Frequently asked questions about chlorophyll fluorescence ... · Frequently asked questions about...
54
REVIEW Frequently asked questions about chlorophyll fluorescence, the sequel Hazem M. Kalaji 1 • Gert Schansker 2 • Marian Brestic 3 • Filippo Bussotti 4 • Angeles Calatayud 5 • Lorenzo Ferroni 6 • Vasilij Goltsev 7 • Lucia Guidi 8 • Anjana Jajoo 9 • Pengmin Li 10 • Pasquale Losciale 11 • Vinod K. Mishra 12 • Amarendra N. Misra 13 • Sergio G. Nebauer 14 • Simonetta Pancaldi 6 • Consuelo Penella 5 • Martina Pollastrini 4 • Kancherla Suresh 15 • Eduardo Tambussi 16 • Marcos Yanniccari 16 • Marek Zivcak 3 • Magdalena D. Cetner 1 • Izabela A. Samborska 1 • Alexandrina Stirbet 17 • Katarina Olsovska 18 • Kristyna Kunderlikova 18 • Henry Shelonzek 19 • Szymon Rusinowski 20 • Wojciech Ba ˛ba 21 Received: 26 June 2016 / Accepted: 17 October 2016 / Published online: 4 November 2016 Ó The Author(s) 2016. This article is published with open access at Springerlink.com Abstract Using chlorophyll (Chl) a fluorescence many aspects of the photosynthetic apparatus can be studied, both in vitro and, noninvasively, in vivo. Complementary tech- niques can help to interpret changes in the Chl a fluorescence kinetics. Kalaji et al. (Photosynth Res 122:121–158, 2014a) addressed several questions about instruments, methods and applications based on Chl a fluorescence. Here, additional Chl a fluorescence-related topics are discussed again in a question and answer format. Examples are the effect of connectivity on photochemical quenching, the correction of F V /F M values for PSI fluorescence, the energy partitioning concept, the inter- pretation of the complementary area, probing the donor side of PSII, the assignment of bands of 77 K fluorescence emis- sion spectra to fluorescence emitters, the relationship between prompt and delayed fluorescence, potential problems when sampling tree canopies, the use of fluorescence parameters in QTL studies, the use of Chl a fluorescence in biosensor Hazem M. Kalaji and Gert Schansker have contributed equally to this paper. & Hazem M. Kalaji [email protected] & Gert Schansker [email protected] Marian Brestic [email protected] Filippo Bussotti filippo.bussotti@unifi.it Angeles Calatayud [email protected] Lorenzo Ferroni [email protected] Vasilij Goltsev [email protected]; [email protected]fia.bg Lucia Guidi [email protected] Anjana Jajoo [email protected] Pengmin Li [email protected] Pasquale Losciale [email protected] Vinod K. Mishra [email protected] Amarendra N. Misra [email protected]; [email protected] Sergio G. Nebauer [email protected] Simonetta Pancaldi [email protected] Consuelo Penella [email protected] Martina Pollastrini martina.pollastrini@unifi.it Kancherla Suresh [email protected] Eduardo Tambussi [email protected] Marcos Yanniccari [email protected] Marek Zivcak [email protected] Alexandrina Stirbet [email protected] 123 Photosynth Res (2017) 132:13–66 DOI 10.1007/s11120-016-0318-y
Transcript of Frequently asked questions about chlorophyll fluorescence ... · Frequently asked questions about...
REVIEW
Frequently asked questions about chlorophyll fluorescence,the sequel
Hazem M. Kalaji1 • Gert Schansker2 • Marian Brestic3 • Filippo Bussotti4 •
Angeles Calatayud5 • Lorenzo Ferroni6 • Vasilij Goltsev7 • Lucia Guidi8 •
Anjana Jajoo9 • Pengmin Li10 • Pasquale Losciale11 • Vinod K. Mishra12 •
Amarendra N. Misra13 • Sergio G. Nebauer14 • Simonetta Pancaldi6 •
Consuelo Penella5 • Martina Pollastrini4 • Kancherla Suresh15 • Eduardo Tambussi16 •
Marcos Yanniccari16 • Marek Zivcak3 • Magdalena D. Cetner1 • Izabela A. Samborska1 •
Alexandrina Stirbet17 • Katarina Olsovska18 • Kristyna Kunderlikova18 •
Henry Shelonzek19 • Szymon Rusinowski20 • Wojciech Baba21
Received: 26 June 2016 / Accepted: 17 October 2016 / Published online: 4 November 2016
� The Author(s) 2016. This article is published with open access at Springerlink.com
Abstract Using chlorophyll (Chl) a fluorescence many
aspects of the photosynthetic apparatus can be studied, both
in vitro and, noninvasively, in vivo. Complementary tech-
niques can help to interpret changes in the Chl a fluorescence
kinetics. Kalaji et al. (Photosynth Res 122:121–158, 2014a)
addressed several questions about instruments, methods and
applications based on Chl afluorescence. Here, additional Chl
a fluorescence-related topics are discussed again in a question
and answer format. Examples are the effect of connectivity on
photochemical quenching, the correction of FV/FM values for
PSI fluorescence, the energy partitioning concept, the inter-
pretation of the complementary area, probing the donor side
of PSII, the assignment of bands of 77 K fluorescence emis-
sion spectra to fluorescence emitters, the relationship between
prompt and delayed fluorescence, potential problems when
sampling tree canopies, the use of fluorescence parameters in
QTL studies, the use of Chl a fluorescence in biosensorHazem M. Kalaji and Gert Schansker have contributed equally to this
paper.
& Hazem M. Kalaji
& Gert Schansker
Marian Brestic
Filippo Bussotti
Angeles Calatayud
Lorenzo Ferroni
Vasilij Goltsev
[email protected]; [email protected]
Lucia Guidi
Anjana Jajoo
Pengmin Li
Pasquale Losciale
Vinod K. Mishra
Amarendra N. Misra
[email protected]; [email protected]
Sergio G. Nebauer
Simonetta Pancaldi
Consuelo Penella
Martina Pollastrini
Kancherla Suresh
Eduardo Tambussi
Marcos Yanniccari
Marek Zivcak
Alexandrina Stirbet
123
Photosynth Res (2017) 132:13–66
DOI 10.1007/s11120-016-0318-y

applications and the application of neural network approaches
for the analysis of fluorescence measurements. The answers
draw on knowledge from different Chl afluorescence analysis
domains, yielding in several cases new insights.
Keywords Chl a fluorescence � Delayed fluorescence �Photochemical quenching � Energy partitioning � Area
Abbreviations
ANN Artificial neural network
Area, Sm Complementary area above the
fluorescence rise and this area
normalized to FV, respectively
ATP Adenosine triphosphate
Car Carotenoid
Chl Chlorophyll1Chl, 3Chl Singlet chlorophyll and triplet
chlorophyll
ChlD1 Accessory Chl molecule bound to the
D1 protein
CP43, CP47 Core antenna proteins of PSII of 43
and 47 kDa, respectively
CSm Cross section (in the JIP test it is
assumed that FM is a measure for the
cross section)
cyt Cytochrome
D1 protein One of the major PSII reaction center
proteins, the other being D2
DCMU 3-(3,4-Dichlorophenyl)-1,1-
dimethylurea
ETC Electron transport chain
ETR Electron transport rate
Fd Ferredoxin
FNR Ferredoxin NADP? reductase
FO, FM, FO0, FM
0 Minimum and maximum
fluorescence intensity emitted by
dark- and light-acclimated samples,
respectively
FPSI Chlorophyll a fluorescence emitted
by photosystem I
FS Steady-state chlorophyll
a fluorescence
FV/FM Maximum quantum yield of primary
photosystem II photochemistry
IRGA Infrared gas analyzer
JIP test Analysis framework for the
interpretation of OJIP transients
developed by Bruno and Reto
Strasser
K step Fluorescence intensity at 300 ls
Katarina Olsovska
Kristyna Kunderlikova
Henry Shelonzek
Szymon Rusinowski
Wojciech Baba
1 Department of Plant Physiology, Faculty of Agriculture and
Biology, Warsaw University of Life Sciences – SGGW,
Nowoursynowska 159, 02-776 Warsaw, Poland
2 Wesemlinstrasse 58, 6006 Lucerne, Switzerland
3 Department of Plant Physiology, Slovak Agricultural
University, Tr. A. Hlinku 2, 949 76 Nitra, Slovak Republic
4 Department of Agricultural, Food and Environmental
Sciences, University of Florence, Piazzale delle Cascine 28,
50144 Florence, Italy
5 Departamento de Horticultura, Instituto Valenciano de
Investigaciones Agrarias, Ctra. Moncada-Naquera Km 4.5.,
46113 Moncada, Valencia, Spain
6 Department of Life Sciences and Biotechnology, University
of Ferrara, Corso Ercole I d’Este, 32, 44121 Ferrara, Italy
7 Department of Biophysics and Radiobiology, Faculty of
Biology, St. Kliment Ohridski University of Sofia, 8
Dr.Tzankov Blvd., 1164 Sofia, Bulgaria
8 Department of Agriculture, Food and Environment, Via del
Borghetto, 80, 56124 Pisa, Italy
9 School of Life Sciences, Devi Ahilya University, Indore,
M.P. 452 001, India
10 State Key Laboratory of Crop Stress Biology for Arid Areas,
College of Horticulture, Northwest A&F University,
Yangling 712100, Shaanxi, China
11 Consiglio per la ricerca in agricoltura e l’analisi
dell’economia agraria [Research Unit for Agriculture in Dry
Environments], 70125 Bari, Italy
12 Department of Biotechnology, Doon (P.G.) College of
Agriculture Science, Dehradun, Uttarakhand 248001, India
13 Centre for Life Sciences, Central University of Jharkhand,
Ratu-Lohardaga Road, Ranchi 835205, India
14 Departamento de Produccion vegetal, Universitat Politecnica
de Valencia, Camino de Vera sn., 46022 Valencia, Spain
15 ICAR – Indian Institute of Oil Palm Research, Pedavegi,
West Godavari Dt., Andhra Pradesh 534 450, India
16 Institute of Plant Physiology, INFIVE (Universidad Nacional
de La Plata — Consejo Nacional de Investigaciones
Cientıficas y Tecnicas), Diagonal 113 N�495, CC 327,
La Plata, Argentina
17 204 Anne Burras Lane, Newport News, VA 23606, USA
18 Department of Plant Physiology, Slovak University of
Agriculture, A. Hlinku 2, 94976 Nitra, Slovak Republic
14 Photosynth Res (2017) 132:13–66
123
kF, kN and kP Rate constants for Chl
a fluorescence, heat dissipation and
photochemistry
LED Light-emitting diode
LHC, LHCI and
LHCII
Light-harvesting complex, in
general, associated with PSI and
mainly associated with PSII,
respectively
Mo The initial slope (first 250 ls) of the
OJIP transient times 4, normalized to
FV
NADP? Nicotinamide adenine dinucleotide
phosphate, oxidized form
NO Nitric oxide
NPQ, qN Non-photochemical quenching
expressed as (FM/FM0 - 1) and
(1 - FV0/FV), respectively
OEC Oxygen-evolving complex
OJIP Fluorescence rise on a dark-to-light
transition from a minimum value
O via the intermediate steps J and
I to the maximum value P, which is
FM if the light is saturating
P680, P700 PSII and PSI reaction center
chlorophyll dimer, respectively
PAR Photosynthetically active radiance
PCA Principal component analysis
PF, DF Prompt fluorescence and delayed
fluorescence, respectively
Pheo Pheophytin, cofactor bound to PSII
PIabs, PItot Performance indexes of the JIP test
Pn, IPL Net rate of carbon fixation and model
based calculated net rate of carbon
fixation, respectively
PPFD Photosynthetic photon flux density
PsbO, PsbP and
PsbQ
PSII extrinsic proteins
PSI, PSII Photosystems I and II, respectively
Q cycle Cyclic electron transport through cyt
b6f and the PQ pool
QA, QB, PQ Primary and secondary quinone
electron acceptors of PSII and free
plastoquinone, respectively
qE Energy quenching, fluorescence
quenching dependent on an
acidification of the lumen
qP, qL Photochemical quenching calculated
based on the puddle and lake model,
respectively
QTL Quantitative trait locus
qZ Non-photochemical quenching of
Chl a fluorescence related to the
xanthophyll cycle
RC Reaction center
RFd Relative fluorescence decrease ratio
RLC Rapid light curve
ROS Reactive oxygen species
Rubisco Ribulose-1,5-bisphosphate
carboxylase/oxygenase
RWC Relative water content
SOM Self-organizing map
SPAD Refers to an instrument used to
estimate the leaf Chl content
S states
S0, S1, S2, S3 and
S4
Redox states of the oxygen-evolving
complex
tFmTime needed to rise from O to P
Tl Leaf temperature
TL Thermoluminescence
TyrD, TyrZ Tyrosine D and Z, redox active
tyrosines in the D2 and D1 proteins
of PSII, respectively
UV Ultraviolet
V, A, Z Violaxanthin, antheraxanthin and
zeaxanthin, respectively
VDE Violaxanthin de-epoxidase
VJ, VI Relative position of the J and I steps
between O and P
UP0 Maximum quantum yield of primary
photochemistry
UPSI, UPSII PSI and PSII operating efficiency,
respectively
wEo JIP test parameter thought to be
related to forward electron transport,
defined as 1 - VJ
Introduction
In 2014 we published a paper in question and answer
format on a series of chlorophyll (Chl) a fluorescence-re-
lated topics (Kalaji et al. 2014a). There were, however, still
enough questions left for a sequel. In the present paper we
treat questions on the relationship between prompt fluo-
rescence (PF), measured with fluorimeters like the PAM
and the HandyPEA, and delayed fluorescence (DF), the
19 Department of Plant Anatomy and Cytology, Faculty of
Biology and Environmental Protection, University of Silesia,
ul. Jagiellonska 28, 40-032 Katowice, Poland
20 Institute for Ecology of Industrial Areas, Kossutha 6,
40-844 Katowice, Poland
21 Department of Plant Ecology, Institute of Botany,
Jagiellonian University, Lubicz 46, 31-512 Krakow, Poland
Photosynth Res (2017) 132:13–66 15
123
much weaker cousin of PF that is emitted in response to
recombination reactions within PSII; energy partitioning;
qP versus qL; the analysis of several forms of stress using
Chl a fluorescence; the JIP test parameters area and FJ; the
consequences of fluorescence emitted by PSI for parame-
ters like FV/FM; considerations when sampling trees; the
assignment of 77 K fluorescence bands; QTL studies on
Chl a fluorescence-related traits from a Chl a fluorescence
point of view and several other topics.
Question 1: What is chlorophyll a fluorescenceand why do we study it?
Chl a fluorescence can be defined as the red to far-red light
emitted by photosynthetic tissues/organisms when illumi-
nated by light of approximately 400–700 nm (photosyn-
thetically active radiation or PAR) (McCree 1972). Within
this spectrum, blue and red light excite chlorophyll more
efficiently than green light. Although Chl a fluorescence
represents only a small fraction of the absorbed energy
[approximately 0.5–10% (Latimer et al. 1956; Brody and
Rabinowitch 1957; Barber et al. 1989; Porcar-Castell et al.
2014)], its intensity is inversely proportional to the fraction
of energy used for photosynthesis (a redox effect) (Duysens
and Sweers 1963). For this reason, the Chl a fluorescence
signal can be used as a probe for photosynthetic activity. At
the same time, Chl a fluorescence is also inversely pro-
portional to changes in dissipative heat emission (a yield
effect, i.e., an increase in the yield of heat emission causes
a decrease in the yield of fluorescence emission) (e.g.,
Krause and Weis 1991) and, therefore, Chl a fluorescence
can be used as well to monitor regulatory processes
affecting the PSII antenna (see, e.g., Question 8). Finally,
P680? is a strong quencher of Chl a fluorescence (Steffen
et al. 2005) and this effect allows the study of the different
redox states (S states) the oxygen-evolving complex of
PSII, due to the fact that the lifetime of P680? is S state
dependent. All of these things taken together could turn
Chl a fluorescence into a indecipherable signal, but thanks
to the development of specific protocols, and by using
complementary techniques, the different effects can be
separated, turning Chl a fluorescence into a powerful tool
for the study of photosynthesis: quenching analysis
(Bradbury and Baker 1981; Quick and Horton 1984;
Schreiber et al. 1986), JIP test (Strasser and Strasser 1995;
Strasser et al. 2004), non-photochemical quenching (NPQ)
(Demmig and Winter 1988; Horton and Hague 1988),
electron transport rate (ETR) (Genty et al. 1989; Krall and
Edwards 1990), rapid light curves (RLCs) (White and
Critchley 1999; Ralph and Gademann 2005), flash-induced
fluorescence (Robinson and Crofts 1983; de Wijn and van
Gorkom 2001; Bouges-Bocquet 1980, Ioannidis et al.
2000), dark-adaptation kinetics of OJIP transients (Bukhov
et al. 2001; Schansker et al. 2005), Chl a fluorescence and
photoacoustic spectroscopy (Buschmann and Koscanyi
1989; Snel et al. 1990; Allakhverdiev et al. 1994; Bukhov
et al. 1997), Chl a fluorescence and 820-nm
absorbance/transmission (Klughammer and Schreiber
1994; Schansker et al. 2003), Chl a fluorescence and
delayed fluorescence (Goltsev et al. 2012; Kalaji et al.
2012a), imaging (Nedbal and Whitmarsh 2004; Hideg and
Schreiber 2007; Lichtenthaler et al. 2007; Gorbe and
Calatayud 2012), the actinic light wavelength dependence
of photosynthesis (Schreiber et al. 2012) and more recently
attention has been paid to statistic aspects of the mea-
surements of parameters (e.g., Bussotti et al. 2011a). The
photosynthetic literature is huge with many topics studied
such as plant breeding (Baker and Rosenqvist 2004; Kalaji
and Pietkiewicz 2004; Kalaji and Guo 2008), seed vigor
and seed quality assessment (Jalink et al. 1998; Dell’Aquila
et al. 2002; Konstantinova et al. 2002), fruit and veg-
etable quality determination and postharvest processing
control (Merz et al. 1996; Nedbal et al. 2000), senescence
(Adams et al. 1990a; Kotakis et al. 2014), climate change
effects (Ashraf and Harris 2004) and a variety of algae
(Gorbunov et al. 1999; Antal et al. 2009; Grouneva et al.
2009). Furthermore, Chl a fluorescence measurements have
been used for monitoring plant stresses (Guidi and Cala-
tayud 2014), such as photoinhibition (Sarvikas et al. 2010;
Matsubara et al. 2011), heat stress (Allakhverdiev et al.
2007; Ducruet et al. 2007; Toth et al. 2007a; Kalaji et al.
2011a; Brestic et al. 2012), UV stress (Vass et al. 1999; van
Rensen et al. 2007; Guidi et al. 2011), salt stress (Kalaji
and Pietkiewicz 1993; Demetriou et al. 2007; Melgar et al.
2009; Kalaji et al. 2011b; Penella et al. 2016), drought
stress (Lu and Zhang 1998; Flexas et al. 2002; Zivcak et al.
2013), urban tree conditions (Hermans et al. 2003; Swoc-
zyna et al. 2010a, b), environmental pollution (Bussotti
et al. 2005; Kalaji and Łoboda 2007; Romanowska-Duda
et al. 2010; Tuba et al. 2010; Bussotti et al. 2011b; Cotrozzi
et al. 2016), sulfur-deprivation/H2 production in Chlamy-
domonas (Antal et al. 2007; Nagy et al. 2012) and water
quality (Romanowska-Duda et al. 2005; Ralph et al. 2007;
Baumann et al. 2009).
Question 2: Does Chl a fluorescence only probePSII?
A common misunderstanding is that variable Chl a fluo-
rescence is a specific probe for PSII. This is true for flash
experiments, in which QA in all PSII RCs is reduced by a
saturating single turnover flash. However, if longer pulses
of light are given, QA will become reduced and oxidized
multiple times, and under these conditions fluorescence
16 Photosynth Res (2017) 132:13–66
123

also becomes a probe for the reduction and redox state of
the PQ pool and even for the electron flow through PSI and
PSI content (Schansker et al. 2005; Ceppi et al. 2012).
Under steady-state conditions, i.e., a stable level of
photosynthesis reached after a few minutes of illumination,
the whole photosynthetic apparatus is in equilibrium and
electron flow through any of the components of the electron
transport chain (including PSII) would be indicative for the
overall photosynthetic rate (Kramer et al. 2004a; Scheibe
et al. 2005; Eichelmann et al. 2009). As a consequence,
under steady-state conditions, the electron flux calculated
on the basis of the Chl a fluorescence signal can be used as a
measure for the overall photosynthetic activity. This point
was demonstrated by Genty et al. (1989, 1990a).
Another common mistake is to interpret fluorescence
measurements in terms of single reaction centers. In the
case of photoinhibition it is, e.g., often assumed or implied
that the quantum yield of individual PSII RCs changes,
whereas it is more realistic to interpret changes in the
parameter FV/FM in terms of changes in the quantum yield
of the population of PSII RCs as a whole.
The importance of looking at photosynthesis measure-
ments in stochastic terms can be illustrated by experiments
showing that at high light intensities 80% of the PSII RCs
can be inhibited before the electron transport rate becomes
affected (e.g., Heber et al. 1988).
This observation also illustrates that at high light inten-
sities PSII activity has little relevance for photosynthetic
activity, whereas at low light intensities PSII RCs become
rate limiting. This also means that the effect of a treatment on
PSII measured at a single light intensity has limited meaning.
Question 3: What is the Kautsky effect?
Kautsky and Hirsch (1931) observed for several types of
leaves that a dark-to-light transition is characterized by an
initial fast increase of the fluorescence intensity followed
by a slow decrease to a minimum level, after which the
fluorescence intensity remains at this low intensity. The
authors assigned the stable low level of fluorescence to
steady-state photosynthesis. They noted further that the
slow fluorescence decrease had the same time dependence
as the induction of CO2 assimilation and concluded that the
fast fluorescence rise reflects a photochemical reaction
since it was insensitive to cyanide and temperature chan-
ges. The fluorescence changes occurring during induction
of photosynthesis have been studied intensively during the
last 50 years and, in honor of the first publication on this
phenomenon, such a fluorescence transient is called a
Kautsky transient, and the changes in the fluorescence
intensity the Kautsky effect. In Fig. 1 examples of the first
10 s of Kautsky transients measured on several angiosperm
and gymnosperm plants are shown on a logarithmic time-
scale. The fluorescence rise phase (OJIP) reflects the
reduction of the photosynthetic electron transport chain
(see Kalaji et al. 2014a for a more comprehensive discus-
sion) and its kinetics, as illustrated in Fig. 1, are quite
similar for all photosynthetic organisms. The fluorescence
decrease has kinetics that differ quite strongly between
different types of photosynthetic organisms (in Fig. 1
angiosperm vs. gymnosperm plants). The S and M steps
observed in transients of gymnosperm species lack/are
hidden in transients of angiosperm species. Using 820-nm
transmission measurements it was shown that the initial
fluorescence kinetics beyond P depend strongly on the
activation of electron flow at the PSI acceptor side, asso-
ciated with the activation of ferredoxin-NADP? reductase
(FNR) (Kautsky et al. 1960; Munday and Govindjee 1969;
Satoh 1981; Harbinson and Hedley 1993; Schansker et al.
2003, 2008; Ilık et al. 2006). Fluorescence then declines
within 3–5 min with the onset of photosynthetic CO2 fix-
ation until it reaches a lower, steady-state fluorescence
intensity (FS). In fully photosynthetically active leaves this
steady-state level, especially at high light intensities, is
usually close to the FO level (e.g., Flexas et al. 2002).
Question 4: What is quantum yield?
In a general sense, the quantum yield can be defined by an
action, e.g., oxygen evolution or a stable charge separation,
divided by the number of photons that has to be absorbed
Fig. 1 Chl a fluorescence induction transients measured on angios-
perm (sugar beet, camellia and tobacco) and gymnosperm (Ginkgo
and yew) leaves. The fast induction kinetics OJIP are similar for both
types of plants with a higher FM/FO ratio in gymnosperms and the
same OJIP kinetics for all leaves/needles measured. Beyond P the
kinetics differ quite strongly between both types of plants (Schansker
et al., unpublished data)
Photosynth Res (2017) 132:13–66 17
123

for this action. The quantum yield of oxygen evolution has
been studied intensively (Warburg and Negelein 1923;
Emerson and Lewis 1943; Govindjee 1999). Govindjee
et al. (1968) concluded for Chlorella cells that the quantum
yield for oxygen evolution is at least 0.12, which means
that at least 8 light quanta are needed for this process. The
maximum quantum yield of a stable charge separation for
the dark-adapted state is in the literature defined as FV/FM,
and this gives a value of about 0.88 in higher plants (see
Question 6). Tyystjarvi and Aro (1996) determined a
quantum yield for the photoinhibition of PSII of 7 9 10-8,
which means that for every 14.3 million photons absorbed,
one PSII RC is inactivated. For each photochemical pro-
cess such a quantum yield can be determined.
If we look at the potential fate of a single photon that has
excited a chlorophyll molecule, the sum of the different de-
excitation pathways, due to the law of energy conservation,
is 1. The three main de-excitation pathways are photo-
chemistry (induction of a stable charge separation), emis-
sion as heat, and emission as Chl a fluorescence. In open
PSII RCs photochemistry is the fastest process and has the
highest probability/quantum yield (see also Questions 6
and 13). In more physical terms the quantum yield of
photochemistry is the rate constant for photochemistry
divided by the sum of the rate constants of all competing
processes (photochemistry, heat dissipation, Chl a fluores-
cence emission) [for a more in-depth treatment of this
topic: Harbinson and Rosenqvist (2003), Strasser et al.
(2004) and Lazar (2016)].
Since photochemistry, fluorescence and heat are com-
peting de-excitation processes, fluorescence measurements
can be used to assess the balance between photochemistry
and non-photochemical dissipation of absorbed light
quanta (photons) under different environmental conditions.
It is important to keep in mind that more fluorescence
means either less photochemistry and/or less heat (see also
Question 13).
Question 5: When are reaction centers consideredto be closed?
The biochemical definition of a closed reaction center is
simple. If QA is in the reduced state (QA-) no further
stable charge separations can occur and the rate constant
for photochemistry (kP) goes to 0 (the presence of P680?
will also close PSII, but this we will not treat here; see for
P680? Questions 18 and 22). Unfortunately, the redox state
of QA cannot be measured directly under most conditions;
therefore, Chl a fluorescence is used instead. Based on the
paper of Duysens and Sweers (1963) a closed RC is gen-
erally equated to FM. However, looking at the literature, the
FM value depends on the technique used to determine it. A
single turnover xenon or laser flash is thought to reduce QA
in all reaction centers. However, the FM measured under
these conditions is 30–50% lower than the FM induced by a
saturating pulse of 200–500 ms (Samson and Bruce 1996).
In addition, even at very high light intensities
(12,000–15,000 lmol photons m-2 s-1), where the exci-
tation rate is once every 40–50 ls (Neubauer and Schreiber
1987; Lazar and Pospısil 1999), which is considerably
higher than the re-oxidation time of QA- of 100–200 ls in
the presence of QB and 400–600 ls in the presence of QB-
(Petrouleas and Crofts 2005), it still takes 80–100 ms to
reach FM (Schreiber 1986; Neubauer and Schreiber 1987;
Schansker et al. 2006). From a practical point of view, it
can be argued that the FM represents a state with all RCs
closed for both single turnover flashes and saturating pul-
ses. The difference is that during a saturating pulse many
other things happen as well that affect the fluorescence
intensity and, therefore, the FM values of flash and pulse
experiments are not directly comparable.
Question 6: How can fluorescence measurementsand derived fluorescence parameter be correctedfor fluorescence emission by PSI?
As noted in the previous paper (Kalaji et al. 2014a), at
wavelengths longer than 700 nm PSI fluorescence emission
contributes considerably to FO. For commercial fluorime-
ters this contribution may be as high as 30–35% for C3
plants and 50–60% for C4 plants (Genty et al. 1990b;
Adams et al. 1990b; Pfundel 1998; Peterson et al. 2001).
The stronger contribution of PSI fluorescence (FPSI) in C4
plants is due to a higher PSI/PSII ratio (Edwards and
Walker 1983; Ku et al. 1991) and to higher levels of
spillover of excitation energy from PSII to PSI (Pfundel
and Pfeffer 1997). The question whether PSI emits variable
fluorescence at room temperature has been studied as well.
It is often assumed that the fluorescence yield of open and
closed RCs of PSI is the same (Butler 1978; Kyle et al.
1983; Savikhin 2006). Byrdin et al. (2000) reported a 12%
increase of the fluorescence yield of PSI of Synechococcus
elongatus on closing. If FPSI is 30% of the FO fluorescence
emission, then 12% more would be equal to 4% of FO, and,
since FM is 5–6 times FO, this would represent 1% or less
of the total variable fluorescence. In other words, even if
there is some PSI variable fluorescence, this amount is so
small that it can be ignored. This is further supported by
several kinetic experiments. In leaves or intact chloro-
plasts, in the presence or absence of DCMU, the FM is the
same (Schreiber and Krieger 1996; Toth et al. 2005b)
despite the fact that in the absence of DCMU P700 is
reduced at FM and in its presence is oxidized (Schansker
et al. 2005). In a variation on this experiment Peterson et al.
18 Photosynth Res (2017) 132:13–66
123
(2014) showed that during fluorescence induction (FO to
FM) the relationship between F(680) (more PSII fluores-
cence) and F(750) (more PSI fluorescence) did not show an
oscillation related to the P700 oxidation and reduction
kinetics occurring during OJIP fluorescence rise. Peterson
et al. (2014) concluded that variable PSI fluorescence was
less than 0.8% of FV. In contrast, theoretical simulations
performed by Lazar (2013), based on known values of rate
constants of PSI reactions and considering the reported
PSII/PSI stoichiometry, yielded an OJIP simulation with
approximately correct kinetics. On the basis of these results
Lazar concluded that the contribution of PSI variable Chl
a fluorescence to total FV could be 8–17%. However, a
close link between PSI kinetics and the OJIP rise can also
be explained on the basis of the PSII conformational
change hypothesis (Schansker et al. 2014).
Several authors have studied methods to correct
parameters like FV/FM for the contribution of PSI fluores-
cence, but, so far, this has not led to a simple formula that
can be applied. It is important to note that the PSI contri-
bution is instrument sensitive. Pfundel (1998) wrote that a
special PAM instrument that detects the fluorescence
emission at wavelengths shorter than 710 nm shows very
little, or at least much less, contribution of PSI
fluorescence.
Pfundel (1998) showed for a set of C3, C3–C4 and C4
plants that there is a linear relationship between the
parameter FM/FV determined at room temperature and the
parameter F735/F685 determined at 77 K, with a slope m
and an intercept of the Y axis b. In the model of Pfundel
(1998):
FM=FV ¼ b þ m � F735=F685
For the data set of Pfundel (1998) this gave a regression
coefficient of 0.963. On the basis of this approach, a cor-
rected FV/FM value of about 0.88 was obtained. To use this
approach, it would be necessary to construct a calibration
curve, like Pfundel (1998) did, for each instrument used
and then to determine for the samples of interest both the
FO and FM at room temperature measured on leaves and the
77 K fluorescence emission spectrum of diluted leaf pow-
der, which in most cases is impractical.
Franck et al. (2002) approached the topic in a different
way, developing a method for the resolution of the PSII and
PSI contributions to the fluorescence emission spectrum.
The authors noted that, for diluted PSII particles, the FM/
FO was wavelength independent. On that basis, they con-
cluded that the wavelength dependence of FM/FO observed
for leaves was due to the presence of PSI. Furthermore,
they assumed that the PSI and PSII spectra do not change
and, therefore, that these spectra can be scaled to obtain the
FO and FM spectra. After correction by this method, the
authors obtained a FV/FM value of 0.83 instead of 0.81.
This difference is considerably smaller than the correction
found by Pfundel (1998).
The quantum yield of PSII can also be determined on
the basis of time-resolved (ps) fluorescence measurements.
Wientjes et al. (2013a) acclimated Arabidopsis plants to
20, 100 and 800 lmol photons m-2 s-1. Under such con-
ditions the PSII antenna size decreased as the light intensity
increased. The quantum yields derived from the time-re-
solved fluorescence measurements were 0.84, 0.89 and
0.91, respectively. The FV/FM values (corrected for the PSI
contribution) determined for the same plants were 0.83,
0.87 and 0.86, respectively. Since the first set of data is
measured on thylakoid membranes and the second set of
data on leaves, there are several possible explanations for
the observed discrepancies.
The data of Wientjes et al. (2013a) support the choice of
a FV/FM value of 0.87 or 0.88 as a good approximation of
the real FV/FM value, at least for C3 plants. Taking 0.88 as
the real value of the parameter FV/FM of PSII (=UP0) of C3
and C4 plants, it can be used to estimate the contribution of
PSI fluorescence:
FPSI ¼ /P0 �Fm
Fm � Fo
� �� 1
� �� Fm ð1Þ
when we take a typical FV/FM value for C3 plants (e.g.,
0.836), we get FPSI = *5.2% of FM. When we take a
typical value for C4 plants (e.g., 0.80), we get
FPSI = *10% of FM. This calculation can, however, only
be applied to FO and FM measurements on plants that are
completely relaxed with respect to photoprotective dissi-
pation mechanisms (no NPQ) and non-stressed (no pho-
toinhibition). The data of Wientjes et al. (2013a) also
suggest that 0.88 is too high for plants acclimated to shade
conditions. Another approach will also have to be devel-
oped for the correction of the FV/FM values in the photo-
synthetic organisms in which the thylakoid stacking is
hindered by the presence of phycobilisomes (cyanobacte-
ria, red algae), or the thylakoids are appressed for their
entire length (brown algae, diatoms, etc.), or display a not
yet well-differentiated grana-intergrana arrangement (most
green algae) (see Trissl and Wilhelm 1993; Solymosi
2012). Further, Peterson et al. (2014) described an addi-
tional contribution to FO in greening maize (up to 12–15%
of FM at 680 nm) and sunflower (up to 8% of FM at
680 nm) leaves which was absent in mature leaves and
correcting for which improved the analysis of the fluores-
cence data. The authors ascribed this fluorescence to
emission by partially assembled PSII and could be the
same fluorescence emission Srivastava et al. (1999) ascri-
bed to free LHCII. Once FPSI has been determined, it can
be subtracted from all Ft values and the resulting fluores-
cence data can be used for the calculation of all fluores-
cence parameters.
Photosynth Res (2017) 132:13–66 19
123

A correction of fluorescence measurements for the PSI
contribution is especially relevant when fluorescence
measurements are correlated with data obtained by other
methods (e.g., gas exchange or absorbance measurements).
Strong red LEDs with a peak emission at *650 nm
were the first LEDs that became commercially available for
a reasonable price. Instruments that use such LEDs need to
measure fluorescence above 700 nm to avoid overlap with
the emission of the red LEDs. This is the case for, e.g.,
classical PAM instruments and HandyPEAs. Using, e.g.,
blue LEDs it is possible to avoid the overlap problem and
to measure fluorescence emission at *685 nm, where the
contribution of PSI fluorescence is very small (Krause and
Weis 1991; Gitelson et al. 1998). However, Peterson et al.
(2001, 2014) argued that in the end the fluorescence
detected above 700 nm may be the better probe, because
light around 680 nm is much more strongly absorbed by
the leaf and, therefore, more a probe for the top cell layers
of the leaf. Further, it should be noted that differences in
filters and other specifications between instruments may
affect the contribution of PSI to fluorescence measure-
ments and can explain, at least to some extent, differences
in the values of parameters like FV/FM between different
fluorometers.
Part of the JIP test parameters (e.g., Mo, Area, Sm, VJ,
VI, wEo) only depend on variable fluorescence and are not
affected by the contribution of PSI fluorescence. For
measurements derived from OJIP measurements it may be
noted that, as long as the PSII to PSI ratio does not change,
PSI fluorescence causes a systematic error. This means that
it does not affect the comparability of measurements of
comparable samples. With respect to the quenching anal-
ysis, the effect of PSI fluorescence emission on the calcu-
lated parameters increases for measurements made at
stronger actinic light intensities. Higher light intensities
quench FM, and to a lesser extent FO, but are not expected
to affect FPSI, increasing the relative contribution of FPSI.
Pfundel et al. (2013) studied the effects of FPSI under
steady-state conditions. They noted that the method of
Oxborough and Baker (1997) to calculate FO0 systemati-
cally produces values that are too low and they ascribed
this to the fact that Oxborough and Baker (1997) did not
take the contribution of FPSI into account. Pfundel et al.
(2013) also showed that correcting fluorescence data of
maize for FPSI makes the relationship between UPSI and
UPSII more linear.
In summary, PSI fluorescence emission has only a sig-
nificant effect on FO. Even a rough correction of fluores-
cence data for PSI fluorescence emission, assuming that the
real FV/FM value is 0.88, will considerably improve the
quality of the fluorescence data.
Question 7: How does cytochrome b6/f regulateand affect the redox state of the photosyntheticelectron transport and parameters like qEand ETR?
The cytochrome (cyt) b6/f complex is located between PSII
and PSI at a crossroad of different electron pathways
(linear electron transport, Q cycle, chlororespiration, cyclic
electron transport) (Sacksteder et al. 2000; Bennoun 2002;
Mulkidjanian 2010; Johnson 2011; Shikanai 2014) and is
an important site for the regulation of electron flow and the
control of regulatory mechanisms like state transitions (see
Question 8) and qE. The Q cycle and cyclic electron
transport increase the ATP to NADPH ratio by diverting
electrons away from NADP? while at the same time
increasing the pH difference over the membrane (Sackst-
eder et al. 2000; Munekage et al. 2010; Johnson 2011).
Lowering the lumen pH decreases the re-oxidation rate of
PQH2, thereby slowing down electron transport (Witt 1979;
Heber et al. 1988; Harbinson et al. 1990). A low lumen pH
is also the driving force behind qE. Kramer et al. (1999),
reviewing the literature on the lumen pH, argued that under
most conditions the lumen pH remains between pH 5.8 and
6.3. The feedback inhibition of PQH2 oxidation may play
an important role in keeping the lumen pH within this
range. At the same time, this feedback inhibition will lead
to a more reduced PQ pool where the cyt b6/f complex is
known as a sensor for the PQ pool redox state, activating a
kinase that can phosphorylate LHCII when the PQ pool
becomes more reduced; this is the classical definition of
state transitions (see Question 8).
Under steady-state conditions, a higher light intensity
means a more reduced PQ pool and a more oxidized PSI
donor side (Klughammer and Schreiber 1994; Zivcak et al.
2014). This is due to the fact that PSII can pump electrons
faster to the PQ pool and PSI can pump them faster to the
electron acceptors at its acceptor side than cyt b6/f can
transfer them from the PQ pool to plastocyanin and, then,
P700. This imbalance increases as the light intensity is
raised and can be detected by measuring Chl a fluorescence
and 820-nm transmission/absorption simultaneously
(Klughammer and Schreiber 1994; Zivcak et al. 2014). The
described feedback mechanism can respond rapidly to
fluctuations in the light intensity and will keep PSI in a
relatively oxidized state. The excitation quenching ability
of P700? state of PSI has recently been suggested to play a
photoprotective role, since in the cyanobacterium
Arthrospira platensis P700? photostability was shown to
reduce PSI photodestruction (Shubin et al. 2008). A similar
mechanism was hypothesized to be operative in vascular
plants as well (Tikkanen and Aro 2014; Ferroni et al.
20 Photosynth Res (2017) 132:13–66
123

2014). A similar observation (sensitivity of PSI to a
reduced acceptor side) was made for plants in which cyclic
electron transport was inactivated and the plants were
exposed to fluctuating light conditions (Suorsa et al. 2012).
Tikkanen et al. (2014) have argued that the ability of the
chloroplast apparatus to keep PSI in a relatively oxidized
state is critical, because damage to PSI is nearly irre-
versible. It is this aspect that makes the cyt b6/f complex a
particularly important regulatory point for electron flow
under conditions of changing light conditions (Genty and
Harbinson 2004). Tikkanen et al. (2015) recently con-
cluded that the cyt b6/f complex and not downregulation of
PSII by the processes related to qE regulates linear electron
transport. They based this on the observation that PsbS-less
npq4 mutant of Arabidopsis thaliana has an impaired
ability to generate qE, but still combines a highly reduced
PQ pool with strongly oxidized P700 in high light, indi-
cating that the ability of cyt b6/f to control electron flow is
retained. This supports the observation of Belgio et al.
(2014) that processes related to qE do not reduce the effi-
ciency of PSII to trap excitation energy.
Question 8: What is a state transition and how doesit affect Chl a fluorescence?
Bonaventura and Myers (1969) were the first to describe
state transitions in cells of Chlorella only a few years after
the existence of two photosystems had been shown (Duy-
sens et al. 1961). Duysens et al. (1961) had used light of
560 and 680 nm to preferentially excite either of those two
photosystems. This was done as well by Bonaventura and
Meyers by using so-called light 2 of 645 nm exciting PSII
and PSI and light 1 of 710 nm preferentially exciting PSI.
The authors observed slow excitation-wavelength-depen-
dent changes in the O2 evolution rate and Chl a fluores-
cence, which they interpreted as a change in the
distribution of light energy between the two photosystems.
In 1977, John Bennett showed that in the light several
photosynthetic proteins became phosphorylated (especially
LHCII and a 9-kDa protein) and he suggested a link with
the above-described state transitions (Bennett 1977). Sub-
sequently, it was shown that a reduced PQ pool was needed
to activate the kinase that phosporylated LHCII and that cyt
b6/f acted as a redox sensor (Allen et al. 1981; Bennett
et al. 1988; Rintamaki et al. 2000).
In the literature, several methods can be found to detect
state transitions. A variation of the experimental approach
of Bonaventura and Myers (1969) is the determination of
the effect of pre-illumination with PSII and PSI light on
FM0 induced by a saturating pulse (e.g., Lunde et al. 2000).
A variant of this approach is to use the FS/FM0 ratio induced
in response to either PSI or PSII light (Wagner et al. 2008).
Emission spectra (77 K) are also widely used to detect state
transitions. In green algae such as Chlamydomonas rein-
hardtii, in which state 2 is induced by anaerobic conditions
that cause a reduction of the PQ pool, this works very well
(Depege et al. 2003; Iwai et al. 2008). On going from state
1 to state 2, the PSII bands decrease and the PSI bands
increase in amplitude. A variation on this approach is to
use the F735/F685 ratio (at 77 K) as a measure for state
transitions. This ratio increases during the transition from
state 1 to state 2 and decreases during the transition from
state 2 to state 1 as, e.g., demonstrated by McCormac et al.
(1994) for Spirodela oligorrhiza. Studying OJIP transients,
Schreiber et al. (1995) observed that state 2 in C. rein-
hardtii and Synechocystis PCC 6803 is associated with a
reduction in the JI amplitude. Schansker et al. (2006)
observed that already at low actinic light intensities the JI
amplitude in the steady state decreased, an effect that had
still not reversed after 15 min of dark adaptation. The
authors interpreted this in analogy with Schreiber et al.
(1995) as the effect of a state 1 to state 2 transition.
Recently, a simple model to simulate state transitions in C.
reinhardtii was created (Ebenhoh et al. 2014) based on
which Stirbet and Govindjee (2016) tried to simulate the
slow PS(M)T fluorescence decline.
Depege et al. 2003 identified the kinase (Stt7) in C.
reinhardtii, and then, Bellafiore et al. (2005) identified its
higher plant ortholog (STN7) in Arabidopsis thaliani.
However, in the STN7 mutant, which lacked this gene had a
phenotype that was very similar to that of the wild type. Only
under fluctuating light conditions, the growth of the STN7-
less mutant was affected. Grieco et al. (2012) observed that
in the STN7 mutant grown under fluctuating white light the
PSI content decreases and they proposed, therefore, that
state transitions are important in protecting PSI against
damage under fluctuating white light conditions.
According to the classical concept of state transitions, the
phosphorylated LHCII disconnects from PSII and migrates
to PSI, which leads to a redistribution of excitation energy
from PSII to PSI (Allen 1992; McCormac et al. 1994; Misra
and Biswal 2000). This view has been modified in recent
years. Wientjes et al. (2013b) showed that LHCII acts as an
efficient antenna for both photosystems under most natu-
rally occurring conditions and that only under special con-
ditions (strong preferential excitation of PSI with FR light
or strong light) LHCII migrates to PSII, where, especially
under high light conditions, the light it absorbs can be more
easily quenched. Grieco et al. (2015) looked at PSII and PSI
as located in a connected lake of LHCIIs. For high light
conditions, it has been shown that the LHCII kinase
becomes inactivated by reduced thioredoxins leading to the
dephosphorylated state of LHCII (Rintamaki et al. 2000).
In summary, since its discovery in 1969 the role of state
transitions in higher plants has evolved and is still
Photosynth Res (2017) 132:13–66 21
123

evolving. Based on recent studies on plants lacking the
LHCII kinase, state transitions are thought to play a reg-
ulatory role under fluctuating light conditions, possibly
protecting PSI. Its role in the redistribution of light energy,
in higher plants, seems to be less important. For a com-
prehensive review of this topic, see, e.g., Goldschmidt-
Clermont and Bassi (2015).
Question 9: How can photochemical quenching bedefined and what type of information does itprovide?
Photochemical quenching is a reflection of the redox state
of QA. If the photosynthetic electron transport chain is
oxidized, re-oxidation of QA by forward electron transfer
can compete strongly with fluorescence emission and can
keep the fluorescence intensity low (Kautsky et al. 1960;
Munday and Govindjee 1969; Bradbury and Baker 1981;
Krause et al. 1982). This is called photochemical quench-
ing (e.g., Bradbury and Baker 1981). If the relationship
between QA redox state and variable fluorescence were
linear, as proposed by Duysens and Sweers (1963), we
could simply use the parameter qP as it was defined for the
quenching analysis (Schreiber et al. 1986, Genty et al.
1989, van Kooten and Snel 1990):
qP ¼ F0m � Fs
F0m � F0
o
ð2Þ
However, as first argued by Joliot and Joliot (1964), this
relationship, at least in the presence of a PSII inhibitor like
DCMU, is affected by the exchange of excitation energy
between the antennae of different PSII RCs. This process
has been called connectivity (e.g., Bennett 1983; Dau 1994;
Lavergne and Trissl 1995) or grouping (Strasser 1978;
Strasser et al. 2004). The parameter qP is based on the so-
called puddle model, which ignores the connectivity among
PSII units. However, if connectivity also affects the whole
fluorescence rise in the absence of inhibitors like DCMU,
qP needs a correction to take this process into account
(Kramer et al. 2004b).
The question of how much connectivity affects the flu-
orescence rise is a contentious one. Strasser and Stirbet
(2001) showed, on the basis of a simulation, that in the
absence of DCMU connectivity mainly has a measurable
effect on the first 300 ls of the fluorescence rise. Beyond
that point re-opening and again closing PSII RCs and the
effect of the different S states on the fluorescence rise (see
Questions 15 and 22) disturb the simple relationship that
can be derived for DCMU-inhibited PSII RCs. Oja and
Laisk (2012) demonstrated only a negligible effect of PSII
connectivity and observed that qP is proportional to the
fraction of open PSII centers in the steady state. Toth et al.
(2007b) showed that the relation between FJ and the area
between the OJ rise and FM as a function of the extent of
anaerobiosis was linear, indicating that at the FJ step
connectivity no longer affects the fluorescence rise. It has
also been suggested that the sigmoidicity of the initial
fluorescence rise, which is interpreted to be consequence of
connectivity (reviewed by Stirbet 2013) can alternatively
be explained on the basis of two overlapping exponential
reactions (Vredenberg 2008; Schansker et al. 2011). This
can account for the disappearance of the sigmoidicity of the
fluorescence rise when the temperature is lowered to
-10 �C (Schansker et al. 2011). Schansker et al.
(2011, 2014) provided experimental proof that only 70% of
the variable fluorescence is related to the redox state of QA,
introducing an additional complication. And finally, there
is an important difference between the fluorescence rise in
the absence and presence of a PSII inhibitor like DCMU. In
the presence of an inhibitor, there is one single charge
separation and all QA becomes gradually reduced (as a
function of the excitation rate). In the absence of an inhi-
bitor, at, e.g., 3000 lmol photons m-2 s-1, a single exci-
tation of all reaction centers is complete after about 200 ls
(cf Neubauer and Schreiber 1987; Lazar and Pospısil
1999). At longer times, as mentioned above, there is a
continuous re-oxidation and re-reduction of QA in all RCs
(see Questions 16 and 22), where the connectivity effect is
likely to average out between all opening and closing PSII
RCs.
The experimental data presented in the previous para-
graph are not widely known and an approach based on the
assumption that connectivity affects the whole fluorescence
rise between FO and FM (Kramer et al. 2004b) is gaining
wider acceptance. Kramer et al. (2004b) derived a modified
parameter based on the ‘‘lake’’ model that considers the
units to be fully connected, which they called qL (Kramer
et al. 2004b):
qL ¼ F0m � Fs
F0m � F0
o
� Fo
Fs
ð3Þ
For the calculation of qL without the measurement of
FO0, Kasajima et al. (2009) derived the following equation:
qL ¼ 1
Fs
� 1
F0m
� ��1
Fo
� 1
Fm
� �ð4Þ
With the parameters qP or qL, we want to quantify the
fraction of open PSII RCs, i.e., the fraction of PSII RCs
with QA in the oxidized state, in the light-adapted state
(Kramer et al. 2004b; Rohacek et al. 2008). Depending on
the assumptions made (effect of connectivity or not), the
value ‘‘1 - qP’’ or ‘‘1 - qL’’ represents the approximate
redox state of QA, expressed as QA-/QA(tot) (Schreiber and
Bilger 1987; Weis and Berry 1987). The expression
‘‘1 - qP’’ represents the balance between excitation rate
22 Photosynth Res (2017) 132:13–66
123

and forward electron transport and is a reflection of the
excitation pressure inside PSII (Ogren and Rosenquist
1992). It is also a measure for the degree of RC closure
(Bjorkman and Demmig-Adams 1995; Rohacek and Bartak
1999).
qP or qL values vary between 0 and 1, where 1 is
observed in a fully relaxed dark-acclimated state (where
FS = FO) and 0 represents the state when all QA is reduced
(QA-) and FS = FM
0. See Question 5 for a discussion of the
relation between all QA reduced and FM.
An example of photochemical quenching (qP, qL and
qL(c)) and UPSII as a function of the actinic light intensity is
presented in Fig. 2a.
Figure 2 demonstrates that there is a considerable dif-
ference between qP and qL, as well as between values of qL
calculated with or without FO0. Figure 2b illustrates that
the relationship between qP and qL is nonlinear. It is worth
mentioning that Pfundel et al. (2013) showed that FO0
values estimated on the basis of the method of Oxborough
and Baker (1997) are systematically too low (see Question
6).
The choice between qP and qL depends on the way we
look at the Chl a fluorescence induced by a saturating
pulse. If we treat it as essentially a single charge separation,
an analogy with the fluorescence rise in the presence of
DCMU can be inferred, as Kramer et al. (2004b) did. If we
take into account that the fluorescence rise induced by a
saturating pulse consists of many turnovers of QA, the
analogy is lost and then the straightforward parameter qP,
though far from perfect, is probably a much better
approximation of the QA redox state in the light then the
parameter qL.
Question 10: Is the electron transport rate (ETR)calculated from Chl a fluorescence a reliableparameter?
The electron transport rate (ETR) estimated from Chl a
fluorescence is often defined as:
ETR ¼ /PSII � PPFD � 0:5 � leaf absorptivity coefficient
lmol electrons m�2 s�1� �
ð5Þ
where UPSII (which is dimensionless) is the effective
quantum yield of photosystem II in the light; PPFD
(lmol photons m-2 s-1) is the photosynthetic photon flux
density incident on the leaf (or any green organ); leaf
absorptivity coefficient (which is dimensionless) is the
absorptance of the photosynthetic organ, i.e., the propor-
tion of the incident PPFD effectively absorbed by the
photosynthetic surface, and ‘‘0.5’’ is a correction factor for
PPFD, assuming that half of the photons are absorbed by
PSI and the other half by PSII as first formulated by Krall
and Edwards (1992). As formula 5 shows, ETR and UPSII
are proportional and are, therefore, closely related
parameters.
The parameter ETR has been shown to correlate well
with linear electron flow calculated on the basis of O2
evolution rates (Flexas et al. 1999; von Caemmerer 2000).
Genty et al. (1989) observed a linear correlation between
UPSII and CO2 assimilation rate at 1% O2 for barley and
20% O2 for mays. Edwards and Baker (1993) extended the
number of conditions under which a linear correlation was
observed. However, in many other studies a nonlinear,
somewhat concave, relationship was observed (Peterson
et al. 2001 and references therein). Correcting for PSI
Fig. 2 Photochemical
quenching. a The parameters
UPSII, qP, qL and qL(c) as a
function of the actinic light
intensity determined on wheat
leaves. b The relationship
between qP and qL is nonlinear
especially at low light
intensities (values close to 1),
whereas the relationship
between qL and qL(c) is linear
with qL(c) systematically lower
than qL (Zivcak and Brestic,
unpublished data)
Photosynth Res (2017) 132:13–66 23
123
fluorescence improves the linearity of the relationship
(Peterson et al. 2001).
For the leaf absorptivity coefficient, 0.85 is a typical
value for C3 plants (Ehleringer and Pearcy 1983; Krall and
Edwards 1992; Schultz 1996).
The value ‘‘0.5’’ is a rough estimate. Von Caemmerer
(2000) wrote that this factor varies between 0.45 and 0.5. In
contrast, in some studies (e.g., Strasser and Butler 1977) it
was observed that PSII absorbs more light than PSI. As a
first approximation, and in the absence of further infor-
mation, ‘‘0.5’’ is likely the best choice.
Peterson and Havir (2003, 2004) considered the possi-
bility that the rate constants kN of heat dissipation and/or
kF of Chl a fluorescence change during the OJIP fluores-
cence rise. According to Dau (1994) the relationship
between 1/FO and 1/FM should be linear and proportional
(slope = 1) if NPQ is purely due to dissipation of excita-
tion energy in the antenna. Peterson and Havir (2003)
tested this assumption for WT and psbS mutants of Ara-
bidopsis thaliana. They observed that for WT leaves the
relationship is biphasic with a steeper slope at low light
intensities than at high light intensities. In the case of the
psbS-mutant leaves there is a strong deviation from lin-
earity, mainly because the mutant shows no FO quenching.
Peterson and Havir (2004) extended this study to 10 A.
thaliana lines and concluded that during an OJIP rise
(saturating pulse) the kN and/or kF changes. They showed
that this affects the relationship between ETR based on
fluorescence measurements and ETR based on gas
exchange measurements. They further showed that the
relationship between these two parameters could be
improved considering the redox state of QA. Schansker
et al. (2011, 2014) proposed that during the OJIP rise the
fluorescence yield increases (kF increases) depending on
the time QA remains reduced, before becoming re-oxidized
by forward electron transport. This interpretation model
supports the observations and interpretations by Peterson
and Havir (2003, 2004).
There are several other factors that may affect the cor-
rection factor 0.5: (1) state transitions (see Question 8) can
cause a redistribution of light between PSII and PSI on a
minutes timescale, especially in algae (Bonaventura and
Myers 1969; Depege et al. 2003; Iwai et al. 2008); (2) the
extent of stacking and the associated changes in spillover,
again especially in algae (see Trissl and Wilhelm 1993 for
a discussion of this point), may have a considerable effect
on the distribution of light between the two photosystems;
(3) as shown by Anderson et al. (1988), there are at least
threefold differences in the PSII/PSI ratio (ranging from at
least 1:1 to 1:3) between different plant species. This range
may in part be compensated by differences in PSII antenna
size, but it is likely that it also represents some variability
in this parameter; (4) long-term acclimation of a plant
species to different light regimes affects PSII antenna size
and PSII/PSI ratio (Bailey et al. 2001; Ballottari et al. 2007;
Hogewoning et al. 2012; Bielczynski et al. 2016). A change
in both the PSII antenna size and the PSII/PSI ratio affects
the Chl a/b ratio and may be used as an indicator for effects
related to points (3) and (4).
Not only variations in the value ‘‘0.5,’’ but also cor-
rections of UPSII should be considered. As noted in Ques-
tion 6, a correction of UPSII for PSI fluorescence emission
will yield a more reliable ETR value, especially for C4
plants, and improve the linear correlation with CO2
assimilation measurements (Pfundel et al. 2013).
In Kalaji et al. (2014a) simultaneous Chl a fluores-
cence and CO2 assimilation measurements, and the
information such measurements can yield, are discussed.
In that paper the problems of using APSII or ETR as
indicators for the quantum yield of CO2 assimilation by
the leaf (UCO2) were also discussed extensively. By
determining the linearity of the relationship between ETR
and CO2 assimilation (in the case of C3 plants in the
presence of 2% O2 to suppress photorespiration), the
usefulness of ETR as a measure for CO2 assimilation can
be established for individual cases.
In C3 species where the linearity between ETR and net
CO2 assimilation is often absent due to the existence of
alternative electron sinks, especially photorespiration (see
Question 11), a multivariate approach was shown to be a
good alternative (Losciale et al. 2015). The rationale of
this method is: to consider the main factors affecting net
photosynthesis; to identify the related variables, and to
combine these variables using a multivariate semi-mech-
anistic approach. Roughly, net photosynthesis (Pn) is a
function of: (1) the electron transport rate of the ETC; (2)
the CO2 concentration at the carboxylative sites, which
depends on stomatal and mesophyll conductance; and (3)
the carboxylative activity of Rubisco, which depends on
the Michaelis–Menten constants for carboxylation, Kc,
and photorespiration, Ko. The first factor can easily be
determined using Chl a fluorescence (ETR), and the last
two are strictly related to the leaf-to-air temperature dif-
ference (DT) and the leaf temperature (Tl), used for Ko
and Kc estimation (von Caemmerer 2000). Using the
function
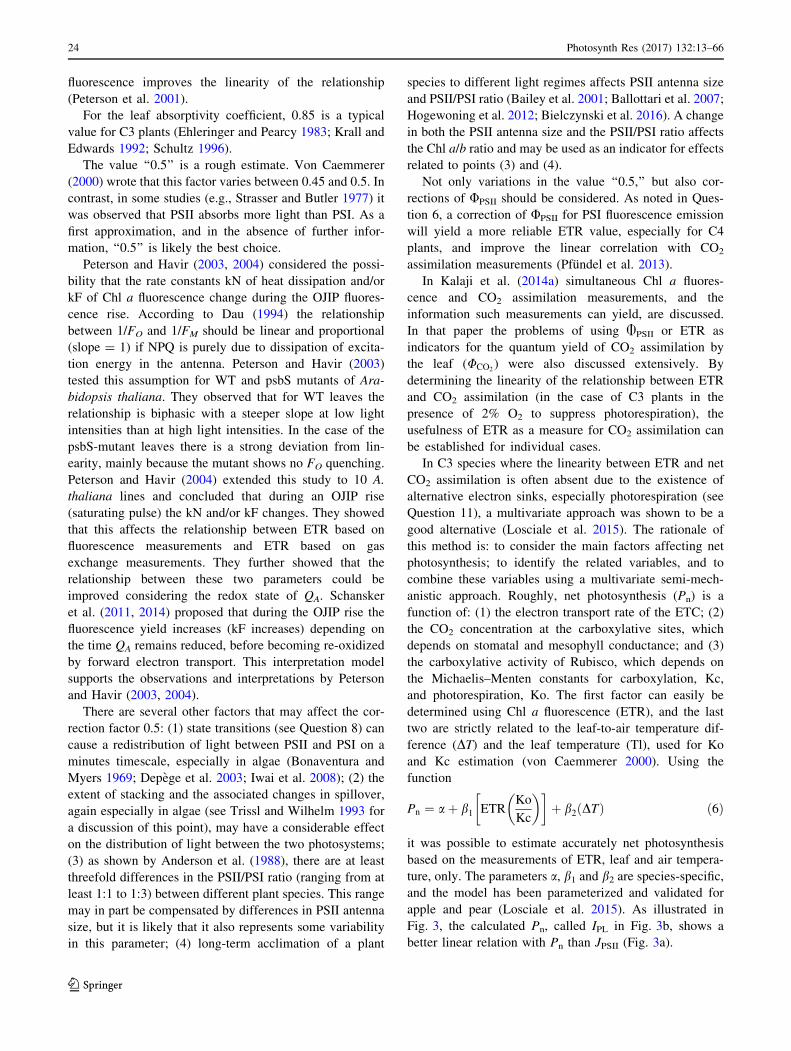
Pn ¼ aþ b1 ETRKo
Kc
� �� �þ b2 DTð Þ ð6Þ
it was possible to estimate accurately net photosynthesis
based on the measurements of ETR, leaf and air tempera-
ture, only. The parameters a, b1 and b2 are species-specific,
and the model has been parameterized and validated for
apple and pear (Losciale et al. 2015). As illustrated in
Fig. 3, the calculated Pn, called IPL in Fig. 3b, shows a
better linear relation with Pn than JPSII (Fig. 3a).
24 Photosynth Res (2017) 132:13–66
123

In summary, ETR has been shown to linearly correlate
with CO2 assimilation under several conditions. CO2
assimilation is, of course, only one of the available electron
sinks (see Question 11), photorespiration in C3 plants
being an important alternative sink, and, therefore, it
should not be used to estimate absolute rates of CO2
assimilation (Baker 2008). Correcting the ETR calculation
for PSI fluorescence emission (Question 6), taking into
account possible deviations of the factor from 0.5 as well
as the inclusion of several easy to measure parameters as
described in the previous paragraph may further improve
the usefulness and reliability of this parameter.
Question 11: What are the experimentaldifferences between Chl a fluorescence and gasexchange measurements?
ETR (‘‘Electron Transport Rate’’) is the fluorescence
parameter that gives a measure for the linear transport of
electrons from H2O (i.e., from PSII) to the Calvin–Benson
cycle (or other sinks, see below) under steady-state con-
ditions. If ETR and the CO2 assimilation rate are com-
pared, several theoretical and experimental factors have to
be considered.
Electron sinks
It is important to realize that CO2 assimilation is only one
of several potential electron sinks. The most important
competitor under stress conditions, that cause reduced
stomatal opening, is photorespiration. Photorespiration is
mainly an issue for C3 plants (Cornic and Fresneau 2002).
The most important alternative pathway under high light
conditions is also photorespiration (Foyer and Noctor 2009;
Bauwe et al. 2010). Photorespiratory activity can be nearly
completely suppressed if the oxygen concentration is
reduced to 2% or less. In C4 plants photorespiration is
negligible (Laisk and Edwards 1998). Other electron sinks
are the Mehler reaction (i.e., the reduction of molecular
oxygen on the acceptor side of PSI) (Asada 1999; Foyer
and Noctor 2009), cyclic electron transport around PSI
(e.g., Heber and Walker 1992), nitrogen and sulfur meta-
bolism, which also consume ATP and NADPH (e.g., Neyra
and Hageman 1974; Leustek et al. 2000; Kopriva and
Rennenberg 2004) and the export of reducing equivalents
to mitochondria or peroxisomes (Raghavendra and Pad-
masree 2003; Yoshida et al. 2007). The importance of these
alternative sinks under steady-state conditions has been a
discussion issue for many, many years (see, e.g., Peterson
and Havir 2004) and is beyond the scope of the present
review.
Structural considerations
The assimilation rate of CO2 reflects the photosynthetic
activity of the whole leaf, whereas ETR measurements
derive mainly from fluorescence emission by chloroplasts
in the top cell layers (in most cases, mainly the palisade
parenchyma cells) of the leaf. In addition, Pn is measured
by infrared gas analyzers (IRGAs) on an entire leaf or,
more commonly, a significant part of it; Chl a fluorescence,
in contrast, is measured on a much more limited area of the
leaf (a few square millimeters) (Rosenqvist and van Kooten
2003). Thus, the chloroplasts placed near the adaxial side
of the leaf may be photoinhibited (e.g., by strong light or
Fig. 3 Factors affecting the relationship between the electron trans-
port rate (ETR) and net photosynthesis (Pn) in apple. a Pn as a
function of ETR for 21 apple (C3 plant) genotypes exposed to
different drought stress conditions. The relation is nonlinear; b Pn as a
function of a parameter (IPL) based on ETR, leaf temperature and the
leaf-to-air temperature difference and derived by a multivariate
approach. This yielded a strongly linearly correlated relationship with
a slope of nearly 1. (Figures a and b are adapted from Figs. 1d and 3
in Losciale et al. 2015)
Photosynth Res (2017) 132:13–66 25
123
low temperatures in combination with moderate light),
whereas other chloroplasts (deeper in the leaf) are photo-
synthesizing normally. However, given the steep light
gradient inside the leaf, these chloroplasts will receive
much less light.
In summary, IRGA and Chl a fluorescence refer to
different spatial scales in terms of surface and depth.
Discrepancies between ETR and CO2 assimilation can, at
least in part, be explained on the basis of these differences.
Finally, coexistence of mitochondrial respiration and
photosynthetic metabolism needs to be considered. Pho-
tosynthesis measured by IRGA represents the net exchange
of CO2—gross photosynthesis minus the CO2 produced by
respiration and photorespiration. In general, the respiration
rate of a leaf is low compared with photosynthesis (around
5–10%) (e.g., Kromer 1995) and can therefore be disre-
garded. However, in leaves with very low photosynthetic
rates (e.g., plants under severe environmental stress or
deep-shade-adapted species), respiration becomes com-
paratively more important.
If a linear relationship between ETR and CO2 assimi-
lation is observed, one can conclude either that the con-
tribution of alternative sinks is negligible, or that their
contribution is light intensity independent. The same is true
for the structural effects. A systematic study of the effects
of these factors on the relationship between ETR and CO2
assimilation would, therefore, be useful. It is, however,
always good to keep in mind the factors mentioned above
that may affect the relationship between fluorescence and
IRGA measurements.
Question 12: Is it meaningful to determine energypartitioning?
Demmig-Adams et al. (1996) published a paper in which
they observed that the parameters qN and NPQ only gave
relative values for energy dissipation as heat. They wanted
to find a way to quantify in absolute terms the fraction of
energy dissipated as heat. The authors noted that in sun
leaves non-photochemical quenching was high and the PSII
reaction centers remained relatively open. In shade leaves
little non-photochemical quenching was induced and the
PSII reaction centers were to a large extent closed. The
authors then concluded that in shade leaves there is little
heat dissipation. This conclusion, however, is questionable.
Let’s have a look at a dark-adapted leaf. If a saturating
pulse is given to a dark-adapted leaf, all PSII reaction centers
become closed, photochemistry is reduced to 0, and exci-
tation energy can only be dissipated as either heat or fluo-
rescence emission (if we ignore connectivity, spillover and
oxidative damage). For such a saturating pulse it is also
assumed that it does not induce non-photochemical
quenching. Under such conditions fluorescence emission
has been determined to be *10% (Barber et al. 1989). This
means that at least 90% of the excitation energy in closed
PSII reaction centers is dissipated as heat. This happens both
in sun and in shade leaves. The induction of qE can increase
this percentage by no more than 10% by completely out-
competing fluorescence emission. In other words, the
induction of the processes associated with qE has only a
rather small effect on the fraction of excitation energy dis-
sipated as heat. However, the purpose of the processes
associated with qE is not so much to increase the fraction of
heat dissipation; its purpose is to reduce the lifetime of
excitation energy in the antenna. It may be expected that the
probability that excitation energy will cause oxidative
damage is a function of the lifetime of an exciton.
It can, therefore, be argued that the idea of Demmig-
Adams et al. (1996) was based on a false premise. Dissi-
pation of excitation energy as heat in closed PSII reaction
centers is always 90% or higher. What changes is an
increase of the efficiency with which the antenna can dis-
sipate excitation energy as heat if processes associated with
qE are induced. A shift in the lifetime of excitation energy
from 1.6–1.8 to 0.5 ns as violaxanthin is turned into
zeaxanthin (Z) ? antheraxanthin (A) has been observed by
Gilmore et al. (1998). These authors observed that changes
in the parameter FM0/FM can be used to monitor directly
fluorescence lifetimes, intrathylakoid pH and [Z ? A].
Recently, Lazar (2015) reviewed all the efforts that have
been made to improve on the original concept of Demmig-
Adams et al. (1996). Demmig-Adams et al. argued that in
addition to photosynthesis and dissipation there is an
undefined component, called ‘‘excess’’ by the authors.
Since no process is associated with this component this is
difficult to accept and understand (see Lazar 2015 for a
discussion of this point). Another point of criticism of the
approach of Demmig-Adams et al. can be that their
approach is too simplistic and ignores other processes that
affect Chl a fluorescence. Kornyeyev and Hendrickson
(2007) and Kornyeyev et al. (2013) included photoinhibi-
tion and other photochemical and non-photochemical pro-
cesses in their analysis. However, the observation that only
*10% of the absorbed energy, which in dark-adapted
leaves is emitted as fluorescence, can be quenched and
emitted as heat is also valid for all these improvements.
In summary, fluorescence, heat dissipation and photo-
synthesis compete with each other. In a closed PSII RC
photosynthesis is 0 and only fluorescence and heat dissi-
pation compete. If the rate constant for heat dissipation
(kN) increases, heat dissipation will increase at the cost of
fluorescence emission, which is observed as fluorescence
quenching. The rate constant kN increases if the lifetime of
the associated process decreases as observed by Gilmore
et al. (1998) for the xanthophyll cycle.
26 Photosynth Res (2017) 132:13–66
123

Question 13: What is the fate of light absorbedby PSII?
Once light is absorbed by the PSII antenna, it is efficiently
transferred to the PSII RCs and if they are in the open state
the most likely fate of the excitation energy (*90%) is that
it is used to drive a charge separation between the acces-
sory chlorophyll ChlD1 and Pheo followed by a transfer to
QA (see Question 6). Long and Humphries (1994) reported
on the basis of the literature that in full sunlight the per-
centage of absorbed light used for the photosynthetic pro-
cess as a whole drops to 5–10%. This observation was
confirmed by Losciale et al. (2010).
Alternative de-excitation pathways are: (1) dissipation
as heat by the carotenoids bound to the antenna proteins
(Gibasiewicz et al. 2005; Bode et al. 2009); (2) fluores-
cence emission by Chl a molecules (Butler 1978; Lazar
1999; Maxwell and Johnson 2000; Kalaji et al. 2012b); (3)
in the case of photoinhibition of a part of the PSII RCs,
transfer of excitation energy from active to inactive RCs
(see below); (4) the excitation of oxygen, resulting in
singlet oxygen (reviewed in Krieger-Liszkay et al. 2008).
These processes are all in competition. If QA is reduced, the
pathway related to charge separation is blocked, the life-
time of the excitation energy increases, and the other de-
excitation pathways become more important.
The rate constant for dissipation as heat is increased
considerably by photoprotective quenching, associated
with DpH, PsbS and the xanthophyll cycle (Ort 2001).
The xanthophyll cycle (i.e., the formation of zeaxanthin)
can reduce fluorescence emission by 75–90% (Demmig-
Adams et al. 1996; Flexas and Medrano 2002), which
means that nearly all absorbed energy is dissipated as heat
(see also Question 12).
Pogson et al. (1998) found that in addition to the xan-
thophyll cycle pigments (zeaxanthin and antheraxanthin),
the a-carotene-derived xanthophyll lutein, which is a
structural component of the subunits of the light-harvesting
complexes, contributes to the dissipation of excess absor-
bed light energy and the protection of plants against pho-
tooxidative damage. Lutein is also thought to contribute to
qE (Pogson et al. 1998; Muller et al. 2001). The xantho-
phyll neoxanthin, on the other hand, that also binds to
antenna proteins, does not seem to play a role in energy
dissipation (reviewed by Jahns and Holzwarth 2012).
A special case, in this respect, is formed by photoinac-
tivated PSII RCs. When inactivated, PSII RCs are disas-
sembled and repaired (Aro et al. 1993). During a clear
sunny day, in the absence of any additional stress, the total
PSII pool can be completely inactivated and repaired
without photoinhibition being detectable (Chow and Aro
2005). If plants also suffer from other stresses like water or
nitrogen deficiency (Jifon and Syvertsen 2003; Cheng et al.
2000), a significant population of inactivated PSII RCs may
accumulate in the thylakoid stacks. It has been proposed
that these RCs play a role in the dissipation of light energy
under high light conditions (Matsubara and Chow 2004;
Chow et al. 2012). Matsubara and Chow (2004) showed
that photoinhibition of PSII enriched membranes, which do
not show xanthophyll cycle activity, caused the induction
of a 0.3-ns lifetime component at the expense of 1.7- and
3.9-ns components. This suggests that photoinhibited PSII
RCs become strong quenchers of light energy. On this
basis, Matsubara and Chow (2004) proposed that by con-
nectivity with other active PSII RCs the photoinhibited
PSII RCs can act as quenching sinks. In thylakoid mem-
branes isolated from photoinhibited leaves the authors
observed 1.25- and 0.58-ns lifetime components, which
they associated with photoinhibition. It may be noted,
however, that the assignment of the 0.58-ns lifetime com-
ponent to photoinhibition can be challenged, since Gilmore
et al. (1998) ascribed a similar 0.5-ns component to the
effect of zeaxanthin formation.
The formation of singlet oxygen by excited Chl mole-
cules is a multistep process. The excited singlet Chl state
(1Chl) can return to the ground state under the emission of
fluorescence. Alternatively, a transition of the 1Chl state to
the triplet state (3Chl) can occur with a certain probability.
There are two sources of 3Chl: the PSII antenna and 3P680
following recombination (Krieger-Liszkay 2004). 3Chl can
return to the ground state under transfer of its energy to O2.
This leads to the formation of very reactive singlet O2
(1O2). The recombination pathway depends on the mid-
point potential of QA-. Fufezan et al. (2002) showed that in
the presence of the phenolic herbicide bromoxynil the
midpoint potential of QA- is lowered, charge recombination
between Pheo- and P680? is favoured, and the 1O2 yield is
higher. This indicates that it is this recombination pathway
that leads in the RC to singlet oxygen formation via the3P680 state. Singlet O2 is thought to play a role in pho-
toinhibition (see Krieger-Liszkay et al. 2008 for a discus-
sion of this point).
The excitation pressure is not only reduced by more
efficient heat dissipation but also by a higher electron
transport rate (see Question 11). As discussed in Question
8, preventing a strongly reduced acceptor side of PSI is
important. Tiwari et al. (2016) showed recently for the pgr5
mutant, in which cyclic electron transport around PSI is
inhibited, that the FeS clusters on the acceptor side of PSI
become more easily damaged under high light conditions,
showing the importance of this process for the protection of
PSI. The glutathione–ascorbate cycle is also thought to
play a role in the protection of the acceptor side of PSI
from damage under conditions of low Calvin–Benson cycle
Photosynth Res (2017) 132:13–66 27
123

activity (Noctor and Foyer 1998; Baker and Rosenqvist
2004). Baker and Rosenqvist (2004) noted that the partic-
ular physiological effects of different stresses determine
which alternative process becomes more active.
Regulation of thermal and photochemical de-excitation
pathways, together with the PSII recovery system, all
contribute to a photoprotective system, which prevents
photodamage to the photosynthetic apparatus (Baker and
Rosenqvist 2004). Photoinhibition and photoprotective
mechanisms can be detected using several techniques, but
the most useful method is the measurement of Chl a fluo-
rescence (Krause and Weis 1991; Govindjee 1995; Max-
well and Johnson 2000; Losciale et al. 2008, 2010).
Question 14: How to probe the donor side of PSII?
Oxygen evolution takes place at the donor side of PSII,
which consists of a Mn cluster of four manganese ions, a
Cl- and Ca2? ion and the surrounding protein environment
(Debus 1992; Yocum 2008). Access of reductants like
ascorbate is limited by the presence of three extrinsic
proteins of the oxygen-evolving complex (OEC), i.e.,
PsbO, PsbP and PsbQ (reviewed by Toth et al. 2013). The
electron transfer link between the Mn cluster and P680 is a
tyrosine molecule located in the D1 protein called TyrZ.
During the oxygen-evolving process, the PSII donor side
passes through five redox states, S0 to S4, of which the S4
state is not stable and passes to the S0 state within about
2 ms under the release of an oxygen molecule. Flash-in-
duced oxygen evolution (Kok et al. 1970; Joliot et al.
1971), flash-induced fluorescence (Bouges-Bocquet 1980)
and flash-induced DF (Grabolle and Dau 2005) are char-
acterized by period-4 oscillations. For the analysis of the
S states, the five-state model as introduced by Kok et al.
(1970) is still largely valid: The OEC following dark
adaptation is in the S1 state, and the period-4 oscillations
are dampened by misses and double hits, i.e., a flash
induces two charge separations [see, e.g., Dau et al. (2012)
for a more mechanistic model for the period-4 oscillations].
The only major change is that a population of about 25%
RCs, which Kok et al. ascribed to PSII RCs in the S0 state
in darkness, is now ascribed to electron donation by
reduced TyrD to the Mn cluster between flashes (Velthuys
and Visser 1975; Vermaas et al. 1984; Shinkarev 2005).
Donation of an electron by TyrD to the Mn cluster is a slow
reaction and can, in continuous light, not compete with the
light-induced turnover of the OEC. In dark-adapted sam-
ples all RCs can be considered to be in the S1 state. Period-
4 oscillations can be used to analyze the S state distribution
of a sample (cf. Ioannidis et al. 2000). This analysis can
even be extended to super-reduced states such as the S-1
and S-2 states (Schansker et al. 2002). Period-4 oscillation
in the FO level can be used to follow the decay kinetics of
the S states under natural conditions, but also in response to
external electron donors like hydroxylamine or NO (see
Ioannidis et al. 2000). The time resolution of such mea-
surements depends on the flash frequency, which is, in
practice, around 10 Hz (one flash every 100 ms). This type
of measurement can also be carried out with flash illumi-
nation of a sample on a bare oxygen electrode (e.g.,
Messinger and Renger 1990, 1993). The disadvantage of a
bare oxygen electrode is that a rapid injection and mixing
of reactants is not possible (Messinger and Renger 1990).
Period-4 oscillations are usually measured on PSII enriched
membranes, thylakoid membranes or algal cells. David
Kramer and coworkers introduced, in 1990, an instrument
to measure period-4 oscillations on leaves in the field
(Kramer et al. 1990), although few studies using this
instrument have been published.
In response to heat stress, the Mn cluster can be
destroyed. Heat stress can cause a dissociation of extrinsic
proteins, followed by a super-reduction of the Mn cluster,
which destabilizes it, resulting in a disintegration of the Mn
cluster and a release of the Mn ions into the lumen (Ya-
mane et al. 1998; Pospıcil et al. 2003; Barra et al. 2006). In
the case of severe heat stress, the OJ rise turns into a K
peak (e.g., Srivastava et al. 1997; Fig. 4). It has been
proposed that the K peak, that can be made visible by
subtraction of the double-normalized OJ rise, can be used
Fig. 4 Chl a fluorescence transients of untreated (closed symbols)
and severely high-temperature-stressed (open symbols) barley leaves
illuminated with 5000 (green symbols), 10,000 (red symbols) and
15,000 (black symbols) lmol photons m-2 s-1. To allow a compar-
ison of the kinetics the transients were shifted to 0 to have for all
transients the same O value. The time needed to reach the K peak at
the different light intensities is indicated. The K peak equates
approximately 1 charge separation in all RCs after which a shortage
of electrons that can be donated by the donor side occurs, and the
fluorescence intensity decreases due to re-oxidation of QA- reduced by
the first charge separation (modified from Toth et al. 2007a)
28 Photosynth Res (2017) 132:13–66
123

as a probe of PSII RCs with an inactive donor side (e.g.,
Smit et al. 2009; Yusuf et al. 2010). However, as discussed
in Kalaji et al. (2014a), this is tricky, because the same
phenomenon is also induced by differences in the PSII
antenna size between samples and a difference in the redox
state of the PQ pool (Strasser et al. 2001). There are,
however, two alternative approaches available to
researchers. At approximately 3000 lmol photons m-2 -
s-1 one charge separation in all reaction centers takes
about 200 ls (K step). PSII RCs with an inactive donor
side are capable of a single charge separation and during
this time interval the fluorescence rise is the same in active
and inactive RCs (Toth et al. 2007a; Fig. 4). Subsequently,
TyrZ is re-reduced with a half-time of about 30 ms (Toth
et al. 2007a, 2009) and during this time no second
stable charge separation can occur. This means that the
K to J rise is slowed down as a function the fraction of PSII
RCs with an inactive donor side. Making use of this phe-
nomenon, the parameter FK/FJ was introduced to probe the
extent of inactivation of the PSII donor side (Srivastava
et al. 1995; Lu and Zhang 1999). Making use of the dif-
ference in the regeneration time of the donor side, it is also
possible to give two strong 5-ms pulses spaced 2.3 ms
apart (the dark interval when the pulse interval of the
HandyPEA is set to 0). The ratio of the fluorescence
intensity at 300 ls of the second and the first pulse can then
be used as a measure of the fraction PSII RCs with an
inactivated donor side (Oukarroum et al. 2009; see this
paper also for a discussion of the different approaches).
In summary, to probe the fraction of PSII RCs with an
inactive donor side, it is possible to make use of the dif-
ference in the regeneration time of the donor side of PSII
(the re-reduction of P680? and TyrZ?).
Question 15: What is the character of the J step?
The J step (F2ms or F3ms) forms the central point in the JIP
test analysis. Giving the J step such a central role was one
of the major innovations introduced by Strasser and
Strasser (1995) together with the consistent use of a loga-
rithmic time base to make the different steps of the OJIP
rise visible. The J step of Strasser and coworkers equates
the I1 step of Schreiber (Schreiber 1986; Neubauer and
Schreiber 1987; Schreiber and Neubauer 1987). Compare
for this equivalence panels A and B of Fig. 1 in Lazar
(2006). In publications about the analysis of OJIP tran-
sients the time point taken for the J step is either at 2 or at
3 ms (e.g., Strasser and Strasser 1995 vs. Toth et al.
2007b). Stirbet and Govindjee (2012) argued that it had to
be 2 ms because this was the time point chosen by Strasser
and Strasser (1995) for the JIP test. Kinetically, the choice
is important. At low light intensities or for PSII reaction
centers with a smaller antenna size the time needed to
reach the J step is more than 2 ms, and this provides
additional variability, which may be interesting for a stress
test. For people interested in the kinetics of the photosyn-
thetic electron transport chain, the 3-ms point is the more
logical choice. It is at the end of the step, where the traffic
jam of electrons induced by the rate-limiting step presented
by the exchange of reduced PQH2 for PQ is maximal. As
shown in the literature, this time point remains the end of
the J step independent of the light intensity; lowering the
light intensity gradually makes F3ms disappear (Schansker
et al. 2005, 2011).
Another phenomenon observed, when using very high
light intensities, is a dip occurring around 2–3 ms (Neu-
bauer and Schreiber 1987; Schansker et al. 2005, 2011). A
possible explanation for this dip is the presence of P680?,
which acts as an even stronger fluorescence quencher than
QA (Steffen et al. 2005; see Question 22). The lifetime of
P680? is short for all S states, with the exception of the
transition from the S3 to S4 state. As the light intensity is
increased, the turnover of PSII will remain more synchro-
nized during the first turnovers and the peak concentration
accompanying the S3 to S4 state transition will not only
occur at shorter times, but will also reach a higher peak
value causing a stronger and more localized quenching
effect.
It has been assumed that the J step is due to the rate
limitation caused by the exchange of QBH2 for PQ (cf.
Petrouleas and Crofts 2005; Schansker et al. 2005; Toth
et al. 2007b). The role of P680? quenching discussed
above suggests that the transitory accumulation of P680?,
in going from the S3 to the S4 state (after 3 charge sepa-
rations), is the physical reason for the existence of the J
step. For dark-adapted leaves and continuous light both
processes occur synchronously. Using a preflash protocol, a
desynchronization between PSII donor and acceptor sides
can be induced. This happens following two preflashes.
This creates the S3ZP680QAQB- state, where the S3 state is
quite stable during a, e.g., 100-ms flash interval and QBH2
is exchanged within 2 ms for PQ. If 100 ms after the two
preflashes the OJIP transient is measured, the induction
kinetics of the fluorescence rise are quite drastically
changed (Schreiber and Neubauer 1987; Strasser and
Strasser 1998).
Question 16: What is the information that can bederived from the Area parameter?
Joliot and Joliot (1964) published evidence that the rela-
tionship between variable fluorescence and QA redox state
in the presence of an inhibitor (e.g., DCMU) that prevents
the re-oxidation of QA- is nonlinear. The authors proposed
Photosynth Res (2017) 132:13–66 29
123

that this nonlinearity was due to the exchange of excitation
energy between different PSII antennae. As a consequence
the relationship became sigmoidal. Two years later, Malkin
(1966) and Murata et al. (1966a) came up with an alter-
native. They proposed that the complementary area
between FM and the fluorescence transient measured in the
presence of an inhibitor of re-oxidation of QA- is linearly
related to the QA- concentration. This was confirmed
experimentally by Bennoun and Li (1973). Although this
idea can still be applied, several complications have been
identified.
First, the complementary area of fluorescence induction
curves measured in the presence of DCMU was shown to
consist of several rise components. Doschek and Kok
(1972) concluded that the complementary area represented
a two-electron process. Melis and Homann (1975, 1976)
interpreted this phenomenon to represent PSII hetero-
geneity: PSII alpha and beta centers differing in antenna
size. Subsequently, two more phases were identified, des-
ignated gamma and delta (e.g., Sinclair and Spence 1990).
Then it was discovered that the area was very sensitive to
the place where the FM was set (Bell and Hipkins 1985).
Particularly, in cases where part of the PSII RCs remained
uninhibited, it took a long time before FM was reached. As a
consequence, the area grew strongly. In the pre-LED period,
when shutters with opening times of 0.8–2 ms were used,
measurements in the presence of inhibitors like DCMU had
to be made at very low light intensities to record as much as
possible of the fluorescence transient. With modern shut-
terless LED-based systems, such measurements at light
intensities of 3000 lmol photons m-2 s-1 or more can be
made without any problem. Such measurements have much
better definedFM levels, which strongly reduces the problem
with inhibited PSII RCs.
Using high light intensities, area ratios of alpha/beta/
gamma = 0.58:0.33:0.06 were obtained for pea leaves
(Toth and Strasser 2005). With a simulation approach,
Lazar et al. (2001) obtained similar values for wheat
leaves: 0.64:032:0.04. The percentage of gamma centers
agrees well with the percentage of QB non-reducing centers
determined using another method (Schansker and Strasser
2005). Based on present knowledge, the area growth of
alpha centers should parallel the reduction of QA.
It should be noted that Trissl and Lavergne (1995)
argued that changing rate constants during induction would
preclude the use of the area as a measure for QA-. However,
if we assume that almost each charge separation reduces
QA (quantum yield of approximately 0.88, see Question 6),
then the area growth simply follows the gradual reduction
of QA in all PSII RCs and does not depend on different
reactions and changing rate constants in individual RCs.
The area approach has also been applied to OJIP tran-
sients, for example, in the JIP test (Strasser and Strasser
1995; Strasser et al. 2004), but also by Joliot and Joliot
(2002) and Toth et al. (2007b). Joliot and Joliot (2002)
showed that the regeneration of the area above the OJIP
transient following a saturating pulse of light is defined by
two exponential phases that they ascribed to the reoxida-
tion of the acceptor side of PSI (fast phase) and the reox-
idation of the PQ pool (slow phase). Toth et al. (2007b)
manipulated the redox state of the electron transport chain
using anaerobiosis and showed that both the area between
FM and the OJ rise (0–3 ms) and the area between FM and
the JI rise (3–30 ms) linearly correlate with the FJ
intensity.
The area above the OJIP transient is dominated by the
area above the JIP rise. Schansker et al. (2011) have pro-
vided evidence that the character of the JIP rise differs
from that of the OJ rise. During the JIP rise the fluores-
cence yield per reduced molecule of QA reduced increases.
In this respect, the calibration of the area above the OJIP
transient by the area between the J step and the OJ rise, as
done in the JIP test, may not be the best approach. Instead,
it is better to use the area between the OJ rise and FM,
taking J at 3 ms. In this way, the fluorescence yield
increase is taken care of. This area would equate approx-
imately 3 electrons, i.e., the reduction of the acceptor side
of PSII. The JIP test approach yields for dark-adapted, non-
stressed leaves a value N of about 30 electrons (=total Area
divided by the area between the OJ rise and the J step).
Joliot and Joliot (2002) observed that PQ pool and PSI
acceptor-side pool size were similar. For the JIP test
approach this means 7–8 PQ molecules per PSII, which
agrees quite well with a calculation of Lavergne et al.
(1992). Kirchhoff et al. (2000), on the other hand, con-
cluded that in stacked thylakoid membranes there are about
3–4 PQ molecules per PSII, which is a considerably lower
value. The approach of Toth et al. (2007b), using the area
between OJ rise and FM, yields for Phaseolus vulgaris
leaves a value N of approximately 31 and about 7 PQ
molecules. Although the calculation in both cases is quite
different, the outcome is quite similar.
The conformational change concept gives a rational-
ization for the relationship between area and electron
transport chain redox state (Schansker et al. 2011, 2014).
The induction of the conformational changes depends on
the time interval QA- is reduced before being reoxidized,
and this in turn depends on the redox state of the electron
transport chain.
The use of the Area—if normalized—is an effective way
to detect changes in the redox state of the electron transport
chain or changes in the stoichiometry PSII/PQ pool/PSI
acceptor side of unstressed leaves. For stressed leaves, the
Area can only be used if it has been ascertained that several
criteria are met: The FM should be reached and the rate
constants of different electron transport reactions should
30 Photosynth Res (2017) 132:13–66
123
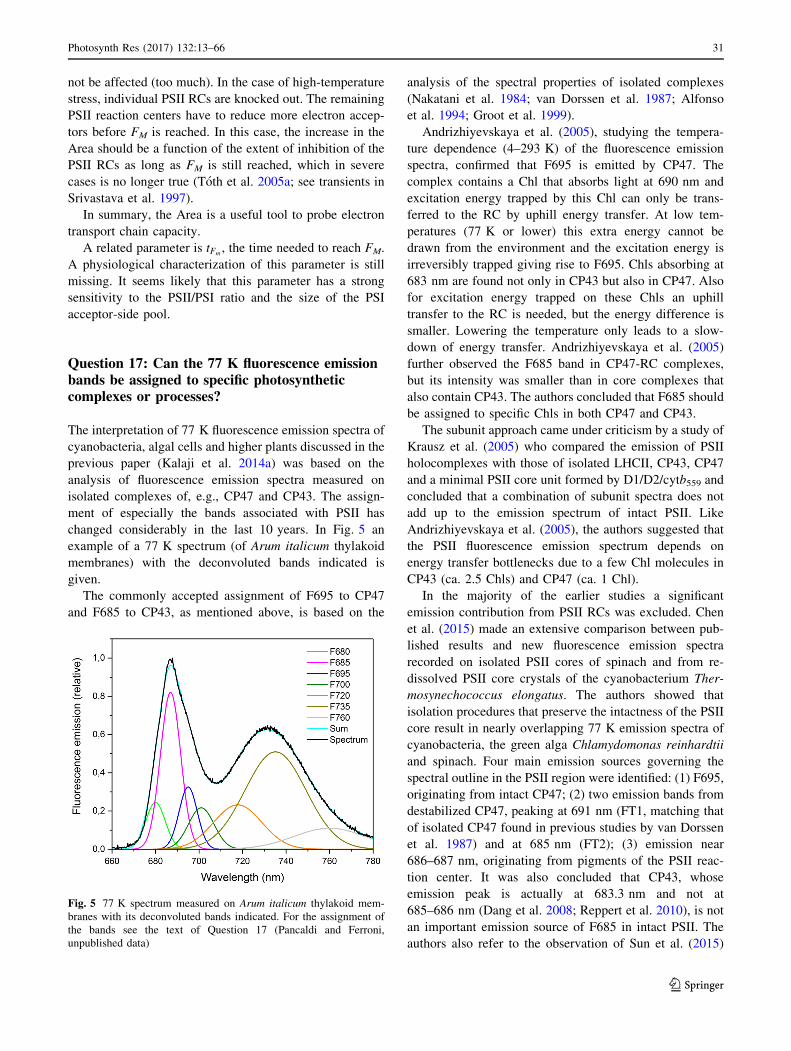
not be affected (too much). In the case of high-temperature
stress, individual PSII RCs are knocked out. The remaining
PSII reaction centers have to reduce more electron accep-
tors before FM is reached. In this case, the increase in the
Area should be a function of the extent of inhibition of the
PSII RCs as long as FM is still reached, which in severe
cases is no longer true (Toth et al. 2005a; see transients in
Srivastava et al. 1997).
In summary, the Area is a useful tool to probe electron
transport chain capacity.
A related parameter is tFm, the time needed to reach FM.
A physiological characterization of this parameter is still
missing. It seems likely that this parameter has a strong
sensitivity to the PSII/PSI ratio and the size of the PSI
acceptor-side pool.
Question 17: Can the 77 K fluorescence emissionbands be assigned to specific photosyntheticcomplexes or processes?
The interpretation of 77 K fluorescence emission spectra of
cyanobacteria, algal cells and higher plants discussed in the
previous paper (Kalaji et al. 2014a) was based on the
analysis of fluorescence emission spectra measured on
isolated complexes of, e.g., CP47 and CP43. The assign-
ment of especially the bands associated with PSII has
changed considerably in the last 10 years. In Fig. 5 an
example of a 77 K spectrum (of Arum italicum thylakoid
membranes) with the deconvoluted bands indicated is
given.
The commonly accepted assignment of F695 to CP47
and F685 to CP43, as mentioned above, is based on the
analysis of the spectral properties of isolated complexes
(Nakatani et al. 1984; van Dorssen et al. 1987; Alfonso
et al. 1994; Groot et al. 1999).
Andrizhiyevskaya et al. (2005), studying the tempera-
ture dependence (4–293 K) of the fluorescence emission
spectra, confirmed that F695 is emitted by CP47. The
complex contains a Chl that absorbs light at 690 nm and
excitation energy trapped by this Chl can only be trans-
ferred to the RC by uphill energy transfer. At low tem-
peratures (77 K or lower) this extra energy cannot be
drawn from the environment and the excitation energy is
irreversibly trapped giving rise to F695. Chls absorbing at
683 nm are found not only in CP43 but also in CP47. Also
for excitation energy trapped on these Chls an uphill
transfer to the RC is needed, but the energy difference is
smaller. Lowering the temperature only leads to a slow-
down of energy transfer. Andrizhiyevskaya et al. (2005)
further observed the F685 band in CP47-RC complexes,
but its intensity was smaller than in core complexes that
also contain CP43. The authors concluded that F685 should
be assigned to specific Chls in both CP47 and CP43.
The subunit approach came under criticism by a study of
Krausz et al. (2005) who compared the emission of PSII
holocomplexes with those of isolated LHCII, CP43, CP47
and a minimal PSII core unit formed by D1/D2/cytb559 and
concluded that a combination of subunit spectra does not
add up to the emission spectrum of intact PSII. Like
Andrizhiyevskaya et al. (2005), the authors suggested that
the PSII fluorescence emission spectrum depends on
energy transfer bottlenecks due to a few Chl molecules in
CP43 (ca. 2.5 Chls) and CP47 (ca. 1 Chl).
In the majority of the earlier studies a significant
emission contribution from PSII RCs was excluded. Chen
et al. (2015) made an extensive comparison between pub-
lished results and new fluorescence emission spectra
recorded on isolated PSII cores of spinach and from re-
dissolved PSII core crystals of the cyanobacterium Ther-
mosynechococcus elongatus. The authors showed that
isolation procedures that preserve the intactness of the PSII
core result in nearly overlapping 77 K emission spectra of
cyanobacteria, the green alga Chlamydomonas reinhardtii
and spinach. Four main emission sources governing the
spectral outline in the PSII region were identified: (1) F695,
originating from intact CP47; (2) two emission bands from
destabilized CP47, peaking at 691 nm (FT1, matching that
of isolated CP47 found in previous studies by van Dorssen
et al. 1987) and at 685 nm (FT2); (3) emission near
686–687 nm, originating from pigments of the PSII reac-
tion center. It was also concluded that CP43, whose
emission peak is actually at 683.3 nm and not at
685–686 nm (Dang et al. 2008; Reppert et al. 2010), is not
an important emission source of F685 in intact PSII. The
authors also refer to the observation of Sun et al. (2015)
Fig. 5 77 K spectrum measured on Arum italicum thylakoid mem-
branes with its deconvoluted bands indicated. For the assignment of
the bands see the text of Question 17 (Pancaldi and Ferroni,
unpublished data)
Photosynth Res (2017) 132:13–66 31
123
that interaction of LHCII with purified PSII core increases
F685 considerably, which would further support their
assignment of F685 to PSII RC pigments. In other words,
in intact PSII core, the main source for F685 is proposed to
be the PSII reaction center.
D’Haene et al. 2015 came with an alternative interpre-
tation of F695. In PSII mutants of the cyanobacterium
Synechocystis lacking PsbH, a small PSII subunit, F695 is
not detected. The authors suggest that the interaction of
PsbH with a single monomeric Chl ligated to His114 of
CP47 is responsible for F695.
The story of the PSII 77 K emission band assignment is
a good illustration of the potential problems of using iso-
lated subunits to study processes affecting the whole
complex. In this case, the whole is more than the sum of
the parts.
The assignment of the fluorescence emission associated
with PSI at around 720 nm is more straightforward. The
major fluorescence emission band of PSI is remarkably
variable among different species (Murata et al. 1966b) with
peak emission occurring between 710 and 730 nm. Isolation
of subunits from PSI particles allowed a more detailed
characterization of PSI emission (Mullet et al. 1980; Argy-
roudi-Akoyunoglou 1984; Kuang et al.1984). In higher
plants two main emission sources were identified at 77 K:
F720 and F735 (Mukerji and Sauer 1990; Palsson et al.
1995). In the green alga Chlamydomonas reinhardtii, LHCI-
PSI emission is quite blue-shifted compared to higher plants,
i.e., a peak at ca. 715 nm instead of 735 nm (Garnier et al.
1986; Ferroni et al. 2011). Croce et al. (1997) showed that
actually three Chl spectral forms exist in native PSI from
maize thylakoids, having emission maxima at 720, 730 and
742 nm. Analyzing barley mutants lacking individual LHCI
subunits, Knoetzel et al. (1998) linked the Lhca1 and Lhca4
subunits of LHCI to emissions at 732 and 742 nm, respec-
tively, but only when such LHCI antennae were associated
with PSI. A simplified band attribution can, therefore, be
proposed: PSI core emits F720, but is also characterized by a
short wavelength emission at 690 nm (Croce et al. 1997).
Assembly of LHCI-PSI complexes gives rise to longer
wavelength emissions with increased intensity, collectively
giving rise to F735. In cyanobacteria, where PSI typically is
organized in trimers instead of monomers, a further redshift
in emission gives rise to F760 (Shubin et al. 1992; Kara-
petyan et al. 2014). Origin of PSI fluorescence bands is
attributed to the ‘‘red chlorophylls’’ bound to PSI core,
Lhca1/4 and Lhca2/3; the emission sources are probably
dimers, trimers or aggregates of Chls which absorb light at
wavelengths longer than 700 nm, necessitating uphill energy
transfer at 77 K as described above for PSII (reviewed by van
Grondelle and Gobets 2004).
An important contribution to the 77 K spectra comes
from LHCII. The presence of LHCII, formed by trimers of
Lhcb1-3 subunits in higher plants, gives the photosystems a
high degree of flexibility, which is still the subject of
intense study. The following interactions have been
observed so far: (1) LHCII association with PSII core
dimers to form LHCII-PSII supercomplexes (Boekema
et al. 1999); (2) LHCII association with PSI in the so-called
LHCII-PSI state transition complex to balance excitation
between PSI and PSII (Pesaresi et al. 2009; Wientjes et al.
2013b); (3) aggregation of LHCII trimers related to the
transition from the harvesting to the quenched state (qE)
(Johnson et al. 2011); (4) monomerization of LHCII tri-
mers upon long-term acclimation to high light to reduce
energy transfer to photosystems (Bielczynski et al. 2016);
(5) LHCII trimers surrounding PSI-PSII megacomplexes
(Yokono et al. 2015) and/or forming a bridge between PSI
and PSII in such megacomplexes (Grieco et al. 2015;
Suorsa et al. 2015) mediating photoprotective energy
spillover from PSII to PSI (Yokono et al. 2015; Ferroni
et al. 2016). Because LHCII can serve PSII and/or PSI, the
relative size of F685 and F720 is dependent on the pre-
illumination conditions (see also Question 8).
The F680 emission of LHCII, as demonstrated in iso-
lated LHCII monomers and trimers (Kirchhoff et al. 2003;
Caffarri et al. 2004; Karapetyan 2004), is not usually found
as a distinct peak in 77 K spectra of thylakoids, reflecting
the very efficient excitation energy transfer from LHCII to
PSII in LHCII-PSII supercomplexes. Association of LHCII
with PSII core increased the intensity of F695 (greening
pea plants, Srivastava et al. 1999) and/or F685 (in vitro
incorporation of LHCII in PSII cores, Sun et al. 2015),
testifying to an increased efficiency of exciton transfer to
the reaction centers. Conversely, release of LHCII trimers
enhances F680. There are several lines of evidence linking
F680 to free LHCII, among which LHCII release from
grana cores induced by thylakoid unstacking (van der
Weij-de Wit et al. 2007), LHCII release from grana mar-
gins induced by digitonin treatment of isolated thylakoids
(Grieco et al. 2015), and also steady-state conditions in
which LHCII trimers are overly abundant as compared to
photosystem cores (Pantaleoni et al. 2009; Ferroni et al.
2013). Native LHCII trimers have a strong tendency to
aggregate in vitro, leading to the appearance of a new long-
wavelength band, F700, also accompanied by a quenching
of fluorescence, which could support a role of LHCII
aggregates in excess energy dissipation (Mullet et al. 1980;
Ruban and Horton 1992; Karapetyan 2004; Schaller et al.
2011). F700 has been recorded also in vivo in intact leaves
(Siffel and Braunova 1999; Oh et al. 2003). The LHCII
aggregates that originated in leaves upon a CO2 deficit
yielded a F700 band with high fluorescence yield (Siffel
and Braunova 1999). It is likely that, in vivo, different
populations of LHCII aggregates can be formed, either
engaged in thermal dissipation or not.
32 Photosynth Res (2017) 132:13–66
123
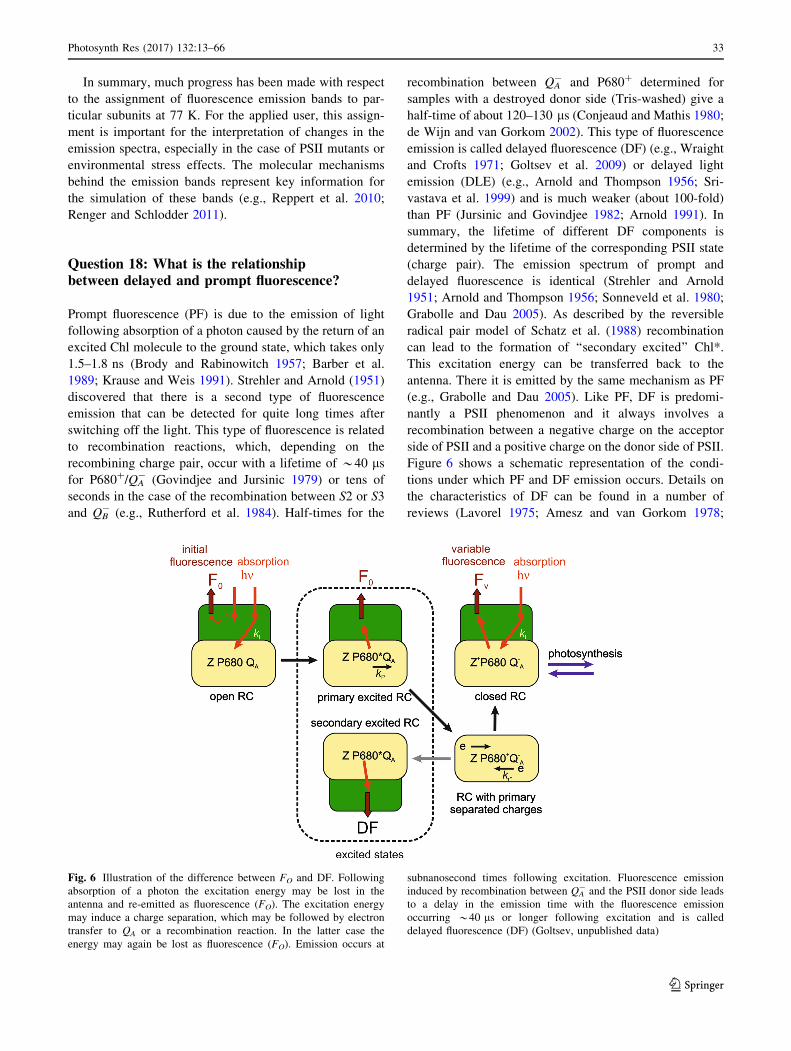
In summary, much progress has been made with respect
to the assignment of fluorescence emission bands to par-
ticular subunits at 77 K. For the applied user, this assign-
ment is important for the interpretation of changes in the
emission spectra, especially in the case of PSII mutants or
environmental stress effects. The molecular mechanisms
behind the emission bands represent key information for
the simulation of these bands (e.g., Reppert et al. 2010;
Renger and Schlodder 2011).
Question 18: What is the relationshipbetween delayed and prompt fluorescence?
Prompt fluorescence (PF) is due to the emission of light
following absorption of a photon caused by the return of an
excited Chl molecule to the ground state, which takes only
1.5–1.8 ns (Brody and Rabinowitch 1957; Barber et al.
1989; Krause and Weis 1991). Strehler and Arnold (1951)
discovered that there is a second type of fluorescence
emission that can be detected for quite long times after
switching off the light. This type of fluorescence is related
to recombination reactions, which, depending on the
recombining charge pair, occur with a lifetime of *40 ls
for P680?/QA- (Govindjee and Jursinic 1979) or tens of
seconds in the case of the recombination between S2 or S3
and QB- (e.g., Rutherford et al. 1984). Half-times for the
recombination between QA- and P680? determined for
samples with a destroyed donor side (Tris-washed) give a
half-time of about 120–130 ls (Conjeaud and Mathis 1980;
de Wijn and van Gorkom 2002). This type of fluorescence
emission is called delayed fluorescence (DF) (e.g., Wraight
and Crofts 1971; Goltsev et al. 2009) or delayed light
emission (DLE) (e.g., Arnold and Thompson 1956; Sri-
vastava et al. 1999) and is much weaker (about 100-fold)
than PF (Jursinic and Govindjee 1982; Arnold 1991). In
summary, the lifetime of different DF components is
determined by the lifetime of the corresponding PSII state
(charge pair). The emission spectrum of prompt and
delayed fluorescence is identical (Strehler and Arnold
1951; Arnold and Thompson 1956; Sonneveld et al. 1980;
Grabolle and Dau 2005). As described by the reversible
radical pair model of Schatz et al. (1988) recombination
can lead to the formation of ‘‘secondary excited’’ Chl*.
This excitation energy can be transferred back to the
antenna. There it is emitted by the same mechanism as PF
(e.g., Grabolle and Dau 2005). Like PF, DF is predomi-
nantly a PSII phenomenon and it always involves a
recombination between a negative charge on the acceptor
side of PSII and a positive charge on the donor side of PSII.
Figure 6 shows a schematic representation of the condi-
tions under which PF and DF emission occurs. Details on
the characteristics of DF can be found in a number of
reviews (Lavorel 1975; Amesz and van Gorkom 1978;
Fig. 6 Illustration of the difference between FO and DF. Following
absorption of a photon the excitation energy may be lost in the
antenna and re-emitted as fluorescence (FO). The excitation energy
may induce a charge separation, which may be followed by electron
transfer to QA or a recombination reaction. In the latter case the
energy may again be lost as fluorescence (FO). Emission occurs at
subnanosecond times following excitation. Fluorescence emission
induced by recombination between QA- and the PSII donor side leads
to a delay in the emission time with the fluorescence emission
occurring *40 ls or longer following excitation and is called
delayed fluorescence (DF) (Goltsev, unpublished data)
Photosynth Res (2017) 132:13–66 33
123
Malkin 1979; Lavorel et al. 1982; Jursinic 1986; Vese-
lovskii and Veselova 1990; Gaevsky and Morgun 1993;
Radenovic et al. 1994; Tyystjarvi and Vass 2004; Goltsev
et al. 2009; Kalaji et al. 2012a). The older reviews predate
the introduction of the reversible radical pair mechanism
and contain extensive discussions on the mechanism of DF.
These articles are good sources for experimental DF phe-
nomena though.
Question 19: What is the relationshipbetween delayed fluorescence (DF)and thermoluminescence (TL)?
As noted above, each charge pair has its own particular
recombination time. Based on their specific lifetimes, the
different charge pairs can be identified and their popula-
tion/amplitude and recombination rate characterized (re-
viewed by, e.g., Vass and Govindjee 1996; Vass 2003).
Thermoluminescence (TL), light emission as a result of
temperature-dependent recombination of charge pairs, is a
special application of DF, although it has to be noted that
not all DF phenomena have a TL counterpart (Vass and
Govindjee 1996). In addition, there are high-temperature
TL bands that are due to oxidative chemiluminescence
(50–70 �C) (Hideg and Vass 1993; Skotnica et al. 1999)
and lipid peroxidation (130–140 �C) (Ducruet and Vavilin
1999). As the temperature is lowered, charge recombina-
tions become gradually inhibited. Below approximately
-40 �C/-45 �C no charge recombinations occur anymore
and induced charge pairs can be stabilized (Brudvig et al.
1983). For TL, there are different illumination strategies. It
is possible to give one or more single turnover flashes at,
for example, -20 �C, at which temperature it is still pos-
sible to induce stable charge separations in practically all
reaction centers, followed by a rapid lowering of the
temperature to stabilize the induced state. Alternatively, it
is possible to illuminate a sample for a much longer time in
the range -60 to -80 �C to induce a single charge sepa-
ration in all reaction centers (Brudvig et al. 1983). This
does not induce Chl or Car radicals as suggested by Stirbet
and Govindjee (2012); to induce these radicals the tem-
perature has to be lowered further (e.g., Faller et al. 2001).
Inversely, upon warming the sample, the different charge
pairs can gradually recombine; each charge pair with its
own typical peak temperature (Vass 2003). Longer
recombination times go together with higher TL peak
temperatures. The Q band, the charge recombination
between QA- and the S2 or S3 state of the OEC, peaks
around 0 �C, whereas the B band, the charge recombina-
tion between QB- and the S2 or S3 state of the OEC, peaks
at considerably higher temperatures. TL measurements
become distorted during the transition from the frozen to
the thawed state (Vass et al. 1981). To minimize the effects
of this transition, different solutions have been found, for
example a stronger heating around 0 �C (Ducruet and
Miranda 1992) or the presence of 30 or 60% glycerol
(Demeter et al. 1985). See Ducruet and Vass (2009) for a
practical guide to the application of TL.
TL measurements are destructive. A sample does not
survive the freezing/heating cycle that is applied during a
measurement. DF measurements, on the other hand, are
non-destructive. Even so, TL measurements have been
more popular than DF measurements due to the absence of
commercially available instruments for the measurement of
DF. Such an instrument is now available on the market (M-
PEA, Hansatech Instruments Ltd, UK; see Question 21). It
may also be mentioned that the analysis of TL measure-
ments is better developed (DeVault et al. 1983; Vass 2003)
than the analysis of DF transients. TL measurements have
been used extensively for the characterization of PSII
mutants (e.g., mutants that affect charge recombination
properties) (e.g., Etienne et al. 1990; Cser and Vass 2007)
and treatments that change the state of PSII (e.g., Cl- and
Ca2? depletion from the donor side of PSII or the effects of
the presence of herbicides bound to the QB site of PSII)
(e.g., Krieger et al. 1993; Demeter et al. 1993; Bock et al.
2001). It is also a convenient technique for the study of
environmental stresses that affect PSII (e.g., Mohanty et al.
1989; Hideg et al. 1993; Toth et al. 2005a).
Question 20: Does a recombination reaction alwayslead to DF emission?
PF intensity is linearly related to the actinic light intensity
(see, e.g., Schansker et al. 2006). In the case of DF only
absorbed light that induces a stable charge separation can
lead to DF and especially at high light intensities, this is
only a small fraction of the absorbed light. In addition, DF
emission is much more spread out in time because the DF-
inducing charge recombinations can be due to different
charge pairs, with different recombination times. A third
factor that reduces the DF yield is the existence of several
recombination pathways of which only one leads to DF
(see, e.g., Krieger-Liszkay and Rutherford 1998 and Cser
and Vass 2007 for a discussion of this point). Cser and
Vass (2007) give an overview of the different pathways:
(1) a direct recombination between QA- and P680? via
tunneling, which is non-radiative; (2) recombination via the
triplet state of P680? Pheo–, which is also non-radiative,
but there is an increased probability of singlet oxygen
formation (see Question 13); (3) recombination via the
singlet state of P680? Pheo-, which decays via light
emission. Pathways 2 and 3 are called indirect charge
recombination pathways. Krieger-Liszkay and Rutherford
34 Photosynth Res (2017) 132:13–66
123

(1998) showed that DCMU bound to the QB site increases
the midpoint potential of QA, stabilizes the charge separa-
tion (shift of TL bands to higher temperatures) and
increases the probability that recombination occurs via
tunneling (pathway 1). Bromoxynil, on the other hand,
decreases the midpoint potential of QA, destabilizes the
charge separation (shift TL bands to lower temperature)
and increases the probability that recombination occurs via
pathways 2 and 3). Cser and Vass (2007) confirmed this
interpretation using mutants in which amino acids near
Pheo and P680 were modified using site-directed mutage-
nesis. The authors showed that the free energy difference
between P680 in the excited state and P680?Pheo– is an
important determinant of TL emission intensity.
Question 21: How can PF and DF besimultaneously measured?
PSII reaction centers and antennae emit about 100 times
more PF than DF. In addition, the emission spectra of both
types of fluorescence emission are identical (Strehler and
Arnold 1951; Arnold and Thompson 1956; Sonneveld et al.
1980; Grabolle and Dau 2005) (see Question 18). As a
consequence, both cannot be detected at the same time and
thus a separation strategy is needed. Two approaches for
the simultaneous monitoring of PF and DF signals have
been developed: (1) quasi-continuous illumination of dark-
adapted samples and (2) illumination of a dark-adapted
sample by single pulse (usually by a laser) [see, e.g.,
Steffen et al. (2001) for such a experimental setup and
Belyaeva et al. (2015) for a discussion of laser-flash-in-
duced fluorescence data], or by continuous illumination.
The results of these two methods differ.
The first approach has been used for the evaluation of
the induction kinetics of the two fluorescence signals over
short time periods (seconds) (Wraight and Crofts 1971;
Zaharieva and Goltsev 2003; Strasser et al. 2010), whereas
the second approach has been used for both the analysis of
induction kinetics (e.g., Schansker et al. 2011) and the
analysis of PF and DF relaxation kinetics within wider time
intervals (minutes to hours) (Katsumata et al. 2008, Ber-
den-Zrimec et al. 2011).
The first approach has been successfully implemented
using the Multifunction Plant Efficiency Analyzer (MPEA,
Hansatech Instruments Ltd, UK). The sample is illumi-
nated by a series of red light pulses of variable duration
(produced by light-emitting diodes), followed by short dark
periods (duration: 1/3 of the light pulses). This type of
illumination is often called quasi-continuous. Prompt flu-
orescence is measured during the illumination periods, and
the decaying DF signal is recorded during the dark inter-
vals. The maximum rate of digitization of both signals in
the M-PEA is 1 point per 10 ls. It should be noted that the
dark intervals reduce the effective light intensity by one-
third. Thus, 5000 lmol photons m-2 s-1 light pulses yield
an effective light intensity of 3334 lmol photons m-2 s-1.
In addition, during the dark intervals the dark reactions
continue (electron flow), whereas the light reactions
(charge separations) stop, changing the relationship
between dark and light reactions.
Using quasi-continuous illumination, DF induction
transients complementing the PF induction transients can
be constructed. To do this, the DF intensities measured
during a particular dark interval for all dark periods are
selected and averaged, and then used as single points for
the DF induction curve. By selecting different decay
intervals, induction curves can be constructed that show DF
kinetic components with different lifetimes (Kalaji et al.
2012a; Fig. 7a).
Using the second approach, Chl a fluorescence decay is
recorded after a short (ns) laser pulse or after continuous
illumination. The strong fluorescence signal registered
Fig. 7 Kinetics of prompt fluorescence (PF) induced by a pulse of
5000 lmol photons m-2 s-1, interspaced by short intervals of dark-
ness to measure the delayed fluorescence (DF) kinetics. a PF
intensity, DF intensity following 0.1 ms of darkness and the DF
intensity following 1 ms of darkness as a function the time of
illumination; b DF intensity following 0.1 and 1 ms of darkness as a
function of the PF intensity (Goltsev, unpublished data)
Photosynth Res (2017) 132:13–66 35
123
during the first few nanoseconds following illumination is
due to PF, while at longer times after illumination the
emitted light is the result of charge recombinations (i.e.,
DF) (Goltsev et al. 2009). Alternatively, single light pulses
of variable length (e.g., 1–200 ms) can be given, during
which PF is measured, followed by a dark period during
which DF is measured (Schansker et al. 2011). The M-PEA
also allows this type of measurement. This approach is
much more time-consuming than method (1), because each
time point is a separate measurement, but has the advan-
tage that the intensity of the actinic light is also the
effective light intensity and, therefore, the results can be
related to OJIP transients on a one-to-one basis.
Question 22: How to compare PF inductiontransients with induction curves of different DFdecay components?
The DF induction curve is often compared to the simulta-
neously measured PF induction curve. To allow a direct
comparison of the maxima for both fluorescence types,
they are superimposed on each other on the same timescale
(Govindjee and Papageorgiou 1971; Krause and Weis
1991; Malkin et al. 1994; Goltsev et al. 2003, 2005, 2009;
Strasser et al. 2010; Kalaji et al. 2012a; Fig. 7a). For the
construction of DF induction transients, see Question 21.
During induction, different reactions occur in parallel in
different RCs. Upon turning off the light, different reoxi-
dation and recombination reactions all occur separately
with their own particular rate constants (for PF see, e.g.,
Schansker et al. 2005). Since PF is measured during
induction (a mix), and DF during dark intervals (in time
separated reactions), comparing PF and DF is not
straightforward (Mar et al. 1975) and needs an analysis
framework.
To understand DF measurements during the first few ms
of induction, it is important to understand what happens on
the donor side of PSII. The different S states each transfer
an electron to TyrZ? with different transfer times:
S0 ? S1 = 30 ls, S1 ? S2 = 100 ls, S2 ? S3 = 300 ls,
S3/4 ? S0 = 1.5 ms (see Grabolle and Dau 2007 and
references therein). This sequence shows that the lifetime
of the couple (TyrZ/P680)? increases as a function of the
S state. As shown by Grabolle and Dau (2005) the fast ls
DF component increases on the first three single turnover
flashes reaching a maximum intensity on going toward the
S4 state. These authors also showed for the ms DF com-
ponent that only the state induced by three flashes (on
going from S3 via S4 to S0) still yields a high DF
intensity. After a ms, TyrZ? has been re-reduced by the
oxygen-evolving complex going to the S1, S2 and S3
states.
According to simulations (Lazar 2003) and actual DF
measurements (Schansker et al. 2011, Kalaji et al. 2012a)
the maximum DF intensity/maximum [P680?] occurs after
3–4 ms (I1 peak) and coincides with the J step or slightly
after. It is likely that the K peak (in high-temperature
treated samples observed after *300 ls of illumination) is
equal to one charge separation and, therefore, the S2 state
(Toth et al. 2007a). Simulations of Lazar (2003) suggest
that the second charge separation peaks around 1 ms of
illumination (S3 state). And as mentioned above, the peak
DF intensity (S4 state) occurs after 3–4 ms. This reaction
sequence accounts for the DF rise to the I1 peak.
Using single turnover flashes, several S state cycles can
be detected (see Grabolle and Dau 2005 for DF). OJIP
transients, on the other hand, are induced by much lower
light intensities that are much less concentrated in time. As
a consequence the S states will dampen (due to double hits
and misses; Kok et al. 1970) more quickly. Probably,
already shortly after reaching the J step, the donor sides of
the PSII RCs will become desynchronized. This means
that, at all times, there are 25% S0, 25% S1, 25% S2 and
25% S3 and all donor side effects will cancel each other
out. Once this has happened the acceptor side of PSII starts
to determine DF again. This is observed beyond the J step
where an inverse relationship between DF and PF is
observed (e.g., Schansker et al. 2011; Kalaji et al. 2012a).
Between J and P the ETC becomes gradually reduced
(Schansker et al. 2005). As the PQ pool becomes reduced
the availability of oxidized PQ decreases. This means that
it takes longer before an oxidized PQ molecule binds to the
QB site and it takes longer before QA- can again become re-
oxidized. This has two effects: PF increases and DF
decreases because only following the re-oxidation of QA- a
new charge separation can occur, and only then there is
again a transient induction of P680? (see Schansker et al.
2011, 2014 and Oukarroum et al. 2012 for a more in-depth
discussion of this point).
The position of the I1 peak is sensitive to the light
intensity. At a relatively low light intensity
(500 lmol photons m-2 s-1; i.e., an effective light inten-
sity of 334 lmol photons m-2 s-1), the initial DF induc-
tion is rather slow and I1 is reached after about 23 ms
(Kalaji et al. 2012a, b). Destruction of the Mn cluster
changes the DF response. In that case the lifetime of P680?
increases and the QA- concentration strongly decreases (see
Oukarroum et al. 2012).
Two DF induction curves are shown in Fig. 7a. They
represent different DF decay intervals: 20–90 ls and
0.1–0.99 ms. The characteristic points of the DF induction
are indicated according to the nomenclature proposed by
Goltsev and Yordanov (1997) and Goltsev et al.
(2005, 2009). The maxima (denoted by I) and minima
(denoted by D) are numbered according to their position on
36 Photosynth Res (2017) 132:13–66
123
the DF induction curve (I1, I2, D2 up to I6; S is steady-state
DF level).
Similarly to the PF induction curve, the DF induction
curve can be divided into fast and slow phases (Itoh et al.
1971; Itoh and Murata 1973; Malkin and Barber 1978;
Goltsev and Yordanov 1997; Goltsev et al. 2003, 2005;
Fig. 7). The fast phase lasts for about 300 ms and coincides
with the OJIP transient of PF. The slow phase lasts several
minutes, reaching a stationary level after 5–10 min of
illumination by quasi-continuous actinic light. Two max-
ima I1 and I2 (sometimes with a minimum D1 in between)
are observed in the fast phase, after which DF drops to a
minimum labeled as D2 (Goltsev and Yordanov 1997;
Goltsev et al. 2003; Zaharieva and Goltsev 2003; Kalaji
et al. 2012a). The second maximum (I2) appears at about
60–100 ms during the IP phase of PF. I2 strongly depends
on the actinic light intensity; at high light intensities it is
visible only as a shoulder (Schansker et al. 2011; Kalaji
et al. 2012a).
The correlation between simultaneously recorded PF
and DF in one sample can be visualized in a ‘‘phase dia-
gram’’ (Malkin et al. 1994; Goltsev et al. 2003; Schansker
et al. 2011; Kalaji et al. 2012a). In a 2D graph, DF values
collected from different dark delay intervals are plotted as
a function of relative double-normalized PF, Vt (Fig. 7b).
For the two plots there is a long induction interval, where
the intensities of PF and DF change synchronously (in-
versely). This appears on the diagram as an almost linear
section between phases S and T of the PF transient. During
this time interval both PF and DF intensities are modified,
and it has been suggested that this is mainly due to changes
in fluorescence quantum yield (Lavorel 1975; Goltsev et al.
2003). In the fast phase of induction (OJIP), PF and DF
deviate from linearity for the reasons discussed above. In
the first part of the diagram the changes are most pro-
nounced for DF recorded during the 20- to 90-ls decay
interval. The dependence between DF and PF is not linear
but almost quadratic, which means that PF increases ini-
tially much faster than DF. In the time range between
points I1 and D2, DF shows a negative correlation with
PF—micro- and millisecond DF decreases when PF
increases from J to I and P. See above for a discussion of
the reasons for this relationship.
Between 0.5 and 5 s DF and PF are again inversely
proportional. DF increases from D2 to I4, initially, as a
result of the activation of FNR, due to which electron flow
restarts (Satoh 1981; Harbinson and Hedley 1993;
Schansker et al. 2003, 2008), QA starts to turnover again (is
re-oxidized and then reduced again), which is accompanied
by a transient P680? generation and this leads to an
increase of DF emission (and a decrease of PF). The
restarted electron flow is also accompanied by a further
energetization of the thylakoid membranes. External
electric fields are known to stimulate recombination reac-
tions (Vos et al. 1991; Dau and Sauer 1992), and the nat-
urally induced electric field may, therefore, also have an
effect on DF emission.
In summary, during induction PF follows the reduction
of the electron transport chain, whereas the fast 40-ls and
ms DF components are determined by the P680? concen-
tration of the population of PSII RCs, which is determined
by the S states and the turnover rate of QA. In other words,
both signals monitor the reduction kinetics of the photo-
synthetic electron transport chain in different ways, pro-
viding complementary information.
Question 23: How do the fluorescence parametersvary during the day?
To produce comparable experimental data several factors
are important. In the previous paper the variability among
instruments and the extent to which parameters vary nat-
urally was discussed (Kalaji et al. 2014a). With respect to
the parameter statistics we want to refer to two additional
studies (Lazar and Naus 1998; Lazar et al. 2005). In the
first study it is shown that the statistical distribution of
eight OJIP-derived parameters does not follow the Gaus-
sian distribution law, and in the second study it is shown
that a stress like high-temperature stress affects the statis-
tical distribution. Changes occurring in leaves during the
day and their effect on leaf sampling form another factor.
An important variable is the orientation of a leaf. Certain
leaves are oriented toward the east and receive most of
their daily light dose in the morning, whereas other leaves
may be oriented toward the west and receive a large part of
their daily light dose in the afternoon. Losciale et al. (2010)
and Demmig-Adams et al. (2012) gave experimental
examples of this. Another important factor is the angle of
the leaf relative to the plane. Leaves that are oriented
almost orthogonally will intercept only a relatively small
part of the sunlight, whereas leaves oriented nearly parallel
to the plane will intercept a large part of the sunlight. A
steeper orientation allows a better distribution of the light
over different layers of leaves (e.g., Ishida et al. 1999;
Falster and Westoby 2003; Stewart et al. 2003). Another
factor is wind. Leaves that move around in the wind will
continuously change their orientation relative to the sun
causing fluctuations in the intercepted light. These fluctu-
ations are further modulated by the passage of clouds and
sunflecks. The intensity of sunlight also varies over the
day, being low in the early morning and late afternoon and
peaking around noon. This natural pattern is responsible for
the typical bell curves of parameters like FV/FM or zeax-
anthin ? antheraxanthin content during the day (e.g.,
Demmig-Adams et al. 1996, 2012; Garcıa-Plazaola et al.
Photosynth Res (2017) 132:13–66 37
123

1997; Bernacchi et al. 2006). In this sense, photosynthetic
activity is strongly dependent on the perceived average
light intensity, which ultimately drives long-term light
acclimation. In shade leaves, having a lower photosynthetic
capacity, saturation will be reached at lower light intensi-
ties than in sun leaves. It may be noted, on the other hand,
that shade leaves exhibit a higher photosynthetic activity at
low light intensities and a lower compensation point. Sat-
uration is further modulated by temperature. With the
exception of the light reactions (photophysical), photo-
synthetic electron transport, Calvin–Benson cycle and the
photorespiratory pathway have a biochemical character
and, as a consequence, photosynthetic activity is quite
strongly temperature dependent. A lowering of the tem-
perature will shift the light intensity at which saturation
occurs to lower light intensities. Low temperatures asso-
ciated with high light intensities cause severe winter pho-
toinhibition in Mediterranean (Martınez-Ferri et al. 2004)
and Alpine-Central European (Robakowski 2005) tree
species. Another important variable is the humidity of the
air. Dry air is likely to lead to high levels of evaporation, to
which the plant may respond by (partially) closing its
stomata (Lange et al. 1971; Schulze 1986). This lowers the
uptake of CO2 and increases photorespiratory activity at
the expense of the assimilatory activity (Medrano et al.
2002). Closing of the stomata will, however, increase the
leaf temperature (e.g., Long et al. 2006). All these variables
should be considered when designing a leaf sampling
protocol for an experiment (Rousseau et al. 2013). Many
researchers have experimentally characterized the diurnal
pattern of Chl a fluorescence parameters in C3, C4 and
CAM plants (Adams and Demmig-Adams 1992; Franco
et al. 1999; Pollet et al. 2009; Desotgiu et al. 2013). On
bright days, solar radiation is supersaturating with respect
to the photosynthetic capacity during a considerable part of
the day in most plant species and regions of the world
(Long and Humphries 1994). Midday high light conditions
lead to a decrease in the maximum quantum yield under
dark-adapted conditions (FV/FM) and an increase in the rate
constant for thermal dissipation reflected by higher levels
of qE (Gilmore et al. 1998; Adams III and Demmig-Adams
2004). Field observations show the progressive decrease in
FV/FM, measured after 20–25 min of dark adaptation, with
the lowest values at midday (Desotgiu et al. 2013). An
obvious candidate for this decrease is photoinhibition,
which causes a loss/quenching of FV (Long and Humphries
1994). Normally, plants recover from photoinhibition
during the night and FV/FM reaches its maximum value
before sunrise (predawn observations) (e.g., Demmig-
Adams et al. 2012). Dark acclimation with leaf clips for
20 min during daytime hours ensures the relaxation of the
transthylakoid pH difference (Quick and Stitt 1989; Nilk-
ens et al. 2010), inactivation of FNR (Schansker et al.
2006, 2008) and realignment of the chloroplasts within the
cell (Cazzaniga et al. 2013; Kong and Wada 2014). Peter
Jahn’s zeaxanthin-dependent qZ quenching, on the other
hand, needs considerably more time to recover (Nilkens
et al. 2010; Jahns and Holzwarth 2012), just as the release
of part of the PSII antenna proposed by Alfred Holzwarth
(Holzwarth et al. 2009) and Roberto Bassi (Betterle et al.
2009), and even more time is needed to recover from
photoinhibition (Horton and Hague 1988). These last three
processes are all associated with a sustained FV/FM
reduction.
Photosynthesis frequently remains depressed during the
afternoon hours (Correia et al. 1990; Pollastrini et al.
2013). Apart from photoinhibition and slowly reversing
regulatory mechanisms, abscisic acid-induced stomatal
closure in the afternoon (Tallman 2004) and feedback
inhibition of photosynthesis by accumulating sucrose and/
or starch have been considered (see Paul and Foyer 2001
for a discussion). It is worth noting that nighttime recovery
of photoinhibition may be inhibited or slowed down by low
night temperatures (Strand and Lundmark 1987; Bussotti
2004). The temperature dependence of the repair cycle and
its inhibition under low temperature conditions has been
described under in vitro conditions (Aro et al. 1990).
The parameter 1 - VJ, which is an approximation of the
relative amplitude of the thermal phase, follows the same
diurnal pattern as the parameter FV/FM (Desotgiu et al.
2013; Pollastrini et al. 2011, 2014). In the JIP test this
parameter is associated with electron transport activity
(Strasser et al. 2004); however, there are several processes
to which this parameter is sensitive, including severe high-
temperature stress associated with inactivation of the PSII
donor side (Schreiber and Neubauer 1987; Srivastava et al.
1997; Toth et al. 2007a), and a partially reduced PQ pool
(Toth et al. 2007b), but also certain regulatory mechanisms
(Schreiber et al. 1995; Schansker et al. 2006). Photoinhi-
bition, reducing the donation capacity of all PSII RCs
together, may, in this respect, have the same effect on OJIP
transient as high-temperature stress. The water status of
plants may play an important role. Desotgiu et al. (2012a)
observed for well-watered plants of Fagus sylvatica L. that
1 - VJ increased at midday. The amplitude of the IP phase,
which was shown experimentally to correlate with leaf PSI
content in fully dark-adapted leaves, was always found to
be enhanced during the noontime hours as well as in sun
leaves (Cascio et al. 2010; Desotgiu et al. 2013; Pollastrini
et al. 2014). However, the reason for this observation is
different in these two cases. In dark-acclimated sun leaves
the PSII/PSI ratio may be lower than in dark-acclimated
shade leaves (Anderson et al. 1988) and this is expected to
lead to an increased IP amplitude. If leaves suffer from a
significant amount of photoinhibition at noontime, the
electron donation capacity of PSII will be lower. This is
38 Photosynth Res (2017) 132:13–66
123

comparable to illumination at a lower light intensity (cf.
Schansker et al. 2011) or high-temperature stress (cf. Sri-
vastava et al. 1997), both conditions that increase the rel-
ative amplitude of the IP phase. The electron transport rate
(ETR), the effective quantum yield (UPSII) and photo-
chemical quenching (qP) derived from PAM fluorimetry on
light-adapted samples are higher during the day than at
night (Larcher 2000; Pollet et al. 2009; Desotgiu et al.
2013). An explanation for this observation may be that
leaves kept overnight in darkness may have lower sink
activities and a reduced stomatal opening (Felle et al. 2000)
compared to plants that have been exposed for hours to
*600 lmol photons m-2 s-1.
Question 24: How do fluorescence parameters varywithin a tree canopy?
Leaves from a tree form a population, and each single leaf
may differ from the others in terms of size, age and posi-
tion in the tree canopy. The position of the leaf in the
canopy (top vs. bottom leaves; outer vs. inner) determines
primarily the exposure to sunlight and the differentiation
between sun and shade leaves. Sun and shade leaves differ
significantly in their photosynthetic apparatus and perfor-
mance (Lichtenthaler et al. 1981; Anderson et al. 1988).
Sun leaves have in general a lower Chl a and b content,
smaller thylakoid stacks, lower LHCII content, higher Chl
a/b ratio, lower Chl(a ? b)/carotenoid ratio and a higher
PSI/PSII ratio when compared with shade leaves. Fur-
thermore, sun leaves have a higher Calvin–Benson cycle
capacity relative to the capacity of the electron transport
chains, and more efficiently dissipate excess energy as
heat, compared to shade leaves. Shade leaves, on the other
hand, are more efficient at exploiting low PAR levels for
photosynthesis, having a larger PSII antenna and more
extensively stacked thylakoid membranes (Lichtenthaler
et al. 1981).
The Chl a fluorescence parameters most sensitive to
sunlight exposure during the day are (1) the maximum
quantum yield of primary photochemistry (FV/FM) as a
measure for the efficiency of the whole PSII population and
the sensitivity of PSII to photoinhibition, and (2) non-
photochemical quenching (NPQ). NPQ induction in
response to solar radiation is stronger in sun leaves than in
shade leaves. Among the chlorophyll fluorescence param-
eters derived from OJIP transients, the amplitude of the IP
phase, that reflects the relative PSI content (Oukarroum
et al. 2009; Ceppi et al. 2012), is higher in sun leaves than
in shade leaves, which is in agreement with the higher PSI/
PSII ratio.
The Chl a fluorescence parameters are also sensitive to
the age and/or senescence of leaves/needles in evergreen
tree species and to the age of leaves appearing in the spring
compared with those developed during the summer or
autumn (Desotgiu et al. 2012b).
Some stress factors act preferentially on a specific side
of the canopy. These factors include, e.g., wind blowing
dominantly out of a particular direction and provoking
desiccation of leaves, salt from the sea shore, and chemi-
cals from local pollution sources. Other environmental
factors, such as soil properties and air pollutants, affect the
canopy in a different way. The effects of these factors
depend on the physiology, ontogeny and the position of
leaves in the crown. We can thus have damaged leaves at
specific levels in the tree crown, e.g., ozone symptoms on
leaves in the lower part of the crown, but not in the higher
part (Desotgiu et al. 2012b).
Finally, when leaves are lost from the branches due to
senescence, or damaged by biotic or abiotic factors, the
photosynthetic activity of the remaining foliage may
increase (Eyles et al. 2011). Such a response affects the
value of several Chl a fluorescence parameters, especially
the amplitude of the IP phase of the OJIP transient (De-
sotgiu et al. 2012b).
Question 25: What do Chl a fluorescencemeasurements tell us about drought stress?
The usefulness of individual Chl a fluorescence parameters
and protocols for evaluation of drought depends on the
severity and duration of drought stress (Suresh et al. 2012).
Mild-to-moderate drought stress causes a decrease in the
photosynthetic rate, mainly due to stomatal closure,
whereas drought has no direct effect on the capacity of
individual metabolic reactions (Brestic et al. 1995; Cornic
and Massacci 1996; Flexas and Medrano 2002). Recently,
it was observed that blue-light-induced chloroplast move-
ments are very sensitive to drought stress. Inhibition
occurred already at RWC values considerably above 70%,
and was, therefore proposed to be a sensitive tool for small
changes in RWC (Naus et al. 2016). In typical C3 plants,
critical leaf relative water content is about 70% and below
this value non-stomatal effects occur. These phenomena
are also reflected in Chl a fluorescence and calculated
fluorescence parameters.
The most frequently used fluorescence parameter in
photosynthetic or environmental research (including
drought stress) is the maximum quantum yield of PSII
photochemistry (FV/FM). This parameter is easy to measure
and is generally well accepted as a measure for the PSII
status (or more correctly the status of the population of
PSII RCs). However, it is highly insensitive to stomatal
changes and other effects occurring under moderate
drought stress (see Fig. 8, recorded during quick
Photosynth Res (2017) 132:13–66 39
123

dehydration of a wheat leaf in very low light). FV/FM
values are extremely stable, starting to decline at a dehy-
dration level that is lethal for typical leaves. If drought
stress persists under field conditions for a longer period
(days) the decrease in FV/FM values can be dramatic
(Zivcak et al. 2008b). Hence, decreases in FV/FM cannot be
used to monitor early drought stress effects. However, the
FV/FM measurements during drought stress may draw
attention to the effects of co-occurring stresses (high-tem-
perature stress, photoinhibition, etc.) or to leaf senescence
(Lu et al. 2002; Kotakis et al. 2014).
Both the slow and fast Chl a fluorescence kinetics pro-
vide parameters sensitive to drought stress (Fracheboud
and Leipner 2003; Oukarroum et al. 2007, 2009; Zivcak
et al. 2008a, 2014; Goltsev et al. 2012 ). The early decrease
of the effective PSII quantum yield (UPSII) in drought-
stressed leaves compared to well-hydrated ones is mainly
due to lack of CO2 inside the leaf (closed stomata). In C3
leaves, the decrease of UPSII is not linearly correlated with
net photosynthetic rate, as increased photorespiration effi-
ciently consumes part of the electrons flowing through the
photosynthetic electron transport chain. Moreover, alter-
native electron transport pathways also consume electrons
generated by linear electron transport under drought stress
conditions, complicating the physiological interpretation of
the results (Zivcak et al. 2013; Questions 11 and 13). For
example, in C3 plants PSII activity (O2 evolution rate)
relative to Rubisco activity is *equal to the carboxylase
activity ? the oxygenase activity which in turn correlates
with PSII activity measured by Chl a fluorescence analysis
(Krall and Edwards 1992; Oberhuber et al. 1993).
In summary, measurements of slow fluorescence kinet-
ics and calculation of quantum yields and electron transport
rate (ETR) are useful for determination of drought stress
effects, reflecting both stomatal and non-stomatal effects.
However, such measurements during drought stress cannot
be directly related to CO2 assimilation (Baker 2008).
Indeed, the relative fluorescence decrease ratio (RFd) was
shown to be more sensitive and better correlated with the
photosynthetic CO2 assimilation rate than PSII quantum
yield or ETR (Lichtenthaler et al. 2005a). RFd was intro-
duced as a so-called vitality index, calculated as RFd =
(FP - FS)/FS, where FP and FS denote the fluorescence
intensities at the fluorescence peak after 200–500 ms of
illumination (FP), i.e., P of the OJIP transient, and the
fluorescence level in the steady state (FS) reached after a
few minutes (usually 2–5 min) of illumination. When a
plant is stressed, FP decreases due to processes such as
photoinhibition and under stress conditions FS can also
increase, leading to a decrease of RFd (Lichtenthaler et al.
1986). Lichtenthaler (2013) showed that RFd is sensitive to
the acclimation state of leaves (sun–blue-shade–half-
shade–shade) and correlates roughly with Pn, and there is a
strong correlation with FV/FO. The fluorescence decrease
from FP to FS depends on several factors that have not yet
been characterized completely, complicating the physio-
logical interpretation of Rfd values (Rohacek 2002).
Recently, fast Chl a fluorescence kinetics and the JIP
test (Strasser et al. 2000) have become popular for rapid
screening of stress effects. The measurements are as simple
as FV/FM measurements and provide additional information
on the photochemistry of PSII and the photosynthetic
electron transport chain. Figure 8 shows the comparison of
the response of three parameters [FV/FM measured by the
PAM (Fig. 8a) and HandyPEA (Fig. 8b), UPSII (Fig. 8a)
and the Performance Index (PItot) (Fig. 8b)] to decreasing
leaf water content (RWC) in wheat. The FV/FM level is
quite insensitive to a decrease in RWC, whereas UPSII and
Fig. 8 Response of Chl a fluorescence parameters to drought stress.
a The parameters FV/FM and UPSII measured with a PAM fluorometer
as a function of the relative water content (RWC); b the parameters
FV/FM and PItot measured with a HandyPEA as a function of the
RWC (modified from Brestic and Zivcak, Molecular Stress Physiol-
ogy of Plants, Chapter 4, republished with permission of Springer)
40 Photosynth Res (2017) 132:13–66
123

PItot respond strongly to a RWC decrease, showing a
similar dependence on RWC. Similar decreases have been
observed under natural conditions during slowly advancing
drought stress (Zivcak et al. 2008b). The decrease in the
Performance Index is associated with changes in Chl
a fluorescence transients and, by extension, changes in rate
constants of individual electron transport steps and/or the
state of the ETC that are detected by fast Chl a fluores-
cence induction (reviewed, e.g., by Lazar 1999; Strasser
et al. 2004). The simplicity of the fast Chl a measurements
and automated analysis have sometimes led to misappli-
cation. Analysis should be supported by parallel measure-
ments using other methods, and the restrictions of the JIP
test analysis should be kept in mind (is the FM level still
reached, is the FO truly measured, is the electron transport
chain fully reoxidized?).
Question 26: Can Chl a fluorescence be usedfor high-temperature stress tolerancecomparisons?
Photosynthesis is very sensitive to high temperatures and
can be partially or even completely inhibited before other
stress symptoms are observed. High temperatures affect
photosynthesis by their effect on the rates of chemical
reactions and on the structural organization of the photo-
synthetic apparatus (Pastenes and Horton 1996).
Photosynthetic CO2 assimilation decreases at moder-
ately high temperature levels (up to 38 �C) due to thermal
inactivation of Rubisco activase, the enzyme that removes
inhibiting molecules from the active site of Rubisco (Feller
et al. 1998; Law and Crafts-Brandner 1999; Salvucci and
Crafts-Brandner 2004). This decrease is reversible and
leads to a decrease in the linear electron transport rate,
which can be detected using the saturating pulse method.
Direct impairment of PSII occurs when the leaf tem-
perature reaches *40 �C and higher. This may be due to
high-temperature-induced changes in the properties of
thylakoid membranes (Sharkey and Zhang 2010;
Yamauchi and Sugimoto 2010), the dissociation of the
manganese-stabilizing protein from the PSII reaction
center complex and the release of Mn atoms (Yamane
et al. 1998). The Mn cluster can be reconstituted (Ana-
nyev and Dismukes 1996 and references therein); how-
ever, in the leaf this does not seem to happen and once
the Mn cluster has fallen apart, PSII follows the same
repair cycle as in the case of photoinhibition (Toth et al.
2005b; Komayama et al. 2007).
Damage to PSII can be observed in slow Chl a fluores-
cence kinetics using the saturating pulse method (e.g.,
Pastenes and Horton 1996), but the most efficient way is
through measurements taken after a period of dark
acclimation. The high-temperature effects on PSII photo-
chemistry and high-temperature tolerance at the PSII level
have frequently been characterized in terms of FO increases
or FM decreases. However, the basal and maximum fluo-
rescence values are rather variable between different
samples, even under non-stressed conditions, and their use
can, therefore, become a source of uncertainty.
The maximum quantum yield, FV/FM, is the most fre-
quently used measure of direct high-temperature effects on
PSII. This parameter is based on the assumption that FO is
measured for open RCs (QA fully oxidized) and FM for
closed RCs (QA fully reduced). Under high-temperature
conditions, FO can slightly increase as high temperatures
enhance the process of chlororespiration, leading to a
partial reduction of QA in the dark due to a more reduced
PQ pool (Sazanov et al. 1998). In high-temperature-stres-
sed samples with a large population of PSII with an
impaired oxygen-evolving complex (OEC), electron
transport rate is lower and it takes longer to reach the
maximum fluorescence intensity. In high-temperature
treated samples, FNR may be activated before FM is
reached and then the measured FM does not relate to a fully
reduced ETC—a prerequisite for FM determination under
non-inhibited conditions—causing an underestimation of
FM (Toth et al. 2005a, 2007a). Both the overestimation of
FO and underestimation of FM lead to FV/FM underesti-
mation and therefore overestimate the temperature effect.
In addition, the observed change in the FV/FM value is
related to a loss of electron donation capacity and not to a
change in the PSII quantum yield.
Rate constants or some parameters derived from fast Chl
a fluorescence induction show a greater sensitivity to high
temperatures than conventional fluorescence parameters
such as FV/FM. The typical ‘‘visual’’ symptom of PSII
high-temperature injury is the appearance of a new peak
within the fluorescence induction curve at approximately
300 ls (denoted as the K step). This is frequently accom-
panied by a slowdown of the J–I rise and by an increase in
the amplitude of the I–P rise (Fig. 9). The K step appears
as a consequence of a high-temperature-induced destruc-
tion of the Mn cluster in a considerable fraction of PSII
RCs (Srivastava et al. 1997; Toth et al. 2005a).
The K step has only been described in response to high-
temperature stress or manganese deficiency, and its
occurrence is thus a very specific symptom of high-tem-
perature-induced damage of PSII. This is clearly illustrated
in Fig. 10a, where VK/VJ values derived from fluorescence
kinetics recorded on wheat plants subjected to progressive
drought stress and a high-temperature treatment are shown.
It is evident that even very strong drought stress did not
induce any increase in VK/VJ, whereas short periods of high
temperatures caused substantial increases in this parameter.
High-temperature stress responses vary considerably when
Photosynth Res (2017) 132:13–66 41
123

data from a large collection of wheat genotypes of diverse
provenance are used (Brestic et al. 2012).
The K step is much more apparent if the leaves are
heated in the dark (Fig. 9), since light causes a constant
oxidation of the Mn cluster and therefore prevents the
super-reduction of the Mn cluster, which is responsible for
the disintegration of the Mn cluster in the absence of
extrinsic proteins (e.g., Beck and Brudvig 1987). As a
consequence, the K peak is much lower under such con-
ditions (Fig. 9). RCs that lack a Mn cluster are very sen-
sitive to light (e.g., Blubaugh and Cheniae 1990) and,
therefore, quickly become photodamaged. High-tempera-
ture susceptibility of PSII differs depending on species,
age, physiological status, acclimation level, etc. The ability
of PSII to tolerate high-temperature stress is termed ‘‘PSII
thermostability’’ and is clearly demonstrated by the
dependence of basal fluorescence on temperature (FO-T
curve), introduced by Schreiber and Berry (1977). The FO-
T curve method is based on a continuous increase of
sample temperature during which the FO value is contin-
uously recorded. The critical temperature TC represents the
temperature at which FO starts to increase steeply
(Fig. 10b). As shown by Ducruet (1999), this increase is
due to a shift in the (QAQB)- equilibrium toward QA. The
critical temperature for different species may vary con-
siderably, with the critical temperature ranging from 42 �Cup to more than 50 �C (Froux et al. 2004). It is known that
increasing the saturation level of membrane lipids increa-
ses the tolerance to high temperatures (Murakami et al.
2000) and differences in this respect between plant species
may explain in part the observed variability.
Analogous to the continuous FO measurements, the
exposure of fresh leaf samples to a single temperature (the
graduated temperature approach) (Zivcak et al. 2008c;
Brestic and Zivcak 2013) provides more detailed infor-
mation about high-temperature effects on PSII photo-
chemistry and enables the estimation of the TC for FO.
Critical temperatures represent the point at which a severe
disorganization of structure and loss of main functions
occur. Hence, the estimated critical temperature can occur
above the ‘‘physiologically relevant’’ temperature range,
reaching temperatures as high as 50 �C. This estimate is
non-physiological, as in most cases leaves in a field are not
Fig. 10 High-temperature stress effects. a The parameter VK/VJ as a
function of the parameter FV/FM used here as a measure for the
severity of the treatment. Heat stress induces a significant increase in
the value of the parameter VK/VJ, whereas drought stress has no effect
on this parameter. b. Demonstration of the critical temperature (TC):
gradually increasing the leaf temperature leads above a certain critical
temperature to an increase of the FO value. TC is determined as
indicated in b; it differs between photosynthetic samples and may be
used as an indicator for adaptation or tolerance to heat (Zivcak and
Brestic, unpublished data)
Fig. 9 Comparison of the effect of high-temperature stress applied in
the light and in darkness on the OJIP kinetics. In the inset the Chl
a fluorescence transients double-normalized between O and J are
shown (Zivcak and Brestic, unpublished data)
42 Photosynth Res (2017) 132:13–66
123

typically exposed to 50 �C or more. On the other hand, the
use of graduated temperatures with fast Chl a fluorescence
not only gives a real-life TC measurement, but also enables
the calculation of other parameters. A broad study on 30
field-grown wheat genotypes demonstrated that the K step
occurred even at temperatures 4–5 �C lower than the steep
FO increase (Brestic et al. 2012). Moreover, the capacity to
increase thermostability of the K step was higher than for
the FO increase. High-temperature acclimation can occur
quite quickly. Lazar et al. (1997a, b) observed a shift of the
temperature at which the K peak appeared (TK) by 3 �C(from 47 to 50 �C) following the incubation of barley
leaves for 2–3 h at 35 �C. Using possibly the same accli-
mation data set Lazar and Ilık (1997) observed an
approximately linear relationship between TC and TK.
However, TK increased more than TC following acclima-
tion and TK was always higher than TC. This contradicts
somewhat the above-mentioned observation of Brestic
et al. (2012).
PSII thermostability is only a small part of overall high-
temperature tolerance. The reversible inactivation of
Rubisco activase occurs already at considerably lower tem-
peratures than PSII inactivation. However, inactivation of
the donor side of PSII takes considerably longer to repair
than re-activation of Rubisco activase. As a consequence,
PSII donor side inactivation may not so much play a role
during a high-temperature episode; instead, it may have an
effect on plant photosynthetic productivity in its aftermath.
In any case, the application of fast Chl a fluorescence mea-
surements with FO, FV/FM along with the K step determi-
nation appears to be an efficient approach for screening PSII
thermostability, enabling rapid identification of high-tem-
perature-resistant or high-temperature-sensitive samples.
Question 27: Can variable Chl a fluorescence beused as a biomarker of environmental pollution?
By using Chl a fluorescence it is possible to detect the
effects of environmental stressors (e.g., herbicides, ozone,
trifluoroacetic acid, acid rain, many heavy metals) that
disrupt photosynthesis (Judy et al. 1991; Lewis et al. 2001;
Guidi et al. 2010; Chaudhary et al. 2013). Chl a fluores-
cence-based methods have been applied in ecotoxicologi-
cal studies to examine the effects of pollutants on algae and
plants (Kumar et al. 2014). These methods have many
advantages over existing bioassays, especially with regard
to sensitivity, rapidity, and the non-destructiveness and
non-invasiveness of the methodology. Depending on the
stressor, changes can be detected before visible symptoms
appear (Guidi et al. 1997, 2000; Popovic et al. 2003).
While it is commonly assumed that parameters linked to
PSII electron transport are indicators for toxicity in plants
(e.g., Perreault et al. 2010), it is important to specify which
kind of parameter could be a good biomarker for a par-
ticular agent. For instance, in Lemna plants exposed to
copper oxide nanoparticles, the effective PSII quantum
yield (UPSII) is a reliable indicator for toxicity after 24 h of
exposition, but FV/FM remains unaffected (Perreault et al.
2010). However, upon long exposure of Lemna to a heavy
metal such as Cr, FV/FM and FV/FO showed a clear dose-
dependent decrease (Reale et al. 2016). Similarly, FV/FM
can be used for the detection of several herbicides that
inhibit linear electron transport (see Question 28) and
petrochemicals that can contaminate natural waterways or
reservoirs (Conrad et al. 1993; Ralph and Burchett 1998;
Dorigo and Leboulanger 2001; Choi et al. 2012). The
effective quantum yield has been found to be a sensitive
indicator for certain heavy metals, herbicides and petro-
chemicals (Ralph and Burchet 1998; Haynes et al. 2000;
Juneau et al. 2001; Marwood et al. 2001; Macinnis-Ng and
Ralph 2003; Perreault et al. 2010; Wilson and Ralph 2012).
The tolerance to pollutants differs between plant spe-
cies. Uptake reduction, compartmentalization or differen-
tial detoxification are strategies that have been
demonstrated in plants (Hall 2002). For every bioassay it
is, therefore, important to choose plant or algal species that
are sensitive to the pollutant or mixture of pollutants of
interest. In the case of crops, the comparison of sensitive
and tolerant cultivars can also be interesting (e.g., Cala-
tayud et al. 2002; Degl’Innocenti et al. 2002).
In summary, for a successful bioassay, the choice of a
species sensitive to the pollutant and of a Chl a fluores-
cence parameter that is affected by the pollutant in the
concentration range of interest is critical (Choi et al. 2012).
Taking these considerations into account, Chl a fluores-
cence methods represent a more rapid and sensitive
methodology than growth assays (Kvıderova 2010; Fai
et al. 2007).
Question 28: Can toxicity induced by differentherbicides be identified?
Screening for herbicide efficacy and plant sensitivity is
usually a lengthy process. The experiments take up a lot of
space, and the evaluation of results, either quantitatively or
qualitatively, is normally completed more than a week after
the treatment (Christensen et al. 2003). In this respect, the
most straightforward category of herbicides is those that
bind to the QB site of PSII (e.g., DCMU, atrazine and
phenolic herbicides like ioxynil or bromoxynil). Full
inhibition of PSII by these herbicides raises FJ to the FM
level, and the percentage of increase between FJ and FM
can be easily quantified (cf. Lazar et al.
1997a, 1997b, 1998; Toth et al. 2005b). However, as
Photosynth Res (2017) 132:13–66 43
123
shown by Krieger-Liszkay and Rutherford (1998), the
effect of these herbicides on the midpoint potential of QA
affects their working mechanism. DCMU increases the
midpoint potential of QA, stabilizing the charge separation,
whereas phenolic herbicides decrease the midpoint poten-
tial of QA and destabilize the charge recombination (see
also Question 13). The first type of herbicides reduces the
probability that a charge recombination induces singlet
oxygen, whereas the second type increases this probability.
In other words, the extent of inhibition is only half the
story.
The activities of a surprisingly large number of herbi-
cides are directly or indirectly influenced by light (Hess
2000). Herbicides that catalyze the formation of reactive
oxygen species (e.g., paraquat and diquat), block the syn-
thesis of carotenoids directly or indirectly, inhibit proto-
porphyrinogen oxidase during Chl biosynthesis or inhibit
glutamine synthetase in the nitrogen assimilation pathway
can, therefore, also be detected using fluorometric methods
(Fuerst et al. 1985; Kana et al. 2004; Merkell et al. 2004;
Søbye et al. 2011). Paraquat, also known as methylviolo-
gen, can accept electrons from the FeS clusters of PSI in
competition with Fd. In dark-adapted leaves this is
observed as a suppression of the IP phase of the OJIP
transient (e.g., Schansker et al. 2005). Herbicides binding
to the QB site do not necessarily affect the FO or FM values
(Toth et al. 2005b). However, the measuring light of a
PAM instrument will strongly increase the measured FO
value in samples in which the re-oxidation of QA- is fully or
partially inhibited. This effect decreases the calculated FV/
FM value and allows the detection of such herbicides
(Bolhar-Nordenkampf et al. 1989).
Glyphosate application leads to a depletion of free
phosphate, leading to an inhibition of ATP synthesis, and
isoxaflutole inhibits PQ synthesis. Søbye et al. (2011)
showed that FJ and the slopes at the J and I steps can be
used to titrate the effects of the herbicides glyphosate and
isoxaflutole as well as mixtures of these two compounds.
However, looking at the OJIP transients shown in that
paper, these parameters seem to reflect mainly the
destruction of either the photosynthetic system or alterna-
tively PSII, since the main effect was observed on the FV
amplitude. The authors note that the fluorescence data
obtained 48 h after the treatment gave the same informa-
tion as the biomass measurements carried out 3 weeks after
the treatment.
Special equipment for the detection of herbicides in
microalgae was introduced by the laboratries of Jean-
Claude Duval and Claudia Buchel (Arsalane et al. 1993;
Conrad et al. 1993). The principle is the same as that for
the PAM and FV/FM mentioned above, but the equipment
was considerably more sensitive than the PAM. The
equipment works with low-intensity-modulated light that
does not lead to the induction of fluorescence in the
absence of herbicide, leads to the induction of fluorescence
as a function of the fraction of PSII RCs inhibited by
herbicide.
Herbicides that inhibit the synthesis of amino acids or
lipids have indirect effects on photosynthesis through their
effect on the carbon metabolism or the stability of thy-
lakoid membranes and may consequently alter PSII and
PSI photochemical activity. Their effects on the fluores-
cence kinetics will only be apparent after a much longer
exposure time than in the case of PSII-type inhibitor her-
bicides (Popovic et al. 2003). Olesen and Cedergreen
(2010) and Yanniccari et al. (2012) have argued that the
inhibition of CO2 assimilation is a better and more direct
probe for glyphosate effects than Chl a fluorescence. This
is true for OJIP transients, but it can be pointed out that a
full Kautsky curve measured till the steady state is reached
would also give information on the inhibition of CO2
assimilation. As noted by Yanniccari et al. (2012), the
parameter ETR (a parameter determined for steady-state
conditions) is a good probe for herbicides that have a
kinetic effect on photosynthetic activity since fluorescence
measurements are easier and faster than quantification of
CO2 assimilation by IRGA.
Chl a fluorescence imaging does not only allow the
measurement of a whole plant or several small plants
simultaneously, and it also makes it possible to follow the
spread of herbicides in leaves or whole plants (see Licht-
enthaler et al. 2005b). Herbicide-induced perturbations of
plant metabolism have been detected using changes in the
derived images of fluorescence parameters before any
visual effects on growth were observed (Barbagallo et al.
2003). Konishi et al. (2009) made a three-dimensional
analysis of the uptake of DCMU, in plants of Cucumis
melo, in which the third dimension was the uptake time.
This allowed the authors to show in detail how the herbi-
cide, arriving in the leaf via the xylem, spread inside the
leaf. Saura and Quiles (2009), using Chl a fluorescence
imaging, to compare the uptake of DCMU and paraquat in
Chrysanthemum morifolium, Rosa meillandina and
Spathiphyllum wallisii, showed (1) that paraquat, an her-
bicide acting on the acceptor side of PSI, can also be
monitored by Chl a fluorescence imaging and (2) that the
more water-soluble paraquat affected the leaves more
homogeneously than DCMU. Muller et al. (2008) showed
how a combination of the Maxi imaging PAM, black 96
well plates and Chlorella vulgaris and Phaeodactylum
tricornutum as biosensors can be used as a rapid and
inexpensive bioassay for herbicides in, e.g., water samples.
Chl a fluorescence imaging has not only been used to
detect the effects of herbicides on the photosynthetic per-
formance of plants but also of algae as recently reviewed
by Kumar et al. (2014).
44 Photosynth Res (2017) 132:13–66
123

Question 29: Can fluorescence parameters be usedfor QTL studies?
QTLs or quantitative trait loci refer to a location on a
chromosome coding for one or more genes that affect a
certain characteristic or process, e.g., stress tolerance or
sensitivity. It is likely that, e.g., drought stress tolerance is
affected by many genes that can be found on several
chromosomes. The word quantitative refers to the fact that
the genes linked to a QTL only have partial control over a
characteristic. With respect to photosynthesis there is one
more peculiarity. QTLs are located in the nuclear genome,
whereas many important photosynthetic genes are found in
the chloroplast genome.
Several studies have been carried out that had as goal to
identify QTLs related to fluorescence parameters (see
Question 30 for a discussion of a rational choice of
parameters for such studies). There are two main approa-
ches to the identification of QTLs, but for the study of
QTLs related to fluorescence parameters only one of them,
association mapping, has been used (see Flood et al. 2011
for a discussion of linkage mapping). Czyczyło-Mysza
et al. (2013) used for their study 94 daughter lines from the
cross of two wheat varieties: Chinese spring 9 SQ1. For
these daughter lines the authors determined the following
parameters: FV/FM, PIabs (performance index), ABS/CSm,
TRo/CSm, ETo/CSm, DIo/CSm, RC/CSm, Chl a ? b,
SPAD, Car, DWP (dry weight per plant), GWE (grain yield
of the main stem), YP (grain yield per plant).
Separately, a genetic map was made based on the DNA
of 90 lines. This resulted in a Chinese spring 9 SQ1
genetic map defined by 1039 genetic markers of which 472
were derived from their study. In addition, 165 genes
related to the photosynthetic light reactions, pigment
metabolism.
The authors then tested, which of the studied parameters
were linked, in the sense that they were inherited together
in the different daughter lines. By studying the extent of
linkage between the parameters and the genetic markers,
the genes controlling the variability in the studied param-
eters could be assigned to areas on particular chromo-
somes. Czyczyło-Mysza et al. (2013) observed that the
productivity traits were not consistently correlated with any
of the fluorescence or pigment traits.
Similar studies were carried out by several other groups.
Stamp and coworkers published several QTL studies rela-
ted to chilling tolerance in maize. Fracheboud et al. (2002)
studied 233 recombinant inbred lines derived from a cross
between a drought-tolerant and a drought-sensitive maize
variety grown at 15 and 25 �C. The authors screened the
following parameters: CO2 assimilation, UPSII, FV/FM, FO
(rel.), stomatal resistance, Chl a 9 b, Chl a/b, b-
carotene/lutein and different carotenes/xanthophylls. In a
second study, Fracheboud et al. (2004) screened: FO, FV/
FM, UPSII, FV0/FM
0, qP, CER (CO2 assimilation), SPAD,
shoot DW, N (%) (nitrogen content). Apart from an
assignment of several QTLs, these studies also yielded a lot
of biological variability allowing the study of the rela-
tionship between different parameters. Yang et al. (2007)
studied 150 recombinant inbred lines of the cross Hanxuan
109 Lumai 14 lines of wheat under drought and well-
watered conditions. The authors screened the following
parameters: Chl content, FO, FM, FV, FV/FM, FV/FO. The
authors noted that for each of the two conditions studied
different QTLs were found. An observation that is made in
several other studies as well. Yin et al. (2010) studied 184
recombinant inbred lines of crosses of the soybean varieties
Kefeng no 1 and Nannong1138-2. The authors used the
following parameters for screening: TRo/ABS (FV/FM JIP
test), ETo/TRo, REo/ETo, ABS/RC, PIabs, FV/FM (PAM),
FV0/FM
0, qP, UPSII, Pn (CO2 assimilation rate). The authors
planted at different times in order to be able to measure all
the plants at the same age. Remarkable was the observation
that the FV/FM measured with the HandPEA did not yield
the same results as the FV/FM measured with a PAM
instrument. It is possible that the authors erroneously used
the 50-ls point for the FO value of the OJIP measurements,
but it may also suggest that there were methodological
problems. Simic et al. (2014) studied 205 recombinant
inbred lines of the cross of the maize lines B73 9 M017 in
four environmental conditions differing in soil moisture
levels. The authors used the following parameters for
screening: TRo/ABS, ETo/TRo, ABS/RC, TRo/RC, ETo/
RC, DIo/RC, TRo/DIo, ETo/(TRo - ETo), PIabs. The
authors identified 10 significant QTLs, but also observed
that different QTLs were found for different environmental
conditions.
With respect to the JIP test parameters chosen in the
above-mentioned studies, it can be noted that most of them
have not been characterized physiologically. See the next
question for a discussion about the choice of parameters for
this type of study.
Fracheboud et al. (2002, 2004) tried to link their QTLs
to candidate genes. In most of the other cited studies the
link with the physiology of the studied plants is less
evident.
Question 30: Which parameters to choose for QTLstudies?
Fluorescence parameters reflect an underlying process or
processes. If we would assume, for example, that a
decrease in PSI content during stress is a marker for
Photosynth Res (2017) 132:13–66 45
123

oxidative damage, then the resistance of the IP amplitude
to stress could be a good candidate for a QTL study.
Although the meaning of changes in the ratio between the
amplitude of the photochemical phase and the amplitude of
the thermal phase has not been established, it probably
reflects a fundamental property of the chloroplast and may,
therefore, be another candidate. Another parameter could
be the normalized area [the parameter Sm of the JIP test
(Strasser et al. 2004)], or even the normalized area split in
parts (area between FM and the OJ, JI and IP rise,
respectively; see Toth et al. 2007b and Question 16) that
give information on the ratio between PSII and the number
of electron acceptors downstream (PQ pool and acceptor-
side PSI). For the qE several genes have already been
identified (Jung and Niyogi 2009) and it may, therefore, be
a less interesting parameter for a QTL study. The param-
eter qP, as a rough indicator of the balance between exci-
tation pressure and electron flow, in response to a certain
stress may be another candidate parameter to screen for
stress resistance genes.
Parameters that have not been characterized physiolog-
ically are less rational choices for QTL studies. Many JIP
test parameters are only used conceptionally and have so
far not been characterized physiologically in a proper way.
Quite a few of the JIP test parameters mentioned in the
previous question belong to this category of conceptional
parameters. Other parameters are so fundamental that they
are unlikely to change much. The quantum yield of PSII
has been shown to be sensitive to antenna size (Wientjes
et al. 2013a), but, apart from that, is essentially invariable
(see Question 6). On the other hand, the parameter FV/FM
can be used to probe the resistance to photoinhibition.
QTL studies are, in principle, not so different from
mutant screening. If you do not have a well-thought-out
strategy, it is unlikely that you will obtain interesting
information.
In summary, in our opinion, QTL studies can yield more
interesting information if a more rational approach, making
better use of our knowledge of the meaning of fluorescence
parameters, is applied.
Question 31: Can Chl a fluorescencemeasurements/parameters be used for cropimprovement?
As discussed in response to several questions in this paper
(e.g., 25 and 26), Chl a fluorescence can be used to monitor
environmental stress. Therefore, fluorescence parameters
can, in principle, be used as selection tools in plant
breeding programs and for analyzing genotype–environ-
ment interactions (Araus et al. 1998; Kalaji and Pietkie-
wicz 2004). In quite a few studies this approach has been
advocated (Greaves and Wilson 1987; Baker and Rosen-
qvist 2004; Kalaji and Pietkiewicz 2004).
There are a few points that should be considered: (1) It
is important to obtain Chl a fluorescence-related traits
showing a high correlation with yield or plant performance
in addition to Chl a fluorescence-related traits that are
specific for resistance to the stress of interest; (2) the
measurements should cause only minimal perturbations in
growth conditions: The shorter the measurements the bet-
ter; (3) short measurements that are easy to carry out, to
allow the accumulation of many measurements in a short
time—plant characteristics change during growth in
response to both age and environmental factors. To allow
comparisons between different cultivars, varieties or
crosses of all plants of interest, measurements have to be
made within a short time interval. With respect to point (1),
it may be noted that our knowledge of plant stress
responses is often too limited to decide with certainty
which trait will improve both stress resistance and plant
yield. For example, in the case of photoinhibition it has
been argued widely that this represents damage. More
recently, however, it has been suggested that the inactiva-
tion of PSII by light (reversible damage) prevents damage
to PSI (largely irreversible damage) (Grieco et al. 2012; see
Question 8). Breeding for plants with PSII that is no longer
inactivated by light could, therefore, have catastrophic
consequences for the survival chances of such plants.
Another example of such a conflict of interest is the
observation that increasing the synthesis of enzymes that
scavenge ROS may make the plant more resistant to abiotic
stress, but, at the same time, more sensitive to biotic stress,
because it weakens programmed-cell-death-based defense
mechanisms against pathogens (Mittler 2002).
Thus, two Chl a fluorescence-related traits have to be
used to screen for crop improvements: (1) processes that
are closely correlated with plant performance, which can
be monitored by Chl a fluorescence and (2) Chl a fluores-
cence-related traits that correlate with the stress of interest
and are under genetic control and can be genetically
manipulated.
In the field, plants often are subjected to several types of
biotic or abiotic stresses during the growing season. If two
or three types of stress interact, the response of the plant
may differ considerably from the response to individual
stresses. This complicates the analysis of data for breeding
programs directed at a particular stress. It should be noted
that the growth conditions of horticultural plants grown in
greenhouses can, in this respect, be much better controlled.
If stress combinations are common, it is also possible to
target such a combination of stresses. Rosyara et al. (2010)
looked at the combination of high-temperature stress and
spot blotch in wheat. They observed that the parameters
FV/FM, Chl content (SPAD measurements) and the
46 Photosynth Res (2017) 132:13–66
123

parameter canopy temperature depression (measured using
infrared thermography) showed a better correlation with
plant yield (e.g., thousand kernel weight) than the leaf area
affected by spot blotch.
The inheritance of Chl a fluorescence features in dif-
ferent stress environments indicates typical quantitative
traits determined by multiple QTLs (Fracheboud et al.
2004; Hund et al. 2005; Yang et al. 2007; Guo et al. 2008;
Kalaji and Guo 2008; Kiani et al. 2008; Zhang et al. 2010;
Czyczyło-Mysza et al. 2013; Anithakumari et al. 2012).
Depending on the complexity of the processes associated
with a trait, the number of QTLs and their effect size differ.
Although the technical quality of Chl a fluorescence
measurements and the efficiency with which they can be
carried out have increased over the years, there still remain
many basic interpretation issues of which quite a few are
mentioned here and in Kalaji et al. (2014a). Chl a fluores-
cence analysis is now rapid, sensitive, non-destructive and
relatively cheap (Misra et al. 2001a, b, 2006; Kalaji et al.
2012a). A discussion issue remains under which conditions
Chl a fluorescence measurements can be used for early
detection of stress and which parameters are subsequently
the best tools. Chl a fluorescence can be measured on
whole tree canopies down to single cells or even chloro-
plasts (Malenovsky et al. 2009; Snel and Dassen 2000). It
has to be noted though that for imaging applications, the
time resolution is considerably lower than for point mea-
surements and homogeneous illumination of the measured
leaves or plants remains a concern for kinetic fluorescence
measurements. Also, for tree crown measurements, the
relatively large distance between measuring equipment and
photosynthetic sample imposes considerable limitations on
the Chl a fluorescence parameters that can be measured
(Malenovsky et al. 2009).
One of the most important problems associated with the
use of Chl a fluorescence parameters is the heterogeneity of
photosynthetic samples. Different factors such as senes-
cence (Wingler et al. 2005), injury/wounding (Quilliam
et al. 2006), microbial infection (Scharte et al. 2005;
Bonfig et al. 2006; Berger et al. 2007), leaf water status
(Meyer and Genty 1999; Nejad et al. 2006), photosynthetic
induction (Meyer and Genty 1999), spatial gradients in
thylakoid differentiation (Pantaleoni et al. 2009), chilling
(Hogewoning and Harbinson 2007) and ozone exposure
(Leipner et al. 2001) can cause photosynthetic hetero-
geneity. This type of photosynthetic heterogeneity is dif-
ficult to capture with non-imaging fluorescence techniques.
Recent advances in fluorescence imaging technology has
turned it into an important tool for resolving spatial
heterogeneity of leaf photosynthesis (Nedbal and Whit-
marsh 2004; Oxborough 2004). But even when using
imaging techniques, it is not easy to quantify the effect of a
pathogen infection on the photosynthetic capacity of a leaf
based on Chl a fluorescence measurements alone. In such
cases, it would probably be necessary to calibrate such
measurements using, for example, CO2 assimilation mea-
surements that yield absolute activities.
For a breeder it is important to measure all plants in a
breeding program in a short time to be able to compare the
different crosses (see above). However, it is also possible
to use imaging or even remote sensing methods depending
on the question whether the chosen parameter(s) can be
determined using such techniques. Overall, the measure-
ment of Chl a fluorescence can be helpful for breeding
purposes if the questions ‘‘what to measure’’ and ‘‘how to
measure it efficiently’’ can be resolved.
Question 32: Are machine learning methods usefulfor the analysis of Chl a fluorescence inductioncurves?
Prompt fluorescence (PF) induction curves reflect energy
and electron transfer processes in thylakoid membranes
following a dark-to-light transition of dark-adapted pho-
tosynthetic samples. Analyzing the shapes of the induction
transient, the absolute values of the fluorescence signal at
different times Ft during induction (OJIP), their relative
amplitudes, normalized to the variable part of the signal, or
difference curves reflecting stress effects, we can study
different sites of the photosynthetic electron transport chain
and monitor stress effects on them. Stress often affects not
only specific sites of the photosynthetic structure or
specific reactions, but modifies a wide range of cell
structures (which may not all be directly related to the
photosynthetic apparatus) and change their function. This
may have secondary (indirect) effects on photosynthetic
processes. These effects can be detected looking at changes
in the ‘‘fingerprint’’—a term also used by Tyystjarvi et al.
(1999)—formed by the constellation of parameters derived
from OJIP transients or by studying the modified shape of
the fluorescence rise kinetics. This ‘‘stress response’’ often
contains hidden information concerning the stress type, a
specific plant tolerance to the applied stress, and other
important and interesting information related to the plant as
whole and that, at first sight, is not directly connected to the
photosynthetic apparatus of the plant.
The identification of such kinds of hidden information is
possible through additional secondary fluorescence data
processing, using methods of artificial intelligence that
allow the analysis of large data sets, the amount, precision
and complexity of which cannot not be efficiently analyzed
by traditional methods (Samborska et al. 2014). Here, the
analysis of OJIP transients is discussed. In an earlier series
of articles, Tyystjarvi and coworkers tried to apply similar
artificial intelligence methods to the analysis of
Photosynth Res (2017) 132:13–66 47
123
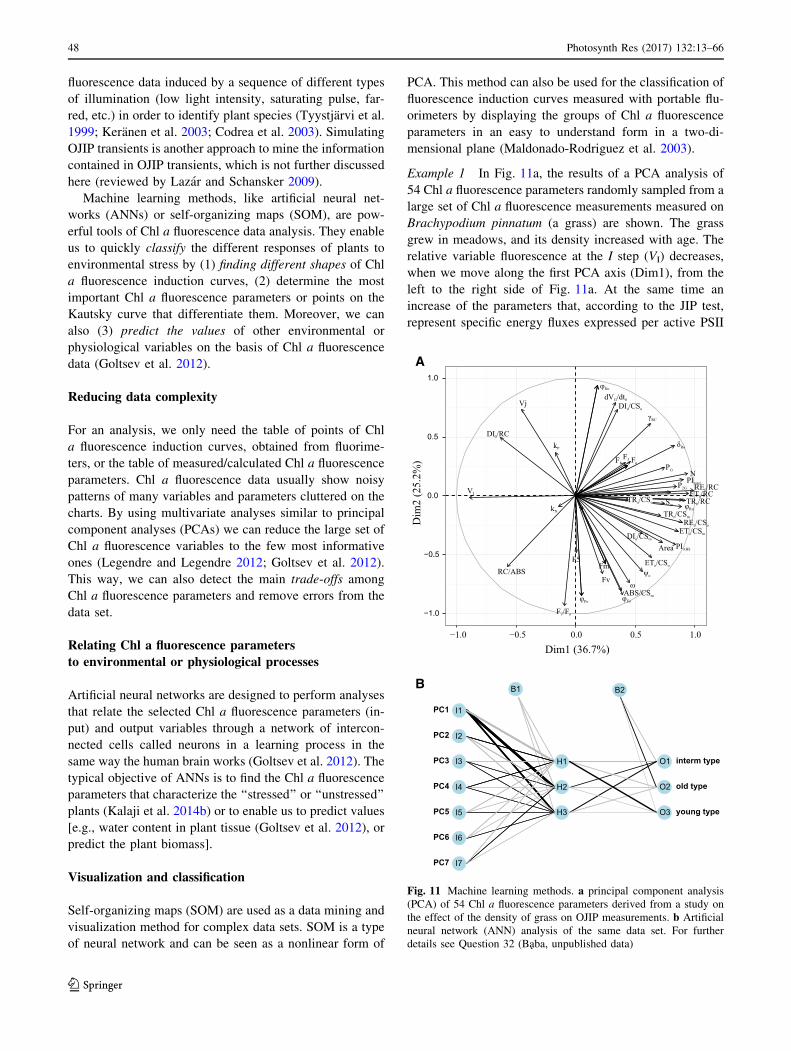
fluorescence data induced by a sequence of different types
of illumination (low light intensity, saturating pulse, far-
red, etc.) in order to identify plant species (Tyystjarvi et al.
1999; Keranen et al. 2003; Codrea et al. 2003). Simulating
OJIP transients is another approach to mine the information
contained in OJIP transients, which is not further discussed
here (reviewed by Lazar and Schansker 2009).
Machine learning methods, like artificial neural net-
works (ANNs) or self-organizing maps (SOM), are pow-
erful tools of Chl a fluorescence data analysis. They enable
us to quickly classify the different responses of plants to
environmental stress by (1) finding different shapes of Chl
a fluorescence induction curves, (2) determine the most
important Chl a fluorescence parameters or points on the
Kautsky curve that differentiate them. Moreover, we can
also (3) predict the values of other environmental or
physiological variables on the basis of Chl a fluorescence
data (Goltsev et al. 2012).
Reducing data complexity
For an analysis, we only need the table of points of Chl
a fluorescence induction curves, obtained from fluorime-
ters, or the table of measured/calculated Chl a fluorescence
parameters. Chl a fluorescence data usually show noisy
patterns of many variables and parameters cluttered on the
charts. By using multivariate analyses similar to principal
component analyses (PCAs) we can reduce the large set of
Chl a fluorescence variables to the few most informative
ones (Legendre and Legendre 2012; Goltsev et al. 2012).
This way, we can also detect the main trade-offs among
Chl a fluorescence parameters and remove errors from the
data set.
Relating Chl a fluorescence parameters
to environmental or physiological processes
Artificial neural networks are designed to perform analyses
that relate the selected Chl a fluorescence parameters (in-
put) and output variables through a network of intercon-
nected cells called neurons in a learning process in the
same way the human brain works (Goltsev et al. 2012). The
typical objective of ANNs is to find the Chl a fluorescence
parameters that characterize the ‘‘stressed’’ or ‘‘unstressed’’
plants (Kalaji et al. 2014b) or to enable us to predict values
[e.g., water content in plant tissue (Goltsev et al. 2012), or
predict the plant biomass].
Visualization and classification
Self-organizing maps (SOM) are used as a data mining and
visualization method for complex data sets. SOM is a type
of neural network and can be seen as a nonlinear form of
PCA. This method can also be used for the classification of
fluorescence induction curves measured with portable flu-
orimeters by displaying the groups of Chl a fluorescence
parameters in an easy to understand form in a two-di-
mensional plane (Maldonado-Rodriguez et al. 2003).
Example 1 In Fig. 11a, the results of a PCA analysis of
54 Chl a fluorescence parameters randomly sampled from a
large set of Chl a fluorescence measurements measured on
Brachypodium pinnatum (a grass) are shown. The grass
grew in meadows, and its density increased with age. The
relative variable fluorescence at the I step (VI) decreases,
when we move along the first PCA axis (Dim1), from the
left to the right side of Fig. 11a. At the same time an
increase of the parameters that, according to the JIP test,
represent specific energy fluxes expressed per active PSII
I1
I2
I3
I4
I5
I6
I7
PC1
PC2
PC3
PC4
PC5
PC6
PC7
H1
H2
H3
O1
O2
O3
interm type
old type
young type
B1 B2
Dim1 (36.7%)
Area
Fm
Fv
F5
F /Fv o
Vj
VI
Sm
DI /CSo o
ET /CSo o
RE /CSo o
ABS/CSm
DI /CSo m
TR /CSo m
ET /CSo m
RC/ABS
−1.0
−0.5
0.0
0.5
1.0
−1.0 −0.5 0.0 0.5 1.0
Dim
2 (2
5.2%
) FJFK
DI /RC0
dV /dtG 0
γRC
kP
ω
PItotal
PIABS
δRo
ψo
kN
φEo
PG
ET /RC0
φDo
Fo
RE /RC0
φPo
TR /RC0φRo
P2G
N
A
B
TR /CSo o
Fig. 11 Machine learning methods. a principal component analysis
(PCA) of 54 Chl a fluorescence parameters derived from a study on
the effect of the density of grass on OJIP measurements. b Artificial
neural network (ANN) analysis of the same data set. For further
details see Question 32 (Baba, unpublished data)
48 Photosynth Res (2017) 132:13–66
123

reaction center (TRO/RC, ETO/RC, REO/RC) is observed.
When we move along the second PCA axis (Dim2), from
bottom to upper side of Fig. 11a, the increase of the values
of the parameters FV/FO and maximum quantum yield of
primary PSII photochemistry (/Po) can be seen. In this way
we find the four most important parameters (instead of the
initial 54), which describe the state of the photosynthetic
apparatus, related to the studied increase in the stand
density of grass.
Example 2 In Fig. 11b, the artificial neural network
(ANN) analysis of Chl a fluorescence of the same data set
is shown. As in the previous analyses we performed the
PCA and retained the first 7 axes (the two most important
axes are related to fluorescence parameters from Example
1). The ANNs find the relationships between these
parameters and the plants of different age growing in
grasslands. In other words, the analyses allow the com-
parison of the responses of the photosynthetic apparatus to
the condition of these three plots.
Example 3 Unsupervised self-organizing maps (SOM)
using another population of plants growing under stressed
(drought stress) and unstressed (well-watered) conditions.
The pattern of differences in Chl a fluorescence parameters
(F0, F1, TR0/RC, ET0/RC, RE0/RC, Sm, /Po) is easily
detectable (SOM; Fig. 12).
Examples of successful use of machine learning meth-
ods for Chl a fluorescence analysis from the literature are:
1. Taxonomic classification of plant species based on Chl
a fluorescence parameter data using an artificial neural
network (Kirova et al. 2009)
2. Determination of relative water contents (RWCs) in
leaves based on PF, DF and MR820 signals (=820 nm
reflection signal) or calculated JIP parameters (Goltsev
et al. 2012)
3. Prediction of the yield of wheat based on selected
factors in wheat crop production with self-organizing
maps (Pantazi et al. 2014)
Sm
Fo
F1
F2
F3
F5
DI /RCo
RE /RCo
TR /RCo
ET /RCoφPo
Fig. 12 Example of a self-
organizing map (SOM) based
on a set of OJIP measurements
of unstressed and drought-
stressed plants. For further
details see Question 32 (Baba,
unpublished data)
Photosynth Res (2017) 132:13–66 49
123

How to perform the analyses? All analyses presented
above are implemented using statistical packages, for
example Statistica (StatSoft Inc. 2011) or SAS (SAS
Enterprise Miner; SAS Institute, Cary, NC). Neural net-
work analyses can also be performed in MATLAB with the
Neural Network Toolbox (MathWorks).
Question 33: Which are the most useful booksabout Chl a fluorescence?
There are not many books dealing with Chl a fluorescence.
Since the 1980s there have been two classic references:
‘‘Light Emission by Plants and Bacteria’’ (1986), edited by
Govindjee, Amesz and Fork; and ‘‘Applications of
Chlorophyll Fluorescence in Photosynthesis Research,
Stress Physiology, Hydrobiology and Remote Sensing’’
(1988), edited by Lichtenthaler. More recently, Laisk and
Oja (1998) published ‘‘Dynamics of Leaf Photosynthesis
on Dynamic Measurements of Photosynthesis in Leaves’’
and DeEll and Toivonen (2003) published ‘‘Practical
Applications of Chlorophyll Fluorescence Science in Plant
Biology.’’ Further there are three books in the series
Advances in Photosynthesis and Respiration that contain
much information on Chl a fluorescence: ‘‘Chlorophyll
a Fluorescence: a Signature of Photosynthesis’’ (2004),
edited by Papageorgiou and Govindjee, ‘‘Photosynthesis in
Silico: Understanding Complexity from Molecules to
Ecosystems’’ (2009), edited by Laisk, Nedbal and Govin-
djee and ‘‘Non-photochemical Quenching and Energy
Dissipation in Plants, Algae and Cyanobacteria’’ (2014),
edited by Demmig-Adams, Garab, Adams and Govindjee.
A recent addition is ‘‘Applications of Chlorophyll Fluo-
rescence in Understanding Plant Performance’’ (2016),
edited by Kalaji et al. In addition, several review papers
have been published: Krause and Weis (1991), Dau (1994),
Govindjee (1995), Rohacek and Bartak (1999), Maxwell
and Johnson (2000), Rohacek (2002), Lazar (2006), Logan
et al. (2007), Baker (2008), Henriques (2009), Allakhver-
diev (2011), Gorbe and Calatayud (2012), Misra et al.
(2012), Kalaji et al. (2012b), Murchie and Lawson (2013)
and Lazar (2015).
Concluding remarks
Chlorophyll a fluorescence is a simple, non-invasive, non-
destructive, quick and relatively easy way to determine the
efficiency and activity of the photosynthetic electron
transport chain. However, as this paper and the previous
paper (Kalaji et al. 2014a) demonstrate, the interpretation
of fluorescence measurements demands knowledge. Both
knowledge of the sample (e.g., do I still measure the true
FO or true FM) but also of all the photosynthetic processes
that can affect the fluorescence intensity, are important.
Once these two requirements are met, Chl a fluorescence
offers, without doubt, a very broad range of probes for the
monitoring of processes related to photosynthesis.
The parameters derived from fluorescence signals can
provide information about the structure (PSII antenna size,
photosystem integrity and stoichiometry of components of
the ETC) and function of PSII and the ETC. It has to be
emphasized once more that the utility Chl a fluorescence is
not limited to PSII. Chl a fluorescence measurements can
also give insight into the function and content of PSI,
cyclic electron flow and excitation transfer to and between
the photosystems. Several fluorescence methods (e.g.,
prompt and delayed Chl a fluorescence), measured using
various protocols and instruments, are applied at different
temperatures to decipher the functional integrity of the
pigment protein complexes in different photosystems. The
impact of biotic and abiotic environmental stress on green
plants—but also on algae and cyanobacteria—and in many
cases their early detection is possible. Fluorescence meth-
ods can also be combined with other photosynthetic tech-
niques to help decipher the intricate regulation and
complex interactions between a plant’s metabolic systems.
Thanks to the efforts of several generations of scientists
in the field of photosynthetic research, Chl a fluorescence is
becoming more and more one of the success stories in plant
physiology. Over the last decades the number of users of
this technique in basic and applied research has grown
exponentially. However, if new users lack sufficient basic
knowledge of Chl a fluorescence and of the experimental
possibilities of Chl a fluorescence-based techniques, there
is a high risk that the users will misinterpret or overinter-
pret their results, that they will insufficiently take into
account the preconditions that have to be met to success-
fully apply Chl a fluorescence and that they will not make
use of all the possibilities the method offers to them.
In this review we have treated an additional set of
questions relevant to contemporary Chl a fluorescence
research. Nevertheless, many details and specific aspects of
Chl a fluorescence are beyond the scope of this review and
every reader is urged to consult the primary literature for a
fuller treatment of this rapidly moving area of research.
Finally, as many of the treated questions imply, much is
still unknown, many topics rest on weak foundations, new
protocols can be designed, and new instruments developed.
There is still considerable potential for chlorophyll fluo-
rescence techniques to be improved and to expand, pro-
viding new insights into the fundamental process of
photosynthesis.
Acknowledgements The authors would like to thank the following
prominent scientists for encouraging us and to prepare this
50 Photosynth Res (2017) 132:13–66
123
manuscript, their important leads to enhance the quality of the text,
and fruitful discussions: Govindjee, Suleyman Allakhverdiev, George
Papageorgiou, Merope Tsimilli-Michael, Giles Johnson, Helmut
Lichtenthaler, Ulrich Schreiber, Jeremy Harbinson, Bernard Genty
and Joao Serodio.
Open Access This article is distributed under the terms of the
Creative Commons Attribution 4.0 International License (http://crea
tivecommons.org/licenses/by/4.0/), which permits unrestricted use,
distribution, and reproduction in any medium, provided you give
appropriate credit to the original author(s) and the source, provide a
link to the Creative Commons license, and indicate if changes were
made.
References
Adams WW III, Demmig-Adams B (1992) Operation of the
xanthophyll cycle in higher plants in response to diurnal changes
in incident sunlight. Plant 186:390–398
Adams WW III, Demmig-Adams B (2004) Chlorophyll fluorescence
as a tool to monitor plant response to the environment. In:
Papageorgiou GC, Govindjee (eds) Advances in photosynthesis
and respiration series chlorophyll fluorescence: a signature of
photosynthesis, vol 19. Springer, Dordrecht, pp 583–604
Adams WW III, Demmig-Adams B, Winter K, Schreiber U (1990a)
The ratio of variable to maximum chlorophyll fluorescence from
photosystem II, measured in leaves at ambient temperature and
at 77 K, as an indicator of the photon yield of photosynthesis.
Planta 180:166–174
Adams WW III, Winter K, Schreiber U, Schramel P (1990b)
Photosynthesis and chlorophyll fluorescence characteristics in
relationship to changes in pigment and element composition of
leaves of Platanus occidentalis L. during autumnal senescence.
Plant Physiol 93:1184–1190
Alfonso M, Montoya G, Cases R, Rodriguez R, Picorel R (1994) Core
antenna complexes, CP43 and CP47, of higher plant photosys-
tem II. Spectral properties, pigment stoichiometry, and amino
acid composition. Biochemistry 33:10494–10500
Allakhverdiev SI (2011) Recent progress in the studies of structure
and function of photosystem II. J Photochem Photobiol B Biol
104:1–8
Allakhverdiev SI, Klimov VV, Carpentier R (1994) Variable thermal
emission and chlorophyll fluorescence in photosystem II parti-
cles. Proc Natl Acad Sci USA 491:281–285
Allakhverdiev SI, Los DA, Mohanty P, Nishiyama Y, Murata N
(2007) Glycinebetaine alleviates the inhibitory effect of moder-
ate heat stress on the repair of photosystem II during photoin-
hibition. Biochim Biophys Acta 1767:1363–1371
Allen JF (1992) Protein phosphorylation in regulation of photosyn-
thesis. Biochim Biophys Acta 1098:275–335
Allen JF, Bennett J, Steinback KE, Arntzen CJ (1981) Chloroplast
protein phosphorylation couples platoquinone redox state to
distribution of excitation energy between photosystems. Nature
291:21–25
Amesz J, van Gorkom HJ (1978) Delayed fluorescence in photosyn-
thesis. Annu Rev Plant Physiol 29:47–66
Ananyev GM, Dismukes GC (1996) Assembly of the tetra-Mn site of
photosynthetic water oxidation by photoactivation: Mn stoi-
chiometry and detection of a new intermediate. Biochemistry
35:4102–4109
Anderson JM, Chow WS, Goodchild DJ (1988) Thylakoid membrane
organization in sun/shade acclimation. Aust J Plant Physiol
15:11–26
Andrizhiyevskaya EG, Chojnicka A, Bautista JA, Diner BA, van
Grondelle R, Dekker JP (2005) Origin of the F685 and F695
fluorescence in photosystem II. Photosynth Res 84:173–180
Anithakumari AM, Nataraja KN, Visser RGF, van der Linden G
(2012) Genetic dissection of drought tolerance and recovery
potential by quantitative trait locus mapping of a diploid potato
population. Mol Breed 30:1413–1429
Antal TK, Krendeleva TE, Rubin AB (2007) Study of photosystem 2
heterogeneity in the sulfur-deficient green alga Chlamydomonas
reinhardtii. Photosynth Res 94:13–22
Antal TK, Matorin DN, Ilyash LV, Volgusheva AA, Osipov A,
Konyuhow IV, Krendeleva TE, Rubin AB (2009) Probing of
photosynthetic reactions in four phytoplanktonic algae with a
PEA fluorometer. Photosynth Res 102:67–76
Araus JL, Amaro T, Voltas J, Nakkoul H, Nachit MM (1998)
Chlorophyll fluorescence as a selection criterion for grain yield
in durum wheat under Mediterranean conditions. Field Crops
Res 55:209–223
Argyroudi-Akoyunoglou J (1984) The 77 K fluorescence spectrum of
the Photosystem I pigment-protein complex CPIa. FEBS Lett
171:47–53
Arnold WA (1991) Experiments. Photosynth Res 27:73–82
Arnold WA, Thompson J (1956) Delayed light production by blue-
green algae, red algae and purple bacteria. J Gen Physiol
39:311–318
Aro EM, Hundal T, Carlberg I, Andersson B (1990) In vitro studies
on light-induced inhibition of PSII and D1-protein degradation at
low temperatures. Biochim Biophys Acta 1019:269–275
Aro EM, Virgin I, Andersson B (1993) Photoinhibition of photosys-
tem II. Inactivation protein damage and turnover. Biochim
Biophys Acta 1143:113–134
Arsalane W, Paresys G, Duval JC, Wilhelm C, Conrad R, Buchel C
(1993) A new fluorometric device to measure the in vivo
chlorophyll a fluorescence yield in microalgae and its use as a
herbicide monitor. Eur J Phycol 28:247–252
Asada K (1999) The water-water cycle in chloroplasts: scavenging of
active oxygens and dissipation of excess photons. Annu Rev
Plant Physiol Plant Mol Biol 50:601–639
Ashraf M, Harris PJC (2004) Potential biochemical indicators of
salinity tolerance in plants. Plant Sci 166:3–16
Bailey S, Walters RG, Jansson S, Horton P (2001) Acclimation of
Arabidopsis thaliana to the light environment: the existence of
separate low light and high light responses. Planta 213:794–801
Baker NR (2008) Chlorophyll fluorescence: a probe of photosynthesis
in vivo. Annu Rev Plant Biol 59:659–668
Baker NR, Rosenqvist E (2004) Applications of chlorophyll fluores-
cence can improve crop production strategies: an examination of
future possibilities. J Exp Bot 55:1607–1621
Ballottari M, Dall’Osto L, Morosinotto T, Bassi R (2007) Contrasting
behavior of higher plant photosystem I and II antenna systems
during acclimation. J Biol Chem 282:8947–8958
Barbagallo RP, Oxborough K, Pallett KE, Baker NR (2003) Rapid,
noninvasive screening for perturbations of metabolism and plantgrowth using chlorophyll fluorescence imaging. Plant Physiol
132:485–493
Barber J, Malkin S, Telfer A (1989) The origin of chlorophyll
fluorescence in vivo and its quenching by the photosystem II
reaction centre. Philos Trans R Soc Lond B 323:227–239
Barra M, Haumann M, Loja P, Krivanek R, Grundmeier A, Dau H
(2006) Intermediates in assembly by photoactivation after
thermally accelerated disassembly of the manganese complex
of photosynthetic water oxidation. Biochemistry
45:14523–14532
Baumann HA, Morrison L, Stengel DB (2009) Metal accumulation
and toxicity measured by PAM-chlorophyll fluorescence in
Photosynth Res (2017) 132:13–66 51
123

seven species of marine macroalgae. Ecotoxicol Environ Safe
72:1063–1075
Bauwe H, Hagemann M, Fernie A (2010) Photorespiration: players,
partners and origin. Trends Plant Sci 15:330–336
Beck WF, Brudvig GW (1987) Reactions of hydroxylamine with the
electron-donor side of photosystem II. Biochemistry
26:8285–8295
Belgio E, Kapitonova E, Chmeliov J, Duffy CDP, Ungerer P,
Valkunas L, Ruban AV (2014) Economic photoprotection in
photosystem II that retains a complete light-harvesting system
with slow energy traps. Nat Commun 5:4433. doi:10.1038/
ncomms5433
Bell DH, Hipkins MF (1985) Analysis of fluorescence induction
curves from pea chloroplasts: photosystem II reaction centre
heterogeneity. Biochim Biophys Acta 807:255–262
Bellafiore S, Barneche F, Peltier G, Rochaix J-D (2005) State
transitions and light adaptation require chloroplast thylakoid
protein kinase STN7. Nature 433:892–895
Belyaeva NE, Schmitt F-J, Paschenko VZ, Riznichenko GY, Rubin
AB (2015) Modeling of the redox state dynamics in photosystem
II of Chlorella pyrenoidosa Chick cells and leaves of spinach
and Arabidopsis thaliana from single flash-induced fluorescence
quantum yield changes on the 100 ns–10 s time scale. Photo-
synth Res 125:123–140
Bennett J (1977) Phosphorylation of chloroplast membrane polypep-
tides. Nature 269:344–346
Bennett J (1983) Regulation of photosynthesis by reversible phos-
phorylation of the light-harvesting chlorophyll a/b protein.
Biochem J 212:1–13
Bennett J, Shaw EK, Michel H (1988) Cytochrome b6f complex is
required for phosphorylation of light-harvesting chlorophyll a/b
complex II in chloroplast photosynthetic membranes. Eur J
Biochem 171:95–100
Bennoun P (2002) The present model for chlororespiration. Photo-
synth Res 73:273–277
Bennoun P, Li Y-S (1973) New results on the mode of action of 3,-
(3,4-dichlorophenyl)-1,1-dimethylurea in spinach chloroplasts.
Biochim Biophys Acta 292:162–168
Berden-Zrimec M, Drinovec L, Zrimec A (2011) Delayed fluores-
cence. In: Suggett DJ, Borowitzka M, Prasil O (eds) Chlorophyll
a fluorescence in aquatic sciences: methods and applications,
developments in applied phycology, vol 4. Springer, The
Netherlands, pp 293–309
Berger S, Sinha AK, Roitsch T (2007) Plant physiology meets
phytopathology: plant primary metabolism and plant-pathogen
interactions. J Exp Bot 58:4019–4026
Bernacchi CJ, Leakey ADB, Heady LE, Morgan PB, Dohleman FG,
McGrath JM, Gillespie GM, Wittig VE, Rogers A, Long SP, Ort
DR (2006) Hourly and seasonal variation in photosynthesis and
stomatal conductance of soybean grown at future CO2 and ozone
concentrations for 3 years under fully open-air field conditions.
Plant Cell Environ 29:2077–2090
Betterle N, Ballotari M, Zorzan S, de Bianchi S, Cazzaniga S,
Dall’Osto L, Morosinotto T, Bassi R (2009) Light-induced
dissociation of an antenna hetero-oligomer is needed for non-
photochemical quenching induction. J Biol Chem
284:15255–15266
Bielczynski LW, Schansker G, Croce R (2016) Effect of light
acclimation on the organization of photosystem II super and sub-
complexes in Arabidopsis thaliana. Front Plant Sci. doi:10.3389/
fpls.2016.00105
Bjorkman O, Demmig-Adams B (1995) Regulation of photosynthetic
light energy capture, conversion, and dissipation in leaves of
higher plants. In: Schulze ED, Caldwell MM (eds) Ecophysiol-
ogy of photosynthesis. Springer, Berlin, pp 17–47
Blubaugh DJ, Cheniae GM (1990) Kinetics of photoinhibition in
hydroxylamine-extracted photosystem II membranes: relevance
to photoactivation and site of electron donation. Biochemistry
29:5109–5118
Bock A, Krieger-Liszkay A, Ortiz de Zarate IB, Schonknecht G
(2001) Cl—channel inhibitors of the arylaminobenzoate type act
as photosystem II herbicides: a functional and structural study.
Biochemistry 40:3273–3281
Bode S, Quentmeier CC, Liao P-N, Hafi N, Barros T, Wilk L, Bittner
F, Walla PJ (2009) On the regulation of photosynthesis by
excitonic interactions between carotenoids and chlorophylls.
Proc Natl Acad Sci USA 106:12311–12316
Boekema EJ, Van Roon H, Van Breemen JFL, Dekker JP (1999)
Supramolecular organization of photosystem II and its light-
harvesting antenna in partially solubilized photosystem II
membranes. Eur J Biochem 266:444–452
Bolhar-Nordenkampf HR, Long SP, Baker NR, Oquist G, Schreiber
U, Lechner EG (1989) Chlorophyll fluorescence as a probe of the
photosynthetic competence of leaves in the field: a review of
current Instrumentation. Funct Ecol 3:497–514
Bonaventura C, Myers J (1969) Fluorescence and oxygen evolution
from Chlorella pyrenoidosa. Biochim Biophys Acta 189:366–383
Bonfig KB, Schreiber U, Gabler A, Roitsch T, Berger S (2006)
Infection with virulent and avirulent P. syringae strains differ-
entially affects photosynthesis and sink metabolism in Ara-
bidopsis leaves. Planta 225:1–12
Bouges-Bocquet B (1980) Kinetic models for the electron donors of
photosystem II of photosynthesis. Biochim Biophys Acta
594:85–103
Bradbury M, Baker NR (1981) Analysis of the slow phases of the
in vivo chlorophyll fluorescence induction curve; changes in the
redox state of photosystem II electron acceptors and fluorescence
emission from photosystem I and II. Biochim Biophys Acta
635:542–551
Brestic M, Zivcak M (2013) PSII fluorescence techniques for
measurement of drought and high temperature stress signal in
crop plants: protocols and applications. In: Das AB, Rout GR
(eds) Molecular stress physiology of plants. Springer, New
Dehli, pp 87–131
Brestic M, Cornic G, Fryer MJ, Baker NR (1995) Does photorespi-
ration protect the photosynthetic apparatus in French bean leaves
from photoinhibition during drought stress? Planta 196:450–457
Brestic M, Zivcak M, Kalaji HM, Allakhverdiev SI, Carpentier R
(2012) Photosystem II thermo-stability in situ: environmentally
induced acclimation and genotype-specific reactions in Triticum
aestivum L. Plant Physiol Biochem 57:93–105
Brody SS, Rabinowitch E (1957) Excitation lifetime of photosyn-
thetic pigments in vitro and in vivo. Science 125:555–563
Brudvig GW, Casey JL, Sauer K (1983) The effect of temperature on
the formation and decay of the multiline EPR signal species
associated with photosynthetic oxygen evolution. Biochim
Biophys Acta 723:366–371
Bukhov NG, Boucher N, Carpentier R (1997) The correlation
between the induction kinetics of the photoacoustic signal and
chlorophyll fluorescence in barley leaves is governed by changes
in the redox state of the photosystem II acceptor side; a study
under atmospheric and high CO2 concentrations. Can J Bot
75:1399–1406
Bukhov N, Egorova E, Krendeleva T, Rubin A, Wiese C, Heber U (2001)
Relaxation of variable chlorophyll fluorescence after illumination
of dark-adapted barley leaves as influenced by the redox states of
electron carriers. Photosynth Res 70:155–166
Buschmann C, Koscanyi L (1989) Light-induced heat production
correlated with chlorophyll fluorescence and its quenching.
Photosynth Res 21:129–136
52 Photosynth Res (2017) 132:13–66
123

Bussotti F (2004) Assessment of stress conditions in Quercus ilex L.
leaves by O-J-I-P chlorophyll a fluorescence analysis. Plant
Biosystems 13:101–109
Bussotti F, Agati G, Desotgiu R, Matteini P, Tani C (2005) Ozone
foliar symptoms in woody plants assessed with ultrastructural
and fluorescence analysis. New Phytol 166:941–955
Bussotti F, Desotgiu R, Cascio C, Pollastrini M, Gravano E, Gerosa
G, Marzuoli R, Nali C, Lorenzini G, Salvatori E, Manes F,
Schaub M, Strasser RJ (2011a) Ozone stress in woody plants
assessed with chlorophyll a fluorescence. A critical reassessment
of existing data. Environ Exp Bot 73:19–30
Bussotti F, Pollastrini M, Cascio C, Desotgiu R, Gerosa G, Marzuoli
R, Nali C, Lorenzini G, Pellegrini E, Carucci MG, Salvatori E,
Fusaro L, Piccotto M, Malaspina P, Manfredi A, Roccotello E,
Toscano S, Gottardini E, Cristofori A, Fini A, Weber D,
Baldassarre V, Barbanti L, Monti A, Strasser RJ (2011b)
Conclusive remarks. Reliability and comparability of chloro-
phyll fluorescence data from several field teams. Environ Exp
Bot 73:116–119
Butler WL (1978) Energy distribution in the photochemical apparatus
of photosynthesis. Annu Rev Plant Physiol 29:345–378
Byrdin M, Rimke I, Schlodder E, Stehlik D, Roelofs TA (2000)
Decay kinetics and quantum yields of fluorescence in photosys-
tem I from Synechococcus elongatus with P700 in the reduced
and oxidized state: Are the kinetics of excited state decay trap-
limited or transfer-limited? Biophys J 79:992–1007
Caffarri S, Croce R, Cattivelli L, Bassi R (2004) A look within
LHCII: differential analysis of the Lhcb1-3 complexes building
the major trimeric antenna complex of higher-plant photosyn-
thesis. Biochemistry 43:9467–9476
Calatayud A, Ramirez JW, Iglesias DJ, Barreno E (2002) Effects of
ozone on photosynthetic CO2 exchange, chlorophyll a fluores-
cence and antioxidant systems in lettuce leaves. Physiol Plant
116:308–316
Cascio C, Schaub M, Novak K, Desotgiu R, Bussotti F, Strasser RJ
(2010) Foliar responses to ozone of Fagus sylvatica L. seedlings
grown in shaded and in full sunlight conditions. Environ Exp Bot
68:188–197
Cazzaniga S, Dall’Osto L, Kong S-G, Wada M, Bassi R (2013)
Interaction between avoidance of photon absorption, excess
energy dissipation and zeaxanthin synthesis against photooxida-
tive stress in Arabidopsis. Plant J 76:568–579
Ceppi MG, Oukarroum A, Cicek N, Strasser RJ, Schansker G (2012)
The IP amplitude of the fluorescence rise OJIP is sensitive to
changes in the photosystem I content of leaves: a study on plants
exposed to magnesium and sulfate deficiencies, drought stress
and salt stress. Physiol Plant 144:277–288
Chaudhary N, Singh S, Agrawal SB, Agrawal M (2013) Assessment
of six Indian cultivars of mung bean against ozone by using
foliar injury index and changes in carbon assimilation, gas
exchange, chlorophyll fluorescence and photosynthetic pig-
ments. Environ Monit Assess 185:7793–7807
Chen J, Kell A, Acharya K, Kupitz C, Fromme P, Jankowiak R (2015)
Critical assessment of the emission spectra of various photosys-
tem II core complexes. Photosynth Res 124:253–265
Cheng L, Fuchigami LH, Breen PJ (2000) Light absorption and
partitioning in relation to nitrogen content ‘Fuji’ apple leaves.
J Am Soc Hortic Sci 125:581–587
Choi CJ, Berges JA, Young EB (2012) Rapid effects of diverse toxic
water pollutants on chlorophyll a fluorescence: variable responses
among freshwater microalgae. Water Res 46:2615–2626
Chow WS, Aro EM (2005) Photoinactivation and mechanisms of
recovery. In: Wydrzynski T, Satoh K (eds) Photosystem II: the
light-driven water: plastoquinone oxidoreductase, advances in
photosynthesis and respiration, vol 22. Springer, Dordrecht,
pp 627–648
Chow WS, Fan DY, Oguchi R, Jia H, Losciale P, Youn-Il P, He J,
Oquist G, Shen YG, Anderson JM (2012) Quantifying and
monitoring functional photosystem II and the stoichiometry of
the two photosystems in leaf segments: approaches and approx-
imations. Photosynth Res 113:63–74
Christensen MG, Teicher HB, Streibig JC (2003) Linking fluores-
cence induction curve and biomass in herbicide screening. Pest
Manag Sci 59:1303–1310
Codrea CM, Aittokallio T, Keranen M, Tyystjarvi E, Nevalainen OS
(2003) Feature learning with a genetic algorithm for fluorescence
fingerprinting of plant species. Pattern Recognit Lett
24:2663–2673
Conjeaud H, Mathis P (1980) The effect of pH on the reduction
kinetics of P-680 in tris-treated chloroplasts. Biochim Biophys
Acta 590:353–359
Conrad R, Buchel C, Wilhelm C, Arsalane W, Berkaloff C, Duval JC
(1993) Changes in yield of in-vivo fluorescence of chlorophyll a
as a tool for selective herbicide monitoring. J Appl Phycol
5:505–516
Cornic G, Massacci A (1996) Leaf photosynthesis under drought
stress. In: Baker NR (ed) Photosynthesis and the environment.
Kluwer Academic Publisher, Dordrecht, pp 347–366
Cornic G, Fresneau C (2002) Photosynthetic carbon reduction and
carbon oxidation cycles are the main electron sinks for
photosystems II during a mild drought. Ann Bot 89:887–894
Correia MJ, Chaves MMC, Pereira JS (1990) Afternoon depression in
photosynthesis in grapevine leaves—evidence for a high light
stress effect. J Exp Bot 41:417–426
Cotrozzi L, Remorini D, Pellegrini E, Landi M, Massai R, Nali C,
Guidi L, Lorenzini G (2016) Variations in physiological and
biochemical traits of oak seedlings grown under drought and
ozone stress. Physiol Plant 157:69–84
Croce R, Zucchelli G, Garlaschi FM, Bassi R, Jennings RC (1997)
Excited state equilibration in the photosystem I-light-harvesting
I complex: P700 is almost isoenergetic with its antenna.
Biochemistry 35:8572–8579
Cser K, Vass I (2007) Radiative and non-radiative charge recombi-
nation pathways in photosystem II studied by thermolumines-
cence and chlorophyll fluorescence in the cyanobacterium
Synechocystis 6308. Biochim Biophys Acta 1767:233–243
Czyczyło-Mysza I, Tyrka M, Marcinska Skrzypek E, Karbarz M,
Dziurka M, Hura T, Dziurka K, Quarrie SA (2013) Quantitative
trait loci for leaf chlorophyll fluorescence parameters, chloro-
phyll and carotenoid contents in relation to biomass and yield in
bread wheat and their chromosome deletion bin assignments.
Mol Breed 32:189–210
D’Haene SE, Sobotka R, Bucinska L, Dekker JP, Komenda J (2015)
Interaction of the PsbH subunit with a chlorophyll bound to
histidine 114 of CP47 is responsible for the red 77 K fluorescence
of Photosystem II. Biochim Biophys Acta 1847:1327–1334
Dang NC, Zazubovich V, Reppert M, Neupane B, Picorel R, Seibert
M, Jankowiak R (2008) The CP43 proximal antenna complex of
higher plant photosystem II revisited: modeling and hole burning
study. J Phys Chem B 112:9921–9933
Dau H (1994) Molecular mechanisms and quantitative models of
variable Photosystem II fluorescence. Photochem Photobiol60:1–23
Dau H, Sauer K (1992) Electric field effect on the picosecond
fluorescence of photosystem II and its relation to the energetics
and kinetics of primary charge separation. Biochim Biophys
Acta 1102:91–106
Dau H, Zaharieva I, Haumann M (2012) Recent developments in
research on water oxidation by photosystem II. Curr Opin Chem
Biol 16:3–10
de Wijn R, van Gorkom HJ (2001) Kinetics of electron transfer from
QA to QB in photosystem II. Biochemistry 40:11912–11922
Photosynth Res (2017) 132:13–66 53
123

de Wijn R, van Gorkom HJ (2002) The rate of charge recombination
in photosystem II. Biochim Biophys Acta 1553:302–308
Debus RJ (1992) The manganese and calcium ions of photosynthetic
oxygen evolution. Biochim Biophys Acta 1102:269–352
Degl’Innocenti E, Guidi L, Soldatini GF (2002) Characterization of
the photosynthetic response of tobacco leaves to ozone: CO2
assimilation and chlorophyll fluorescence. J Plant Physiol
159:845–853
Dell’Aquila AR, Van der Schoor R, Jalink H (2002) Application of
chlorophyll fluorescence in sorting controlled deteriorated white
cabbage (Brassica oleracea L.) seeds. Seed Sci Technol
30:689–695
Demeter S, Zs Rosza, Vass I, Sallai A (1985) Thermoluminescence
study of charge recombination in photosystem II at low
temperatures. I. Characterization of the Zv and A thermolumi-
nescence bands. Biochim Biophys Acta 809:369–378
Demeter S, Goussias Ch, Bernat G, Kovacs L, Petrouleas V (1993)
Participation of the g = 1.9 and g = 1.82 EPR forms of the
semiquinone-iron complex, QA-Fe2? of photosystem II in the
generation of the Q and C thermoluminescence bands, respec-
tively. FEBS Lett 336:352–356
Demetriou G, Neonaki C, Navakoudis E, Kotzabasis K (2007) Salt
stress impact on the molecular structure and function of the
photosynthetic apparatus—the protective role of polyamines.
Biochim Biophys Acta 1767:272–280
Demmig B, Winter K (1988) Characterisation of three components of
non-photochemical fluorescence quenching and their response to
photoinhibition. Aust J Plant Physiol 15:163–177
Demmig-Adams B, Adams WW III, Barker DH, Logan BA, Bowling
DR, Verhoeven AS (1996) Using chlorophyll fluorescence to
assess the fraction of absorbed light allocated to thermal
dissipation of excess excitation. Physiol Plant 98:253–264
Demmig-Adams B, Cohu CM, Muller O, Adams WW III (2012)
Modulation of photosynthetic energy conversion efficiency in
nature: from seconds to seasons. Photosynth Res 113:75–88
Demmig-Adams B, Garab G, Adams WW III, Govindjee (2014) Non-
photochemical quenching and energy dissipation in plants, algae
and cyanobacteria. Advances in photosynthesis and respiration,
vol 40. Springer, Dordrecht
Depege N, Bellafiore S, Rochaix J-D (2003) Role of chloroplast
protein kinase Stt7 in LHCII phosphorylation and state transition
in Chlamydomonas. Science 299:1572–1575
Desotgiu R, Cascio C, Pollastrini M, Gerosa G, Marzuoli R, Bussotti F
(2012a) Short and long term photosynthetic adjustments in sun and
shade leaves of Fagus sylvatica L., investigated by fluorescence
transient (FT) analysis. Plant Biosystems 146:206–216
Desotgiu R, Pollastrini M, Cascio C, Gerosa G, Marzuoli R, Bussotti
F (2012b) Chlorophyll a fluorescence analysis along a vertical
gradient of the crown in a poplar (Oxford clone) subjected to
ozone and water stress. Tree Physiol 32:976–986
Desotgiu R, Pollastrini M, Cascio C, Gerosa G, Marzuoli R, Bussotti
F (2013) Responses to ozone on Populus ‘‘Oxford’’ clone in an
open top chamber experiment assessed before sunrise and in full
sunlight. Photosynthetica 51:267–280
DeVault D, Govindjee, Arnold W (1983) Energetics of photosynthetic
glow peaks. Proc Natl Acad Sci USA 80:983–987
Dorigo U, Leboulanger C (2001) A pulse-amplitude modulated
fluorescence-based method for assessing the effects of photo-
system II herbicides on freshwater periphyton. J Appl Phycol
13:509–515
Doschek WW, Kok B (1972) Photon trapping in photosystem II of
photosynthesis; the fluorescence rise curve in the presence of
3-(3,4-dichlorophenyl)-1,1-dimethylurea. Biophys J 12:832–838
Ducruet JM (1999) Relation between the heat-induced increase of F0
fluorescence and a shift in the electronic equilibrium at the
acceptor side of photosystem 2. Photosynthetica 37:335–338
Ducruet J-M, Miranda T (1992) Graphical and numerical analysis of
thermoluminescence and fluorescence F0 emission in photosyn-
thetic material. Photosynth Res 33:15–27
Ducruet JM, Vavilin D (1999) Chlorophyll high-temperature ther-
moluminescence emission as an indicator of oxidative stress:
perturbating effects of oxygen and leaf water content. Free
Radical Res 31:S187–S192
Ducruet JM, Vass I (2009) Thermoluminescence: experimental.
Photosynth Res 101:195–204
Ducruet J-M, Peeva V, Havaux M (2007) Chlorophyll thermofluo-
rescence and thermoluminescence as complementary tools for
the study of temperature stress in plants. Photosynth Res
93:159–171
Duysens LNM, Sweers HE (1963) Mechanisms of two photochemical
reactions in algae as studied by means of fluorescence. In:
Mahlis L (ed) Studies on microalgae and photosynthetic bacteria,
special issue of plant cell physiol. Japanese Society of Plant
Physiologists, University of Tokyo Press, Tokyo, pp 353–372
Duysens LNM, Amesz J, Kamp BM (1961) Two photochemical
systems in photosynthesis. Nature 190:510–511
Ebenhoh O, Fucile G, Finazzi G, Rochaix J-D, Goldschmidt-
Clermont M (2014) Short-term acclimation of the photosynthetic
electron transfer chain to changing light: a mathematical model.
Philos Trans R Soc B 369:20130223
Edwards GE, Baker NR (1993) Can CO2 assimilation in maize leaves
be predicted accurately from chlorophyll fluorescence analysis?
Photosynth Res 37:89–102
Edwards G, Walker D (1983) C3, C4: mechanisms, and cellular and
environmental regulation, of photosynthesis. University of
California Press, California
Ehleringer J, Pearcy RW (1983) Variation in quantum yield for CO2
uptake among C3 and C4 plants. Plant Physiol 73:555–559
Eichelmann H, Talts E, Oja V, Padu E, Laisk A (2009) Rubisco in
planta kcat is regulated in balance with photosynthetic electron
transport. J Exp Bot 60:4077–4088
Emerson R, Lewis CM (1943) The dependence of the quantum yield
of Chlorella photosynthesis on wavelength of light. Am J Bot
30:165–178
Etienne A-L, Ducruet J-M, Ajlani G, Vernotte C (1990) Comparative
studies on electron transfer in photosystem II of herbicide-
resistant mutants from different organisms. Biochim Biophys
Acta 1015:435–440
Eyles A, Smith D, Pinkard EA, Smith I, Corkrey R, Elms S, Beadle C,
Mohammed C (2011) Photosynthetic responses of field-grown
Pinus radiata trees to artificial and aphid-induced defoliation.
Tree Physiol 31:592–603
Fai PB, Grant A, Reid B (2007) Chlorophyll a fluorescence as a
biomarker for rapid toxicity assessment. Environ Toxicol Chem
26:1520–1531
Faller P, Pascal A, Rutherford AW (2001) b-Carotene redox reactions
in photosystem II: electron transfer pathway. Biochemistry
40:6431–6440
Falster DS, Westoby M (2003) Leaf size and angle vary widely across
species: what consequences for light interception? New Phytol
158:509–525
Felle HH, Hanstein S, Steinmeyer R, Hedrich R (2000) Dynamics of
ionic activities in the apoplast of the sub-stomatal cavity of intact
Vicia faba leaves during stomatal closure evoked by ABA and
darkness. Plant J 24:297–304
Feller U, Crafts-Brandner SJ, Salvucci E (1998) Moderately high
temperatures inhibit ribulose-1,5-bisphosphate carboxylase/oxy-
genase activase mediated activation of Rubisco. Plant Physiol
116:539–546
Ferroni L, Baldisserotto C, Giovanardi M, Pantaleoni L, Morosinotto
T, Pancaldi S (2011) Revised assignment of room-temperature
chlorophyll fluorescence emission bands in single living cells of
54 Photosynth Res (2017) 132:13–66
123

Chlamydomonas reinhardtii. J Bioenergy Biomembr
43:163–173
Ferroni L, Pantaleoni L, Baldisserotto C, Aro EM, Pancaldi S (2013)
Low photosynthetic activity is linked to changes in the
organization of photosystem II in the fruit of Arum italicum.
Plant Physiol Biochem 63:140–150
Ferroni L, Angeleri M, Pantaleoni L, Pagliano C, Longoni P, Marsano
F, Aro EM, Suorsa M, Baldisserotto C, Giovanardi M, Cella R,
Pancaldi S (2014) Light-dependent reversible phosphorylation of
the minor photosystem II antenna Lhcb6 (CP24) occurs in
lycophytes. Plant J 77:893–905
Ferroni L, Suorsa M, Aro EM, Baldisserotto C, Pancaldi S (2016)
Light acclimation in the lycophyte Selaginella martensii depends
on changes in the amount of photosystems and on the flexibility
of LHCII antenna association to both photosystems. New Phytol
211:554–568
Flexas J, Medrano H (2002) Energy dissipation in C3 plants under
drought. Funct Plant Biol 29:1209–1215
Flexas J, Escalona JM, Medrano H (1999) Water stress induces
different levels of photosynthesis and electron transport rate
regulation in grapevines. Plant Cell Environ 22:39–48
Flexas J, Escalona JM, Evain S, Gulıas J, Moya I, Osmond CB,
Medrano H (2002) Steady-state chlorophyll fluorescence (Fs)
measurements as a tool to follow variations of net CO2
assimilation and stomatal conductance during water-stress in
C3 plants. Physiol Plant 114:231–240
Flood PJ, Harbinson J, Aarts MGM (2011) Natural genetic variation
in plant photosynthesis. Trends Plant Sci 16:327–335
Foyer CH, Noctor G (2009) Redox regulation in photosynthetic
organisms: signaling, acclimation, and practical implications.
Antioxid Redox Signal 11:861–905
Fracheboud Y, Leipner J (2003) The application of chlorophyll
fluorescence to study light, temperature, and drought stress. In:
DeEll JR, Toivonen PMA (eds) Practical applications of
chlorophyll fluorescence in plant biology. Kluwer Academic
Publishers, Dordrecht, pp 125–150
Fracheboud Y, Ribaut J-M, Vargas M, Messmer R, Stamp P (2002)
Identification of quantitative trait loci for cold-tolerance of
photosynthesis in maize (Zea mays L.). J Exp Bot 53:1967–1977
Fracheboud Y, Jompuk C, Ribaut JM, Stamp P, Leipner J (2004)
Genetic analysis of cold-tolerance of photosynthesis in maize.
Plant Mol Biol 56:241–253
Franck F, Juneau P, Popovich R (2002) Resolution of the photosystem I
and photosystem II contributions to chlorophyll fluorescence of intact
laves at room temperature. Biochim Biophys Acta 1556:239–246
Franco AC, Herzog B, Hubner C, de Mattos EA, Scarano FR, Ball E,
Luttge U (1999) Diurnal changes in chlorophyll a fluorescence,
CO2-exchange and organic acid decarboxylation in the tropical
CAM tree Clusia hilariana. Tree Physiol 19:635–644
Froux F, Ducrey M, Epron D, Dreyer E (2004) Seasonal variations
and acclimation potential of the thermostability of photochem-
istry in four Mediterranean conifers. Ann For Sci 61:235–241
Fuerst EP, Nakatani HY, Dodge AD, Penner D, Arntzen CJ (1985)
Paraquat resistance in conyza. Plant Physiol 77:984–989
Fufezan C, Rutherford AW, Krieger-Liszkay A (2002) Singlet oxygen
production in herbicide-treated photosystem II. FEBS Lett
532:407–410
Gaevsky NA, Morgun VN (1993) Use of variable and delayed
chlorophyll fluorescence for the study of plant photosynthesis.
Fiziol Rast 40:136–145 [in Russian]Garcıa-Plazaola JI, Faria T, Abaıa J, Abadıa A, Chaves MM, Pereira
JS (1997) Seasonal changes in xanthophyll composition and
photosynthesis of cork oak (Quercus suber L.) leaves under
mediterranean climate. J Exp Bot 48:1667–1674
Garnier J, Maroc J, Guyon D (1986) Low-temperature fluorescence
emission spectra and chlorophyll-protein complexes in mutants
of Chlamydomonas reinhardtii: evidence for a new chlorophyll-
a-protein complex related to photosystem I. Biochim Biophys
Acta 85:395–406
Genty B, Harbinson J (2004) The regulation of light utilization for
photosynthetic electron transport. In: Baker NR (ed) Photosyn-
thesis and environment. Advances in photosynthesis and respi-
ration, vol 5. Kluwer Academic Publisher, Dordrecht, pp 67–99
Genty B, Briantais J-M, Baker NR (1989) The relationship between
the quantum yield of photosynthetic electron transport and
quenching of chlorophyll fluorescence. Biochim Biophys Acta
990:87–92
Genty B, Harbinson J, Baker NR (1990a) Relative quantum
efficiencies of the two photosystems of leaves in photorespira-
tory and non-photorespiratory conditions. Plant Physiol Biochem
28:1–10
Genty B, Wonders J, Baker NR (1990b) Non-photochemical
quenching of FO in leaves is emission wavelength dependent.
Consequences for quenching analysis and its interpretation.
Photosynth Res 26:133–139
Gibasiewicz K, Croce R, Morosinotto T, Ihalainen JA, van Stokkum
IHM, Dekker JP, Bassi R, van Grondelle R (2005) Excitation
energy transfer pathways in Lhca4. Biophys J 88:1959–1969
Gilmore AM, Shinkarev VP, Hazlett TL, Govindjee (1998) Quanti-
tative analysis of the effects of intrathylakoid pH and xantho-
phyll cycle pigments on chlorophyll a fluorescence lifetime
distributions and intensity in thylakoids. Biochemistry
37:13582–13593
Gitelson AA, Buschmann C, Lichtenthaler HK (1998) Leaf chloro-
phyll fluorescence corrected for re-absorption by means of
absorption and reflectance measurements. J Plant Physiol
152:283–296
Goldschmidt-Clermont M, Bassi R (2015) Sharing light between two
photosystems: mechanism of state transitions. Curr Opin Plant
Biol 25:71–78
Goltsev V, Yordanov I (1997) Mathematical model of prompt and
delayed chlorophyll fluorescence induction kinetics. Photosyn-
thetica 33:571–586
Goltsev V, Zaharieva I, Lambrev P, Yordanov I, Strasser R (2003)
Simultaneous analysis of prompt and delayed chlorophyll
a fluorescence in leaves during the induction period of dark to
light adaptation. J Theor Biol 225:171–183
Goltsev V, Chernev P, Zaharieva I, Lambrev P, Strasser RJ (2005)
Kinetics of delayed chlorophyll a fluorescence registered in
milliseconds time range. Photosynth Res 84:209–215
Goltsev V, Zaharieva I, Chernev P, Strasser RJ (2009) Delayed
fluorescence in photosynthesis. Photosynth Res 101:217–232
Goltsev V, Zaharieva I, Chernev P, Kouzmanova M, Kalaji H,
Yordanov I, Krasteva V, Alexandrov V, Stefanov D, Allakh-
verdiev S, Strasser RJ (2012) Drought-induced modifications of
photosynthetic electron transport in intact leaves: analysis and
use of neural networks as a tool for a rapid non-invasive
estimation. Biochim Biophys Acta 1817:1490–1498
Gorbe E, Calatayud A (2012) Applications of chlorophyll fluores-
cence imaging technique in horticultural research: a review. Sci
Hortic 138:24–35
Gorbunov MY, Kolber ZS, Falkowski PG (1999) Measuring photo-
synthetic parameters in individual algal cells by fast repetition
rate fluorometry. Photosynth Res 62:141–153
Govindjee, Jursinic PA (1979) Photosynthesis and fast changes in
light emission by green plants. In: Smith KC (ed) Photochemical
and photobiological reviews, vol 4. Plenum Press, New York,
pp 125–205
Govindjee (1995) Sixty years since Kautsky: chlorophyll a fluores-
cence. Aust J Plant Physiol 22:131–160
Govindjee (1999) On the requirement of minimum number of four
versus eight quanta of light for the evolution of one molecule of
Photosynth Res (2017) 132:13–66 55
123

oxygen in photosynthesis: a historical note. Photosynth Res
59:249–254
Govindjee, Papageorgiou G (1971) Chlorophyll fluorescence and
photosynthesis: fluorescence transients. Photophysiol 6:1–50
Govindjee R, Rabinowitch E, Govindjee (1968) Maximum quantum
yield and action spectrum of photosynthesis and fluorescence in
Chlorella. Biochim Biophys Acta 162:539–544
Govindjee, Amesz J, Fork DJ (1986) Light emission by plants and
bacteria. Academic Press, New York
Grabolle M, Dau H (2005) Energetics of primary and secondary
electron transfer in photosystem II membrane particles of
spinach revisited on basis of recombination-fluorescence mea-
surements. Biochim Biophys Acta 1708:209–218
Grabolle M, Dau H (2007) Efficiency and role of loss processes in
light-driven water oxidation by PSII. Physiol Plant 131:50–63
Greaves JA, Wilson JM (1987) Chlorophyll fluorescence analysis—
an aid to plant breeders. Biologist 34:209–214
Grieco M, Tikkanen M, Paakkarinen V, Kangasjarvi S, Aro E-M
(2012) Steady-state phosphorylation of light-harvesting complex
II proteins preserves photosystem I under fluctuating white light.
Plant Physiol 160:1896–1910
Grieco M, Suorsa M, Jajoo A, Tikkanen M, Aro EM (2015) Light-
harvesting II antenna trimers connect energetically the entire
photosynthetic machinery—including both photosystems II and
I. Biochim Biophys Acta 1847:607–619
Groot ML, Frese RN, de Weerd FL, Bromek K, Petterson A,
Peterman EJG, van Stokkum IHM, van Grondelle R, Dekker JP
(1999) Spectroscopic properties of the CP43 core antenna
protein of photosystem II. Biophys J 77:3328–3340
Grouneva I, Jakob T, Wilhelm C, Goss R (2009) The regulation of
xanthophyll cycle activity and of non-photochemical fluores-
cence quenching by two alternative electron flows in the diatoms
Phaeodactylum tricornutum and Cyclotella meneghiniana.
Biochim Biophys Acta 1787:929–938
Guidi L, Calatayud A (2014) Non-invasive tools to estimate stress-
induced changes in photosynthetic performance in plants inhab-
iting Mediterranean areas. Environ Exp Bot 103:42–52
Guidi L, Nali C, Ciompi S, Lorenzini G, Soldatini GF (1997) The use
of chlorophyll fluorescence and leaf gas exchange as methods for
studying the different responses to ozone of two bean cultivars.
J Exp Bot 48:173–179
Guidi L, Tonini M, Soldatini GF (2000) Effects of high light and
ozone fumigation on photosynthesis in Phaseolus vulgaris. Plant
Physiol Biochem 38:717–725
Guidi L, Degl’Innocenti E, Giordano C, Biricolti S, Tattini M (2010)
Ozone tolerance in Phaseolus vulgaris depends on more than one
mechanism. Environ Pollut 158:3164–3171
Guidi L, Degl’Innocenti E, Remorini D, Biricolti S, Fini A, Ferrini F,
Nicese FP, Tattini M (2011) The impact of UV-radiation on the
physiology and biochemistry of Ligustrum vulgare exposed to
different visible-light irradiance. Environ Exp Bot 70:88–95
Guo P, Baum M, Varshney RK, Graner A, Grando S, Ceccarelli S
(2008) QTLs for chlorophyll and chlorophyll fluorescence
parameters in barley under post-flowering drought. Euphytica
163:203–214
Hall JL (2002) Cellular mechanisms for heavy metal detoxification
and tolerance. J Exp Bot 53:1–11
Harbinson J, Hedley CL (1993) Changes in P-700 oxidation during
the early stages of the induction of photosynthesis. Plant Physiol
103:649–660
Harbinson J, Rosenqvist E (2003) An introduction to chlorophyll
fluorescence. In: DeEll J, Toivonen PMA (eds) Practical
applications of chlorophyll fluorescence in plant biology. Kluwer
Academic Publishers, Dordrecht, pp 1–30
Harbinson J, Genty B, Foyer CH (1990) Relationship between
photosynthetic electron transport and stromal enzyme activity in
pea leaves toward an understanding of the nature of photosyn-
thetic control. Plant Physiol 94:545–553
Haynes D, Ralph P, Prange J, Dennison W (2000) The impact of the
herbicide diuron on photosynthesis in three species of tropical
seagrass. Mar Pollut Bull 41:288–293
Heber U, Walker D (1992) Concerning a dual function of coupled
cyclic electron transport in leaves. Plant Physiol 100:1621–1626
Heber U, Neimanis S, Dietz K-J (1988) Fractional control of
photosynthesis by the QB protein, the cytochrome f/b6 complex
and other components of the photosynthetic apparatus. Planta
173:267–274
Henriques FS (2009) Leaf chlorophyll fluorescence: background and
fundamentals for plant biologists. Bot Rev 75:249–270
Hermans C, Smeyers M, Maldonado-Rodriguez R, Eyletters M,
Strasser RJ, Delhaye P-J (2003) Quality assessment of urban
trees: a comparative study of physiological characterisation,
airborne imaging and on site fluorescence by the OJIP-test.
J Plant Physiol 160:81–90
Hess FD (2000) Light-dependent herbicides: an overview. Weed Sci
48:160–170
Hideg E, Schreiber U (2007) Parallel assessment of ROS formation
and photosynthesis in leaves by fluorescence imaging. Photo-
synth Res 92:103–108
Hideg E, Vass I (1993) The 75 �C thermoluminescence band of green
tissues: chemiluminescence from membrane-chlorophyll inter-
action. Photochem Photobiol 58:280–283
Hideg E, Sass L, Barbato R, Vass I (1993) Interaction of photosyn-
thetic oxygen evolution by UV-B irradiation: a thermolumines-
cence study. Photosynth Res 38:455–462
Hogewoning SW, Harbinson J (2007) Insights on the development,
kinetics, and variation of photoinhibition using chlorophyll
fluorescence imaging of a chilled, variegated leaf. J Exp Bot
58:453–463
Hogewoning SW, Wientjes E, Douwstra P, Trouwborst G, van
Ieperen W, Croce R, Harbinson J (2012) Photosynthetic quantum
yield dynamics: from photosystems to leaves. Plant Cell
24:1921–1935
Holzwarth AR, Miloslavina Y, Nilkens M, Jahns P (2009) Identifi-
cation of two quenching sites active in the regulation of
photosynthetic light-harvesting studied by time-resolved fluo-
rescence. Chem Phys Lett 483:262–267
Horton P, Hague A (1988) Studies on the induction of chlorophyll
fluorescence in isolated barley protoplasts: IV. Resolution of
nonphotochemical quenching. Biochim Biophys Acta 932:107–115
Hund A, Frascaroli E, Leipner J, Jompuk C, Stamp P, Fracheboud Y
(2005) Cold tolerance of the photosynthetic apparatus: pleio-
tropic relationship between photosynthetic performance and
specific leaf area of maize seedlings. Mol Breed 16:321–331
Ilık P, Schansker G, Kotabova E, Vaczi P, Strasser RJ, Bartak M
(2006) A dip in the chlorophyll fluorescence induction at 0.2–2 s
in Trebouxia-possessing lichens reflects a fast reoxidation of
photosystem I. A comparison with higher plants. Biochim
Biophys Acta 1757:12–20
Ioannidis N, Schansker G, Barynin VV, Petrouleas V (2000)
Interaction of nitric oxide with the oxygen evolving complex
of photosystem II and manganese catalase: a comparative study.
J Bioinorg Chem 5:354–363
Ishida A, Toma T, Marjenah (1999) Leaf gas exchange and
chlorophyll fluorescence in relation to leaf angle, azimuth, and
canopy position in the tropical pioneer tree, Macaranga conifer.
Tree Physiol 9:117–124
Itoh S, Murata N (1973) Correlation between delayed light emission
and fluorescence of chlorophyll a in system II particles derived
from spinach chloroplasts. Photochem Photobiol 18:209–218
Itoh S, Katoh S, Takamiya A (1971) Studies on the delayed light
emission in spinach chloroplasts; II. Participation of primary
56 Photosynth Res (2017) 132:13–66
123

electron donor and acceptor of photoreaction II in producing the
delayed light emission. Biochim Biophys Acta 245:121–128
Iwai M, Takahashi Y, Minagawa J (2008) Molecular remodeling of
photosystem II during state transitions in Chlamydomonas
reinhardtii. Plant Cell 20:2177–2189
Jahns P, Holzwarth AR (2012) The role of the xanthophyll cycle and
of lutein in photoprotection of photosystem II. Biochim Biophys
Acta 1817:182–193
Jalink H, Van der Schoor R, Frandas A, Van Pijlen JG (1998)
Chlorophyll fluorescence of Brassica oleracea seeds as a non-
destructive marker for seed maturity and seed performance. Seed
Sci Res 8:437–443
Jifon JL, Syvertsen JP (2003) Moderate shade can increase net gas
exchange and reduce photoinhibition in citrus leaves. Tree
Physiol 23:119–127
Johnson GN (2011) Physiology of PSI cyclic electron transport in
higher plants. Biochim Biophys Acta 1807:384–389
Johnson MP, Goral TK, Duffy CD, Brain AP, Mullineaux CW, Ruban
AV (2011) Photoprotective energy dissipation involves the
reorganization of photosystem II light-harvesting complexes in
the grana membranes of spinach chloroplasts. Plant Cell
23:1468–1479
Joliot A, Joliot P (1964) Etude cinetique de la reaction photochimique
liberant l’oxygene au cours de la photosynthese. C R Acad Sci
Paris 258:4622–4625
Joliot P, Joliot A (2002) Cyclic electron transfer in plant leaf. Proc
Natl Acad Sci USA 99:10209–10214
Joliot P, Joliot A, Bouges B, Barbieri G (1971) Studies of system II
photocenters by comparative measurements of luminescence,
fluorescence, and oxygen emission. Photochem Photobiol
14:287–305
Judy BM, Lower WR, Ireland FA, Krause GF (1991) A seedling
chlorophyll fluorescence toxicity assay. In: Gorsuch JW, Lower
WR, Lewis MA, Wang W (eds) Plants for toxicity assessment.
ASTM, Philadelphia, pp 146–158
Juneau P, Dewez D, Matsui S, Kim SG, Popovic R (2001) Evaluation
of different algal species sensitivity to mercury and metolachlor
by PAM-fluorometry. Chemosphere 45:589–598
Jung H-S, Niyogi KK (2009) Quantitative genetic analysis of thermal
dissipation in Arabidopsis. Plant Physiol 150:977–986
Jursinic P (1986) Delayed fluorescence: current concepts and status.
In: Amesz J, Fork DJ, Govindjee (eds) Light emission by plants
and bacteria. Academic Press, New York, pp 291–328
Jursinic P, Govindjee (1982) Effects of hydroxylamine and silico-
molybdate on the decay in delayed light emission in the
6–100 ls range after a single 10 ns flash in pea thylakoids.
Photosynth Res 3:161–177
Kalaji MH, Guo P (2008) Chlorophyll fluorescence: A useful tool in
barley plant breeding programs. In: Sanchez A, Gutierrez SJ
(eds) Photochemistry research progress. Nova Science Publish-
ers, New York, pp 439–463
Kalaji MH, Łoboda T (2007) Photosystem II of barley seedlings
under cadmium and lead stress. Plant Soil Environ 53:511–516
Kalaji MH, Pietkiewicz S (1993) Salinity effects on plant growth and
other physiological processes. Acta Physiol Plant 15:89–124
Kalaji MH, Pietkiewicz S (2004) Some physiological indices to be
exploited as a crucial tool in plant breeding. Plant Breed Seeds
Sci 49:19–39
Kalaji MH, Bosa K, Koscielniak J, Hossain Z (2011a) Chlorophyll
a fluorescence—a useful tool for the early detection of temper-
ature stress in spring barley (Hordeum vulgare L.). OMICS
15:925–934
Kalaji MH, Govindjee, Bosa K, Koscielniak J, _Zuk-Gołaszewska K
(2011b) Effects of salt stress on photosystem II efficiency and
CO2 assimilation of two Syrian barley landraces. Environ Exper
Bot 73:64–72
Kalaji MH, Carpentier R, Allakhverdiev SI, Bosa K (2012a)
Fluorescence parameters as early indicators of light stress in
barley. J Photochem Photobiol B 112:1–6
Kalaji MH, Govindjee, Goltsev V, Bosa K, Allakhverdiev SI, Strasser
R (2012b) Experimental in vivo measurements of light emission
in plants: a perspective dedicated to David Walker. Photosynth
Res 114:69–96
Kalaji MH, Oukarroum A, Alexandrov V, Kouzmanova M, Brestic
M, Zivcak M, Samborska IA, Cetner MD, Allakhverdiev SI,
Vasilij Goltsev V (2014a) Identification of nutrient deficiency in
maize and tomato plants by in vivo chlorophyll a fluorescence
measurements. Plant Physiol Biochem 81:16–25
Kalaji HM, Schansker G, Ladle RJ, Goltsev V, Bosa K, Allakhver-
diev SI, Brestic M, Bussotti F, Calatayud A, Dabrowski Elsheery
NI, Ferroni L, Guidi L, Hogewoning SW, Jajoo A, Misra AN,
Nebauer SG, Pancaldi S, Penella C, Poli DB, Pollastrini M,
Romanowska-Duda ZB, Rutkowska B, Serodio J, Suresh K,
Szulc W, Tambussi E, Yanniccari M, Zivcak M (2014b)
Frequently Asked Questions about chlorophyll fluorescence:
practical issues. Photosynth Res 122:121–158
Kalaji HM, Goltsev VN, _Zuk-Golaszewska K, Zivcak M, Brestic M
(2016) Application of Chlorophyll Fluorescence in Understand-
ing Plant Performance. CRC Press, Florida
Kana R, Spundova P, Ilık P, Lazar D, Klem K, Tomek P, Naus J,
Prasil O (2004) Effect of herbicide clomazone on photosynthetic
processes in primary barley (Hordeum vulgare L.) leaves. Pestic
Biochem Physiol 78:161–170
Karapetyan NV (2004) Interaction of pigment-protein complexes
within aggregates stimulates dissipation of excess energy.
Biochem (Moscow) 69:1299–1304
Karapetyan NV, Bolychevtseva YV, Yurina NP, Terekhova IV,
Shubin VV, Brecht M (2014) Long-wavelength chlorophylls in
photosystem I of cyanobacteria: origin, localization, and func-
tions. Biochem (Moscow) 79:213–220
Kasajima I, Takahara K, Kawai-Yamada M, Uchimiya H (2009)
Estimation of the relative sizes of rate constants for chlorophyll
de-excitation processes through comparison of inverse fluores-
cence intensities. Plant Cell Physiol 50:1600–1616
Katsumata M, Takeuchi A, Kazumura K, Koike T (2008) New feature
of delayed luminescence: preillumination-induced concavity and
convexity in delayed luminescence decay curve in the green alga
Pseudokirchneriella subcapitata. J Photochem Photobiol B
90:152–162
Kautsky H, Hirsch A (1931) Neue Versuche zur Kohlensaureassim-
ilation. Naturwissenschaften 19:964 [in German]Kautsky H, Appel W, Amann H (1960) Chlorophyllfluoreszenz und
Kohlensaure-assimilation: XIII. Die Fluoreszenzkurve und die
Photochemie der Pflanze. Biochem Z 322:277–292 [in German]Keranen M, Aro E-M, Tyystjarvi E (2003) Automatic plant identi-
fication with chlorophyll fluorescence fingerprinting. Precis
Agric 4:53–67
Kiani SP, Maury P, Sarrafi A, Grieu P (2008) QTL analysis of
chlorophyll fluorescence parameters in sunflower (Helianthus
annuus L.) under well-watered and water-stressed conditions.
Plant Sci 175:565–573
Kirchhoff H, Horstmann S, Weis E (2000) Control of the photosyn-
thetic electron transport by PQ diffusion microdomains in
thylakoids of higher plants. Biochim Biophys Acta
1459:148–168
Kirchhoff H, Hinz HJ, Rosgen J (2003) Aggregation and chlorophyll
a fluorescence quenching of the light harvesting complex II from
spinach in vitro. Biochim Biophys Acta 1606:105–116
Kirova M, Ceppi G, Chernev P, Goltsev V, Strasser R (2009) Using
artificial neural networks for plant taxonomic determination
based on chlorophyll fluorescence induction curves. Biotechnol
Biotechnol Equip 23:941–945
Photosynth Res (2017) 132:13–66 57
123

Klughammer C, Schreiber U (1994) An improved method, using
saturating light pulses, for the determination of photosystem I
quantum yield via P700?-absorbance changes at 830 nm. Planta
192:261–268
Knoetzel J, Bossmann B, Grimme H (1998) Chlorina and viridis
mutants of barley (Hordeum vulgare L.) allow assignment of
long-wavelength chlorophyll forms to individual Lhca proteins
of Photosystem I in vivo. FEBS Lett 436:339–342
Kok B, Forbush B, McGloin M (1970) Cooperation of charges in
photosynthetic O2 evolution; I. A linear four-step mechanism.
Photochem Photobiol 11:467–475
Komayama K, Khatoon M, Takenaka D, Horie J, Yamashita A,
Yoshioka M, Nakayama Y, Yoshida M, Ohira S, Morita N,
Velitchkova M, Enami I, Yamamoto Y (2007) Quality control of
photosystem II: cleavage and aggregation of heat-damaged D1
protein in spinach thylakoids. Biochim Biophys Acta
1767:838–846
Kong S-G, Wada M (2014) Recent advances in understanding the
molecular mechanism of chloroplast photorelocation movement.
Biochim Biophys Acta 1837:522–530
Konishi A, Eguchi A, Hosoi F, Omasa K (2009) 3D monitoring
spatio–temporal effects of herbicide on a whole plant using
combined range and chlorophyll a fluorescence imaging. Funct
Plant Biol 36:874–879
Konstantinova P, Van der Schoor R, van den Bulk RW, Jalink H
(2002) Chlorophyll fluorescence sorting as a method for
improvement of barley (Hordeum vulgare L.) seed health and
germination. Seed Sci Technol 30:411–421
Kopriva S, Rennenberg H (2004) Control of sulphate assimilation and
glutathione synthesis: interaction with N and C metabolism.
J Exp Bot 55:1831–1842
Kornyeyev D, Hendrickson L (2007) Energy partitioning in photo-
system II complexes subjected to photoinhibitory treatment.
Funct Plant Biol 34:214–220
Kornyeyev D, Guadagno CR, D’Ambrosio N (2013) Assessment of
energy partitioning in PSII complexes using chlorophyll fluo-
rescence: reviewing the different approaches toward the defini-
tion of a unified method. Photosynthetica 51:477–480
Kotakis C, Kyeridou A, Manetas Y (2014) Photosynthetic electron
flow during leaf senescence: evidence for a preferential main-
tenance of photosystem I activity and increased cyclic electron
flow. Photosynthetica 52:413–420
Krall JP, Edwards GE (1990) Quantum yields of photosystem II
electron transport and carbon dioxide fixation in C4 plants. Aust
J Plant Physiol 17:579–588
Krall JP, Edwards GE (1992) Relationship between photosystem II
activity and CO2 fixation in leaves. Physiol Plant 86:180–187
Kramer DM, Robinson HR, Crofts AR (1990) A portable multi-flash
kinetic fluorimeter for measurement of donor and acceptor
reactions of photosystems 2 in leaves of intact plants under field
conditions. Photosynth Res 26:181–193
Kramer DM, Sacksteder CA, Cruz JA (1999) How acidic is the
lumen? Photosynth Res 60:151–163
Kramer DM, Avenson TJ, Edwards GE (2004a) Dynamic flexibility
in the light reactions of photosynthesis governed by both
electron and proton transfer reactions. Trends Plant Sci
9:349–357
Kramer DM, Johnson G, Kiirats O, Edwards GE (2004b) New
fluorescence parameters for the determination of QA redox state
and excitation energy fluxes. Photosynth Res 79:209–218
Krause G, Weis E (1991) Chlorophyll fluorescence and photosynthe-
sis: the basics. Annu Rev Plant Physiol Plant Mol Biol
42:313–349
Krause GH, Vernotte C, Briantais J-M (1982) Photoinduced quench-
ing of chlorophyll fluorescence in intact chloroplasts and algae;
resolution into two components. Biochim Biophys Acta
679:116–124
Krausz E, Hughes JL, Smith PJ, Pace RJ, Peterson Arskold S (2005)
Assignment of the low-temperature fluorescence in oxygen-
evolving photosystem II. Photosynth Res 84:193–199
Krieger A, Weis E, Demeter S (1993) Low-pH-induced Ca2? ion
release in the water-splitting system is accompanied by a shift in
the midpoint redox potential of the primary quinone acceptor
QA. Biochim Biophys Acta 1144:411–418
Krieger-Liszkay A (2004) Singlet oxygen production in photosyn-
thesis. J Exp Bot 56:337–346
Krieger-Liszkay A, Rutherford AW (1998) Influence of herbicide
binding on the redox potential of the quinone acceptor in
photosystem II: relevance to photodamage and phytotoxicity.
Biochemistry 37:17339–17344
Krieger-Liszkay A, Fufezan C, Trebst A (2008) Singlet oxygen
production in photosystem II and related protetction mechanism.
Photosynth Res 98:551–564
Kromer S (1995) Respiration during photosynthesis. Annu Rev Plant
Physiol Plant Mol Biol 46:45–70
Ku MSB, Wu J, Dai Z, Scott RA, Chu C, Edwards GE (1991)
Photosynthetic and photorespiratory characteristics of Flaveria
species. Plant Physiol 96:518–528
Kuang TY, Argyroudi-Akoyunoglou JH, Nakatani HY, Watson J,
Arntzen CJ (1984) The origin of the long-wavelength fluores-
cence emission band (77 K) from photosystem I. Arch Biochem
Biophys 235:618–627
Kumar K, Dahms H, Lee J, Kim H, Lee W, Shin K (2014) Algal
photosynthetic responses to toxic metals and herbicides assessed
by chlorophyll a fluorescence. Ecotoxicol Environ Safety
104:51–71
Kvıderova J (2010) Rapid algal toxicity assay using variable
chlorophyll fluorescence for Chlorella kessleri (chlorophyta).
Environ Toxicol 25:554–563
Kyle DJ, Baker NR, Arntzen CJ (1983) Spectral characterization of
photosystem I fluorescence at room temperature using thylakoid
protein phosphorylation of Chlamydomonas reinhardtii. Photo-
biochem Photobiophys 5:71–78
Laisk A, Edwards GE (1998) Oxygen and electron flow in C4
photosynthesis: Mehler reaction, photorespiration and CO2
concentration in the bundle sheath. Planta 205:632–645
Laisk A, Oja V (1998) Dynamics of leaf photosynthesis. CSIRO
Publishing, Collingwood
Laisk A, Nedbal L, Govindjee (2009) Photosynthesis in Silico;
understanding complexity from molecules to ecosystems.
Advances in Photosynthesis and Respiration, vol 25. Springer,
Dordrecht
Lange OL, Losch R, Schulze E-D, Kappen L (1971) Responses of
stomata to changes in humidity. Planta 100:76–86
Larcher W (2000) Temperature stress and survival ability of
Mediterranean sclerophyllous plants. Plant Biosyst 134:279–295
Latimer P, Bannister TT, Rabinowitch E (1956) Quantum yields of
fluorescence of plant pigments. Science 124:585–586
Lavergne J, Trissl H-W (1995) Theory of fluorescence induction in
photosystem II: derivation of analytical expression in a model
including exciton-radical-pair equilibrium and restricted energy
transfer between photosynthetic units. Biophys J 68:2474–2492
Lavergne J, Bouchaud J-P, Joliot P (1992) Plastoquinone compart-
mentation in chloroplasts. II. Theoretical aspects. Biochim
Biophys Acta 1101:13–22
Lavorel J (1975) Luminescence. In: Govindjee (ed) Bioenergetics of
photosynthesis. Academic Press, New York, pp 223–317
Lavorel J, Lavergne J, Etienne AL (1982) A reflection of several
problems of luminescence in photosynthetic systems. Photo-
biochem Photobiophys 3:287–314
58 Photosynth Res (2017) 132:13–66
123

Law RD, Crafts-Brandner SJ (1999) Inhibition and acclimation of
photosynthesis to heat stress is closely correlated with activation
of ribulose-1,5-bisphosphate carboxylase/oxygenase. Plant Phys-
iol 120:173–181
Lazar D (1999) Chlorophyll a fluorescence induction. Biochim
Biophys Acta 1412:1–28
Lazar D (2003) Chlorophyll a fluorescence rise induced by high light
illumination of dark-adapted plant tissue studied by means of a
model of photosystem II and considering photosystem II
heterogeneity. J Theor Biol 220:469–503
Lazar D (2006) The polyphasic chlorophyll a fluorescence rise
measured under high intensity of exciting light. Funct Plant Biol
33:9–30
Lazar D (2013) Simulations show that a small part of variable
chlorophyll a fluorescence originates in photosystem I and
contributes to overall fluorescence rise. J Theor Biol
335:249–264
Lazar D (2015) Parameters of photosynthetic energy partitioning.
J Plant Physiol 175:131–147
Lazar D (2016) A word or two about chlorophyll fluorescence and its
relation to photosynthesis research; a text for Ph.D. students.
doi:10.13140/RG.2.1.4243.0329
Lazar D, Ilık P (1997) High-temperature induced chlorophyll
fluorescence changes in barley leaves; comparison of the critical
temperatures determined from fluorescence induction and from
fluorescence temperature curve. Plant Sci 124:159–164
Lazar D, Naus J (1998) Statistical properties of chlorophyll fluores-
cence induction parameters. Photosynthetica 35:121–127
Lazar D, Pospısil P (1999) Mathematical simulation of chlorophyll
a fluorescence rise measured with 3-(30,40-dichlorophenyl)-1,1-
dimethylurea-treated barley leaves at room and high tempera-
tures. Eur Biophys J 28:468–477
Lazar D, Schansker G (2009) Models of chlorophyll a fluorescence
transients. In: Laisk A, Nedbal L, Govindjee (eds) Photosynthe-
sis in silico; understanding complexity from molecules to
ecosystems. Advances in photosynthesis and respiration, vol
25. Springer, Dordrecht, pp 85–123
Lazar D, Ilık P, Naus J (1997a) An appearance of K-peak in
fluorescence induction depends on the acclimation of barley
leaves to higher temperatures. J Luminesc 72–74:595–596
Lazar D, Naus J, Matouskova M, Flasarova M (1997b) Mathematical
modeling of changes in chlorophyll fluorescence induction
caused by herbicides. Pest Biochem Physiol 57:200–210
Lazar D, Brokes M, Naus J, Dvorak L (1998) Mathematical
modelling of 3-(30,40-dichlorophenyl)-1,1-dimethylurea action
in plant leaves. J Theor Biol 191:79–86
Lazar D, Tomek P, Ilık P, Naus J (2001) Determination of the antenna
heterogeneity of Photosystem II by direct simultaneous fitting of
several fluorescence rise curves measured with DCMU at
different light intensities. Photosynth Res 68:247–257
Lazar D, Susila P, Naus J (2005) Statistical properties of parameters
evaluated from the O-J-I-P chlorophyll a fluorescence transients
and their change upon high temperature stress. In: van Est A,
Bruce D (eds) Photosynthesis: fundamental aspects to global
perspectives. Allen Press, Lawrence, pp 563–566
Legendre P, Legendre L (2012) Numerical ecology, vol 3. Elsevier,
Amsterdam
Leipner J, Oxborough K, Baker NR (2001) Primary sites of ozone-
induced perturbations of photosynthesis in leaves: identification
and characterization in Phaseolus vulgaris using high resolution
chlorophyll fluorescence imaging. J Exp Bot 52:1689–1696
Leustek T, Martin MN, Bick J-A, Davies JP (2000) Pathways and
regulation of sulfur metabolism revealed through molecular and
genetic studies. Annu Rev Plant Physiol Plant Mol Biol
51:141–165
Lewis S, Donkin ME, Depledge MH (2001) Hsp70 expression in
Enteromorpha intestinalis (Chlorophyta) exposed to environ-
mental stress. Aquat Bot 51:277–291
Lichtenthaler HK (1988) Applications of chlorophyll fluorescence.
Kluwer Academic, Dordrecht
Lichtenthaler HK (2013) Chlorophyll fluorescence kinetics, photo-
synthetic activity, and pigment composition of blue-shade and
half-shade leaves as compared to sun and shade leaves of
different trees. Photosynth Res 117:355–366
Lichtenthaler HK, Buschmann C, Doll M, Fietz HJ, Bach T, Kozel U,
Meier D, Rahmsdorf U (1981) Photosynthetic activity, chloro-
plast ultrastructure, and leaf characteristics of high-light and
low-light plants and of sun and shade leaves. Photosynth Res
2:115–141
Lichtenthaler HK, Buschmann C, Rinderle U, Schmuck G (1986)
Application of chlorophyll fluorescence in ecophysiology.
Radiat Environmental Biophys 25:297–308
Lichtenthaler HK, Buschmann C, Knapp M (2005a) How to correctly
determine the different chlorophyll fluorescence parameters and
the chlorophyll fluorescence decrease ratio RFd of leaves with the
PAM fluorometer. Photosynthetica 43:379–393
Lichtenthaler HK, Langsdorf G, Lenk S, Buschmann C (2005b)
Chlorophyll fluorescence imaging of photosynthetic activity with
the flash-lamp fluorescence imaging system. Photosynthetica
43:355–369
Lichtenthaler HK, Ac A, Marek MV, Kalina J, Urban O (2007)
Differences in pigment composition, photosynthetic rates and
chlorophyll fluorescence images of sun and shade leaves of four
tree species. Plant Physiol Biochem 45:577–588
Logan BA, Adams WW, Demmig-Adams B (2007) Viewpoint:
avoiding common pitfalls of chlorophyll fluorescence analysis
under field conditions. Funct Plant Biol 34:853–859
Long SP, Humphries S (1994) Photoinhibition of photosynthesis in
nature. Annu Rev Plant Physiol Plant Mol Biol 45:633–662
Long SP, Ainsworth EA, Leakey ADB, Nosberger J, Ort DR (2006)
Food for thought: lower-than-expected crop yield stimulation
with rising CO2 concentrations. Science 312:1918–1921
Losciale P, Oguchi R, Hendrickson L, Hope AB, Corelli Grappadelli
L, Chow WS (2008) A rapid, whole-tissue determination of the
functional fraction of photosystem II after photoinhibition of
leaves based on flash-induced P700 redox kinetics. Physiol Plant
132:23–32
Losciale P, Chow WS, Corelli Grappadelli L (2010) Modulating the
light environment with the peach ‘asymmetric orchard’: effects
on gas exchange performances, photoprotection, and photoinhi-
bition. J Exp Bot 61:1177–1192
Losciale P, Manfrini L, Morandi B, Pierpaoli E, Zibordi M, Stellaci
AM, Salvati L, Grappadelli LC (2015) A multivariate approach
for assessing leaf photo-assimilation performance using the IPL
index. Physiol Plant 154:609–620
Lu C, Zhang J (1998) Effects of water stress on photosynthesis,
chlorophyll fluorescence and photoinhibition in wheat plants.
Aust J Plant Physiol 25:883–892
Lu C, Zhang J (1999) Effects of water stress on photosystem II
photochemistry and its thermostability in wheat plants. J Exp Bot
50:1199–1206
Lu Q, Lu C, Zhang J, Kuang T (2002) Photosynthesis and chlorophyll
a fluorescence during flag leaf senescence of field-grown wheat
plants. J Plant Physiol 159:1173–1178
Lunde C, Jensen PE, Haldrup A, Knoetzel J, Scheller HV (2000) The
PSI-H subunit of photosystem I is essential for state transitions in
plant photosynthesis. 408:613–615
Macinnis-Ng CMO, Ralph PJ (2003) Short-term response and
recovery of Zostera capricorni photosynthesis after herbicide
exposure. Aqua Bot 76:1–15
Photosynth Res (2017) 132:13–66 59
123

Maldonado-Rodriguez R, Pavlov S, Gonzalez A, Oukarroum A,
Strasser RJ (2003) Can machines recognise stress in plants?
Environ Chem Lett 1:201–205
Malenovsky Z, Mishra KB, Zemek F, Rascher U, Nedbal L (2009)
Scientific and technical challenges in remote sensing of plant
canopy reflectance of fluorescence. J Exp Bot 60:2987–3004
Malkin S (1966) Fluorescence induction studies in isolated chloro-
plasts. I. Kinetic analysis of the fluorescence intensity depen-
dence on time. Biochim Biophys Acta 126:433–442
Malkin S (1979) Delayed luminescence. In: Trebst A, Avron M (eds)
Photosynthesis I. Photosynthetic Electron Transport and Pho-
tophosphorylation. Academic Press, New York, pp 473–491
Malkin S, Barber J (1978) Induction patterns of delayed luminescence
from isolated chloroplasts. I. Response of delayed luminescence
to changes in the prompt fluorescence yield. Biochim Biophys
Acta 502:524–541
Malkin S, Bilger W, Schreiber U (1994) The relationship between
millisecond luminescence and fluorescence in tobacco leaves
during the induction period. Photosynth Res 39:57–66
Mar T, Brebner J, Roy G (1975) Induction kinetics of delayed light
emission in spinach chloroplasts. Biochim Biophys Acta
376:345–353
Martınez-Ferri E, Manrique E, Valladares F, Balaguer L (2004)
Winter photoinhibition in the field involves different processes
in four co-occurring Mediterranean tree species. Tree Physiol
24:981–990
Marwood CA, Solomon KR, Greenberg BM (2001) Chlorophyll
fluorescence as a bioindicator of effects on growth in aquatic
macrophytes from mixtures of polycyclic aromatic hydrocar-
bons. Environ Toxicol Chem 20:890–898
Matsubara S, Chow WS (2004) Population of photoinactivated
Photosystem II reaction centers characterized by chlorophyll
a fluorescence lifetime in vivo. Proc Natl Acad Sci USA
101:18234–18239
Matsubara S, Chen Y-C, Caliandro R, Govindjee, Clegg RM (2011)
Photosystem II fluorescence lifetime imaging in avocado leaves:
contributions of the lutein-epoxide and violaxanthin cycles to
fluorescence quenching. J Photochem Photobiol B 104:271–284
Maxwell K, Johnson GN (2000) Chlorophyll fluorescence—a prac-
tical guide. J Exp Bot 51:659–668
McCormac DJ, Bruce D, Greenberg BM (1994) State transitions,
light-harvesting antenna phosphorylation and light-harvesting
antenna migration in vivo in the higher plant Spirodela
oligorrhiza. Biochim Biophys Acta 1187:301–312
McCree KJ (1972) The action spectrum, absorptance and quantum
yield of photosynthesis in crop plants. Agric Meteorol
9:191–216
Medrano H, Escalona JM, Bota J, Gulıas J, Flexas J (2002)
Regulation of photosynthesis of C3 plants in response to
progressive drought: stomatal conductance as a reference
parameter. Ann Bot 89:895–905
Melgar JC, Guidi L, Remorini Agati G, Degl’Innocenti E, Castelli S,
Baratto MC, Faraloni C, Tattini M (2009) Antioxidant defences
and oxidative damage in salt-treated olive plants under contrast-
ing sunlight irradiance. Tree Physiol 29:1187–1198
Melis A, Homann PH (1975) Kinetic analysis of the fluorescence
induction in 3-(3,4- dichlorophenyl)-1,1-dimethylurea poisoned
chloroplasts. Photochem Photobiol 21:431–437
Melis A, Homann PH (1976) Heterogeneity of the photochemical
centers in system II of chloroplasts. Photochem Photobiol
23:343–350
Merkell U, Rathke GW, Schuster C, Warnstorff K, Diepenbrock W
(2004) Use of glufosinate-ammonium to control cruciferous
weed species in glufosinate-resistant winter oilseed rape. Field
Crop Res 85:237–249
Merz D, Geyer M, Moss DA, Ache HJ (1996) Chlorophyll
fluorescence biosensor for the detection of herbicides. Fresenius
J Anal Chem 354:299–305
Messinger J, Renger G (1990) The reactivity of hydrazine with
photosystem II strongly depends on the redox state of the water
oxidizing system. FEBS Lett 277:141–146
Messinger J, Renger G (1993) Generation, oxidation by the oxidized
form of the tyrosine of polypeptide D2, and possible electronic
configuration of the redox states S0, S-1, and S-2 of the water
oxidase in isolated spinach thylakoids. Biochemistry 32:9379–9386
Meyer S, Genty B (1999) Heterogeneous inhibition of photosynthesis
over the leaf surface of Rosa rubiginosa L. during water stress
and abscisic acid treatment: induction of a metabolic component
by limitation of CO2 diffusion. Planta 210:126–131
Misra AN, Biswal AK (2000) Thylakoid membrane protein kinase
activity as a signal transduction pathway in chloroplasts.
Photosynthetica 38:323–332
Misra AN, Srivastava A, Strasser RJ (2001a) Fast chlorophyll
a fluorescence kinetic analysis for the assessment of temperature
and light effects: a dynamic model for stress recovery phenom-
ena. Photosynthesis: PS2001. CSIRO Publ., Melbourne, Aus-
tralia S3-007
Misra AN, Srivastava A, Strasser RJ (2001b) Utilisation of fast
chlorophyll a fluorescence technique in assessing the salt/ion
sensitivity of mung bean and brassica seedlings. J Plant Physiol
158:1173–1181
Misra AN, Latowski D, Strzalka K (2006) The xanthophyll cycle
activity in kidney bean and cabbage leaves under salinity stress.
Russ J Plant Physiol 53:102–109
Misra AN, Misra M, Singh R (2012) Chlorophyll fluorescence in
plant biology. In: Misra AN (ed) Biophysics. Intech Europe,
Croatia, pp 171–192
Mittler R (2002) Oxidative stress, antioxidants and stress tolerance.
Trends Plant Sci 7:405–410
Mohanty N, Vass I, Demeter S (1989) Copper toxicity affects
photosystem II electron transport at the secondary quinone
acceptor, QB. Plant Physiol 90:175–179
Mukerji I, Sauer K (1990) Optical Spectroscopy on a Photosystem I
Antenna Complex. In: Baltscheffsky M (ed) Current research in
photosynthesis, vol II. Kluwer Academic Publishers, Dordrecht,
pp 321–324
Mulkidjanian AY (2010) Activated Q cycle as a common mechanism
for cytochrome bc1 and cytochrome b6f complexes. Biochim
Biophys Acta 1797:1858–1868
Muller R, Schreiber U, Escher BI, Quayle P, Bengtson Nash SM,
Mueller JF (2008) Rapid exposure assessment of PSII herbicides
in surface water using a novel chlorophyll a fluorescence
imaging assay. Sci Total Environ 401:51–59
Muller P, Li X-P, Niyogi KK (2001) Non-photochemical quenching;
a response to excess light energy. Plant Physiol 125:1558–1566
Mullet JE, Burke JJ, Arntzen CJ (1980) Chlorophyll proteins of
photosystem I. Plant Physiol 65:814–822
Munday JC, Govindjee (1969) Light-induced changes in the fluores-
cence yield of chlorophyll a in vivo; III. The dip and the peak in
the fluorescence transient of Chlorella pyrenoidosa. Biophys J
9:1–21
Munekage YN, Eymery F, Rumeau D, Cuine S, Oguri M, Nakamura
N, Yakota A, Genty B, Peltier G (2010) Elevated expression of
PGR5 and NDH-H in bundle sheath chloroplasts in C4 Flaveria
species. Plant Cell Physiol 51:664–668
Murakami Y, Tsuyama M, Kobayashi Y, Kodama H, Iba K (2000)
Trienoic fatty acids and plant tolerance of high temperature.
Science 287:476–479
Murata N, Nishimura M, Takamiya A (1966a) Fluorescence of
chlorophyll in photosynthetic systems; II. Induction of
60 Photosynth Res (2017) 132:13–66
123

fluorescence in isolated spinach chloroplasts. Biochim Biophys
Acta 120:23–33
Murata N, Nishimura M, Takamiya A (1966b) Fluorescence of
chlorophyll in photosynthetic systems. III. Emission and action
spectra of fluorescence–three emission bands of chlorophyll
a and the energy transfer between two pigment systems. Biochim
Biophys Acta 126:234–243
Murchie EH, Lawson T (2013) Chlorophyll fluorescence analysis: a
guide to good practice and understanding some new applications.
J Exp Bot 64:3983–3998
Nagy V, Tengolics R, Schansker G, Rakhely G, Kovacs KL, Garab G,
Toth SZ (2012) Stimulatory effect of ascorbate, the alternative
electron donor of photosystem II, on the hydrogen production of
Chlamydomonas reinhardtii. Int J Hydrog Energ 37:8864–8871
Nakatani HY, Ke B, Dolan E, Arntzen CJ (1984) Identity of the
photosystem II reaction center polypeptide. Biochim Biophys
Acta 765:347–352
Naus J, Smecko S, Spundova M (2016) Chloroplast avoidance
movement as a sensitive indicator of relative water content
during leaf dessication in the dark. Photosynth Res 129:217–225
Nedbal L, Whitmarsh J (2004) Chlorophyll fluorescence imaging of
leaves and fruits. In: Papageorgiou GC, Govindjee (eds)
Advances in photosynthesis and respiration series chlorophyll
fluorescence: a signature of photosynthesis, vol 19. Springer,
Dordrecht, pp 389–407
Nedbal L, Soukupova J, Whitmarsh J, Trtılek M (2000) Postharvest
imaging of chlorophyll fluorescence from lemons can be used to
predict fruit quality. Photosynthetica 38:571–579
Nejad AR, Harbinson J, van Meeteren U (2006) Dynamics of spatial
heterogeneity of stomatal closure in Tradescantia virginiana altered
by growth at high relative humidity. J Exp Bot 57:3669–3678
Neubauer C, Schreiber U (1987) The polyphasic rise of chlorophyll
fluorescence upon onset of the strong continuous illumination: I.
Saturation characteristics and partial control by the photosystem
II acceptor side. Z Naturforsch 42c:1246–1254
Neyra CH, Hageman RH (1974) Dependence of nitrite reduction on
electron transport in chloroplasts. Plant Physiol 54:480–484
Nilkens M, Kress E, Lambrev P, Miloslavina Y, Muller M, Holzwarth
AR, Jahns P (2010) Identification of a slowly inducible
zeaxanthin-dependent component of non-photochemical quench-
ing of chlorophyll fluorescence generated under steady-state
conditions in Arabidopsis. Biochim Biophys Acta 1797:466–475
Noctor G, Foyer CH (1998) Ascorbate and glutathione: keeping
active oxygen under control. Annu Rev Plant Physiol Plant Mol
Biol 49:249–279
Oberhuber W, Dai Z-Y, Edwards GE (1993) Light dependence of
quantum yields photosystem II and CO2 fixation in C3 and C4
plants. Photosynth Res 35:265–274
Ogren E, Rosenqvist E (1992) On the significance of photoinhibition
of photosynthesis in the field and its generality among species.
Photosynth Res 33:63–71
Oh M-H, Moon Y-H, Lee C-H (2003) Increased stability of LHCII by
aggregate formation during dark-induced leaf senescence in the
Arabidopsis mutant ore10. Plant Cell Physiol 44:1368–1377
Oja V, Laisk A (2012) Photosystem II antennae are not energetically
connected: evidence based on flash-induced O2 evolution and
chlorophyll fluorescence in sunflower leaves. Photosynth Res
114:15–28
Olesen CF, Cedergreen N (2010) Glyphosate uncouples gas exchange
and chlorophyll fluorescence. Pest Manag Sci 66:536–542
Oukarroum A, El Madidi S, Schansker G, Strasser RJ (2007) Probing
the responses of barley cultivars (Hordeum vulgare L.) by
chlorophyll a fluorescence OLKJIP under drought stress and re-
watering. Environ Exp Bot 60:438–446
Oukarroum A, Schansker G, Strasser RJ (2009) Drought stress effects
on photosystem I content and photosystem II thermotolerance
analyzed using Chl a fluorescence kinetics barley varieties
differing in their drought tolerance. Physiol Plant 137:188–199
Oukarroum A, Strasser RJ, Schansker G (2012) Heat stress response
of the lichen Parmelia tiliacea in the dry and the wet state:
differences and similarities with the heat stress response of
higher plants. Photosynth Res 111:303–314
Oxborough K (2004) Using chlorophyll a fluorescence imaging to
monitor photosynthetic performance. In: Papageorgiou GC,
Govindjee (eds) Chl a fluorescence: a signature of photosynthe-
sis, advances in photosynthesis and respiration, vol 19. Springer,
Dordrecht, pp 409–428
Oxborough K, Baker NR (1997) Resolving chlorophyll a fluorescence
images of photosynthetic efficiency into photochemical and non-
photochemical components: calculation of qP and Fv’/Fm’
without measuring Fo’. Photosynth Res 54:135–142
Palsson LO, Tjus SE, Andersson B, Gillbro T (1995) Energy-transfer in
photosystem-I: time-resolved fluorescence of the native photo-
system-I complex and its core complex. Chem Phys 194:291–302
Pantaleoni L, Ferroni L, Baldisserotto C, Aro EM, Pancaldi S (2009)
Photosystem II organisation in chloroplasts of Arum italicum leaf
depends on tissue location. Planta 230:1019–1031
Pantazi XE, Moshou D, Mouazen AM, Kuang B, Alexandridis T
(2014) Application of supervised self organising models for
wheat yield prediction. In: Iliadis L, Maglogiannis I, Papado-
poulos H (eds) Artificial intelligence applications and innova-
tions. Springer, Berlin, pp 556–565
Papageorgiou GC, Govindjee (eds) (2004) Chl a fluorescence: a
signature of photosynthesis, advances in photosynthesis and
respiration, vol 19. Springer, Dordrecht
Pastenes C, Horton P (1996) Effect of high temperature on
photosynthesis in beans. 1. Oxygen evolution and chlorophyll
fluorescence. Plant Physiol 112:1245–1251
Paul M, Foyer CH (2001) Sink regulation of photosynthesis. J Exp
Bot 52:1383–1400
Penella C, Landi M, Guidi L, Nebauer SG, Pellegrini E, San Bautista
A, Remorini D, Nali C, Lopez-Galarza S, Calatayud A (2016)
Salt-tolerant rootstock increases yield of pepper under salinity
through maintenance of photosynthetic performance and sink
strength. J Plant Physiol 193:1–11
Perreault F, Oukarroum A, Pirastru L, Sirois L, Matias GW, Popovic
R (2010) Evaluation of copper oxide nanoparticles toxicity using
chlorophyll a fluorescence imaging in Lemna gibba. J Bot.
doi:10.1155/2010/763142
Pesaresi P, Hertle A, Pribil M, Kleine T, Wagner R, Strissel H,
Ihnatowicz A, Bonardi V, Scharfenberg M, Schneider A,
Pfannschmidt T, Leister D (2009) Arabidopsis STN7 kinase
provides a link between short- and long-term photosynthetic
acclimation. Plant Cell 21:2402–2423
Peterson RB, Havir EA (2003) Contrasting modes of regulation of PS
II light utilization with changing irradiance in normal and psbS
mutant leaves of Arabidopsis thaliana. Photosynth Res 75:57–70
Peterson RB, Havir EA (2004) The multiphasic nature of nonpho-
tochemical quenching: implications for assessment of photosyn-
thetic electron transport based on chlorophyll fluorescence.
Photosynth Res 82:95–107
Peterson RB, Oja V, Laisk A (2001) Chlorophyll fluorescence at 680 and
730 nm and leaf photosynthesis. Photosynth Res 70:185–196
Peterson RB, Oja V, Eichelmann H, Bichele I, Dall’Osto L, Laisk A
(2014) Fluorescence F0 of photosystems II and I in developing
C3 and C4 leaves, and implications on regulation of excitation
balance. Photosynth Res 122:41–56
Petrouleas V, Crofts AR (2005) The iron-quinone acceptor complex.
In: Wydrzynski TJ, Satoh K (eds) Photosystem II: the light-
driven water:plastoquinone oxidoreductase, advances in photo-
synthesis and respiration, vol 22. Springer, Dordrecht,
pp 177–206
Photosynth Res (2017) 132:13–66 61
123

Pfundel E (1998) Estimating the contribution of photosystem I to total
leaf chlorophyll fluorescence. Photosynth Res 56:185–195
Pfundel E, Pfeffer M (1997) Modification of photosystem I light
harvesting of bundle-sheath chloroplasts occurred during the
evolution of NADP-malic enzyme C4 photosynthesis. Plant
Physiol 114:145–152
Pfundel EE, Klughammer C, Meister A, Cerovic ZG (2013) Deriving
fluorometer-specific values of relative PSI fluorescence intensity
from quenching of F0 fluorescence in leaves of Arabidopsis
thaliana and Zea mays. Photosynth Res 114:189–206
Pogson BJ, Niyogio KK, Bjorkman O, DellaPenna D (1998) Altered
xanthophyll compositions adversely affect chlorophyll accumu-
lation and nonphotochemical quenching in Arabidopsis mutants.
Proc Natl Acad Sci USA 95:13324–13329
Pollastrini M, Di Stefano V, Ferretti M, Agati G, Grifoni D, Zipoli G,
Orlandini S, Bussotti F (2011) Influence of different light
intensity regimes on leaf features of Vitis vinifera L. in
ultraviolet radiation filtered condition. Environ Exp Bot
73:108–115
Pollastrini M, Desotgiu R, Camin F, Ziller L, Marzuoli R, Gerosa G,
Bussotti F (2013) Intra-annual pattern of photosynthesis, growth
and stable isotope partitioning in a poplar clone subjected to
ozone and water stress. Water Air Soil Pollut 224:1761–1772
Pollastrini M, Holland V, Bruggemann W, Koricheva J, Jussila I,
Scherer-Lorenzen M, Berger S, Bussotti F (2014) Interactions
and competition processes among tree species in young exper-
imental mixed forests, assessed with chlorophyll fluorescence
and leaf morphology. Plant Biol 16:323–331
Pollet B, Steppe K, van Labeke M-C, Lemeur R (2009) Diurnal cycle
of chlorophyll fluorescence in Phalaenopsis. Photoynthetica
47:309–312
Popovic R, Dewez D, Juneau P (2003) Applications of chlorophyll
fluorescence in ecotoxicology: heavy metals, herbicides, and air
pollutants. In: DeEll JR, Toivonen PMA (eds) Practical appli-
cations of chlorophyll fluorescence in plant biology. Kluwer
Academic Publishers, Dordrecht, pp 151–184
Porcar-Castell A, Tyystjarvi E, Atherton J, van der Tol C, Flexas J,
Pfundel EE, Moreno J, Frankenberg C, Berry JA (2014) J Exp
Bot 65:4065–4095
Pospıcil P, Haumann M, Dittmer J, Sole VA, Dau H (2003) Stepwise
transition of the tetra-manganese complex of photosystem II to a
binuclear Mn2(l-O)2 complex in response to a temperature
jump: a time-resolved structural investigation employing X-ray
absorption spectroscopy. Biophys J 84:1370–1386
Quick WP, Horton P (1984) Studies on the induction of chlorophyll
fluorescence in barley protoplasts; II. Resolution of fluorescence
quenching by redox state and the transthylakoid pH gradient.
Proc R Soc Lond B 220:371–382
Quick WP, Stitt M (1989) An examination of factors contributing to
non-photochemical quenching of chlorophyll fluorescence in
barley leaves. Biochim Biophys Acta 977:287–296
Quilliam RS, Swarbrick PJ, Scholes JD, Rolfe SA (2006) Imaging
photosynthesis in wounded leaves of Arabidopsis thaliana. J Exp
Bot 57:55–69
Radenovic C, Markovic D, Jeremic M (1994) Delayed chlorophyll
fluorescence in plant models. Photosynthetica 30:1–24
Raghavendra AS, Padmasree K (2003) Beneficial interactions of
mitochondrial metabolism with photosynthetic carbon assimila-
tion. Trends Plant Sci 8:546–553
Ralph PJ, Burchett MD (1998) Photosynthetic response of Halophila
ovalis to heavy metal stress. Environ Pollut 103:91–101
Ralph PJ, Gademann R (2005) Rapid light curves: a powerful tool to
assess photosynthetic activity. Aquat Bot 82:222–237
Ralph PJ, Durako MJ, Enrıquez S, Collier CJ, Doblin MA (2007)
Impact of light limitation on seagrasses. J Exp Mar Biol Ecol
350:176–193
Reale L, Ferranti F, Mantilacci S, Corboli M, Aversa S, Landucci F,
Baldisserotto C, Ferroni L, Pancaldi S, Venanzini R (2016)
Cyto-histological and morpho-physiological responses of com-
mon duckweed (Lemna minor L.) to chromium. Chemosphere
145:98–105
Renger T, Schlodder E (2011) Optical properties, excitation energy
and primary charge transfer in photosystem II: theory meets
experiment. J Photochem Photobiol B 104:126–141
Reppert M, Acharya K, Neupane B, Jankowiak R (2010) Lowest
electronic states of the CP47 antenna protein complex of
photosystem II: simulation of optical spectra and revised
structural assignments. J Phys Chem B 114:11884–11898
Rintamaki E, Martinsuo P, Pursiheimo S, Aro E-M (2000) Cooper-
ative regulation of light-harvesting complex II phosphorylation
via the plastoquinol and ferredoxin-thioredoxin system in
chloroplasts. Proc Natl Acad Sci USA 97:11644–11649
Robakowski P (2005) Susceptibility to low-temperature photoinhibi-
tion in three conifers differing in successional status. Tree
Physiol 25:1151–1160
Robinson HH, Crofts AR (1983) Kinetics of the oxidation-reduction
reactions of photosystem II quinone acceptor complex, and the
pathway for deactivation. FEBS Lett 153:221–226
Rohacek K (2002) Chlorophyll fluorescence parameters: the defini-
tions, photosynthetic meaning, and mutual relationships. Photo-
synthetica 40:13–29
Rohacek K, Bartak M (1999) Technique of the modulated chlorophyll
fluorescence: basic concepts, useful parameters, and some
applications. Photosynthetica 37:339–363
Rohacek K, Soukupova J, Bartak M (2008) Chlorophyll fluorescence:
a wonderful tool to study plant physiology and plant stress. Res
Signpost 37(661):41–104
Romanowska-Duda B, Kalaji MH, Strasser RJ (2005) The use of PSII
activity of Spirodela oligorrhiza plants as an indicator for water
toxicity. In: Van der Est A, Bruce D (eds) Photosynthesis:
fundamental aspects to global perspectives. Allen Press,
Lawrence, KS, pp 585–587
Romanowska-Duda ZB, Grzesik M, Kalaji MH (2010) Physiological
activity of energy plants fertilized with sewage sludge and usefulness
of the Phytotoxkit test in practice. Environ Prot Eng 36:73–81
Rosenqvist E, van Kooten O (2003) Chlorophyll fluorescence: a general
description and nomenclature. In: DeEll JR, Toivonen PMA (eds)
Practical applications of chlorophyll fluorescence in plant biology.
Kluwer Academic Publishers, Dordrecht, pp 31–77
Rosyara UR, Subedi S, Sharma RC, Duveiller E (2010) The effect of
spot blotch and heat stress in variation of canopy temperature
depression, chlorophyll fluorescence and chlorophyll content of
hexaploid wheat genotypes. Euphytica 174:377–390
Rousseau C, Belin E, Bove E, Rousseau D, Fabre F, Berruyer R,
Guillaumes J, Manceau C, Jacques M-A, Boureau T (2013) High
throughput quantitative phenotyping of plant resistance using
chlorophyll fluorescence image analysis. Plant Methods 9:17.
doi:10.1186/1746-4811-9-17
Ruban AV, Horton P (1992) Mechanism of delta-pH-dependent
dissipation of absorbed excitation-energy by photosynthetic
membranes. 1. Spectroscopic analysis of isolated light-harvest-
ing complexes. Biochim Biophys Acta 1102:30–38
Rutherford AW, Govindjee, Inoue Y (1984) Charge accumulation and
photochemistry in leaves studied by thermoluminescence and
delayed light emission. Proc Natl Acad Sci USA 81:1107–1111
Sacksteder CA, Kanazawa A, Jacoby ME, Kramer DM (2000) The
proton to electron stoichiometry of steady-state photosynthesis in
living plants: in proton-pumping Q cycle is continuously
engaged. Proc Natl Acad Sci USA 97:14283–14288
Salvucci ME, Crafts-Brandner SJ (2004) Inhibition of photosynthesis
by heat stress: the activation state of Rubisco as a limiting factor
in photosynthesis. Physiol Plant 120:179–186
62 Photosynth Res (2017) 132:13–66
123

Samborska IA, Alexandrov V, Sieczko L, Kornatowska B, Goltsev V,
Cetner MD, Kalaji MH (2014) Artificial neural networks and
their application in biological and agricultural research. Signpost
Open Access J NanoPhotoBioSciences 2:14–30
Samson G, Bruce D (1996) Origins of the low yield of chlorophyll
a fluorescence induced by a single turnover flash in spinach
thylakoids. Biochim Biophys Acta 1276:147–153
Sarvikas P, Tyystjarvi T, Tyystjarvi E (2010) Kinetics of prolonged
photoinhibition revisited: photoinhibited photosystem II centres
do not protect the active ones against loss of oxygen evolution.
Photosynth Res 103:7–17
Satoh K (1981) Fluorescence induction and activity of ferredoxin-
NADP? reductase in Bryopsis chloroplasts. Biochim Biophys
Acta 638:327–333
Saura P, Quiles MJ (2009) Assessment of photosynthesis tolerance to
herbicides, heat and high illumination by fluorescence. Open
Plant Sci J 3:7–13
Savikhin S (2006) Ultrafast optical spectroscopy of photosystem I. In:
Golbeck JH (ed) Photosystem I: the light-driven plastocyanin:
ferredoxin oxidoreductase. Springer, Dordrecht, pp 155–175
Sazanov LA, Burrows PA, Nixon PJ (1998) The chloroplast Ndh
complex mediates the dark reduction of the plastoquinone pool
in response to heat stress in tobacco leaves. FEBS Lett
429:115–118
Schaller S, Latowski D, Jemioła-Rzeminska M, Dawood A, Wilhelm
C, Strzałka K, Goss R (2011) Regulation of LHCII aggregation
by different thylakoid membrane lipids. Biochim Biophys Acta
1807:326–335
Schansker G, Strasser RJ (2005) Quantification of non-QB-reducing
centers in leaves using a far-red pre-illumination. Photosynth
Res 84:145–151
Schansker G, Goussias C, Petrouleas V, Rutherford AW (2002)
Reduction of the Mn cluster of the water-oxidizing enzyme by
nitric oxide: formation of an S-2 state. Biochem US
41:3057–3064
Schansker G, Srivastava A, Strasser RJ (2003) Characterization of the
820-nm transmission signal paralleling the chlorophyll a fluores-
cence rise (OJIP) in pea leaves. Funct Plant Biol 30:785–796
Schansker G, Toth SZ, Strasser RJ (2005) Methylviologen and
dibromothymoquinone treatments of pea leaves reveal the role of
photosystem I in the Chl a fluorescence rise OJIP. Biochim
Biophys Acta 1706:250–261
Schansker G, Toth SZ, Strasser RJ (2006) Dark-recovery of the Chl
a fluorescence transient (OJIP) after light adaptation: the qT-
component of non-photochemical quenching is related to an
activated photosystem I acceptor side. Biochim Biophys Acta
1757:787–797
Schansker G, Yuan Y, Strasser RJ (2008) Chl a fluorescence and
820 nm transmission changes occurring during a dark-to-light
transition in pine needles and pea leaves: a comparison. In: Allen
JF, Osmond B, Golbeck JH, Gantt E (eds) Photosynthesis.
Energy from the sun. Springer, Dordrecht, pp 951–955
Schansker G, Toth SZ, Kovacs L, Holzwarth AR, Garab G (2011)
Evidence for a fluorescence yield change driven by a light-
induced conformational change within photosystem II during the
fast chlorophyll a fluorescence rise. Biochim Biophys Acta
1807:1032–1043
Schansker G, Toth SZ, Holzwarth AR, Garab G (2014) Chlorophyll
a fluorescence: beyond the limits of the QA-model. Photosynth
Res 120:43–58
Scharte J, Schon H, Weis E (2005) Photosynthesis and carbohydrate
metabolism in tobacco leaves during an incompatible interaction
with Phytophthora nicotianae. Plant Cell Environ 28:1421–1435
Schatz GH, Brock H, Holzwarth AR (1988) Kinetic and energetic
model for the primary processes in photosystem II. Biophys J
54:397–405
Scheibe R, Backhausen JE, Emmerlich V, Holtgrefe S (2005)
Strategies to maintain redox homeostasis during photosynthesis
under changing conditions. J Exp Bot 56:1481–1489
Schreiber U (1986) Detection of rapid induction kinetics with a new
type of high-frequency modulated chlorophyll fluorometer.
Photosynth Res 9:261–272
Schreiber U, Berry JA (1977) Heat-induced changes of chlorophyll
fluorescence in intact leaves correlated with damage of the
photosynthetic apparatus. Planta 136:233–238
Schreiber U, Bilger W (1987) Rapid assessment of stress effects on plant
leaves by chlorophyll fluorescence measurements. In: Tenhunen
JD, Catarino FM, Lange OL, Oechel WC (eds) Plant response to
stress, NATO ASI series, vol 15. Springer, Berlin, pp 27–53
Schreiber U, Krieger A (1996) Two fundamentally different types of
variable chlorophyll fluorescence in vivo. FEBS Lett 397:131–135
Schreiber U, Neubauer C (1987) The polyphasic rise of chlorophyll
fluorescence upon onset of strong continuous illumination: II.
Partial control by the photosystem II donor side and possible
ways of interpretation. Z Naturforsch 42c:1255–1264
Schreiber U, Schliwa U, Bilger W (1986) Continuous recording of
photochemical and non-photochemical chlorophyll fluorescence
quenching with a new type of modulation fluorometer. Photo-
synth Res 10:51–62
Schreiber U, Endo T, Mi H, Asada K (1995) Quenching analysis of
chlorophyll fluorescence by the saturation pulse method: partic-
ular aspects relating to the study of eukaryotic algae and
cyanobacteria. Plant Cell Physiol 36:873–882
Schreiber U, Klughammer C, Kolbowski J (2012) Assessment of
wavelength-dependent parameters of photosynthetic electron
transport with a new type of multi-color PAM chlorophyll
fluorometer. Photosynth Res 113:127–144
Schultz HR (1996) Leaf absorptance of visible radiation in Vitis
vinifera L.: estimates of age and shade effects with a simple field
method. Sci Hortic 66:93–102
Schulze ED (1986) Carbon dioxide and water vapor exchange in
response to drought in the atmosphere and in the soil. Annu Rev
Plant Physiol 37:247–274
Sharkey TD, Zhang R (2010) High temperature effects on electron and
proton circuits of photosynthesis. J Integr Plant Biol 52:712–722
Shikanai T (2014) Central role of cyclic electron transport around
photosystem I in the regulation of photosynthesis. Curr Opin
Biotechnol 26:25–30
Shinkarev VP (2005) Flash-induced oxygen evolution in photosyn-
thesis: simple solution for the extended S-state model that
includes misses, double-hits, inactivation, and backward-transi-
tions. Biophys J 88:412–421
Shubin VV, Bezsmertnaya IN, Karapetyan NV (1992) Isolation from
Spirulina membranes of two photosystem I-type complexes, one
of which contains chlorophyll responsible for the 77 K fluores-
cence band at 760 nm. FEBS Lett 309:340–342
Shubin VV, Terekhova IN, Kirillova BA, Karapetyan NV (2008)
Quantum yield of P700? photodestruction in isolated photosys-
tem I complexes of the cyanobacterium Arthrospira platensis.
Photochem Photobiol Sci 7:956–962
Siffel P, Braunova Z (1999) Release and aggregation of the light
harvesting complex in intact leaves subjected to strong CO2
deficit. Photosynth Res 61:217–226
Simic D, Lepedus H, Jurkovic V, Antunovic J, Cesar V (2014)
Quantitative genetic analysis of chlorophyll a fluorescence
parameters in maize in the field environments. J Integr Plant
Biol 56:695–708
Sinclair J, Spence SM (1990) Heterogeneous photosystem 2 activity
in isolated spinach chloroplasts. Photosynth Res 24:209–220
Skotnica J, Fiala J, Ilık P, Dvork L (1999) Thermally induced
chemiluminescence of barley leaves. Photochem Photobiol
69:211–217
Photosynth Res (2017) 132:13–66 63
123

Smit MF, van Heerden PDR, Pienaar JJ, Weissflog L, Strasser RJ,
Kruger GHJ (2009) Effect of trifluoroacetate, a persistent
degradation product of fluorinated hydrocarbons, on Phaseolus
vulgaris and Zea mays. Plant Physiol Biochem 47:623–634
Snel JFH, Dassen HHA (2000) Measurement of light and pH
dependence of single-cell photosynthesis by fluorescence
microscopy. J Fluoresc 10:269–273
Snel JFH, Kooijman M, Vredenberg WJ (1990) Correlation between
chlorophyll fluorescence and photoacoustic signal transients in
spinach leaves. Photosynth Res 25:259–268
Søbye KW, Streibig JC, Cedergreen N (2011) Prediction of joint
herbicide action by biomass and chlorophyll a fluorescence.
Weed Res 51:23–32
Solymosi K (2012) Plastid structure, diversification and interconver-
sions. I. Algae. Curr Chem Biol 6:167–186
Sonneveld A, Rademaker H, Duysens LNM (1980) Microsecond
delayed fluorescence of photosystem II of photosynthesis in
various algae: emission spectra and uphill energy transfer. FEBS
Lett 113:323–327
Srivastava A, Greppin H, Strasser RJ (1995) Acclimation of land
plants to diurnal changes in temperature and light. In: Mathis P
(ed) Photosynthesis: from light to biosphere, vol IV. Kluwer,
Dordrecht, pp 909–912
Srivastava A, Guisse B, Greppin H, Strasser RJ (1997) Regulation of
antenna structure and electron transport in Photosystem II of
Pisum sativum under elevated temperature probed by the fast
polyphasic chlorophyll a fluorescence transient: OKJIP. Biochim
Biophys Acta 1320:95–106
Srivastava A, Strasser RJ, Govindjee (1999) Greening of peas:
parallel measurements of 77 K emission spectra, OJIP chloro-
phyll a fluorescence transient, period four oscillation of the
initial fluorescence level, delayed light emission, and P700.
Photosynthetica 37:365–392
StatSoft, Inc. (2011). STATISTICA (data analysis software system),
version 10. www.statsoft.com
Steffen R, Christen G, Renger G (2001) Time-resolved monitoring of
flash-induced changes of fluorescence quantum yield and decay
of delayed light emission in oxygen-evolving photosynthetic
organisms. Biochemistry 40:163–180
Steffen R, Eckert H-J, Kelly AA, Dormann P, Renger G (2005)
Investigations on the reaction pattern of photosystem II in leaves
from Arabidopsis thaliana by time-resolved fluorometric anal-
ysis. Biochemistry 44:3123–3133
Stewart DW, Costa C, Dwyer LM, Smith DL, Hamilton RI, Ma BL
(2003) Canopy structure, light interception, and photosynthesis
in maize. Agronom J 95:1465–1474
Stirbet A (2013) Excitonic connectivity between photosystem II units:
what is it, and how to measure it? Photosynth Res 116:189–214
Stirbet A, Govindjee (2012) Chlorophyll a fluorescence induction: a
personal perspective of the thermal phase, the J-I-P rise.
Photosynth Res 113:15–61
Stirbet A, Govindjee (2016) The slow phase of chlorophyll a fluores-
cence induction in silico: origin of the S-M fluorescence rise.
Photosynth Res 130:193–213
Strand M, Lundmark T (1987) Effects of low night temperature and
light on chlorophyll fluorescence of field-grown seedlings of
Scots pine (Pinus sylvestris L.). Tree Physiol 3:211–224
Strasser RJ (1978) The grouping model of plant photosynthesis. In:
Akoyunoglou G, Argyroudi-Akoyunoglou (eds) Chloroplast
development. Elsevier/North Holland Biomedical Press, The
Netherlands, pp 513–524
Strasser RJ, Butler WL (1977) Fluorescence emission spectra of
photosystem I, photosystem II and the light-harvesting chlorophyll
a/b complex of higher plants. Biochim Biophys Acta 462:307–313
Strasser RJ, Stirbet A (2001) Estimation of the energetic connectivity
of PS II centres in plants using the fluorescence rise O-J-I-P:
fitting of experimental data to three different PS II models. Math
Comput Simul 56:451–462
Strasser BJ, Strasser RJ (1995) Measuring fast fluorescence transients
to address environmental questions: The JIP test. In: Mathis P
(ed) Photosynthesis: from light to biosphere, vol V. Kluwer
Acadamic Publishers, Dordrecht, pp 977–980
Strasser BJ, Strasser RJ (1998) Oscillations of the chlorophyll
a fluorescence related to the S-states of the oxygen evolving
complex. In: Garab G (ed) Photosynthesis: mechanisms and
effects, vol V. Kluwer, Dordrecht, pp 4325–4328
Strasser RJ, Srivastava A, Tsimilli-Michael M (2000) The fluores-
cence transient as a tool to characterize and screen photosyn-
thetic samples. In: Yunus M, Pathre U, Mohanty P (eds) Probing
photosynthesis: mechanisms, regulation and adaptation. Tayor &
Francis, London, pp 445–483
Strasser RJ, Schansker G, Srivastava A, Govindjee (2001) Simulta-
neous measurement of photosystem I and photosystem II probed
by modulated transmission at 820 nm and by chlorophyll a
fluorescence in the sub ms to second time range. In: Proceedings
of the 12th international congress on photosynthesis. CSIRO
Publishing, Collingwood, Australia, S14-003
Strasser RJ, Tsimilli-Michael M, Srivastava A (2004) Analysis of the
chlorophyll a fluorescence transient. In: Papageorgiou G,
Govindjee (eds) Chlorophyll a Fluorescence: a signature of
photosynthesis, advances in photosynthesis and respiration.
Springer, Dordrecht, pp 321–362
Strasser RJ, Tsimilli-Michael M, Qiang S, Goltsev V (2010)
Simultaneous in vivo recording of prompt and delayed fluores-
cence and 820-nm reflection changes during drying and after
rehydration of the resurrection plant Haberlea rhodopensis.
Biochim Biophys Acta 1797:1313–1326
Strehler BL, Arnold WA (1951) Light production by green plants.
J Gen Physiol 34:809–820
Sun R, Liu K, Dong L, Wu Y, Paulsen H, Yang C (2015) Direct
energy transfer from the major antenna to the photosystem II
core complexes in the absence of minor antennae in liposomes.
Biochim Biophys Acta 1847:248–261
Suorsa M, Jarvi S, Grieco M, Nurmi M, Pietrzykowska M, Rantala
M, Kangasjarvi S, Paakkarinen V, Tikkanen M, Jansson S, Aro
EM (2012) PROTON GRADIENT REGULATION5 is essential
for proper acclimation of Arabidopsis photosystem I to naturally
and artificially fluctuating light conditions. Plant Cell
24:2934–2948
Suorsa M, Rantala M, Mamedov F, Lespinasse M, Trotta A, Grieco
M, Vuorio E, Tikkanen M, Jarvi S, Aro EM (2015) Light
acclimation involves dynamic re-organisation of the pigment-
protein megacomplexes in non-appressed thylakoid domains.
Plant J 84:360–373
Suresh K, Nagamani C, Kantha DL, Kumar MK (2012) Changes in
photosynthetic activity in five common hybrids of oil palm
(Elaeis guineensis Jacq.) seedlings under water deficit. Photo-
synthetica 50:549–556
Swoczyna T, Kalaji MH, Pietkiewicz S, Borowski J, Zaras-
Januszkiewicz E (2010a) Photosynthetic apparatus efficiency
of eight tree taxa as an indicator of their tolerance to urban
environments. Dendrobiology 63:65–75
Swoczyna T, Kalaji MH, Pietkiewicz S, Borowski J, Zaras-
Januszkiewicz E (2010b) Monitoring young urban trees toler-
ance to roadside conditions by application of chlorophyll
fluorescence technique. Zesz Probl Post N Rol 545:303–309
Tallman G (2004) Are diurnal patterns of stomatal movement the
result of alternating metabolism of endogenous guard cell ABA
and accumulation of ABA delivered to the apoplast around guard
cells by transpiration? J Exp Bot 55:1963–1976
Tikkanen M, Aro EM (2014) Integrative regulatory network of plant
thylakoid energy transduction. Trends Plant Sci 19:10–17
64 Photosynth Res (2017) 132:13–66
123
Tikkanen M, Mekala NR, Aro E-M (2014) Photosystem II photoin-
hibition-repair cycle protects photosystem I from irreversible
damage. Biochim Biophys Acta 1837:210–215
Tikkanen M, Rantala S, Aro E-M (2015) Electron flow from PSII to
PSI under high light is controlled by PGR5 but not by PSBS.
Front Plant Sci 6:521. doi:10.3389/fpls.2015.00521
Tiwari A, Mamedov F, Grieco M, Suorsa M, Jajoo A, Styring S,
Tikkanen M, Aro E-M (2016) Photodamage of iron–sulphur
clusters in photosystem I induces non-photochemical energy
dissipation. Nat Plants. doi:10.1038/NPLANTS.2016.35
Toth SZ, Strasser RJ (2005) The specific rate of QA reduction
increases as a function of the initial QA- concentration. In: van
Est A, Bruce D (eds) Photosynthesis: fundamental aspects to
global perspectives. Allen Press, Lawrence, pp 198–200
Toth SZ, Schansker G, Kissimon J, Kovacs L, Garab G, Strasser RJ
(2005a) Biophysical studies of photosystem II-related recovery
processes after a heat pulse in barley seedling (Hordeum vulgare
L.). J Plant Physiol 162:181–194
Toth SZ, Schansker G, Strasser RJ (2005b) In intact leaves, the
maximum fluorescence level (FM) is independent of the redox
state of the plastoquinone pool: a DCMU-inhibition study.
Biochim Biophys Acta 1708:275–282
Toth SZ, Schansker G, Garab G, Strasser RJ (2007a) Photosynthetic
electron transport activity in heat-treated barley leaves: the role
of internal alternative electron donors to photosystem II.
Biochim Biophys Acta 1767:295–305
Toth SZ, Schansker G, Strasser RJ (2007b) A non-invasive assay of
the plastoquinone pool redox state based on the OJIP-transient.
Photosynth Res 93:193–203
Toth SZ, Puthur JT, Nagy V, Garab G (2009) Experimental evidence
for ascorbate-dependent electron transport in leaves with inac-
tive oxygen-evolving complexes. Plant Physiol 149:1568–1578
Toth SZ, Schansker G, Garab G (2013) The physiological roles and
metabolism of ascorbate in chloroplasts. Physiol Plant 148:161–175
Trissl H-W, Lavergne J (1995) Fluorescence induction from photo-
system II: analytical equations for the yields of photochemistry
and fluorescence derived from analysis of a model including
exciton-radical pair equilibrium and restricted energy transfer
between photosynthetic units. Aust J Plant Physiol 22:183–193
Trissl HW, Wilhelm C (1993) Why do thylakoid membranes from higher
plants form grana stacks? Trends Biochem Sci 18:415–419
Tuba Z, Saxena DK, Srivastava K, Singh S, Sz Czebol, Kalaji MH
(2010) Chlorophyll a fluorescence measurements for validating
the tolerant bryophytes for heavy metal (Pb) biomapping. Curr
Sci 98:1505–1508
Tyystjarvi E, Aro EM (1996) The rate constant of photoinhibition,
measured in lincomycin-treated leaves, is directly proportional to
light intensity. Proc Natl Acad Sci USA 93:2213–2218
Tyystjarvi E, Vass I (2004) Light emission as a probe of charge
separation and recombination in the photosynthetic apparatus:
relation of prompt fluorescence to delayed light emission and
thermoluminescence. In: Papageorgiou GC, Govindjee (eds)
Chlorophyll a fluorescence: a signature of photosynthesis.
Advances in photosynthesis and respiration, vol 19. Springer,
Dordrecht, pp 363–388
Tyystjarvi E, Koski A, Keranen M, Nevalainen O (1999) The Kautsky
curve is a built-in barcode. Biophys J 77:1159–1167
van der Weij-de Wit CD, Ihalainen JA, van Grondelle R, Dekker JP
(2007) Excitation energy transfer in native and unstacked
thylakoid membranes studied by low temperature and ultrafast
fluorescence spectroscopy. Photosynth Res 93:173–182
van Dorssen RJ, Breton J, Plijter JJ, Satoh K, van Gorkom HJ, Amesz
J (1987) Spectroscopic properties of the reaction center and of
the 47 kDa chlorophyll protein of photosystem II. Biochim
Biophys Acta 893:267–274
van Grondelle R, Gobets B (2004) Transfer and trapping of
excitations om plant photosystems. In: Papageorgiou GC,
Govindjee (eds) Chlorophyll a fluorescence: a signature of
photosynthesis. Advances in photosynthesis and respiration, vol
19. Springer, Dordrecht, pp 107–132
van Kooten O, Snel JFH (1990) The use of chlorophyll fluorescence
nomenclature in plant stress physiology. Photosynth Res
25:147–150
van Rensen JJS, Vredenberg WJ, Rodrigues GC (2007) Time
sequence of the damage to the acceptor and donor sides of
photosystem II by UV-B radiation as evaluated by chlorophyll
a fluorescence. Photosynth Res 94:291–297
Vass I (2003) The history of photosynthetic thermoluminescence.
Photosynth Res 76:303–318
Vass I, Govindjee (1996) Thermoluminescence from the photosyn-
thetic apparatus. Photosynth Res 48:117–126
Vass I, Horvath G, Herczeg T, Demeter S (1981) Photosynthetic
energy conservation investigated by thermoluminescence; acti-
vation energies and half-lives of thermoluminescence bands of
chloroplasts determined by mathematical resolution of glow
curves. Biochim Biophys Acta 634:140–152
Vass I, Kirilovski D, Etienne A-L (1999) UV-B radiation-induced
donor- and acceptor-side modifications of photosystem II in the
cyanobacterium Synechocystis sp. PCC 6803. Biochemistry
38:12786–12794
Velthuys BR, Visser JWM (1975) The reactivation of EPR signal II in
chloroplasts treated with reduced dichlorophenol-indophenol:
evidence against a dark equilibrium between two oxidation states
of the oxygen evolving system. FEBS Lett 55:109–112
Vermaas WFJ, Renger G, Dohnt G (1984) The reduction of the
oxygen-evolving system in chloroplasts by thylakoid compo-
nents. Biochim Biophys Acta 764:194–202
Veselovskii V, Veselova T (1990) Plant Luminescence: theoretical
and practical aspects. Nauka, Moscow [in Russian]von Caemmerer S (2000) Biochemical models of photosynthesis.
Techniques in plant sciences, vol 2. CSIRO Publications,
Collingwood
Vos MH, van Gorkom HJ, van Leeuwen PJ (1991) An electrolumi-
nescence study of stabilization reactions in the oxygen-evolving
complex of photosystem II. Biochim Biophys Acta 1056:27–39
Vredenberg WJ (2008) Analysis of initial chlorophyll fluorescence
induction kinetics in chloroplasts in terms of rate constants ofdonor side quenching release and electron trapping in photosys-
tem II. Photosynth Res 96:83–97
Wagner R, Dietzel L, Brautigam K, Fischer W, Pfannschmidt T
(2008) The long-term response to fluctuating light quality is an
important and distinct light acclimation mechanism that supports
survival of Arabidopsis thaliana under low light conditions.
Planta 228:573–587
Warburg O, Negelein E (1923) Uber den Einfluss der Wellenlange auf
den Energieumsatz bei der Kohlensaureassimilation. Z Physik
Chem 106:191–218 [in German]
Weis E, Berry JA (1987) Quantum efficiency of photosystem II in
relation to ‘energy’-dependent quenching of chlorophyll fluo-
rescence. Biochim Biophys Acta 894:198–208
White AJ, Critchley C (1999) Rapid Light Curves: a new fluorescence
method to assess the state of the photosynthetic apparatus.
Photosynth Res 59:63–72
Wientjes E, van Amerongen H, Croce R (2013a) Quantum yield of
charge separation in photosystem II: functional effect of changes
in the antenna size upon light acclimation. J Phys Chem B
117:11200–11208
Wientjes E, van Amerongen H, Croce R (2013b) LHCII is an antenna
of both photosystems after long-term acclimation. Biochim
Biophys Acta 1827:420–426
Photosynth Res (2017) 132:13–66 65
123

Wilson KG, Ralph PJ (2012) Laboratory testing protocol for the
impact of dispersed petrochemicals on seagrass. Mar Pollut Bull
64:2421–2427
Wingler A, Brownhill E, Portau N (2005) Mechanisms of the light-
dependent induction of cell death in tobacco plants with delayed
senescence. J Exp Bot 56:2897–2905
Witt HT (1979) Energy conversion in the functional membranes of
photosynthesis analysis by light pulse and electric pulse
methods. Biochim Biophys Acta 505:355–427
Wraight CA, Crofts AR (1971) Delayed fluorescence and the high-
energy state of chloroplasts. Eur J Biochem 19:386–397
Yamane Y, Kashino Y, Koike H, Satoh K (1998) Effects of high
temperatures on the photosynthetic systems in spinach: oxygen-
evolving activities, fluorescence characteristics and the de-
naturation process. Photosynth Res 57:51–59
Yamauchi Y, Sugimoto Y (2010) Effect of protein modification by
malondialdehyde on the interaction between the oxygen-evolv-
ing complex 33 kDa protein and photosystem II core proteins.
Planta 231:1077–1088
Yang DL, Jing RL, Chang XP, Li W (2007) Quantitative trait loci
mapping for chlorophyll fluorescence and associated traits in
wheat (Triticum aestivum). OMICS 49:646–654
Yanniccari M, Tambussi E, Istilart C, Castro AM (2012) Glyphosate
effects on gas exchange and chlorophyll fluorescence responses
of two Lolium perenne L. biotypes with differential herbicide
sensitivity. Plant Physiol Biochem 57:210–217
Yin Z, Meng F, Song H, He X, Xu X, Yu D (2010) Mapping
quantitative trait loci associated with chlorophyll a fluorescence
parameters in soybean (Glycine max (L.) Merr.). Planta
231:875–885
Yocum CF (2008) The calcium and chloride requirements of the O2
evolving complex. Coord Chem Rev 252:296–305
Yokono M, Takabayashi A, Akimoto S, Tanaka A (2015) A
megacomplex composed of both photosystem reaction centres
in higher plants. Nat Commun 6:6675. doi:10.1038/ncomms7675
Yoshida K, Terashima I, Noguchi K (2007) Up-regulation of
mitochondrial alternative oxidase concomitant with chloroplast
over-reduction by excess light. Plant Cell Physiol 48:606–614
Yusuf MA, Kumar D, Rajwanshi R, Strasser RJ, Tsimilli-Michael M,
Govindjee, Sarin NM (2010) Overexpression of y-tocopherol
methyl transferase gene in transgenic Brassica juncea plants
alleviates abiotic stress: physiological and chlorophyll fluores-
cence measurements. Biochim Biophys Acta 1791:428–438
Zaharieva I, Goltsev V (2003) Advances on photosystem II inves-
tigation by measurement of delayed chlorophyll fluorescence by
a phosphoroscopic method. Photochem Photobiol 77:292–298
Zhang ZB, Xu P, Jia JZ, Zhou RH (2010) Quantitative trait loci for
leaf chlorophyll fluorescence traits in wheat. Aust J Crop Sci
4:571–579
Zivcak M, Brestic M, Olsovska K (2008a) Physiological parameters
useful in screening for improved tolerance to drought in winter
wheat (Triticum aestivum L.). Cereal Res Commun
36:1943–1946
Zivcak M, Brestic M, Olsovska K (2008b) Application of photosyn-
thetic parameters in screening of wheat (Triticum aestivum L.)
genotypes for improved drought and high temperature tolerance.
In: Allen JF, Gantt E, Goldbeck JH, Osmond B (eds) Photosyn-
thesis. Energy from the sun. Springer, Dordrecht, pp 1247–1250
Zivcak M, Brestic M, Olsovska K, Slamka P (2008c) Performance
Index as a sensitive indicator of water stress in Triticum
aestivum. Plant Soil Environ 54:133–139
Zivcak M, Brestic M, Balatova Z, Drevenakova P, Olsovska K, Kalaji
HM, Allakhverdiev SI (2013) Photosynthetic electron transport
and specific photoprotective responses in wheat leaves under
drought stress. Photosynth Res 117:529–546
Zivcak M, Kalaji HM, Shao HB, Olsovska K, Brestic M (2014)
Photosynthetic proton and electron transport in wheat leaves
under prolonged moderate drought stress. J Photochem Photobiol
B 137:107–115
66 Photosynth Res (2017) 132:13–66
123