
Error Modeling and Analysis for Travel Time Data …Paula J. Hammond, Secretary Olympia, Washington...
84
Error Modeling and Analysis for Travel Time Data Obtained from Bluetooth MAC Address Matching WA-RD 782.1 Research Report December 2011 ' ' t\• .l ·- . ,•. 'J -. • ,_ .- - - - - ' • Washington State Department of ansportation
Transcript of Error Modeling and Analysis for Travel Time Data …Paula J. Hammond, Secretary Olympia, Washington...

Error Modeling and Analysis for Travel Time Data Obtained from
Bluetooth MAC Address Matching
WA-RD 782.1
Research Report December 2011
' ' t..;.\• .l ·- . ,.•. 'J -. • ,._ .- - - - - ' •
:,: Washington State'ff /I Department of Transportation

Research Report Agreement T4118 Task 46
Bluetooth Time Data TNW 2011-01
TransNow Budget 61-8390
ERROR MODELING AND ANALYSIS FOR TRAVEL TIME DATA OBTAINED FROM BLUETOOTH MAC ADDRESS MATCHING
by
Yinhai Wang Yegor Malinovskiy Yao-Jan Wu Un Kun Lee
Professor Graduate Research Assistant
Graduate Research Assistant
Visiting Professor
Department of Civil and Environmental Engineering
University of Washington Seattle, Washington, 98195-2700
Washington State Transportation Center (TRAC) University of Washington, Box 354802
1107 NE 45th Street, Suite 535 Seattle, Washington 98105-4631
Washington State Department of Transportation Technical Monitor Matt Neeley
State ITS Research and Planning Engineer
Sponsored by
Washington State Department of Transportation
Paula J. Hammond, Secretary Olympia, Washington 98504-7372
Transportation Northwest (TransNow) University of Washington
135 More Hall, Box 352700 Seattle, Washington 98195-2700
and in cooperation with U.S. Department of Transportation
Federal Highway Administration
December 2011

TECHNICAL REPORT STANDARD TITLE PAGE
1. REPORT NO. 2. GOVERNMENT ACCESSION NO. 3. RECIPIENT'S CATALOG NO.
WA-RD 782.1 / TNW 2011-01 4. TITLE AND SUBTITLE
Error Modeling and Analysis for Travel Time Data Obtained from Bluetooth MAC Address Matching
5. REPORT DATE
December 2011 6. PERFORMING ORGANIZATION CODE
7. AUTHOR(S) 8. PERFORMING ORGANIZATION REPORT NO.
Yinhai Wang, Yegor Malinovskiy, Yao-Jan Wu, and Un Kun Lee 9. PERFORMING ORGANIZATION NAME AND ADDRESS 10. WORK UNIT NO.
Transportation Northwest Regional Washington State Transportation Center X (TransNow) Center (TRAC) Box 352700, 129 More Hall University of Washington, 354802 University of Washington 1107 NE 45th Street, Suite 535 Seattle, Washington 98195-2700 Seattle, Washington 98105-4631
11. CONTRACT OR GRANT NO. Agreement T4118, Task 46 DTRT07-G-00
12. SPONSORING AGENCY NAME AND ADDRESS 13. TYPE OF REPORT AND PERIOD COVERED
Washington State Dept of Transp U.S. Department of Transportation Transportation Building, MS 47372 Office of the Secretary of Transp.
Research Report
Olympia, Washington 98504-7372 400 7th St. SW 14. SPONSORING AGENCY CODE
Doug Brodin, 360-705-7972 Washington, DC 20590 15. SUPPLEMENTARY NOTES
This study was conducted in cooperation with University of Washington, Washington State Department of Transportation and the U.S. Department of Transportation 16. ABSTRACT
Travel time data had been very difficult to collect until recently. Current attempts at exploiting short-range communication protocols that rely on unique identifiers, primarily Bluetooth, have significantly simplified the travel time collection task. Many transportation agencies are now considering using Bluetooth travel time estimates to feed a variety of applications, such as user information systems. As Bluetooth-based travel time data collection increases in popularity, investigating the errors that are characteristic of this detection type becomes more important. A Bluetooth sensor, called the Media Access Control Address Detection (MACAD) system, was developed for travel time data collection in this study to facilitate testing system configurations and allow for future deployments. Three types of antennae and three different sensor arrangements were tested to determine the effects of these variables on travel time error. The collected travel time data were compared to license plate reader data, which, because of their relatively small detection zone for vehicle license plate recognition, were taken as the ground truth travel time. A regression model was used to investigate whether travel time error can be predicted with observable explanatory variables. Descriptive statistical analysis was also employed to evaluate the impacts of individual variables on the travel time error. The results suggested that a combination of sensors is desirable, despite the potential loss of accuracy, as the higher matching rates obtained by the system will improve sample size and reduce random error rates. Findings of this study are helpful to transportation professionals attempting to understand the errors associated with the Bluetooth-based travel time data collection technology and to configure the sensors to mitigate the errors. 17. KEY WORDS 18. DISTRIBUTION STATEMENT
Congestion, incident-induced delay, short-term traffic flow forecast
No restrictions. This document is available to the public through the National Technical Information Service, Springfield, VA 22616
19. SECURITY CLASSIF. (of this report) 20. SECURITY CLASSIF. (of this page) 21. NO. OF PAGES 22. PRICE
None None
DISCLAIMER
The contents of this report reflect the views of the authors, who are responsible for the
facts and accuracy of the data presented herein. This document is disseminated through
the Transportation Northwest (TransNow) Regional Center under the sponsorship of the
U.S. Department of Transportation UTC Grant Program and through the Washington
State Department of Transportation. The U.S. Government assumes no liability for the
contents or use thereof. Sponsorship for the local match portion of this research project
was provided by the Washington State Department of Transportation. The contents do
not necessarily reflect the views or policies of the U.S. Department of Transportation or
Washington State Department of Transportation. This report does not constitute a
standard, specification, or regulation.

CONTENTS
Section Page
Executive Summary ........................................................................................................ vii
1 Introduction ........................................................................................................... 1
1.1 Background ................................................................................................. 1 1.2 Problem statement ....................................................................................... 3
2 Review of Previous Work ..................................................................................... 7
2.1 Probe Vehicle-Based Travel Time Analysis ............................................... 7 2.2 License Plate Reader-Based Travel Time Analysis .................................... 8 2.3 Travel Time Estimation Based on Historical Data ..................................... 9 2.4 MAC Address-Based Travel Time Analysis .............................................. 9
3 System Design And Development ...................................................................... 13
3.1 System Design .......................................................................................... 13 3.1.1 Design Evolution .......................................................................... 13 3.1.2 Current Design Overview ............................................................. 15 3.1.3 Communications Design ............................................................... 16
3.2 Data Outliers and Filtering ........................................................................ 18 3.2.1 Outlier Sources .............................................................................. 18 3.2.2 Data Filtering ................................................................................ 19
4 System Testing ..................................................................................................... 22
4.1 SR 520 Freeway Test in Seattle, Washington ........................................... 22 4.2 Rural Tests in Richland, WAshington, and Yreka, CAlifornia ................ 27 4.3 Border Delay Testing ................................................................................ 29
5 Primary Experiment Design .............................................................................. 38
5.1 SR 522 ALPR Test Corridor ..................................................................... 38 5.1.1 Corridor Description ..................................................................... 38 5.1.2 Corridor Spectrum Noise Testing ................................................. 39
5.2 MAC Address Data Aquisition ................................................................. 42 5.3 License Plate Data ACquisition ................................................................ 44 5.4 Test Configurations ................................................................................... 45
6 Field Experiment and Data Analysis ................................................................. 47
6.1 Error Analysis, Westbound ....................................................................... 48
iii

6.1.1 Descriptive Analysis, Westbound Direction ................................. 48 6.1.2 Error Modeling, Westbound ......................................................... 52
6.2 Error Analysis, Eastbound ........................................................................ 54 6.2.1 Descriptive Analysis, Eastbound Direction .................................. 54 6.2.2 Error Modeling Eastbound ............................................................ 57
6.3 Configuration Comparison........................................................................ 58 6.3.1 Westbound .................................................................................... 58 6.3.2 Eastbound ...................................................................................... 62 6.3.3 Configuration Comparison Summary ........................................... 64
7 Conclusions and Recommendations .................................................................. 65
7.1 Conclusions ............................................................................................... 65 7.2 Recommendations ..................................................................................... 68 Acknowledgements ............................................................................................... 70
References ........................................................................................................................ 71
iv

LIST OF FIGURES
Figure Page Figure 1-1: Segment composition ....................................................................................... 4
Figure 3-1: MACAD device evolution ............................................................................. 15
Figure 3-2: STAR Lab Bluetooth detector (MACAD device) used in this study ............. 16
Figure 3-3: Bluetooth data collection and distribution diagram ....................................... 17
Figure 3-4: DRIVE NET Bluetooth data collection interface .......................................... 18
Figure 3-5: STAR Lab MAC address processing software screen shot ........................... 20
Figure 5-1: Study route on SR 522 [Image from maps.google.com] ................................ 38
Figure 5-2: Spectrum average for 170th St NE. ............................................................... 40
Figure 5-3: Spectrum average for NE 61st Ave. ............................................................... 41
Figure 5-4: Spectrum noise image .................................................................................... 42
Figure 5-5: Lane-ft coverage of a 12-dBi directional sensor at NE 170th St ................... 44
Figure 5-6: Sensor configurations [Background images from maps.google.com] ........... 46
Figure 6-1: Sensor detection zones ................................................................................... 48
Figure 6-2: Travel time comparison westbound SR 522 (ALPR – blue, BT – red +
orange) (1hr averages) ................................................................................... 50
Figure 6-3: Westbound SR 522 error and volume (1hr averages) .................................... 51
Figure 6-4: Travel time comparison eastbound SR 522 (ALPR – blue, BT – red + orange)
(1-hr averages) ............................................................................................... 55
Figure 6-5: Eastbound SR 522 error and volume (1-hr averages) .................................... 56
Figure 6-6: a) Westbound detection rates normalized by ALPR volume b) Westbound
matching rates normalized by ALPR volume ................................................ 61
Figure 6-7: a) Eastbound detection rates normalized by ALPR volume b) Eastbound
matching rates normalized by ALPR volume ................................................ 63
v
LIST OF TABLES
Table Page
Table 5-1: Bluetooth device mounting and antenna configurations ................................. 43
Table 6-1: Westbound error regression model results ...................................................... 53
Table 6-2: Eastbound error regression model results ....................................................... 57
Table 6-3: Westbound 15-minute aggregate error statistics by configuration .................. 59
Table 6-4: Eastbound 15-minute aggregate error statistics by configuration ................... 62
vi

EXECUTIVE SUMMARY
The growing popularity of mobile devices, combined with the wireless communications
used to connect these devices to each other and the Internet, has allowed researchers to
develop a Media Access Control (MAC) address-based tracking method for collecting
corridor travel times. This approach relies on recording the MAC addresses of bypassing
devices at one location and noting the time difference between matching MAC addresses
at a different location. Because of its significantly lower overall cost, ease of deployment,
and relatively fewer privacy concerns in comparison to traditional methods, interest in
this means of collecting travel time data is growing.
Although MAC address-based collection techniques have significant advantages in
most aspects, there are some drawbacks to their use. Relatively small sample size is an
issue for some purposes; most studies using MAC address matching have found that they
are able to capture somewhere between 5 to 10 percent of the total vehicle volume. An
additional, and perhaps more serious, issue is the ambiguity of accuracy due to the
inherent properties of the MAC address broadcast protocols. Because the Bluetooth
readers are capable of detecting MACs within a specific range, the travel times obtained
can be thought of as zone to zone. Since these zones can be large, a certain level of
uncertainty exists when MAC addressed-based travel times are used.
The purpose of this study was to investigate the Bluetooth travel time errors that are
inherent in the data collection technique and to develop a robust MAC address sensor
device (recorder).
A Bluetooth protocol-based device, the Media Access Control Address Detection
(MACAD) system, was developed and tested in this study. The current MACAD device
vii

design consists of three main components: (1) a Bluetooth chipset that constantly scans
the available channels, (2) a 60 GHz ARM processor that records MACs, and (3) a GPS-
enabled communications module that synchronizes to Universal Time Coordinated
(UTC) time and transmits data in near real-time using the Global System for Mobile
Communications (GSM) standard. This device provides an excellent base for testing
mounting locations and various antennae, as it can be mounted to signposts and signal
posts and will accept a wide range of antenna types. The current design allows the device
to function for up to a week without external power by using one 6-cell LiPo pack
(15.6Ah capacity at 3.7V). The device also allows for up to two battery packs at a time,
which create a maximum runtime of two weeks without external or solar power. As data
are collected, they are sent over the GSM network to a server in the Smart Transportation
Applications and Research Laboratory (STAR Lab) of the University of Washington,
where the data are uploaded to the Digital Roadway Interactive Visualization and
Evaluation Network (DRIVE Net), currently being developed by the STAR Lab as a data
sharing, modeling, and online analysis platform. This approach to data collection allows
real-time information flow to users while maintaining a level of privacy.
Multiple tests were conducted in a variety of locations to evaluate the device’s ability
to measure travel times in freeway, arterial, and highway conditions. An extensive test
was conducted on SR 522 in Seattle, Washington, where the travel times obtained from
Bluetooth devices were compared to those collected by Automatic License Plate
Recognition (ALPR) devices mounted at intersections. Error analysis performed on the
resulting data produced a set of recommendations for future Bluetooth deployments and
studies:
viii

ix
(1) Bluetooth-based MAC address matching is an effective, low cost means for travel
time data collection. Bluetooth-based travel times are sufficiently accurate for most
transportation applications. However, because slower vehicles have a better chance to be
detected by Bluetooth readers, Bluetooth-based travel times tend to slightly overestimate
travel time.
(2) Extraneous delay sources such as traffic signals and nearby bus stops may worsen
the overestimation, and efforts must be made to mount and configure the MACAD
systems to avoid such undesirable factors.
(3) A method for correcting the travel time bias caused by the Bluetooth protocol is
highly desirable and should be developed in future studies.
(4) Combinations of sensors working in tandem were found to help reduce error in
most cases. Tandem set-ups greatly increase the detection and matching rates, which is
important for time-critical applications such as real-time travel information.
(5) Sensor configuration can significantly affect the performance of the Bluetooth-
based travel-time collection system, especially if the chosen corridor has a short travel
time. The travel time data collected with Bluetooth sensors along the 0.98-mile-long
corridor tested in this study for sensor configurations produced average errors of between
2.4 and 11.4 seconds (4 percent to 13 percent). The absolute errors were mostly
determined by sensor configuration and surrounding conditions and may not have
changed with the length of a corridor. This suggests that the relative errors will decrease
when corridor travel time increases, meaning that longer corridors will produce better
performance by the Bluetooth-based data collection systems.

1 INTRODUCTION
1.1 BACKGROUND
Travel time is considered to be one of the most important transportation metrics, as it is
easily understood by roadway users. Travel time is often directly conveyed to users
through the use of dynamic message signs (DMS), 5-1-1, and online systems to allow
individuals to make choices about their routes. The Federal Highways Administration
(FHWA) has encouraged jurisdictions to provide travel time estimates through existing
DMS infrastructure (Paniati, 2004). The Travel Time Handbook, published by the
FHWA, provides an extensive overview of travel time data collection methodologies,
listing three major means of obtaining travel time estimates for a corridor: “active” test
vehicles, license plate matching, and “passive” probe vehicles (Travel Time Data
Collection Handbook, 1998). The handbook mentions platoon and video matching as
potential emerging methods, but the three primary technologies mentioned have been the
most common means of obtaining travel time information for the past few decades.
However, in the past few years, a new methodology for obtaining travel time
measurements has been generating interest. The growing popularity of mobile devices,
combined with the wireless communications used to connect these devices to each other
and the Internet has allowed a Media Access Control (MAC) address-based tracking
method to be developed. This approach relies on recording the MAC addresses of
bypassing devices at one location and noting the time difference between matching MAC
addresses at a different location. This approach is becoming very popular because of its
significantly lower overall costs, ease of deployment, and fewer privacy concerns in
1

comparison to the three traditional methods outlined in the Travel Time Data Collection
Handbook (Turner et al., 1998). The lower costs are primarily related to the lower cost of
the Bluetooth reader, as well as the fact that one MAC address collection device spans
multiple lanes, which is of significant advantage in comparison to Automatic License
Plate Recognition (ALPR) systems that require lane-based detection. Additionally,
Bluetooth-based travel time data collection systems are easy to install and do not require
high bandwidth for communications. In comparison to Global Positioning Systems (GPS)
strategies, the MAC address-based systems do not require willing volunteers with
properly equipped vehicles whose GPS coordinates are constantly being recorded;
instead, the MAC address is broadcast freely to all surrounding devices. Users who do
not wish to disclose their location can simply turn off the broadcast function of their
MAC device, although it is difficult to tie a particular MAC to an individual.
Although the MAC address-based collection techniques have significant
advantages, there are some drawbacks to their use. Relatively small sample size is an
issue for some purposes; most studies using MAC address matching have found that they
are able to match somewhere between 5 to 10 percent of the total vehicle volume. An
additional, and perhaps more serious, issue is the ambiguity of accuracy due to the
inherent properties of the MAC address broadcast protocols. One of the most common
protocols is known as Bluetooth, published by Special Interests Group (SIG,
https://www.bluetooth.org/). This protocol is common in mobile telephones and has been
the focus of MAC address-based travel time estimation. The uncertainty about the
accuracy of the use of the Bluetooth protocol for travel time measurement comes from
the random frequency hopping characteristic of the protocol. Because the protocol was
2

designed to function in the same 2.4-GHz band as WiFi, a frequency hopping mechanism
was implemented to prevent interference (Special Interests Group, 2010). The constantly
changing frequency mandated by the Bluetooth protocol could delay the device
connection time by up to 10.24 seconds. This “connection time” complication is further
exacerbated by the variety of ranges that receiving Bluetooth sensor devices may have.
However, devices mounted in tandem could provide better results by increasing the
detection range and decreasing detection time. These complications in using MAC
address-based travel time measurements have not yet been investigated in detail by the
transportation research community.
1.2 PROBLEM STATEMENT
Obtaining travel time measurements with Bluetooth devices involves matching an
observed MAC address between at least two locations. The difference in time between
the two observations yields the travel time. Because the Bluetooth readers are capable of
detecting MAC addresses within a specific range, the travel times obtained can be
thought of as zone to zone rather than point to point, as a Bluetooth reader’s detection
range is much larger than the window of video-based detection approaches like ALPR.
This is illustrated in Figure 1-1, where the dashed lines represent Bluetooth detection
zones and the squares represent the ALPR detection “points.” The average travel times
obtained from both types of sensors can be expressed as follows:
(1)
, ,1
( ( ) ( ))( )
km
i A i Bi
ALPRk
t k t kTT k
m=
−=∑
3

(2)
, ,1( ( ) ( ))
( )
kn
j A j Bj
BTk
t k t kTT k
n=
−=∑
where and are the ALPR-based and Bluetooth-based average travel
times, respectively, between nodes A and B during period ; m and n are the number of
observations by ALPR- and Bluetooth-based systems, respectively; and t is the time
stamp when a license plate or a Bluetooth device is detected. A vehicle’s MAC address
may be detected multiple times by the Bluetooth sensor, so it is imperative that the
convention is consistent, either matching first detection to first detection or last detection
to last detection, to mitigate detection errors.
( )ALPRTT k ( )BTTT k
k
Link Node BNode A
Zone A Zone B
Figure 1-1: Segment composition
The purpose of this study was to investigate the Bluetooth travel time errors that
are inherent to the collection technique. In particular, the authors realized that the travel
times reported by Bluetooth devices are subject to the following sources of error:
• Spatial error: A Bluetooth-equipped vehicle may be detectable anywhere in the
circle of the detection zone. However, the detection zone radius varies with
4

different Bluetooth detectors, in-traffic Bluetooth devices, and environments.
Furthermore, because the Bluetooth signal is easily affected by home appliances,
such as microwaves and wireless phones in residential areas (Bullock et al.,
2010), the detection zone formed by an omni-directional antenna is usually an
irregular shape rather than an ideally circular area.
• Temporal error: A Bluetooth-equipped vehicle can be detected anytime in a time
range of up to 10.24 seconds after it enters the detection zone. It can also be
missed entirely or be detected multiple times, depending on the time it stays in the
detectable area and possible interfering signals at that moment. The time until its
first detection is determined by several factors, such as the probabilistic
characteristics of channel hopping behavior, the signal strength from the
Bluetooth device, are sensitivity of the Bluetooth detector (Special Interests
Group, 2009).
• Sampling error: This type of error results from the sampling process of Bluetooth
devices in traffic. First, multiple Bluetooth devices in the same vehicle may be
regarded as several vehicles, and the same vehicle’s travel time will be duplicated
in calculations. Second, fast-moving cyclists could be counted as vehicles, since
the Bluetooth reader may record travel times from multiple transportation modes,
such as pedestrians, cyclists, and bus passengers, in addition to motor vehicles. In
contrast, ALPR readers collect only motor vehicle travel time data.
To analyze Bluetooth travel time error, ALPR-collected travel times were used as
benchmarks. Relative to the large detection zone of a Bluetooth device, an ALPR has a
very small detection window. This window resulted in a small travel time error,
5

particularly at higher speeds (Mizuta, 2007). Therefore, ALPR-collected travel times
were chosen to serve as ground-truth data in this study. After travel times were calculated
from equations (1) and (2), the absolute travel time error for each period k was
calculated as
( )
(3)
E k
( ) ( ) ( )LPR kBT AE k TT k TT= −
The absolute travel time error was then used to compare a variety of Bluetooth sensor
configurations to determine which was most accurate in comparison to the ALPR sensors
mounted at the same location. The short length of the corridor studied greatly exacerbated
any detection errors relative to the total travel time, and this process ensured that the
errors were significant and their determination relevant.
6
2 REVIEW OF PREVIOUS WORK
Travel time information is regarded to be of primary importance in user information
systems. As of 2005, over 300 million dollars have been invested into dynamic message
signs (DMS) nationwide, with the FHWA recommending that the default message (when
higher priority information is not available) should state estimated travel times to popular
destinations. Such systems have gained much support from the public as well, with 85 to
90 percent of roadway users responding favorably in cities that had implemented such
systems, such as Seattle and Salt Lake City (Meehan, 2005). However, the quality and
usefulness of the DMS-based travel time information greatly depends on the accuracy of
travel time estimates. Inaccurate travel time estimates can have a detrimental effect on the
system, as users lose trust in the posted travel times and do not alter their decisions on the
basis of the information provided. Therefore, understanding the accuracy of the available
means of collecting travel time information is critical. The FHWA guidelines suggest a
maximum error of +/-20 percent, with an ideal goal of +/-10 percent error. This chapter
reviews the current travel time data collection methods and their associated error sources.
2.1 PROBE VEHICLE-BASED TRAVEL TIME ANALYSIS
Probe vehicle-based analysis relies on a willing volunteer vehicle, or set of vehicles, to
provide travel times along the corridor in question. Probe vehicles may be simply hired
vehicles that drive the corridor and report travel time or may be GPS-equipped vehicles
that relay their exact coordinates, from which corridor travel time information can be
extracted. In the past, this type of data collection has been fairly expensive, involving the
use of special vehicles and hired drivers, but it has recently become much more
7

affordable because of increased use of GPS among fleet vehicles, as well as the capability
of purchasing GPS data from routing service providers such as TomTom or Google.
While individual, representative, “pilot” vehicle results can be very accurate, results
coming from fleet services such as taxis and delivery trucks may be significantly
different, depending on the number of stops the driver makes. Additional concerns arise
for GPS data from freight trucks, as their speeds tend to differ from those of passenger
cars under identical conditions. Another potential drawback of using GPS probe vehicle
data is the relatively small sample size that can be attained. Test vehicle runs often
represent an insignificant fraction of the total volumes, and fleet-based GPS penetration
rates are also quite low if one considers the size of the whole traffic population.
2.2 LICENSE PLATE READER-BASED TRAVEL TIME ANALYSIS
ALPRs extract travel time data by using Optical Character Recognition (OCR) software
to read license plate numbers at one location and then match them with reads at another.
This approach provides a nearly complete record of the vehicle populations within the
lane of analysis, with detection rates of up to 98 percent possible with properly mounted
cameras (Mizuta, 2007). The accuracy of this approach is very high because of a limited
detection zone and nearly instant recognition; however, improper OCR matching may
create false positives, resulting in erroneous data. Such error rates have been noted to be
around 8 percent (Pokrajac et al., 2009).
Although ALPR systems demonstrate some of the most accurate results, their cost
is often prohibitively high. In order to instrument a four-lane arterial, a minimum of eight
sensors is needed (four at each corridor location, two in each direction). Sensor prices
have been around $10,000 each, resulting in an $80,000 price tag for a four-lane arterial,
8

and that does not yet include mounting arms/booms and installation costs. The expenses
involved with such systems have resulted in their limited deployment, despite their
advantages in accuracy.
2.3 TRAVEL TIME ESTIMATION BASED ON HISTORICAL DATA
Travel time estimation based on historical data in conjunction with available sensor data,
predominantly loop data, has been a popular means of estimating travel time. Speeds
obtained from individual loops based on an average vehicle length are extrapolated over
the corridor, and the corresponding travel times are computed and compared against
historical data (Monsere et al., 2006). This approach requires existing sensor
infrastructure as well as historical records, and therefore may not be applicable to all
corridors. Accuracy is another major concern when this approach is used. A study by
Monsere et al. (2006) showed that, on average, the link travel time estimates obtained by
such an approach are within the FHWA-suggested 20 percent error margin. However, the
study found that incidents and special events create situations in which this approach is
no longer within the accepted accuracy range.
2.4 MAC ADDRESS-BASED TRAVEL TIME ANALYSIS
The increasing ubiquity of electronic devices in our daily lives, combined with the need
for those devices to communicate among each other, has created a steady stream of
information that is generated and maintained around our immediate vicinity. This has
become a lucrative information source for all those wishing to determine the travel
patterns of individuals, with tracking happening in zoos, shopping malls, and airports
(Bullock, 2010). Of the several available data exchange protocols available, Bluetooth
9

has become by far the most popular. The transportation community has become
increasingly interested in Bluetooth tracking, particularly for the collection of travel time
data (Ahmed et al., 2008; Wasson et al., 2008; Tarnoff et al., 2009; Haseman et al., 2010;
Haghani et al., 2010 and Quayle et al., 2010). Tracking via Bluetooth provides an
inexpensive and simple means of collecting data that could otherwise be obtained only by
using probe vehicles or ALPR. Therefore, the number of jurisdictions that are interested
in using Bluetooth sensors has increased drastically, with applications ranging from work
zone delay estimations (Haseman et al., 2010) to facility improvement “before and after”
studies and traveler information systems.
The popularity of the approach can be attributed not only to the significantly
lower costs of data collection, but also to the relative ease of the sensor construction and
customization. In fact, at least half a dozen groups in the U.S. appear to be now
manufacturing their own Bluetooth sensors (Traffax, TraffiCast, CalTrans, WSDOT/UW,
TTI, Kittleson). Although the basic hardware for these devices may be similar, the
antenna choices (physical size, directional properties or gain) and mounting strategies
vary. While this creates a good opportunity for innovation and experimentation, relatively
little research has been done to systematically evaluate the effects of these variables on
the detection accuracy of the devices. Haghani et al. (2010) compared Bluetooth travel
times with those from floating car data and demonstrated that the travel times collected
by Bluetooth sensors are not significantly different from actual travel times.
Even though the Bluetooth-based method has been demonstrated on freeways and
arterial corridors, several important issues have not been addressed by previous studies.
The first one is the temporal error introduced by the channel scan process. Bluetooth
10

splits the 2.4-GHz band into 79 channels, with 32 of them used for detecting nearby
devices during the discovery process. Typically, a Bluetooth detector sends a message to
each channel repeatedly and waits for the reply from the nearby devices. Although the
discovery process takes about 5 seconds on average, it may take up to 10.24 seconds in
theory (Huang and Rudolph, 2007). In other words, a Bluetooth device may be detected
at any time from 0 to 10.24 seconds after it enters the detection range, resulting in errors
in travel time estimation.
The second issue stems from the spatial uncertainty related to when a Bluetooth
MAC address is registered. The Bluetooth-based method is subject to various spatial
errors because of different device types, antenna types, and geometric configurations of
Bluetooth detectors. Given the above spatial and temporal uncertainties, the accuracy of
Bluetooth-based travel time measurements is unclear to the researchers and practitioners.
The last issue relates to noisy sources of MAC addresses. Detected Bluetooth
devices may be carried by passenger cars, buses, bicycles, or pedestrians. Proper filtering
procedures must be applied to screen out travel time measurements from transportation
modes other than those of interest. For all these reasons, an in-depth analysis of errors in
Bluetooth MAC address-based travel time data is important for understanding the
limitations of this new technology.
Error modeling has been widely employed for sensor evaluation and calibration.
Hao-Hsiang and Ling-Jyh (2011) have recently developed Bluetooth error models.
However, the analytical models used Markov chains to consider only the error resulting
from the theoretical channel hopping process. Such models are difficult to apply and are
11

not directly helpful for understanding the errors associated with the travel time data
collected by the Bluetooth-based method.
This investigation attempted to better characterize the error that is inherent in the
Bluetooth detection technology by formulating an initial relationship between error and
antennae type, strength, and mounting configurations. The objectives of this study were
as follows:
• Develop a Bluetooth MAC Address Detection (MACAD) system.
• Extract travel time data for a highway section by using Bluetooth MAC address
matching.
• Evaluate the travel time data error of the Bluetooth-based method by comparing
travel time data from Bluetooth MAC address matching and ALPR.
• Conduct a thorough investigation of the error sources of the Bluetooth-based
travel time data collection method.
• Propose error control guidelines for Bluetooth-based travel-time data collection.
12

3 SYSTEM DESIGN AND DEVELOPMENT
3.1 SYSTEM DESIGN
As of early 2009, very few commercially available Bluetooth readers were on the market,
and their accuracy levels were largely untested and unknown. Furthermore, to understand
Bluetooth-based travel time measurement errors, a number of different configurations
involving different antennae had to be tested, requiring a custom solution. Therefore, a
significant amount of effort was invested into designing and testing a device that would
be not only able to perform well but was also very modular. Additional considerations
were given to the devices’ eventual professional use, allowing not only a variety of
antenna choices but also power and communications options.
3.1.1 Design Evolution
Throughout the project, the designed MACAD device has gone through two version
changes and a number of upgrades. Figure 3-1 outlines the evolution of the device
throughout the year-long design process. The first version of the device was based on a
Gumstix platform. The Gumstix platform provides a full Linux-based operating system
running on a 600 MHz processor, all on a footprint about the size of a stick of gum
(Gumstix, 2010). The device was powered by eight “D” cell batteries, which allowed it to
function continuously for 40 hrs. At the time, an 8-dBi “rubber duck” external antenna
and a 12-dBi in-lid antenna were used with a DCE-ANT NEMA 6 rated enclosure.
Although this set-up provided ample processing power and functioned well, there were
concerns about the relatively short running time, as well as the use of “D” cell batteries in
wet environments, which was not recommended by WSDOT field engineers.
13

To reduce power consumption, a 60-MHz processor was chosen for the second
version of the device (V2.0). This greatly increased run time, allowing the device to
operate for five days on just six “D” cell batteries. However, concerns about oxidation of
the batteries, as well as the general wastefulness of single-use batteries, prompted
development of a rechargeable battery-based system. Version 2.1 of the system included
a lithium-iron (LiFE) rechargeable battery and an N-Male interface that allowed for a
variety of waterproof, external omni-directional Laird antennae to be mounted on the
device.
After V2.1 had been completed, questions arose about data communication:
previous versions had been saving the data onto MicroSD cards, which had to be
extracted before data analysis. Although this was convenient for short tests, additional
information during longer tests was seen as an advantage. Eventual practical deployment
of the device also would require a means to transfer data in real time, allowing for use in
conjunction with user information systems. A GPS/Global System for Mobile
Communications (GSM) module was added to the device to resolve both
communications and clock synchronicity issues. Finally, a custom board was designed to
hold all of the components, and yet another battery was chosen. The reasoning behind
switching from LiFE to lithium polymer (LiPo) batteries was mainly practical: LiPo
batteries could be charged significantly faster, on the order of hours instead of days, than
LiFE batteries. With the design finalized, four units were produced for field testing. The
exact end product is described in greater detail in the following section.
14

Figure 3-1: MACAD device evolution 3.1.2 Current Design Overview
The current device design consists of three main components: (1) a Bluetooth chipset that
constantly scans the available 79 channels, (2) a 60-GHz ARM processor that records
MAC addresses, and (3) a GPS-enabled communications module that synchronizes to the
Universal Time Coordinated (UTC) time and transmits data in near real-time using the
GSM network. The device is enclosed in a weatherproof NEMA-rated box (254x180x57
mm or 10x7.1x2.25 in.), which provides a port for an external antenna, as well as a space
for a 12-dBi directional antenna in the lid, as shown in Figure 3-2. This provides an
excellent base for testing mounting locations and various antennae, as it can be mounted
to signposts and signal posts and will accept a wide range of antenna types. The current
design uses one 6-cell LiPo pack (15.6Ah capacity at 3.7V), allowing the device to
function for up to a week without external power. The device can accommodate two
15

battery packs at a time, resulting in a maximum runtime of two weeks without external or
solar power.
a) Mounted device b) Device interior
Figure 3-2: STAR Lab Bluetooth detector (MACAD device) used in this study
Solar power compatibility was also considered in the design, and a solar power
module has been designed and tested. The device operates on the power provided by the
battery, which is in turn charged by the solar panel. Preliminary testing showed the
discharge rate is lower than the received solar power input rate, indicating that continuous
operation is possible. However, a longer testing phase is necessary to ensure that the
chosen solar panel is sufficiently large to power the unit for a full season, as winter solar
power tends to be lower, particularly in Western Washington.
3.1.3 Communications Design
Once mounted, the device synchronizes to the UTC time using the communications
module. In addition to synchronizing over the GPS network, the system also sends its
exact coordinates via GSM. These coordinates are then used for automatic geospatial
organization of deployed sensor units. This initialization routine is repeated at regular
16

intervals to prevent clock drift (Quayle et al., 2010) and to ensure that the device is
functioning properly and has not been tampered with. Once the synchronization and
location recording are complete, the device begins data collection, recording the
bypassing MAC addresses and their respective timestamps. As data are collected, they
are sent over the GSM network to a server in STAR Lab, where the MACs are kept for a
specified period (currently 60 minutes). If a matching MAC is received during this
period, a travel time is calculated, the MAC address is deleted, and the data are uploaded
to the Digital Roadway Interactive Visualization and Evaluation Network (DRIVE Net)
developed by the STAR Lab for data sharing, modeling, and online analysis (Ma et al.,
2011). This approach to data collection allows real-time information to flow to users
while maintaining a level of privacy. Figure 3-3 illustrates the overarching structure of
the data collection effort.
MAC
DRIVE NET
Calculate Travel Time
Strip MACs
Filter Results
MAC
via GSM
via GSM
Figure 3-3: Bluetooth data collection and distribution diagram
DRIVE Net facilitates data sharing, visualization, and aggregation and allows
users to view instrumented routes’ travel times in real time. A screenshot of the user
interface for accessing Bluetooth data can be seen in Figure 3-4. A user can click a
…
Users
17

specific corridor to find relevant information such as average travel time, as well as more
advanced statistics such as standard deviation. This platform allows for quick and
seamless data integration and comparisons, making it an ideal candidate for a data quality
study such as this one. Figure 3-4 shows the system in action: the user has selected a
particular corridor that was instrumented with the sensors and is able to view the travel
time trend as well as the mean and standard deviation. More details regarding DRIVE
NET and the Bluetooth data collection and visualization module can be found in (Ma et
al., 2011). Data collected by the sensors can also be retrieved for further processing,
which is covered in the next section.
Figure 3-4: DRIVE NET Bluetooth data collection interface
3.2 DATA OUTLIERS AND FILTERING
3.2.1 Outlier Sources
Once the MAC address data has been collected and matched within a 60-minute interval,
the resulting travel times must be filtered for outliers. There are numerous potential
18

sources of outliers in the travel time data. Perhaps the most apparent cause is drivers who
stop on their way through the corridor or choose a route that is significantly longer than
that of most travelers. This creates a delay that is not experienced by other travelers,
resulting in an outlier. Because the additional delay is unlikely to be a factor of the
roadway design or any other transportation considerations, it is of little interest in the
current scope. This type of outlier is often easy to recognize and is present in both ALPR
and MAC address matched travel time data.
An additional source of outliers is present only in ALPR data. As mentioned
previously, errors in the OCR analysis of license plates can result in matches between
plates that are similar in appearance but are in fact unique (such as plates containing the
number “1” and the letter “I”). Although the chances of such an error are quite low (8
percent, as mentioned before), the resulting errors can produce travel time estimates that
are not representative of the general pattern.
Multiple modes present along the same corridor can also cause outliers when one
is looking at auto-only travel times. Because it is difficult to differentiate between the
modes by using MAC addresses alone, the discrimination step occurs during the filtering
of the travel time data. Procedures for screening and filtering travel time data obtained
from MAC address readers are described in the following section.
3.2.2 Data Filtering
A customized computer program used to process both ALPR and Bluetooth MAC
address data was written in C# to facilitate analysis. A screen shot of the software is
given in Figure 3-5. The software system is capable of processing the data manually,
19

using two or more ALPR text files for matching (obtained from the MicroSD cards
mounted in the MACAD devices), or doing it automatically, using data that are sent to
the server via GSM communications. Regardless of the source of the data, the filtering
and aggregation techniques are identical.
Figure 3-5: STAR Lab MAC address processing software screen shot In addition to varying the record lifetime, which effectively filters any travel
times above a certain length (60 minutes was used in this study), the software allows a
moving median analysis to be conducted. A moving median filter, based on the one used
by Quayle et al., was used. Assuming that there were N MAC address matches in time
window t from x - t/2 to x + t/2, then the standard deviation of these N samples could be
calculated on the basis of a sliding time window to filter the results:
(4)
20

where is the ith matched travel time and is the mean calculated for moment x using
data collected from x - t/2 to x + t/2. If a particular travel time measurement was within
one standard deviation above the localized mean, it was accepted as a valid data point. A
time window of 15 minutes was used in all analysis scenarios in this study, as it provided
sufficient resolution to demonstrate any congestion delay peaks and was broad enough to
smooth over occasional outliers.
Offline analysis for small data sets was performed with Excel; the software
system automatically outputs aggregated data from all included sources as an “.xls” file.
Online analysis was performed with Google Maps API tools, which is an interactive
timeline interface that allows users to view ongoing trends within a specified time
window and provides basic statistics such as average trip time and standard deviation for
the selected time window.
21

4 SYSTEM TESTING
4.1 SR 520 FREEWAY TEST IN SEATTLE, WASHINGTON
One of the primary concerns with Bluetooth detection is the device’s ability to capture
fast moving vehicles. As mentioned before, since the Bluetooth protocol requires up to
10.24 seconds to detect a vehicle, it is imperative that the detection range of the MACAD
system is sufficient to work at high speeds. For example, if a vehicle is moving at 60
mph, the detection zone needs to be no smaller than 900 ft (275 m) in diameter to
guarantee that the vehicle is in range for at least 10.24 seconds.
A freeway test was conducted on February 22, 2009, early in the development
cycle, to ensure that sufficient data could be collected from fast moving vehicles. The
chosen corridor was a 3-mile-long section of the SR 520 floating bridge in Seattle,
Washington, at the 24th Ave and 76th Ave overpasses. The speed limit on the bridge is 55
mph. The average speeds in free-flow conditions tend to be around 60 mph. A portable
ALPR system was borrowed from WSDOT to check the accuracy of the MACAD
obtained data. Figure 4-1 shows: a) the locations chosen for testing (the west side
location is at 76th Ave, and the east side location is at 24th Ave) and b) the testing set-up
at the 24th Ave location. The MACAD devices were equipped with 7-dBi antennae.
22

a)
b)
Figure 4-1: a) Selected freeway test corridor on SR 520. b) Bluetooth sensor (left) and portable ALPR (right) used to collect travel time data at the 24th Ave location. The results confirmed the MACAD system’s ability to collect travel time data for
freeways. The sample travel time data collected by the MACAD were within
expectations and consistent with the ALPR-collected travel time data. During the hour-
long test, from 8:00 am to 9:00 am, the ALPR devices captured 1,957 vehicles at the 24th
Ave location and 1,368 vehicles at the 76th Ave location. Note that the ALPR sensors
captured just one of the two lanes in the westbound direction. The numbers of unique
MAC addresses obtained by the MACAD devices at the two locations were 432 at 24th
Ave and 190 at 76th Ave. Shielding caused by one of the concrete barriers on the 76th Ave
23

overpass was thought to be responsible for that location’s lower detection rate. The
MACAD matching rate was 61 percent for the corridor or 116 matches of a maximum
possible 190, while the ALPR system’s matching rate was 39 percent or 533 matches of a
maximum possible 1,368. Although the ALPR system was able to obtain more samples
from a given direction, the MAC address method was capable of covering all lanes and
both directions while providing a higher matching rate.
The acquired travel times were aggregated and filtered as described above, and
the two means of collecting the data were compared. Figure 4-2a shows the comparison
between ALPR and Bluetooth travel times on SR 520 in the westbound direction (the
only direction measured with ALPR devices). The average error for the hour-long test
was 9.6 percent, ranging from 6 percent to nearly 20 percent. One of the most noticeable
trends was that all the errors obtained were positive. In other words, Bluetooth-based
travel time estimates were consistently slower (higher travel times) than the “ground
truth” ALPR measurements. However, in this test the exact locations of the centerlines
and detection zones of the Bluetooth and ALPR sensors were not known; therefore, a
compensating adjustment was necessary. The two data sources were also compared by
adjusting the two datasets to a common mean. After a mean shift of .293 minutes, the
error rates decreased to a maximum of 9.4 percent and a minimum of -3.95 percent, well
within the FHWA recommended values. Figure 4-2b shows the resulting error and
Bluetooth travel times after adjustment.
Although the SR 520 test site would have been ideal for longer testing with a
number of configurations, as was subsequently done on SR 522, the use of a portable
ALPR unit required in-person data collection at both ends of the corridor. WSDOT
24

security concerns on freeway overpasses created further restrictions, allowing only an
hour of testing. SR 522 is equipped with permanently deployed ALPR units, making data
collection there significantly easier.
Note that the Bluetooth readers were mounted about 30 feet above the roadway.
Their detection range was thus significantly more than that provided by sensors mounted
near ground level (about 5 to 7 feet). The reason is that the antennae used in the
experiment have a downward tilt of about 5 degrees, so the range of the antenna increases
with height above ground plane. With the sensors at 30 feet, the detection range
theoretically grows to about 400 feet (radius), giving an 800-ft detection zone, or the
capacity to detect about 80 percent of the “detectable” traffic. This is consistent with the
60 percent matching rate observed.
25

Figure 4-2: SR 520 freeway test
26

4.2 RURAL TESTS IN RICHLAND, WASHINGTON, AND YREKA, CALIFORNIA
An additional concern with using MAC address-based data collection was the overall
penetration rate of MAC address broadcasting devices. Rural jurisdictions fear that the
population demographics and characteristics in metropolitan regions are sufficiently
different from and perhaps more “tech savvy” than those living in rural areas to make
MAC-based data collection effective in those areas. A smaller city in rural Eastern
Washington and a rural section of I-5 in California were tested to determine the validity
of such concerns.
Richland, Washington, is a city of about 47,000 and, despite being located in a rural
setting, is near a significant amount of hi-tech industry (Washington State Office of
Financial Management, 2009; Weiss and Schmitt, 2009). SR 240 and the intersections of
Van Giesen St and Swift Blvd were the primary focus sites in the study, as the mile-long
corridor experiences significant peaks in traffic volume during morning and afternoon
rush periods. Figure 4-3 shows MAC address-based travel time data collected by the
MACAD devices on July 12 through 14, 2010, in Richland. Southbound travel time
values are positive, while northbound values are shown as negative. A sufficient number
of data appear to be present within the city. The data clearly depict the morning
southbound peak (larger concentration of devices), but little delay is seen. However, the
afternoon peak, clearly visible in the opposite direction, increases travel times by up to
three times. This type of information is useful for growing rural cities such as Richland,
and the test showed that there are sufficient MAC address broadcasting devices in such
areas to consider further studies or deployment.
27

Figure 4-3: Bluetooth travel times collected by the MACAD devices in Richland, Washington
Additional testing in Yreka, California, occurred on a 7.6-mile stretch of I-5,
where average speeds often exceeded the 70 mph speed limit. This location provided an
opportunity to further test the device in high-speed freeway conditions, as well as rural
areas without significant commuter volumes. The test proved that the MACAD devices
are capable of detecting vehicles even at these higher speeds. Furthermore, the number of
bypassing MAC broadcasting devices was noted to be much higher than anticipated,
staying close to the 10 percent range recorded in urban areas. The prevalence of
Bluetooth dongles among truck drivers is considered to be a potential factor in such a
large number of devices broadcasting in rural areas.
28

4.3 BORDER DELAY TESTING
Border delay measurement is one of the potential uses of the developed technology.
Bluetooth-based technology is capable of providing the necessary re-identification
function at a fraction of the cost of current approaches. This would allow more border
crossing areas to provide delay estimates to inform drivers and to collect performance
measurement data. The SR 539 border crossing near Bellingham, Washington, was
chosen as a study site. This particular crossing is already equipped with license plate
readers, as well as inductance loop sensors capable of estimating the delay at the
crossing. Figure 4-4 shows the experiment set-up, with Bluetooth and license plate
readers installed at the intersection of SR 539 and Badger Rd and right before the U.S.-
Canada border. The distance between the sensors was determined to be 2.64 miles.
To facilitate the permission process, data were collected on the U.S. side only,
thus producing delay estimates for Canada-bound vehicles only. The speed limit along
this section of SR 539 is 40 mph, so at free-flow travel speeds, vehicles should be
expected to travel the study corridor in just under 4 minutes. Delays primarily occur on
weekends, resulting in queues that back up significantly but rarely past Badger Rd.
Parallel roads provide opportunities to those familiar with the region to jump the queue
and merge in at a later point. The test was conducted from May 16, 2011, to May 26,
2011, covering Victoria Day weekend, celebrated on Monday, May 23, 2011.
29

2.64 miles
Figure 4-4: SR 539 Border crossing test site
Sensors were attached to light poles approximately 6 feet off the ground. 9-dBi,
omni-directional antennae were used. Figures 4-5 and 4-6 show the placement of the
sensors on site. Approximately 1,200 Canada-bound unique valid matches were made
during the experiment, with approximately 120 detections per weekday and 240 per day
on weekends (including Victoria Day Monday).
30

Figure 4-5: SR 539 and Badger Rd. Bluetooth installation location
Figure 4-6: SR 539 U.S.-Canada border Bluetooth installation location
31

A comparison of raw data collected from both the on-site license plate readers and
the installed Bluetooth sensors is shown in Figure 4-7. The Bluetooth data shown were
filtered to discard travel times of 100 minutes or more. The PIPS ALPR system
aggregated the license plate reader data into 5-minute intervals, which effectively filtered
the data, smoothing over outliers. This aggregation also prevented detection of the queue
cutters that can be seen under the main delay peak observed on Victoria Day (May 23rd).
A number of outliers were present in the Bluetooth data, possibly from patrol vehicles
and local residents who did not enter the ALPR detection zone, but the majority of the
collected matches corresponded to the recorded ALPR travel time values. When the data
were filtered to 15-minute bins and outliers are removed in accordance with the
methodology described in Section 3.2.2, the result was an even closer match to the ALPR
data. A minimum Bluetooth travel time was used instead of average to minimize the
effect of non-crossing vehicles and devices. Some of the higher peaks did remain in the
Bluetooth dataset, likely because of fewer data points available during midday periods.
The comparison with ALPR aggregated 15-minute intervals is shown in green, as defined
by the difference between 15-minute bin results shown as a running average of 10 data
points. Taking ALPR values as ground truth, we see that the error is not as systematic as
was observed in the SR-520 test. Most notably, the Bluetooth sensors significantly
overestimate during low-volume periods, likely due to patrol vehicles and other local
non-crossing traffic. This can be mediated by a minimum sample size requirement, or by
simply not generating estimates during low-volume hours. However, during the Victoria
Day delay spike, the Bluetooth sensors underestimate the delay – the shortcutting
vehicles are biasing Bluetooth estimates to lower values than those achieved by ALPR
32

33
sensors, as the shortcutting vehicles are not detected by the ALPR system. Overall, the
Bluetooth sensors overestimated the delay by 2.56 minutes, for an average ground truth
travel time of 10.43 minutes. However, the lack of alignment between the sensors, noise
and shortcutting makes these comparisons unreliable.

Figure 4-7: Unfiltered Canada-bound delay at SR 539 border
34

35
Figure 4-8: Filtered Canada-bound delay at SR 539 border

A histogram of the delay experienced at the border is presented in Figure 4-9. The
distribution follows a predictable exponential decay trend, with most vehicles
experiencing less than 10 minutes of delay along the corridor. The free-flow speed travel
time of 3.98 minutes was subtracted from the total to obtain delay.
Figure 4-9: SR-539 border delay (*Delay = Travel Time – Free Flow Travel Time)
For further analysis of the collected data, the collected MAC addresses were
examined to determine the manufacturer of the detected device. This was done to see
which types of devices were most often detected. Figure 4-10 shows the most popular
devices detected at the SR 539 border crossing. Most of the devices were likely to be
handsets or headsets, with RIM, Nokia, Samsung and LG focusing primarily on that
market. However, other brands could definitely be attributed to passenger cars only, such
as Parrot SA, which produces predominantly car accessories such as hands-free phone
kits and navigation systems. While this knowledge may not be of much use now, trends
36

in wireless communications suggest that many more devices with very specific purposes
will be in use. Such devices could include a valve-cap pressure sensor that broadcasts tire
pressure to the main in-vehicle computer system or a temperature sensor on the vehicle
windshield. Knowing the types of devices present may allow for finer-grained analysis,
such as distinguishing between passenger vehicle and truck travel times.
Figure 4-10: Relative shares of detected device manufacturers
37

5 PRIMARY EXPERIMENT DESIGN
5.1 SR 522 ALPR TEST CORRIDOR
5.1.1 Corridor Description
A 0.98-mile section of SR 522 (Bothell Way NE in Washington state), shown in Figure
5-1, was selected for this study. The section is located on the northwest side of Lake
Washington. This corridor was ideal because of the availability of ALPR data along the
corridor, minimal pedestrian and cyclist presence, and a high volume of over 50,000
vehicles per day (Mizuta, 2007). The section started at NE 170th Street in the City of
Lake Forest Park and ended at 61st Ave NE in the City of Kenmore. The short length of
the corridor emphasized the need for error analysis and mitigation because the Bluetooth
device range, especially for stronger antennae, could contribute significantly to the travel
time error, as most travel times along the corridor were less than 2 minutes.
Figure 5-1: Study route on SR 522 [Image from maps.google.com]
38

5.1.2 Corridor Spectrum Noise Testing
Spectrum data were collected for this experiment to ensure that no significant source of
background noise would severely affect detection quality. Because the Bluetooth protocol
uses spread-spectrum frequency hopping, the device skips from frequency to frequency
and is thus largely not affected by local sources that may be operating within a narrow
band of the 2.399 MHz to 2.483 MHz spectrum. However, additional Wireless Local
Area Networks (WLAN) that cover the same location could significantly affect detection
performance by occupying large portions of the spectrum and rendering it unusable.
Because WLAN networks have only 11 different channels, each of which occupies 22 of
the 79 available Bluetooth channels (Hewlett Packard, 2002), the presence of multiple
WLAN networks in the area could significantly reduce performance if the signal
strengths of those networks was sufficient. It was important to ensure that the test sites
chosen did not contain significant contamination of the 2.4 GHz spectrum.
Figure 5-2 shows the spectrum characteristics at the 170th St NE site. Each point on
the graph represents a 1-hour average along a 327-KHz strip of the spectrum, for a total
of 256 strips. The figure shows that the location had several active networks that
occupied some bands, but the signatures were narrow, creating little competition for
Bluetooth devices. More importantly, the magnitude of the detected networks was very
small, with the highest peaks reaching well under -100 dBm. Signals below -100 dBm are
considered to be out of range for the directional and omni-directional antennae, thus
having little impact on the detection speed.
39

Figure 5-2: Spectrum average for 170th St NE.
Figure 5-3 shows a similar diagram for the NE 61st Ave site. The signature at this
location was slightly different, as two WLAN networks were present, shown on the right
side as the wide peaks. However, the signal strengths were still too weak to cause any
significant interference to Bluetooth detectors.
40

Figure 5-3: Spectrum average for NE 61st Ave.
To determine the effects of mounting two MACAD devices adjacently and
operating them concurrently, a short test was conducted to see the number of “collisions”
that the devices would experience. Figure 5-4 compares the overall noise levels when one
device was scanning versus when two devices were scanning. The graph shows the full
2.399 to 2.483 spectrum on the x-axis and time on the y-axis. Green areas represent
“clear” sections of the spectrum where signal was strong. Yellow represents sections with
some interference, and the red sections represent moments of strong interference,
indicating that another device was also using the spectrum. The testing was done at the
170th St site. On the basis of the resulting images, it is difficult to say that an additional
Bluetooth device had a significant effect on the number of collisions experienced by one
device. The amount of red and yellow areas remained roughly the same, indicating that
41

the additional device was unnoticeable among the noise. Both a) and b) of Figure 5-4
contain about 68 percent red and yellow sections.
Figure 5-4: Spectrum noise image
5.2 MAC ADDRESS DATA AQUISITION
Up to four MACAD devices, with a combination of antennae types, strengths, and on-site
placement positions, were used to collect travel time data. Table 5-1 shows the variables
considered in this study. Three types of antennae were used in testing: a 7-dBi
weatherproof, omni-directional antenna, a 9-dBi weatherproof, omni-directional antenna,
and a 12-dBi directional, 35-degree vertical and horizontal spread antenna mounted in the
lid of an MACAD device. These are denoted as “O7,” “O9,” and “D12” in Table 5-1.
42
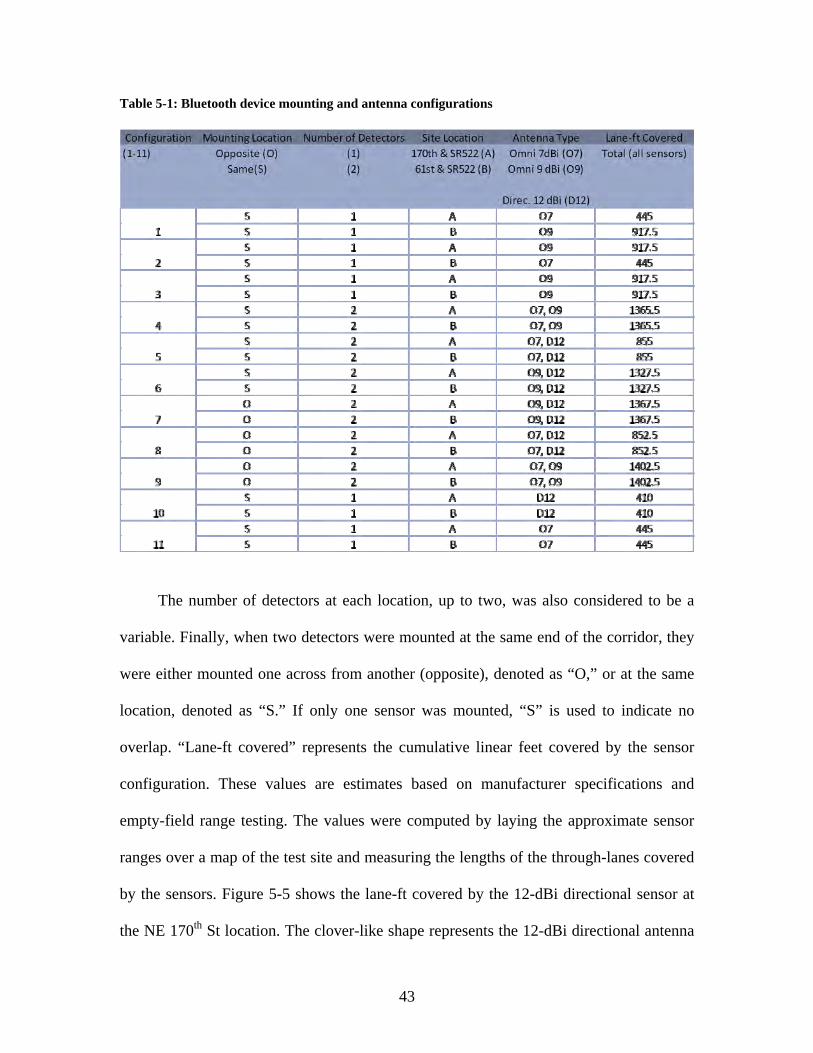
Table 5-1: Bluetooth device mounting and antenna configurations
The number of detectors at each location, up to two, was also considered to be a
variable. Finally, when two detectors were mounted at the same end of the corridor, they
were either mounted one across from another (opposite), denoted as “O,” or at the same
location, denoted as “S.” If only one sensor was mounted, “S” is used to indicate no
overlap. “Lane-ft covered” represents the cumulative linear feet covered by the sensor
configuration. These values are estimates based on manufacturer specifications and
empty-field range testing. The values were computed by laying the approximate sensor
ranges over a map of the test site and measuring the lengths of the through-lanes covered
by the sensors. Figure 5-5 shows the lane-ft covered by the 12-dBi directional sensor at
the NE 170th St location. The clover-like shape represents the 12-dBi directional antenna
43

bloom as specified by the manufacturer. The red lines indicate vehicle travel trajectories
in the detectable range. Eleven different configurations were tested and are summarized
in Table 5-1.
x
Figure 5-5: Lane-ft coverage of a 12-dBi directional sensor at NE 170th St
5.3 LICENSE PLATE DATA ACQUISITION
The examined section of SR 522 has a speed limit of 45 mph and is a six-lane arterial
with four inside general purpose lanes and two transit-only outside lanes. ALPR readers
are installed on the arms of the intersection signal heads to read license plates from the
rear of passing vehicles. All the westbound ALPR readers were designed to read the
vehicles traveling in the inside lane (closest to the median). All the eastbound readers
were designed to read the vehicles traveling in the outside general purpose lane (Mizuta,
2007). ALPR data are reported in aggregated 5-minute averages in the eastbound and
44

westbound directions. ALPR capture rates are also reported upstream and downstream
and are used as surrogates for volume data. Details of the installed systems can be found
in the PIPS Technology Product Overview (2009).
5.4 TEST CONFIGURATIONS
Detectors were conveniently mounted at a height of about 1.5 meters (5 ft) above the
ground on roadside signage poles. Directional sensors were pointed across the roadway,
near the westbound side of the route, as close as possible to the westbound ALPR
detection zones. Figure 5-6 shows all of the possible sensor footprints that were tested in
this study and their approximate detection zones. Bluetooth sensor locations are marked
with an “x,” and ALPR detection zones are shown as rectangles. These footprints were
permutated through 11 different configurations that represent the potential variability of
set-ups, bearing in mind the locations of the ALPR sensors. The directional antennae, for
example, were only mounted near the ALPR detection zones, as other placements were
unlikely to produce better results. The westbound side provided convenient mounting
locations for numerous sensors and was therefore chosen as the primary focus of this
study. The estimated ranges for the 7-dBi, 9-dBi omni-directional, and 12-dBi directional
antennae were 40 meters (131 ft), 70 meters (230 ft), and 40 meters (131 ft), respectively.
These sensors were configured to match the westbound ALPR detection zones as closely
as possible. Eastbound travel times picked up by these sensors were likely to be more
different from their ALPR counterparts, as they were separated by an intersection. This
was clearly shown in the collected data, and the results are hence presented separately.
Permutations with identical set-ups at each of the two locations (NE 170th St and
61st AVE NE) were primarily tested, but two configurations (1 and 2) with disparate
45

antenna strengths were tested as well. Each antenna type was tested by itself as well as in
tandem with another antenna type. During tandem tests for configurations 5 through 9,
data for configurations 10 and 11 were extracted by looking at only one sensor set (while
ignoring data from the other two). Since the measured interference between two devices
was minimal, the impacts of doing the two tests at once were considered negligible, while
they provided useful insights into the additional accuracy afforded by extra devices.
Figure 5-6: Sensor configurations [Background images from maps.google.com]
46

6 FIELD EXPERIMENT AND DATA ANALYSIS
Because of the misalignment between the eastbound ALPR detection zones and the
MACAD detection areas, the results for each direction are presented separately. As will
be shown in sections 6.1 and 6.2, the westbound measurements were more accurate than
the eastbound ones. This is due to the fact that the eastbound ALPR detection zones did
not correlate well with the antenna footprints. Figure 6-1 shows the approximate relative
positions of the detection zones and footprints. Last-to-last matching, or using the last
available timestamp for each bypassing MAC for matching, was used to obtain the travel
times on SR 522. This was done to minimize the effects of intersection delay on the
results, as the timestamp was taken after a vehicle left the intersection, regardless of
direction of travel. Although this approach demonstrated better results than first-first or
median matching, it was still insufficient to completely circumvent the problem, as the
last timestamp could still occur within the intersection area because of noise and signal
blockage issues.
The combinations of mountings, antennae strengths, and sensor quantities were
tested during the week of July 19 through 27, 2010. The tests were stopped for a break on
the afternoon of July 20th to the evening of the 21st, when the ALPR units were switched
off for maintenance.
47

Figure 6-1: Sensor detection zones
6.1 ERROR ANALYSIS, WESTBOUND
6.1.1 Descriptive Analysis, Westbound Direction
Figure 6-1 shows the 1-hour average travel time results in the westbound direction. Red
points and lines are Bluetooth (BT) travel times, while blue ones are ALPR travel times.
The testing intervals for each configuration are labeled; configurations 10 and 11 ran in
parallel with 5 through 9. To differentiate them from other configurations, their results
are shown in orange. Trend lines were generated by using a five-point moving average
window. Overall, the sensors followed the travel time trends recorded by the ALPRs. It
can be seen that tandem sensor configurations did a better job in following the trends.
Figure 6-2 demonstrates the 1-hour averages of error rates and volumes
encountered during testing in the westbound direction. Total volume in both directions is
shown in blue and error in red. The graph is once again segmented into the testing
configurations and error rates for each configuration; 10 and 11 are shown separately in
orange. Trend lines were generated by using a five-point rolling average. Because the
westbound approach had only one mounting location that was centered at the intersection
48

49
approach (NE 61st Ave (Opposite), see Fig. 6-1), the results show that although there was
some correlation with volume, some configurations were not as affected.
A closer look at the westbound data shows that configurations 5, 6, 7, and 8 were
almost unaffected by the additional intersection delay. These configurations contained a
directional antenna that successfully determined the vehicles waiting at the intersection
approach, outside its narrower range. Single sensor layouts also appear to have produced
a lower error. This was expected, as the smaller overall footprint reduced error, which
was especially true in the westbound direction, since the MACAD directional detection
beam was focused right over the ALPR detection point. However, this smaller footprint
reduced the total available matches, thus reducing the accuracy of the more precise 15-
minute intervals discussed in the next section.

Figure 6-2: Travel time comparison westbound SR 522 (ALPR – blue, BT – red + orange) (1hr averages)
50

Figure 6-3: Westbound SR 522 error and volume (1hr averages)
51

6.1.2 Error Modeling, Westbound
Initial efforts in interpreting the data focused on modeling the detection rate and relating
that to the accuracy of the acquired travel times. However, a look at the data collected at
the sites chosen in this study showed no immediate correlation between the detection rate
and accuracy. This was likely due to the effect of the delay superimposed by the signal
lights. To circumvent this issue, a more generic approach to error modeling was taken
that considered all possible variables and their relationship to accuracy. A multivariate
regression model was developed for each direction to determine which variables were
significant. A 15-minute time window was chosen to show variation in traffic patterns
while minimizing the effects of contamination by signal delay. All variables were
aggregated to 15-minute intervals. Ten variables were considered:
(1) Volume (Categorical: <500[LOW], <1000[MED], >1000[HIGH])
(2) Detection Rate (Percentage of Volume)
(3) Matching Rate (Percentage of Volume)
(4) Lane-ft Covered by All Sensors in Configuration
(5) Directional Antenna (Categorical: 0 [no],1 [yes])
(6) Opposite Side Tandem Sensors (Categorical: 0,1)
(7) Sensor 1 Antenna Strength (Categorical [dBi]: 7,9,12)
(8) Sensor 2 Antenna Strength (Categorical [dBi]: 7,9)
(9) Sensor 3 Antenna Strength (Categorical[dBi]: 7,9)
(10) Sensor 4 Antenna Strength (Categorical[dBi]: 7,9,12)
A generic model was first attempted using all variables:
(5)
52

where Ek is the absolute error in fractional minutes, V is the volume in veh/hr, D is the
detection rate in percent, M is the matching rate in percent, L is the sensor lane-ft
coverage, R is the directional variable, O is the opposite side variable, and S1-4 are the
antenna strengths of the sensors in dBi 1-4. is the regression error term. The resulting
model for the westbound direction and its variables, with relative significance levels, are
presented in Table 6-1.
Table 6-1: Westbound error regression model results
The resulting model confirmed some of the anticipated concerns regarding
volume, with lower volumes resulting in more accurate travel times. This can be
attributed to the fact that the lower volumes accumulated less signal delay, as vehicles did
not back up or wait as long on approaches. Medium volumes increased error in the
westbound direction, suggesting that volumes over 500 veh/hr resulted in additional
intersection delays that were passed on to the MACAD system. Higher detection rates
were shown to increase the error. This was also expected because, under the same volume
level, a higher detection rate is typically associated with a larger detection zone, and a
53

54
larger detection zone will lead to a larger spatial error. Matching rates had a negative
correlation, implying that improving matching rates would reduce error by providing a
larger sample size. Linear coverage played a role similar to that of detection, with larger
zones contributing to the error. Opposite-side tandem mounting was found to have an
increasing effect on error in the westbound direction. This may have been caused by the
fact that the opposing side sensor at 61st St NE was mounted close to the eastbound
ALPR detection zone, which allowed it to capture westbound vehicles waiting at the
light. The NE 170th location was configured to avoid this issue.
6.2 ERROR ANALYSIS, EASTBOUND
6.2.1 Descriptive Analysis, Eastbound Direction
The eastbound side of the test bed showed greater variations and errors. In Figure 6-3, the
single sensor configuration (shown in orange) is notably farther from the ALPR trend
than the tandem configuration data obtained concurrently.
As can be seen in Figure 6-4, volume had a greater effect on the accuracy of the
Bluetooth MAC address readers because of the signal delay. Eastbound travel times were
affected much more than westbound ones, as the detection zones of most of the
configuration’s mountings were centered near the eastbound signal approaches. This
resulted in more reads near the approach areas and progressively less as the vehicles left
the detection zone. This skewed the results toward reflecting the intersection delay.

Figure 6-4: Travel time comparison eastbound SR 522 (ALPR – blue, BT – red + orange) (1-hr averages)
55
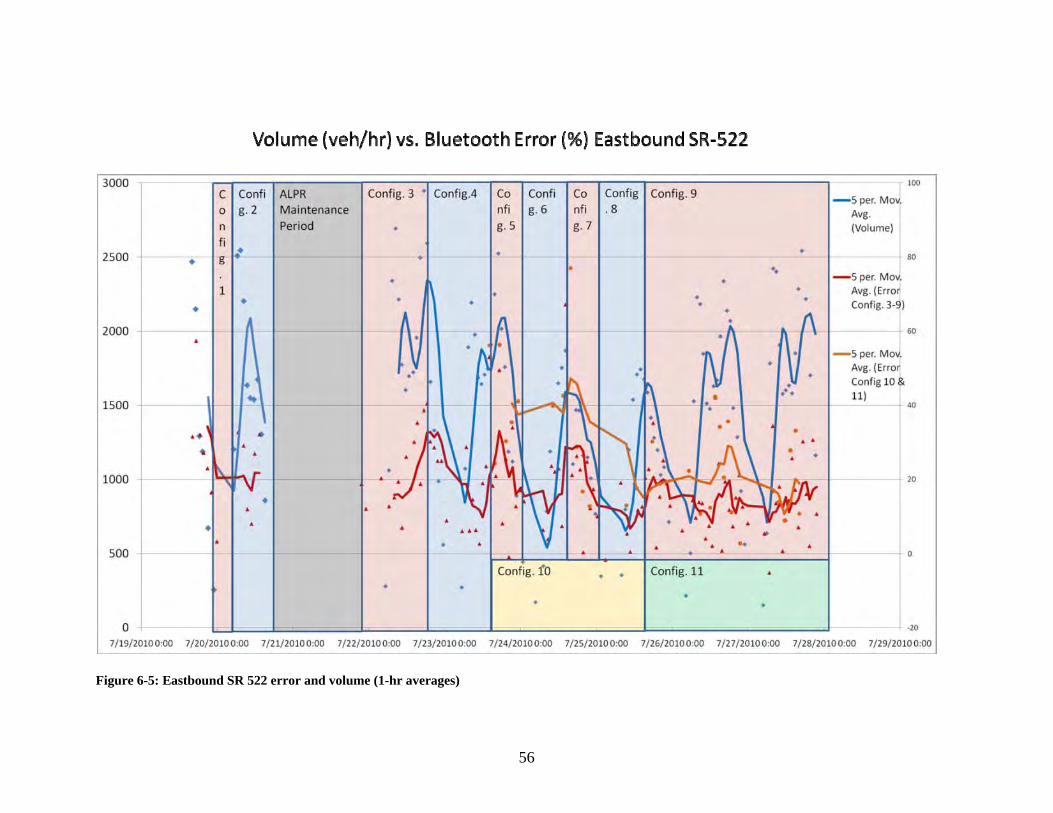
56
Figure 6-5: Eastbound SR 522 error and volume (1-hr averages)

6.2.2 Error Modeling Eastbound
An eastbound model was developed by using the same approach and the same initial set
of variables as the westbound direction. However, the resulting set of significant
variables turned out to be slightly different, with more variables being statistically
significant. Because the relationship between the ALPR zones and MACAD zones was
more complex, this was expected. However, volume, detection rate, match rate, and
linear coverage still played a significant role. Table 6.2 shows the regression model for
the eastbound direction.
Table 6-2: Eastbound error regression model results
For the eastbound direction, directional antennae and antenna strength were found
to have an increasing effect on error. Because the directional antennae were focused on
the westbound side ALPRs, causing misalignment, an increase in error was to be
expected. Reduced error due to antenna strength (the stronger the lower the error—7 dBi
had less of a decreasing effect than 9 dBi) at sensor 2 (NE 170th St) can be interpreted as
creating a larger sample size. The eastbound direction was farther from the mounted
57

sensors for most configurations; in such cases, antenna strength made more of a
difference, as smaller antennae had more difficulty collecting samples.
Note that the detection rate was not shown to be significant in the model for either
direction. This was somewhat unexpected and discouraged the use of the initial detection-
based model outlined in the original research plan. There are a couple explanations
possible for this occurrence. First, too much noise from non-vehicular sources may have
increased the detection rate without providing subsequent matches. Second, the diversion
rates for the corridor may have been too high, once again resulting in detections without
matches. A discussion of detection and match rates for each configuration is presented in
the following section.
6.3 CONFIGURATION COMPARISON
Further insights into the performance of the MACAD devices can be obtained by
comparing the different configurations tested. In doing so, one can determine the set-up
that best provided the most accurate results, despite the additional issues caused by signal
delay. The performances of the configurations are discussed in the following section,
once again separated by direction. In examining the data, it is imperative to recall that the
tested corridor was less than 1 mile long, meaning that the largest footprints took up
nearly 20 percent of the corridor.
6.3.1 Westbound
Table 6-3 presents a basic comparison of the tested configurations’ error statistics:
average error, standard deviation of error, and minimum and maximum error in terms of
minutes. The statistics were computed at 15-minute intervals. Of the configurations
58

tested, configuration 6 (9-dBi omni and 12-dBi directional antennae) appeared to produce
some of the best results, with a low average error and the lowest deviation in both the
westbound and eastbound directions. Configuration 1 (a mix of 7- and 9-dBi antennae as
singles) also fared well, with the lowest absolute error, low standard deviation, and a low
maximum error. It can be seen in Table 6-3 that the absolute value of the maximum error
was significantly higher than the absolute value of the minimum error, supporting a case
for positive bias.
Table 6-3: Westbound 15-minute aggregate error statistics by configuration
Abs. Error (sec) Std. Dev (sec) Max Error (sec) Min Error (sec)Config.
1 2.6 5.7 12.2 ‐8.62 11.0 7.3 25.3 ‐2.33 7.6 6.1 20.9 ‐6.94 9.0 7.3 25.3 ‐5.85 6.1 9.7 33.4 ‐13.46 6.1 4.4 16.7 ‐0.47 3.6 8.2 19.3 ‐8.28 11.3 10.8 39.0 ‐4.69 9.7 8.0 36.3 ‐6.8
10 6.1 7.8 22.3 ‐14.611 3.8 8.9 37.5 ‐11.0
Average TT: 91.8 sec
Figure 6-6 shows the detection and matching rates for each configuration in the
westbound direction. The matching and detection rates proved to be consistent with
earlier studies (e.g., Malinovskiy et al., 2010), although certain configurations, notably
tandem ones, had significantly higher detection and matching rates. The rates were
obtained by counting the number of detections or matches happening within a particular
15-minute time window and normalizing the value by the sum of ALPR volumes in both
directions. Because ALPR data were available for only one lane, the values were doubled
59

in an attempt to reflect the total volume in all four general purpose lanes. Transit volumes
were ignored in this study. The westbound direction captured an average of 10.8 percent
of the total estimated volume with 4.1 percent of the estimated volume matched.
Note that both matching and detection rates can be over 100% theoretically, as
contamination from non-vehicle sources may occur, and vehicles can contain more than
one device, resulting in an over-estimation.
60

Figure 6-6: a) Westbound detection rates normalized by ALPR volume b) Westbound matching rates normalized by ALPR volume
61

6.3.2 Eastbound
Table 6-4 presents the basic configuration comparison for the eastbound direction. As
expected, the results were different. The average error increased from 7.2 seconds to 19.8
seconds, reflecting the additional error from the intersection delay. However, note that
configuration 6 again managed to demonstrate a relatively low error of 13.6 seconds,
although this was still higher than any westbound configuration.
Table 6-4: Eastbound 15-minute aggregate error statistics by configuration Eastbound
Abs. Error (sec) Std. Dev (sec) Max Error (sec) Min Error (sec)Config.
1 28.2 17.3 62.0 1.12 20.8 11.0 40.3 0.73 19.4 10.1 52.5 ‐5.34 17.4 11.1 45.7 0.45 21.7 12.6 47.0 ‐1.26 13.6 8.0 31.2 ‐2.97 23.5 23.0 97.1 1.18 8.4 7.0 20.1 ‐6.39 13.8 10.0 41.2 ‐13.0
10 33.2 23.0 114.5 ‐1.411 19.3 9.2 39.3 ‐2.0
Average TT: 96.0 sec
For this direction, the sensors captured an average of 11.4 percent of the estimated
volume. The detections resulted in travel time matches for 5.2 percent of the total
estimated volume. Figure 6-7 shows the detection and matching rates of the 11
configurations for the eastbound direction.
62

Figure 6-7: a) Eastbound detection rates normalized by ALPR volume b) Eastbound matching rates normalized by ALPR volume
63

6.3.3 Configuration Comparison Summary
In general, configurations with higher matching rates provided more accurate results,
particularly in the better aligned westbound direction. An additional intersection (47th St
and SR 522) that allowed for diversion from only the westbound direction was likely
responsible for the lower matching rates in the westbound direction. Configurations 5 and
6, or combinations of 7-dBi and 9-dBi antennae with a 12-dBi directional antennae
mounted in the same location, did consistently well in both travel directions, obtaining
some of the highest matching and detection rates. Configurations 5 and 6 were also
among the most accurate, with configuration 6 being the closest to ground truth, in part
because of its larger antennae, which allowed it to obtain a lower error rate in the
eastbound direction. Although there was a directional component to this, which may have
increased error in the eastbound direction, the sensors were mounted at the same point in
each location, improving the accuracy in the westbound direction. The linear coverage of
the sensor footprints was also modest in comparison to fully omni-directional
configurations. Therefore, the findings of the configuration analysis were fairly consistent
with the modeling results.
64

7 CONCLUSIONS AND RECOMMENDATIONS
7.1 CONCLUSIONS
Travel time data have been one of the most desirable variables for traffic operations and
traveler information systems. However, they are not easy to obtain from the conventional
traffic sensors ubiquitously deployed in today’s infrastructure network. ALPR systems do
provide accurate travel time measurements, but the cost is too expensive for network-
wide deployment. Over the past several years, MAC address-based travel time data
collection methods and systems have become a hot research area because of their lower
cost and fewer privacy concerns than the ALRP systems. This study developed such a
system, called MACAD, that is capable of reading MAC addresses and matching them
for travel time data collection. The MACAD system is characterized by mobility,
affordability, and energy efficiency. It can be easily deployed anywhere because it does
not require a power source or wired communication infrastructure at the installation site.
It has a GPS module to locate itself, a GSM model to communicate with the data server
for MAC address data processing and matching, and a solar energy harvest system for
charging batteries. The design does not require expensive parts, and therefore the unit
cost is much lower than that of ALPR devices.
Several experiments were conducted to verify the effectiveness and reliability of the
MACAD system for travel time data collection. Some of the test corridors were equipped
with ALPR sensors. The obtained travel time data were compared between the two sensor
systems. The results of numerous tests using two primary types of antennae and
verification of the data with ALPR data showed that Bluetooth sensors are an adequate
65

surrogate for ALPR sensors, with detection errors ranging from 4.0 percent to 9.4 percent
(or 7.1 sec to 16.9 sec) for the MACAD system test on SR 520. While the sample size
obtained (typically 4 percent to 10 percent) was significantly smaller than what can be
achieved with ALPR systems, it was still representative of actual conditions.
While the use of Bluetooth readers to measure travel time provides a comparable
alternative to ALPR technology and can be used with significantly less effort and lower
costs, shorter corridors do pose challenges for the Bluetooth detection scheme because of
the inherent “zone to zone” detection paradigm offered by sensors implementing the
Bluetooth protocol. In such cases, it may be tempting to reduce the detection area in order
to decrease the size of the detection zones and thus reduce the error. However, when the
zones are reduced, the matching rate drops dramatically. In this study’s experiments,
configurations that used just one detector per site (thus significantly reducing the
detection zone size) had less than half the matching rate of configurations that used two
detectors per site, regardless of antenna choice.
Therefore, experiments were also conducted in this study to identify optimal
configurations of Bluetooth sensors for travel time data collection. Of all the
configurations attempted, combinations of omni-directional antennae with large detection
zones provided the best results, with low absolute error and high matching rates.
Combination configurations (4, 5, 6, 7, 8, and 9) had an average matching rate of 7.92
percent and a detection rate of 15.35 percent; while single-sensor (at each location)
configurations had an average matching rate of 3.43 percent and a detection rate of 9.37
percent. The higher detection rates may not necessarily mean much because of
66

extraneous sources, but the matching rates were shown to be statistically significant in
reducing error.
Across all configurations, the reported Bluetooth travel time was 8.0 percent
higher than the actual travel times reported by the ALPR sensors. All error rates
encountered were well within FHWA’s recommended levels. Although reducing the
overall error was a concern, the main objectives of this study were to model and analyze
travel time errors, not to minimize the overall error. Lower overall errors could be
accomplished by using a more discerning filtering algorithm and/or better sensor
configurations. Among the eleven sensor configurations tested in this study, the least
error-prone configurations (i.e., configurations 1, 5, 6, and 11) reported travel times that
were, on average, 4 to 7 percent above the ALPR average travel time.
For the eastbound direction analysis of the configuration test, additional
intersection delay, affecting MACAD devices but not the ALPR sensors, was likely to
have contributed very significantly to the overestimation of travel time, severely
degrading the results. However, about half of the configurations tested were still able to
produce results well under the FHWA threshold.
Errors encountered during this study were almost always positive. This implies that
there was still a bias toward slower vehicles within the corridor. This is likely a result of
the inherent nature of the Bluetooth protocol and technology; that is, there is a bias
toward slower vehicles that have a higher chance of being detected because of their
longer residence times within the detection zone.
67

7.2 RECOMMENDATIONS
On the basis of the experimental results obtained and lessons learned in this study,
the researchers make the following recommendations for future studies of Bluetooth-base
travel time collection:
1. Bluetooth-based MAC address matching is an effective, low cost means for travel
time data collection. Bluetooth-based travel times are sufficiently accurate for
most transportation applications. However, because slower vehicles have a better
chance to be detected by Bluetooth readers, the Bluetooth- protocol may
contribute to slightly overestimated travel times.
2. Extraneous delay sources such as traffic signals and nearby bus stops may worsen
the overestimation, and efforts are needed to mount and configure the MACAD
systems in ways that will avoid such undesirable factors.
3. A method for correcting the travel time bias caused by the Bluetooth protocol is
highly desirable and should be developed in future studies.
4. Combinations of sensors working in tandem help reduce error in most cases.
Tandem set-ups greatly increase the accuracy of the detection and matching rates,
which are important for time-critical applications such as real-time travel
information.
5. Sensor configuration can significantly affect the performance of the Bluetooth-
based travel-time collection system, especially if the chosen corridor has a short
travel time. The travel time data collected with Bluetooth sensors along the 0.98-
mile-long corridor tested in this study for sensor configurations produced average
errors of between 2.4 and 11.4 seconds (4 percent to 13 percent). The absolute
68

errors were pretty much determined by sensor configurations and surrounding
conditions and may not change with the length of a corridor. This suggests that
the relative errors will decrease if corridor travel times are longer, meaning that
longer corridors tend to allow a better performance by the Bluetooth-based data
collection system.
69

ACKNOWLEDGEMENTS
The authors would like to acknowledge the support received from the Washington State
Department of Transportation (WSDOT) and Transportation Northwest (TransNow), the
University Transportation Center for Federal Region 10 at the University of Washington.
Special thanks go to Kevin Mizuta, Sean Brackett, Matt Neeley, Ted Bailey, and Paul
Neel of WSDOT for their invaluable comments and support. Additional thanks go to
STAR Lab members Yunteng Lao, Jonathan Corey, and Runze Yu for their assistance in
error analysis.
70

REFERENCES
Ahmed, H., M. El-Darieby, B. Abdulhai, and Y. Morgan. Bluetooth- and Wi-Fi-Based Mesh Network Platform for Traffic Monitoring. In Transportation Research Board 87th Annual Meeting. CD-ROM. Transportation Research Board, 2008.
Bullock, D., R. Haseman, J. Wasson and R. Spitler. “Anonymous Bluetooth Probes for Measuring Airport Security Screening Passage Time: The Indianapolis Pilot Deployment” In Transportation Research Board 89th Annual Meeting. CD-ROM. Transportation Research Board, Washington D.C., 2010.
Gumstix Inc. www.gumstix.com. Accessed Oct 10th, 2010.
Haghani, A., M. Hamedi, K.F. Sadabadi, S. Yound Young and P. J. Tarnoff. (2010). “Freeway Travel Time Ground Truth Data Collection Using Bluetooth Sensors.” Transportation Research Record: Journal of the Transportation Research Board, 2010.
Ling-Jyh Chen and Hao-Hsiang Hung, "A Two-State Markov-based Wireless Error Model for Bluetooth Networks," Wireless Personal Communications Journal, Springer, volume 58, number 4, pages 657-668, June 2011.
Haseman, R.J., J. Wasson and D. Bullock. “Work Zone Travel Time Delay and Evaluation Metrics Using Bluetooth Probe Tracking” In Transportation Research Board 89th Annual Meeting. CD-ROM. Transportation Research Board, Washington D.C., 2010.
Hewlett Packard “Wi-Fi and Bluetooth interference issues”. 2002.
Huang, A.S., and L. Rudolph. (2007). , Bluetooth essentials for programmers, Cambridge University Press, New York, NY., 2007.
Ma, X., Y.J. Wu, and Y. Wang. DRIVE Net: An E-Science of Transportation Platform for Data Sharing, Visualization, Modeling, and Analysis. Paper 11-4106 for the 90th Annual Meeting Transportation Research Board, Washington, D.C., 2011.
Malinovskiy Y., Wu Y., Wang Y. and Lee U., “Field Experiments on Bluetooth-based Travel Time Data Collection,” In Transportation Research Board 89th Annual Meeting. CD-ROM. Transportation Research Board, Washington D.C., 2010.
Meehan, B. Transportation Information Management Team, Federal Highway Administration. Travel Times on Dynamic Message Signs. September 28, 2005 – Travel Time Messages on Dynamic Message Signs National Transportation Operations Center (NTOC) Web Casts Archive http://www.ntoctalks.com/web_casts_archive.php
71

Mizuta, K., Automated License Plate Readers Applied to Real-Time Arterial Performance: A Feasibility Study, Department of Civil & Environmental Engineering: University of Washington, 2007.
Monsere, C., A. Breakstone, R. L. Bertini, D. Deeter, and G. McGill. “Validating Dynamic Message Sign Freeway Travel Times Using Ground Truth Geospatial Data. In Transportation Research Record: Journal of the Transportation Research Board, No. 1959, TRB, National Research Council, Washington, D.C., 2006, pp. 19–27.
Paniati, F. J., “Dynamic Message Sign Recommended Practice and Guidance”. FHWA Memorandum, July 16, 2004. Accessed October 10, 2010. http://mutcd.fhwa.dot.gov/res-memorandum_dms.htm.
PIPS Technology. Product Overview. http://www.pipstechnology.co.uk/products.php?section_id=5&article_id=30. Accessed Feb. 12, 2009.
Pokrajac, D.; Borcean, C.; Johnson, A.; Hobbs, A.; Agodio, L.; Nieves, S.; Balbes, M.; McCauley, L.; Tice, J.; Dare, N.; McKie, J.; Lombardo, B.; Self, B.J.; Austin, J.; , "Evaluation of automated license plate reader accuracy," Telecommunication in Modern Satellite, Cable, and Broadcasting Services, 2009. TELSIKS '09. 9th International Conference on , vol., no., pp.217-220, 7-9 Oct. 2009.
Quayle, S., P. Koonce, D. DePencier, and D. Bullock. “Freeway Arterial Performance Measures Using MAC Readers: Portland Pilot Study” In Transportation Research Board 89th Annual Meeting. CD-ROM. Transportation Research Board, Washington D.C., 2010.
Special Interests Group (SIG), Core Specification v4.0, June, 30, 2010. www.bluetooth.com
Tarnoff, P.B., Darcy; Young, Stanley; Wasson, James; Ganig, Nicholas; Sturdevant, James. Continuing Evolution of Travel Time Data Information Collection and Processing In Transportation Research Board 88th Annual Meeting. CD-ROM. Transportation Research Board, Washington D.C., 2009.
Travel Time Data Collection Handbook. Office of Highway Information Management, Federal Highway Administration, U.S. Department of Transportation and Texas Transportation Institute, Texas A&M University System. Report FHWA-PL-98-035, March 1998
Turner, S., W.L. Eisele, R.J. Benz, and D.J. Holdener. 1998. Travel Time Data Collection Handbook. Research Report FHWA-PL-98-035 for the Federal Highway Administration. Washington D.C.
72

73
Washington State Office of Financial Management. "Rank of Cities and Towns by April 1, 2009 Population Size" April, 2009. http://www.ofm.wa.gov/pop/april1/rank2009.pdf. Retrieved November 29th, 2009.
Wasson, J.S., J.R. Sturdevant, and D.M. Bullock. Real-Time Travel Time Estimates Using Media Access Control Address Matching. ITE Journal, Vol. 78, No. 6, 2008, pp. 20-23.
Weiss, Tara; Schmitt, Emily. "Where The Jobs Are, Spring 2009". Forbes.com. March 10, 2009. Retrieved February 28, 2010.


