
Epidemiology for strategic control of neglected zoonoses
44
Epidemiology for strategic control of Neglected Zoonoses Presented at FAO-APHCA/OIE/USDA Regional Workshop on Prevention and Control of Neglected Zoonoses in Asia July 16, 2015 Obihiro, Japan Associate Professor of Veterinary Epidemiology Kohei Makita Division of Health and Environmental Sciences (DHES), Rakuno Gakuen University, Japan International Livestock Research Institute (ILRI)
Transcript of Epidemiology for strategic control of neglected zoonoses

Epidemiology for strategic control of Neglected Zoonoses
Presented at FAO-APHCA/OIE/USDA Regional Workshop on
Prevention and Control of Neglected Zoonoses in AsiaJuly 16, 2015
Obihiro, Japan
Associate Professor of Veterinary Epidemiology
Kohei MakitaDivision of Health and Environmental Sciences (DHES),
Rakuno Gakuen University, JapanInternational Livestock Research Institute (ILRI)

Motivation
• Problem of Neglected Zoonoses– Neglected because they are ‘invisible’
– Cannot be controlled because ‘resource is limited’
– Cannot be controlled because ‘responsibility is fragmented’
– Persistency – ‘prediction‘ is needed to plan long-term policy

Overview
• Tool box to tackle with ‘invisibility’, ‘limited resources’, ‘fragmented responsibility’, and ‘needs of prediction’
– Epidemiology cycle
– Inter-disciplinarity
– Risk-based surveillance
– Risk assessment
– Mathematical modelling
– Animal Health Economics
Epidemiology cycle Inter-disciplinarity Risk-based surveillance Risk assessment Mathematical modelling Animal Health Economics

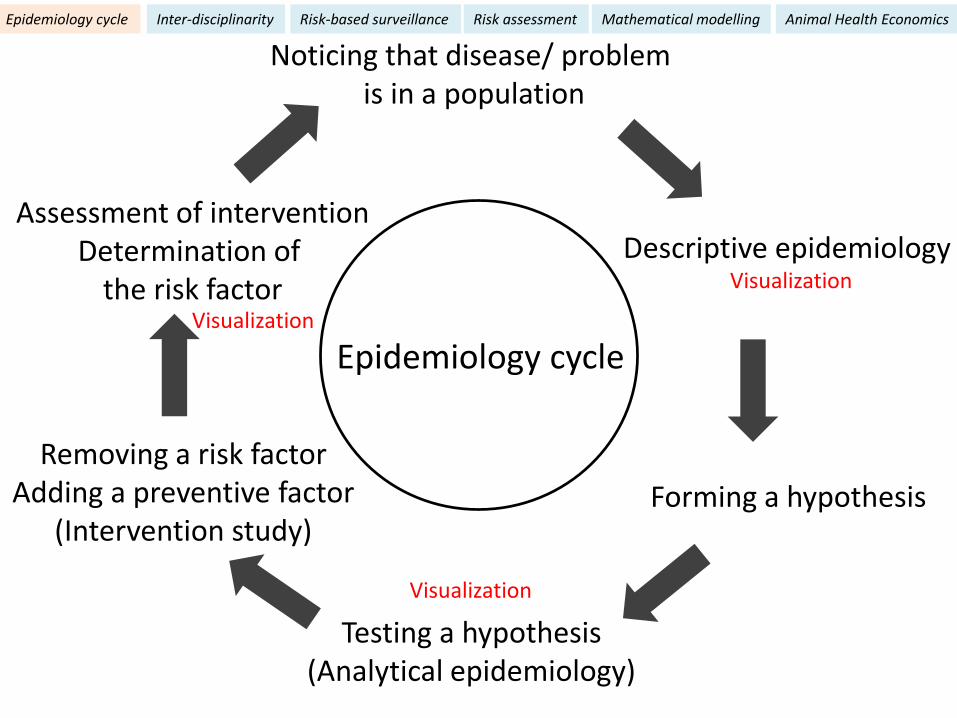
Noticing that disease/ problemis in a population
Epidemiology cycle
Descriptive epidemiology
Forming a hypothesis
Testing a hypothesis(Analytical epidemiology)
Removing a risk factorAdding a preventive factor
(Intervention study)
Assessment of interventionDetermination of
the risk factor
Epidemiology cycle Inter-disciplinarity Risk-based surveillance Risk assessment Mathematical modelling Animal Health Economics

Brucella infected farms in Kampala, UgandaMakita K. (2009) PhD Thesis. The University of Edinburgh. Any hypothesis?

Herd size and Brucella sero-positivityMakita et al. (2011) BMC Veterinary Research 7:60.
Makita K. (2009) PhD Thesis. The University of Edinburgh.
Any hypothesis?
Number of cows in a herd
Pro
po
rtio
n o
f bru
cello
sis
po
sitiv
e c
ow
s
0.0
0.1
0.2
0.3
0.4
0.5
1 2 3 4 5 6 7 8 10 11 13 19 24


Causal webs
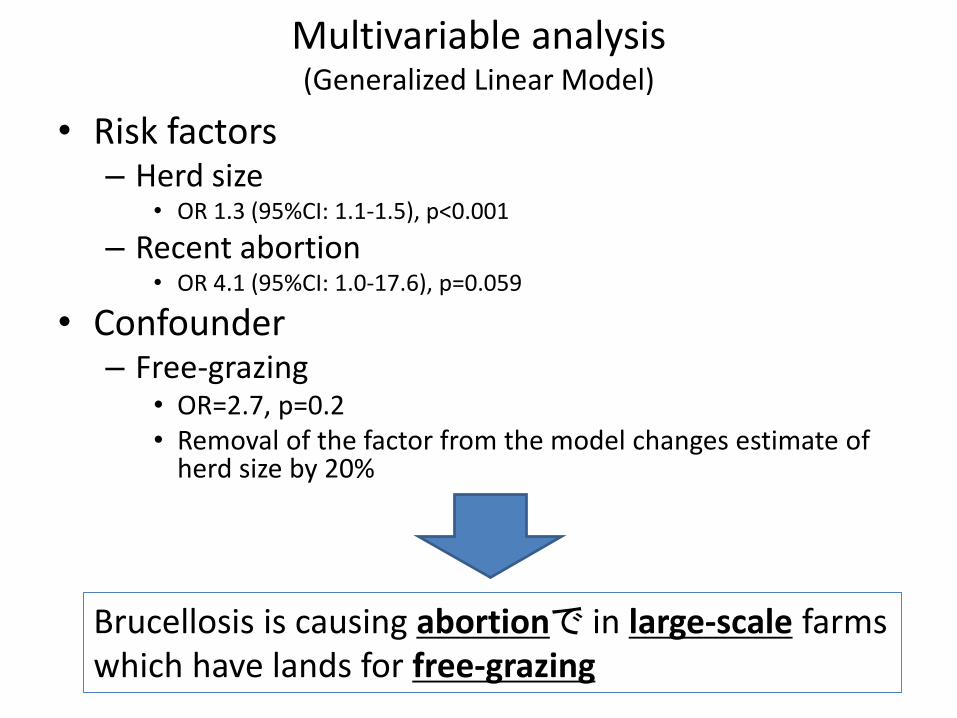
Multivariable analysis(Generalized Linear Model)
• Risk factors– Herd size
• OR 1.3 (95%CI: 1.1-1.5), p<0.001
– Recent abortion• OR 4.1 (95%CI: 1.0-17.6), p=0.059
• Confounder– Free-grazing
• OR=2.7, p=0.2• Removal of the factor from the model changes estimate of
herd size by 20%
Brucellosis is causing abortionで in large-scale farmswhich have lands for free-grazing
Noticing that disease/ problemis in a population
Epidemiology cycle
Descriptive epidemiology
Forming a hypothesis
Testing a hypothesis(Analytical epidemiology)
Removing a risk factorAdding a preventive factor
(Intervention study)
Assessment of interventionDetermination of
the risk factor Visualization
Visualization
Visualization
Epidemiology cycle Inter-disciplinarity Risk-based surveillance Risk assessment Mathematical modelling Animal Health Economics

Inter-disciplinary and trans-disciplinary approaches
Example of disciplines:Medicine, Veterinary Medicine, Environmental Sciences, Socio-economics
Discipline
Discipline
DisciplineDiscipline
Inter-disciplinary
Trans-d
isciplin
ary
Research
Policy
Community
Epidemiology cycle Inter-disciplinarity Risk-based surveillance Risk assessment Mathematical modelling Animal Health Economics

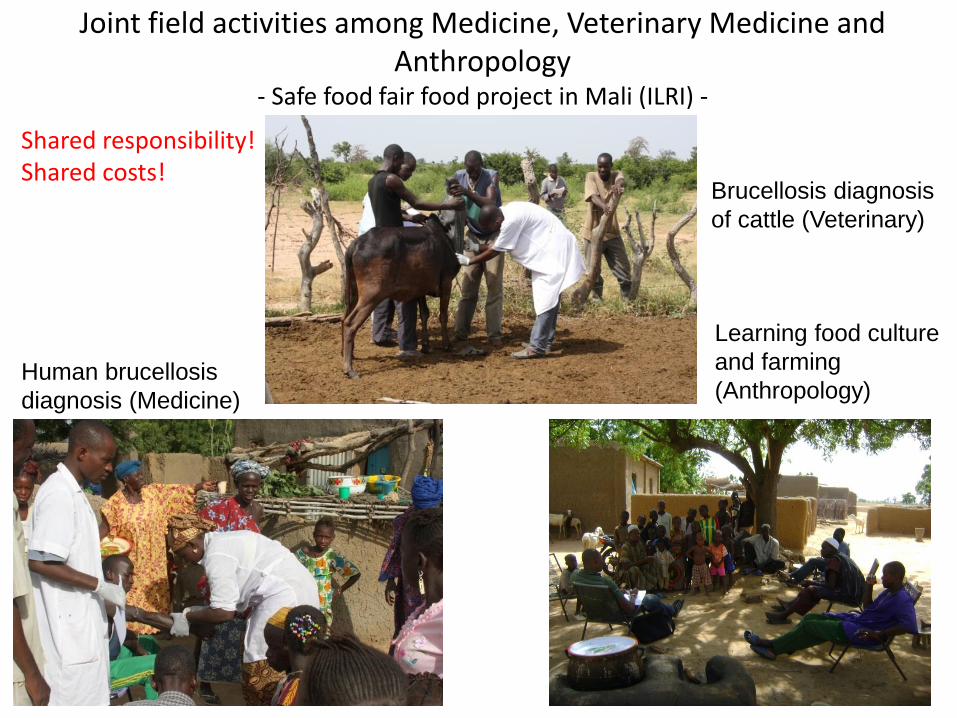
Joint field activities among Medicine, Veterinary Medicine and Anthropology
- Safe food fair food project in Mali (ILRI) -
Brucellosis diagnosis
of cattle (Veterinary)
Human brucellosis
diagnosis (Medicine)
Learning food culture
and farming
(Anthropology)
Joint field activities among Medicine, Veterinary Medicine and Anthropology
- Safe food fair food project in Mali (ILRI) -
Brucellosis diagnosis
of cattle (Veterinary)
Human brucellosis
diagnosis (Medicine)
Learning food culture
and farming
(Anthropology)
Shared responsibility!Shared costs!

Surveillance• Systematic and continuous collection, analysis, and
interpretation of data, closely integrated with the timely and coherent dissemination of the results and assessment to those who have the right to know so that action can be taken. (A dictionary of Epidemiology 5th Ed. 2008)
Action
AnalysisInterpretation
Dissemination Plan
Collection
Epidemiology cycle Inter-disciplinarity Risk-based surveillance Risk assessment Mathematical modelling Animal Health Economics

Authority
Field
Passive surveillance
・Report-based・Active collection of data fora specific purpose
Active surveillance

Risk-based surveillance
• Set a priority
• Allocate resources effectively and efficiently
• Selecting hazard and/or sub-population
2006, 6:20

Animal source foods
• Two-thirds of human pathogens are zoonotic – many of these transmitted via animal source food
• Animal source food is a single most important cause of food-borne disease
• Many food-borne diseases cause few symptoms in animal host
• Many zoonotic diseases controlled most effectively in animal host/reservoir
Epidemiology cycle Inter-disciplinarity Risk-based surveillance Risk assessment Mathematical modelling Animal Health Economics

Formal marketing
Informal marketing insub-Saharan Africa (90-95%)
Dominance of informal markets in developing countries
“Absence of structured sanitary inspection”

19
Informal ≠ Illegal
20
Risk
Assessment
Risk
Management
Risk
Communication
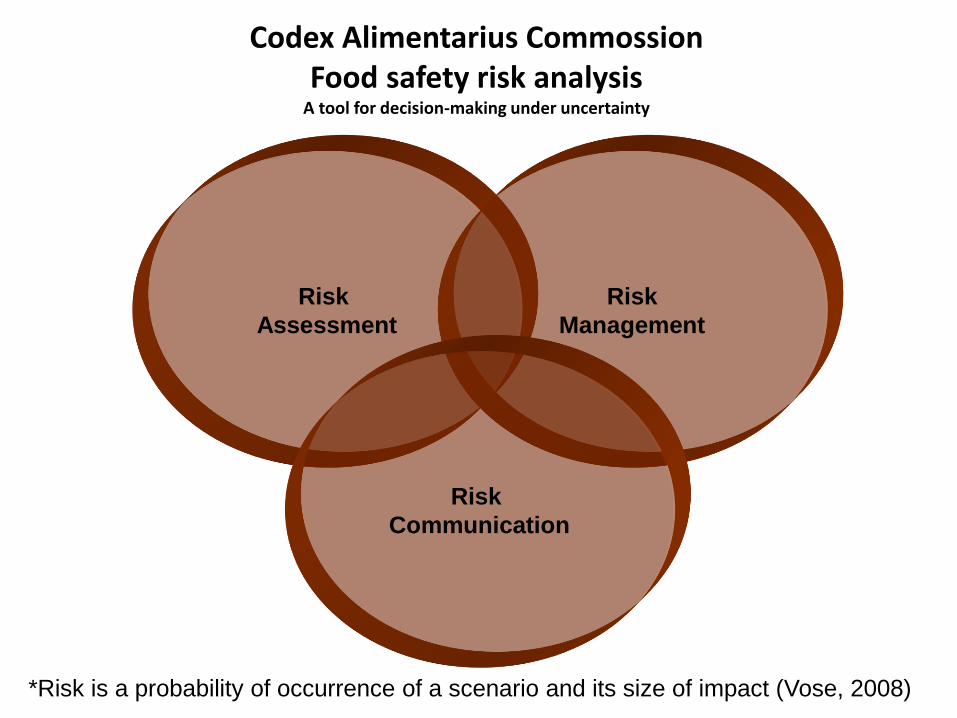
Codex Alimentarius CommossionFood safety risk analysis
A tool for decision-making under uncertainty
*Risk is a probability of occurrence of a scenario and its size of impact (Vose, 2008)

Risk
Assessment
Risk
Management
Risk
Communication
Food safety risk analysisin informal marketing system
Participatory methods

Codex Alimentarius CommissionRisk assessment framework (CAC/GL-30 (1999))
Hazard identification
Exposure assessment
Hazard characterization
Riskcharacterization
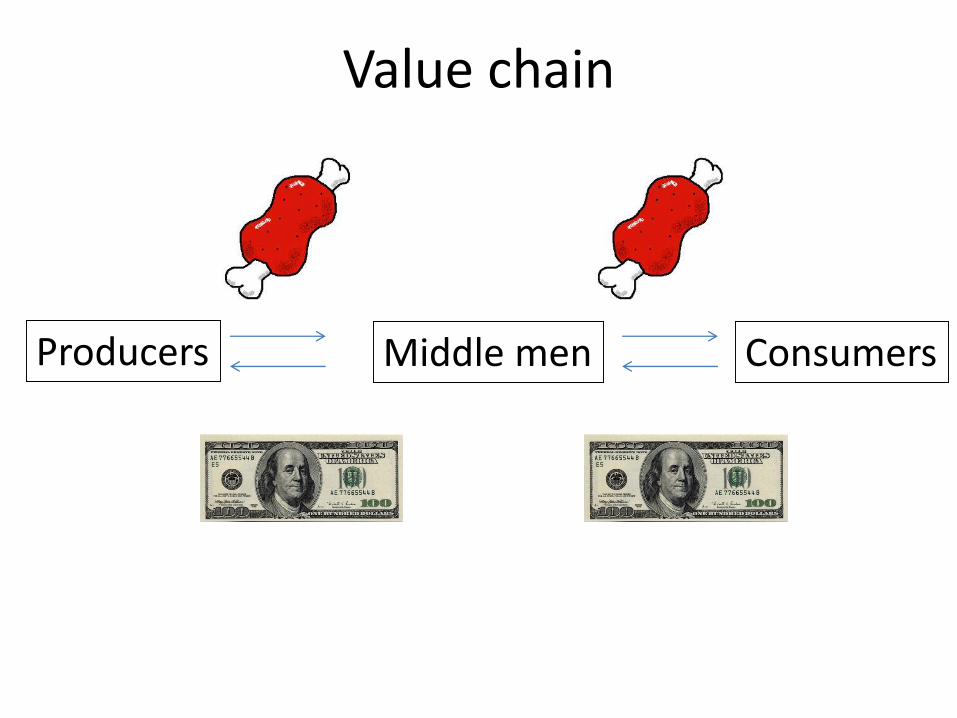
Value chain
Producers ConsumersMiddle men
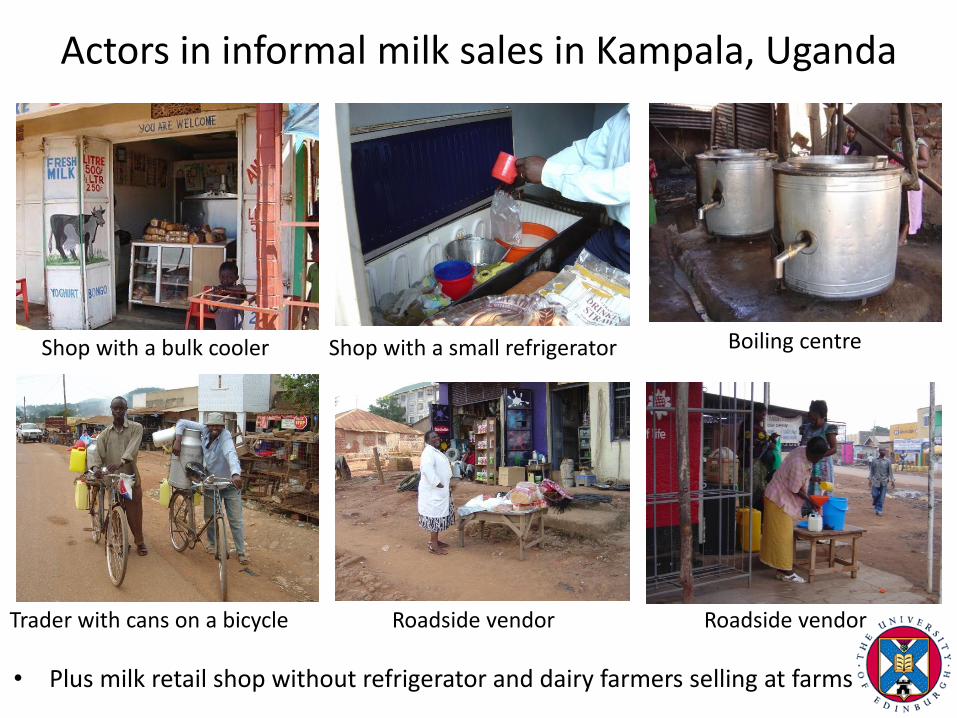
Actors in informal milk sales in Kampala, Uganda
• Plus milk retail shop without refrigerator and dairy farmers selling at farms
Shop with a bulk cooler Shop with a small refrigerator Boiling centre
Trader with cans on a bicycle Roadside vendor Roadside vendor
25
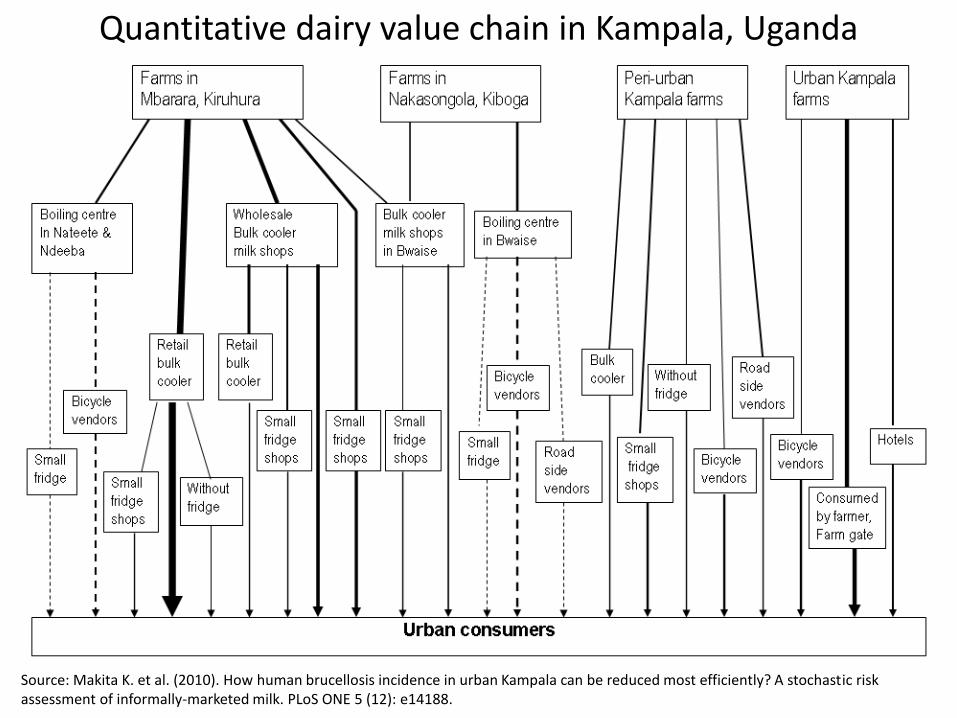
Quantitative dairy value chain in Kampala, Uganda
Source: Makita K. et al. (2010). How human brucellosis incidence in urban Kampala can be reduced most efficiently? A stochastic risk assessment of informally-marketed milk. PLoS ONE 5 (12): e14188.
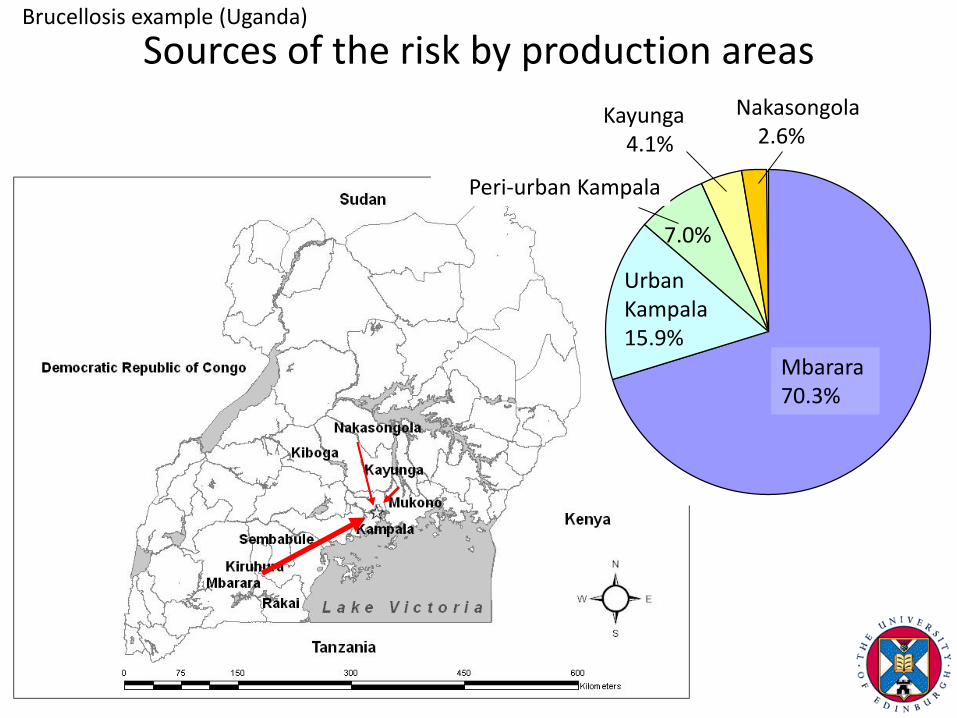
Sources of the risk by production areasNakasongola
2.6%Kayunga
4.1%
Peri-urban Kampala
UrbanKampala15.9%
Mbarara70.3%
7.0%
Brucellosis example (Uganda)
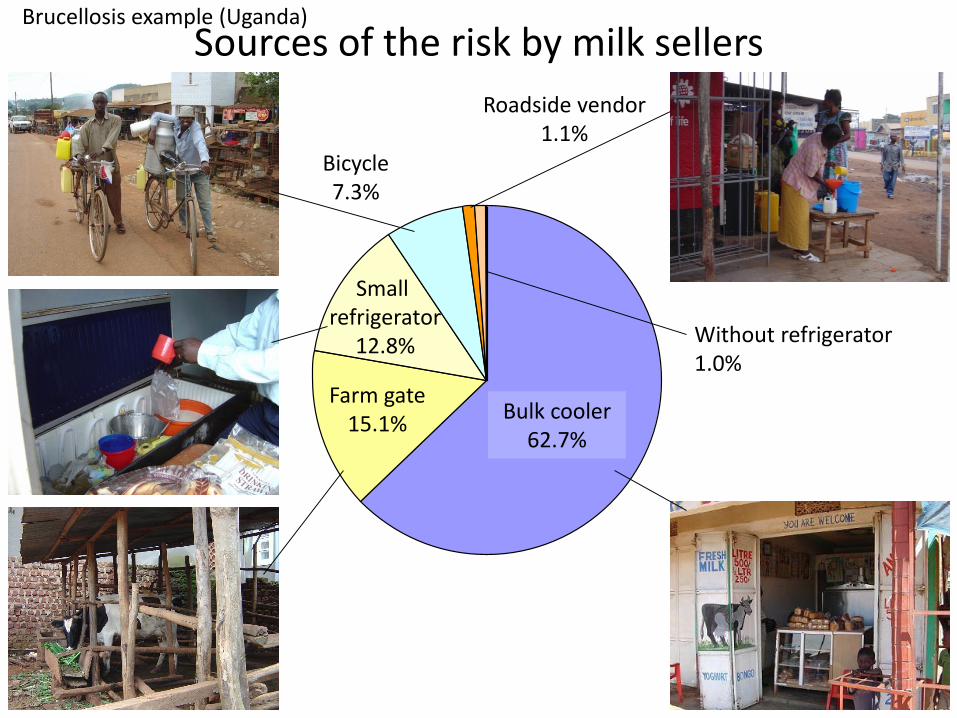
Sources of the risk by milk sellers
Without refrigerator1.0%
Roadside vendor1.1%
Bicycle7.3%
Small refrigerator
12.8%
Farm gate15.1%
Bulk cooler62.7%
27
Brucellosis example (Uganda)

Control options (90% of enforcement)
Control options Reduction Inputs Feasibility Negative impact Assessment
Not to take any option 0.0 None High Risk remains Not recommendable
Construct a boiling centre
in Mbarara62.3
A boiling centre,
legislation, fuel
Middle-
highPrice up Recommendable
Construct boiling centres
in peri-urban Kampala75.4
Boiling centres,
legislation, fuelMiddle Price up Recommendable
Enforce milk shops to boil
milk or to buy boiled milk68.9
Legislation, fuel,
facilities, enforceVery low
Price up, many shops
cannot affordNot recommendable
Ban of farm gate milk
sales12.3
Legislation,
enforcementLow
Alternative sales may
not boil
Single measure does
not change the risk
Ban of urban dairy
farming14.8
Legislation,
enforcementMiddle
Livelihood of urban
farmers, milk supplyNot recommendable
Ban of milk sales by
traders with a bicycle in
urban areas6.6
Legislation,
enforcementHigh
Livelihood of traders,
alternative transport
may not boil
Single measure does
not change the risk
Ban of roadside milk sales 0.8Legislation,
enforcementHigh
Livelihood of traders,
alternative transport
may not boil
Single measure does
not change the risk
Ban of milk sales at shops
without a refrigerator0.8
Legislation,
enforcementHigh
Livelihood of traders,
alternative transport
may not boil
Single measure does
not change the risk
Brucellosis example (Uganda)

Sensitivity Tornado
-0.5 0
0.5 1
1.5 2
2.5
p / 1 to 2days G13
Cont rate B24
Boiling C24
p / Day 0 F13
1960 / Cont rate B11
1960 / Cont rate B16
p / 3 to 4 days H13
1960 / Boiling C16
1960 / Boiling C11
109/291 (Arcuri 2010
Temperature D10
N0 D4
Mean of Incidence rate
29
Sensitivity analysis(From S. aureus food poisoning example)
Prob. SA has SE genes
Prob. farmers boil
Prob. consumers boil
Contamination, farm
Store milk 3,4 days
Contamination, centre
Consume on day 0
Prob. centres boil
Contamination, farm
Store milk 1,2 days
Temperature
Initial bacteria population
*It provides efficient control options
Source: Makita K. et al. (2012). Int. J. Food Microbiol.

Advantage of participatory risk assessment
• -Speed
• -Affordability
• -Flexibility in application
• -Understanding of culture
• -Best control option
• -Potential to change behavior
30

Infectious disease modelling
• Basic reproduction number (R0)
– Total number of individuals directly infected by a single infected individual, when introduced to totally susceptible population
– R0<1 Infection dies out
– R0=1 Infection is maintained
– R0>1 Infection takes over
Epidemiology cycle Inter-disciplinarity Risk-based surveillance Risk assessment Mathematical modelling Animal Health Economics
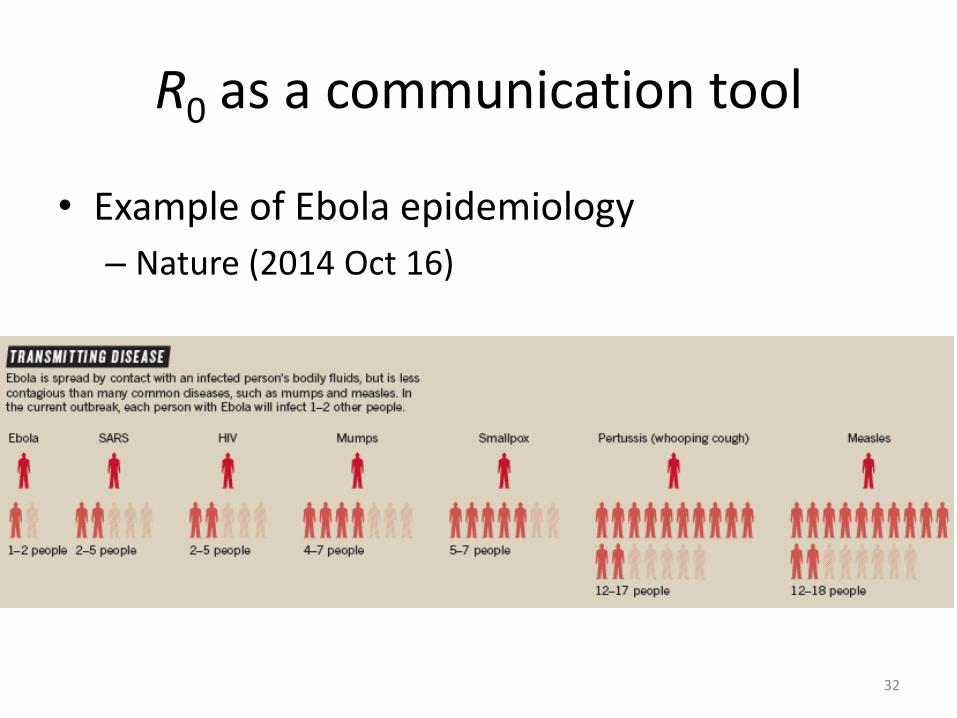
R0 as a communication tool
• Example of Ebola epidemiology
– Nature (2014 Oct 16)
32

SIR model and calculation of R0
S I
S: Susceptible
I: Infectious
R
R: Recovered
SIR model

SIR model and calculation of R0
S I
dS/dt = -βSI
RβSI αI
dI/dt = βSI - αI
dR/dt = αI
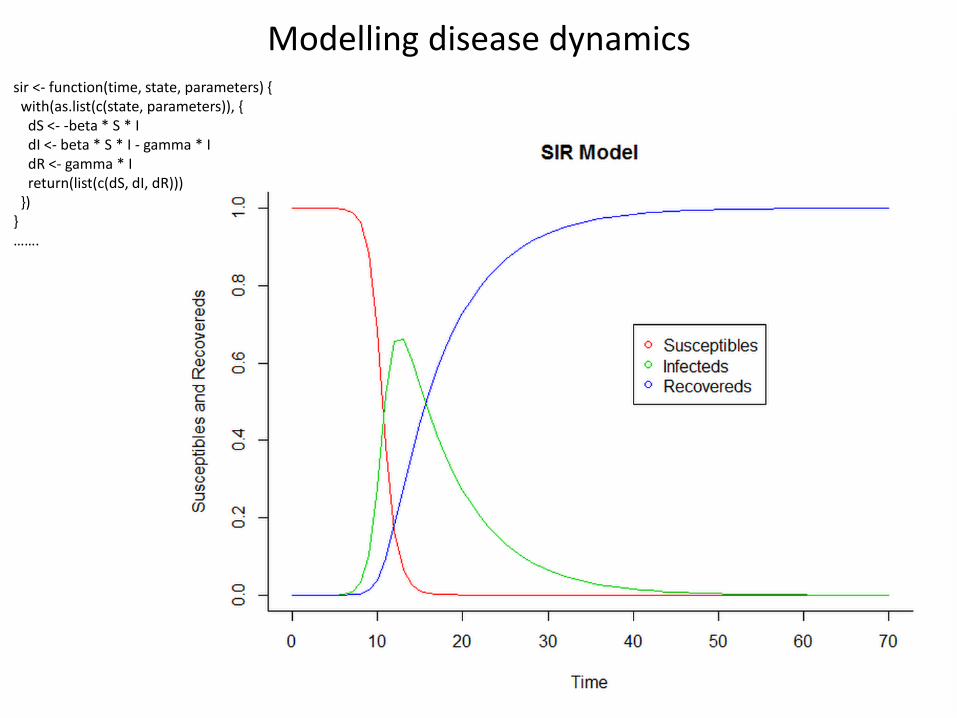
Modelling disease dynamicssir <- function(time, state, parameters) {
with(as.list(c(state, parameters)), {dS <- -beta * S * IdI <- beta * S * I - gamma * IdR <- gamma * Ireturn(list(c(dS, dI, dR)))
})}…….

In the case of endemic diseases-Modelling deaths-
S I
dS/dt = -βSI + μN - μS
RβSI αI
dI/dt = βSI – αI - μI
dR/dt = αI - μR
μS μI μR
μN
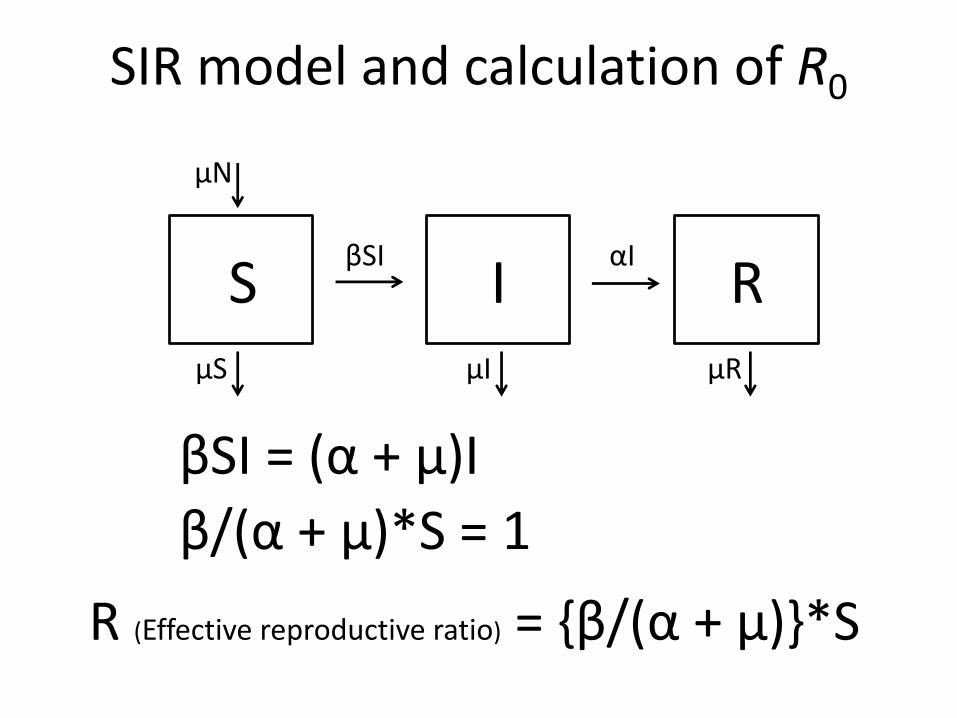
SIR model and calculation of R0
S I
βSI = (α + μ)I
RβSI αI
R (Effective reproductive ratio) = {β/(α + μ)}*S
μS μI μR
μN
β/(α + μ)*S = 1
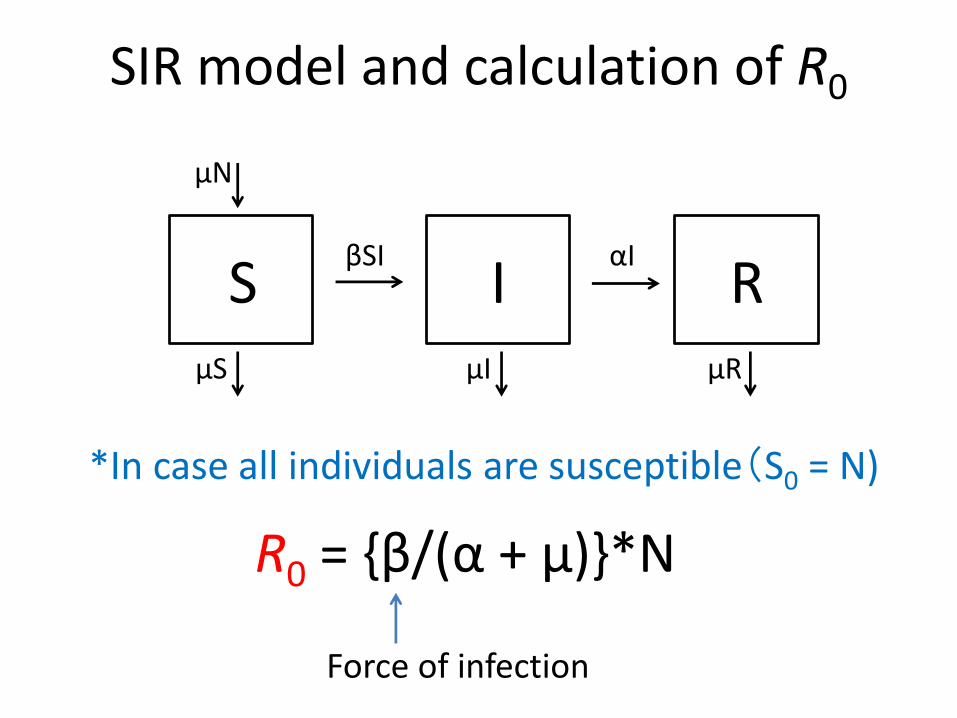
SIR model and calculation of R0
S I
*In case all individuals are susceptible(S0 = N)
RβSI αI
R0 = {β/(α + μ)}*N
μS μI μR
μN
Force of infection

Effect of vaccination against rabiesFinal size simulation (Hokkaido, Japan)
Kadowaki, H., Makita, K. et al. In preparation
75/200(37.5%)
55/200(27.5%)
14/200(7%)
: 0%: 51.7%: 80%
Vaccination coverage
Proportions exceeding two casesper introduction of a rabid doginto Japan

Application of mathematical modelling in Neglected Zoonoses control
• Finding effective control options
– Modelling is flexible
– Solving parameters
– Changing values of parameters to see how much R0 changes
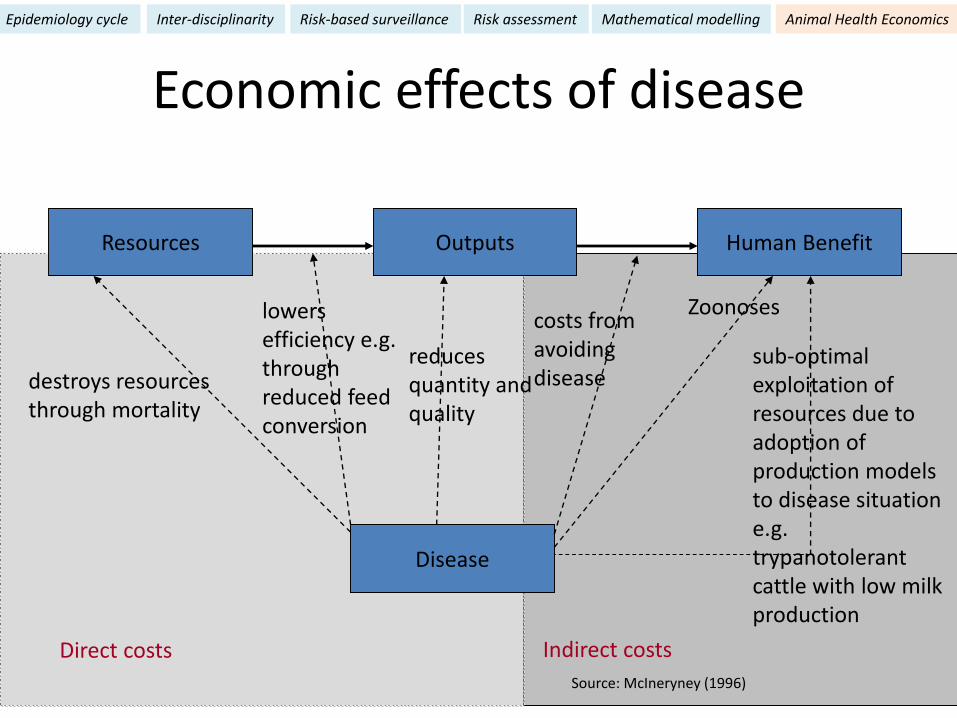
Indirect costsDirect costs
Economic effects of disease
Disease
Resources Outputs Human Benefit
destroys resources through mortality
lowers efficiency e.g. through reduced feed conversion
reduces quantity and quality
costs from avoiding disease
Zoonoses
sub-optimal exploitation of resources due to adoption of production models to disease situation e.g. trypanotolerant cattle with low milk production
Source: McIneryney (1996)
Epidemiology cycle Inter-disciplinarity Risk-based surveillance Risk assessment Mathematical modelling Animal Health Economics

Eg. Cost comparison for S. aureus mastitis control(Comparison of two dipping products)
Product A: cheap butmany cases
Product B: expensive but fewer mastitis
Makita K, Yamamoto H, et al. (2013) Journal of Veterinary Epidemiology
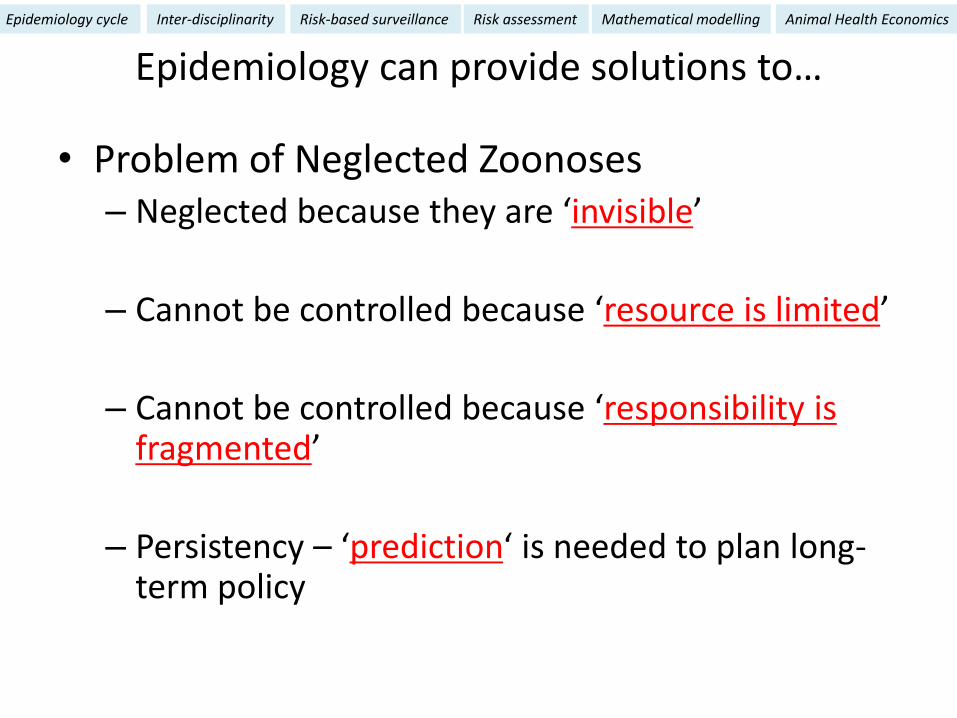
Epidemiology can provide solutions to…
• Problem of Neglected Zoonoses– Neglected because they are ‘invisible’
– Cannot be controlled because ‘resource is limited’
– Cannot be controlled because ‘responsibility is fragmented’
– Persistency – ‘prediction‘ is needed to plan long-term policy
Epidemiology cycle Inter-disciplinarity Risk-based surveillance Risk assessment Mathematical modelling Animal Health Economics