Slaughterhouse Zoonoses: Are workers reservoirs of zoonotic disease?

This thesis has been submitted in fulfilment of the requirements for a postgraduate degree
(e.g. PhD, MPhil, DClinPsychol) at the University of Edinburgh. Please note the following
terms and conditions of use:
This work is protected by copyright and other intellectual property rights, which are
retained by the thesis author, unless otherwise stated.
A copy can be downloaded for personal non-commercial research or study, without
prior permission or charge.
This thesis cannot be reproduced or quoted extensively from without first obtaining
permission in writing from the author.
The content must not be changed in any way or sold commercially in any format or
medium without the formal permission of the author.
When referring to this work, full bibliographic details including the author, title,
awarding institution and date of the thesis must be given.

The epidemiology of zoonoses in
slaughterhouse workers in western Kenya
Elizabeth Cook
A Thesis submitted for the degree of
Doctor of Philosophy
University of Edinburgh
2014

ii
“The doctor of the future will give no medicine, but will
educate his patients in the care of the human frame, in
diet, and in the cause and prevention of disease.”
Thomas Edison

iii
Declaration
The data presented in this thesis are my own. There are components of the data
collection and sample analysis that were conducted by others. These are outlined
below. In all circumstances I performed the analysis and interpretation of the data.
The field data collection was conducted by a team of medical, veterinary and
laboratory personnel including myself.
Human sampling was conducted by Fred Amanya, Daniel Cheruiyot and Lorren
Alumasa.
Animal sampling was conducted by James Akoko, Lazarus Omoto, Will de
Glanville, Lian Thomas and myself.
Human parasitological testing was performed by Hannah Kariuki and John Mwaniki.
Serological testing was conducted by Alice Kiyong’a and Velma Kivali together with
myself at the International Livestock Research Institute, Nairobi, Kenya.
This work has not been submitted for any other degree or professional qualification.
Signed:
Date: 21st May 2015
iv
Abstract
Slaughterhouses are places where animals are slaughtered for food. In developing
countries a lack of appropriate facilities and limited resources mean the slaughter
industry is poorly regulated. Poor hygiene practices in slaughterhouses can result in
the transmission of diseases from animals to people called zoonoses. Slaughterhouse
workers are generally considered at increased risk of being exposed to such diseases
due to their close contact with animals and animal products.
The aims of this study were: to assess the current conditions in slaughterhouses and
the knowledge, attitudes and practices of workers in ruminant and pig
slaughterhouses in western Kenya; to determine the exposure of slaughterhouse
workers to different zoonotic pathogens; to investigate the risk factors associated
with exposure to these pathogens and to quantify the risk of zoonotic disease
exposure for slaughterhouse workers compared to the general population.
Slaughterhouses in western Kenya were visited between May 2011 and October
2012. Seven hundred and thirty-eight workers were recruited from 142
slaughterhouses. Overall, the slaughterhouses lacked facilities, with 65% (95% CI
63–67%) of slaughterhouses having a roof, cement floor and solid sides, 60% (95%
CI 57–62%) had a toilet and 20% (95% CI 18–22%) hand-washing facilities. Less
than half of workers 32% (95% CI 29–34%) wore personal protective clothing.
Antemortem inspection was practiced at 7% (95% CI 6–8%) of slaughterhouses and
18% (95% CI 16–19%) of workers reported slaughtering sick animals.
Slaughterhouse workers were screened for five zoonotic diseases. The unadjusted
seroprevalence of the zoonotic diseases were: brucellosis 0.1% (95% CI 0.007–
v
0.8%); leptospirosis 13.4% (95% CI 11.1–16.1%); Q fever 4.5% (95% CI 3.2–6.2%);
Rift Valley fever (RVF) 1.2% (95% CI 0.6–2.3%); taeniasis 1.8% (95% CI 1.0–
3.0%); and cysticercosis 2.6% (95% CI 1.7–4.0%).
Risk factors for leptospirosis and Q fever were examined by multivariable logistic
regression. Risk factors associated with leptospirosis seropositivity included: having
wounds (OR 2.7; 95% CI 1.4–5.3); smoking at work (OR 1.8; 95% CI 1.1–3.0);
eating at work (OR 2.1; 95% CI 1.2–3.6); and cleaning the intestines (OR 3.8; 95%
CI 1.8–8.2). Protective factors were: working at a slaughterhouse where antemortem
inspection was performed (OR 0.6; 95% CI 0.4–0.9). The risk factors significantly
associated with Q fever seropositivity included: being intoxicated at work (OR 3.2;
95% CI 1.1–9.4).
The odds ratio for leptospirosis seropositivity in slaughterhouse workers was
determined to be 2.3 (95% CI 1.6–3.4) times that of the community. For Q fever the
odds ratio for seropositivity in slaughterhouse workers was 1.9 (95% CI 1.0–3.8)
times that of the community.
This is the first report of a range of zoonotic pathogens in slaughterhouse workers in
Kenya. This study indicated the potential risk factors for zoonotic disease exposure
in slaughterhouses. The current working conditions in slaughterhouses in western
Kenya are far below the recommended standard. Improvements need to be made to
facilities and practices in all slaughterhouses. Training is recommended to improve
awareness for workers, managers and inspectors of the risks of zoonotic disease
exposure and methods to reduce it.

vi
Acknowledgements
The creation of a thesis can seem at times a dark and lonely road – usually at 3am
sitting alone amongst the papers and empty coffee mugs. In fact I have had an
abundance of support. Many people have given advice, sent R code when I didn’t
have a clue, made tea or more often poured a glass of wine. I am fortunate to have
many remarkable friends, colleagues and advisors that made this possible.
Firstly, thank you to 738 slaughterhouse workers in western Kenya that patiently sat
through a 30 minute interview and then suffered the discomfort of a needle stick,
with whom this work was made possible.
Thank you to Eric Fèvre my principal supervisor for creating this opportunity and
giving me the freedom to develop my ideas. Thanks to the keen eye of my second
supervisor Mark Bronsvoort who helped create this manuscript.
I am indebted to my colleagues at ILRI - Fred Amanya, James Akoko, Lorren
Alumasa, Daniel Cheruiyot, Isaac Obara, Alice Kiyong’a, Velma Kivali, John
Mwaniki, Dominic Njuguna, Hannah Kariuki, Abraham Simiyu, Gideon Maloba,
Lillian Abonyo, Bartholomew Wabwire, and George Omondi for the enthusiasm
they gave this project and long hours they put in to make it happen.
To my dear friends Lian Thomas, Laura Darby Brown, Cheryl Gibbons, Tatjana Sitt,
Katie Hamilton and Claire Okell thanks for tea at 11am and wine at 7pm. Thanks to
Gerri McHugh for wine and stories to keep me sane and Mark Newman for my UK
home. Michael Timbrell thanks for giving me a place to write. I am grateful to Viv
Carbines for some late night, last minute copy editing. Thanks to Liz Dobson for

vii
setting me on the path and for unending support and encouragement. Thanks to Will
de Glanville, who is my PhD colleague, my housemate, my co-manager and most
importantly my friend. His wisdom and expertise guided me through the last few
months. Thanks to Ravi Ruparel for his unconditional support, encouragement,
patience, care and most importantly for editing. I am sure there will be more to
come....
I could not have done this without the loving (and financial) support of my parents
and family who taught me that education is a precious gift. And finally to my furry
children Jed and Snowy – thanks for holding me together through the darkest hours.
This work was made possible by a Medical Research Council Doctoral Training
Grant, the Wellcome Trust (Grant number 085308) and the CGIAR Program for
Agriculture Nutrition and Health.
viii
Table of contents
Declaration ................................................................................................................... iii
Abstract .........................................................................................................................iv
Acknowledgements ........................................................................................................vi
Table of contents ......................................................................................................... viii
Table of figures .............................................................................................................. xi
Table of tables ............................................................................................................. xiv
List of Abbreviations .................................................................................................... xvi
Chapter 1 ....................................................................................................................... 1
Introduction ................................................................................................................... 1
1.1 Motivation ...................................................................................................................... 2
1.2 Aims................................................................................................................................ 4
1.3 Thesis outline ................................................................................................................. 5
1.4 Slaughterhouses ............................................................................................................. 6
1.5 Epidemiology of zoonotic disease ................................................................................ 12
1.6 The Kenyan meat industry ........................................................................................... 26
Chapter 2 ..................................................................................................................... 32
Study design ................................................................................................................ 32
2.1 Study site ...................................................................................................................... 33
2.2 Ethical approval ............................................................................................................ 35
2.3 The sampling and laboratory teams ............................................................................ 36
2.4 Study population and recruitment .............................................................................. 36
2.5 Sampling ....................................................................................................................... 36
2.6 Sample analysis ............................................................................................................ 40
2.7 Laboratory procedures (ILRI) ....................................................................................... 42
CHAPTER 3 ................................................................................................................... 51
Cross–sectional survey of slaughterhouses and slaughterhouse workers in western Kenya:
comparison between ruminant and pig slaughterhouses ............................................... 51
3.1 Introduction ................................................................................................................. 52
3.2 Methods ....................................................................................................................... 53
3.3 Results .......................................................................................................................... 57
3.4 Discussion ..................................................................................................................... 78

ix
3.5 Conclusion .................................................................................................................... 84
Chapter 4 ..................................................................................................................... 86
Sero-prevalence of brucellosis, leptospirosis, Q fever, Rift Valley fever (RVF), taeniasis and
cysticercosis in slaughterhouse workers in western Kenya ............................................ 86
4.1 Introduction ................................................................................................................. 87
4.2 Methods ....................................................................................................................... 89
4.3 Results .......................................................................................................................... 92
4.4 Discussion ................................................................................................................... 111
4.5 Conclusion .................................................................................................................. 121
Chapter 5 .................................................................................................................... 123
Risk factors for exposure to leptospirosis and Q fever in slaughterhouse workers in
western Kenya ............................................................................................................ 123
5.1 Introduction ............................................................................................................... 124
5.2 Methods ..................................................................................................................... 125
5.3 Results ........................................................................................................................ 129
5.4 Discussion ................................................................................................................... 147
5.5 Conclusion .................................................................................................................. 154
Chapter 6 .................................................................................................................... 157
Epidemiology of leptospirosis and Q fever in people in western Kenya ......................... 157
6.1 Introduction ............................................................................................................... 158
6.2 Methods ..................................................................................................................... 159
6.3 Results ........................................................................................................................ 166
6.4 Discussion ................................................................................................................... 181
6.5 Conclusion .................................................................................................................. 185
Chapter 7 .................................................................................................................... 186
Comparing the risks for exposure to leptospirosis and Q fever between slaughterhouse
workers and the community ........................................................................................ 186
7.1 Introduction ............................................................................................................... 187
7.2 Methods ..................................................................................................................... 188
7.3 Results ........................................................................................................................ 192
7.4 Discussion ................................................................................................................... 203
7.5 Conclusion .................................................................................................................. 207
Chapter 8 .................................................................................................................... 209

x
Conclusion .................................................................................................................. 209
APPENDICES ................................................................................................................ 218
Appendix 1 Consent form ................................................................................................ 219
Appendix 2 Slaughterhouse individual questionnaire ..................................................... 221
Appendix 3 Slaughterhouse foremen questionnaire ....................................................... 228
Appendix 4 Details of closed and declined slaughterhouses ........................................... 231
Appendix 5 Results from cross sectional survey .............................................................. 232
Appendix 6 Spatial analysis .............................................................................................. 237
Appendix 7 Images for zoonotic disease recognition ...................................................... 239
Appendix 8 Variables for multivariable models Chapter 5 .............................................. 240
Appendix 9 PAZ individual questionnaire ........................................................................ 242
Appendix 10 PAZ homestead questionnaire.................................................................... 250
Appendix 11 Variables for multivariable models Chapter 7 ............................................ 257
References .................................................................................................................. 258
xi
Table of figures
Figure 1.1 The effects of zoonotic disease. .............................................................................. 2
Figure 1.2 The slaughterhouse process ................................................................................... 8
Figure 1.3 Factors contributing to meat contamination. ......................................................... 8
Figure 1.4 Transmission cycles of leptospires (Faine, 1999) .................................................. 16
Figure 1.5 IgM and IgG persistence in leptospirosis patients (Cumberland et al., 2001) ...... 18
Figure 1.6 Counties where zoonotic disease has been reported in Kenya ............................ 25
Figure 1.7 Flow chart of the meat value chain in Kenya (Adapted from (Farmer, 2012) ...... 26
Figure 1.8 Butchery in western Kenya (A) Metal container for transporting meat (B) ......... 29
Figure 1.9 Photographs of the types of slaughterhouses in western Kenya ......................... 31
Figure 2.1 Map of study area in western Kenya .................................................................... 33
Figure 2.2 Maps showing human, cattle and small ruminant density in Kenya (FAO, 2005) 34
Figure 2.3 Flow chart of the laboratory processes in the Busia laboratory ........................... 41
Figure 3.1 Map of slaughterhouses showing location, type and number of workers ........... 58
Figure 3.2 Number of slaughterhouses and workers in western Kenya in 2012 ................... 59
Figure 3.3 Slaughterhouses in western Kenya ....................................................................... 61
Figure 3.4 Structural features at slaughterhouse – observed ............................................... 62
Figure 3.5 Sanitation facilities at slaughterhouses – reported and observed ....................... 63
Figure 3.6 Water source at slaughterhouse – reported ........................................................ 63
Figure 3.7 Personal hygiene practices at slaughterhouses – reported and observed ........... 65
Figure 3.8 Meat inspection practices – reported and observed ............................................ 66
Figure 3.9 The distribution of jobs in the slaughterhouse – reported ................................... 67
Figure 3.10 Secondary occupations of slaughterhouse workers – reported ......................... 68
Figure 3.11 Slaughterhouse worker contact with animals outside work – reported ............ 69
Figure 3.12 Protective clothing and boots worn reported by workers ................................. 70
Figure 3.13 Slaughterhouse workers personal hygiene practices – reported and observed 71
Figure 3.14 Meat inspection practices reported by the slaughterhouse workers ................ 71
Figure 3.15 Slaughterhouse worker knowledge of zoonotic and foodborne disease ........... 72
Figure 3.16 Self reported symptoms in the 3 months before interview – reported ............. 73
Figure 3.17 Health status of the slaughterhouse workers in western Kenya at interview. ... 74
Figure 3.18 Workers that are injured every month and workers with wounds at interview 74
Figure 3.19 The distribution of variables using the first 2 dimensions of the multiple
correspondence analysis ........................................................................................................ 76
Figure 3.20 Dendrogram of the first 5 dimensions of the multiple correspondence analysis.
............................................................................................................................................... 77
Figure 4.1 Histogram of Panbio leptospirosis ELISA Panbio units ......................................... 94
Figure 4.2 Map of leptospirosis positive slaughterhouses .................................................... 95
Figure 4.3 Histogram of Q fever optical density (OD) values for slaughterhouse workers ... 97
Figure 4.4 Map of Q fever positive slaughterhouses ............................................................. 98
Figure 4.5 Histogram of RVF percentage inhibition (PI) values ........................................... 100

xii
Figure 4.6 Map of Rift Valley fever positive slaughterhouses ............................................. 101
Figure 4.7 Histogram of coproantigen ELISA optical density (OD) values for slaughterhouse
workers ................................................................................................................................ 103
Figure 4.8 Map of taeniasis positive slaughterhouses ......................................................... 104
Figure 4.9 Histogram of HP10 ELISA optical density (OD) values for slaughterhouse workers
............................................................................................................................................. 106
Figure 4.10 Map of cysticercosis positive slaughterhouses ................................................. 107
Figure 4.11 Map showing slaughterhouses positive for zoonoses ...................................... 110
Figure 5.1 Correlation matrix for the selected variables for exposure to leptospirosis in
slaughterhouse workers ...................................................................................................... 133
Figure 5.2 Histogram of the group level residuals from model for leptospirosis in
slaughterhouse workers ...................................................................................................... 136
Figure 5.3 Correlation matrix for variables associated with exposure to Q fever in
slaughterhouse workers ...................................................................................................... 142
Figure 5.4 Histogram of the group level residuals from the model for Q fever in
slaughterhouse workers ...................................................................................................... 145
Figure 5.5 Causal framework of risk factors for leptospirosis in slaughterhouse workers.. 147
Figure 5.6 Causal framework of risk factors for Q fever in slaughterhouse workers .......... 151
Figure 6.1 Map of the study area indicating the cattle population numbers for each division,
the sublocation boundaries and the selected homesteads ................................................. 161
Figure 6.2 The age profile of the People, Animals and their Zoonoses (PAZ) adjusted
population ............................................................................................................................ 167
Figure 6.3 Animal ownership in the People, Animals and their Zoonoses (PAZ) adjusted
population ............................................................................................................................ 167
Figure 6.4 Histogram of the Panbio units for the People, Animals and their Zoonoses (PAZ)
adjusted population ............................................................................................................. 168
Figure 6.5 Map of the People, Animals and their Zoonoses (PAZ) adjusted population
leptospirosis positive homesteads ....................................................................................... 169
Figure 6.6 Histogram of the corrected optical density (OD) values for Q fever .................. 170
Figure 6.7 Map of the People, Animals and their Zoonoses (PAZ) adjusted population Q
fever positive homesteads ................................................................................................... 171
Figure 6.8 Correlation matrix for variables for exposure to leptospirosis in People, Animals
and their Zoonoses (PAZ) adjusted population................................................................... 174
Figure 6.9 Correlation matrix for variables for exposure to Q fever in People, Animals and
their Zoonoses (PAZ) adjusted population .......................................................................... 178
Figure 6.10 Causal framework of risk factors for leptospirosis in the People, Animals and
their Zoonoses (PAZ) adjusted population .......................................................................... 182
Figure 6.11 Causal framework of risk factors for Q fever in the People, Animals and their
Zoonoses (PAZ) adjusted population ................................................................................... 184
Figure 7.1 Spatially smoothed relative risk for leptospirosis ............................................... 199
A) slaughterhouse, B) homesteads ...................................................................................... 199
Figure 7.2 Spatially smoothed relative risk for Q fever A) slaughterhouses, B) homesteads
............................................................................................................................................. 201

xiii
Figure 7.3 Spatially smoothed relative risk for Q fever in cattle ......................................... 202

xiv
Table of tables
Table 1.1 Published reports of zoonoses in slaughterhouse workers ................................... 13
Table 1.2 Published reports of zoonoses in Kenya ................................................................ 24
Table 1.3: Classification of slaughterhouses in Kenya (Government of Kenya, 2012) .......... 30
Table 2.1 Sensitivity and specificity reported for the diagnostic tests in this study. The
sensitivity and specificity used for this thesis are highlighted............................................... 50
Table 3.1 Number of slaughterhouse workers and animals slaughtered per week .............. 60
Table 3.2 Slaughterhouse workers that recognise images of zoonotic disease in animals ... 72
Table 3.3 Contribution of the variables to 5 dimensions created by the multiple
correspondence analysis ........................................................................................................ 75
Table 4.1 Individual level prevalence estimates for 6 zoonoses in workers .......................... 92
Table 4.2 Leptospirosis seroprevalence estimates for slaughterhouse workers................... 94
Table 4.3 Q fever seroprevalence estimates for slaughterhouse workers ............................ 97
Table 4.4 Rift Valley fever seroprevalence estimates for slaughterhouse workers .............. 99
Table 4.5 Taenia prevalence estimates for slaughterhouse workers ................................. 103
Table 4.6 Cysticercosis seroprevalence estimates for slaughterhouse workers ................. 106
Table 4.7 Slaughterhouse level apparent and adjusted prevalence to 6 zoonoses ............ 108
Table 4.8 Slaughterhouse level prevalence of zoonoses in the 3 slaughterhouse types .... 109
Table 5.1 Odds ratios for leptospirosis between slaughterhouse types ............................. 129
Table 5.2 Odds ratios for leptospirosis in slaughterhouse workers examining personal
history variables and health ................................................................................................. 130
Table 5.3 Odds ratios for leptospirosis in slaughterhouse workers examining individual
slaughterhouse practices ..................................................................................................... 131
Table 5.4 Odds ratios for leptospirosis in slaughterhouse workers examining slaughterhouse
factors .................................................................................................................................. 132
Table 5.5 Multivariable model selection for leptospirosis in slaughterhouse workers. ...... 134
Table 5.6 Results of multivariable analysis for leptospirosis in slaughterhouse workers ... 135
Table 5.7 Individual and slaughterhouse level predictors associated with leptospirosis in
slaughterhouse workers by multivariable logistic regression ............................................. 137
Table 5.8 Odds ratios for Q fever amongst slaughterhouse workers between slaughterhouse
types ..................................................................................................................................... 138
Table 5.9 Odds ratios for Q fever in slaughterhouse workers examining personal history
variables and examining health factors ............................................................................... 139
Table 5.10 Odds rations for Q fever in slaughterhouse workers examining individual
slaughterhouse practices ..................................................................................................... 140
Table 5.11 Odds ratios for Q fever in slaughterhouse workers examining slaughterhouse
factors .................................................................................................................................. 140
Table 5.12 Multivariable model selection for Q fever seropositivity in slaughterhouse
workers ................................................................................................................................ 143
Table 5.13 Results of the multivariable analysis for Q fever in slaughterhouse workers ... 144
xv
Table 5.14 Individual and slaughterhouse level predictors associated with Q fever in
slaughterhouse workers by multivariable logistic regression ............................................. 146
Table 6.1 Demographics of the People, Animals and their Zoonoses (PAZ) adjusted
population ............................................................................................................................ 166
Table 6.2 Seroprevalence estimates for leptospirosis in the People, Animals and their
Zoonoses (PAZ) adjusted population ................................................................................... 168
Table 6.3 Seroprevalence estimates for Q fever in the PAZ adjusted population ............... 170
Table 6.4 Odds ratios for leptospirosis in People, Animals and their Zoonoses (PAZ) adjusted
population. ........................................................................................................................... 173
Table 6.5 Model selection for leptospirosis in the People, Animals and their Zoonoses (PAZ)
adjusted population. ............................................................................................................ 175
Table 6.6 Results of multivariable logistic regression for exposure to leptospirosis in the
People, Animals and their Zoonoses (PAZ) adjusted population ......................................... 176
Table 6.7 Individual and homestead level predictors associated with leptospirosis in the
People, Animals and their Zoonoses (PAZ) adjusted population by multivariable logistic
regression ............................................................................................................................. 177
Table 6.8 Odd ratios for Q fever in People, Animals and their Zoonoses (PAZ) adjusted
population. ........................................................................................................................... 178
Table 6.9 Model selection for Q fever in People, Animals and their Zoonoses (PAZ) adjusted
population ............................................................................................................................ 179
Table 6.10 Results of multivariable logistic regression for exposure to Q fever in the People,
Animals and their Zoonoses (PAZ) adjusted population ...................................................... 179
Table 7.1 Comparison of knowledge and risk behaviours between slaughterhouse workers
and People, Animals and their Zoonoses (PAZ) adjusted population .................................. 192
Table 7.2 Comparison of animal ownership between slaughterhouse workers and People,
Animals and their Zoonoses (PAZ) adjusted population ...................................................... 193
Table 7.3 Comparison of select diagnosed diseases and clinical symptoms between
slaughterhouse workers and the People, Animals and their Zoonoses (PAZ) adjusted
population ............................................................................................................................ 194
Table 7.4 Comparison of self reported symptoms between slaughterhouse workers and
People, Animals and their Zoonoses (PAZ) adjusted population ......................................... 195
Table 7.5 Comparison of recent medications between slaughterhouse workers and People,
Animals and their Zoonoses (PAZ) adjusted population ...................................................... 196
Table 7.6 Prevalence of leptospirosis in slaughterhouse workers and the People, Animals
and their Zoonoses (PAZ) adjusted population ................................................................... 196
Table 7.7 Prevalence of Q fever in slaughterhouse workers and the People, Animals and
their Zoonoses (PAZ) adjusted population .......................................................................... 197

xvi
List of Abbreviations
Ab Antibody
AIC Akaike’s second-order information criterion
BD Becton, Dickinson and Company
CI Confidence interval
CT Computerised tomography
DLPO Divisional livestock production office
EDTA Ethylenediaminetetraacetic acid
EITB Enzyme-linked immunoelectrotransfer blot
ELISA Enzyme-linked immunosorbent assay
FAO Food and Agriculture Organization of the United Nations
fpc Finite population correction
GIS Geographical information systems
GPS Global Positioning System
HDSS Human and Demographic Surveillance System
HIV Human immunodeficiency virus
Ig Immunoglobulin
IHA Indirect haemagglutination assay
ILRI International Livestock Research Institute
KEMRI Kenya Medical Research Institute
MAT Microscopic agglutination test
MCA Multiple correspondence analysis
MOR Median odds ratio
MRC Medical Research Council
MRI Magnetic resonance imaging
MUAC Mid-upper-arm circumference
OD Optical density
OIE World Organisation for Animal Health

xvii
OR Odds ratio
PAZ People, Animals and their Zoonoses
PBS Phosphate buffered saline
PCR Polymerase chain reaction
PCV Packed cell volume
PDA Personal digital assistant
PI Percentage inhibition
PPE Personal protective equipment
RBT Rose Bengal test
rpm Revolutions per minute
RVF Rift Valley fever
SE Standard error
Se Sensitivity
Sp Specificity
SSA Sub-Saharan Africa
USA United States of America
VIFs Variance inflation factors
VPH Veterinary public health
WHO World Health Organization

Chapter 1 Introduction _____________________ 1
Chapter 1
Introduction

Chapter 1 Introduction _____________________ 2
1.1 Motivation
Zoonotic diseases are those that are transmitted between animals and people (WHO,
2006). The burden of zoonotic disease falls disproportionately on poor people in
rural areas who live in close contact with their animals (Maudlin et al., 2009).
Livestock serve many functions for people in rural areas including: food source,
traction/transport, manure, dowry, and financial security (Muma et al., 2014).
Zoonotic diseases impact both human health and also livelihoods as disease in
animals can result in reduced livestock productivity (Figure 1.1) (Maudlin et al.,
2009).
Zoonotic
disease in
animals
Impact on
human
livelihood
Sick animal
Reduced
production/
animal death
Impact on
human
health
Meat
inspection
Vaccination
Treat
Laboratory
testing
Awareness
PPE
Vaccination
Treat
Contaminate
food chain
Sold for
slaughter
Awareness
*The red boxes indicate where interventions may reduce the impact of the disease to people/animals. PPE – personal protective equipment
Figure 1.1 The effects of zoonotic disease.
(Adapted from (FAO, 2002).

Chapter 1 Introduction _____________________ 3
The surveillance and control of zoonotic diseases requires a “One Health” approach,
involving human and animal health disciplines (WHO, 2006). However, lack of
funding and inadequate coordination has weakened animal health and veterinary
departments in most developing countries. This situation has resulted in a lack of
control of endemic zoonoses, increasing occurrences of foodborne disease and the
emergence of new diseases (FAO, 2002). These veterinary public health (VPH)
issues are likely to be exacerbated in future by globalisation, increasing population,
urbanisation, climate change, changing agricultural practices, and agricultural
intensification (WHO, 2002).
Improvements in VPH systems in developing countries will require a focus on
education of stakeholders, regulation and legislation, improved facilities, new
technologies, surveillance, and communication (WHO, 2002). In addition,
interdisciplinary research is necessary to understand the epidemiology of zoonoses in
different environments, to perform appropriate risk analyses, and to develop control
measures (WHO, 2002).
In 2006, a joint meeting between the World Health Organization (WHO), the Food
and Agriculture Organization of the United Nations (FAO) and the World
Organisation for Animal Health (OIE) made recommendations on methods to control
zoonotic disease for poverty alleviation in developing countries (WHO, 2006). One
of the epidemiological research methods proposed by the meeting was the
investigation of risk factors for zoonoses in high risk groups for the purpose of
developing targeted control interventions. One such high risk group is slaughterhouse
workers (McEwen, 1987). In areas where animal disease surveillance systems are

Chapter 1 Introduction _____________________ 4
poor, it has been suggested that slaughterhouse workers may act as sentinels for
monitoring zoonotic diseases (Rabinowitz et al., 2009).
The People, Animals and their Zoonoses (PAZ) project was established in 2010 to
investigate the epidemiology of zoonoses in livestock and non livestock keeping
homesteads in rural western Kenya (Doble and Fevre, 2010). The study of zoonotic
diseases in slaughterhouse workers is an off-shoot of the PAZ project. It came about
because of a request by slaughterhouse workers within the PAZ study area for
information regarding their zoonotic disease risks. These slaughterhouse workers
presented a unique opportunity to conduct a demand-led project with the support of
the community.
The project proposal and protocols were developed in 2011 during the first year of
the author’s PhD. The field data collection and initial laboratory testing was
performed at the International Livestock Research Institute (ILRI) laboratory in
Busia, Kenya in 2012. The majority of the serological testing was conducted at the
ILRI laboratory in Nairobi, Kenya in 2013. The data analysis and write up was
completed in 2014.
1.2 Aims
The project aim was to understand the epidemiology of zoonoses in slaughterhouse
workers in rural western Kenya. The main hypotheses of this study are that:
1. Slaughterhouses in western Kenya have inadequate infrastructure,
sanitation and hygiene practices;
Chapter 1 Introduction _____________________ 5
2. The current situation in slaughterhouses in western Kenya contributes to
zoonotic disease risk in slaughterhouse workers;
3. Slaughterhouse workers are more exposed to zoonotic disease than other
members of the community.
The specific aims of this thesis are to:
1. describe the current standards and practices in slaughterhouse workers in
western Kenya;
2. to measure the seroprevalence of zoonotic pathogens in slaughterhouse
workers;
3. identify the risk factors for zoonotic disease exposure in slaughterhouse
workers;
4. compare the prevalence of zoonotic disease in slaughterhouse workers
and the community.
1.3 Thesis outline
The overall aim of this thesis is to establish the exposure of slaughterhouse workers
to zoonotic disease and the risk factors associated with exposure.
Chapter 1 is a review of the literature regarding slaughterhouses and the specific
zoonotic diseases that will be the focus of this study.
Chapter 2 describes the design of the study which was conducted in western Kenya
between May 2011 and October 2012.

Chapter 1 Introduction _____________________ 6
Chapter 3 describes the current standards and practices in slaughterhouses and
amongst slaughterhouse workers in western Kenya and compares these practices
between different slaughterhouse types.
Chapter 4 discusses the diagnostic tests used to determine the exposure of
slaughterhouse workers to zoonotic disease and reports the prevalence of zoonotic
disease in the different slaughterhouse types.
Chapter 5 identifies the risk factors for leptospirosis and Q fever seropositivity
among slaughterhouse workers in western Kenya.
Chapter 6 identifies the risk factors for leptospirosis and Q fever seropositivity in a
community-based sample of the population of western Kenya.
Chapter 7 explores the difference in the seropositivity to zoonotic disease between
slaughterhouse workers and members of the community.
Chapter 8 summarises the main findings of the thesis and makes recommendations
for future research areas and potential areas where interventions for control may be
effective.
1.4 Slaughterhouses
A slaughterhouse, also called an abattoir, is defined as a place where animals are
slaughtered for food (Stevenson, 2013). The development of the slaughter industry
varies between countries due to cultural differences, the types of animals slaughtered
and wealth (Long, 1990). In developed countries such as the USA or United
Kingdom slaughter facilities are centralised, large-scale, industrialised, and are
predominantly meat packing plants where meat is packed ready for distribution
Chapter 1 Introduction _____________________ 7
(Broadway, 2002, Broadway and Ward, 1990). This growth in the industry occurred
through urbanisation, improved transport and refrigeration, in addition to regulations
for public health (Fitzgerald, 2010). In developing countries there are three types of
slaughter facilities (Clottey, 1985).
The larger cities or towns often have government or commercially-owned
modern slaughterhouses that are well designed and equipped with industrial
meat processing facilities. These slaughterhouses focus on the commercial or
export markets.
In smaller towns local authorities own and manage the slaughterhouses and
slaughterslabs1. These facilities are rented to butchers to slaughter animals for
the local market.
In villages and rural areas slaughter facilities are privately owned and
unregulated.
This variation in standards is largely due to inadequate infrastructure to regulate the
trade particularly in rural areas. In addition there is often a deficit of suitable and/or
affordable equipment for the processing and transportation of meat. Overall there is a
lack of incentive to improve conditions which is the result of a poor understanding of
the risks of foodborne disease (Mann, 1984, FAO, 2010).
1 Slaughterslab is a term used to describe crudely equipped low throughput slaughter
facilities in rural areas. For the purposes of this thesis the term slaughterhouse will refer to all
slaughter facilities.
Chapter 1 Introduction _____________________ 8
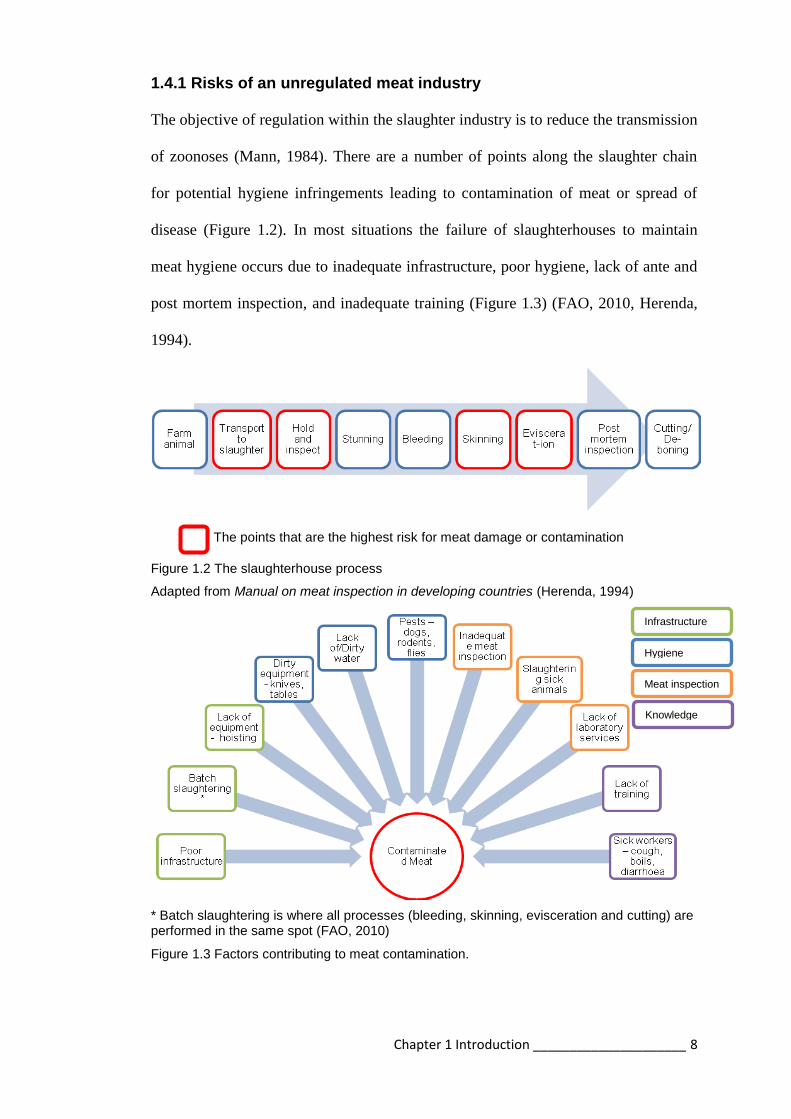
1.4.1 Risks of an unregulated meat industry
The objective of regulation within the slaughter industry is to reduce the transmission
of zoonoses (Mann, 1984). There are a number of points along the slaughter chain
for potential hygiene infringements leading to contamination of meat or spread of
disease (Figure 1.2). In most situations the failure of slaughterhouses to maintain
meat hygiene occurs due to inadequate infrastructure, poor hygiene, lack of ante and
post mortem inspection, and inadequate training (Figure 1.3) (FAO, 2010, Herenda,
1994).
The points that are the highest risk for meat damage or contamination
Figure 1.2 The slaughterhouse process
Adapted from Manual on meat inspection in developing countries (Herenda, 1994)
* Batch slaughtering is where all processes (bleeding, skinning, evisceration and cutting) are performed in the same spot (FAO, 2010)
Figure 1.3 Factors contributing to meat contamination.
Infrastructure
Hygiene
Meat inspection
Knowledge

Chapter 1 Introduction _____________________ 9
1.4.2 Infrastructural requirements
The FAO published international guidelines for minimum building requirements in
slaughterhouses (FAO, 2004, Codex Alimentarius Commission, 2005). The FAO
guidelines take into account the availability of resources in different regions. The
guidelines recommend that buildings should be situated away from residential areas
with adequate land for expansion. Roofing is recommended and the floor must be
hard, smooth, and impervious. There should be separate areas for stunning, bleeding,
scalding, and skinning before evisceration. Hoisting equipment is essential. There
should be animal holding facilities, a source of potable water, toilets, and a pit for
disposal of carcasses and condemned meat.
1.4.3 Personal hygiene requirements
Workers can be a source of meat contamination through poor personal hygiene
(FAO, 2004). The FAO guidelines suggest the following steps to reduce meat
contamination from personnel:
clean coveralls and waterproof boots that are only worn in the
slaughterhouse;
workers should abstain from work if coughing, sneezing, or have
gastrointestinal illness;
cuts or abrasions should be covered with waterproof tape;
workers should wash hands with soap and warm water when starting and
finishing work, after using the toilet, after coughing, sneezing, or touching the
face.

Chapter 1 Introduction _____________________ 10
1.4.4 Meat inspection
Meat inspection is important to reduce the spread of disease. Antemortem inspection
prevents diseased animals entering the slaughterhouse and hence the food chain
(Herenda, 1994). Disease monitoring at the slaughterhouse can be reported back to
source farms. This reporting can lead to animal disease control at the farm level and
reduce the occurrence of animal pathogens in the surrounding region (Mann, 1984).
In this way, antemortem screening for tuberculosis in cattle has formed an essential
part of eradication programmes in many countries (Palmer and Waters, 2011).
Antemortem inspection is particularly important in developing countries where there
may be a higher proportion of sick animals at slaughter. Producers may sell sick
animals to reduce losses (Brown et al., 2011). Animals with brucellosis, for example,
may be sold due to previous abortion or infertility. These animals are likely to shed
large amounts of the infectious organism posing a risk to workers and consumers
(Nabukenya et al., 2013). Postmortem inspection of the carcass is important to
identify lesions. This inspection is done using gross examination combined with
laboratory support to determine the fitness of the carcass for human consumption
(FAO, 2010). Postmortem inspection should be risk based (Codex Alimentarius
Commission, 2005):
according to knowledge of the animal disease problems in the region;
allowing additional examination of carcasses where findings suggest the
presence of disease;
reducing cross contamination through proper handling of the carcass.

Chapter 1 Introduction _____________________ 11
1.4.5 Training
The meat industry employs unskilled labour with a high turnover which makes
specialisation difficult (Fitzgerald, 2010). Training of slaughterhouse workers in
personal hygiene practices has been shown to significantly reduce carcass
contamination (Wamalwa et al., 2012). Education regarding the risks of zoonotic
disease can reduce exposure to disease (Campagnolo et al., 2000, Nabukenya et al.,
2013). However in developing countries slaughtering is done by butchers with their
own team in rented slaughter facilities. The slaughterhouses are not staffed with
regular personnel, which makes consistent and formal training difficult (FAO, 2010).
1.4.6 Slaughterhouse worker health
Slaughterhouse workers are considered a high risk group for work-related injuries
and occupational exposure to disease (Fitzgerald, 2010). Slaughterhouse workers are
at particularly high risk of lacerations to the arms and hands through the use of hand-
held tools (Cai et al., 2005, Pedersen et al., 2010, Burridge et al., 1997). They are
also at risk of contracting zoonoses due to their intimate contact with animals, animal
products, and excreta (Beheshti et al., 2010, Dorjee et al., 2011). Transmission of
these diseases occurs through the regular routes such as inhalation, instillation in
wounds or ingestion (Taylor et al., 2001). Exposure is exacerbated under
slaughterhouse conditions by opening the carcass, being splashed with body fluids,
poor hygiene practices, and working with uncovered wounds (Mann, 1984). Risk
behaviours that appear most frequently to be associated with zoonotic disease
exposure are low levels of education, role in the slaughterhouse, lack of personal
protective equipment, smoking, and eating at work (Brown et al., 2011, Gilbert et al.,
2012, Wilson et al., 2010). Zoonotic diseases that have been reported in

Chapter 1 Introduction _____________________ 12
slaughterhouse workers, worldwide, include anthrax, brucellosis, leptospirosis, Rift
Valley fever, orf virus, dermatophytosis, and Q fever (Beheshti et al., 2010, Brown et
al., 2011, Wilson et al., 2010, Ray et al., 2009, Peck and Fitzgerald, 2007, Maslen,
2000, Nougairede et al., 2013, Abu-Elyazeed et al., 1996).
Four zoonotic diseases were identified to commonly affect slaughterhouse workers
and are the focus of this study – brucellosis, leptospirosis, Q fever, and Rift Valley
fever. Table 1.1 shows a selection of published reports of these diseases in
slaughterhouse workers. Two additional diseases were investigated: taeniasis and
cysticercosis. The reason for including these diseases is discussed later in the
chapter.
1.5 Epidemiology of zoonotic disease
Little is known about the prevalence of zoonotic diseases in sub-Saharan Africa due
to the lack of surveillance, misdiagnosis, and underreporting (McDermott and Arimi,
2002, Abela-Ridder et al., 2010, Maudlin et al., 2009). The generalised presentation
in people of zoonotic diseases such as brucellosis, leptospirosis and Q fever result in
misdiagnoses as other febrile illnesses such as malaria, typhoid, tuberculosis, cancer
or HIV-related illness (Mantur et al., 2006, Dames et al., 2005, McDermott and
Arimi, 2002, Abela-Ridder et al., 2010, Crump et al., 2013). Unfortunately
diagnostic tests for zoonotic diseases are often not available or have variable
performance in endemic situations (Crump et al., 2013, Maudlin et al., 2009).
Diagnosis of febrile illnesses is further complicated by co-infections with multiple
pathogens or previous infections (Ari et al., 2011).

Chapter 1 Introduction _____________________ 13
Disease Study type Country Animals slaughtered
Prevalence (people)
Risk factors Year of study
Reference
Brucellosis Prevalence Pakistan Cattle, Goats, Sheep, Camels, Buffaloes
21.7% Age Assistance at animal birth Consuming raw milk Handling sheep
2008 Mukhtar, 2010
Prevalence Uganda - 2 regions
Cattle, Goats, Sheep
10% 7%
Lack of protective gear Working over 5 years
2007 Nabukenya et al., 2013
Prevalence Iran Cattle Sheep
9.8% Longer duration of work Contact with sheep Traditional slaughterhouse
2009 Nikokar et al., 2011
Leptospirosis Outbreak USA Pigs 8% Smoking Drinking at work Washing hands (protective)
1998 Campagnolo et al., 2000
Prevalence Singapore Pigs 28.7% Cleaning intestines 1987 Chan et al., 1987
Prevalence New Zealand
Sheep Deer Cattle
12-31% 17-19% 5%
Role/position in slaughterhouse
2009 Dreyfus et al., 2014
Q fever Outbreak Scotland Sheep 41.9% Work position 2006 Wilson et al., 2010
Prevalence Brazil Cattle 29% Work position 1972 Riemann et al., 1975
Rift Valley fever
Outbreak Egypt Cattle 2% Cutting animals’ throats Handling animal parts
1993 Abu-Elyazeed et al., 1996
Table 1.1 Published reports of zoonoses in slaughterhouse workers
Chapter 1 Introduction _____________________ 14
1.5.1 Brucellosis
Brucellosis is considered to be one of the most widespread and most common
zoonoses worldwide (Pappas et al., 2006). Brucella abortus from cattle is the most
widespread species and B. melitensis, primarily from sheep and goats, causes the
most cases of human disease (Corbel, 1997). There have been reports of both B.
abortus and B. melitensis in Kenya (McDermott and Arimi, 2002, Corbel, 1997,
Muendo et al., 2012).
Transmission of brucellosis to people is primarily through consumption of
unpasteurised milk products from an infected animal but can also occur through
instillation of bacteria into broken skin or inhalation of the organism (Pappas et al.,
2005, Beheshti et al., 2010). The latter transmission events occur through contact
with body fluids or excreta such as urine, faeces, blood, vaginal secretions, gravid
uteri, or abortion material (Beheshti et al., 2010, Ali et al., 2013). Slaughterhouse
workers are occupationally exposed to brucellosis because of their contact with body
fluids of infected animals during evisceration or cleaning (Beheshti et al., 2010, Ali
et al., 2013). Slaughterhouse workers have been demonstrated to be a high risk group
for brucellosis in a number of studies with prevalence more than twice that of the
general population (Ali et al., 2013, Nikokar et al., 2011, Swai and Schoonman,
2009, Abo-Shehada et al., 1996, Bikas et al., 2003).
Human brucellosis is a clinically non-specific illness that invariably presents with
fever (Pappas et al., 2005). Clinical signs include headache, joint pain, back pain,
sweating, lethargy, lymphadenopathy, splenomegaly, hepatomegaly, and
epididymoorchitis (Pappas et al., 2005, Ali et al., 2013). In order to definitively

Chapter 1 Introduction _____________________ 15
diagnose brucellosis, the organism must be isolated from blood or tissue (Pappas et
al., 2005). Traditionally serological diagnosis has been made by serum agglutination
but enzyme-linked immunosorbent assays (ELISAs) have improved sensitivity and
specificity (Mantur et al., 2006). Lateral flow assays have been shown to be effective
at diagnosing brucellosis at different stages of infection and are convenient field tests
(Irmak et al., 2004). The Rose Bengal plate agglutination test (RBT) has also been
shown to be a highly specific and sensitive for diagnosis of brucellosis (Cernyseva et
al., 1977).
1.5.2 Leptospirosis
Leptospirosis is a zoonotic disease with worldwide distribution (Abela-Ridder et al.,
2010). There are over 200 serovars of the pathogenic Leptospira and domestic
animals are maintenance hosts for a number of pathogenic serovars including: cattle
(hardjo, pomona, grippotyphosa); pigs (pomona, tarassovi, bratislava); and sheep
(hardjo and pomona) (Levett, 2001). There is extremely limited published material
regarding the prevalence of human leptospirosis in Kenya. The first human cases
were reported in 1977 (de Geus et al., 1977) and in 2011 a study investigating acute
febrile illnesses in northern Kenya reported cases of leptospirosis (Ari et al., 2011).
A number of serovars have been reported in rodents in a recent study in Kenya,
highlighting the potential public health risk posed by this zoonosis (Halliday et al.,
2013).
Leptospires are maintained in the kidneys of the host animal and excreted in urine
(Levett, 2001, Monahan et al., 2009). Human infections result from exposure
through broken skin or mucosal surfaces to the organism in urine from an infected

Chapter 1 Introduction _____________________ 16
animal or contaminated water or soil (Waitkins, 1986, Campagnolo et al., 2000).
Faine et al (1999) described three epidemiological situations that promote the
transmission of leptospirosis to people (Figure 1.4):
1. farming in temperate climates where transmission events occur
predominantly from infected domestic animals – cattle and pigs
2. tropical wet areas with a range of animal reservoirs – rodent, cattle, pigs, and
dogs
3. urban situations where rodents are the predominant reservoir
Figure 1.4 Transmission cycles of leptospires (Faine, 1999)
Farmers, veterinarians, slaughterhouse workers, rodent control officers and sewer
workers are all considered to be occupationally exposed to Leptospira spp.
(Campagnolo et al., 2000, Alston and Brown, 1935, Demers et al., 1985).
Slaughterhouse workers are considered to be at high risk and have been shown to

Chapter 1 Introduction _____________________ 17
have a seropositivity rate twice that of other non risk occupations in studies
conducted in Singapore, Tanzania and India (Chan et al., 1987, Schoonman and
Swai, 2009, Sharma et al., 2006). Other risk factors include recreational water sports
such as swimming (Jackson et al., 1993, Evans, 2000).
The majority of human infections are subclinical or mild. Persons with leptospirosis
will develop fever, headache, muscle pain, anorexia, nausea, vomiting, abdominal
pain, rash, conjunctivitis, and hepatitis (Terry et al., 2000, Farr, 1995, Waitkins,
1986). A small number of patients will develop Weil’s disease with jaundice, renal
failure and haemorrhage (Bharti et al., 2003). The microscopic agglutination test
(MAT) is currently the gold standard for sero-diagnosis of leptospirosis but is
complex and requires experienced operators (Levett, 2001). Alternative methods
include the indirect haemagglutination assay (IHA) which has variable performance;
and ELISAs which are generally recommended as a screening tool for suspect cases
(Signorini et al., 2013, Budihal and Perwez, 2014, Bajani et al., 2003). The
Immunoglobulin M (IgM) ELISA has improved sensitivity and specificity over the
IgG ELISA for leptospirosis at all stages of disease (Signorini et al., 2013). Unlike
other infectious diseases, the development of IgG antibodies in leptospirosis patients
is highly variable which makes it unsuitable for use in diagnostics (Adler et al., 1980,
WHO, 2003). IgM antibodies specific for different serovars have been shown to
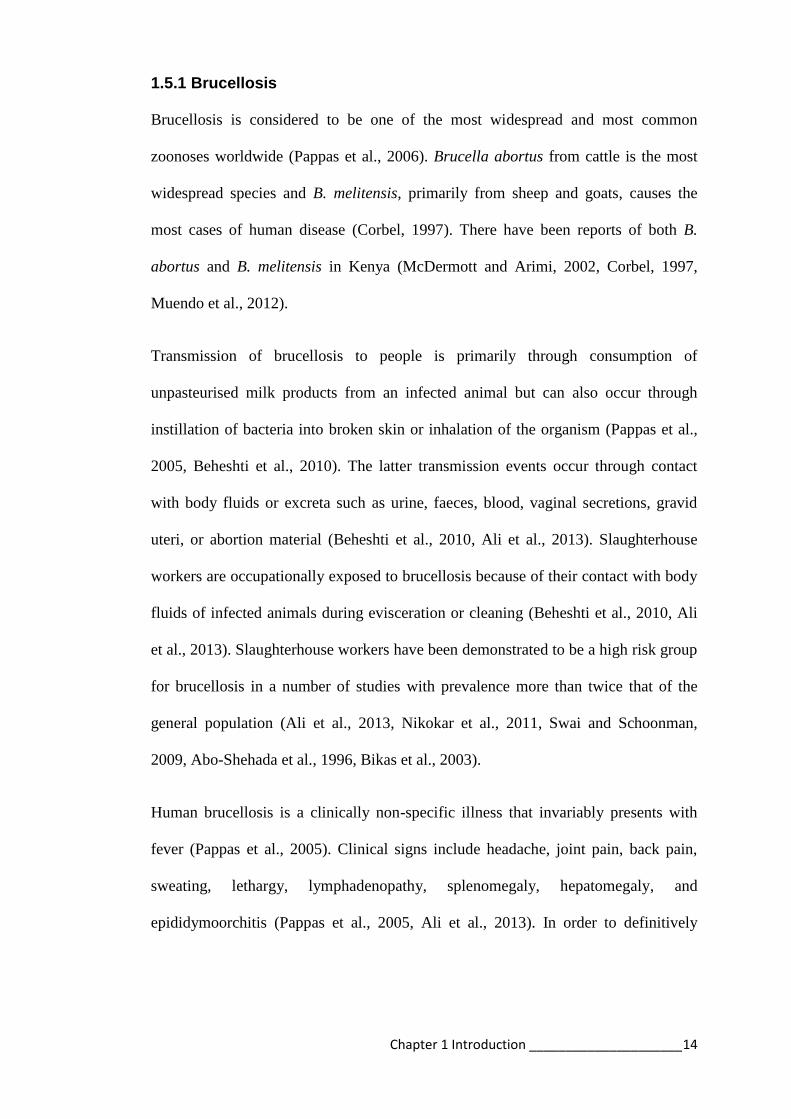
persist for up to 6 years (Cumberland et al., 2001). Figure 1.5 shows ELISA IgM and
IgG persistence for leptospirosis patients (Cumberland et al., 2001).
Chapter 1 Introduction _____________________ 18
A1 – Acute phase 1, A2 – Acute phase 2, C – Convalescent, Units - years
Figure 1.5 IgM and IgG persistence in leptospirosis patients (Cumberland et al., 2001)
1.5.3. Q Fever
Q fever is an underreported zoonotic disease caused by the bacteria Coxiella burnetii
(Maurin and Raoult, 1999). The organism has a worldwide distribution with cattle,
goats, and sheep being the primary reservoirs for human infection (Kaplan and
Bertagna, 1955, McQuiston et al., 2002, Raoult and Marrie, 1995, Marmion, 1959).
As with other zoonoses, there is very little information about Q fever in Kenya since
it was first described in Nakuru in 1955 (Craddock and Gear, 1955). There was a
recent report of Q fever being the cause of disease in misdiagnosed febrile patients in
western Kenya (Knobel et al., 2013).
Infected animals shed the organism in urine, faeces, milk, or placental fluids (Maurin
and Raoult, 1999). The organism is persistent in the environment and transmission is
primarily through exposure to animal birth products, aerosols from materials
contaminated by infected animals, and ingestion of milk (Raoult and Marrie, 1995,
Marmion, 1959, van Woerden et al., 2004, Bernard et al., 2012, De Lange et al.,
2014). C. burnetii has been isolated from ticks but this vector does not play a
significant role in transmission to people (Maurin and Raoult, 1999, Eklund et al.,

Chapter 1 Introduction _____________________ 19
1947). C. burnetii is a very infectious organism with one bacterium able to cause
infection in people (Brooke et al., 2013).
Outbreaks of Q fever in slaughterhouse workers have been documented in countries
worldwide and slaughterhouse workers have been shown to have a higher
seroprevalence than people in the community (Van Peenen et al., 1978, Marmion,
1959, Carrieri et al., 2002).
The majority of human infections are asymptomatic, whilst some people develop
mild disease such as a nonspecific flu-like illness (Maurin and Raoult, 1999). The
presenting signs are normally fever, sweating, chills, cough, joint pain, muscle pain,
headaches, atypical pneumonia, and hepatitis (Brown et al., 1968, Wilson et al.,
2010, McQuiston et al., 2002, Maurin and Raoult, 1999). If untreated, chronic Q
fever can result in endocarditis (Maurin and Raoult, 1999). Immunofluorescence
antibody is the reference technique for diagnosis of Q fever but for seroprevalence
studies IgG Phase 2 ELISAs are recommended (Raoult and Marrie, 1995, Blaauw et
al., 2012, Waag et al., 1995).
1.5.4 Rift Valley fever
Rift Valley fever (RVF) is a zoonotic arbovirus affecting livestock and people in
Africa and the Arabian peninsula (King et al., 2010). Epidemics of RVF are
associated with greater than average rainfall and are characterised by abortion in
livestock and febrile illness in people (Davies et al., 1985, King et al., 2010). RVF
virus has not previously been reported in western Kenya although epidemics have
occurred in neighbouring regions (Figure 1.6) (Murithi et al., 2011). It has been
suggested that the virus can be maintained in animal populations between epidemics

Chapter 1 Introduction _____________________ 20
and potentially spread to new areas through animal movement (LaBeaud et al.,
2007).
The virus is transmitted between animals by mosquitoes, but the most common route
of infection for people is exposure to infected animals or their products, particularly
abortion material during an epidemic when affected animals are shedding large
amounts of virus (Anyangu et al., 2010, Mohamed et al., 2010). Slaughterhouse
workers are at risk of exposure to infected materials such as blood through cutting
animals’ throats and handling animal parts (Mohamed et al., 2010, Nguku et al.,
2010, Abu-Elyazeed et al., 1996).
The majority of people infected by RVF suffer mild or subclinical disease (WHO,
2010). Fever, nausea, and vomiting are the most commonly reported clinical signs in
people (Kahlon et al., 2010, Madani et al., 2003). Other signs include large joint
arthralgia, diarrhoea, jaundice, right upper quadrant pain, delirium, neurological
manifestations, and haemorrhagic disorders (Madani et al., 2003, Kahlon et al.,
2010).
Diagnosis of RVF may be hindered because of the similar presentation to other
endemic febrile illnesses such as malaria or other arboviral diseases such as dengue
(Kahlon et al., 2010, Shieh et al., 2010). Diagnosis of RVF is made by virus isolation
or polymerase chain reaction (PCR) in the early stage of clinical disease (Sall et al.,
2002). Virus neutralisation assays are the gold standard of antibody detection, but the
requirement for live virus makes their use limited (OIE, 2014). ELISAs for IgM and
IgG can be used for diagnosis and surveillance of RVF (Paweska et al., 2005).

Chapter 1 Introduction _____________________ 21
1.5.5. Taeniasis
There are two human tape worms found in east Africa, Taenia saginata and Taenia
solium. They have different intermediate hosts, cattle and pig respectively. Both are
transmitted to people by eating undercooked meat from infected animals. Kenya is
considered a highly endemic area for T. saginata (Hall et al., 1981, Urquhart, 1961).
In contrast, T. solium is an emerging zoonotic threat in the region (Mafojane et al.,
2003).
Slaughterhouse workers are not specifically at risk for taeniasis due to its mode of
transmission. However, the author hypothesised that workers may be more likely to
eat infected meat and hence have a higher prevalence of disease. This conjecture has
been demonstrated in a study in Poland that showed meat handlers were 14 times
more likely to have a tapeworm infection than those in other professions (Gemmell,
1983).
Clinical signs of tapeworm infection are generally asymptomatic but adult worms
can cause abdominal pain, nausea, debility, weight loss, flatulence, diarrhoea, or
constipation due to the presence of the worm in the gut of the host (Craig and Ito,
2007). Taeniasis by T. solium has less overt signs, as the tapeworm is smaller and
less motile (Gemmell, 1983).
Diagnosis of tapeworm infection in the definitive human hosts can be made by faecal
examination (Gemmell, 1983). An alternative method for detecting Taenia infection
is the coproantigen ELISA which has better sensitivity than microscopy but does not
differentiate between Taenia sp (Allan and Craig, 2006).

Chapter 1 Introduction _____________________ 22
1.5.6 Cysticercosis
Cysticercosis is the larval form of the human tapeworm Taenia solium. Human
cysticercosis occurs when people ingest tapeworm eggs in food or drink
contaminated by a human tapeworm carrier and T. solium larvae develop in the
tissues (Pan American Health Organization, 2003 ). The intermediate host is the
domestic pig and increases in pig production across East Africa in recent years have
led to an increase in porcine and human cysticercosis (Phiri et al., 2003, Mafojane et
al., 2003).
Similarly to taeniasis, slaughterhouse workers are not necessarily a high risk group
for cysticercosis. The author proposes that due to their increased access to infected
meat those slaughterhouse workers may have a higher prevalence of disease.
Infection with the larval form in humans can result in neurocysticercosis which is
considered the leading cause of acquired epilepsy in developing world (Carpio et al.,
1998). This occurs because the infection is cleared from most tissues by the immune
system but the ocular and neural tissue is protected from the immune system and
hence cysts can develop unhindered (Garcia and Del Brutto, 2005). Disease develops
with the death of the larvae, resulting in an immune reaction causing non-specific
pathology of the nervous system (Pan American Health Organization, 2003 ).
Diagnosis of neurocysticercosis is made by computerised tomography (CT) and
magnetic resonance imaging (MRI) to detect lesions (Garcia and Del Brutto, 2005).
For serological diagnosis, the enzyme-linked immunoelectrotransfer blot (EITB) and
ELISA are most commonly used for diagnosis of cysticercosis although the EITB is
too labour intensive and costly for field use (Willingham and Engels, 2006).

Chapter 1 Introduction _____________________ 23
1.5.7 Zoonoses in Kenya
Table 1.2 summarises the zoonoses that are of interest to this study that have been
reported in Kenya. Maps of the location of the disease reports are shown in Figure
1.6.

Chapter 1 Introduction _____________________ 24
Disease Species County Year Reference
Brucellosis Humans Garissa 2005 Ari et al., 2011
Cattle Kiambu, Samburu, Kilifi 1991 Kadohira et al., 1997
Leptospirosis Humans Garissa 2005 Ari et al., 2011
Humans Bungoma 2004 WHO, 2004
Rodents Nairobi 2008 Halliday et al., 2013
Q fever Cattle Sheep Goats Camels
Laikipia 2011 Depuy et al., 2014
Humans Nakuru 1952 Craddock and Gear, 1955
Humans, Cattle Goats Sheep
Siaya 2007–2010
Knobel et al., 2013
Humans Mara 2000 Potasman et al., 2000
RVF Humans, Cattle
Baringo, Embu, Garissa, Isiolo, Kajiado, Keiyo-Marakwet, Kericho, Kiambu, Kilifi, Kirinyaga, Kitui, Kwale, Laikipia, Machakos, Makueni, Mandera, Marsabit, Meru, Mombasa, Murang’a, Nairobi, Nakuru, Narok, Nyandarua, Nyeri, Samburu, Taita Taveta, Tana River, Tharaka, Trans Nzoia, Uasin Gishu, Wajir, West Pokot
2007 Murithi et al., 2011
Taenia People West Pokot Hall et al., 1981
People Baringo Kipyegen et al., 2012
People Busia 2000–2009
Kagira et al., 2011
People Cattle
Turkana 2006 Asaava et al., 2009
People Cattle
Nairobi, Samburu Wanzala et al., 2003
Cattle Uasin, Gishu, Kericho, Nakuru, Narok, Laikipia, Isiolo, Meru, Embu, Machakos, Garissa
Onyango-Abuje et al., 1996
Cysticercosis Pigs Homa Bay 2010 Eshitera et al., 2012
Pigs, People
Busia, Kakamega, Nairobi
Phiri et al., 2003
Year of study not recorded in publication
Table 1.2 Published reports of zoonoses in Kenya

Chapter 1 Introduction _____________________ 25
Figure 1.6 Counties where zoonotic disease has been reported in Kenya
5 4 1 2 3
C
1. Brucellosis
2. Leptospirosis
3. Q fever
4. RVF
5. Taeniasis/
Cysticercosis
(green)
Chapter 1 Introduction _____________________ 26
1.6 The Kenyan meat industry
It is difficult to estimate the number of slaughter facilities in Kenya, as up to one
third of Kenya’s meat production occurs informally (Farmer, 2012). A report
commissioned in 2006 to examine the Kenyan livestock sector estimated the number
of slaughterhouses to be 2000 (Muthee, 2006). The majority of publications
concerning Kenya’s meat industry are focused on the large domestic slaughterhouses
in Nairobi (Figure 1.7). This bias is a result of the market for meat in Kenya being
predominantly urban and the middle class being the largest consumer (Farmer,
2012).
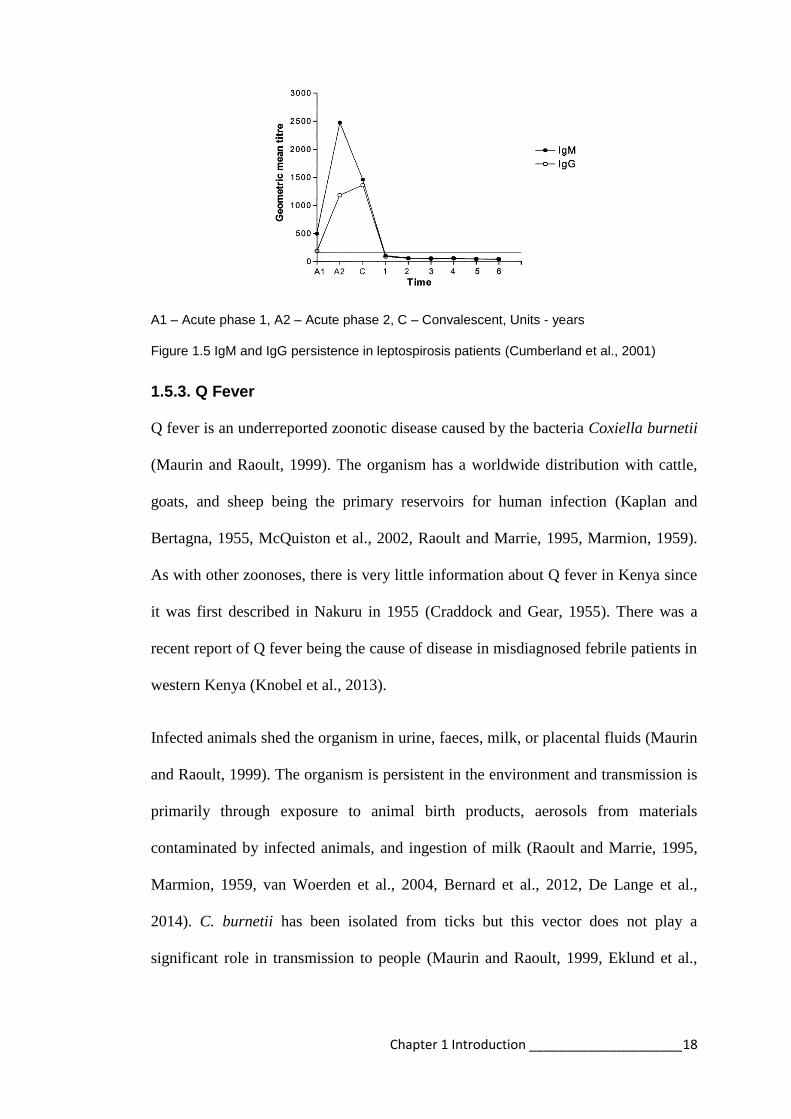
The rural value chain that is predominant in western Kenya is highlighted in red.
Figure 1.7 Flow chart of the meat value chain in Kenya (Adapted from (Farmer, 2012)

Chapter 1 Introduction _____________________ 27
The meat industry is regulated by the Department of Veterinary Services under the
Ministry of Livestock and Fisheries (Government of Kenya, 2012). The original
Meat Control Act of 1972, last revised in 1977, governed slaughter until 2012. A
new revised Meat Control Act was introduced in 2012 to standardise the meat
industry across the country (Government of Kenya, 2012).
The revised act provides information to reduce the risk of foodborne disease and
protect the consumer. The revised guidelines cover components of the slaughter
process such as building structure and layout, equipment, personal hygiene, carcass
handling, waste management, and meat inspection. Slaughterhouses are categorised
into three categories depending on the size of the slaughterhouse and whether the
meat is for local consumption or export out of the community (Table 1.3).
Slaughterhouses are further subdivided into ruminant or pig slaughterhouses, out of
respect for the Muslim community. Changes are now being implemented across the
country to varying degrees. Introduction of the new regulations is slow in rural areas
because of previously inadequate regulation. Abrupt enforcement may result in an
increase in the informal market as local meat handlers are unwilling to meet the costs
of the improved facilities, as has been reported in other countries (FAO, 2010, Mann,
1984).
The majority of slaughterhouses in rural areas are classified under the new Meat
Control Act as Category C (Table 1.3) or more commonly referred to as
slaughterslabs. As in other developing countries these facilities are privately owned
and rented to butchers who employ their own team of slaughter workers (FAO, 2010,
Clottey, 1985). There is a lack of refrigerated transport so meat is sold “hot” or

Chapter 1 Introduction _____________________ 28
unrefrigerated in local markets, or is eaten at point of sale as roasted, boiled or fried
meat (Figure 1.8) (Farmer, 2012). It is estimated from a study in Nairobi that
consumption of meat at the point of sale accounts for 60% of the market (Farmer,
2012). This percentile is supported by data collected during the PAZ study
suggesting 65% of people eat meat prepared outside the home (Thomas, 2013).
There is a smaller informal market for meat that continues outside the regulatory
system that includes “backyard” slaughter (Farmer, 2012). Informal slaughter
facilities are not regulated and may contribute to illegal livestock trading and the
slaughter of diseased animals (Clottey, 1985).
There are no published reports of the standards in slaughterhouses in western Kenya
but a study investigating risk for meat contamination reported that smaller
slaughterhouses have poor hygiene practices, unskilled labour, lack of infrastructure,
and lack of water (Kariuki, 2013). Figure 1.9 demonstrates the types of
slaughterhouses represented in western Kenya.

Chapter 1 Introduction _____________________ 29
Figure 1.8 Butchery in western Kenya (A) Metal container for transporting meat (B)
A
B

Chapter 1 Introduction _____________________ 30
CATEGORY A CATEGORY B CATEGORY C
Animal number >40 bovines >20 sheep/goats >8 small pigs
6–39 bovines 16–24 sheep/goats 1–7 small pigs
<5 bovines <15 sheep/goats <6 units small pigs
Export meat Export all Kenya Export up to 50km Supply town centre
Location Any Not within a city Not within a city
Land size 2.5 hectares 1.5 hectares 0.5 hectares
Structure Perimeter fence Floor – water proof concrete Walls and ceiling – Portland cement plaster
Lighting Natural and artificial Natural or artificial Natural light
Animal holding Lairage for 2 days Lairage for 1.5 days Lairage for the day
Main slaughter hall Slaughter area Bleeding area Dressing area Area for dehairing pigs
Slaughter area Separate areas to bleed, dress, eviscerate and split Area for dehairing pigs
Slaughter area Areas for bleeding, dressing, hanging, and meat inspection Area for dehairing pigs
Additional rooms Office Store Meat inspection Offal cleaning Skins/hides Condemned meat
Office Store Meat inspection Offal cleaning Skins/hides
Office Store Area next to the slab for cleaning offal with water and fly screens
Equipment Knives, Hooks, Spreaders
Equipment (more specific)
Overhead rail/Hoist Hide puller Freezers -10°C Chiller
Overhead rail/Hoist Hide puller Freezer -10°C Chiller
Chains for hanging Axes
Sanitation Boots, aprons, wash basins, refuse container, Hot water >82°C Toilet with hand washing facilities 200 Litres potable water per animal
Pest control Rodent control and insect electrocuters
Pest control at entrances
Windows with fly screen
Laboratory Food safety analysis Food safety analysis
Disposal of waste Incinerator or pit Manure shed Blood tank
Incinerator or pit Manure shed Blood tank
Pit Manure shed Blood tank
Manager Diploma in Food Hygiene or similar
Basic training in food hygiene
Certificate in Food Hygiene
Meat inspector Diploma in Meat Grading or similar
Diploma in Meat Grading or similar
Trained as Meat Inspector
Training 3 food safety training sessions a year
2 food training sessions a year
2 food training sessions a year
Table 1.3: Classification of slaughterhouses in Kenya (Government of Kenya, 2012)

Chapter 1 Introduction _____________________ 31
Figure 1.9 Photographs of the types of slaughterhouses in western Kenya
Informal
Category C
Category B

Chapter 2 Study design ____________________
32
Chapter 2
Study design

Chapter 2 Study design ____________________
33
2.1 Study site
The study was conducted in western Kenya in the Lake Victoria Basin region of
Kenya on the border with Uganda. The study area was a 45 kilometre radius from the
project laboratory in Busia (Figure 2.1). This area covered portions of four counties –
Busia, Bungoma, Siaya, and Kakamega.
+ Red crosses indicate the main cattle markets
Figure 2.1 Map of study area in western Kenya
The region is predominantly rural with a population of 1.4 million (estimated from
the Kenyan Human Population Census of 2009). It is densely populated with a
population density of approximately 500 people per square kilometre (Figure 2.2)
(estimated from the Kenyan Human Population Census of 2009). The predominant
ethnic groups are Luhya, Luo, and Teso. It is estimated more than 40% of
homesteads are below the poverty line (Thornton, 2002).
B A
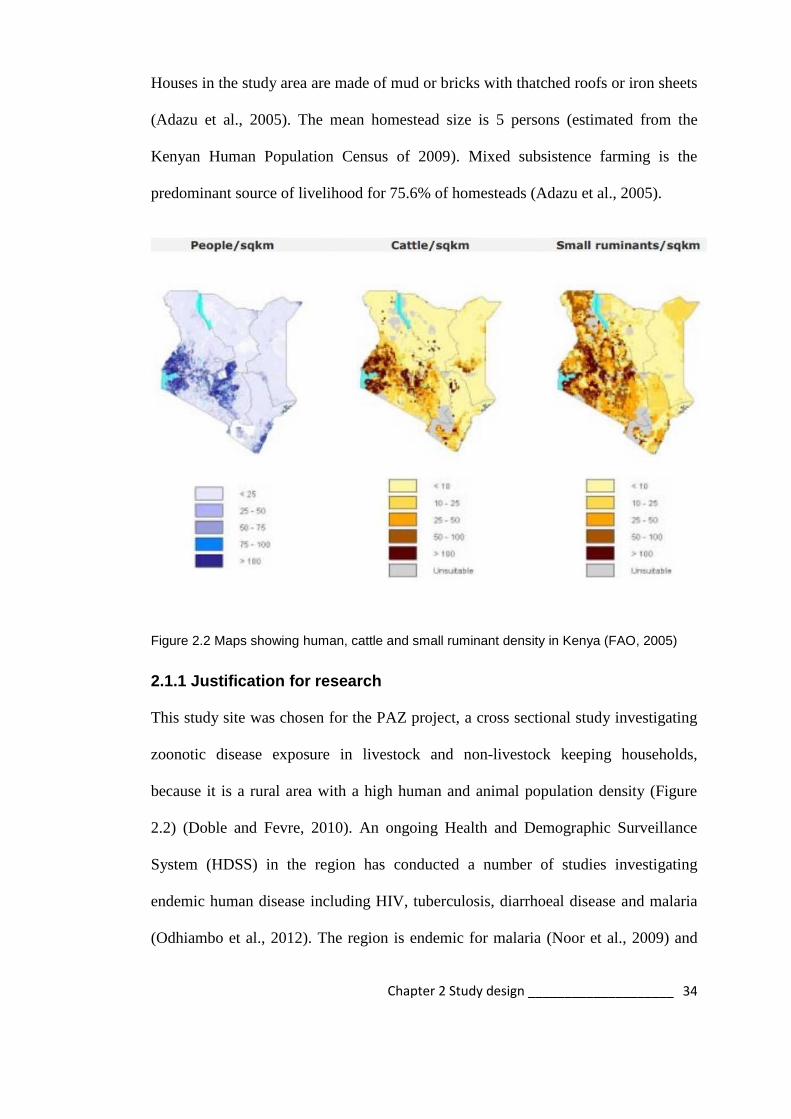
Chapter 2 Study design ____________________
34
Houses in the study area are made of mud or bricks with thatched roofs or iron sheets
(Adazu et al., 2005). The mean homestead size is 5 persons (estimated from the
Kenyan Human Population Census of 2009). Mixed subsistence farming is the
predominant source of livelihood for 75.6% of homesteads (Adazu et al., 2005).
Figure 2.2 Maps showing human, cattle and small ruminant density in Kenya (FAO, 2005)
2.1.1 Justification for research
This study site was chosen for the PAZ project, a cross sectional study investigating
zoonotic disease exposure in livestock and non-livestock keeping households,
because it is a rural area with a high human and animal population density (Figure
2.2) (Doble and Fevre, 2010). An ongoing Health and Demographic Surveillance
System (HDSS) in the region has conducted a number of studies investigating
endemic human disease including HIV, tuberculosis, diarrhoeal disease and malaria
(Odhiambo et al., 2012). The region is endemic for malaria (Noor et al., 2009) and
Chapter 2 Study design ____________________
35
has a high prevalence of HIV 6.6–13.9% (KNBS, 2010). It was hypothesised that the
high prevalence of malaria and HIV in the region might result in an increased risk of
coinfection with zoonotic diseases (Doble and Fevre, 2010). Zoonotic diseases have
not previously been investigated in the region, and might have an important role in
human and animal health in the region. As previously stated, the slaughterhouse
worker project developed from a request by slaughterhouse workers to understand
the risks of zoonotic disease exposure in this high risk population.
Six zoonotic diseases were selected for inclusion in the study. Brucellosis,
leptospirosis, Q fever and RVF were chosen as there is a demonstrated risk to
slaughterhouse workers of exposure to these diseases as discussed in Section 1.5.
Cysticercosis and taeniasis were also screened as these zoonoses are endemic in the
area, are considered neglected zoonoses, and as previously stated the author
hypothesised there might be an increased risk to slaughterhouse workers in the
region through the increased consumption of infected meat products.
2.2 Ethical approval
Ethical approvals for the slaughterhouse workers and the PAZ studies were granted
by the Kenya Medical Research Institute Ethical Review Committee (SCC Protocols
2086 and 1701 respectively). Ethical approval for animal sampling was granted by
the Animal Welfare and Ethical Review Body (AWERB) at The Roslin Institute,
University of Edinburgh (approval number AWA004). Informed consent was
obtained from all participants. Participants were requested to sign or thumb print a
consent form (Appendix 1). A copy was retained for the project records and a second
given to the participant with contact details for the project staff if there were any

Chapter 2 Study design ____________________
36
concerns. All participants were assigned a unique identifier and all samples bar-
coded for anonymity.
2.3 The sampling and laboratory teams
The field work required a team of six enumerators including the author. These
included 3 clinical officers, a community health worker, and an animal health
technician. The Busia laboratory team consisted of 5 technicians – haematologist,
parasitologist, and two microbiologists assisting the author. The ILRI Nairobi
laboratory team consisted of two technicians assisting the author with the serological
tests.
2.4 Study population and recruitment
The study population was every slaughterhouse worker in the study area. A census of
slaughterhouses was performed between May 2011 and January 2012. This
information was collected by visiting butchers in every village market in the study
area and enquiring where slaughtering was performed. The slaughterhouse was
visited and recruited into the study. Initially all of the 180 slaughterhouses in the
study area were recruited to participate in the study. Sampling was conducted
between February and October 2012.
2.5 Sampling
2.5.1 Sampling procedure
All slaughterhouses in the study area were visited 3–6 days before sampling for
sensitisation and to explain the project objectives. All slaughterhouses were assigned
a unique identification number and mapped using the Global Positioning System
(GPS) (Dwolatzky et al., 2006).
Chapter 2 Study design ____________________
37
On the day of sampling, informed consent was obtained from all participants
individually (Appendix 1). Inclusion criteria specified all workers, aged over 18 and
present at the slaughterhouse on the day of sampling. Due to the time required to
process the samples on the day of collection the number of workers recruited from
each slaughterhouse was limited to 12 workers. In slaughterhouses with less than 12
workers all willing participants were recruited. In slaughterhouses with greater than
12 workers a random selection of 12 willing participants from the workers present on
the day were sampled. Random selection was conducted by assigning each worker a
number. All numbers were written on a piece of paper and placed in a container. A
piece of paper was drawn from the container. The worker with the number on the
piece of paper was recruited. This was repeated until 12 workers had been selected.
Exclusion criteria included third trimester pregnancy, severe anaemia, under the age
of eighteen, inebriation, aggression, and extreme old age. A clinical officer from the
project team, responsible for all medical examinations, could exclude participants for
any underlying health condition where participation might affect them adversely.
All participants were offered treatment for any diagnosed parasite infections,
including malaria and faecal parasites. These conditions were reported confidentially
to participants who were then treated for these conditions free of charge by the PAZ
project.
2.5.2 Data collection
Four data collection tools were used to collect data regarding slaughterhouses and
workers.

Chapter 2 Study design ____________________
38
A 114-item individual questionnaire was administered to each participant by
one of seven trained interviewers (Appendix 2). Interviews were conducted in
Kiswahili, Luo, Luhya and English depending on the language in which the
participant was most comfortable. Data were collected on personal history
(age, gender, marital status, education, etc.), dietary habits, knowledge of
zoonoses, risk behaviours, exposure to livestock, and personal hygiene
practices at the slaughterhouse. The questionnaire was developed to include
risk factors that had previously been reported in the literature as described in
Section 1.4.6. Images of zoonotic diseases (bovine tuberculosis, brucellosis,
echinococcosis, and cysticercosis in animals and anthrax in people) were used
to determine zoonotic disease recognition in workers (Appendix 7).
An assessment of health status for all participants was made using standard
indicators including height, weight, mid-upper-arm circumference (MUAC),
self-reported disease episodes, measurement of anaemia, and a physical
examination. These health indicators were recorded as part of the worker
questionnaire.
A second 72-item questionnaire was administered to the foremen of the
slaughterhouses regarding slaughterhouse structure, equipment, and practices
(Appendix 3).
The interviewer recorded observations regarding practices where slaughtering
was observed at the time of interview.

Chapter 2 Study design ____________________
39
Questionnaires were pretested in 3 slaughterhouses bordering the study area through
January 2012. Questionnaire data were recorded in a Palm operating system (Palm
OS) personal digital assistant (PDA) using Pendragon Forms 5.1 (Pendragon
Software Corporation, Libertyville, IL, USA). Microsoft® Access databases were
used to manage data.
2.5.3 Mapping
Slaughterhouses were georeferenced using a handheld GPS device (Garmin eTrex®).
The locations of slaughterhouses were mapped using ArcGISTM
version 9.1 and
version 10.2.2 (ESRI, Redlands, CA, USA). Maps were provided by the ILRI
geographical information systems unit (http://www.ilri.org/gis/). Mapping allowed
analysis of the spatial distribution of the slaughterhouses where workers were
seropositive for the specified zoonotic diseases.
2.5.4 Biological sample collection
Samples were collected from every slaughterhouse worker that gave informed
consent. 14mls of blood was collected by a clinical officer from each participant
(10ml plain BD Vaccutainer® and 4ml Ethylenediaminetetraacetic acid (EDTA) BD
Vaccutainer®) using a 21G or 23G BD Vaccutainer® SafetylokTM
blood collection
set. Thick and thin blood smears were prepared from fresh blood by the clinical
officers in the field. These were used to screen for malaria and trypanosomiasis. At
recruitment participants were given a 30ml container and requested to collect a faecal
sample on the morning of the specified sampling day.

Chapter 2 Study design ____________________
40
2.6 Sample analysis
2.6.1 Parasitological analysis (Busia laboratory)
Samples were transferred to the project laboratory in a cool box within 3 hours of
collection. Serum samples were centrifuged at 3000 rpm for 20 minutes and
aliquoted in duplicate in Nalgene® 2ml cryovials and stored at -40°C. The EDTA
sample was used to determine packed cell volume (PCV) and total protein
concentration and then stored at -40°C. 2–3 grams faecal samples were stored in 3–
4mls of 5% formol saline with 0.3% Tween 20 at room temperature (24°C). PCV and
total protein were measured to determine anaemia.
The parasitological analyses of the samples were performed at the Busia laboratory
before the samples were transferred to ILRI, Nairobi. A microhaematocrit tube of
EDTA blood was used to measure PCV and light microscopy was used to examine
the buffy coat for trypanosomes. The plasma from the microhaematocrit was used to
measure total protein using a refractometer. Thick and thin smears were stained with
Giemsa stain and examined for haemoparasites – Plasmodium and Trypanosoma sp.
The techniques for these procedures are described in the District Laboratory Practice
in Tropical Countries (Cheesbrough, 2006). Faecal samples were examined for
evidence of intestinal parasitism using the formol ether concentration method
described in Bench Aids for the Diagnosis of Intestinal Parasites (Ash, 1994). Serum
and EDTA samples were periodically transferred on dry ice to ILRI, Nairobi and
stored at -80°C.
Figure 2.3 is a flow chart of the processes performed at the Busia laboratory. The
highlighted processes are those relevant to this thesis. During the course of the PhD

Chapter 2 Study design ____________________
41
the author was awarded a Medical Research Council (MRC) Centenary grant to
investigate the epidemiology of enteric bacteria in slaughterhouse workers. Although
the samples were collected concurrently with this zoonoses study the material does
not contribute to this PhD thesis and will be reported elsewhere.
Figure 2.3 Flow chart of the laboratory processes in the Busia laboratory
Chapter 2 Study design ____________________
42
2.7 Laboratory procedures (ILRI)
Sera were screened for antibodies to Brucella sp., Leptospira sp, C. burnetii and Rift
Valley fever. A coproantigen ELISA was performed on collected faecal samples for
evidence of Taenia sp. An antigen ELISA was used to screen sera for cysticercosis.
The tests are described in detail. The sensitivity and specificity reported for the tests
used in this study are documented in Table 2.1 at the end of this chapter.
2.7.1 Brucellosis
The RBT was used to screen sera for brucellosis. The RBT is an agglutination test
for IgM and IgG antibodies to B. abortus and B. melitensis. The test reagents were
provided by Ignacio Moriyón, University of Navarra, Spain. The technique has been
described by Diaz et al. (Diaz et al., 2011). Briefly, the agglutination test was
performed on a glossy white ceramic tile. After bringing the serum and antigen to
room temperature 25µL of serum was placed on the tile with a clean pipette. The
antigen suspension was homogenised by shaking and 25µL placed beside the serum
drop. A fresh toothpick was used to mix the serum and antigen. The tile was then
rocked gently for 4 minutes using a timer. Any agglutination was considered a
positive result.
2.7.2 Leptospirosis
The Panbio Leptospira IgM ELISA (Alere, Sinnamon Park, Australia) was used to
screen the sera for antibodies to Leptospira (Winslow et al., 1997). The ELISA is a
qualitative test for antibodies to a broad range of Leptospira interrogans serovars
including: hardjo, pomona, copenhageni, australis, madanesis, kremastos, nokolaevo,
celledoni, canicola, grippotyphosa, szwajizak, djasiman, and tarassovi4 (Winslow et

Chapter 2 Study design ____________________
43
al., 1997). An IgM ELISA was chosen because the specificity and sensitivity of IgM
ELISAs for leptospirosis is better than IgG. IgM antibodies persist for up to 6 years
where the longevity of IgG antibodies is variable, making it inappropriate for
diagnosis (Signorini et al., 2013, Budihal and Perwez, 2014, Cumberland et al., 2001,
Adler et al., 1980).
The ELISA was conducted as per the manufacturer’s instructions. Sera were diluted
1:100 in the kit diluent and 100µL of diluted sample, controls, and calibrator (in
triplicate) were pipetted into microwells precoated with Leptospira antigen. The
plates were covered and incubated at 37°C for 30 minutes and then washed with
buffer 6 times. 100µL of conjugate was added to each well and plates were covered
and incubated at 37°C for 30 minutes and washed with buffer 6 times. Finally 100µL
of substrate was added to each well and plates were incubated at room temperature
for 10 minutes. 100µL of stop solution was added to all wells and the plates read at
450nm with a reference filter of 630nm.
The cut–off value is the mean of the triplicate calibrators multiplied by the
calibration factor, which is batch specific. The calibrators are calibration agents
supplied by the manufacturer.
An index value is calculated by dividing the sample absorbance by the cut-off value.
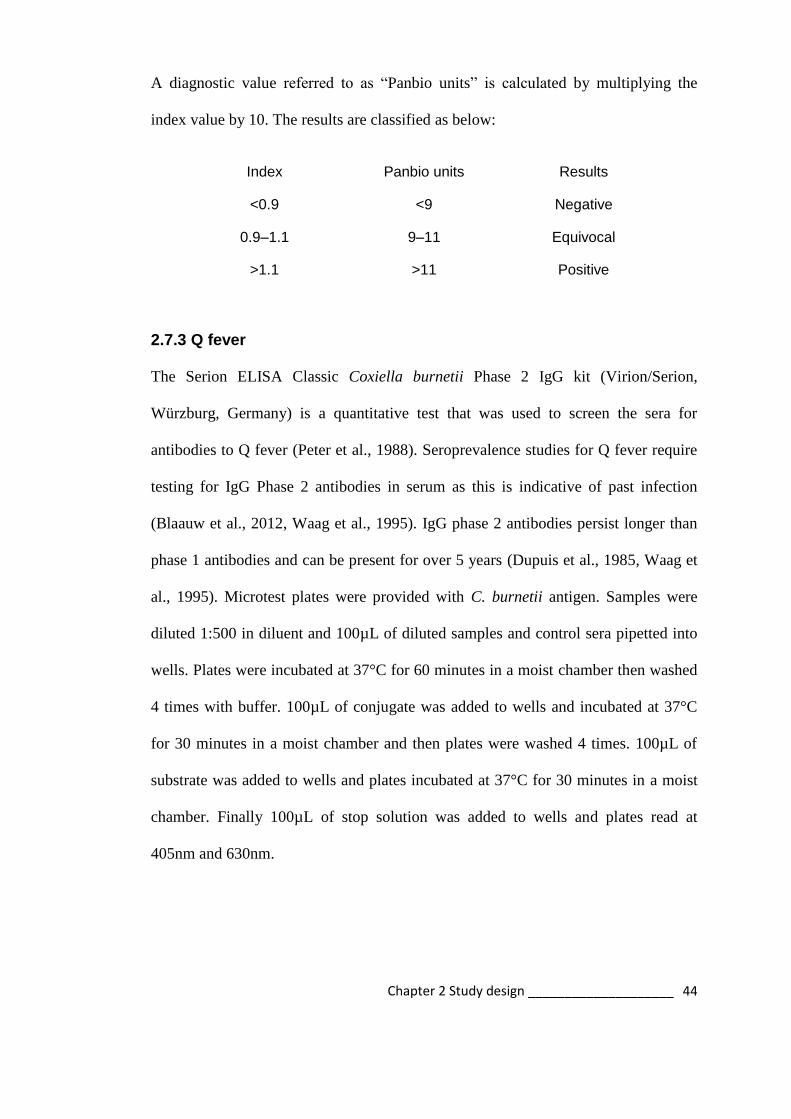
Chapter 2 Study design ____________________
44
A diagnostic value referred to as “Panbio units” is calculated by multiplying the
index value by 10. The results are classified as below:
Index Panbio units Results
<0.9 <9 Negative
0.9–1.1 9–11 Equivocal
>1.1 >11 Positive
2.7.3 Q fever
The Serion ELISA Classic Coxiella burnetii Phase 2 IgG kit (Virion/Serion,
Würzburg, Germany) is a quantitative test that was used to screen the sera for
antibodies to Q fever (Peter et al., 1988). Seroprevalence studies for Q fever require
testing for IgG Phase 2 antibodies in serum as this is indicative of past infection
(Blaauw et al., 2012, Waag et al., 1995). IgG phase 2 antibodies persist longer than
phase 1 antibodies and can be present for over 5 years (Dupuis et al., 1985, Waag et
al., 1995). Microtest plates were provided with C. burnetii antigen. Samples were
diluted 1:500 in diluent and 100µL of diluted samples and control sera pipetted into
wells. Plates were incubated at 37°C for 60 minutes in a moist chamber then washed
4 times with buffer. 100µL of conjugate was added to wells and incubated at 37°C
for 30 minutes in a moist chamber and then plates were washed 4 times. 100µL of
substrate was added to wells and plates incubated at 37°C for 30 minutes in a moist
chamber. Finally 100µL of stop solution was added to wells and plates read at
405nm and 630nm.
Chapter 2 Study design ____________________
45
A correction factor, which was calculated by dividing the reference optical density
(OD) of the standard serum with the current OD of the standard serum, was used to
account for interassay variability.
All measured values of samples were multiplied by the correction factor. The
corrected ODs could then be compared to the batch specific cut-off provided by the
manufacturer. Corrected OD values below 0.38 were considered negative, OD values
over 0.541 were considered positive and those in between these values were
borderline.
It is recommended that borderline cases be tested with a repeated serum sample. As
this was not possible for the purposes of this study, borderline cases were classified
as negative as recommended by the manufacturer.
2.7.4 RVF
The BDSL cELISA is an inhibition ELISA used to detect RVF antibodies (BDSL,
Dreghorn, Scotland) (Paweska et al., 2005). Plates were coated with 100µL capture
antibody and incubated overnight at 4°C then washed 3 times. 200µL of blocking
buffer was added to each well and incubated at 37°C in a moist chamber for 60
minutes. Test and control sera were diluted in duplicate 1:10 with virus and control
antigen and then 100µL of test and control sera with virus antigen were added to
rows A-D 1-12 and 100µL of test and control sera with control antigen were added to
rows E-F 1-12 and incubated at 37°C in a moist chamber for 60 minutes then plates
were washed 3 times. 100µL of detection antibody was added to wells and incubated

Chapter 2 Study design ____________________
46
in a moist chamber at 37°C for an hour and plates were washed 3 times. 100µL of
conjugate was added to wells and incubated in moist chamber at 37°C for an hour
and plates were washed 6 times. 100µL of substrate was added to wells and
incubated in the dark at room temperature for 30 minutes. 100µL of stop solution
was added to wells and plates read at 405nm. The net OD for each serum is
calculated by subtracting the OD reading of the control antigen from the OD of the
virus antigen. The result is converted to a percentage inhibition (PI) using the
equation
The cut-off is determined by the manufacturer to be 38.6PI.
2.7.5 Taeniasis
A coproantigen ELISA was used to detect tapeworm antigens in human faeces (Allan
et al., 1996). This diagnostic test does not differentiate between carriage if T. solium
or T. saginata. The reagents were supplied by the Dorny Laboratory at the Institute
of Tropical Medicine, Antwerp, Belgium. Faecal samples preserved in formol ether
as described previously were mixed equal volumes with phosphate buffered saline
(PBS) (approx 2ml of each). This mixture was left to sit for 1 hour with intermittent
shaking. Samples were centrifuged for 30 minutes at 2000 rpm. The supernatant was
then aliquoted into a 2ml Eppendorf tube. A Nunc Maxisorp (VWR) plate was
coated with 2.5 µg/ml polyclonal IgG in 0.05M carbonate/bicarbonate coating buffer
(Sigma, Gillingham, UK). 100µl was pipetted into each well and the plate incubated
at 37°C for one hour whilst shaking. Plates were washed once with PBS/0.05% (v/v)

Chapter 2 Study design ____________________
47
Tween 20. Plates were blocked with 150µl of PBS/0.05% (v/v) Tween/ 2% (v/v) new
born calf serum (Invitrogen, Life Technologies, Ltd, Paisley, UK) at 37°C for one
hour whilst shaking then emptied. 100 µl of sample, negative and positive controls
were added to wells and incubated shaken for one hour at 37°C . Plates were washed
five times. Biotinylated polyclonal 2.5µg/ml with blocking buffer (100µl) was added
to wells and plates incubated shaken for one hour at 37°C. Plates were washed five
times. Streptavidin (Jackson Immunoresearch, West Grove, PA, USA) 1:10,000 in
blocking buffer was added to wells (100µl) and incubated for one hour at 37°C
whilst shaking. Substrate was prepared from Ortho-Phenylenediamine (DAKO, Ely,
UK) and 0.04% (v/v) 30% hydrogen peroxide and added 100µl added to wells and
incubated for 15 minutes at 30°C in the dark without shaking. Plates were stopped
with 0.5M sulphuric acid solution (50µl) and read at 492 and 655nm.
A cut-off value was determined using 64 negative samples from people sampled as
part of the PAZ project, who lived in the study area and never ate pork, with no
history of tapeworm and negative for Taenia spp. on three microscopic tests). The
cut-off of 0.874 was the mean + 3 standard deviations as described by Allan et al.
(Allan et al., 1996). The mean OD from each duplicate sample was calculated and
the ELISA result determined by applying the above cut-off value to the mean ODs.
2.7.6 Cysticercosis
An antigen ELISA was used to detect T. solium cysticercosis in people (Harrison et
al., 1989). The HP10 ELISA was supplied by Leslie Harrison at the University of
Edinburgh. ELISA plates (Immulon 1, Thermo Life Sciences, Horsham, UK) were
coated with 100l of 0.05M carbonate/biocarbonate coating buffer (Sigma) with

Chapter 2 Study design ____________________
48
McAb-HP10 (10g/ml), covered and incubated overnight at 4C, then washed twice
with 0.9%(w/v) NaCl-0.05%(w/v) Tween 20. The plate was blocked using 200l of
PBS/1%(w/v) Bovine serum albumin/0.05%(w/v) Tween 20 added to each well and
left for 1 hour at room temperature. Plates were washed 3 times. 100l serum was
added to the wells and plates incubated for one hour at 37C. Plates were washed 3
times. Biotinylated-McAB (1g/ml) in PBS/Bovine serum albumin/Tween was
added to the plate at 100l/well and incubated for 1 hour at 37C. The plates were
washed 3 times. Streptavidin peroxidise conjugate (Sigma) 1:10,000 in PBS/Bovine
serum albumin/Tween was added 100l per well and incubated for 1 hour at 37C
and the plates washed 3 times. 100l of 3,3′,5,5′-Tetramethylbenzidine (TMB)
(Sigma) substrate was added and the plate incubated at room temperature for 15–30
minutes. Sulphuric acid solution 0.2M was used to stop the plates and plates were
read at 450nm.
A correction factor was used to correct for interplate variations. The correction factor
was applied to plates that used the same positive and negative control sera over the
screening period. The correction factor was calculated from the first plate run in a
series that used the same negative and positive control. The mean OD from the
positive and negative controls from the first plate were used to create the correction
factor using the equation below and applied to all subsequent plates.
Where: P0 = Mean of the positive control sera from plate 1
N0 = Mean of the negative control sera from plate 1 Pt = Mean of the positive control sera from plate on test Nt = Mean of the negative control sera from plate on test

Chapter 2 Study design ____________________
49
2.7.7 Human Immunodeficiency Virus (HIV)
Samples were tested for HIV using the SD Bioline HIV-1/2 Fast 3.0 test strips
(Standard Diagnostics Inc, Korea) (Vijayakumar et al., 2005).

Chapter 2 Study design ____________________
50
Table 2.1 Sensitivity and specificity reported for the diagnostic tests in this study. The sensitivity and specificity used for this thesis are highlighted.
Disease Name of test Country Number tested Sensitivity Specificity Reference
Brucella Rose Bengal Test Spain 208 (positive)
1559 (negative)
87.4 100 Diaz et al., 2011
Leptospirosis Panbio Leptospira
IgM ELISA
USA 252 96.5 (87.9–99.6) 98.5 (95.6–99.7) Panbio, 2008
Thailand 218 90.8 55.1 Desakorn et al., 2012
Laos 372 60.9 65.6 Blacksell et al., 2006
Australia 41 100 93 Winslow et al., 1997
Hawaii 379 35 (25–46) 98 (96–99) Effler et al., 2002
UK 200 90 94 Zochowski et al., 2001
Q fever Serion ELISA
classic Coxiella
burnetii Phase 2
IgG
Germany 511 93.4 98.5 Serion, 2012
Canada 152 80 >99 Waag et al., 1995
Switzerland 213 94.8 100 Peter et al., 1988
RVF BDSL Rift Valley
Fever Inhibition
ELISA
Kenya, Tanzania,
South Africa,
Uganda
1367 99.47 99.66 Paweska et al., 2005
Taenia Coproantigen
ELISA
Zambia 817 84.5(61.0–98.0) 92.0(90.0–93.8) Praet et al., 2013
Guatemala 1582 98 99.2 Allan et al., 1996
Cysticercosis HP10 Antigen
ELISA
Mexico 116 84.8 94 Fleury et al., 2007

Chapter 3 Cross Sectional Survey_______________________51
CHAPTER 3
Cross–sectional survey of
slaughterhouses and slaughterhouse
workers in western Kenya: comparison
between ruminant and pig
slaughterhouses

Chapter 3 Cross Sectional Survey_______________________52
3.1 Introduction
Slaughterhouses are places where animals are slaughtered for food (Stevenson,
2013). Internationally there are recognised guidelines for minimum standards in
slaughterhouses regarding structure, sanitation, and hygiene practices (FAO, 2010,
Codex Alimentarius Commission, 2005). These regulations are to ensure a safe
product for consumers and reduce the risk of disease transmission from animals to
people (Mann, 1984).
In Kenya a new Meat Control Act was enacted in 2012 (Government of Kenya,
2012). The Act aims to standardise the meat industry and provides guidelines on the
required infrastructure and facilities for slaughterhouses in Kenya. Changes to
slaughterhouses across the country began in 2012.
This study was conducted before the implementation of the new Meat Control Act
and aimed to qualify and quantify the standards in slaughterhouses in rural western
Kenya and to make recommendations for areas of necessary and immediate action.
The hypotheses of the study are that:
1. slaughterhouses in western Kenya have inadequate infrastructure and poor
sanitation
2. slaughterhouse workers in western Kenya have poor hygiene practices
3. slaughterhouse workers are aware of zoonotic diseases

Chapter 3 Cross Sectional Survey_______________________53
3.2 Methods
3.2.1 Study area
The study was conducted in rural western Kenya in the Lake Victoria Basin region
bordering Uganda (Figure 2.1). The study area and population is described in detail
in Section 2.1. The study was conducted between May 2011 and October 2012. The
recruitment and sampling of slaughterhouse workers is described in detail in Sections
2.4 and 2.5.
3.2.2 Data collection
This project investigated the current practices in slaughterhouses in western Kenya
using four tools: 1) a questionnaire related to the facilities and practices within the
slaughterhouses as a unit (Appendix 3); 2) observations regarding the slaughterhouse
facilities; 3) an individual questionnaire regarding knowledge, attitudes, hygiene
practices, and health of the worker (Appendix 2); and 4) a clinical health assessment
of the worker.
3.2.3 Data management
Variables were recoded in R software version 3.0.2 (R Core Team, 2013). Variables
that were recoded for the purposes of analysis:
Age was coded into 10 year age groups 18-27, 28-37, 38-47, 48+
Age was also coded as a binary variable less or equal to the median age of 39
years.

Chapter 3 Cross Sectional Survey_______________________54
Variables relating to frequency of an event such as wearing protective
clothing were recoded as binary variables to Always/Sometimes versus
Rarely/Never.
3.2.4 Data analysis
Descriptive statistics were performed in R software. The Survey package (Lumley,
2012) in R was used to adjust for clustering. Weights for the slaughterhouse level
data were calculated by dividing the number of each type of slaughterhouse by the
number sampled. Weights for the slaughterhouse worker data were calculated by
dividing the number of slaughterhouse workers expected in the slaughterhouse by the
number sampled. Weights and a finite population correction factor (fpc) were used to
calculate a design effect using the svydesign function in Survey using the following
equation. The design effect was used to calculate adjusted proportions for survey
responses.
Variables were analysed for independence using the svychisq command in Survey
which calculated a Pearson’s Chi squared statistic adjusted by the design effect. A
level of 5% statistical significance (Type 1 error) was used. Graphs were made in
Microsoft® Excel 2007 using the design adjusted survey results. Maps were made
using ArcGISTM
version 9.1 and version 10.2.2 (ESRI, Redlands, CA, USA).
Multiple correspondence analysis (MCA) was used to assess the relationship
between slaughterhouses and selected variables. This method of variable reduction

Chapter 3 Cross Sectional Survey_______________________55
was used because the data consists of categorical variables (Husson, 2010). The
outputs were used to make a two dimensional map which was interpreted as a
graphical representation of the relationship between variables and slaughterhouses
(Hoffman, 1992). The methodology is described in detail below. Simply a variable is
plotted as the central point between all slaughterhouses that have that characteristic.
Slaughterhouses are plotted close to characteristics they share and far from
characteristics they do not. This graphical representation can be interpreted that the
slaughterhouses close to each other are similar to each other. This information can be
used to create categories of slaughterhouses that are similar with regard to these
variables.
Variables that were included in the MCA are those that best approximate the
standard requirements described in Section 1.4 and Table 1.3. Variables included
were those that represented:
structure (roof, sides, floor) – coded present/absent
sanitation (latrine, hand washing place) – coded present/absent
hygiene (workers wearing coveralls/boots) – coded always/sometimes/never
worn
meat inspection (antemortem inspection) – coded always/sometimes/never
performed
size of slaughterhouse (number of people) – coded ≤3, ≤10, >10
number of animals slaughtered coded ≤5, ≤10, >10
type of slaughterhouse (type of animals slaughtered) – coded Cattle, sheep
and goats/Cattle only/Pig only

Chapter 3 Cross Sectional Survey_______________________56
The MCA was developed in the FactomineR package (Husson, 2014). The
methodology behind this is well described by Greenacre et al. (Greenacre and
Blasius, 2006).
In order to perform the MCA a matrix is constructed for the slaughterhouses and the
selected variables with each row representing slaughterhouses and each column a
variable. A profile is created for each slaughterhouse defined by variable responses
and a profile for each variable defined by the slaughterhouse responses. The mean of
all profiles is the centroid (centre of gravity). The distance between the centroid and
a profile point is the chi-squared distance, which is calculated from the observed and
expected values of each profile. The average of all the chi-squared distances is
defined as inertia. The points are in multiple dimensions, and this is simplified by
selecting the principal dimensions. For the purposes of this study the first 2
dimensions were examined graphically, which explain the maximum amount of
inertia possible in 2 dimensions. The eigenvalue is the square root of the inertia, and
is used to describe the total variability explained by the dimension.
A dendrogram was created from the MCA output in cluster (Maechler, 2013) to
group slaughterhouses with similar characteristics based on the coordinates
calculated by the MCA (de Souza et al., 2014). This was to determine if
classification or ranking of the slaughterhouses was possible for use in future
analysis.

Chapter 3 Cross Sectional Survey_______________________57
3.3 Results
There were 180 slaughterhouses in the study area when the study began in May
2011. 24 slaughterhouses were closed by the District Veterinary Officer between
May 2011 and January 2012 for non-compliance with regulations. From the
remaining 156 slaughterhouses, 142 slaughterhouses (91%) agreed to participate in
the study. Fourteen (9%) slaughterhouses refused to participate. This included 4/57
(7%) cattle and 10/68 (15%) pig slaughterhouses. Although no specific reason was
given for refusal, the study team surmised that fear of recriminations from the
Department of Veterinary Services was the reason for refusal. Appendix 4 indicates
the facilities at the slaughterhouses that declined and also the 24 slaughterhouses that
closed during 2011.
Figure 3.1 shows the distribution of slaughterhouses in the study area. There was one
cattle and one pig slaughterhouse that used the same facility but for the purposes of
analysis, they were considered separate slaughterhouses as the workers were
different. The slaughterhouses were evenly distributed throughout the study area.
The slaughterhouses that refused to participate were clustered in the south of the
study area.

Chapter 3 Cross Sectional Survey_______________________58
Figure 3.1 Map of slaughterhouses showing location, type and number of workers

Chapter 3 Cross Sectional Survey_______________________59
Of the 142 slaughterhouses recruited in the study, 31 were mixed ruminant (cattle,
goats, sheep), 53 were cattle only and 58 were pig only (Figure 3.2). The total
employment at these slaughterhouses was 1005 workers. Workers were interviewed
at all 142 slaughterhouses. Questionnaires were administered to 738 workers.
Slaughtering was observed at 84 slaughterhouses whilst interviews were being
conducted.
Population
Recruited
Workers
sampled
Observed
at work
156 Slaughterhouses
1039 workers
57 Cattle SH373 workers
31 Mixed SH 429 workers
68 Pig SH 237 workers
4 Declined 12 workers
10 Declined22 workers
53 Cattle361 workers
31 Mixed429 workers
58 Pig 215 workers
53 Cattle292 workers
31 Mixed274 workers
58 Pig172 workers
31 cattle204 workers
28 Mixed259 workers
25 Pig102 workers
Declined
142Slaughterhouses
1005 workers
142Slaughterhouses
738 workers
84 Slaughterhouses
565 workers
Totals
Figure 3.2 Number of slaughterhouses and workers in western Kenya in 2012
Mixed ruminant slaughterhouses had a greater mean number of workers than cattle
only slaughterhouses and pig only slaughterhouses, and a greater proportion of
licensed workers than pig slaughterhouses (Table 3.1). The approximate number of

Chapter 3 Cross Sectional Survey_______________________60
animals slaughtered per week across all slaughterhouses was 807 cattle, 404
sheep/goats and 410 pigs.
Variable Mixed
ruminant %
n=31^
Cattle only
% (95% CI)
n=53
Pigs only
% (95% CI)
n=58
Total
% (95% CI)
n=142
Average number
of workers
14 7 (6–7) 4 (3–4) 7 (6–7)
Percent of
licensed workers
61 61 (59–64) 41 (38–45) 52 (51–54)
Average number
animals/ week
Cattle 15
Goats 13
Cattle 7 (6–7) Pigs 7 (6–8) NA
^ 95% CI not reported for Cattle and sheep/goats as this was a complete census
Table 3.1 Number of slaughterhouse workers and animals slaughtered per week
The results are presented in two parts. The questionnaires completed by the foremen
with the observations by the study team form the results regarding the slaughterhouse
infrastructure and practices. The questionnaires completed by the workers and the
clinical assessment form the results regarding worker practices, knowledge, and
health. Tables of the results for all variables of interest are in Appendix 5.
3.3.1 Slaughterhouse infrastructure and practices
a. Slaughterhouse category
Only 2 slaughterhouses were Category B slaughterhouses. The remainder were
Category C or informal. It was not possible to determine the informal
slaughterhouses, as foremen were unwilling to admit to working outside the
regulations.
Despite the vast majority of slaughterhouse classed as Category C, only 26% (95%
CI 24–28%) of slaughterhouses restricted meat selling to within the local village,

Chapter 3 Cross Sectional Survey_______________________61
with the remainder exporting meat outside their immediate area. Figure 3.3 shows
the slaughterhouse categories of selected slaughterhouses in western Kenya.
1) Category B Cattle and sheep/goat slaughterhouse 2) Cattle and sheep/goat slaughterhouse - sheep/goat unit 3) Category C Cattle slaughterhouse 4) Category C Pig slaughterhouse
Figure 3.3 Slaughterhouses in western Kenya
1 3
2 4
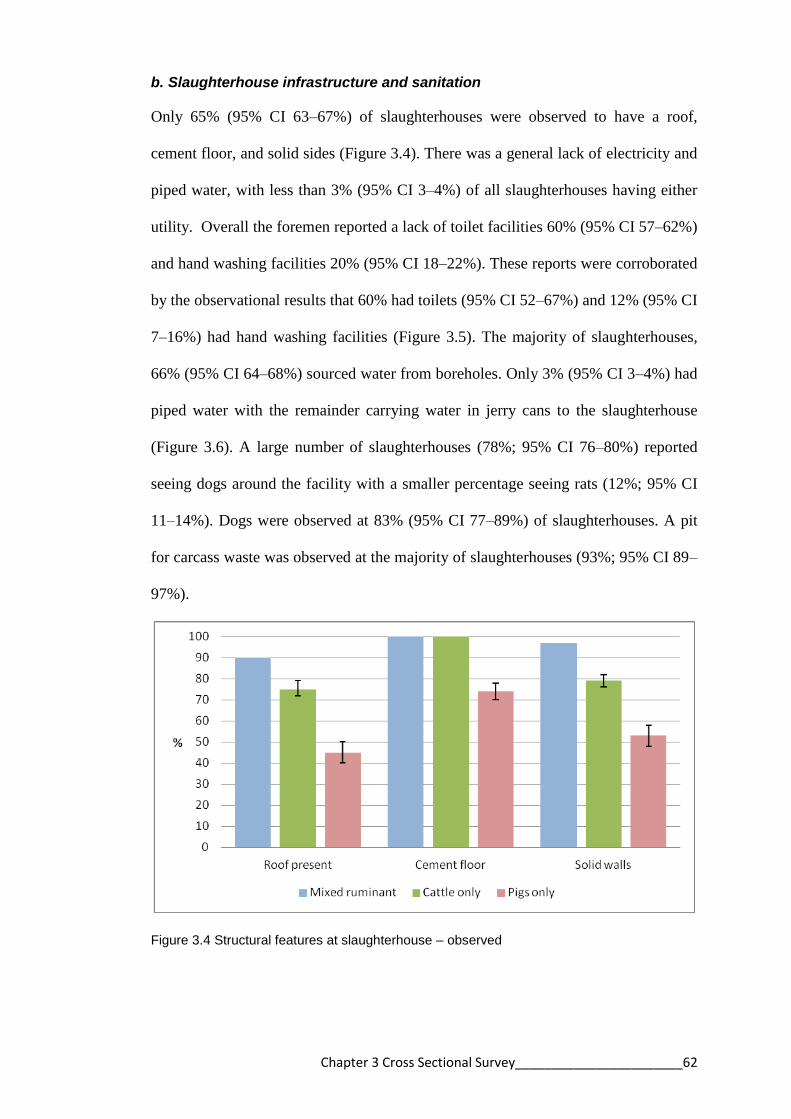
Chapter 3 Cross Sectional Survey_______________________62
b. Slaughterhouse infrastructure and sanitation
Only 65% (95% CI 63–67%) of slaughterhouses were observed to have a roof,
cement floor, and solid sides (Figure 3.4). There was a general lack of electricity and
piped water, with less than 3% (95% CI 3–4%) of all slaughterhouses having either
utility. Overall the foremen reported a lack of toilet facilities 60% (95% CI 57–62%)
and hand washing facilities 20% (95% CI 18–22%). These reports were corroborated
by the observational results that 60% had toilets (95% CI 52–67%) and 12% (95% CI
7–16%) had hand washing facilities (Figure 3.5). The majority of slaughterhouses,
66% (95% CI 64–68%) sourced water from boreholes. Only 3% (95% CI 3–4%) had
piped water with the remainder carrying water in jerry cans to the slaughterhouse
(Figure 3.6). A large number of slaughterhouses (78%; 95% CI 76–80%) reported
seeing dogs around the facility with a smaller percentage seeing rats (12%; 95% CI
11–14%). Dogs were observed at 83% (95% CI 77–89%) of slaughterhouses. A pit
for carcass waste was observed at the majority of slaughterhouses (93%; 95% CI 89–
97%).
Figure 3.4 Structural features at slaughterhouse – observed

Chapter 3 Cross Sectional Survey_______________________63
Figure 3.5 Sanitation facilities at slaughterhouses – reported and observed
Figure 3.6 Water source at slaughterhouse – reported
Both mixed ruminant slaughterhouses and cattle only slaughterhouses had better
infrastructure than pig slaughterhouses. 90% of mixed ruminant slaughterhouses and

Chapter 3 Cross Sectional Survey_______________________64
75% (95% CI 72–79%) of cattle only slaughterhouses had a roof, cement floor and
solid walls compared with 45% (95% CI 40–50%) of pig slaughterhouses (Χ2=21.53,
df=2 p<0.001).
Slaughtering, bleeding, skinning, and evisceration were performed in the same area
in all slaughterhouses. This process is referred to as “batch slaughtering”. The
viscera were washed outside the slaughterhouse on a concrete slab in all but one
slaughterhouse, where there was a specific room inside the slaughterhouse. At only
one mixed ruminant slaughterhouse were cattle stunned before slaughter. The
remaining 141 slaughterhouses cut the throat instead.
c. Personal hygiene practices (slaughterhouse level)
Less than half of slaughterhouses reported that workers wore personal protective
clothing. Workers in 32% (95% CI 29–34%) of slaughterhouses were reported to
wear lab coats. 34% (95% CI 31–36%) of slaughterhouses reported that workers
wore boots. This report was supported by the observational data that workers in 27%
(95% CI 21–34%) of slaughterhouses wore lab coats and workers in 22% (95% CI
17–28%) of slaughterhouses wore boots (Figure 3.7).
Very few slaughterhouses provided protective equipment for workers, with workers
providing their own lab coats in 78% (95% CI 73–84%) of slaughterhouses and
workers providing their own boots in 84% (95% CI 78–89%) of slaughterhouses. No
workers were observed to wear gloves. Workers in mixed ruminant (55%) and cattle
slaughterhouses (36%; 95% CI 32–39%) were more likely to wear lab coats than
workers in pig slaughterhouses (17%; 95% CI 13–21%) (Χ2=13.38, df=2 p=0.001).
Workers in mixed ruminant slaughterhouses (52%) and cattle slaughterhouses (45%;

Chapter 3 Cross Sectional Survey_______________________65
95% 41–48%) were more likely to wear boots than workers in pig slaughterhouses
(16%; 95% CI 12–19%) (Χ2=16.33, df=2 p<0.001).
Soap was reported to be provided at 64% (95% CI 62–67%) of slaughterhouses but
was only observed in 21% (95% CI 15–27%). Soap was observed in 16% (95% CI
7–25%) of cattle only and 12% (95% CI 2–22%) of pig only slaughterhouses. This
was significantly less than in mixed ruminant slaughterhouses where soap was
observed 50% (95% CI 44–56%) of the time (Χ2=4.75, df=2 p=0.001). Eating was
observed in 18% (95% CI 12–24%) of slaughterhouses.
Figure 3.7 Personal hygiene practices at slaughterhouses – reported and observed
d. Meat inspection practices
90% (95% CI 92–95%) of slaughterhouses reported that the meat inspector visited
every day. However the meat inspector was seen at only 53% (95% CI 45–61%) of

Chapter 3 Cross Sectional Survey_______________________66
slaughterhouses. Workers explained that the meat inspector may visit the butchery to
inspect the meat if he was too late arriving and did not see the meat at the
slaughterhouse. Antemortem inspection was reported at 7% (95% CI 6–8%) and
observed at 6% (95% CI 3–10%) of slaughterhouses (Figure 3.8). 9% (95% CI 7–
10%) of slaughterhouses reported slaughtering sick animals.
Figure 3.8 Meat inspection practices – reported and observed
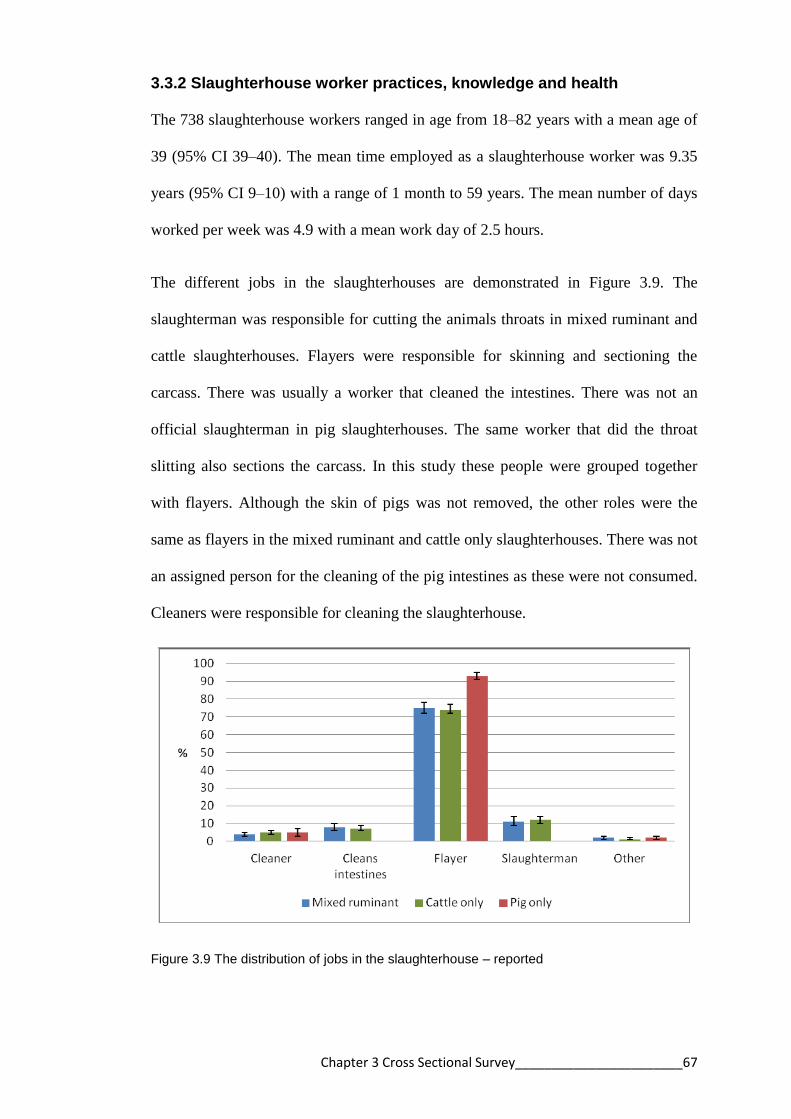
Chapter 3 Cross Sectional Survey_______________________67
3.3.2 Slaughterhouse worker practices, knowledge and health
The 738 slaughterhouse workers ranged in age from 18–82 years with a mean age of
39 (95% CI 39–40). The mean time employed as a slaughterhouse worker was 9.35
years (95% CI 9–10) with a range of 1 month to 59 years. The mean number of days
worked per week was 4.9 with a mean work day of 2.5 hours.
The different jobs in the slaughterhouses are demonstrated in Figure 3.9. The
slaughterman was responsible for cutting the animals throats in mixed ruminant and
cattle slaughterhouses. Flayers were responsible for skinning and sectioning the
carcass. There was usually a worker that cleaned the intestines. There was not an
official slaughterman in pig slaughterhouses. The same worker that did the throat
slitting also sections the carcass. In this study these people were grouped together
with flayers. Although the skin of pigs was not removed, the other roles were the
same as flayers in the mixed ruminant and cattle only slaughterhouses. There was not
an assigned person for the cleaning of the pig intestines as these were not consumed.
Cleaners were responsible for cleaning the slaughterhouse.
Figure 3.9 The distribution of jobs in the slaughterhouse – reported

Chapter 3 Cross Sectional Survey_______________________68
97% (95% CI 96–97%) of slaughterhouse workers were men. 74% (95% CI 73–
76%) of workers had predominantly primary level education. 82% (95% CI 80–83%)
of workers had a second occupation, predominantly as butchers (42%; 95% CI 40–
44%) (Figure 3.10). 72% (95% CI 70–74%) of workers had contact with livestock
outside of work (Figure 3.11). The majority of workers had contact with poultry
(88%; 95% CI 86–89%) and cattle (72%; 95% CI 70–74%).
Figure 3.10 Secondary occupations of slaughterhouse workers – reported
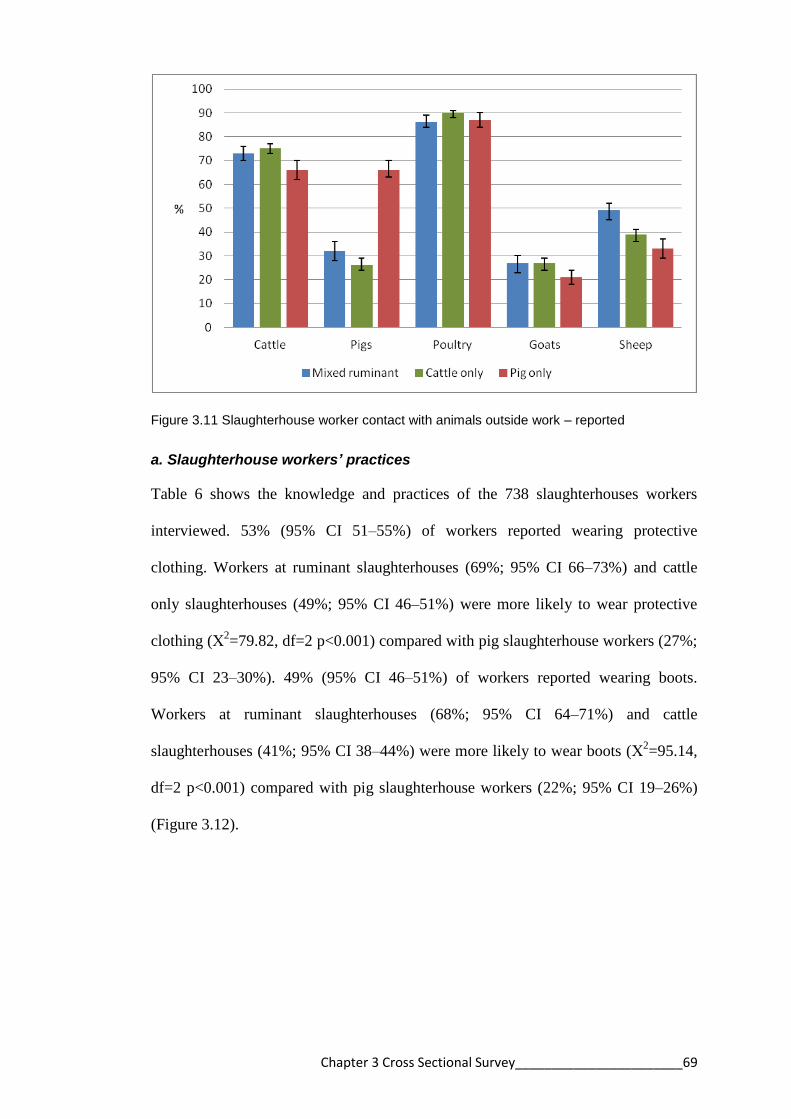
Chapter 3 Cross Sectional Survey_______________________69
Figure 3.11 Slaughterhouse worker contact with animals outside work – reported
a. Slaughterhouse workers’ practices
Table 6 shows the knowledge and practices of the 738 slaughterhouses workers
interviewed. 53% (95% CI 51–55%) of workers reported wearing protective
clothing. Workers at ruminant slaughterhouses (69%; 95% CI 66–73%) and cattle
only slaughterhouses (49%; 95% CI 46–51%) were more likely to wear protective
clothing (Χ2=79.82, df=2 p<0.001) compared with pig slaughterhouse workers (27%;
95% CI 23–30%). 49% (95% CI 46–51%) of workers reported wearing boots.
Workers at ruminant slaughterhouses (68%; 95% CI 64–71%) and cattle
slaughterhouses (41%; 95% CI 38–44%) were more likely to wear boots (Χ2=95.14,
df=2 p<0.001) compared with pig slaughterhouse workers (22%; 95% CI 19–26%)
(Figure 3.12).

Chapter 3 Cross Sectional Survey_______________________70
Figure 3.12 Protective clothing and boots worn reported by workers
Almost one quarter of workers smoke daily (23%; 95% CI 21–25%) and 32% (95%
CI 30–34%) workers take alcohol daily. The study team observed that 11% (95% CI
10–12%) of workers appeared to be intoxicated at interview (Figure 3.13). 21%
(95% CI 21–23%) of workers eat at work (Figure 3.13). At pig slaughterhouses
workers were observed to eat pieces of the carcass that were cooked over an open
fire. At large mixed ruminant slaughterhouses, there was someone preparing and
selling tea to workers. 24% (95% CI 22–26%) of workers reported defecating in the
open.
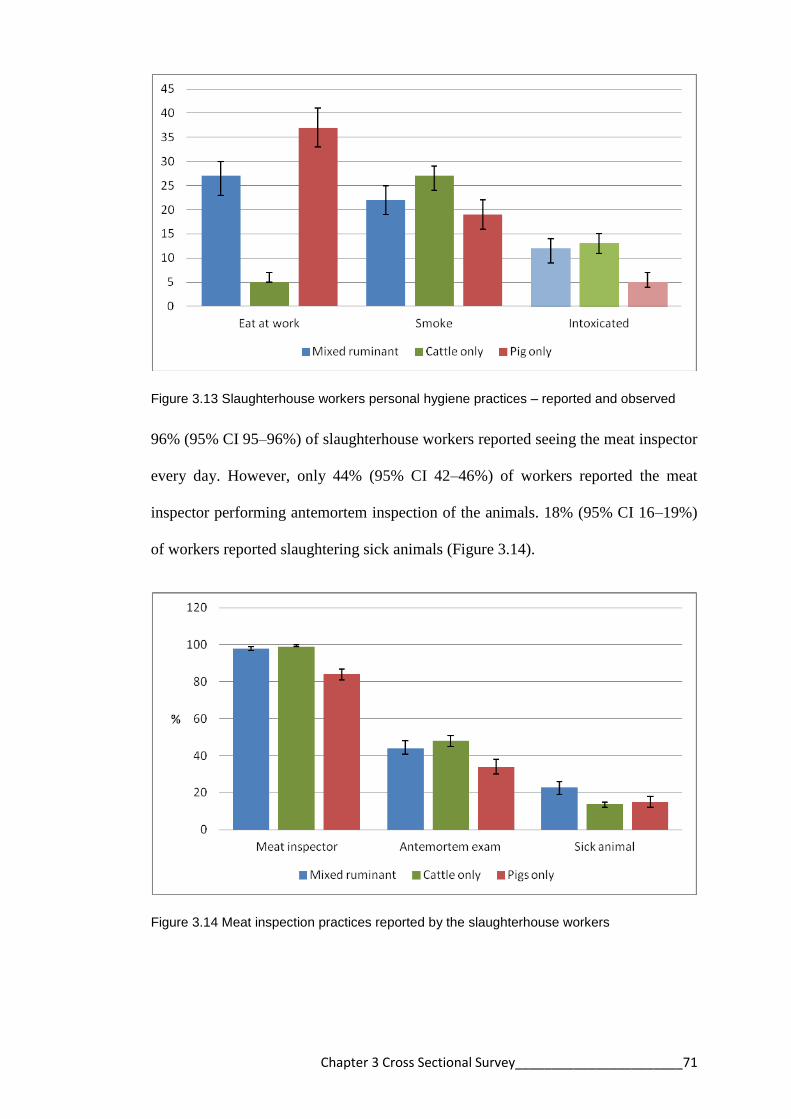
Chapter 3 Cross Sectional Survey_______________________71
Figure 3.13 Slaughterhouse workers personal hygiene practices – reported and observed
96% (95% CI 95–96%) of slaughterhouse workers reported seeing the meat inspector
every day. However, only 44% (95% CI 42–46%) of workers reported the meat
inspector performing antemortem inspection of the animals. 18% (95% CI 16–19%)
of workers reported slaughtering sick animals (Figure 3.14).
Figure 3.14 Meat inspection practices reported by the slaughterhouse workers

Chapter 3 Cross Sectional Survey_______________________72
b. Slaughterhouse workers’ knowledge
31% (95% CI 29–33%) of the 738 slaughterhouse workers knew that disease can be
transmitted from animals. 42% (95% CI 40–44%) knew that meat can be a source of
disease. Only 8% (95% CI 7–9%) of workers could name a zoonotic disease (Figure
3.15). Many workers recognised images of tuberculosis, brucellosis, echinococcosis,
and cysticercosis lesions in animals but no one correctly named these conditions
(Table 3.2).
Figure 3.15 Slaughterhouse worker knowledge of zoonotic and foodborne disease
Variable Mixed % (95% CI)
n=274
Cattle % (95% CI)
n=292
Pigs only %
(95% CI) n=172
Bovine tuberculosis 65 (62–69) 49 (46–51) NA
Brucellosis in cattle 22 (18–25) 6 (5–8) NA
Anthrax in people 13 (10–15) 11 (9–12) NA
Echinococcosis in
cattle
33 (30–37) 33 (31–36) NA
Cysticercosis in pigs NA NA 20 (16-23)
Table 3.2 Slaughterhouse workers that recognise images of zoonotic disease in animals
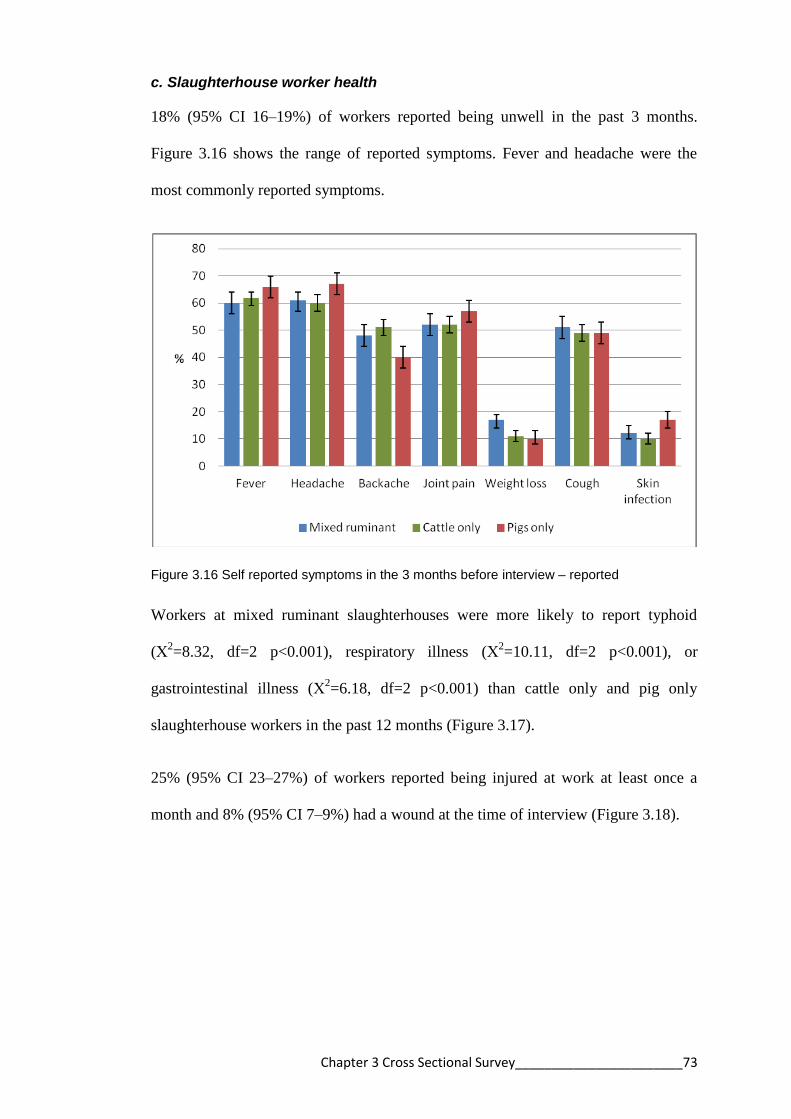
Chapter 3 Cross Sectional Survey_______________________73
c. Slaughterhouse worker health
18% (95% CI 16–19%) of workers reported being unwell in the past 3 months.
Figure 3.16 shows the range of reported symptoms. Fever and headache were the
most commonly reported symptoms.
Figure 3.16 Self reported symptoms in the 3 months before interview – reported
Workers at mixed ruminant slaughterhouses were more likely to report typhoid
(Χ2=8.32, df=2 p<0.001), respiratory illness (Χ
2=10.11, df=2 p<0.001), or
gastrointestinal illness (Χ2=6.18, df=2 p<0.001) than cattle only and pig only
slaughterhouse workers in the past 12 months (Figure 3.17).
25% (95% CI 23–27%) of workers reported being injured at work at least once a
month and 8% (95% CI 7–9%) had a wound at the time of interview (Figure 3.18).
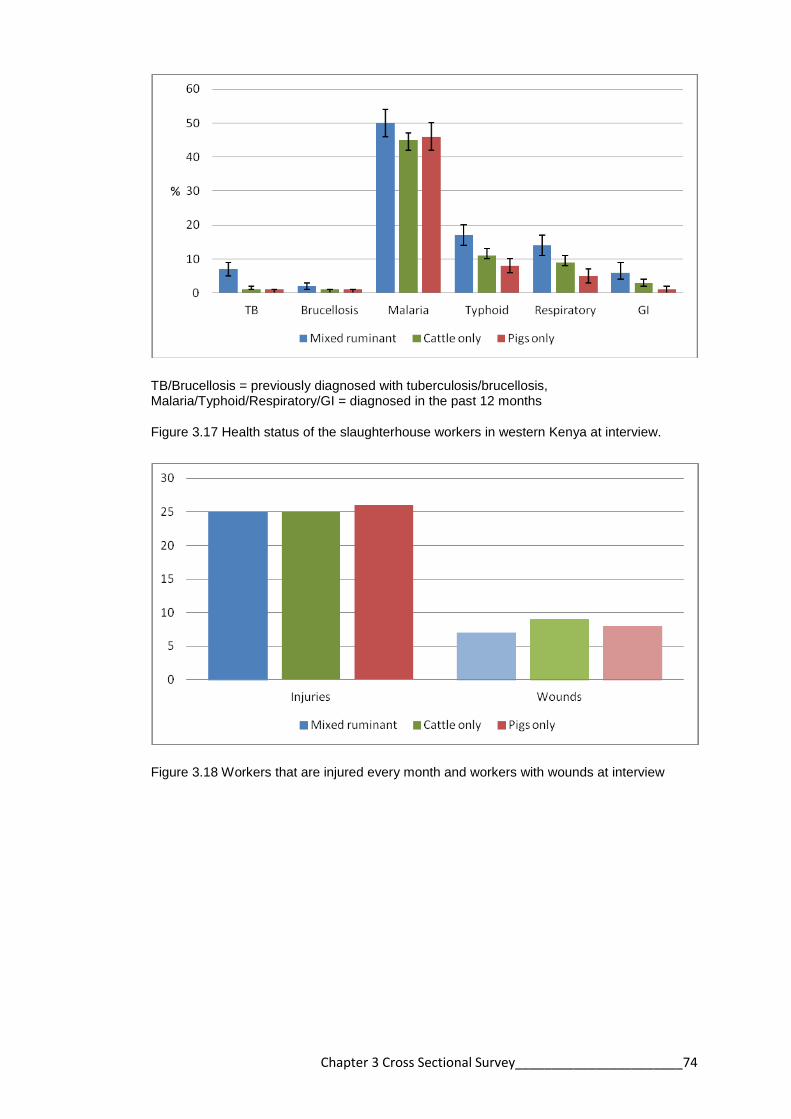
Chapter 3 Cross Sectional Survey_______________________74
TB/Brucellosis = previously diagnosed with tuberculosis/brucellosis, Malaria/Typhoid/Respiratory/GI = diagnosed in the past 12 months
Figure 3.17 Health status of the slaughterhouse workers in western Kenya at interview.
Figure 3.18 Workers that are injured every month and workers with wounds at interview

Chapter 3 Cross Sectional Survey_______________________75
3.3.3. Multiple correspondence analysis of slaughterhouse data
Figure 3.19 is a graphical representation of the MCA where the proximity of
variables can infer similarity. Table 3.3 demonstrates the contribution each variable
made to each dimension. A dendrogram was created from the output of the MCA
taking the first 5 dimensions which accounted for 59% of the variability in the data.
The dendrogram grouped the slaughterhouses into 3 main categories (Figure 3.20).
Category 1: predominantly mixed ruminant slaughterhouses, most wear protective
clothing and boots, most have a roof and slaughter >10 animals per week
Category 2: approximately 50% pig and cattle slaughterhouses, have a roof and
slaughter ≤10 animals a week
Category 3: predominantly pig slaughterhouses, do not wear protective clothing or
boots, do not have a roof and slaughter ≤5 animals a week
Variable Dim1 Dim2 Dim3 Dim4 Dim 5
PPE clothing 0.359 0.440 0.218 0.197 0.007
Boots 0.469 0.292 0.225 0.078 0.115
Animals 0.522 0.185 0.298 0.224 0.019
Roof present 0.568 0.027 0.052 0.113 0.000
Hard floor 0.357 0.198 0.007 0.008 0.003
Walls 0.541 0.036 0.074 0.030 0.012
Animal exam 0.204 0.018 0.134 0.049 0.606
Latrine 0.038 0.096 0.091 0.216 0.042
Hand washing 0.050 0.154 0.022 0.038 0.358
Total people 0.570 0.360 0.147 0.064 0.015
Total animals 0.482 0.196 0.123 0.203 0.032
% of variance 24.471 11.774 8.190 7.768 7.116
Table 3.3 Contribution of the variables to 5 dimensions created by the multiple
correspondence analysis

Chapter 3 Cross Sectional Survey_______________________76
animal_exam – antemortem inspection of animals (Always, Sometimes, Never); animals_slaughtered – type of slaughterhouse (Cattle and shoats(sheep/goats), Cattle only, Pigs only); floortype – Cement/Other; handwashingplace – Present/Absent; latrinepresent – Present/Absent; ppe_clothing – ppe worn (Always, Sometimes, Never); roofpresent – Iron sheets/No roof; total people3 – 1000 - ≤3, 2000 - ≤10, 4000 - >10; totanimals3 – 1000 - ≤5, 2000 - ≤10, 4000 - >10 ; Walls – Solid/Not solid; wearboots – workers wear boots (Always, Sometimes, Never)
Figure 3.19 The distribution of variables using the first 2 dimensions of the multiple correspondence analysis
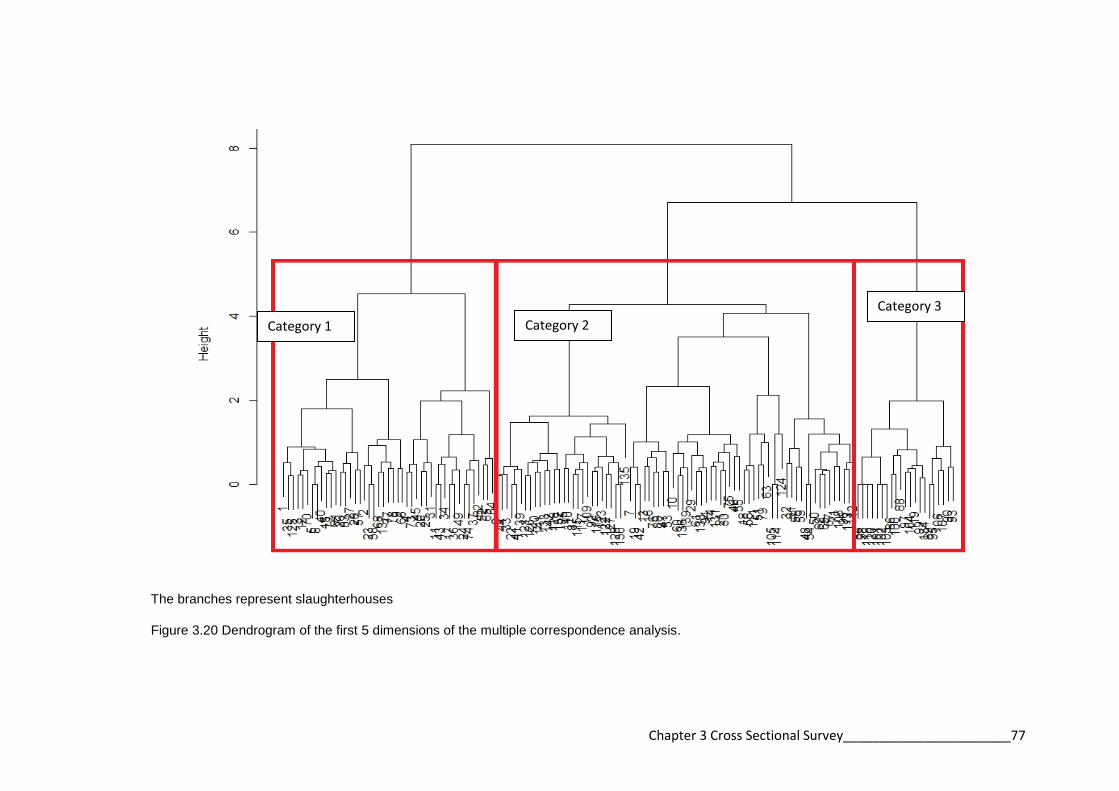
Chapter 3 Cross Sectional Survey_______________________77
The branches represent slaughterhouses
Figure 3.20 Dendrogram of the first 5 dimensions of the multiple correspondence analysis.
Category 3
Category 2 Category 1

Chapter 3 Cross Sectional Survey _____________ 78
3.4 Discussion
The current conditions in slaughterhouses in many developing countries contribute to
the spread of zoonotic diseases (Mann, 1984). The lack of facilities and unhygienic
practices lead to contamination of meat and spread of disease to workers and the
community (Mann, 1984). This study reports the conditions in slaughterhouses in
western Kenya with respect to infrastructure, hygiene, meat inspection, and the
knowledge and health of workers.
3.4.1 Slaughterhouse infrastructure and sanitation
The most notable findings were the lack of facilities to ensure adequate meat
hygiene. Ideally the floor of the slaughterhouse should be hard concrete and
impervious, to reduce dirt in the slaughterhouse and allow drainage and cleaning
(Bengtssom, 1988). Similarly, a roof is important to protect the carcass from the
weather and to reduce the temperature in the slaughterhouse (Mann, 1984,
Bengtssom, 1988). 10% of the 142 slaughterhouses did not have a cement floor and
over 30% of slaughterhouses did not have a roof.
There should be a division in the slaughterhouse between the dirty (killing, bleeding)
and clean (eviscerating and splitting) operations to prevent carcass contamination
(Codex Alimentarius Commission, 2005). All slaughterhouses in the study area
performed “batch slaughtering”. This is where an animal is killed, bled, skinned,
eviscerated, and split in the same spot (FAO, 2010). In the majority of
slaughterhouses, carcass preparation was performed on the ground as seen in the
representative photographs (Figure 3.3). These processes can lead to carcass
contamination from the skin, the intestines and the ground (FAO, 2010).

Chapter 3 Cross Sectional Survey _____________ 79
International guidelines specify that hot and cold water should be readily accessible
for cleaning (FAO, 2004, Codex Alimentarius Commission, 2005). Equipment and
workers’ hands should be washed with soap and hot water (Codex Alimentarius
Commission, 2005, FAO, 2004). This process requires piped water facilities that are
only available in a few (3%) slaughterhouses. There was a lack of water, hand
washing facilities, and soap in all slaughterhouse types. Hand washing is
predominantly used to protect meat from contamination, but is also protective against
infection with zoonotic disease in workers (Brown et al., 2011, Campagnolo et al.,
2000, Gomes-Neves et al., 2012). The lack of hand washing facilities in the majority
of slaughterhouses in western Kenya has public health implications to workers and
the wider community. Only 60% of slaughterhouses had access to a toilet, with 24%
of workers admitting to open defecation. This behaviour promotes the persistence of
zoonotic diseases such as cysticercosis (Mann, 1984). The presence of pests in the
slaughterhouse results in disease spread, either through contamination of meat or
eating of meat scraps by dogs which can lead to persistence and spread of diseases
such as echinococcosis (Brown et al., 2011, Mann, 1984, Bengtssom, 1988).
The MCA was a graphical method of examining the relationship between variables
from the slaughterhouse questionnaire (Hoffman, 1992). It can be inferred from this
and the Chi squared analysis that mixed ruminant slaughterhouses have improved
facilities and practices over the other types of slaughterhouses. The chi squared
analysis showed that mixed ruminant slaughterhouses are more likely to have
appropriate infrastructure such as a roof and cement floor and to have improved
hygiene practices with more slaughterhouses having soap and more workers wearing
protective clothing.

Chapter 3 Cross Sectional Survey _____________ 80
The MCA analysis was not useful as a method of variable reduction. The first
dimension accounted for only 24% of the variability and this was not considered
sufficient for this dimension to be used as a new variable in future analyses. The
dendrogram grouped slaughterhouses according to the facilities and practices at each
slaughterhouse. This process divided the slaughterhouses into three categories. The
categories again support that mixed ruminant slaughterhouses are more equipped
than other slaughterhouses with pig only slaughterhouses having the least
infrastructure and the poorest practices. The new categories defined by the
dendrogram were not used in any future analysis as slaughterhouse type was deemed
a sufficient method of categorisation.
3.4.2 Slaughterhouse personal hygiene practices
The purpose of protective clothing within the slaughterhouse is primarily to protect
the meat product from contamination but has also been shown to be protective
against zoonoses in slaughterhouse workers (Brown et al., 2011, FAO, 2004). Less
than 50% of workers wore protective equipment at all times. It is likely that the cost
of protective clothing is the limiting factor as the majority of workers must provide
their own protective clothing. The income for slaughtering a cow is US$1.10 and the
cost of boots and apron US$9.50 and US$5.00 respectively.
3.4.3 Slaughterhouse meat inspection practices
A large amount of the slaughter activities occurred without an inspector present.
Workers reported that the meat inspector would inspect the meat later at the
butchery. Antemortem inspection, which is essential for preventing the slaughter of
sick animals was practiced at very few slaughterhouses. Almost 1 in 5 workers

Chapter 3 Cross Sectional Survey _____________ 81
admitted to slaughtering sick animals. Slaughtering sick animals is a risk factor for
infection with zoonoses including anthrax, brucellosis, and leptospirosis (Ray et al.,
2009, Peck and Fitzgerald, 2007, Swai and Schoonman, 2009, Brown et al., 2011).
The paucity of antemortem inspection may be limited by the number of inspectors.
Currently inspectors attend to more than 5 slaughter facilities per day. It is the
responsibility of the government to train and provide meat inspectors (FAO, 2010).
3.4.4 Slaughterhouse workers’ knowledge
A lack of knowledge regarding the process of meat contamination is the biggest
hindrance to improving conditions in the meat industry (Mann, 1984). This study
showed that few people were able to recognise or name a zoonotic disease. Training
personnel in meat hygiene is essential to improving conditions in slaughterhouses
and to reduce bacterial contamination of meat and disease exposure in workers
(FAO, 2010, Wamalwa et al., 2012).
3.4.5 Slaughterhouse workers’ health
Slaughterhouse workers have been identified in occupational health studies for
elevated risk of injury, particularly to the upper extremities (mostly due to
lacerations) and back injuries (Pedersen et al., 2010, Burridge et al., 1997). Both
backache and wounds were reported by workers. This trend may be the result of poor
work practices and training or a lack of appropriate equipment (Burridge et al., 1997,
Cai et al., 2005). The population of slaughterhouse workers polled by this study is
young and predominantly male and they have worked for a short duration of time in
the meat industry. Young men are likely to take higher risks (Hannerz and Tuchsen,
2001). This suggests a young, inexperienced work force with a high turnover that

Chapter 3 Cross Sectional Survey _____________ 82
may be more prone to injury and disease (Burridge et al., 1997, Brown et al., 2011).
A large number of workers consumed alcohol regularly and over 10% appeared
intoxicated at interview. Alcohol consumption is a risk factor for injury at work
(Stallones and Xiang, 2003). Over 20% of the workers smoke and over 20% of
workers eat at the slaughterhouse. Smoking and consuming food at work are
associated with increased risk of zoonotic disease (Campagnolo et al., 2000). The
lack of personal hygiene, lack of hand washing, and slaughtering of sick animals
could increase the risk of meat contamination and exposure to disease.
A number of risk factors have been associated with zoonotic disease exposure in
slaughterhouse workers that include cutting animals throats (Abu-Elyazeed et al.,
1996, Swai and Schoonman, 2009). This practice is performed in ruminant
slaughterhouses by a specified slaughterman and in pig only slaughterhouses by the
same person that will perform the evisceration. Cleaning animal parts is considered a
risk for zoonotic disease exposure (Swai and Schoonman, 2009). Washing the
intestines is performed by specific workers in the ruminant slaughterhouse. Workers
involved with cleaning intestines do not wear special protective clothing or gloves to
reduce their exposure.
Ill workers are a risk to meat contamination and should self report (Mann, 1984).
However, as workers are paid per animal slaughtered they are unlikely to take time
off if they are feeling sick. A number of workers reported coughs and skin infections
within the past 3 months. These conditions can lead to bacterial contamination of
meat (Mann, 1984). Workers from ruminant slaughterhouses were more likely to
report certain illnesses. The epidemiology of these illnesses warrants further

Chapter 3 Cross Sectional Survey _____________ 83
investigation. Addition research investigating the carriage of Salmonella sp., Shigella
sp., Escherichia coli and Campylobacter sp. is planned.
A number of workers have a second occupation, predominantly as stakeholders in the
meat production industry as farmers or butchers, and are therefore exposed to
animals and meat products outside the slaughterhouse. This increased exposure may
act as a source of infection or a potential for dissemination since these activities are
independently associated with zoonotic disease exposure. These factors will be
considered in Chapter 5 which will analyse the risk factors for zoonotic disease
exposure in slaughterhouse workers.
Chapter 3 Cross Sectional Survey _____________ 84
3.5 Conclusion
This is the first study of its type in Kenya and the information generated is important
to understanding the current situation in the meat industry in western Kenya.
The hypotheses of this study were:
1. slaughterhouses in western Kenya have inadequate infrastructure and poor
sanitation
2. slaughterhouse workers in western Kenya have poor hygiene practices
3. slaughterhouse workers are aware of zoonotic diseases
The first hypothesis was proven. The infrastructure at the majority of
slaughterhouses did not meet the guidelines with many slaughterhouses lacking basic
structural requirements such as a roof and sanitation facilities such as a toilet or
running water. The second hypothesis was also proven as many of the workers did
not wear protective clothing. However the third hypothesis was not proven as the
majority of workers did not know about zoonotic diseases.
The study documents the conditions in slaughterhouses in western Kenya before the
implementation of the revised Meat Control Act, 2012 and gives an indication where
initial improvements need to be made. None of the slaughterhouses visited complied
with the published regulations at the time of the study, with many falling far below a
minimum standard.
During the course of the study in 2012, some changes were noticed in
slaughterhouses as the new act was brought into effect. The changes were initially
focused on ruminant slaughterhouses, which may explain the significant difference

Chapter 3 Cross Sectional Survey _____________ 85
between ruminant and pig slaughterhouses documented in this study through the chi
squared analysis. Meat inspectors and District Veterinary Officers informed the study
team that each slaughterhouse was urged to adopt one change in the first year or face
closure. They were concerned that strictly enforcing the new standards would lead to
a deficit in the meat industry in the region. 2012 saw the closure of a number of
slaughter facilities which did not make efforts to adopt the changes. The informal
meat industry was very difficult to quantify as slaughterhouse owners and butchers
were unwilling to admit to slaughtering without authority as they feared prosecution
from the public health department. This fear may explain the number of
slaughterhouses that declined to participate. Despite only 2 slaughterhouses being
classified as category B a large number of slaughterhouses were exporting meat
beyond the local village where the slaughter was conducted which contravenes the
regulations of the Meat Control Act and may allow the dissemination of disease.
The results of this study are an important contribution to the meat industry in western
Kenya and may be generalised to other areas in rural Kenya. Improvements need to
be made to facilities and practices in all slaughterhouses. In the initial stages, training
is recommended to improve awareness for workers, managers, and inspectors of the
risks of meat contamination and methods to reduce it. Secondly, improvement of
facilities must be implemented with closure of substandard facilities and focusing
resources on fewer facilities to improve meat hygiene in this resource-limited setting.

Chapter 4 Sero-prevalence of Zoonoses_________86
Chapter 4
Sero-prevalence of brucellosis,
leptospirosis, Q fever, Rift Valley fever
(RVF), taeniasis and cysticercosis in
slaughterhouse workers in western Kenya
Chapter 4 Sero-prevalence of Zoonoses_________87
4.1 Introduction
Slaughterhouse workers are considered at increased risk of being exposed to zoonotic
diseases (Ojo, 1996, McEwen, 1987). This risk is a result of the extremely close
contact workers have with a large number of animals and animal products.
Furthermore, if meat inspection and public health standards are weak, there may be a
higher proportion of sick animals at slaughter as producers sell animals to reduce
losses (Brown et al., 2011, Nabukenya et al., 2013). Zoonotic disease outbreaks in
slaughterhouse workers in other countries are commonly documented in the literature
(Swai and Schoonman, 2009, Wilson et al., 2010, Benschop et al., 2009, Chan et al.,
1987, Cousins et al., 1999, Abu-Elyazeed et al., 1996, Whitney et al., 2009). In
contrast, the last report in Kenya of zoonoses in slaughterhouse workers was a
brucellosis outbreak in 1953 (Wright et al., 1953).
The aim of this component of the study was to assess the seroprevalence of the
described pathogens in slaughterhouse workers. Brucellosis, leptospirosis, Q fever,
and RVF were chosen because there is a documented risk to slaughterhouse workers
(Swai and Schoonman, 2009, Wilson et al., 2010, Chan et al., 1987, Benschop et al.,
2009, Abu-Elyazeed et al., 1996, Cousins et al., 1999). There are no published data
suggesting that slaughterhouse workers are at increased risk for taeniasis and
cysticercosis. It was hypothesised by the author that slaughterhouse workers may
have increased exposure to these pathogens through greater access to meat products
that are infected. Assessing the seropositivity of slaughterhouse workers through
serological testing provides evidence for the potential presence of these organisms in
western Kenya.

Chapter 4 Sero-prevalence of Zoonoses_________88
The hypotheses of this study are that:
1. slaughterhouse workers are exposed to zoonotic disease in western Kenya
2. slaughterhouse workers are more exposed to zoonotic disease than the
general population
Chapter 4 Sero-prevalence of Zoonoses_________89
4.2 Methods
4.2.1 Study design
The study area, population and sampling were described in detail in Sections 2.1, 2.4
and 2.5.
4.2.2 Diagnostic tests
The diagnostic tests used are described in detail in Section 2.7. Sera were tested for
brucellosis (Rose Bengal Test), leptospirosis (Panbio Leptospirosis IgM ELISA), Q
fever (Serion Classic IgG Phase 2 ELISA), RVF (BDSL cELISA), and cysticercosis
(HP10-Antigen ELISA). Faecal samples were tested for taeniasis (Coproantigen
ELISA),
4.2.3 Statistical analysis
The apparent prevalence estimates were calculated using the epi.prev function in the
EpiR package (Stevenson, 2014a) of R (R Core Team, 2013). Weights were
calculated by dividing the number of expected workers by the number sampled.
These were used to calculate a design effect in the Survey (Lumley, 2012) package of
R. The individual level prevalence results were adjusted with slaughterhouse as the
clustering variable using svymean in the Survey package of R. The true prevalence
estimate accounting for the test sensitivity and specificity were calculated using the
truePrev function in the prevalence package (Devleesschauwer et al., 2013) of R.
The sensitivity and specificity used in this analysis are highlighted in Table 2.1.
For the commercially available diagnostic kits (leptospirosis, Q fever and RVF) the
manufacturer’s recommended sensitivity and specificity were used. These values
were chosen as there were not any published studies in the region that gave a better

Chapter 4 Sero-prevalence of Zoonoses_________90
approximation. For the laboratory developed ELISAs (taeniasis and cysticercosis)
the sensitivity and specificity used were those reported in similar study sites and
published by the laboratories that developed the tests (Fleury et al., 2007, Praet et al.,
2013).
For the estimates of the proportion of seropositive slaughterhouses, the data set was
collapsed to slaughterhouse level and each slaughterhouse was classified as positive
if one or more workers were positive. 95% CIs are given unless otherwise stated.
Data were managed in Microsoft® 2007 Access databases. The ELISA output data
for each pathogen is represented graphically using R.
4.2.4 Mapping and spatial cluster analysis
The locations of slaughterhouses were mapped using ArcGISTM
(ESRI, Redlands,
California, USA). Ripley’s K functions were used in the spatstat package (Baddeley,
2005) in R to determine spatial clustering at the slaughterhouse level with
slaughterhouses recorded as positive if one or more workers had disease. The
methodology is described in detail by Ngowi at al. (Ngowi et al., 2010).
The spatial distribution of slaughterhouses without workers seropositive for the
zoonotic disease under examination was considered the control and represented
normal heterogeneity. The distribution of the slaughterhouses with one worker
seropositive for the zoonotic disease under examination was compared with the
control.
The expected number of case slaughterhouses within a fixed distance, 15,000 metres,
of a case slaughterhouse was compared to the expected number of control

Chapter 4 Sero-prevalence of Zoonoses_________91
slaughterhouses. Ripley's K functions were used to assess if the distribution of cases
differed from the distribution of controls. The hypothesis was that the K functions
would be identical for cases and controls if there was no spatial clustering. This was
simulated 1000 times to calculate upper and lower confidence limits. The differences
between the K functions for controls and cases were plotted graphically.
Variation from a straight line above zero in the y axis suggests clustering of the
samples. Significance is determined if the function crosses the upper 95% CI. If the
line falls below zero the clustering is unlikely to be spatial.

Chapter 4 Sero-prevalence of Zoonoses_________92
4.3 Results
Of the 738 slaughterhouse workers that were recruited and interviewed, 737
consented to giving a blood sample and 729 submitted a faecal sample. All 142
slaughterhouses were represented.
4.3.1 Individual level disease prevalence
Table 4.1 shows the individual level prevalence estimates (apparent prevalence) from
the tests. The apparent prevalence of leptospirosis was 13.4% and that of Q fever was
4.5%. The prevalence for RVF, cysticercosis and Taenia were much lower: 1.2%,
2.6% and 1.7% respectively and only 0.1% for brucellosis. Table 4.1 also shows the
adjusted prevalence estimates accounting for the design effect. There was not a
marked difference in the prevalence estimates after this adjustment.
The true prevalence after adjustment for the sensitivity and specificity of the tests is
shown in Table 4.1. There was not a large difference for brucellosis, leptospirosis, Q
fever or RVF. However the true prevalence for taeniasis and cysticercosis were
markedly changed.
Disease Apparent
prevalence (95%
CI) n=737
Adjusted prevalence
for design effect
(95% CI)
Adjusted prevalence
for se/sp†
(95% CI)
Brucellosis 0.1 (0.007–0.8) - 0.3 (0–0.8)
Leptospirosis 13.4 (11.1–16.1) 13.6 (10.9–16.4) 12.7 (10.2–15.4)
Q fever 4.5 (3.2–6.2) 4.6 (3.1–6.1) 3.4 (1.9–5.1)
RVF 1.2 (0.6–2.3) 1.2 (0.4–2.1) 1 (0.3–2.0)
Taenia (n=691)* 1.9 (1.1–3.2) 1.7 (0.8–2.5) 0.2 (0–1.0)
Cysticercosis 2.6 (1.7–4.0) 2.8 (1.5–4.1) 0.3 (0–0.9)
*Only 691 faecal samples were sufficient in volume for the coproantigen ELISA. † se/sp sensitivity/specificity
Table 4.1 Individual level prevalence estimates for 6 zoonoses in workers

Chapter 4 Sero-prevalence of Zoonoses_________93
4.3.2 Brucellosis
There was only one individual positive for brucellosis. Therefore it was not possible
to account for the design affect. It was also not possible to look at the difference in
prevalence between slaughterhouse types.
4.3.3 Leptospirosis
Table 4.2 shows the leptospirosis prevalence for workers in different slaughterhouse
types corrected for the design effect and the test sensitivity and specificity. The
apparent prevalence does not differ between individuals in the different
slaughterhouse types. The apparent prevalence of leptospirosis in mixed ruminant
slaughterhouse workers is 13.5% while in both cattle only slaughterhouse workers
and pig only slaughterhouse workers it is 13.4%. The apparent prevalence did not
change markedly after accounting for the design effect but did change when the test
sensitivity and specificity were considered.
Figure 4.1 are histograms of the Panbio units from the leptospirosis ELISA for each
slaughterhouse type. The red line indicates the negative cut-off and the blue line the
positive cut-off. Equivocal results (between the lines) were considered negative for
the purposes of this study. The distribution of positives is similar across the
slaughterhouse types.
Figure 4.2 shows the location of the slaughterhouses and the number of leptospirosis
positive workers. The leptospirosis positive slaughterhouses were distributed evenly
throughout the study site with a higher number in the middle of the study area. There
was no statistical evidence of spatial clustering of positive slaughterhouses
(Appendix 6).
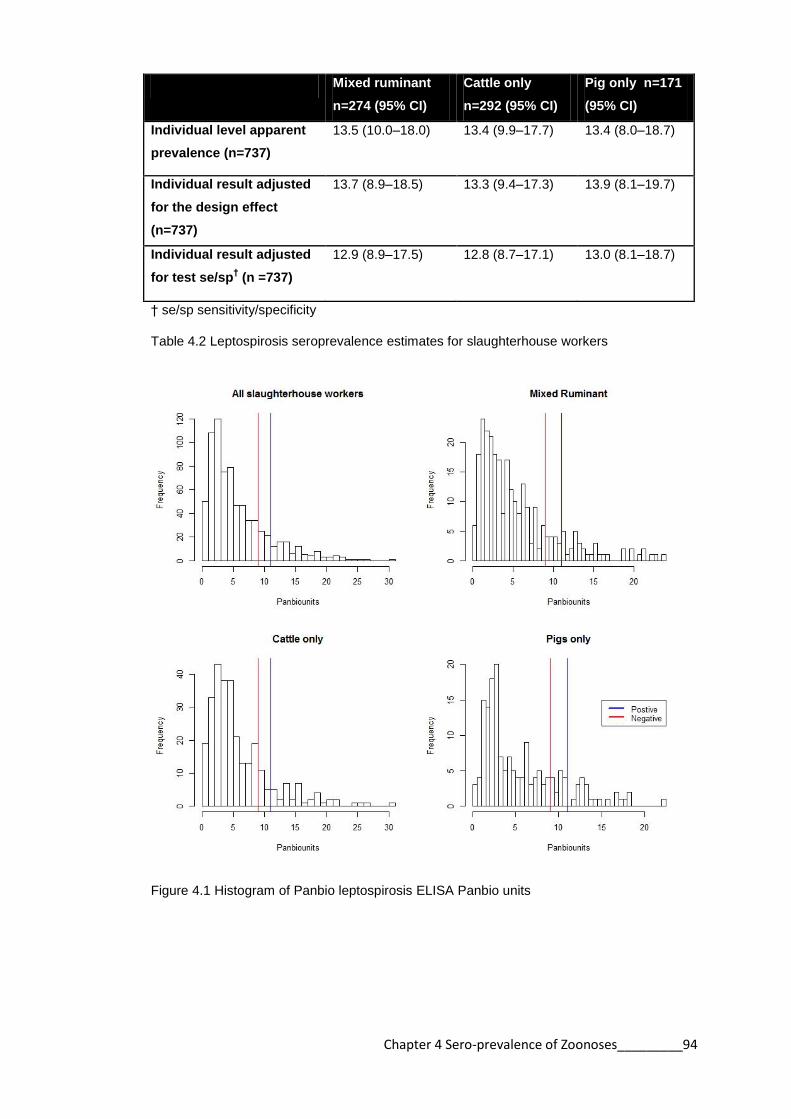
Chapter 4 Sero-prevalence of Zoonoses_________94
Mixed ruminant
n=274 (95% CI)
Cattle only
n=292 (95% CI)
Pig only n=171
(95% CI)
Individual level apparent
prevalence (n=737)
13.5 (10.0–18.0) 13.4 (9.9–17.7) 13.4 (8.0–18.7)
Individual result adjusted
for the design effect
(n=737)
13.7 (8.9–18.5) 13.3 (9.4–17.3) 13.9 (8.1–19.7)
Individual result adjusted
for test se/sp† (n =737)
12.9 (8.9–17.5) 12.8 (8.7–17.1) 13.0 (8.1–18.7)
† se/sp sensitivity/specificity
Table 4.2 Leptospirosis seroprevalence estimates for slaughterhouse workers
Figure 4.1 Histogram of Panbio leptospirosis ELISA Panbio units

Chapter 4 Sero-prevalence of Zoonoses_________95
A) All slaughterhouses, B) Mixed Ruminant, C) Cattle only, D) Pig only
Figure 4.2 Map of leptospirosis positive slaughterhouses
A B
C D

Chapter 4 Sero-prevalence of Zoonoses_________96
4.3.3 Q fever
Table 4.3 shows the Q fever prevalence in different slaughterhouse types corrected
for the design effect and the test sensitivity and specificity. The apparent prevalence
was highest in mixed ruminant slaughterhouse workers (6.2%), moderate in cattle
only slaughterhouse workers (4.1%), and lowest in pig only slaughterhouses workers
(2.3%). The prevalence was not markedly affect by the design but changed when the
sensitivity and specificity of the test was considered.
Figure 4.3 demonstrates histograms of the corrected OD values from the Q fever
ELISA for each slaughterhouse type. The red line is the negative cut-off and the blue
line is the positive cut-off. Values in between were considered negative for the
purposes of this study. The histograms demonstrate a small positive population with
positives having markedly high OD readings in some cases.
Figure 4.4 shows the location of the slaughterhouses and the number of Q fever
positive workers. The Q fever positive slaughterhouses are distributed throughout the
study site although there is an absence of Q fever positive slaughterhouses in the
southern part of the study area. There was no statistical evidence of spatial clustering
of positive slaughterhouses (Appendix 6).
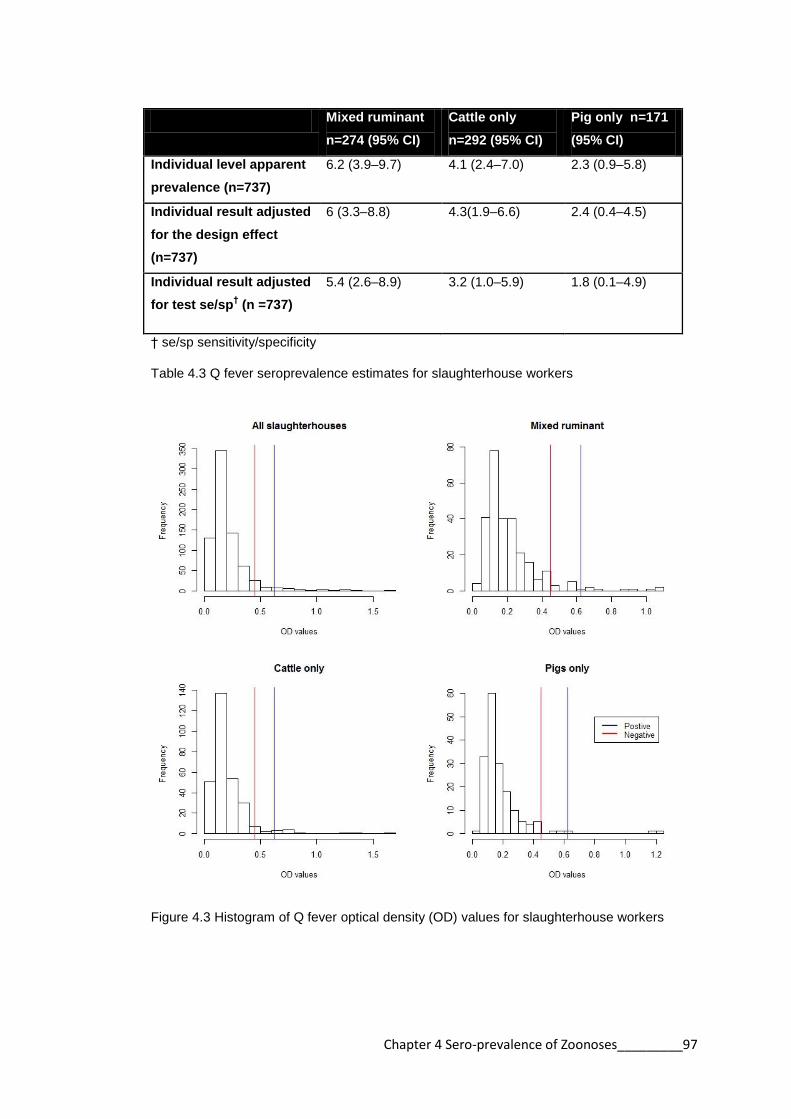
Chapter 4 Sero-prevalence of Zoonoses_________97
Mixed ruminant
n=274 (95% CI)
Cattle only
n=292 (95% CI)
Pig only n=171
(95% CI)
Individual level apparent
prevalence (n=737)
6.2 (3.9–9.7) 4.1 (2.4–7.0) 2.3 (0.9–5.8)
Individual result adjusted
for the design effect
(n=737)
6 (3.3–8.8) 4.3(1.9–6.6) 2.4 (0.4–4.5)
Individual result adjusted
for test se/sp† (n =737)
5.4 (2.6–8.9) 3.2 (1.0–5.9) 1.8 (0.1–4.9)
† se/sp sensitivity/specificity
Table 4.3 Q fever seroprevalence estimates for slaughterhouse workers
Figure 4.3 Histogram of Q fever optical density (OD) values for slaughterhouse workers
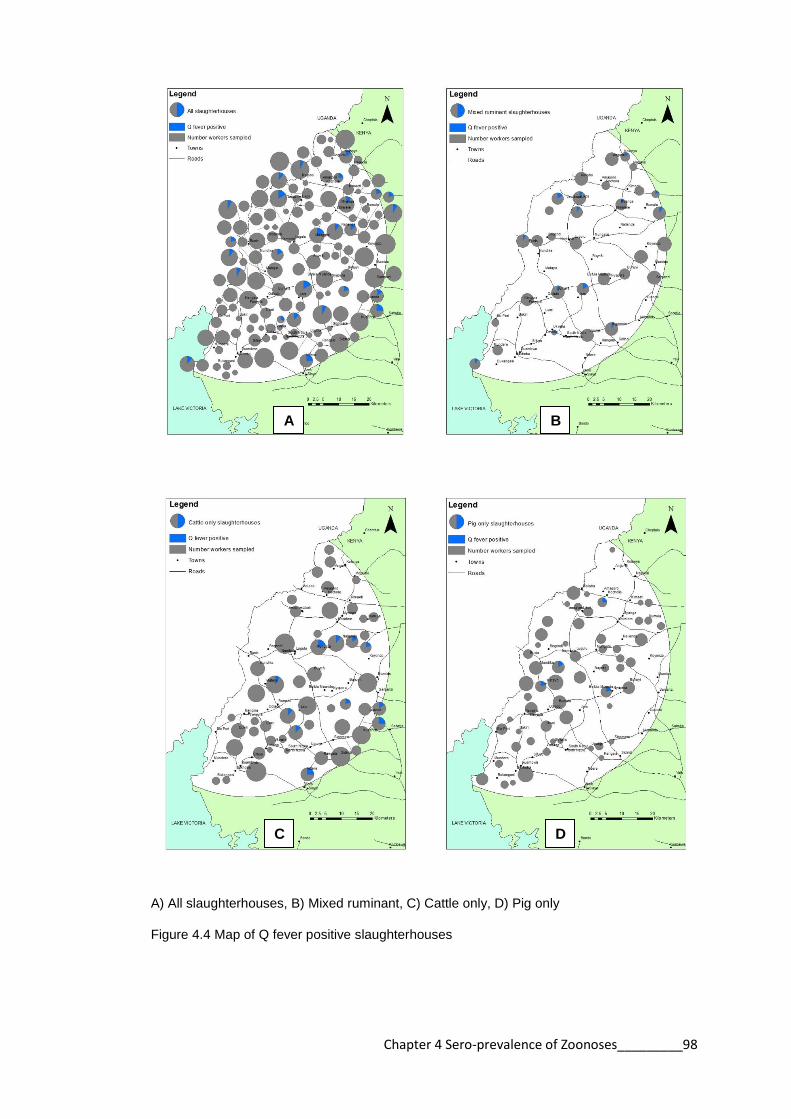
Chapter 4 Sero-prevalence of Zoonoses_________98
A) All slaughterhouses, B) Mixed ruminant, C) Cattle only, D) Pig only
Figure 4.4 Map of Q fever positive slaughterhouses
A B
C D

Chapter 4 Sero-prevalence of Zoonoses_________99
4.3.4 RVF
Table 4.4 shows the RVF prevalence in different slaughterhouse types corrected for
the design effect and the test sensitivity and specificity. The apparent prevalence
estimates were very low and not markedly different between slaughterhouse types.
The apparent prevalence estimates were 1.1% of mixed ruminant slaughterhouse
workers, 1.4% for cattle only slaughterhouse workers and 1.2% for pig only
slaughterhouse workers. Neither the design effect nor the test altered the apparent
prevalence markedly.
Figure 4.5 demonstrates histograms of the PI units from the RVF ELISA for each
slaughterhouse type. The histograms show a very small positive population with
positive results having very high PI values.
Figure 4.6 shows the location of the slaughterhouses and the number of RVF positive
workers. There was no statistical evidence of spatial clustering of positive
slaughterhouses (Appendix 6).
Mixed ruminant
n=274 (95% CI)
Cattle only
n=292 (95% CI)
Pig only n=171
(95% CI)
Individual level apparent
prevalence (n=737)
1.1 (0.3–3.2) 1.4 (0.5–3.5) 1.2 (0.3–4.1)
Individual result
adjusted for the design
effect (n=737)
1.4 (0–3.0) 1.2 (0–2.5) 1.0 (0–2.3)
Individual result
adjusted for test se/sp†
(n =737)
1.2 (0.1–2.9) 1.4 (0.2–3.1) 1.4 (0.1–3.8)
† se/sp sensitivity/specificity
Table 4.4 Rift Valley fever seroprevalence estimates for slaughterhouse workers

Chapter 4 Sero-prevalence of Zoonoses_________100
Figure 4.5 Histogram of RVF percentage inhibition (PI) values

Chapter 4 Sero-prevalence of Zoonoses_________101
All slaughterhouses, B) Mixed ruminant, C) Cattle only, D) Pig only
Figure 4.6 Map of Rift Valley fever positive slaughterhouses
A B
C D
Chapter 4 Sero-prevalence of Zoonoses_________102
4.3.5 Taenia
Table 4.5 shows the Taenia prevalence in different slaughterhouse types corrected
for the design effect and the test sensitivity and specificity. The greatest apparent
prevalence was recorded in workers from cattle only slaughterhouses (3.7%),
followed by pig only slaughterhouses (1.3%). The lowest prevalence was in mixed
ruminant slaughterhouse workers (0.4%). The design effect did not alter the
prevalence. However, accounting for the test sensitivity and specificity markedly
altered the individual prevalence in cattle only slaughterhouses from 3.7% to 0.7%.
The true prevalence of Taenia sp. in cattle only slaughterhouse workers (0.7%) is
similar to mixed ruminant slaughterhouse workers (0.5%) and pig only
slaughterhouse workers (0.9%).
Figure 4.7 demonstrates the OD values from the coproantigen ELISA. The blue line
indicates the positive cut-off. The histograms for each slaughterhouse show a very
small positive group with high OD values.
Figure 4.8 shows the location of the slaughterhouses and the number of Taenia
positive workers. There appears to be an absence of Taenia positive slaughterhouses
in the northern part of the study area. However, there was no statistical evidence of
spatial clustering of positive slaughterhouses (Appendix 6).

Chapter 4 Sero-prevalence of Zoonoses_________103
Mixed ruminant
n=261 (95% CI)
Cattle only n=273
(95% CI)
Pig only n=157
(95% CI)
Individual level
apparent prevalence
(n=691)
0.4 (0.01–2.1) 3.7 (2.0–6.6) 1.3 (0.4–4.5)
Individual result
adjusted for the
design effect (n=691)
0.4 (0–1.1) 3.7 (1.8–5.7) 1 (0–2.2)
Individual result
adjusted for test
se/sp† (n =691)
0.5 (0–1.8) 0.7 (0–2.6) 0.9 (0–3.1)
† se/sp sensitivity/specificity
Table 4.5 Taenia prevalence estimates for slaughterhouse workers
Figure 4.7 Histogram of coproantigen ELISA optical density (OD) values for slaughterhouse
workers

Chapter 4 Sero-prevalence of Zoonoses_________104
A) All slaughterhouses, B) Mixed ruminant, C) Cattle only, D) Pig only
Figure 4.8 Map of taeniasis positive slaughterhouses
A B
C D

Chapter 4 Sero-prevalence of Zoonoses_________105
4.3.6 Cysticercosis
Table 4.6 shows the cysticercosis prevalence in different slaughterhouse types
corrected for the design effect and the test sensitivity and specificity. The greatest
apparent seroprevalence was in pig only slaughterhouse workers (4.1%). Mixed
ruminant slaughterhouse workers had a seroprevalence of 2.6% and cattle only
slaughterhouse workers a seroprevalence of 1.7%. The apparent seroprevalence was
not markedly changed by the design effect. Accounting for the test imperfections did
change the seroprevalence estimates. Pig only slaughterhouse workers still had the
greatest true seroprevalence (1.4%).
Figure 4.9 demonstrates the OD values from the HP10 ELISA. The histograms for
each slaughterhouse type show a small positive population with moderately high OD
values.
Figure 4.10 shows the location of the slaughterhouses and the number of
cysticercosis positive workers. There was no statistical evidence of spatial clustering
of positive slaughterhouses (Appendix 6).

Chapter 4 Sero-prevalence of Zoonoses_________106
Mixed ruminant
n=274 (95% CI)
Cattle only
n=292 (95% CI)
Pig only n=171
(95% CI)
Individual level
apparent prevalence
(n=737)
2.6 (1.2–5.2) 1.7 (0.7–3.9) 4.1 (2.0–8.2)
Individual result
adjusted for design
effect (n=737)
3 (0.5–5.6) 1.8 (0.4–3.2) 4.2 (1.6–6.8)
Individual result
adjusted for test
se/sp† (n =737)
0.7 (0–2.3) 0.5 (0–1.8) 1.4 (0–4.7)
† se/sp sensitivity/specificity Table 4.6 Cysticercosis seroprevalence estimates for slaughterhouse workers
Figure 4.9 Histogram of HP10 ELISA optical density (OD) values for slaughterhouse workers
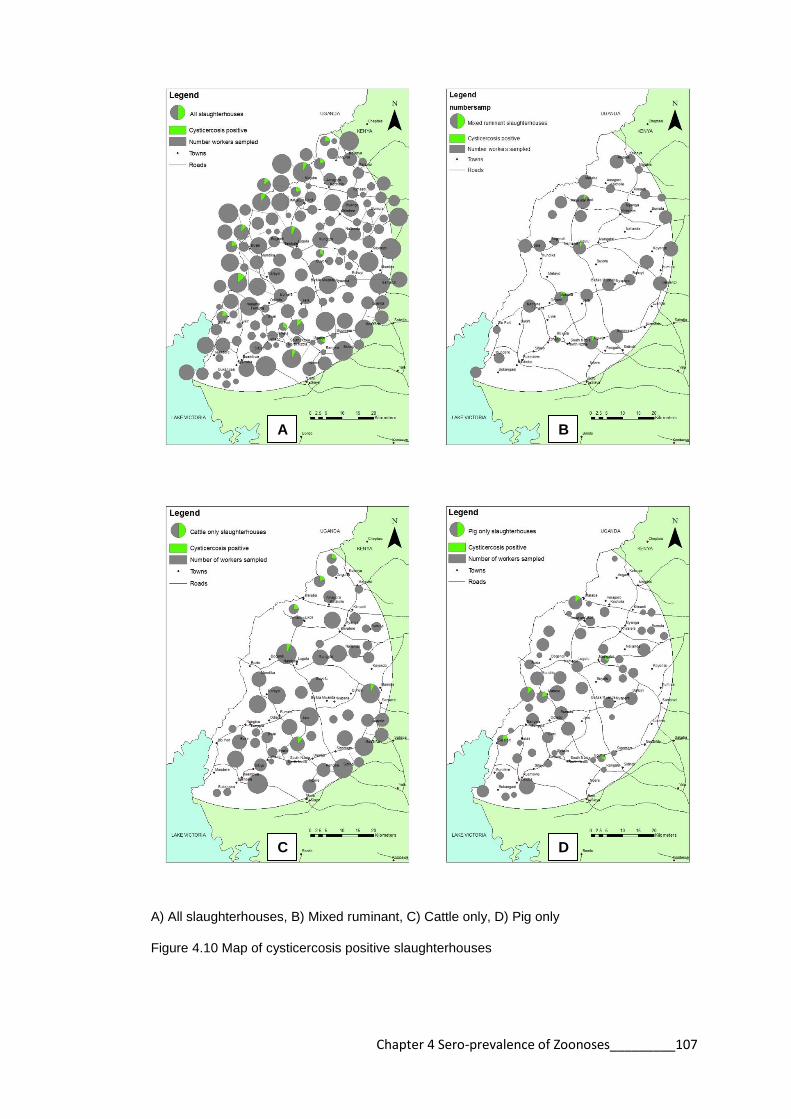
Chapter 4 Sero-prevalence of Zoonoses_________107
A) All slaughterhouses, B) Mixed ruminant, C) Cattle only, D) Pig only
Figure 4.10 Map of cysticercosis positive slaughterhouses
A B
C D

Chapter 4 Sero-prevalence of Zoonoses_________108
4.3.7 Slaughterhouse level disease prevalence
Table 4.7 shows the overall slaughterhouse level prevalence estimates. These data
were calculated for slaughterhouses that had at least one positive worker. The
apparent slaughterhouse level prevalence was 40.8% for leptospirosis and 19.7% for
Q fever. The apparent slaughterhouse level prevalence for RVF, cysticercosis, and
Taenia were lower: 5.6%, 12%, and 9.1% respectively. The apparent slaughterhouse
level seroprevalence for brucellosis was 0.7%.
Disease Apparent prevalence
(95% CI) n=142
Brucellosis 0.7 (0.04–0.9)
Leptospirosis 40.8 (33.1–49.1)
Q fever 19.7 (14.0–27.0)
RVF 5.6 (2.9–10.7)
Taenia 9.1 (5.4–15.0)
Cysticercosis 12.0 (7.6–18.3)
Table 4.7 Slaughterhouse level apparent and adjusted prevalence to 6 zoonoses
Table 4.8 indicates the slaughterhouse level apparent prevalence of each disease for
the 3 slaughterhouse types. Mixed ruminant slaughterhouses had higher apparent
prevalence estimates than cattle only and pig only slaughterhouses for all diseases
except taeniasis. At the slaughterhouse level there is marked difference between
prevalence levels for taeniasis among slaughterhouse types. The apparent prevalence
is greatest in cattle only slaughterhouses (17%).
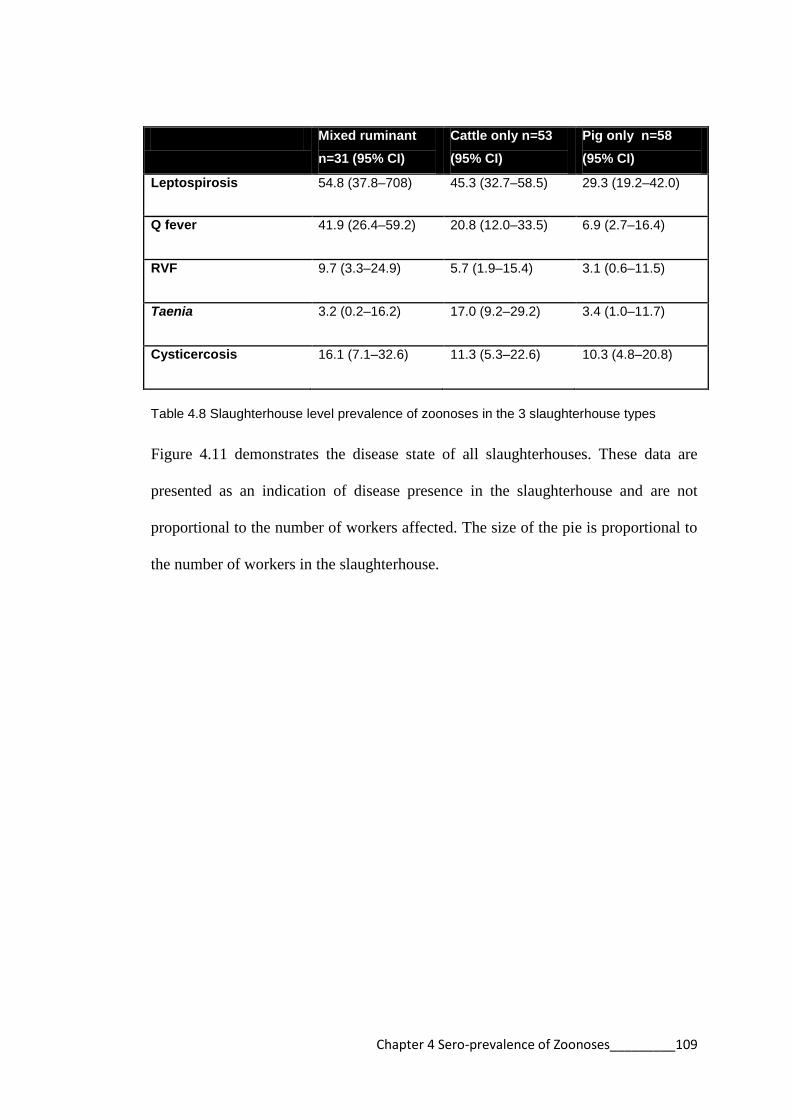
Chapter 4 Sero-prevalence of Zoonoses_________109
Mixed ruminant
n=31 (95% CI)
Cattle only n=53
(95% CI)
Pig only n=58
(95% CI)
Leptospirosis 54.8 (37.8–708) 45.3 (32.7–58.5) 29.3 (19.2–42.0)
Q fever 41.9 (26.4–59.2) 20.8 (12.0–33.5) 6.9 (2.7–16.4)
RVF 9.7 (3.3–24.9) 5.7 (1.9–15.4) 3.1 (0.6–11.5)
Taenia 3.2 (0.2–16.2) 17.0 (9.2–29.2) 3.4 (1.0–11.7)
Cysticercosis 16.1 (7.1–32.6) 11.3 (5.3–22.6) 10.3 (4.8–20.8)
Table 4.8 Slaughterhouse level prevalence of zoonoses in the 3 slaughterhouse types
Figure 4.11 demonstrates the disease state of all slaughterhouses. These data are
presented as an indication of disease presence in the slaughterhouse and are not
proportional to the number of workers affected. The size of the pie is proportional to
the number of workers in the slaughterhouse.
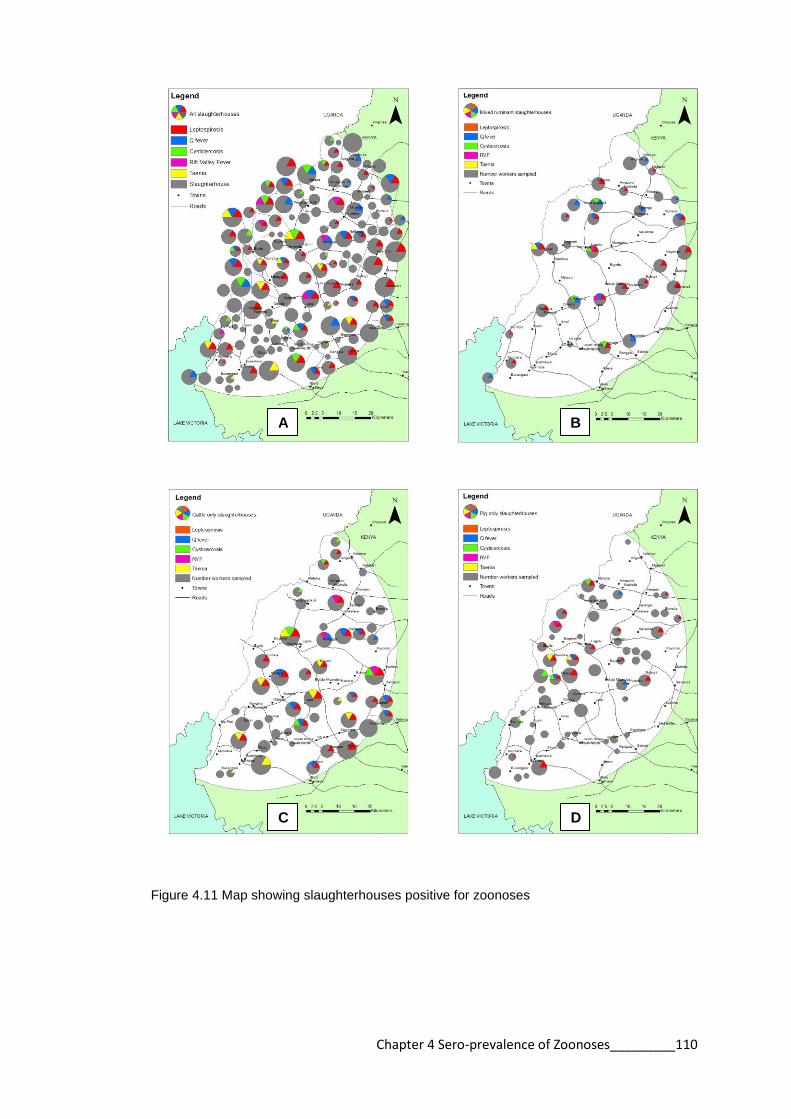
Chapter 4 Sero-prevalence of Zoonoses_________110
Figure 4.11 Map showing slaughterhouses positive for zoonoses
A B
C D

Chapter 4 Sero-prevalence of Zoonoses_________111
4.4 Discussion
The seroprevalence results are presented as apparent prevalence estimates and
adjusted for design and test imperfections. It appears from this study that the design
effect is largely unimportant as the clustered sampling design had little effect on
seroprevalence estimates. The effect of the test sensitivity and specificity was more
important. The test results for each disease will be discussed separately.
4.4.1 Brucellosis
There is almost a complete absence of brucellosis in slaughterhouse workers in the
study area as only one individual (0.1%) was positive on the RBT. This result is in
marked contrast to studies from neighbouring countries Uganda, Tanzania and
Sudan, where brucellosis has been reported in slaughterhouse workers with
seroprevalence rates respectively of 10%, 5.5% and 9% (Nabukenya et al., 2013,
Swai and Schoonman, 2009, Omer et al., 2010).
Infection in people is related to carriage of the organism in animals and Kenya is an
endemic region for brucellosis in livestock (McDermott and Arimi, 2002, Pappas et
al., 2006). The absence of brucellosis in slaughterhouse workers in western Kenya is
likely due to the nature of the farming system and low prevalence rates in animals in
the region. There is a wide range of brucellosis seropositivity across different regions
in Kenya. Animals grazed in large herds on community land are more likely to be
seropositive than those in smaller herds (Kadohira et al., 1997). The production
system in western Kenya is small farms with small herds which may not maintain the
organism (Muma et al., 2012, Matope et al., 2010). This result is supported by the
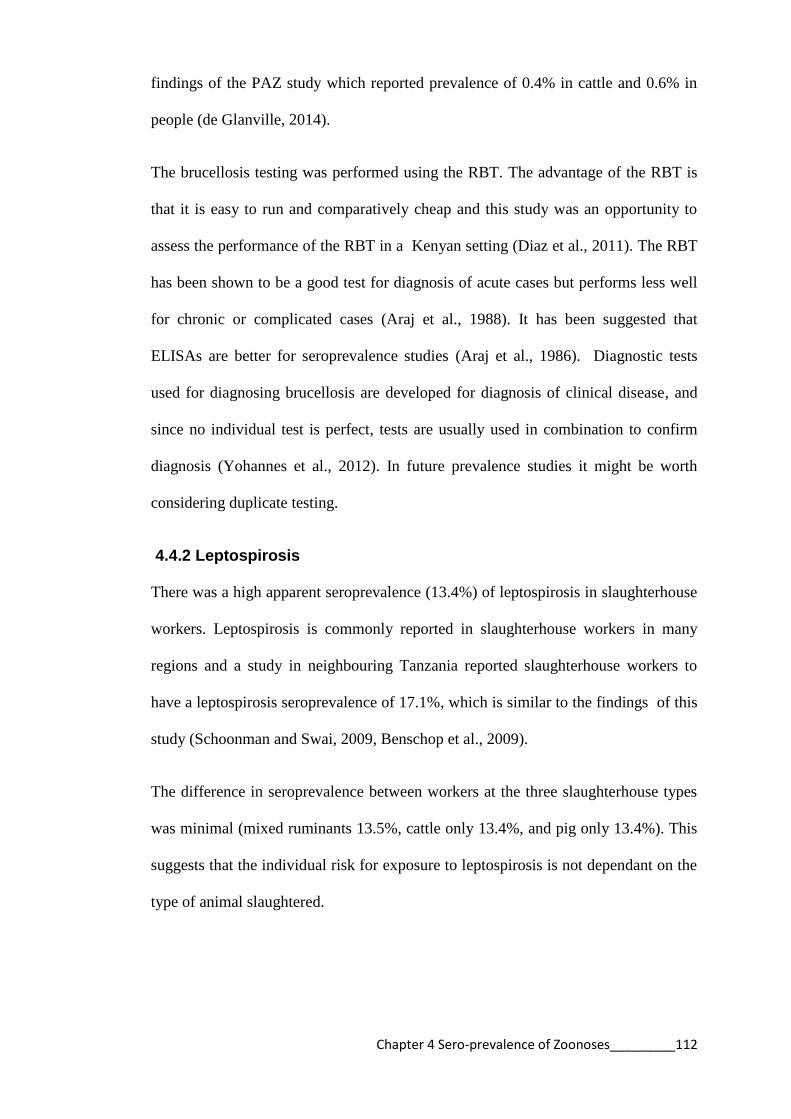
Chapter 4 Sero-prevalence of Zoonoses_________112
findings of the PAZ study which reported prevalence of 0.4% in cattle and 0.6% in
people (de Glanville, 2014).
The brucellosis testing was performed using the RBT. The advantage of the RBT is
that it is easy to run and comparatively cheap and this study was an opportunity to
assess the performance of the RBT in a Kenyan setting (Diaz et al., 2011). The RBT
has been shown to be a good test for diagnosis of acute cases but performs less well
for chronic or complicated cases (Araj et al., 1988). It has been suggested that
ELISAs are better for seroprevalence studies (Araj et al., 1986). Diagnostic tests
used for diagnosing brucellosis are developed for diagnosis of clinical disease, and
since no individual test is perfect, tests are usually used in combination to confirm
diagnosis (Yohannes et al., 2012). In future prevalence studies it might be worth
considering duplicate testing.
4.4.2 Leptospirosis
There was a high apparent seroprevalence (13.4%) of leptospirosis in slaughterhouse
workers. Leptospirosis is commonly reported in slaughterhouse workers in many
regions and a study in neighbouring Tanzania reported slaughterhouse workers to
have a leptospirosis seroprevalence of 17.1%, which is similar to the findings of this
study (Schoonman and Swai, 2009, Benschop et al., 2009).
The difference in seroprevalence between workers at the three slaughterhouse types
was minimal (mixed ruminants 13.5%, cattle only 13.4%, and pig only 13.4%). This
suggests that the individual risk for exposure to leptospirosis is not dependant on the
type of animal slaughtered.

Chapter 4 Sero-prevalence of Zoonoses_________113
There was a higher prevalence of leptospirosis in mixed ruminant slaughterhouses
(54.8%) than the other slaughterhouse types when considering the slaughterhouse as
a single unit. This result may be related to slaughterhouse size. It was shown in
Chapter 3 that mixed ruminant slaughterhouses have more workers and slaughter a
greater number of animals than the other slaughterhouse types. The higher passage of
animals through the slaughterhouse may explain the increased prevalence of disease
in this subgroup. However it was also shown in Chapter 3 that mixed ruminant
slaughterhouses have improved facilities and practices in relation to the other
slaughterhouse types. In theory, the improved facilities and practices should lead to a
lower prevalence. There may be other unexplored factors that contribute to the
increased prevalence of disease in this subgroup of slaughterhouses. The risk factors
for leptospirosis in slaughterhouse workers will be examined in the next chapter.
There did not appear to be any geographical clustering of the positive
slaughterhouses. There is often spatial clustering of leptospirosis associated with a
point source infection, such as an infected water source (Barcellos and Sabroza,
2001, Soares et al., 2010). This situation does not appear to be the case with
slaughterhouse workers in western Kenya. The findings of this study are consistent
with workers being occupationally exposed rather than exposed to a contaminated
water source.
The seroprevalence in the PAZ community for leptospirosis was 4.8%, which is
markedly lower than the prevalence in slaughterhouse workers of 13.4%. These data
suggest that slaughterhouse workers are more exposed to leptospirosis. This result
will be explored further in Chapter 7.

Chapter 4 Sero-prevalence of Zoonoses_________114
This study used a commercial IgM ELISA on a single serum sample to determine
seropositivity. Although the MAT is considered the gold standard for leptospirosis
diagnosis, the complexity of the test limits its use to reference laboratories, so
commercial IgM ELISAs are used commonly in resource poor settings (Budihal and
Perwez, 2014, Adler et al., 1980). Sensitivity of the ELISA compared with MAT is
generally good overall, although there is the possibility of regional variation, and
although the ELISA detects antibodies to a range Leptospira, it does not distinguish
between serovars (Bajani et al., 2003, Winslow et al., 1997, Adler et al., 1980).
The performance of the IgM ELISA has yet to be determined in a Kenyan setting. It
is impossible to determine without reference to a “gold standard” the performance of
the ELISA in this region. The ELISA was developed to detect antibodies to a wide
range of leptospiral antigens. However, it is possible that the ELISA may not detect
the serovars common in this environment which would affect the sensitivity of this
test (Effler et al., 2002). The distribution of the Panbio units for the Panbio
leptospira IgM ELISA did not demonstrate a clear distinction between the negative
and positive results using the manufacturer’s cut-off. There were a large number of
equivocal results. Other studies in endemic tropical areas have raised concerns over
the use of the Panbio leptospirosis ELISA for diagnosis of clinical leptospirosis in
these settings. People in these regions are likely to have persistent antibodies to
leptospirosis that will impair the accuracy of the test in diagnosing acute cases
(Desakorn et al., 2012, Blacksell et al., 2006). Although clinical diagnosis is not an
issue for this study, previously exposed individuals may explain the large number of
“equivocal” results.

Chapter 4 Sero-prevalence of Zoonoses_________115
4.4.3 Q fever
The apparent seroprevalence for Q fever in slaughterhouse workers was 4.5%.
Published reports of Q fever in slaughterhouse workers have reported seroprevalence
estimates ranging from 12–90% (Cetinkaya et al., 2000, Perez-Trallero et al., 1995,
Riemann et al., 1975, Van Peenen et al., 1978). It is difficult to compare
seroprevalence reports across regions because different tests are used (Blaauw et al.,
2012).
Q fever apparent seroprevalence was higher in workers in mixed ruminant (6.2%)
and cattle only slaughterhouses (4.1%) than pig only slaughterhouses (2.3%). These
data are consistent with the source of infection being animals at the ruminant (cattle,
goats, sheep) slaughterhouses (Raoult and Marrie, 1995). Working in a pig
slaughterhouse is not a known risk factor for Q fever (Australian Government, 2013).
The apparent prevalence at the slaughterhouse level is markedly higher in mixed
ruminant slaughterhouses, which further support the hypothesis that workers are
exposed to infected animals (cattle, goats, sheep) at work. The risk factors for Q
fever exposure will be investigated further in Chapter 5.
The adjusted Q fever seroprevalence in the PAZ community was 2.2% (de Glanville,
2014) compared to 4.5% in slaughterhouse workers. This disparity suggests that
slaughterhouse workers are more exposed to Q fever than the general population.
This result will be explored further in Chapter 7.
There was no apparent geographical clustering of Q fever positive slaughterhouses,
which again points to exposure at the slaughterhouse and not another point source.

Chapter 4 Sero-prevalence of Zoonoses_________116
Point source outbreaks of Q fever have been associated with proximity to goat farms
(Roest et al., 2011)
The results of the Serion Classic C. burnetii IgG Phase 2 ELISA OD show a large
negative population and a small positive population. The ELISA used in this study
has good sensitivity and specificity for detection of Q fever Phase 2 antibodies and is
recommended for serological surveillance (Peter et al., 1987). However, as in all
cases it is possible that during convalescence antibodies fall below the cut off
(Blaauw et al., 2012). Antibodies also fall after treatment (Peter et al., 1988). The
treatment for Q fever is doxycycline. In Kenya tetracyclines (including doxycycline)
are the second most dispensed antibiotics (Global Antibiotic Resistance Partnership,
2011) so even if misdiagnosed, it is possible that Q fever patients may receive
effective treatment. This may result in an underestimation of the number of Q fever
positive cases in the population.
4.4.4 RVF
The apparent seroprevalence for RVF in the slaughterhouse workers was 1.2%. The
numbers of seropositive workers for RVF initially seem quite low but these results
are comparable to other studies that have been conducted in RVF endemic areas. For
example, in Egypt and Saudi Arabia, seroprevalence to RVF in slaughterhouse
workers was 2% and 0.72% respectively (Abu-Elyazeed et al., 1996, Azhar et al.,
2010).
There was no difference in apparent seroprevalence between the slaughterhouse
types (Table 4.4). These data suggest that exposure may not occur in the
slaughterhouse. Furthermore, as the virus is predominantly carried by ruminants
Chapter 4 Sero-prevalence of Zoonoses_________117
there should be an increased prevalence in mixed ruminant and cattle only
slaughterhouses. This distinction is not documented in this study.
RVF virus has never been described before in western Kenya. This study reports a
number of people in western Kenya to be historically exposed to RVF but it cannot
make conclusions about where the individuals encountered the virus. There is no
obvious geographic relationship between positive cases. It is possible that the
seropositive workers were affected with RVF outside the study area. Further
investigation of RVF seropositivity in the community was conducted as part of the
PAZ study and the apparent prevalence was 1.5%. This prevalence is similar to the
findings in slaughterhouse workers, suggesting that slaughterhouse workers are not
more exposed than the community.
In relation to other areas in Kenya where RVF is considered enzootic, studies have
shown the inter-epidemic seroprevalence to be between 1 and 19% (LaBeaud et al.,
2007). Antibodies to RVF are likely to be life-long so the presence of IgG antibodies
is indicative of historical exposure (Findlay and Howard, 1951). This is particularly
valuable information for serological surveys in areas where seroprevalence is low
(LaBeaud et al., 2007). This result suggests that it is epidemiologically plausible that
RVF virus is circulating in western Kenya.
In regard to the BDSL RVF cELISA it is a technically demanding test and required
extensive optimisation in our laboratory. It is not a suitable test for a one-off study of
seroprevalence.
Chapter 4 Sero-prevalence of Zoonoses_________118
4.4.5 Taenia
The prevalence estimates for taeniasis (1.8%) are lower than previous reports of
taeniasis in the region. A previous study found the carriage of Taenia sp. eggs by
faecal examination to be 3.2% (Kagira et al., 2011). The PAZ study reported a
prevalence of 19.7% in the community using the coproantigen ELISA (de Glanville,
2014). These results suggest that slaughterhouse workers are not at particular risk of
exposure to Taenia sp.
The route of exposure to Taenia is different to the other pathogens since the
intermediate stage is ingested in meat. The prevalence of bovine cysticercosis is high
in Kenya which means transmission risk is high (Onyango-Abuje et al., 1996). It is
possible that slaughterhouse workers are more selective about the meat they eat as
they can see the lesions at slaughter or they cook the meat well enough to destroy the
infective larvae.
The apparent prevalence is greatest in cattle slaughterhouses suggesting infection
with T. saginata over T. solium. However when accounting for the test sensitivity
and specificity, the true prevalence in cattle only slaughterhouse workers is the
similar to that of mixed ruminant and pig only slaughterhouses. This similarity
suggests a large number of false positives in the original results. Copro PCR has
improved specificity and should be considered as an alternative test (Praet et al.,
2013).
There was no apparent clustering of slaughterhouses that had taeniasis positive
workers, which is consistent with the PAZ findings that human taeniasis in the
community is not spatially clustered (Thomas, 2013).

Chapter 4 Sero-prevalence of Zoonoses_________119
At the slaughterhouse level, the apparent prevalence for taeniasis is greatest in cattle
only slaughterhouses. This result did not take into account the test sensitivity or
specificity. A hierarchical Bayesian model would be required to calculate the true
prevalence which was beyond the scope of this thesis (Scolamacchia et al., 2010).
The coproantigen ELISA is twice as effective in detecting cases of taeniasis
compared to microscopy (Allan and Craig, 2006). However, the sensitivity and
specificity of the ELISA is still relatively poor. It is important to consider that at such
a low prevalence this test is likely to have low positive predictive value and hence
reduce confidence in the results.
4.4.6 Cysticercosis
The seroprevalence of cysticercosis in slaughterhouse workers was 2.6%. The results
are lower than expected in this population. Other studies in this area found
prevalence up to 10% in the region (Mafojane et al., 2003). This discrepancy may be
related to the age and/or gender of the population, as seroprevalence rates are greater
in women and children than adult men (Mafojane et al., 2003, Mwanjali et al., 2013).
The prevalence in the PAZ adjusted population was 6.6% but, when adjusted for the
study design and test sensitivity and specificity, the reported prevalence was 0.8%
(Thomas, 2013). This result is similar to the findings of cysticercosis in
slaughterhouse workers. Exposure to cysticercosis is not related to working in the
slaughterhouse, as transmission requires contact with a T. solium tapeworm carrier.
This study suggests that working in the slaughterhouse is not a risk for cysticercosis.
This result is supported by other studies that have shown that slaughtering is not a
significant risk factor for cysticercosis (Sikasunge et al., 2007).

Chapter 4 Sero-prevalence of Zoonoses_________120
The greatest seroprevalence was found in workers at pig only slaughterhouses, which
is consistent with workers having more access to meat from pigs and potentially
being self infected or exposed to tapeworm carriers.
The HP10 Antigen ELISA is a cost effective tool for screening for cysticercosis as
the alternatives are extensive radiological diagnostics (Fleury et al., 2007). Similarly
to the taeniasis results, the positive predictive value in this circumstance is likely to
be low, reducing confidence in the test results.
Chapter 4 Sero-prevalence of Zoonoses_________121
4.5 Conclusion
This report is the first to chronicle the prevalence of a range of zoonotic pathogens in
slaughterhouse workers in Kenya. A number of these diseases have not been reported
in the Kenyan population for many years, with some of the most recent reports of
disease from tourists who have been diagnosed in their country of origin (Potasman
et al., 2000, Hadda et al., 2009). The results suggest that exposure to these pathogens
is occurring in western Kenya which address the first hypothesis of this chapter.
The results indicate that slaughterhouse workers are more exposed to leptospirosis
and Q fever than the general population. This result answers the second hypothesis of
this chapter. This outcome will be explored in greater detail for these diseases in
subsequent chapters. RVF is described in the study area for the first time which
raises interesting questions about the maintenance of this pathogen in western Kenya
and is a topic that will require further study. The prevalence of brucellosis was much
lower than expected and again points to the need for a greater understanding of the
maintenance of brucellosis in smallholder farming situations in sub-Saharan Africa.
The prevalence of taeniasis and cysticercosis were lower than expected and disproves
the author’s hypothesis that slaughterhouse workers may be more exposed to these
pathogens through their work.
There is a need for well-performing diagnostic tests in order to make conclusions
from serological studies, although at low prevalence even well-performing tests will
be affected by low positive predictive values. The majority of tests used for the
diagnosis of zoonotic disease are developed and tested in a clinical setting for acute
cases where they have a high sensitivity and specificity (Lijmer et al., 1999). In a

Chapter 4 Sero-prevalence of Zoonoses_________122
clinical setting the persistence of antibodies can be a hindrance to diagnosis, whereas
in a serological survey it is valuable to assess the historical exposure to certain
pathogens. It is important to note that antibodies reduce with time and titres go down
after successful treatment which makes assessment of past exposure difficult in
serological surveys (Peter et al., 1988). However, occupational groups that have
constant exposure may have higher titres, which is particularly relevant in this
circumstance (Cumberland et al., 2001). No conclusions can be made about the
current clinical status of workers for this reason.
Many of the diseases tested in this study are misdiagnosed as malaria (Crump et al.,
2013, Prabhu et al., 2011). Workers are not likely to know that they have had these
zoonotic infections and may receive inappropriate treatment for the conditions
(Knobel et al., 2013). Doxycycline is first line treatment for Q fever, brucellosis, and
leptospirosis and is a readily available and cheap antibiotic. Tetracyclines (including
doxycycline) are the second most dispensed antibiotic in Kenya so it is possible that
people are treated effectively without intent or proper diagnosis.
In this communication we have reported seroprevalence of 6 zoonotic diseases in
slaughterhouse workers and the limitations to interpretation. Greater awareness
regarding the epidemiology of zoonotic diseases in rural settings in sub-Saharan
Africa is required in order to develop appropriate control measures. The subsequent
chapter will examine risk factors for exposure to zoonotic diseases in slaughterhouse
workers in an effort to identify areas to focus control efforts.

Chapter 5 Risk factors for zoonoses in slaughterhouse workers____ 123
Chapter 5
Risk factors for exposure to leptospirosis
and Q fever in slaughterhouse workers in
western Kenya

Chapter 5 Risk factors for zoonoses in slaughterhouse workers____ 124
5.1 Introduction
Leptospirosis and Q fever in slaughterhouse workers have been identified in
prevalence investigation studies and also outbreak response studies in different parts
of the world (Campagnolo et al., 2000, Terry et al., 2000, Carrieri et al., 2002,
Wilson et al., 2010). The risk factors identified for exposure to leptospirosis in
slaughterhouse workers are: smoking and drinking whilst at work, cleaning the
intestines, and the role/position of the worker in the slaughterhouse (Chan et al.,
1987, Campagnolo et al., 2000, Dreyfus et al., 2014). In contrast, the only risk factor
identified for Q fever in slaughterhouse workers is the position or job within the
slaughterhouse (Wilson et al., 2010, Riemann et al., 1975).
In this chapter, risk factors for leptospirosis and Q fever exposure in slaughterhouse
workers in western Kenya are explored. The hypotheses tested are:
1. work position/role in the slaughterhouse is a risk for zoonotic disease
seropositivity in slaughterhouse workers
2. inadequate facilities and poor sanitation in slaughterhouses are risk
factors for zoonotic disease seropositivity in workers
3. poor personal hygiene at slaughterhouses are risks for zoonotic disease
seropositivity in workers.
The aim of this study is to identify practices that predispose workers to zoonotic
disease and to recommend control measures to reduce exposure to these pathogens.
Chapter 5 Risk factors for zoonoses in slaughterhouse workers____ 125
5.2 Methods
5.2.1. Study area and population
The study site and location of slaughterhouses is shown in Figure 3.1. The
recruitment of slaughterhouse workers from the participating slaughterhouses is
described in Section 2.5.
5.2.2. Data collection
Data collection and sample collection procedures are described in Section 2.5.
5.2.3 Laboratory analysis
Parasitological analyses of blood and faecal samples were conducted at the ILRI
laboratory in Busia as described in Section 2.6. At the ILRI laboratory in Nairobi
serum samples were tested for leptospirosis and Q fever. The Panbio Leptospira IgM
ELISA (Alere, Sinnamon Park, Australia) was used to test serum samples for
Leptospira antibodies (Winslow et al., 1997). The Serion ELISA Classic Coxiella
burnetii IgG phase 2 (Virion/Serion. Würzburg, Germany) was used to test for Q
fever (Peter et al., 1988). The diagnostic tests are described in detail in Section 2.7.2
and Section 2.7.3. EDTA samples were tested for HIV using the SD Bioline test
(Standard Diagnostics Inc) (Vijayakumar et al., 2005).
5.2.4 Statistical analysis
Questionnaire data and laboratory results were entered into Microsoft Access® 2007
databases. Statistical analysis was performed in R (http://CRAN.R-project.org/).

Chapter 5 Risk factors for zoonoses in slaughterhouse workers____ 126
5.2.5 Logistic regression model
Multivariable logistic regression models were used to identify risk factors for
leptospirosis and Q fever in slaughterhouse workers and estimate the strength of the
relationship with the outcome. The steps in the development of the multivariable
model were:
1. Univariable logistic regression was used to compare slaughterhouse types
to determine if there was a significant difference between the odds for
exposure dependant on the type of slaughterhouse
2. Univariable logistic regression was used to screen variables against
disease exposure at the individual level. Variables were included from
both the individual and slaughterhouse level data. The variables used are
listed in Appendix 8.
Variables were excluded from analysis if they were strongly correlated
with another variable of interest to avoid multicollinearity problems and
model estimate instability. Correlation analysis for categorical variables
was performed by calculating the phi coefficient of correlation in the
psych package (Revelle, 2014) in R. Paired variables with a phi
coefficient >0.5 were considered highly correlated and the variable that
generated the highest p-value during univariable logistic regression
analysis was excluded.
3. Variables with a p-value <0.2 in the univariable analysis were used to
develop a multivariable logistic regression model for each exposure. A
multivariable mixed effects logistic regression model was used to account
Chapter 5 Risk factors for zoonoses in slaughterhouse workers____ 127
for the clustering of the workers within slaughterhouses. The model was
developed using glmer function in the lme4 package (Bates, 2014).
4. A backwards stepwise approach was used for model selection. Starting
with a full model using all predictors, variables with the highest p-value
were dropped in a stepwise fashion. This process was repeated until the
model with the lowest Akaikes second-order information criterion (AIC)
was identified.
5. The ORs, CIs, and p-values were calculated from the model.
5.2.6 Diagnostic checking of multivariable mixed effects model
The traditional approaches for model checking procedures cannot account for the
random effects in mixed effects models. Therefore a number of different approaches
were used for model checking.
1. Variance Inflation Factors (VIFS) were calculated to check for
collinearity. VIFS >4 were considered a problem and the variable
removed from the model
2. Moran’s I were calculated to check for spatial autocorrelation using the
ape package (Paradis E., 2004)
3. Histograms of the group level residuals were made to check for normality
4. The mixed effects models were simplified to the basic model that
included only the disease outcome and the slaughterhouse. A second
model was made using only the individual level factors and finally the
complete fitted multivariable mixed effect model. Median odds ratios
(MOR) were calculated for the three models and compared (Merlo et al.,
2005)

Chapter 5 Risk factors for zoonoses in slaughterhouse workers____ 128
5. Percentage change in variance (PCV) was calculated between the three
models (Merlo et al., 2005)
VA=variance in the empty model and VB=variance of model with
explanatory variables

Chapter 5 Risk factors for zoonoses in slaughterhouse workers____ 129
5.3 Results
5.3.1 Leptospirosis
a. Comparison between slaughterhouse types
The OR for leptospirosis seropositivity in workers from cattle only slaughterhouses
was 0.99 and in workers from pig only slaughterhouses was 1.00 when compared to
workers from mixed ruminant slaughterhouses. There was not a significant
difference between slaughterhouse types so logistic regression models were created
with all slaughterhouse workers as one group (Table 5.1).
Slaughterhouse type OR (95% CI) p-value
Mixed ruminant 1 Ref
Cattle only 0.99 (0.56–1.75) 0.960
Pig only 1.00 (0.52–1.89) 0.989
Table 5.1 Odds ratios for leptospirosis between slaughterhouse types
b. Univariable logistic regression
The complete univariable analysis for risk factors for leptospirosis seropositivity in
slaughterhouse workers included 100 potential exposure variables. Table 5.2 lists the
variables regarding personal history that had a p-value <0.2 in the univariable
analysis. Variables that were significantly associated with leptospirosis seropositivity
in slaughterhouse workers after univariable analysis were: having wounds at the time
of examination (OR 3.2; 95% CI 1.7–6.0); being HIV positive (OR 0.3; 95% CI 0.1–
0.8); smoking (OR 1.7; 95% CI 1.1–2.8) and drinking alcohol (OR 1.7; 95% CI 1.0–
2.7).

Chapter 5 Risk factors for zoonoses in slaughterhouse workers____ 130
Variable % population (n) % positive (n) OR (95% CI) n=737 p–value
Other job
Other 59.3 (437) 15.3 (67) 1 Ref
Butcher 40.7 (300) 10.7 (32) 0.6 (0.4–1.0) 0.063
Goat contact outside of work
No 59.7 (440) 15.0 (66) 1 Ref
Yes 40.3 (297) 11.1 (33) 0.7 (0.4–1.1) 0.133
Pig contact outside of work
No 63.1 (465) 15.3 (71) 1 Ref
Yes 36.9 (272) 10.3 (28) 0.6 (0.4–1.1) 0.055
Pigs owned
No 70.0 (516) 14.7 (76) 1 Ref
Yes 30.0 (221) 10.4 (23) 0.67 (0.4–1.1) 0.136
Private borehole for water in the home
No 91.9 (677) 12.9 (87) 1 Ref
Yes 8.1 (60) 0.2 (12) 1.7 (0.9–3.5) 0.132
HIV
No 87.9 (648) 14.7 (95) 1 Ref
Yes 12.1 (89) 4.5 (4) 0.3 (0.1–0.8) 0.013
Have wounds at the time of examination
No 92.4 (681) 12.0 (82) 1 Ref
Yes 7.6 (56) 30.4 (17) 3.2 (1.7–6.0) <0.001
Clinic visit in past 3 months
No 82.5 (608) 14.5 (88) 1 Ref
Yes 17.5 (129) 8.5 (11) 0.6 (0.3–1.1) 0.086
Smoke
No 76.5 (564) 11.7 (66) 1 Ref
Yes 23.5(173) 19.1 (33) 1.7 (1.1–2.8) 0.024
Take alcohol daily
No 37.3 (275) 9.8 (27) 1 Ref
Yes 62.7 (462) 15.6 (72) 1.7 (1.0–2.7) 0.040
Table 5.2 Odds ratios for leptospirosis in slaughterhouse workers examining personal history
variables and health

Chapter 5 Risk factors for zoonoses in slaughterhouse workers____ 131
Table 5.3 lists the variables regarding individual slaughterhouse practices that had a
p-value <0.2 in the univariable analysis screening. Variables that were significantly
associated with leptospirosis seropositivity in slaughterhouse workers after
univariable analysis were: cleaning the intestines (OR 3.2; 95% CI 1.6–6.7); eating at
the slaughterhouse (OR 1.7; 95% CI 1.0–3.0); working at a slaughterhouse where
animals were pre-examined before slaughter (OR 0.6; 95% CI 0.4–1.0).
Variable % population (n) % positive (n) OR (95% CI) n=737 p–value
Job in the slaughterhouse
Other 94.3 (695) 12.4 (86) 1 Ref
Cleans intestines 5.7 (42) 31.0 (13) 3.2 (1.6–6.7) 0.001
Wear protective clothing
No 30.8 (227) 16.7 (38) 1 Ref
Yes 69.2 (510) 12.0 (61) 0.6 (0.4–1.0) 0.071
Eat at the slaughterhouse
No 80.5 (593) 12.1 (72) 1 Ref
Yes 19.5 (144) 18.8 (27) 1.7 (1.0–3.0) 0.049
Antemortem exam
No 55.8 (411) 15.8 (65) 1 Ref
Yes 44.2 (326) 10.4 (34) 0.6 (0.4–1.0) 0.048
Table 5.3 Odds ratios for leptospirosis in slaughterhouse workers examining individual
slaughterhouse practices
Table 5.4 lists the variables regarding slaughterhouse level practices that had a p-
value <0.2 in the univariable analysis screening. Variables that were significantly
associated with leptospirosis seropositivity in slaughterhouse workers after
univariable analysis were: working in a slaughterhouse with more than 5 workers
(OR 1.9; 95% CI 1.0–3.8); and working in a slaughterhouse where workers wear
protective clothing (OR 0.6; 95% CI 0.3–0.9).
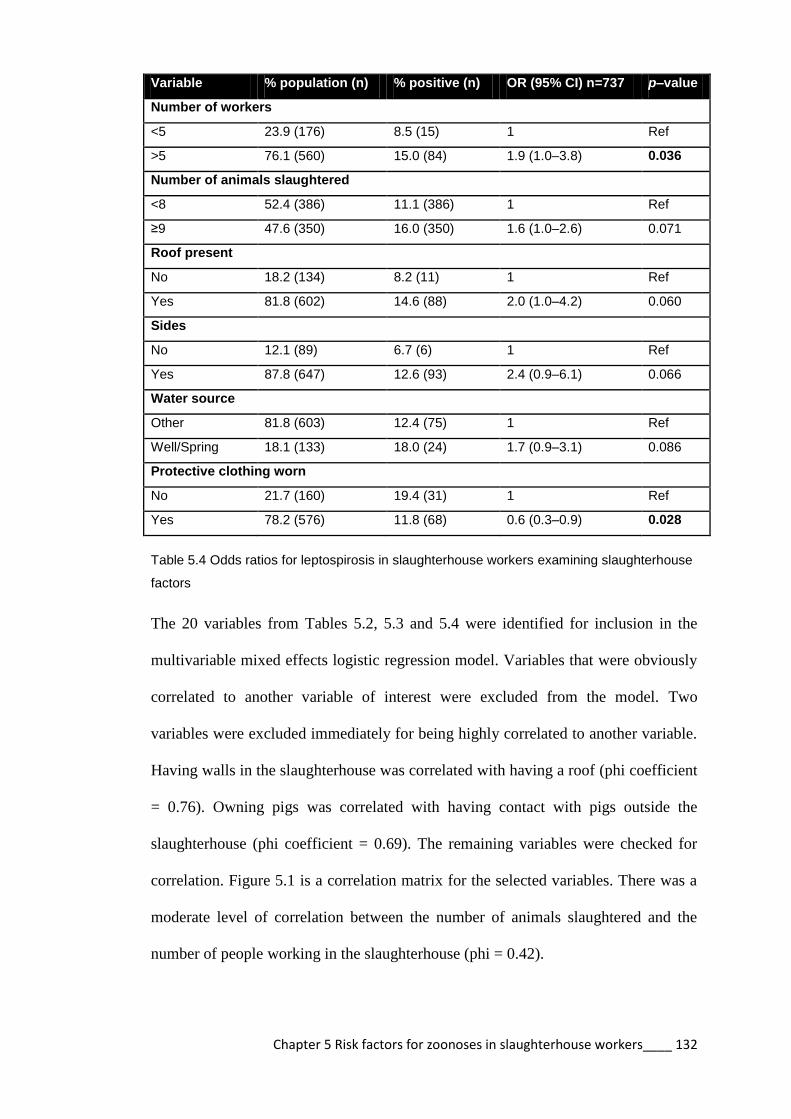
Chapter 5 Risk factors for zoonoses in slaughterhouse workers____ 132
Variable % population (n) % positive (n) OR (95% CI) n=737 p–value
Number of workers
<5 23.9 (176) 8.5 (15) 1 Ref
>5 76.1 (560) 15.0 (84) 1.9 (1.0–3.8) 0.036
Number of animals slaughtered
<8 52.4 (386) 11.1 (386) 1 Ref
≥9 47.6 (350) 16.0 (350) 1.6 (1.0–2.6) 0.071
Roof present
No 18.2 (134) 8.2 (11) 1 Ref
Yes 81.8 (602) 14.6 (88) 2.0 (1.0–4.2) 0.060
Sides
No 12.1 (89) 6.7 (6) 1 Ref
Yes 87.8 (647) 12.6 (93) 2.4 (0.9–6.1) 0.066
Water source
Other 81.8 (603) 12.4 (75) 1 Ref
Well/Spring 18.1 (133) 18.0 (24) 1.7 (0.9–3.1) 0.086
Protective clothing worn
No 21.7 (160) 19.4 (31) 1 Ref
Yes 78.2 (576) 11.8 (68) 0.6 (0.3–0.9) 0.028
Table 5.4 Odds ratios for leptospirosis in slaughterhouse workers examining slaughterhouse
factors
The 20 variables from Tables 5.2, 5.3 and 5.4 were identified for inclusion in the
multivariable mixed effects logistic regression model. Variables that were obviously
correlated to another variable of interest were excluded from the model. Two
variables were excluded immediately for being highly correlated to another variable.
Having walls in the slaughterhouse was correlated with having a roof (phi coefficient
= 0.76). Owning pigs was correlated with having contact with pigs outside the
slaughterhouse (phi coefficient = 0.69). The remaining variables were checked for
correlation. Figure 5.1 is a correlation matrix for the selected variables. There was a
moderate level of correlation between the number of animals slaughtered and the
number of people working in the slaughterhouse (phi = 0.42).

Chapter 5 Risk factors for zoonoses in slaughterhouse workers____ 133
Goat Pigs Bore HIV Wou Clinic Cove PPE Butc Clea Ante Smo Alco PN AN Eat Roof Sprin
Goat 0.22 0.05 0.02 0.00 0.02 0.05 0.10 -0.03 0.12 -0.01 0.02 -0.02 0.10 0.07 0.01 0.08 -0.03
Pigs 0.05 0.01 -0.03 0.04 -0.09 -0.14 -0.19 0.04 0.00 -0.05 0.00 -0.12 -0.06 0.05 -0.15 0.09
Bore 0.03 -0.02 -0.02 -0.01 -0.05 0.02 0.04 -0.08 0.00 -0.03 -0.18 -0.02 0.04 -0.13 -0.15
HIV -0.01 0.11 0.07 0.08 0.00 0.02 -0.02 0.08 0.05 0.00 -0.02 -0.01 0.01 0.01
Wou 0.01 0.07 -0.02 0.04 -0.08 0.00 0.12 0.07 0.07 0.05 0.01 0.03 -0.06
Clinic 0.04 0.01 -0.02 -0.04 0.03 -0.04 -0.03 0.07 -0.01 0.03 0.02 0.03
Cove 0.40 -0.03 -0.01 0.12 0.02 0.02 0.18 0.14 0.00 0.18 -0.03
PPE 0.07 -0.09 0.08 -0.01 -0.01 0.29 0.21 0.01 0.36 0.01
Butc -0.03 0.08 0.11 0.00 0.02 0.01 0.07 0.11 0.04
Clea -0.05 0.03 -0.02 -0.08 -0.05 0.00 -0.02 0.02
Ante -0.03 -0.01 0.09 0.08 0.03 0.12 0.03
Smo 0.25 -0.07 0.00 -0.01 0.04 -0.04
Alco -0.05 -0.02 0.04 0.03 0.04
PN 0.42 -0.04 0.34 -0.02
AN 0.20 0.37 -0.16
Eat -0.07 0.10
Roof 0.13
Sprin
* Variable descriptions are included in Table 5.5 Alco = takes alcohol regularly; AN = number of animals in slaughterhouse; Ante = antemortem inspection performed; Bore = worker’s private water source; Butc = Butcher; Clea = cleans intestines; Clinic = visited clinic within 3 months; Cove = wear coveralls at work; Eat = eats in the slaughterhouse; Goat = contact with goats outside work; HIV = HIV positive; Pigs = contact with pigs outside work; PN = number of people in slaughterhouse; PPE = works in a slaughterhouse where coveralls worn; Roof= slaughterhouse has a roof; Smo = smokes regularly; Wou = wound at interview; Sprin = Spring is water source Figure 5.1 Correlation matrix for the selected variables for exposure to leptospirosis in slaughterhouse workers
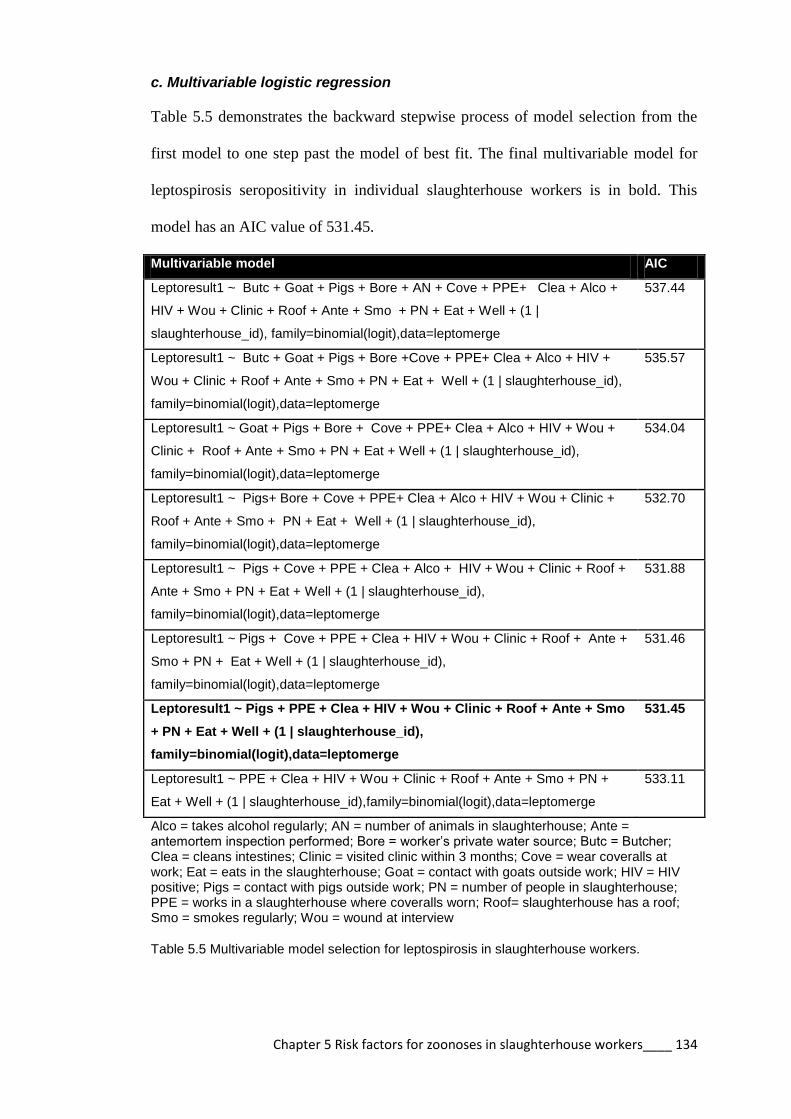
Chapter 5 Risk factors for zoonoses in slaughterhouse workers____ 134
c. Multivariable logistic regression
Table 5.5 demonstrates the backward stepwise process of model selection from the
first model to one step past the model of best fit. The final multivariable model for
leptospirosis seropositivity in individual slaughterhouse workers is in bold. This
model has an AIC value of 531.45.
Multivariable model AIC
Leptoresult1 ~ Butc + Goat + Pigs + Bore + AN + Cove + PPE+ Clea + Alco +
HIV + Wou + Clinic + Roof + Ante + Smo + PN + Eat + Well + (1 |
slaughterhouse_id), family=binomial(logit),data=leptomerge
537.44
Leptoresult1 ~ Butc + Goat + Pigs + Bore +Cove + PPE+ Clea + Alco + HIV +
Wou + Clinic + Roof + Ante + Smo + PN + Eat + Well + (1 | slaughterhouse_id),
family=binomial(logit),data=leptomerge
535.57
Leptoresult1 ~ Goat + Pigs + Bore + Cove + PPE+ Clea + Alco + HIV + Wou +
Clinic + Roof + Ante + Smo + PN + Eat + Well + (1 | slaughterhouse_id),
family=binomial(logit),data=leptomerge
534.04
Leptoresult1 ~ Pigs+ Bore + Cove + PPE+ Clea + Alco + HIV + Wou + Clinic +
Roof + Ante + Smo + PN + Eat + Well + (1 | slaughterhouse_id),
family=binomial(logit),data=leptomerge
532.70
Leptoresult1 ~ Pigs + Cove + PPE + Clea + Alco + HIV + Wou + Clinic + Roof +
Ante + Smo + PN + Eat + Well + (1 | slaughterhouse_id),
family=binomial(logit),data=leptomerge
531.88
Leptoresult1 ~ Pigs + Cove + PPE + Clea + HIV + Wou + Clinic + Roof + Ante +
Smo + PN + Eat + Well + (1 | slaughterhouse_id),
family=binomial(logit),data=leptomerge
531.46
Leptoresult1 ~ Pigs + PPE + Clea + HIV + Wou + Clinic + Roof + Ante + Smo
+ PN + Eat + Well + (1 | slaughterhouse_id),
family=binomial(logit),data=leptomerge
531.45
Leptoresult1 ~ PPE + Clea + HIV + Wou + Clinic + Roof + Ante + Smo + PN +
Eat + Well + (1 | slaughterhouse_id),family=binomial(logit),data=leptomerge
533.11
Alco = takes alcohol regularly; AN = number of animals in slaughterhouse; Ante = antemortem inspection performed; Bore = worker’s private water source; Butc = Butcher; Clea = cleans intestines; Clinic = visited clinic within 3 months; Cove = wear coveralls at work; Eat = eats in the slaughterhouse; Goat = contact with goats outside work; HIV = HIV positive; Pigs = contact with pigs outside work; PN = number of people in slaughterhouse; PPE = works in a slaughterhouse where coveralls worn; Roof= slaughterhouse has a roof; Smo = smokes regularly; Wou = wound at interview
Table 5.5 Multivariable model selection for leptospirosis in slaughterhouse workers.

Chapter 5 Risk factors for zoonoses in slaughterhouse workers____ 135
Variable OR (95% CI) p value VIFs
Individual factors
Cleans intestines 3.8 (1.8–8.2) <0.001 1.055
Wounds 2.7 (1.4–5.3) 0.004 1.041
Smoking 1.8 (1.1–3.0) 0.016 1.042
Eating 2.1 (1.2–3.6) 0.006 1.051
HIV positive 0.3 (0.1–0.9) 0.036 1.013
Visited a clinic in past 3
months
0.5 (0.2–1.0) 0.045 1.036
Worker reports antemortem
inspection performed
0.6 (0.4–0.9) 0.028 1.037
Contact with pigs outside
work
0.6 (0.4–1.0) 0.061 1.054
Slaughterhouse level factors
Slaughterhouse has a roof 2.6 (1.2–5.7) 0.016 1.241
Greater than 5 workers 2.4 (1.2–4.7) 0.012 1.193
Well or spring as water
source for the slaughterhouse
2.1 (1.2–3.6) 0.010 1.077
Workers wear protective
clothing in slaughterhouse
0.3 (0.2–0.5) <0.001 1.400
Table 5.6 Results of multivariable analysis for leptospirosis in slaughterhouse workers
The results of the multivariable logistic regression for leptospirosis seropositivity in
slaughterhouse workers are shown in Table 5.6. Risk factors on an individual level
that were significant for exposure to leptospirosis were: cleaning intestines (OR 3.8;
95% 1.8–8.2); having a wound at interview (OR 2.7; 95% CI 1.4–5.3); smoking (OR
1.8; 95% CI 1.1–3.0); eating at the slaughterhouse (OR 2.1; 95% CI 1.2–3.6).
Individual factors that were protective against exposure were: being HIV positive
(OR 0.3; 95% CI 0.1–0.9); performing antemortem inspection of animals (OR 0.6;
95% CI 0.4–0.9); seeking health care by visiting a clinic (OR 0.5; CI 95% 0.2–1.0).
At the slaughterhouses level, factors that were significant for individual exposure
risk include: working in a slaughterhouse with a roof (OR 2.6; 95% CI 1.2–5.7);
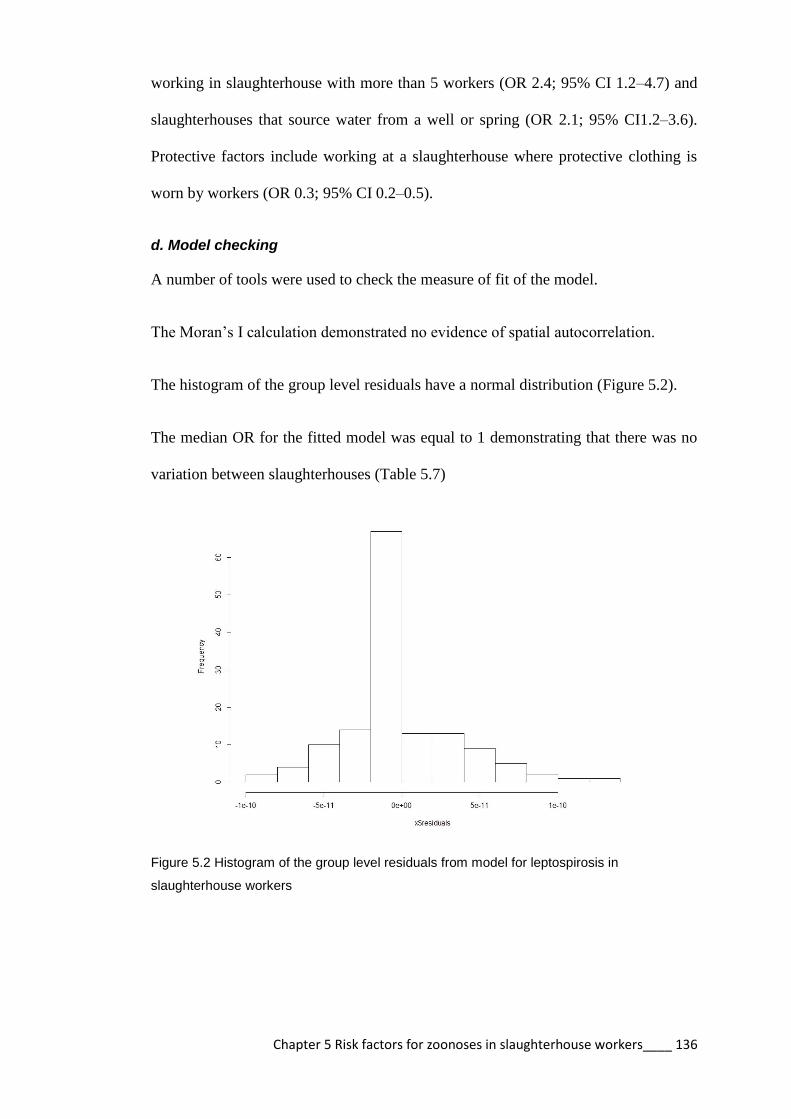
Chapter 5 Risk factors for zoonoses in slaughterhouse workers____ 136
working in slaughterhouse with more than 5 workers (OR 2.4; 95% CI 1.2–4.7) and
slaughterhouses that source water from a well or spring (OR 2.1; 95% CI1.2–3.6).
Protective factors include working at a slaughterhouse where protective clothing is
worn by workers (OR 0.3; 95% CI 0.2–0.5).
d. Model checking
A number of tools were used to check the measure of fit of the model.
The Moran’s I calculation demonstrated no evidence of spatial autocorrelation.
The histogram of the group level residuals have a normal distribution (Figure 5.2).
The median OR for the fitted model was equal to 1 demonstrating that there was no
variation between slaughterhouses (Table 5.7)
Figure 5.2 Histogram of the group level residuals from model for leptospirosis in
slaughterhouse workers

Chapter 5 Risk factors for zoonoses in slaughterhouse workers____ 137
Variable Empty model Model with
individual
variables
Model with
individual and SH
variable
Individual factors
Cleans intestines 3.2 (1.5–6.8)** 3.8 (1.8–8.2)***
Wounds 2.8 (1.4–5.4)** 2.7 (1.4–5.3)**
Smoking 1.8 (1.0–2.9)* 1.8 (1.1–3.0)*
Eating 1.8 (1.0–3.1)* 2.1 (1.2–3.6)**
HIV positive 0.3 (0.1–0.8)* 0.3 (0.1–0.9)*
Visited a clinic in past 3
months
0.6 (0.3–1.1) 0.5 (0.2–1.0)*
Worker reports antemortem
inspection performed
0.6 (0.4–1.0)* 0.6 (0.4–0.9)*
Contact with pigs outside
work
0.6 (0.4–1.0) 0.6 (0.4–1.0)
Slaughterhouse level factors
Slaughterhouse has a roof 2.6 (1.2–5.7)*
Greater than 5 workers 2.4 (1.2–4.7)*
Well or spring as water
source
2.1 (1.2–3.6)*
Workers wear protective
clothing in slaughterhouse
0.3 (0.2–0.5)***
Variance (SE) 0.33 (0.02) 0.20 (0.02) 2.5 x 10⁻¹¹
Proportional change in
variance
Reference 39.4% 99.9%
Median OR 1.7 1.5 1.0
AIC 582.8 552.0 531.4
*p <0.05, **p < 0.01, and ***p < 0.001
Table 5.7 Individual and slaughterhouse level predictors associated with leptospirosis in
slaughterhouse workers by multivariable logistic regression

Chapter 5 Risk factors for zoonoses in slaughterhouse workers____ 138
5.3.2 Q fever
a. Comparison between slaughterhouse types
The OR for Q fever seropositivity in workers from cattle only slaughterhouses was
0.65 and in workers from pig only slaughterhouses was 0.36 when compared to
workers from mixed ruminant slaughterhouses. There was not a significant
difference between slaughterhouse types (Table 5.8). A model was developed that
analysed ruminant and cattle slaughterhouses without the pig slaughterhouses since
being a pig slaughterhouse worker is not a risk factor for exposure to Q fever and any
exposures in this group were likely to happen outside the slaughterhouse (Australian
Government, 2013).
Variable OR (95% CI) p-value
Mixed ruminant 1 Ref
Cattle only 0.65 (0.30–1.39) 0.266
Pig only 0.36 (0.12–1.09) 0.072
Table 5.8 Odds ratios for Q fever amongst slaughterhouse workers between slaughterhouse
types
b. Univariable logistic regression
The complete univariable analysis for risk factors for Q fever seropositivity in
slaughterhouse workers included 100 potential exposure variables. Table 5.9 lists the
variables regarding personal history that had a p-value <0.2 in the univariable
analysis. The only significant variable from the univariable analysis associated with
Q fever seropositivity in slaughterhouse workers was using municipal water for
personal consumption (OR 2.9; 95% CI 1.2–-7.1).
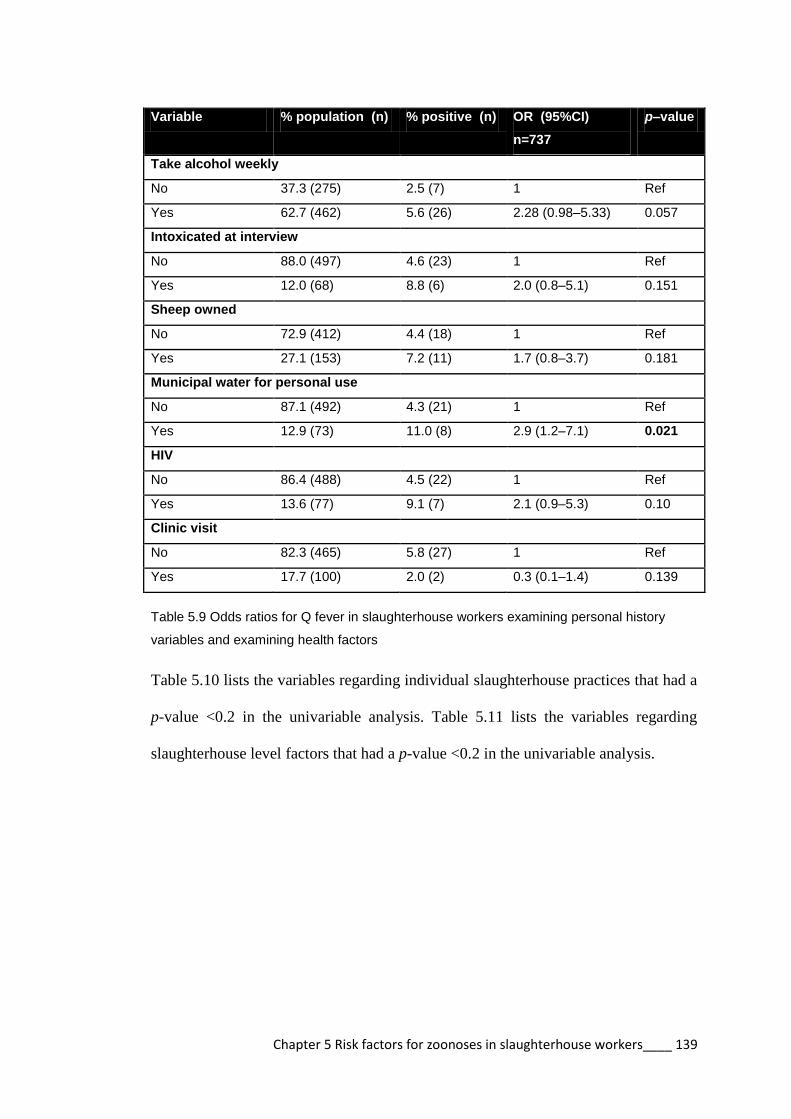
Chapter 5 Risk factors for zoonoses in slaughterhouse workers____ 139
Variable % population (n) % positive (n) OR (95%CI)
n=737
p–value
Take alcohol weekly
No 37.3 (275) 2.5 (7) 1 Ref
Yes 62.7 (462) 5.6 (26) 2.28 (0.98–5.33) 0.057
Intoxicated at interview
No 88.0 (497) 4.6 (23) 1 Ref
Yes 12.0 (68) 8.8 (6) 2.0 (0.8–5.1) 0.151
Sheep owned
No 72.9 (412) 4.4 (18) 1 Ref
Yes 27.1 (153) 7.2 (11) 1.7 (0.8–3.7) 0.181
Municipal water for personal use
No 87.1 (492) 4.3 (21) 1 Ref
Yes 12.9 (73) 11.0 (8) 2.9 (1.2–7.1) 0.021
HIV
No 86.4 (488) 4.5 (22) 1 Ref
Yes 13.6 (77) 9.1 (7) 2.1 (0.9–5.3) 0.10
Clinic visit
No 82.3 (465) 5.8 (27) 1 Ref
Yes 17.7 (100) 2.0 (2) 0.3 (0.1–1.4) 0.139
Table 5.9 Odds ratios for Q fever in slaughterhouse workers examining personal history
variables and examining health factors
Table 5.10 lists the variables regarding individual slaughterhouse practices that had a
p-value <0.2 in the univariable analysis. Table 5.11 lists the variables regarding
slaughterhouse level factors that had a p-value <0.2 in the univariable analysis.

Chapter 5 Risk factors for zoonoses in slaughterhouse workers____ 140
Variable % population (n) % positive
(n)
OR (95% CI) n=737 p–value
Coveralls
No 23.0 (130) 7.7 (10) 1 Ref
Yes 77.0 (435) 4.4 (19) 0.54 (0.2–1.2) 0.137
Boots
No 46.0 (260) 6.9 (18) 1 Ref
Yes 54.0 (305) 3.6 (11) 0.5 (0.2–1.1) 0.080
Wash hands before slaughter
No 31.5 (178) 7.3 (13) 1 Ref
Yes 68.5 (387) 4.1 (16) 0.5 (0.2–1.2) 0.121
Wash hands after slaughter
No 5.7 (32) 13.0 (4) 1 Ref
Yes 94.3 (533) 4.7 (25) 0.3 (0.1–1.1) 0.063
Wash hands after latrine
No 41.6 (235) 6.8 (16) 1 Ref
Yes 58.4 (330) 3.9 (13) 0.6 (0.3–1.2) 0.134
Table 5.10 Odds rations for Q fever in slaughterhouse workers examining individual
slaughterhouse practices
Variable % population
(n)
% positive (n) OR (95% CI)
n=737
p–
value
Number of animals
<8 49.9 (282) 6.4 (18) 1 Ref
≥8 50.1 (283) 3.9 (11) 0.6 (0.3–1.3) 0.183
Total people
<10 49.7 (281) 6.8 (19) 1 Ref
≥10 50.3 (284) 3.5 (10) 0.5 (0.2–1.1) 0.086
PPE
No 11.5 (65) 9.2 (6) 1 Ref
Yes 88.5 (500) 4.6 (23) 0.5 (0.2–1.2) 0.119
Boots
No 18.1 (102) 7.8 (8) 1 Ref
Yes 81.9 (463) 4.5 (21) 0.6 (0.2–1.3) 0.176
Table 5.11 Odds ratios for Q fever in slaughterhouse workers examining slaughterhouse
factors

Chapter 5 Risk factors for zoonoses in slaughterhouse workers____ 141
The 15 variables from Tables 5.9, 5.10, and 5.11 were identified for inclusion in the
multivariable mixed effects logistic regression model. Figure 5.3 is a correlation
matrix for the selected variables. There was a high level of correlation between the
number of animals slaughtered and the number of people working in the
slaughterhouse (phi = 0.68). The number of animals slaughtered was excluded from
the model. There was a high correlation between slaughterhouses where workers
wore protective clothes and slaughterhouses where workers wore rubber boots.
Rubber boots at the slaughterhouse level was excluded from the model (phi = 0.58).
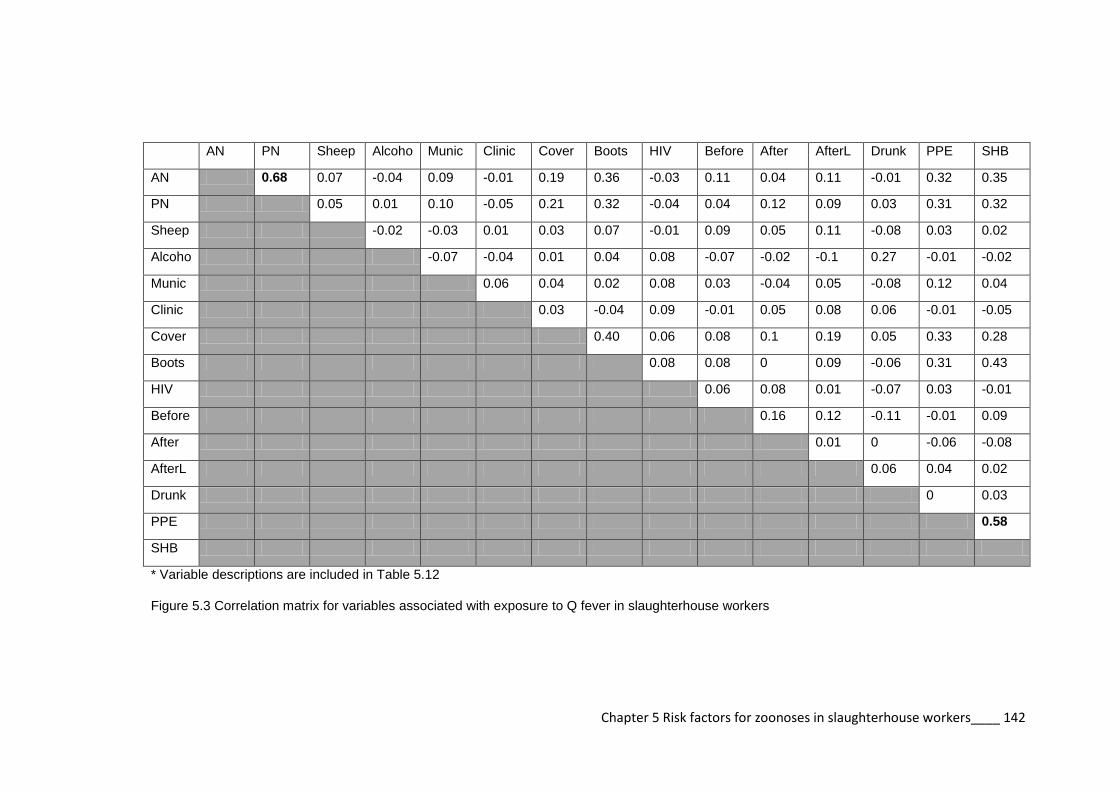
Chapter 5 Risk factors for zoonoses in slaughterhouse workers____ 142
AN PN Sheep Alcoho Munic Clinic Cover Boots HIV Before After AfterL Drunk PPE SHB
AN 0.68 0.07 -0.04 0.09 -0.01 0.19 0.36 -0.03 0.11 0.04 0.11 -0.01 0.32 0.35
PN 0.05 0.01 0.10 -0.05 0.21 0.32 -0.04 0.04 0.12 0.09 0.03 0.31 0.32
Sheep -0.02 -0.03 0.01 0.03 0.07 -0.01 0.09 0.05 0.11 -0.08 0.03 0.02
Alcoho -0.07 -0.04 0.01 0.04 0.08 -0.07 -0.02 -0.1 0.27 -0.01 -0.02
Munic 0.06 0.04 0.02 0.08 0.03 -0.04 0.05 -0.08 0.12 0.04
Clinic 0.03 -0.04 0.09 -0.01 0.05 0.08 0.06 -0.01 -0.05
Cover 0.40 0.06 0.08 0.1 0.19 0.05 0.33 0.28
Boots 0.08 0.08 0 0.09 -0.06 0.31 0.43
HIV 0.06 0.08 0.01 -0.07 0.03 -0.01
Before 0.16 0.12 -0.11 -0.01 0.09
After 0.01 0 -0.06 -0.08
AfterL 0.06 0.04 0.02
Drunk 0 0.03
PPE 0.58
SHB
* Variable descriptions are included in Table 5.12
Figure 5.3 Correlation matrix for variables associated with exposure to Q fever in slaughterhouse workers

Chapter 5 Risk factors for zoonoses in slaughterhouse workers____ 143
c. Multivariable logistic regression
Table 5.12 demonstrates the backward stepwise process of model selection from the
first model to one step past the model of best fit. The final multivariable model for Q
fever seropositivity in individual slaughterhouse workers is in bold. This model has
an AIC value of 222.3.
Multivariable model AIC
Qresult ~ PN + Sheep + Alco + Munic + Clinic + Cover + Boots + AfterL
+ After + HIV + Before + PPE + Drunk + (1 | slaughterhouse_id)
,family=binomial(logit), data=leptomerge
227.7
Qresult ~ PN+ Sheep + Alco + Munic + Clinic + Boots + AfterL + After +
HIV + Before + PPE + Drunk + (1 | slaughterhouse_id)
,family=binomial(logit), data=leptomerge
225.8
Qresult ~ PN+ Sheep + Alco + Munic + Clinic + AfterL + After + HIV
+ Before + PPE + Drunk + (1 | slaughterhouse_id) ,family=binomial(logit),
data=leptomerge
224.1
Qresult ~ PN+ Sheep + Munic + Clinic + AfterL + After + HIV +
Before + PPE + Drunk + (1 | slaughterhouse_id) ,family=binomial(logit),
data=leptomerge
222.7
Qresult ~ PN + Sheep + Munic + Clinic + AfterL + After+ HIV + PPE +
Drunk + (1 | slaughterhouse_id) ,family=binomial(logit), data=leptomerge
222.3
Qresult ~ Sheep + Munic + Clinic + AfterL + After + HIV + PPE +
Drunk + (1 | slaughterhouse_id) ,family=binomial(logit),
data=leptomerge)
222.3
Qresult ~ Sheep + Munic + Clinic + After + HIV + PPE+ Drunk + (1 |
slaughterhouse_id) ,family=binomial(logit), data=leptomerge
223.2
The codes applied are as follows: Alco = takes alcohol regularly; After = washes hand after slaughtering; AfterL = washes hands after latrine; Before = washes hands before slaughtering; Boots = wears boots at works; Clinic = visited clinic in past 3 months; Cover = wears coveralls at work; Drunk = Intoxicated at interview: HIV = HIV positive; Munic = worker’s private water source is municipal water; PN = number of people in slaughterhouse; PPE = works in a slaughterhouse where coveralls are worn; SHB = works in a slaughterhouse where boots are worn; Sheep = contact with sheep away from work
Table 5.12 Multivariable model selection for Q fever seropositivity in slaughterhouse workers

Chapter 5 Risk factors for zoonoses in slaughterhouse workers____ 144
The results of the multivariable logistic regression for Q fever seropositivity in
slaughterhouse workers are shown in Table 5.13. Risk factors on an individual level
for exposure to Q fever were: using municipal water for personal use (OR 4.2; 95%
CI 1.5–11.5); being intoxicated at work (OR 3.2; 95% CI 1.1–9.4). Working in a
slaughterhouse where workers wear protective clothing is protective against Q fever
(OR 0.3; 95% CI 0.1–0.9).
Variables OR (95% CI) p–value VIFS
Individual variables
Sheep contact 2.2 (0.9–5.2) 0.078 1.030
Municipal water for
personal use
4.2 (1.5–11.5) 0.005 1.137
Visited clinic in past 3
months
0.3 (0.1–1.2) 0.090 1.026
Wash hands after
slaughter
0.3 (0.1–1.0) 0.098 1.045
Wash hands after
latrine
0.5 (0.2–1.1) 0.058 1.022
HIV 2.5 (0.9–7.0) 0.072 1.043
Intoxicated at
interview
3.2 (1.1–9.4) 0.037 1.058
Slaughterhouse variables
Workers wear
protective clothing at
slaughterhouse
0.3 (0.1–0.9) 0.035 1.092
Table 5.13 Results of the multivariable analysis for Q fever in slaughterhouse workers
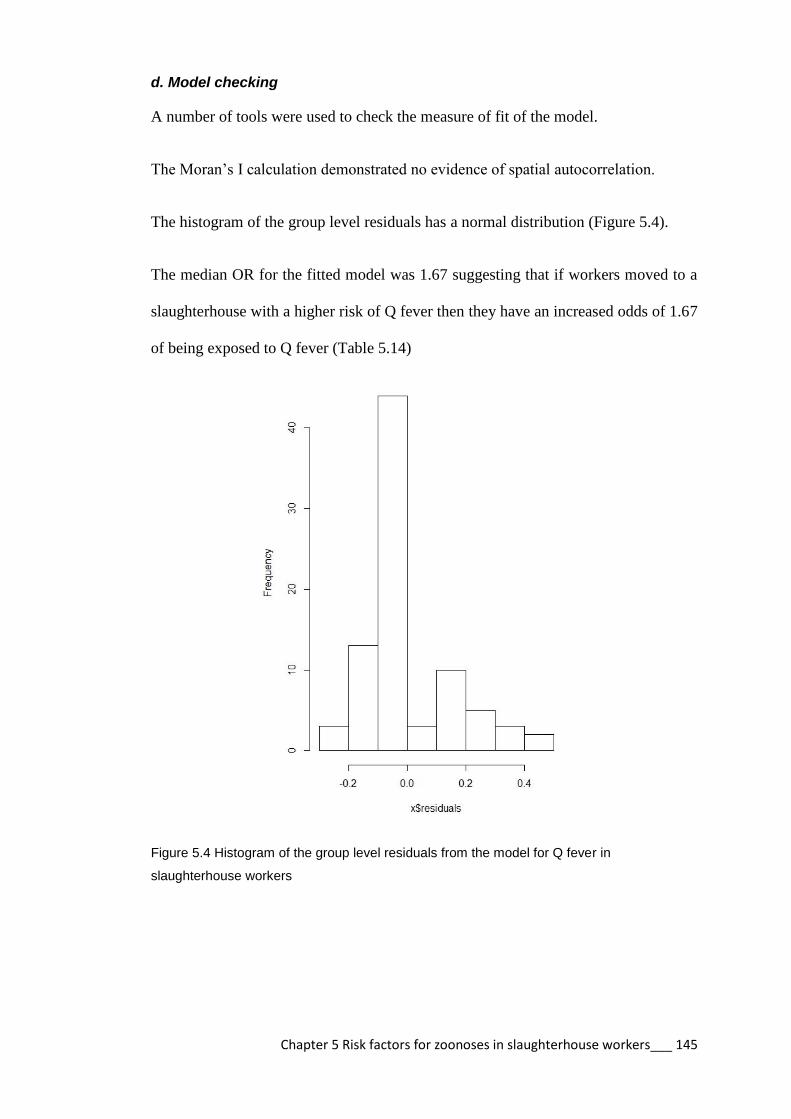
Chapter 5 Risk factors for zoonoses in slaughterhouse workers___ 145
d. Model checking
A number of tools were used to check the measure of fit of the model.
The Moran’s I calculation demonstrated no evidence of spatial autocorrelation.
The histogram of the group level residuals has a normal distribution (Figure 5.4).
The median OR for the fitted model was 1.67 suggesting that if workers moved to a
slaughterhouse with a higher risk of Q fever then they have an increased odds of 1.67
of being exposed to Q fever (Table 5.14)
Figure 5.4 Histogram of the group level residuals from the model for Q fever in
slaughterhouse workers

Chapter 5 Risk factors for zoonoses in slaughterhouse workers___ 146
Variable Empty model Model with
individual
variables
Model with
individual and
slaughterhouse
variables
Individual variables
Sheep contact 2.2 (0.9–5.2) 2.2 (0.9–5.2)
Municipal water for personal
use
3.5 (1.3–9.5)* 4.2 (1.5–11.5)**
Visited clinic in past 3
months
0.3 (0.1–1.3) 0.3 (0.1–1.2)
Wash hands after slaughter 0.3 (0.1–1.2) 0.3 (0.1–1.0)
Wash hands after latrine 0.5 (0.2–1.2) 0.5 (0.2–1.1)
HIV 2.5 (0.9–6.9) 2.5 (0.9–7.0)
Intoxicated at interview 3.2 (1.1–9.4)* 3.2 (1.1–9.4)*
Slaughterhouse variables
Workers wear protective
clothing at slaughterhouse
0.3 (0.1–0.9)*
Variance (SE) 1.1x10⁻¹²
0.409 0.287
Proportional change in
variance
Reference 100%
100%
Median OR 1.00 1.84 1.67
AIC 232.7 224.3 222.3
*p <0.05, **p < 0.01, and ***p < 0.001
Table 5.14 Individual and slaughterhouse level predictors associated with Q fever in
slaughterhouse workers by multivariable logistic regression
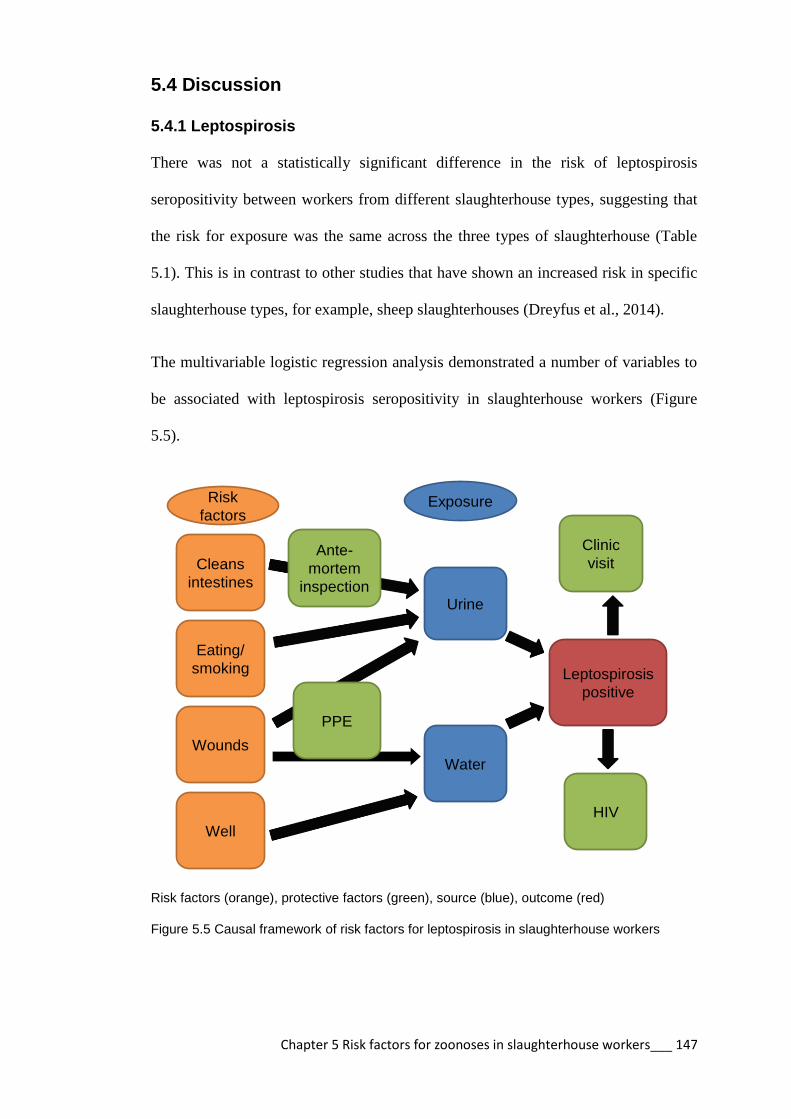
Chapter 5 Risk factors for zoonoses in slaughterhouse workers___ 147
5.4 Discussion
5.4.1 Leptospirosis
There was not a statistically significant difference in the risk of leptospirosis
seropositivity between workers from different slaughterhouse types, suggesting that
the risk for exposure was the same across the three types of slaughterhouse (Table
5.1). This is in contrast to other studies that have shown an increased risk in specific
slaughterhouse types, for example, sheep slaughterhouses (Dreyfus et al., 2014).
The multivariable logistic regression analysis demonstrated a number of variables to
be associated with leptospirosis seropositivity in slaughterhouse workers (Figure
5.5).
Leptospirosis
positive
Urine
Water
Well
Wounds
Cleans
intestines
HIV
Ante-
mortem
inspection
Clinic
visit
Eating/
smoking
PPE
ExposureRisk
factors
Risk factors (orange), protective factors (green), source (blue), outcome (red)
Figure 5.5 Causal framework of risk factors for leptospirosis in slaughterhouse workers
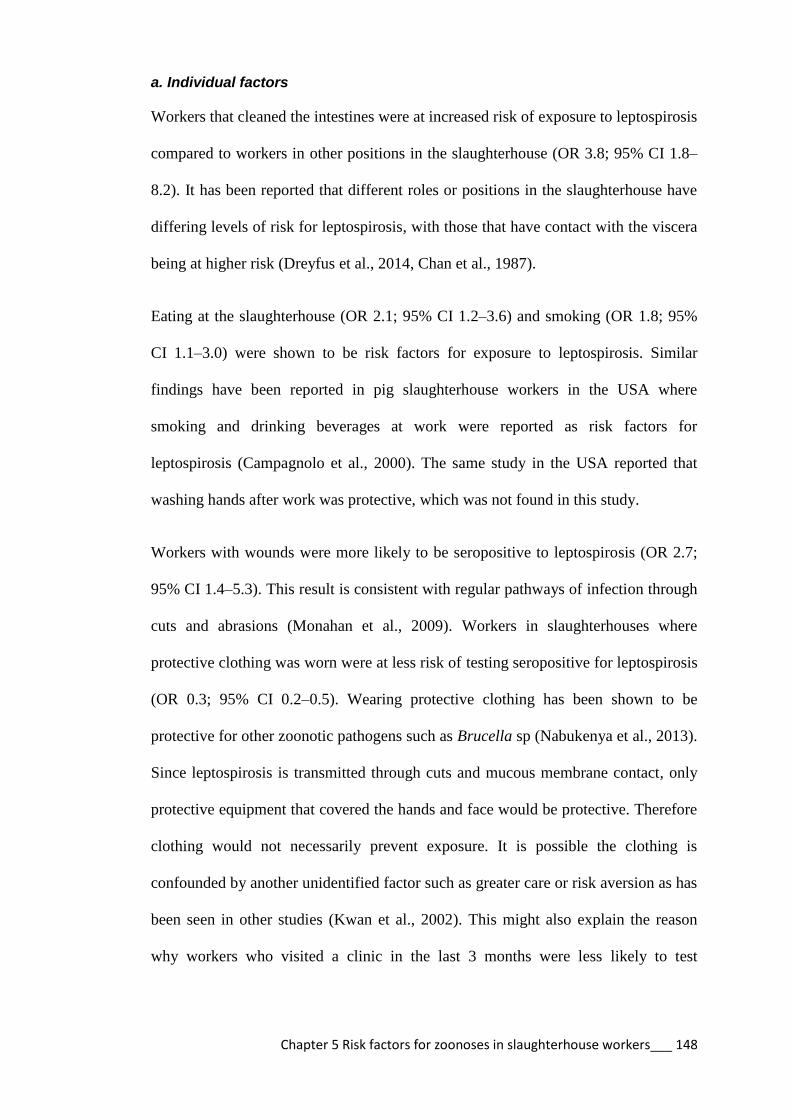
Chapter 5 Risk factors for zoonoses in slaughterhouse workers___ 148
a. Individual factors
Workers that cleaned the intestines were at increased risk of exposure to leptospirosis
compared to workers in other positions in the slaughterhouse (OR 3.8; 95% CI 1.8–
8.2). It has been reported that different roles or positions in the slaughterhouse have
differing levels of risk for leptospirosis, with those that have contact with the viscera
being at higher risk (Dreyfus et al., 2014, Chan et al., 1987).
Eating at the slaughterhouse (OR 2.1; 95% CI 1.2–3.6) and smoking (OR 1.8; 95%
CI 1.1–3.0) were shown to be risk factors for exposure to leptospirosis. Similar
findings have been reported in pig slaughterhouse workers in the USA where
smoking and drinking beverages at work were reported as risk factors for
leptospirosis (Campagnolo et al., 2000). The same study in the USA reported that
washing hands after work was protective, which was not found in this study.
Workers with wounds were more likely to be seropositive to leptospirosis (OR 2.7;
95% CI 1.4–5.3). This result is consistent with regular pathways of infection through
cuts and abrasions (Monahan et al., 2009). Workers in slaughterhouses where
protective clothing was worn were at less risk of testing seropositive for leptospirosis
(OR 0.3; 95% CI 0.2–0.5). Wearing protective clothing has been shown to be
protective for other zoonotic pathogens such as Brucella sp (Nabukenya et al., 2013).
Since leptospirosis is transmitted through cuts and mucous membrane contact, only
protective equipment that covered the hands and face would be protective. Therefore
clothing would not necessarily prevent exposure. It is possible the clothing is
confounded by another unidentified factor such as greater care or risk aversion as has
been seen in other studies (Kwan et al., 2002). This might also explain the reason
why workers who visited a clinic in the last 3 months were less likely to test
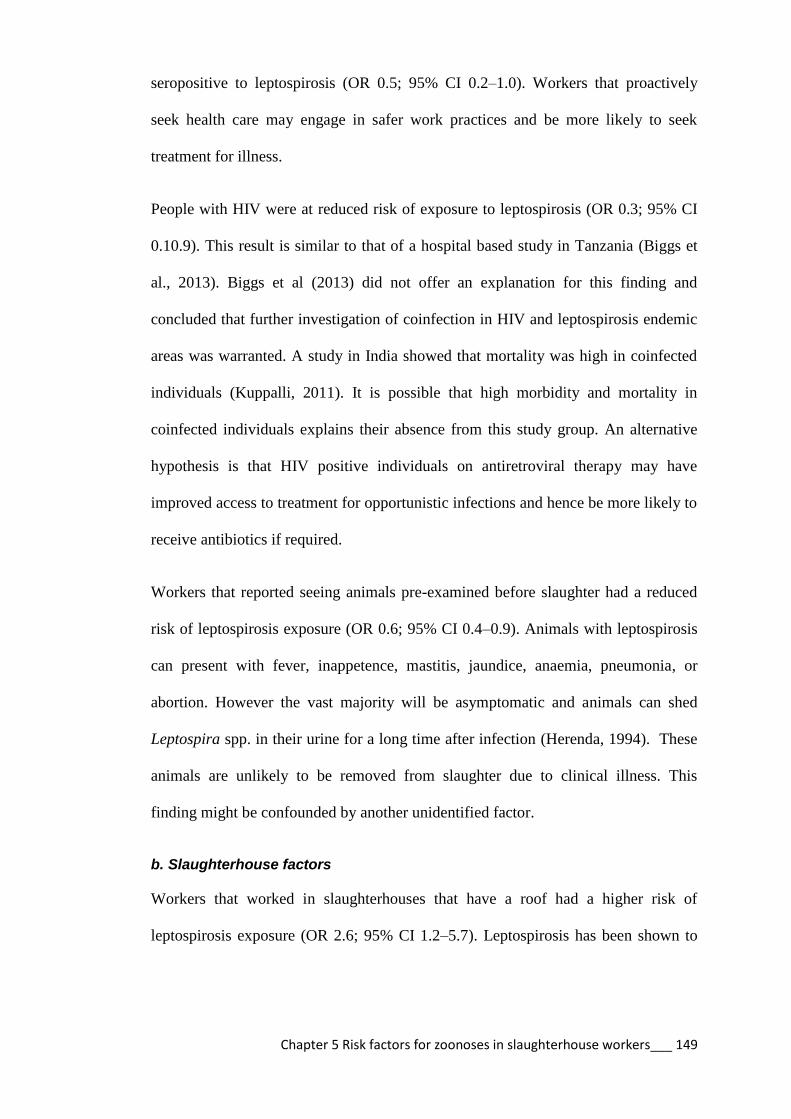
Chapter 5 Risk factors for zoonoses in slaughterhouse workers___ 149
seropositive to leptospirosis (OR 0.5; 95% CI 0.2–1.0). Workers that proactively
seek health care may engage in safer work practices and be more likely to seek
treatment for illness.
People with HIV were at reduced risk of exposure to leptospirosis (OR 0.3; 95% CI
0.10.9). This result is similar to that of a hospital based study in Tanzania (Biggs et
al., 2013). Biggs et al (2013) did not offer an explanation for this finding and
concluded that further investigation of coinfection in HIV and leptospirosis endemic
areas was warranted. A study in India showed that mortality was high in coinfected
individuals (Kuppalli, 2011). It is possible that high morbidity and mortality in
coinfected individuals explains their absence from this study group. An alternative
hypothesis is that HIV positive individuals on antiretroviral therapy may have
improved access to treatment for opportunistic infections and hence be more likely to
receive antibiotics if required.
Workers that reported seeing animals pre-examined before slaughter had a reduced
risk of leptospirosis exposure (OR 0.6; 95% CI 0.4–0.9). Animals with leptospirosis
can present with fever, inappetence, mastitis, jaundice, anaemia, pneumonia, or
abortion. However the vast majority will be asymptomatic and animals can shed
Leptospira spp. in their urine for a long time after infection (Herenda, 1994). These
animals are unlikely to be removed from slaughter due to clinical illness. This
finding might be confounded by another unidentified factor.
b. Slaughterhouse factors
Workers that worked in slaughterhouses that have a roof had a higher risk of
leptospirosis exposure (OR 2.6; 95% CI 1.2–5.7). Leptospirosis has been shown to

Chapter 5 Risk factors for zoonoses in slaughterhouse workers___ 150
survive in the environment in diluted urine in direct sunlight for 2 days and in cooler
shaded environments for longer (Khairani-Bejo, 2004). These findings could suggest
that leptospires survive longer in slaughterhouses that have a roof if they are not
adequately cleaned, leading to exposure of workers.
The number of people that worked in a slaughterhouse was also associated with an
increased risk of leptospirosis exposure (OR 2.4; 95% CI 1.2–4.7). Larger
slaughterhouses will have a higher through-put of animals, increasing the likelihood
of infected animals being slaughtered. However, larger slaughterhouses also have
better management and hygiene practices as outlined in Chapter 3. It is likely that
there is a more complex epidemiology in the larger slaughterhouses that is related to
the number and type of animals being slaughtered. Information on the number of
infected animals entering the slaughterhouse would be important to quantify the risk
to workers.
Using well water at the slaughterhouse was associated with increased exposure to
leptospirosis in slaughterhouse workers (OR 2.1; 95% CI 1.2–3.6). Contaminated
water can be a source of infection (Levett, 2001).

Chapter 5 Risk factors for zoonoses in slaughterhouse workers___ 151
5.4.2 Q fever
There was not a statistically significant difference in the risk of Q fever seropositivity
between workers from different slaughterhouse types. It was considered that pig only
slaughterhouse workers would not be exposed to Q fever within the slaughterhouse
environment (Table 5.8). Pigs are not considered a reservoir of this pathogen (Stoker
and Marmion, 1955). For this reason pig only slaughterhouse workers were excluded
from the model.
The multivariable logistic regression analysis demonstrated 3 variables to be
significantly associated with Q fever seropositivity in slaughterhouse workers
(Figure 5.6). These were using municipal water for personal use, being intoxicated at
interview and working in a slaughterhouse where workers wore protective clothing.
Q fever
positive
Direct
contact
with
animals
Indirect
contact
HIV
Municipal
water
Sheep
contact
Clinic
visit
Drunk
PPE
Wash
hands
Risk
factors Exposure
Risk factors (orange), protective factors (green), source (blue), outcome (red)
Figure 5.6 Causal framework of risk factors for Q fever in slaughterhouse workers

Chapter 5 Risk factors for zoonoses in slaughterhouse workers___ 152
The multivariable analysis identified workers that used municipal water for personal
use to be at increased risk of exposure to Q fever (OR 4.2; 95% CI 1.5–11.5). Q fever
is not transmitted by ingestion of water and studies have shown there is a negligible
risk of being infected with Q fever by aerosolisation of water (Sales-Ortells and
Medema, 2012). Municipal water users must live in larger towns to have access to
this water source. Increased Q fever incidence has been associated with urbanisation
(Hellenbrand et al., 2001). These Q fever cases associated with metropolitan water
use were notably along one of the major road routes to Uganda. This finding needs to
be investigated further.
Slaughterhouse workers that appeared intoxicated at interview were at greater risk of
Q fever exposure (OR 3.2; 95% CI 1.1–9.4). It was common for workers to consume
a locally made fermented porridge, called “nyuka”, “busela”, or “ebusera” before or
during work. Alcohol consumption can impair performance and motor skills
resulting in injury. Studies in farm workers showed that regular alcohol consumption
was associated with increased injury frequency (Stallones and Xiang, 2003). Regular
alcohol consumption may also reduce immunity, increasing susceptibility to
infection, particularly bacterial pneumonia (Nelson and Kolls, 2002).
Individuals that were HIV positive had 2.5 times the odds of being seropositive to Q
fever. People infected with HIV are at greater risk of Q fever co-infection due to
immunosuppression (Raoult et al., 1993). Although HIV infection was not a
significant variable in the multivariable model it must still be considered an
important risk factor for Q fever exposure in slaughterhouse workers in western
Kenya.
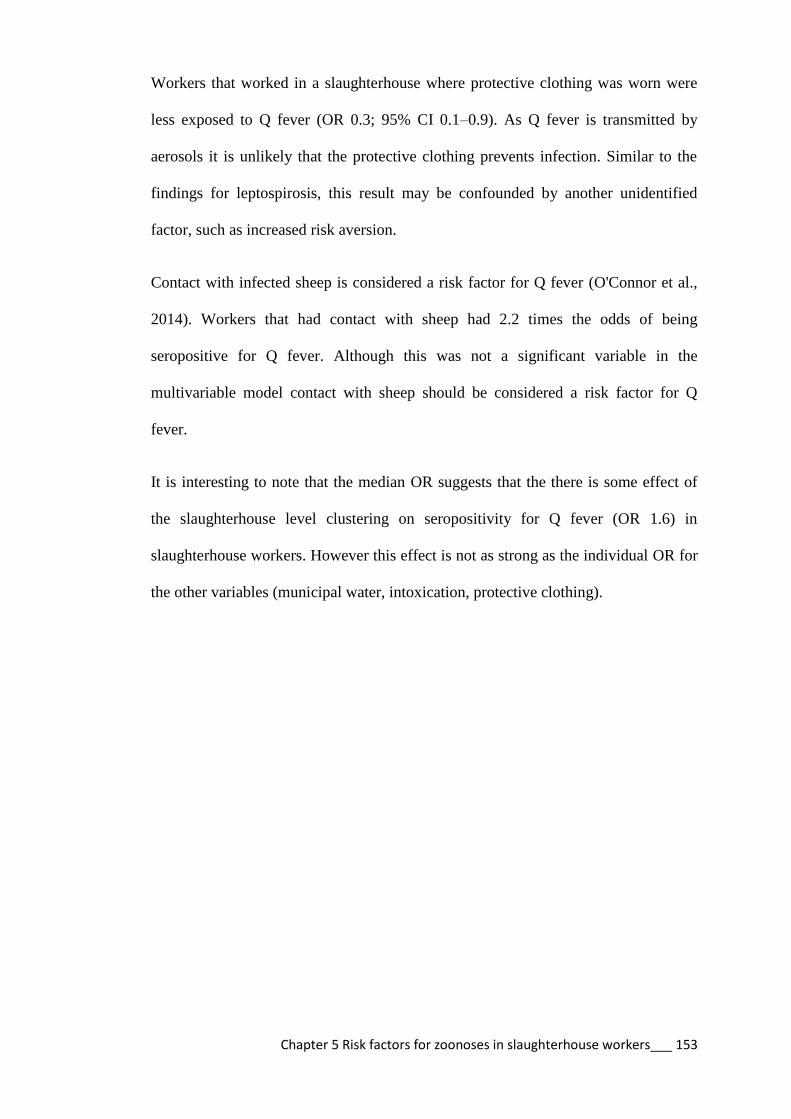
Chapter 5 Risk factors for zoonoses in slaughterhouse workers___ 153
Workers that worked in a slaughterhouse where protective clothing was worn were
less exposed to Q fever (OR 0.3; 95% CI 0.1–0.9). As Q fever is transmitted by
aerosols it is unlikely that the protective clothing prevents infection. Similar to the
findings for leptospirosis, this result may be confounded by another unidentified
factor, such as increased risk aversion.
Contact with infected sheep is considered a risk factor for Q fever (O'Connor et al.,
2014). Workers that had contact with sheep had 2.2 times the odds of being
seropositive for Q fever. Although this was not a significant variable in the
multivariable model contact with sheep should be considered a risk factor for Q
fever.
It is interesting to note that the median OR suggests that the there is some effect of
the slaughterhouse level clustering on seropositivity for Q fever (OR 1.6) in
slaughterhouse workers. However this effect is not as strong as the individual OR for
the other variables (municipal water, intoxication, protective clothing).

Chapter 5 Risk factors for zoonoses in slaughterhouse workers___ 154
5.5 Conclusion
This study is the first of its type in Kenya to investigate the risk factors for zoonotic
disease exposure in slaughterhouse workers. The study hypothesised that:
1. work position/role in the slaughterhouse was a risk for zoonotic disease
seropositivity in slaughterhouse workers
2. inadequate facilities and poor sanitation in slaughterhouses are risk
factors for zoonotic disease seropositivity in workers
3. poor personal hygiene at slaughterhouses are risks for zoonotic disease
seropositivity in workers.
The findings of this study support these hypotheses. The workers with the greatest
risk of leptospirosis seropositivity are those that have contact with the viscera
through cleaning the intestines. This seropositivity is likely due to their intimate
contact with infected organs.
At the slaughterhouse level, increased leptospirosis risk in workers is associated with
infrastructural factors (having a roof) and the source of water (well or spring). These
factors are likely to be indicative of poor sanitation at the slaughterhouse. This
assumption is further supported by the finding that slaughterhouse workers in
slaughterhouses where protective clothing is worn have reduced risk for both
leptospirosis and Q fever. In addition, workers that report animals being preexamined
before slaughter have reduced leptospirosis risk, further supporting the hypothesis
that workers in slaughterhouses with better facilities and practices have reduced
zoonotic disease risk.

Chapter 5 Risk factors for zoonoses in slaughterhouse workers___ 155
Personal hygiene factors appear to have the most influence on zoonotic disease risk.
Workers that have wounds, smoke, and eat at the slaughterhouse have higher risk for
leptospirosis than other workers. In addition, workers that are intoxicated at work
have higher Q fever risk than other workers.
In order to improve conditions in slaughterhouses in western Kenya and reduce
exposure of workers to zoonotic diseases, improvements need to be made to
slaughterhouse facilities. Workers need to be educated regarding their disease risks
and ways to prevent or reduce transmission. Areas that need to be targeted for
intervention include:
1. Sanitation
a. Regular cleaning of the slaughterhouse with disinfectant
b. Potable water source
c. Hand washing facilities
d. Provision of personal protective equipment to workers
2. Personal hygiene
a. Prevent eating and smoking at work
b. Workers to wear protective clothing
c. Wounds to be covered
3. Meat inspection
a. Antemortem inspection
4. Slaughterhouse worker health
a. Regular medical check ups

Chapter 5 Risk factors for zoonoses in slaughterhouse workers___ 156
A detailed report of the findings of this study will be prepared for the local veterinary
department and the workers regarding recommended measures to reduce zoonotic
disease risk in slaughterhouse workers in western Kenya.

Chapter 6 Epidemiology of zoonoses in the community____ 157
Chapter 6
Epidemiology of leptospirosis and Q fever
in people in western Kenya

Chapter 6 Epidemiology of zoonoses in the community____ 158
6.1 Introduction
Risk factors for zoonotic disease exposure are commonly direct contact with animals
but there can be indirect exposures, particularly for waterborne diseases such as
leptospirosis, or aerosols such as Q fever (Waitkins, 1986, Campagnolo et al., 2000,
Raoult and Marrie, 1995, Marmion, 1959).
6.1.1 Leptospirosis
People who come into contact with animal urine, such as farmers, and those that
have contact with contaminated water, such as sewer workers are at risk of
leptospirosis (Waitkins, 1986). In Kenya, rodents, cattle, goats, and sheep have been
shown to be maintenance hosts of leptospires (Halliday et al., 2013, Ball, 1966).
6.1.2. Q fever
People who are in contact with peri-parturient animals such as farmers, veterinarians,
and slaughterhouse workers are considered to be most at risk, but people who live
near farms can also be affected through dispersal of the pathogen (Stoker and
Marmion, 1955, Roest et al., 2011). In Kenya, Q fever has been described in cattle,
sheep, goats and camels (Depuy et al., 2014).
In this chapter, risk factors for leptospirosis and Q fever exposure in the general
community are explored. The hypothesis tested is:
1. People in contact with animals have greater risk of zoonotic disease.
The aim of this study was to identify risk factors for zoonotic disease exposure in the
community and compare these to the risk factors identified for zoonotic disease
exposure in slaughterhouse workers.

Chapter 6 Epidemiology of zoonoses in the community____ 159
6.2 Methods
6.2.1 Sampling frame
The data used for this paper incorporates information from the People, Animals and
their Zoonoses (PAZ) study (Doble and Fevre, 2010). PAZ was a cross-sectional
study of zoonoses in people and animals in western Kenya. The study area was the
same as described in Section 2.1. The population of the study area was 1.4 million
people living in 240,004 homesteads (estimated from the Kenyan Human Population
Census of 2009). The estimated livestock population of 557,418 cattle and 68,484
pigs was obtained from the Divisional Livestock Production Office (DLPO).
The sample size was calculated for an expected prevalence of 2% C. burnetii in cattle
using the equation (Dohoo, 2003):
n= sample size
deff = design effect (5)
z =the confidence interval for a normal distribution taken as 1.96 (95% level)
p =the proportion disease expected in the population
q=1-p
e=the level of precision (5%)
The sample size was calculated as 2300 cattle to be sampled from 412 homesteads
given an average herd size of 5 animals. The study was designed to compare the
seroprevalence of zoonotic diseases in livestock keeping houses to that in non
livestock keeping households. In order to recruit livestock keeping households the
study area was stratified according to the cattle population density which was
calculated from the 2005 livestock census and inflated by 10% per year (Figure 6.1).

Chapter 6 Epidemiology of zoonoses in the community____ 160
The selection of homesteads was done using a two stage cluster design. The study
area was divided into 164 sublocations, which is the smallest administrative unit in
Kenya. The number of homesteads selected from each sublocation was proportional
to the cattle density i.e. more households were sampled in sub-locations with more
livestock. The human sample size was the number of individuals living in the
selected homesteads.
A random set of points was generated within each sublocation using ArcMapTM
version 9.1 and the extension Hawths tools. Maps were provided by the ILRI
geographical information systems unit (http://www.ilri.org/gis/). A handheld GPS
Garmin eTrex®, was used in the field to locate each point. The nearest homestead
within 300 metres of the point was recruited into the study. If there were no
homesteads in the area or the homestead head refused to participate then a backup
point was used. The homestead head was advised of the study aims and objectives
and recruited into the study, and an appointment made for data collection and
sampling the following week.
6.2.2 Sample collection
On the day of sampling, all homesteads members aged over 5 years were invited to
participate. Exclusion criteria included severe anaemia and third trimester pregnancy.
Each participant was individually interviewed with a structured questionnaire that
included questions regarding demographic data, health, and risk factors for zoonotic
disease exposure (Appendix 9). Participants were given a clinical examination by a
trained clinical officer assigned to the project and data were recorded regarding
height, weight, temperature, anaemia, jaundice, and organ enlargement. Participants

Chapter 6 Epidemiology of zoonoses in the community____ 161
under the age of 14 were supervised by an adult relative. The homestead head was
asked a homestead-level questionnaire regarding animal ownership, wealth
indicators, water source, and access to healthcare (Appendix 10). Blood and faecal
samples were collected as described for slaughterhouse workers in Section 2.5.
Figure 6.1 Map of the study area indicating the cattle population numbers for each division,
the sublocation boundaries and the selected homesteads

Chapter 6 Epidemiology of zoonoses in the community____ 162
6.2.3 Sample analysis
Human samples were prepared and tested in the Busia laboratory for blood and
faecal parasites as described in Section 2.6. In addition, faecal samples were
examined for evidence of parasitism using the Kato–Katz technique (Cheesbrough,
2006). Samples were transported to the ILRI Nairobi laboratory for further
serological testing for HIV, leptospirosis, and Q fever as described in Section 2.7.
6.2.4 Data management
Data were recorded in a Palm operating system (Palm OS) personal digital assistant
(PDA) using Pendragon Forms 5.1 (Pendragon Software Corporation). Microsoft®
Access databases were used to manage data.
Variables were recoded in R software version 3.0.2 (R Core Team, 2013). Variables
that were recoded for the purposes of analysis:
Age was coded as a binary variable less or equal to the median age of 35
years.
Variables relating to frequency of an event were recoded as binary
variables to Always/Sometimes versus Rarely/Never.
6.2.5 Spatial analysis
For mapping purposes homesteads were considered positive for each pathogen if one
or more inhabitants were positive for leptospirosis or Q fever, respectively. The
locations of homesteads were mapped using ArcGISTM
(ESRI, Redlands, CA, USA).
6.2.6 Data analysis
For the purposes of this comparison, the population aged over 20 were selected from
the PAZ cross-sectional study (referred to from here as the PAZ adjusted

Chapter 6 Epidemiology of zoonoses in the community____ 163
population). This population was selected for its resemblance to the slaughterhouse
worker population. This process was done in order to reduce any selection bias or
“healthy worker effect” when comparing this population to the slaughterhouse
workers population (Shah, 2009). A subset of questions from the individual
questionnaire regarding demographics, health, and risk factors for zoonotic disease
exposure were used for analysis.
The Survey package (Lumley, 2012, Lumley, 2004) in R was used to adjust for
clustering. Sampling weights were calculated by dividing the number of people per
division (from the Kenyan Human Population Census of 2009) by the number of
people sampled in each division. The svydesign function was used to calculate a
design effect using the following equation. The design effect was used to calculate
adjusted proportions for survey responses.
The apparent seroprevalence estimates for leptospirosis and Q fever were calculated
using the epi.prev function in the EpiR package (Stevenson, 2014b) of R
(http://CRAN.R-project.org/). The seroprevalence results were adjusted using
homestead as a clustering variable in the Survey package of R. The above design
object was used to calculate an adjusted prevalence estimate accounting for the
clustering of the data. The true prevalence estimate accounting for the test sensitivity
and specificity was calculated using truePrev function in the prevalence package
(Devleesschauwer et al., 2013) of R.

Chapter 6 Epidemiology of zoonoses in the community____ 164
6.2.7 Multivariable logistic regression model
Multivariable logistic regression models were developed to identify and quantify risk
factors for leptospirosis and Q fever in the PAZ adjusted population at the individual
level. A multivariable mixed effects logistic regression model was used to account
for the clustering of people within homesteads. The model was developed using
glmer function in the lme4 (Bates, 2014) package. The steps for model development
were:
1. Univariable logistic regression was used to screen 45 variables against
disease exposure. The variables used are listed in Appendix 11.
2. Variables were excluded from analysis if they were strongly correlated
with another variable of interest to avoid multicollinearity problems and
model estimate instability. Correlation analysis for categorical variables
was performed by calculating the phi coefficient of correlation in the
psych package (Revelle, 2014) in R. Variables with a phi coefficient >0.5
were excluded.
3. Variables with a p-value <0.2 in the univariable analysis were then used
to develop a multivariable logistic regression model for each exposure.
4. A backwards stepwise approach was used for model selection by starting
with a full model using all the predictors. Variables with the highest p-
value were dropped in a stepwise fashion until the model with the lowest
AIC was identified.
5. The ORs, CIs, and p-values were calculated from the model.
Chapter 6 Epidemiology of zoonoses in the community____ 165
6.2.8 Diagnostic checking of multivariable mixed effects model
Traditional diagnostic procedures cannot account for the random effects in mixed
effects models. Therefore a number of different approaches were used for model
checking.
1. Variance Inflation Factors (VIFS) were calculated to check for
collinearity. VIFS >4 were considered a problem and the variable
removed from the model
2. Moran’s I were calculated to check for spatial autocorrelation using the
ape package (Paradis E., 2004)
3. The mixed effects models were simplified to the basic model that
included only the disease outcome and the homestead. A second model
was made using only the individual level factors and finally, the complete
fitted multivariable mixed effect model. Median odds ratios (MOR) were
calculated for the three models and compared (Merlo et al., 2005)
4. Percentage change in variance (PCV) was calculated between the three
models (Merlo et al., 2005)
VA=variance in the empty model and VB=variance of model with
explanatory variables

Chapter 6 Epidemiology of zoonoses in the community____ 166
6.3 Results
6.3.1 Demographics of the adjusted PAZ adjusted population
There were 416 homesteads recruited into the PAZ study, which included 2113
people and 983 cattle. For the purposes of this analysis, only the 980 participants
aged over 20 years were included. The demographics of the adjusted PAZ adjusted
population are presented in Table 6.1. The PAZ adjusted population was
predominantly female (60.0%). Figure 6.2 shows the age profile of the PAZ adjusted
population. The majority of the population was aged less than 50 years (72%). Over
two thirds of the population were farmers. Almost 60% of the PAZ adjusted
population owned cattle (Figure 6.3).
Variable % population (95% CI)
(n=980)
Gender
Female 60.0 (56.3–63.8)
Male 40.0 (36.2–43.7)
Education
Primary 80.3 (77.3–83.4)
Secondary 19.7 (16.6–22.7)
Occupation
Farmer 69.1 (65.6–72.6)
Other 30.9 (27.4–34.4)
Knowledge of zoonoses
Don’t know 22.9 (19.7–26.1)
No 57.4 (53.6–61.2)
Yes 19.7 (16.6–22.7)
Table 6.1 Demographics of the People, Animals and their Zoonoses (PAZ) adjusted
population
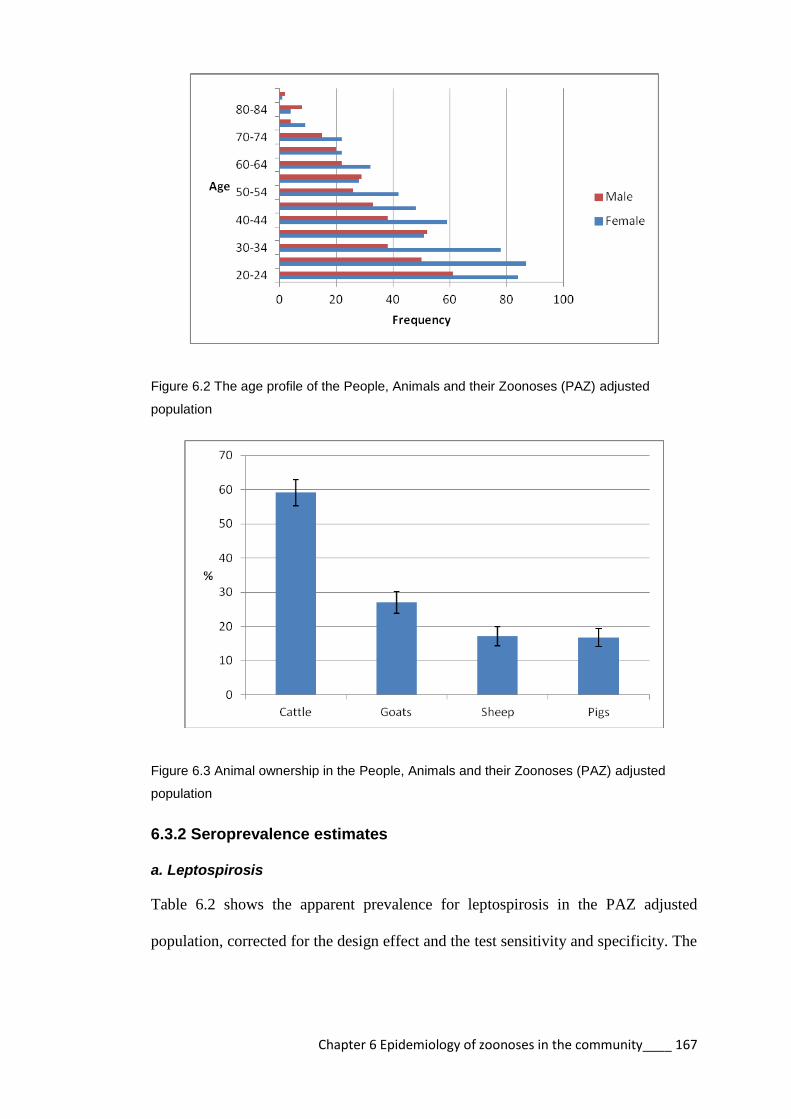
Chapter 6 Epidemiology of zoonoses in the community____ 167
Figure 6.2 The age profile of the People, Animals and their Zoonoses (PAZ) adjusted
population
Figure 6.3 Animal ownership in the People, Animals and their Zoonoses (PAZ) adjusted
population
6.3.2 Seroprevalence estimates
a. Leptospirosis
Table 6.2 shows the apparent prevalence for leptospirosis in the PAZ adjusted
population, corrected for the design effect and the test sensitivity and specificity. The
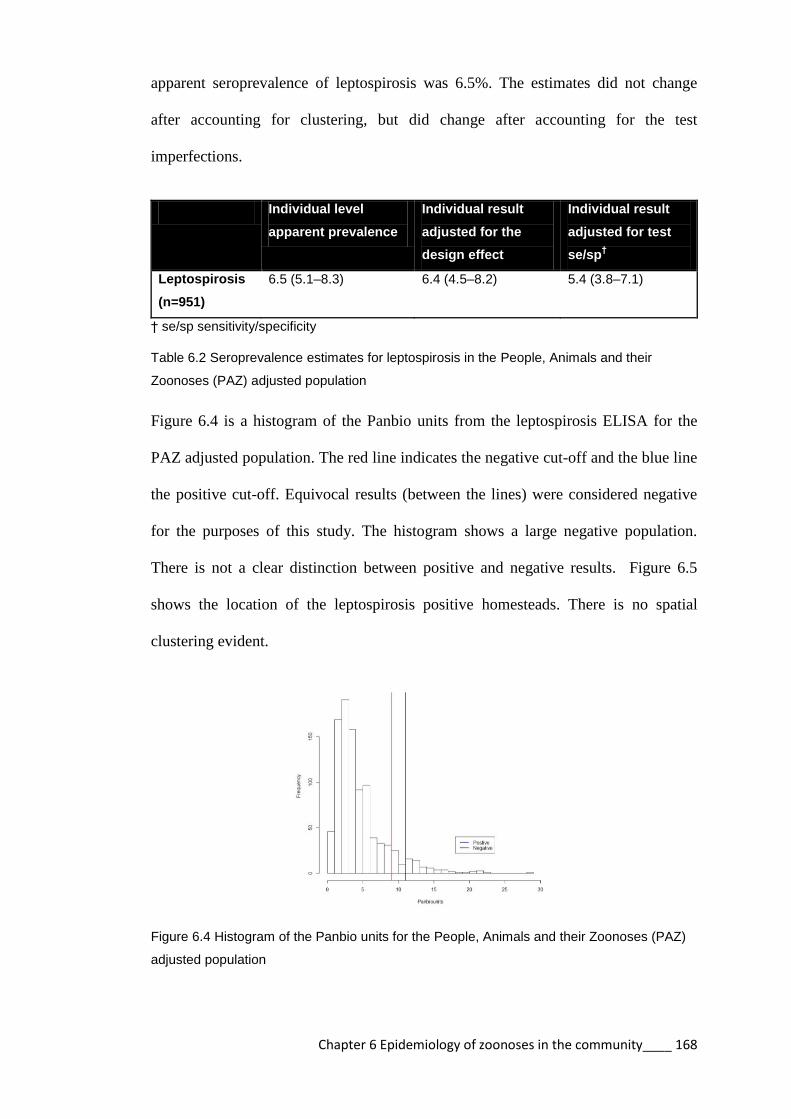
Chapter 6 Epidemiology of zoonoses in the community____ 168
apparent seroprevalence of leptospirosis was 6.5%. The estimates did not change
after accounting for clustering, but did change after accounting for the test
imperfections.
Individual level
apparent prevalence
Individual result
adjusted for the
design effect
Individual result
adjusted for test
se/sp†
Leptospirosis
(n=951)
6.5 (5.1–8.3) 6.4 (4.5–8.2) 5.4 (3.8–7.1)
† se/sp sensitivity/specificity
Table 6.2 Seroprevalence estimates for leptospirosis in the People, Animals and their
Zoonoses (PAZ) adjusted population
Figure 6.4 is a histogram of the Panbio units from the leptospirosis ELISA for the
PAZ adjusted population. The red line indicates the negative cut-off and the blue line
the positive cut-off. Equivocal results (between the lines) were considered negative
for the purposes of this study. The histogram shows a large negative population.
There is not a clear distinction between positive and negative results. Figure 6.5
shows the location of the leptospirosis positive homesteads. There is no spatial
clustering evident.
Figure 6.4 Histogram of the Panbio units for the People, Animals and their Zoonoses (PAZ)
adjusted population
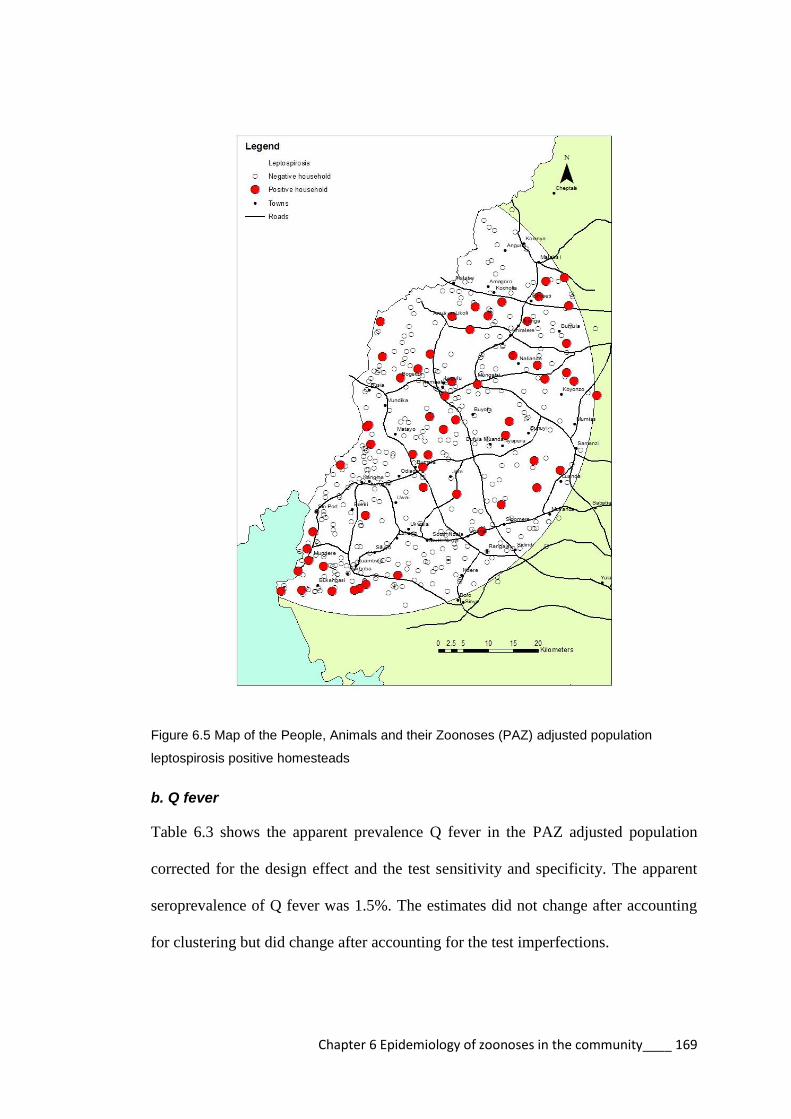
Chapter 6 Epidemiology of zoonoses in the community____ 169
Figure 6.5 Map of the People, Animals and their Zoonoses (PAZ) adjusted population
leptospirosis positive homesteads
b. Q fever
Table 6.3 shows the apparent prevalence Q fever in the PAZ adjusted population
corrected for the design effect and the test sensitivity and specificity. The apparent
seroprevalence of Q fever was 1.5%. The estimates did not change after accounting
for clustering but did change after accounting for the test imperfections.
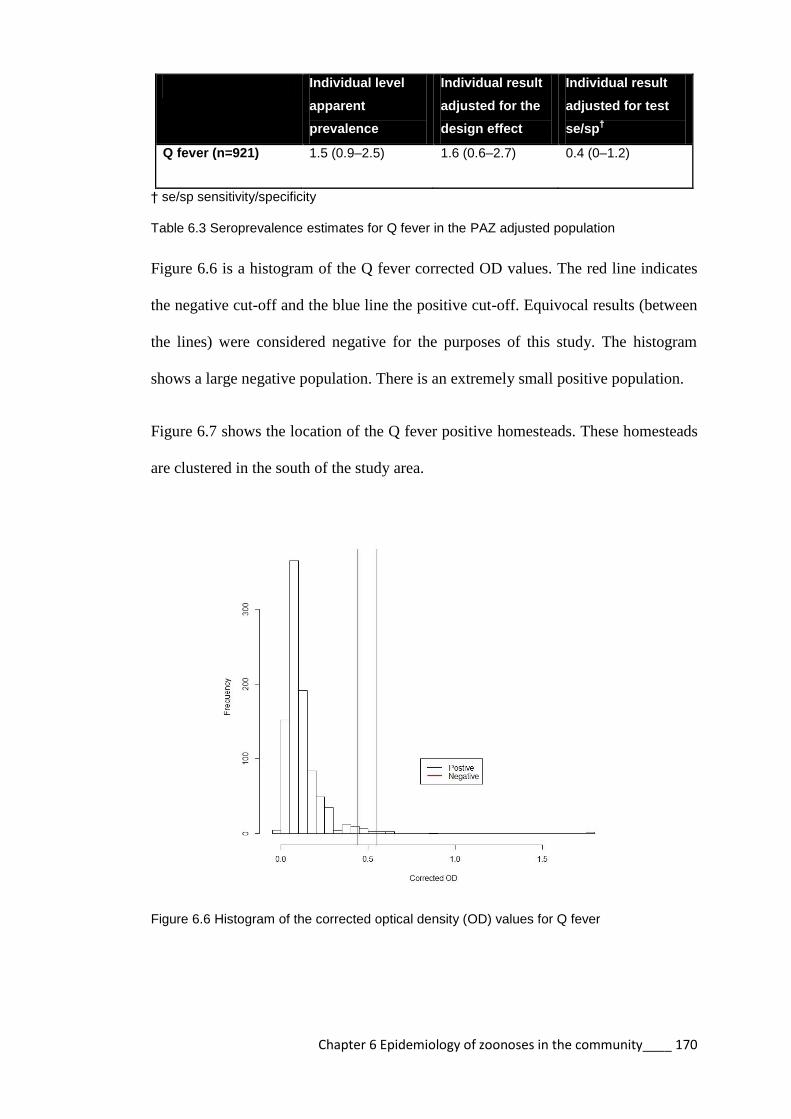
Chapter 6 Epidemiology of zoonoses in the community____ 170
Individual level
apparent
prevalence
Individual result
adjusted for the
design effect
Individual result
adjusted for test
se/sp†
Q fever (n=921) 1.5 (0.9–2.5) 1.6 (0.6–2.7) 0.4 (0–1.2)
† se/sp sensitivity/specificity
Table 6.3 Seroprevalence estimates for Q fever in the PAZ adjusted population
Figure 6.6 is a histogram of the Q fever corrected OD values. The red line indicates
the negative cut-off and the blue line the positive cut-off. Equivocal results (between
the lines) were considered negative for the purposes of this study. The histogram
shows a large negative population. There is an extremely small positive population.
Figure 6.7 shows the location of the Q fever positive homesteads. These homesteads
are clustered in the south of the study area.
Figure 6.6 Histogram of the corrected optical density (OD) values for Q fever
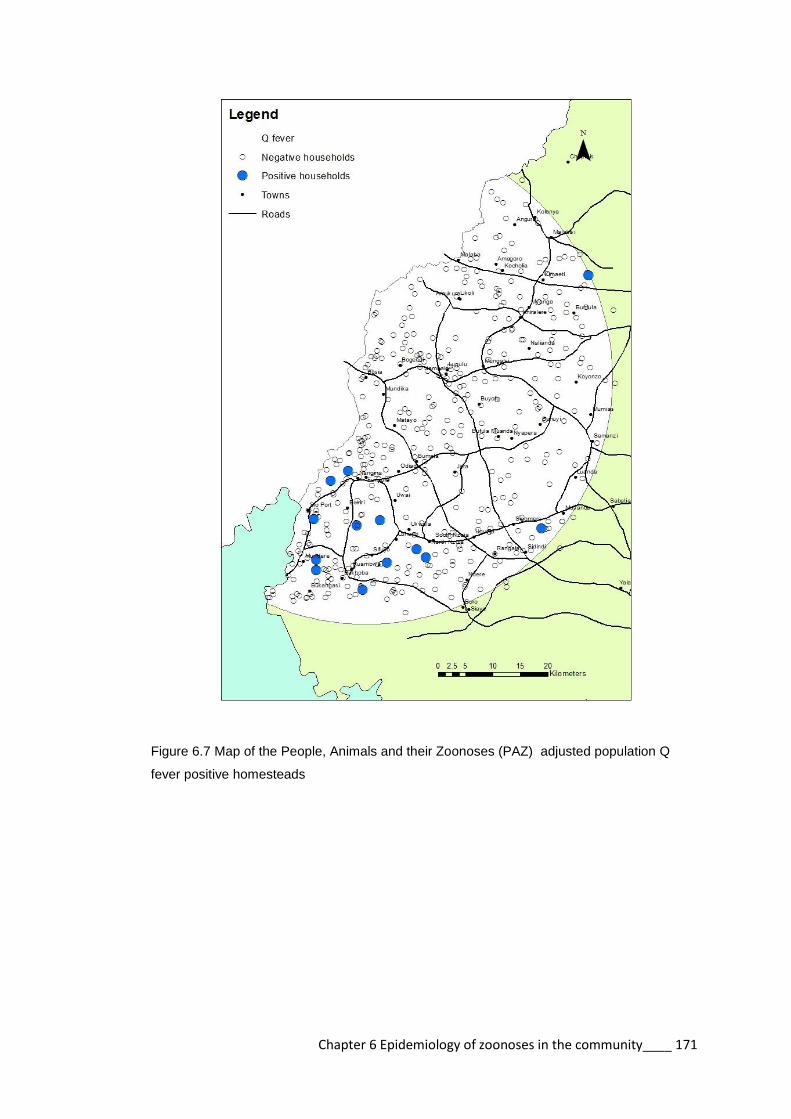
Chapter 6 Epidemiology of zoonoses in the community____ 171
Figure 6.7 Map of the People, Animals and their Zoonoses (PAZ) adjusted population Q
fever positive homesteads
Chapter 6 Epidemiology of zoonoses in the community____ 172
6.3.3 Leptospirosis
a. Univariable logistic regression
The univariable logistic regression analysis identified 9 variables with p-value <0.2
(Table 6.4). The variables that were significantly associated with leptospirosis
seropositivity include: milking cattle (OR 2.0); milking goats or sheep (OR 4.5);
attending to animal births (OR 2.1); and being currently infected with Schistosoma
mansoni (OR 2.7).
Figure 6.8 is a correlation matrix between these variables. There was a medium
correlation between gender and milking cattle but no highly correlated variables.

Chapter 6 Epidemiology of zoonoses in the community____ 173
Variable % population
(n)
% positive (n) OR (95% CI) p–value
Gender
Female 59.2 (564) 5.3 (30) 1 Ref
Male 40.8 (389) 8.2 (32) 1.6 (0.9–2.9) 0.107
Hunting
No 96.0 (914) 6.2 (57) 1 Ref
Yes 4.0 (38) 13.2 (5) 2.4 (0.8–7.4) 0.117
Milking cattle
No 66.4 (631) 5.1 (32) 1 Ref
Yes 33.6 (320) 9.4 (30) 2.0 (1.1–3.5) 0.024
Milking goats or sheep
No 97.2 (924) 6.1 (56) 1 Ref
Yes 2.8 (27) 22.2 (6) 4.5 (1.6–12.4) 0.004
Assisting animal births
No 86.0 (818) 5.7 (47) 1 Ref
Yes 14.0 (133) 11.3 (15) 2.1 (1.1–4.3) 0.031
Borehole
No 60.4 (576) 7.6 (44) 1 Ref
Yes 39.6 (377) 4.8 (18) 0.6 (0.3–1.1) 0.120
Spring
No 63.9 (609) 5.3 (32) 1 Ref
Yes 36.1 (344) 8.7 (30) 1.7 (1.0–2.9) 0.039
S. mansoni
No 93.2 (861) 6.0 (52) 1 Ref
Yes 6.8 (63) 14.3 (9) 2.7 (1.2–6.3) 0.021
HIV
No 89.2 (850) 6.9 (59) 1 Ref
Yes 10.8 (103) 2.9 (3) 0.4 (0.1–1.5) 0.179
Table 6.4 Odds ratios for leptospirosis in People, Animals and their Zoonoses (PAZ)
adjusted population.

Chapter 6 Epidemiology of zoonoses in the community____ 174
Gender Hunting Milking
cattle
Milking
goat/sheep
Animal
births S. mansoni
HIV Spring Borehole
Gender 0.07 0.46 -0.02 0.03 0.01 -0.11 0.33 -0.18
Hunting 0.07 0.08 0.14 0.05 -0.04 -0.03 -0.05
Milking cattle 0.07 0.14 -0.01 -0.03 0.43 -0.44
Milking
goats/sheep
0.13 0.08 -0.02 -0.05 -0.04
Animal births 0.1 -0.03 -0.05 -0.12
S. mansoni -0.03 -0.09 -0.1
HIV -0.02 0.03
Spring -0.29
Borehole
Figure 6.8 Correlation matrix for variables for exposure to leptospirosis in People, Animals and their Zoonoses (PAZ) adjusted population

Chapter 6 Epidemiology of zoonoses in the community____ 175
b. Multivariable model selection
The multivariable model was developed with the 9 selected variables. Table 6.5
demonstrates the models that were created by the backward stepwise selection. The
final model is highlighted in bold and has an AIC of 437.0. The last model in the
table is one step past the model with the best fit.
Model AIC
leptoresult ~ gender + hunting + milking_shoats* + animal_births +
milking_cattle +Smansoni + HIV_Result + home_source_water_wet_borehole +
home_source_water_wet_spring + (1 | homestead_id)
,family=binomial(logit),data=pazadultlepto
441.2
leptoresult ~ sex + hunting + milking_shoats+ animal_births + milking_cattle +
Smansoni + HIV_Result + home_source_water_wet_spring + (1 |
homestead_id) ,family=binomial(logit),data=pazadultlepto
439.4
leptoresult ~ hunting1 + milking_shoats + animal_births + milking_cattle +
Smansoni + HIV_Result + home_source_water_wet_spring + (1 |
homestead_id) ,family=binomial(logit),data=pazadultlepto
438.0
leptoresult ~ hunting1 + milking_shoats + animal_births + milking_cattle +
Smansoni + home_source_water_wet_spring + (1 | homestead_id)
,family=binomial(logit),data=pazadultlepto
437.5
leptoresult ~ hunting1 + milking_shoats + milking_cattle + Smansoni +
home_source_water_wet_spring + (1 | homestead_id)
,family=binomial(logit),data=pazadultlepto
437.2
leptoresult ~ milking_shoats + milking_cattle + Smansoni +
home_source_water_wet_spring + (1 | homestead_id)
,family=binomial(logit),data=pazadultlepto
437.0
leptoresult ~ milking_shoats + Smansoni + home_source_water_wet_spring +
(1 | homestead_id) ,family=binomial(logit),data=pazadultlepto
439.4
*Shoats – colloquial term for goats and sheep
Table 6.5 Model selection for leptospirosis in the People, Animals and their Zoonoses (PAZ)
adjusted population.

Chapter 6 Epidemiology of zoonoses in the community____ 176
c. Final multivariable model
The results of the final multivariable logistic regression model are indicated in Table
6.6. The risk factors significantly associated with leptospirosis exposure in the PAZ
adjusted population were: milking cattle; milking sheep/goats; being infected with S.
mansoni; and having a spring as a water source.
Variables OR (95% CI) p-value VIFS
Milking cattle 1.8 (1.0–3.1) 0.034 1.036
Milking goats/sheep 4.1 (1.5–11.2) 0.005 1.062
S. mansoni 3.2 (1.4–7.0) 0.004 1.037
Water source –
spring
2.1 (1.2–3.6) 0.009 1.068
Table 6.6 Results of multivariable logistic regression for exposure to leptospirosis in the
People, Animals and their Zoonoses (PAZ) adjusted population
d. Model checking
The Morans I measure for spatial autocorrelation was not significant (p=0.40)
showing that there is no spatial autocorrelation in the model.
Table 6.7 shows that the mixed model has the lowest AIC and a median OR of 1
indicating that the clustered design did not affect the results.

Chapter 6 Epidemiology of zoonoses in the community____ 177
Variable Empty model Model with
individual
variables
Model with
individual and
slaughterhouse
variables
Individual variables
Milking cattle 1.9 (1.1–3.2)* 1.8 (1.0–3.1)*
Milking sheep/goats 3.4 (1.3–9.0)* 4.1 (1.5–11.2)**
S. mansoni 2.7 (1.2–5.8)* 3.2 (1.4–7.0)**
Homestead variables
Water source – spring 2.1 (1.2–3.6)**
Variance (SE) 0.793 6.5x10⁻¹¹
8.0x10⁻¹¹
Proportional change in
variance
Reference 100% 100%
Median OR 1.18 1.00 1.00
AIC 462.0 442.0 437.0
*p <0.05, **p < 0.01, and ***p < 0.001
Table 6.7 Individual and homestead level predictors associated with leptospirosis in the
People, Animals and their Zoonoses (PAZ) adjusted population by multivariable logistic
regression

Chapter 6 Epidemiology of zoonoses in the community____ 178
6.3.3 Q fever
a. Univariable logistic regression
The univariable logistic regression analysis identified 3 variables with p values <0.2
(Table 6.8). The only variable that was significantly associated with Q fever
seropositivity was the making of manure. Figure 6.9 is a correlation matrix between
these variables.
Variable % population
(n)
% positive (n) OR (95% CI) p-value
Occupation
Other 32.6 (297) 1.0 (3) 1 Ref
Farmer 67.4 (613) 1.8 (11) 16.7 (0.7–376) 0.076
Manure
No 37.4 (344) 1.4 (5) 1 Ref
Yes 62.6 (576) 1.6 (9) 23.4 (1.1–48.2) 0.041
Wounds
No 97.5 (898) 12 (1.3) 1 Ref
Yes 2.5 (23) 2 (8.7) 10.6 (0.4–27.0) 0.153
Table 6.8 Odd ratios for Q fever in People, Animals and their Zoonoses (PAZ) adjusted
population.
Figure 6.9 Correlation matrix for variables for exposure to Q fever in People, Animals and
their Zoonoses (PAZ) adjusted population
Farmer Manure Wounds
Farmer 0.1 -0.06
Manure 0.01
Wounds

Chapter 6 Epidemiology of zoonoses in the community____ 179
b. Multivariable model selection
The multivariable model was developed with the selected 3 variables. Table 6.9
demonstrates the models that were created by the backward stepwise selection. The
final model is highlighted in bold with an AIC of 99.35. The last model in the table is
one step past the model with the best fit.
Model AIC
qfever ~ occupation + wounds + animal_manure + (1 | homestead_id)
,family=binomial(logit),data=pazadultlepto
99.38
qfever ~ occupation + animal_manure +(1 | homestead_id)
,family=binomial(logit),data=pazadultlepto
99.35
qfever ~ animal_manure1+ (1 | homestead_id)
,family=binomial(logit),data=pazadultlepto)
101.20
Table 6.9 Model selection for Q fever in People, Animals and their Zoonoses (PAZ) adjusted
population
c. Final multivariable model
The results of the final multivariable logistic regression model are indicated in Table
6.10. There were no risk factors identified as significantly associated with Q fever
exposure in the PAZ adjusted population.
Variables OR (95% CI) p-value VIFS
Occupation – farmer 14.2 (0.4–472) 0.137 1.057
Manure 15.0 (0.5–416) 0.109 1.057
Table 6.10 Results of multivariable logistic regression for exposure to Q fever in the People,
Animals and their Zoonoses (PAZ) adjusted population

Chapter 6 Epidemiology of zoonoses in the community____ 180
d. Model checking
The Morans I measure for spatial autocorrelation was not significant (p=0.16)
showing that there is no spatial autocorrelation in the model.
The median ORs were not calculated, as the model did not include any homestead
level predictors.

Chapter 6 Epidemiology of zoonoses in the community____ 181
6.4 Discussion
The PAZ adjusted population was predominantly young and female. A large
proportion (80.3%) of the PAZ adjusted population had primary level education
which is consistent with the report of the Kenya Demographic and Health Survey for
the region (KNBS, 2010). The majority of the population were farmers (69.1%)
which has also been reported elsewhere (Adazu et al., 2005). There was a paucity of
knowledge regarding zoonotic disease with only 20% of people being aware of
zoonoses. A large number of the population had contact with livestock, which is a
risk factor for zoonotic diseases.
6.4.1 Leptospirosis
The apparent prevalence of leptospirosis in the PAZ adjusted population was 6.5%.
The clustered design of the sample did not affect the prevalence markedly.
Adjustments for the test sensitivity and specificity showed the true prevalence to be
5.4%. The ELISA output shows a large negative population but there is an unclear
distinction between the positive and negative populations (Figure 6.4). As discussed
in previous chapters regarding the slaughterhouse worker results the ELISA needs to
be validated in the Kenyan setting. There was no apparent spatial clustering of the
leptospirosis positive homesteads (Figure 6.5).
The results of the multivariable logistic regression model for leptospirosis in the
adjusted PAZ adjusted population indicated a number of risk factors for exposure,
which will be discussed individually (Figure 6.10).
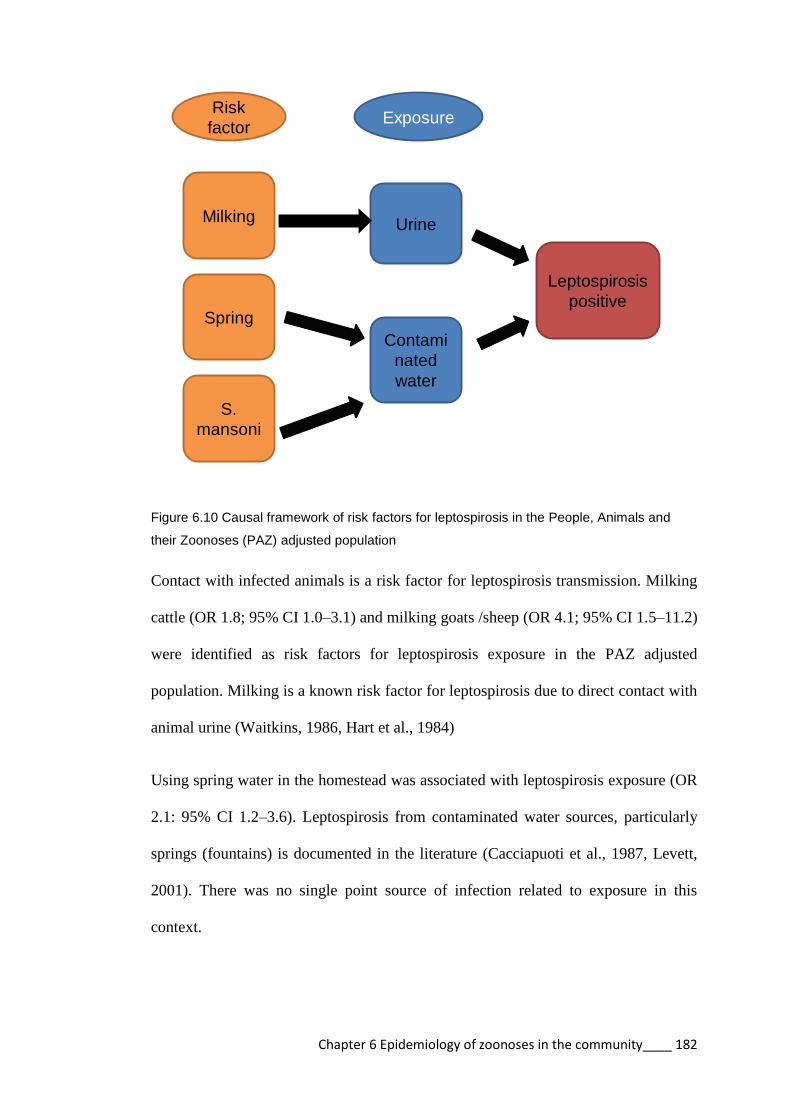
Chapter 6 Epidemiology of zoonoses in the community____ 182
Leptospirosis
positive
Urine
Contami
nated
water
S.
mansoni
Spring
Milking
Risk
factorExposure
Figure 6.10 Causal framework of risk factors for leptospirosis in the People, Animals and
their Zoonoses (PAZ) adjusted population
Contact with infected animals is a risk factor for leptospirosis transmission. Milking
cattle (OR 1.8; 95% CI 1.0–3.1) and milking goats /sheep (OR 4.1; 95% CI 1.5–11.2)
were identified as risk factors for leptospirosis exposure in the PAZ adjusted
population. Milking is a known risk factor for leptospirosis due to direct contact with
animal urine (Waitkins, 1986, Hart et al., 1984)
Using spring water in the homestead was associated with leptospirosis exposure (OR
2.1: 95% CI 1.2–3.6). Leptospirosis from contaminated water sources, particularly
springs (fountains) is documented in the literature (Cacciapuoti et al., 1987, Levett,
2001). There was no single point source of infection related to exposure in this
context.
Chapter 6 Epidemiology of zoonoses in the community____ 183
Infection with S. mansoni was identified as a risk factor for leptospirosis in the PAZ
adjusted population (OR 3.2; 95% CI 1.4–7.0). This result is likely indicative of a co-
infection due to exposure to the same water source. S. mansoni is transmitted through
contact with infected water (WHO, 2014b), and leptospirosis can be transmitted from
contaminated water though cuts (Faine, 1999). The southern part of the study area
bordering Lake Victoria is a high risk area for S. mansoni (Handzel et al., 2003). This
area is prone to flooding, and people use the lake for fishing, swimming, and
collecting water, which are risk factors for leptospirosis (Jackson et al., 1993,
Christova et al., 2003).
6.4.2 Q fever
The apparent prevalence of Q fever was 1.5%. There was no effect on the prevalence
from the clustered design of the sample. However the true prevalence was reduced to
0.4% after adjusting for the test sensitivity and specificity. There were an extremely
small number of positive samples evident from the ELISA output with only a couple
of samples having a clear distinction from the negative population (Figure 6.6). The
Q fever cases are clustered in the southern part of the study area (Figure 6.7). This
area also has the greatest cattle population density (Figure 6.1).
The results of the multivariable logistic regression model for Q fever in the PAZ
adjusted population did not show any significant variables for seropositivity. The two
variables in the model were: being a farmer (OR 14.2; 95% CI 0.4–472); and having
contact with manure (OR 15.0; 95% CI 0.5–416). Both variables had extremely wide
confidence intervals. The wide intervals suggest a large amount of uncertainty
regarding these results. In order to verify these interactions further study would need
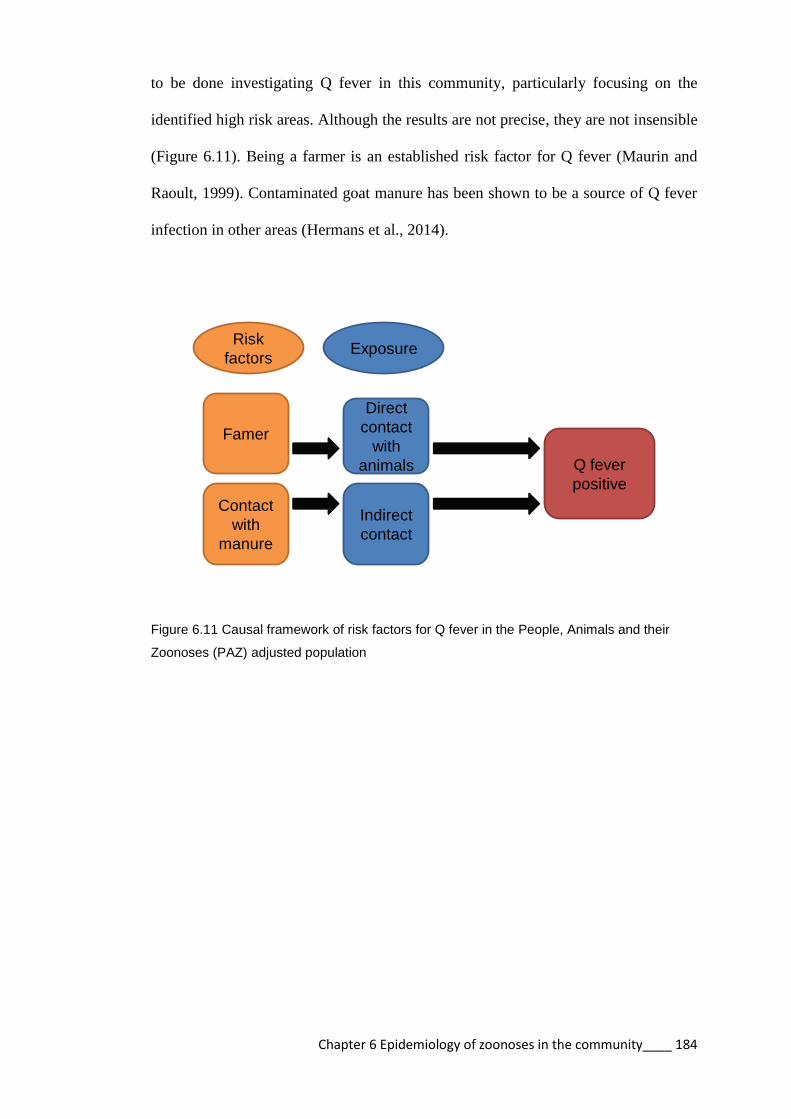
Chapter 6 Epidemiology of zoonoses in the community____ 184
to be done investigating Q fever in this community, particularly focusing on the
identified high risk areas. Although the results are not precise, they are not insensible
(Figure 6.11). Being a farmer is an established risk factor for Q fever (Maurin and
Raoult, 1999). Contaminated goat manure has been shown to be a source of Q fever
infection in other areas (Hermans et al., 2014).
Q fever
positive
Direct
contact
with
animals
Indirect
contact
Contact
with
manure
Famer
Risk
factorsExposure
Figure 6.11 Causal framework of risk factors for Q fever in the People, Animals and their
Zoonoses (PAZ) adjusted population

Chapter 6 Epidemiology of zoonoses in the community____ 185
6.5 Conclusion
This study reports the seroprevalence of leptospirosis and Q fever in the community
of western Kenya. The study findings suggest that the level of zoonotic disease
awareness in the community is very low. The hypothesis for this study was that
people who have contact with animals are more at risk of zoonotic disease.
The hypothesis that contact with animals is a risk factor for leptospirosis and Q fever
is true, but the study identified other factors related to exposure. Leptospirosis
seropositivity in the community was associated with contact with cattle, goats, and
sheep through milking which supports the original hypothesis. However exposure to
contaminated water sources (springs as a source of water as well as Lake Victoria)
were also risk factors for leptospirosis seropositivity in this community. Indirect
contact with animals was a risk factor for Q fever seropositivity (contact with animal
manure).
It is clearly evident from the results described in this chapter that the risk factors for
zoonotic disease in the PAZ adjusted population were predominantly contact with
animals and animal products. However the epidemiology of leptospirosis was
complicated by contact with contaminated water sources.
Further investigation of high risk areas for zoonotic disease and targeted control
programmes for these groups would be advised.

Conclusion______________________________ 186
Chapter 7
Comparing the risks for exposure to
leptospirosis and Q fever between
slaughterhouse workers and the
community
Conclusion______________________________ 187
7.1 Introduction
Slaughterhouse workers, veterinarians, and farmers are often cited as high risk
groups for zoonotic disease but this is rarely quantified by comparison to the general
population (Chan et al., 1987, Schoonman and Swai, 2009, Sharma et al., 2006).
The hypotheses of this study were:
1. slaughterhouse workers are healthier than the general population
2. slaughterhouse workers are more aware of zoonoses than the general
population
3. slaughterhouse workers are more exposed to zoonotic disease than the
community
4. the geospatial zoonotic disease risk in slaughterhouse workers resembles
that in the human and cattle population of the study area
This chapter compares health indices between slaughterhouse workers and the PAZ
adjusted population to determine if slaughterhouse workers are more or less healthy
than the general population. The chapter also reports the seroprevalence and the
quantified risk of leptospirosis and Q fever in slaughterhouse workers as compared to
that of the concomitant general population to determine if slaughterhouse workers
are more exposed to zoonotic disease. Finally, the spatial distribution of exposure to
these pathogens is reported and compared for slaughterhouse workers and the PAZ
adjusted population.

Conclusion______________________________ 188
7.2 Methods
7.2.1 Sampling frame
The data used for this paper incorporates information from the slaughterhouse
worker sample. This sample has been extensively described in previous chapters and
will not be repeated here unless referred to for comparison. Data from the PAZ study
(Doble and Fevre, 2010) described in Section 6.2 are included for comparison. The
PAZ adjusted population consisted of only individuals aged over 20.
In addition, disease data regarding Q fever in cattle in the study area are included in
order to geospatially compare with disease in people.
Cattle were sampled at recruited homesteads. The person responsible for the animals
was asked information on the health and parity of each animal and the animals were
examined by an animal health technician or veterinarian assigned to the project and
data recorded for demeanour, coat condition, body condition, and presence of
external parasites.
24mls of blood was collected from the jugular vein into two 10ml plain and a 4ml
EDTA BD Vaccutainers®. All samples were transported in a cool box to the ILRI
laboratory in Busia for analysis.
Animal blood samples were prepared in the Busia laboratory. Plain blood tubes were
centrifuged for 20 minutes at 3000 rpm and the sera aliquoted into Nalgene® 2 ml
cryovials and kept frozen at −40°C. Further serological testing was performed at the
ILRI Nairobi laboratory for Q fever using the CHEKIT Q Fever Antibody ELISA
Test Kit (IDEXX Laboratories, Wetherby, UK). This assay detects antibodies to C.

Conclusion______________________________ 189
burnetii in ruminant serum, plasma and milk samples. Sera were prediluted 1:400
using CHECKIT wash solution. 100µl of diluted samples and controls were
dispensed into wells of a precoated microtitre plate and incubated at 37ºC for 60
minutes. The plate was washed with approximately 300µl CHEKIT wash solution 3
times. 100µl of conjugate was added to each well and incubated at 37ºC for 60
minutes in a humid chamber. The plate was washed with approximately 300µl
CHEKIT wash solution 3 times. 100µl of TMB substrate was added to each well and
the plate incubated at room temperature for 15 minutes. 100µl of stop solution was
added to each well and the results read at a wavelength of 450nm. The OD results of
duplicate samples were averaged and the following equation applied to the results:
Values less than 30% were considered negative; and values greater than or equal to
40% were considered positive with values in between considered equivocal. The
CHECKIT Q fever ELISA is reported by the manufacturer to have 100% sensitivity
and 100% specificity.
7.2.2 Data management
Microsoft® Access databases were used to manage data.
7.2.3 Variable selection
Variables were selected from both the PAZ individual and the slaughterhouse
individual datasets. Variables were incorporated into a combined dataset for analysis.

Conclusion______________________________ 190
The criteria for inclusion were that the questions had to be asked in the same manner
and coded or recoded using the same methodology. Variables selected included:
knowledge of zoonoses – how many participants knew that animals could
be a source of human disease
Level of education
Smoking behaviour
Latrine use
Animal ownership
HIV
Parasitic condition tested
Reported health conditions
Use of medicines
7.2.4 Data analysis
A combined dataset was created in R using matching variables from the
slaughterhouse workers’ dataset and the PAZ dataset. Univariable logistic regression
was used to compare health indices between the two datasets in the lme4 package.
(Bates, 2014). Univariable logistic regression was used to compare prevalence
estimates between slaughterhouse workers and the PAZ adjusted population in the
lme4 package. A univariable mixed effects logistic regression model was used to
account for the clustering of people within homesteads and slaughterhouses. Age and
gender were added as fixed effects to the multivariable mixed effects model as these
factors were expected to confound the results.

Conclusion______________________________ 191
7.2.4 Spatial analysis
For mapping purposes slaughterhouses and homesteads were considered positive for
each pathogen if one or more inhabitants were positive for leptospirosis or Q fever
respectively. Kernel smoothing was used to assess the density of positive
slaughterhouses and homesteads using the sparr package (Davies et al., 2011) in R
with a fixed bandwidth of 5km and correction for edge effects. The kernel intensity
of seropositive slaughterhouses/homesteads was divided by the kernel intensity of
the seronegative slaughterhouses/homesteads in the study area creating a “relative
risk” surface. This technique does not assess clustering as conducted in Chapter 4 but
produces spatially smooth risk maps that allow areas where the greatest relative risk
for seropositivity to be identified.

Conclusion______________________________ 192
7.3 Results
7.3.1 Comparison between slaughterhouse workers and the PAZ
adjusted population
a. Knowledge and risk behaviours
Univariable logistic regression analysis examined the difference in knowledge, risk
behaviours, and animal contacts between slaughterhouse workers and the PAZ
adjusted population. The differences in knowledge and risk behaviours between
slaughterhouse workers and the PAZ adjusted population are presented in Table 7.1.
Slaughterhouse workers were less educated with 0.3 times the odds of having
secondary education than the PAZ adjusted population. Slaughterhouse workers were
more likely to smoke (OR 2.3). Slaughterhouse workers were more likely to use the
latrine every time they defecated (OR 3.8).
Apparent
prevalence % (n)
OR (95% CI) p–value
Zoonoses awareness
PAZ 20.1 (196) 1 Ref
SHW 31.2 (230) 1.2 (0.9–1.7) 0.154
Secondary education
PAZ 20.3 (199) 1 Ref
SHW 14.9 (110) 0.3 (0.2–0.5) <0.001
Smoking regularly
PAZ 7.2 (70) 1 Ref
SHW 23.4 (173) 2.3 (1.6–3.2) <0.001
Use latrine every time
PAZ 86.9 (849) 1 Ref
SHW 81.1 (569) 3.8 (2.0–7.0) <0.001
Table 7.1 Comparison of knowledge and risk behaviours between slaughterhouse workers
and People, Animals and their Zoonoses (PAZ) adjusted population

Conclusion______________________________ 193
b. Animal contacts
Table 7.2 presents the univariable logistic regression results for animal contacts
between slaughterhouse workers and the PAZ adjusted population. Both
slaughterhouse workers and the PAZ adjusted population were equally likely to own
cattle (OR 1.0). Slaughterhouse workers were less likely to own sheep (OR 0.4) but
more likely to own goats (OR 2.3) and pigs (OR 1.6).
Apparent
prevalence % (n)
OR (95% CI) p–value
Own cattle
PAZ 63.3 (620) 1 Ref
SHW 65.9 (486) 1.0 (0.5–2.4) 0.928
Own sheep
PAZ 32.2 (316) 1 Ref
SHW 15.3 (113) 0.4 (0.3–0.5) <0.001
Own goats
PAZ 20.0 (196) 1 Ref
SHW 26.6 (196) 2.3 (1.8–2.9) <0.001
Own pigs
PAZ 20.9 (205) 1 Ref
SHW 30.1 (222) 1.6 (1.3–2.0) <0.001
Dog contact
PAZ 75.3 (738) 1 Ref
SHW 76.4 (564) 1.0 (0.6–1.6) 0.990
Table 7.2 Comparison of animal ownership between slaughterhouse workers and People,
Animals and their Zoonoses (PAZ) adjusted population

Conclusion______________________________ 194
C. Diagnosed disease
Table 7.3 presents the results of the univariable logistic regression comparing
selected health indices between slaughterhouse workers and the PAZ adjusted
population. Slaughterhouse workers had 1.8 times the odds of having HIV at the time
of interview than the PAZ adjusted population. Slaughterhouse workers were more
likely to have malaria (OR 1.5). Slaughterhouse workers had increased odds of
having a wound at the time of the interview (OR 2.4) (Table 7.3).
Apparent prevalence
% (n)
OR (95% CI) p–value
HIV
PAZ 10.9 (106) 1
SHW 12.1 (89) 1.8 (1.1–2.9) 0.020
Malaria at time of interview
PAZ 11.0 (108) 1
SHW 15.2 (110) 1.5(1.1–2.3) 0.056
Wounds
PAZ 2.7 (26) 1
SHW 7.7 (57) 2.4 (1.3–4.7) 0.008
Entamoeba histolytica
PAZ 28.6 (270) 1
SHW 15.7 (114) 0.6 (0.4–0.9) 0.004
Hookworm
PAZ 35.2 (332) 1
SHW 30.7 (223) 0.8 (0.6–1.1) 0.111
Schistosoma mansoni
PAZ 8.6 (81) 1
SHW 3.7 (27) 0.3 (0.008–21.3) 0.542
Table 7.3 Comparison of select diagnosed diseases and clinical symptoms between
slaughterhouse workers and the People, Animals and their Zoonoses (PAZ) adjusted
population

Conclusion______________________________ 195
d. Self reported disease episodes
Slaughterhouse workers had reduced odds for backache (OR 0.7); headache (OR
0.7); diarrhoea (OR 0.7); and abdominal pain (OR 0.6) (Table 7.4). However they
had increased odds for having a cough (OR 1.4). Slaughterhouse workers had higher
odds for taking medication in the past 3 months: antibiotic (OR 2.4); anti-
inflammatory (OR 2.1); and anti-malarials (OR 3.8) (Table 7.5).
Prevalence % (n) OR (95% CI) p–value
Cough
PAZ 45.8 (449) 1
SHW 50.0 (369) 1.4 (1.1–1.8) 0.008
Fever
PAZ 61.7 (605) 1
SHW 62.6 (462) 1.3(1.0–1.6) 0.060
Joint pain
PAZ 61.5 (603) 1
SHW 53.4 (394) 0.9 (0.7–1.1) 0.258
Backache
PAZ 66.6 (653) 1
SHW 47.8 (353) 0.7 (0.5–0.9) 0.005
Headache
PAZ 76.6 (751) 1
SHW 61.8 (456) 0.7(0.6–0.9) 0.022
Diarrhoea
PAZ 29.0 (283) 1
SHW 21.5 (159) 0.7(0.5–0.9) 0.032
Weight loss
PAZ 15.7 (154) 1
SHW 12.9 (95) 0.9 (0.6–1.3) 0.586
Abdominal pain
PAZ 61.1 (599) 1
SHW 41.6 (307) 0.6 (0.4–0.7) <0.001
Table 7.4 Comparison of self reported symptoms between slaughterhouse workers and
People, Animals and their Zoonoses (PAZ) adjusted population

Conclusion______________________________ 196
Apparent
prevalence % (n)
OR (95% CI) p-value
Antibiotic
PAZ 10.2 (102) 1
SHW 17.2 (127) 2.4 (1.6–3.5) <0.001
Anti-inflammatory
PAZ 33.1 (329) 1
SHW 45.4 (335) 2.1 (1.6–2.7) <0.001
Anti-malarial
PAZ 9.8 (98) 1
SHW 23.3 (172) 3.8 (2.6–5.7) <0.001
Table 7.5 Comparison of recent medications between slaughterhouse workers and People,
Animals and their Zoonoses (PAZ) adjusted population
e. Leptospirosis seroprevalence
The apparent seroprevalence of leptospirosis in the slaughterhouse workers was
13.4% and in the PAZ adjusted population was 6.5%. The apparent and adjusted
seroprevalence estimates are indicated in Table 7.6. The OR for exposure to
leptospirosis in slaughterhouse workers compared with the PAZ adjusted population
was 2.3 (95% CI 1.6–3.4; p <0.001).
Table 7.6 Prevalence of leptospirosis in slaughterhouse workers and the People, Animals
and their Zoonoses (PAZ) adjusted population
Apparent
prevalence
Prevalence
adjusted for
clustering
Prevalence
adjusted for
tests
OR p–
value
Leptospirosis
Slaughterhouse
workers n=737
13.4
(11.1–16.1)
13.6
(10.9–16.4)
12.7
(10.2–15.4)
2.3
(1.6–3.4)
<0.001
PAZ people
n=951
6.5 (5.1–8.3) 6.4 (4.5–8.2) 5.4 (3.8 –7.1) 1

Conclusion______________________________ 197
f. Q fever seroprevalence
The apparent seroprevalence of Q fever in slaughterhouse workers was 4.5% and in
the PAZ adjusted population was 1.5%. The apparent and adjusted seroprevalence
estimates are indicated in Table 7.7. The prevalence of Q fever was reduced in both
groups after accounting for the sensitivity and specificity of the tests. The OR for
exposure to Q fever in slaughterhouse workers compared with the PAZ adjusted
population was 1.9 (95% CI 1.0–3.8; p=0.060).
Table 7.7 Prevalence of Q fever in slaughterhouse workers and the People, Animals and
their Zoonoses (PAZ) adjusted population
Apparent
prevalence
Prevalence
adjusted for
clustering
Prevalence
adjusted for
tests
OR p–
value
Q fever
Slaughterhouse
workers n=737
4.5
(3.2–6.2)
4.6
(3.1–6.1)
3.4
(1.9–5.2)
1.9
(1.0–3.8)
0.060
PAZ people
n=921
1.5 (0.9–2.5) 1.6 (0.6–2.7) 0.4 (0–1.3) 1

Conclusion______________________________ 198
7.3.2 Spatial analysis
The following maps show the spatial risk for leptospirosis and Q fever in
slaughterhouse workers and the PAZ adjusted sample.
a. Leptospirosis
The results of the kernel density mapping for leptospirosis in slaughterhouses and the
PAZ adjusted population demonstrate spatial heterogeneity but do not appear to
correlate with one another (Figures 7.1). Areas of greatest relative risk for
leptospirosis seropositivity in slaughterhouse workers appear to be in the central and
eastern part of the study area. These contrasts to the PAZ adjusted population where
the areas of greatest relative risk for seropositivity were in the north-eastern part of
the study area and a small area in the south of the study area around Lake Victoria.

Conclusion______________________________ 199
Figure 7.1 Spatially smoothed relative risk for leptospirosis
A) slaughterhouse, B) homesteads
A
B

Conclusion______________________________ 200
b. Q fever
The results of the Kernel density mapping for Q fever in slaughterhouse and the PAZ
adjusted population are demonstrated in Figure 7.2. The results of the Kernel density
mapping for Q fever in cattle are demonstrated in Figure 7.3. Spatial heterogeneity is
demonstrated for slaughterhouse workers, the PAZ adjusted population and cattle.
Areas identified of greatest relative risk for Q fever seropositivity in slaughterhouses
were in the eastern-central study area. This contrast to the PAZ adjusted population,
where the area of greatest relative risk was in the south of the study area. The area of
greatest relative risk for Q fever in cattle were also in the south of the study area.

Conclusion______________________________ 201
Figure 7.2 Spatially smoothed relative risk for Q fever A) slaughterhouses, B) homesteads
A
B

Conclusion______________________________ 202
Figure 7.3 Spatially smoothed relative risk for Q fever in cattle

Conclusion______________________________ 203
7.4 Discussion
7.4.1 Comparison between slaughterhouse workers and PAZ
a. Knowledge
Slaughterhouse workers are less educated than the PAZ adjusted population (OR 0.3;
95% CI 0.2–0.5 for secondary education). They have the same knowledge of
zoonotic disease (OR 1.2; 95% CI 0.9–1.7). Other studies have shown that education
is associated with better hygiene practices in slaughterhouses (Ghimire, 2013) and
with zoonotic disease awareness (Brown et al., 2011).
b. Disease
Slaughterhouse workers were at increased risk of HIV when compared to the PAZ
adjusted population (OR 1.8; 95% CI 1.1–2.9). The increased risk for HIV in this
group may be associated with increased risk behaviour, such as consuming alcohol.
32% of slaughterhouse workers reported taking alcohol regularly. Alcohol
consumption has been associated with HIV risk in other studies in sub-Saharan
Africa. (Fisher et al., 2007). The increased risk of HIV may also be associated with
income. Increased wealth has been associated with increase in HIV risk in Kenya
(KNBS, 2010).
Slaughterhouse workers were more likely to have malaria (OR 1.5; 95% CI 1.0–2.3)
at the time of interview and this may be a factor of their working conditions.
Slaughterhouse workers start work before dawn during the risk period for exposure
to malaria (WHO, 2014a), and workers perform physical exercise that increases
perspiration and carbon dioxide production that attract malaria infected mosquitoes
(Smallegange et al., 2013). There may also be standing water around the

Conclusion______________________________ 204
slaughterhouse from runoff that might act as mosquito breeding grounds as many
slaughterhouses have poor drainage and an open pit system for disposal of waste.
Slaughterhouse workers were more likely to have wounds at interview (OR 2.4; 95%
CI 1.3–4.7) which is consistent with other reports that this occupation is a high risk
for injury (Burridge et al., 1997, Cai et al., 2005, Pedersen et al., 2010).
c. Self reported symptoms
The univariable logistic regression analysis investigating the difference between
slaughterhouse workers and the PAZ adjusted population for a variety of self-
reported symptoms indicated that slaughterhouse workers were healthier than the
community sample. This finding may suggest selection bias where only active
workers were sampled and sick workers were not sampled due to absence on the day
of sampling and is generally referred to as the “healthy worker effect” (Li and Sung,
1999). Another element of the “healthy worker effect” is confounding due to non-
comparability between the populations since, by the nature of the work,
slaughterhouse workers need to be physically strong and able-bodied. In addition,
slaughterhouse workers may have more available cash income due to being
employed, placing them in a different socioeconomic group and therefore be able to
seek health care. This conclusion is supported by the fact that slaughterhouse
workers were more likely to have taken medicines in the past 3 months (antibiotic,
anti-inflammatory, anti-malarial). Methods for dealing with this selection bias
include following up retired or absent workers for inclusion in the study (selection
bias) or selecting a more appropriate comparison population (confounding) (Li and
Sung, 1999). Efforts were made to reduce confounding by selecting a similarly aged
Conclusion______________________________ 205
group from the PAZ dataset for comparison and accounting for age and gender in the
univariable models.
d. Seroprevalence of zoonoses
Slaughterhouse workers are potentially more exposed to zoonotic disease than other
members of the community in western Kenya. The logistic regression analysis
indicates that slaughterhouse workers have 2.3 times the odds of being seropositive
for leptospirosis than the PAZ adjusted population and 1.9 times the odds of being
seropositive for Q fever. This result, suggesting that slaughterhouse workers are
approximately two times more exposed to zoonotic disease, is consistent with other
published reports (Chan et al., 1987, Schoonman and Swai, 2009, Sharma et al.,
2006).
7.4.2 Spatial risk
a. Leptospirosis
The spatial risk for leptospirosis in the PAZ adjusted population appears to be
greatest in the north-eastern corner of the study. These areas are part of Bungoma
and Kakamega counties (Figure 2. 1B in Section 2.1) where the main agricultural
activity is sugar cane farming. Sugar cane cutting is considered a high risk
occupation for leptospirosis exposure (Faine, 1999). This assocation is likely due to
rodents inhabiting the sugar cane fields (Emanuel et al., 1964). This connection
would need to be quantified further in a more targeted study. There is a medium level
risk in the south of the study area bordering Lake Victoria related to fishing,
swimming, and contact with infected water as previously discussed. (Jackson et al.,
1993, Christova et al., 2003).

Conclusion______________________________ 206
The pattern of spatial risk to leptospirosis for the PAZ adjusted population differs
from that of slaughterhouse workers. The greatest risk areas for slaughterhouse
workers is through the middle of the study area possibly associated with cattle
imported from outside the study are for slaughter. Three of the main cattle markets
Ogalu, Bumala and Nambale are located in this region (Figure 2.1).
b. Q fever
Q fever in the PAZ human population is clustered in the south of the study area and
seems to be associated with areas of the highest cattle density (Figure 7.1). The same
applies for Q fever in cattle. Q fever exposure in slaughterhouse workers has a
different distribution and is possibly associated with cattle brought in from outside
the study area, as described for leptospirosis. It appears from this study that contact
with infected animals or living in proximity to infected animals is the risk for
exposure to Q fever in this area. This result is similar to those reported in other
countries regarding the risk of Q fever (Roest et al., 2011).

Conclusion______________________________ 207
7.5 Conclusion
This is the first study in Kenya to compare zoonotic disease risk in slaughterhouse
workers to the general population. The hypotheses of the study were:
1. slaughterhouse workers are healthier than the general population
2. slaughterhouse workers are more aware of zoonoses than the general
population
3. slaughterhouse workers are more exposed to zoonotic disease than the
community
4. the geospatial risk of zoonotic disease in slaughterhouse workers
resembles that in the human and cattle population of the study area
In respect to the first hypothesis it can be concluded that slaughterhouse workers are
healthier than the general population. They are less likely to report a range of clinical
symptoms. However slaughterhouse workers do have increased infectious disease
risks. Slaughterhouse workers are at greater risk of malaria infection than the general
population which might be related to the hours of the day that they are working.
Slaughterhouse workers are more likely to have HIV which may be related to their
income.
The second hypothesis is not proven. Slaughterhouse workers are not more informed
about zoonoses. Improved education has been linked to zoonotic disease awareness.
Slaughterhouse workers are less educated than the general population.
Slaughterhouse workers should be more informed about zoonotic disease and
zoonotic disease risk. This is not only to protect themselves but also to protect the

Conclusion______________________________ 208
meat they handle from becoming contaminated. Slaughterhouse workers need
targeted training regarding zoonotic disease risks.
The findings of this study confirm the third hypothesis that slaughterhouse workers
are more exposed to zoonotic disease than the general population in western Kenya.
This is likely to be related to the number of animals that slaughterhouse workers
handle but also a combination of risk behaviours that predispose workers to
exposure.
The final hypothesis is not proven. The geospatial risk of zoonotic disease in
slaughterhouse workers in western Kenya is not related to the disease risk in people
or animals in the study area. The epidemiology of leptospirosis in western Kenya is
likely to be complex with a range of circulating serovars from livestock and rodent
sources. It does appear that slaughterhouse workers are occupationally exposed to
leptospirosis and have a greater risk than the general population. Contact with
livestock is a risk factor for the general population as well as other potential sources
such as sugar cane farming and contaminated water sources. The geographical range
of Q fever within the study areas seems limited to the south. It appears that this is the
area of greatest risk to the general population through exposure to infected animals.
In contrast, the slaughterhouse workers may exposed to animals being moved from
other areas. The epidemiology of Q fever in this area could be studied further.

Conclusion______________________________ 209
Chapter 8
Conclusion
Conclusion______________________________ 210
This thesis aimed to understand the epidemiology of zoonoses in slaughterhouse
workers in western Kenya, not only because it aids our understanding of these
diseases but because the workers themselves were concerned about their health and
wanted a better understanding of their risks.
The thesis started with 3 hypotheses:
1. Slaughterhouses in western Kenya have inadequate infrastructure, sanitation
and hygiene practices
2. The current situation in slaughterhouses in western Kenya contributes to
zoonotic disease risk in slaughterhouse workers
3. Slaughterhouse workers are more exposed to zoonotic disease than other
members of the community.
The methodology for testing these hypotheses was developed over the preceding
chapters:
A cross-sectional survey of slaughterhouses in the study area was performed
to collect data on the current facilities and practices in slaughterhouses
Slaughterhouse workers were recruited into the study and answered a
structured questionnaire on knowledge, practices and risk factors for zoonotic
disease
Biological samples were collected from slaughterhouse workers for the
purpose of serological testing for zoonotic and other infections
Data were analysed using multivariable mixed effects logistic regression
models to identify risk factors for exposure to zoonoses
Conclusion______________________________ 211
A community based sample of people of similar age from the region was
analysed in the same way
Comparisons were made between the groups to quantify the difference in risk
for zoonotic disease
The first hypothesis stated that the slaughterhouses in the study region lacked
infrastructure, sanitation and hygiene. This was explored in Chapter 3. It was found
that many slaughterhouses do not have basic infrastructure such as a cement floor or
roof. Slaughterhouses are lacking sanitation facilities such as piped water, toilets or
hand washing facilities. Antemortem meat inspection is not conducted in the
majority of slaughterhouses.
Slaughterhouse workers do not wear protective clothing in the majority of
slaughterhouses. Slaughterhouse workers smoke and eat whilst working and some
workers appeared intoxicated during their medical examination. Workers were
unable to recognise or name zoonotic diseases in animals.
The current conditions in slaughterhouses in western Kenya are far below the
recommended standard. In addition, zoonotic disease knowledge and awareness is
poor and this perpetuates the substandard conditions in slaughterhouses. There is a
lack of impetus or incentive to improve the situation.
The second hypothesis stated that the conditions in slaughterhouses were risk factors
for zoonotic disease in workers. This was explored through Chapters 4 and 5 and it
was determined that the current conditions in slaughterhouses in western Kenya do
pose a risk to slaughterhouse workers. It was shown in Chapter 4 that slaughterhouse

Conclusion______________________________ 212
workers have a higher seroprevalence to leptospirosis and Q fever. In addition to this
RVF was described in this population for the first time.
In Chapter 5 the risk factors for leptospirosis and Q fever were explored.
Slaughterhouse workers at slaughterhouses where antemortem inspection is
performed are at decreased risk of leptospirosis as are workers who work in
slaughterhouses where protective clothing is worn. Contaminated water supplies at
slaughterhouses may also be a source of infection.
Inadequate personal hygiene practices are the most important factors in the risk of
exposure to zoonotic disease in slaughterhouses. This is evident in Chapter 5 in
which risks of leptospirosis seropositivity include smoking and eating at work and
having wounds. Risks of Q fever seropositivity include being intoxicated at work.
The third hypothesis was that slaughterhouse workers are more exposed to zoonoses
than people in the community. This was tested in Chapter 7. This study was able to
show that slaughterhouse workers have twice the odds of being seropositive for
leptospirosis and Q fever than the general population. It can be concluded that
slaughterhouse workers are at greater risk of exposure to zoonotic disease than
people in the community. Interestingly this risk is not geospatially related to disease
in the human population. This implies that the transmission of zoonotic disease to
slaughterhouse workers may be from animals being imported to the region for
slaughter.
Recommendations
The most important outcome of this is study is to report these findings to the county
veterinary department in Kenya’s newly devolved government and to the workers so

Conclusion______________________________ 213
that they are informed of their disease risks and how to prevent them. Broadly,
recommendations will focus on three areas: facilities/sanitation, knowledge and
regulations.
Facilities/Sanitation
Ideally attention should be focused on bigger slaughterhouses where the costs of
improved sanitation are not prohibitive. However, until there are improved facilities
for the transportation of refrigerated meat this is not a realistic option in western
Kenya. Changes to the distribution of meat in western Kenya are also likely to
increase the cost of meat to the consumer. This may increase the rate of informal or
back yard slaughter. The most important change initially would be the provision of
potable piped water for hand washing and cleaning the slaughterhouse adequately
with soap and water.
The importance of antemortem inspection should be emphasised to the
slaughterhouse and the veterinary department. This may require the training of more
meat inspectors in the region. The workers also play an important role in recognising
disease in animals and this leads to the next area for intervention.
Knowledge
Slaughterhouse workers need to be aware of the risks to their health from zoonotic
diseases. This requires education about the disease, how to recognise clinical signs in
animals and how to prevent transmission. Diseased animals will enter the
slaughterhouse because producers sell sick animals to recoup losses. Slaughterhouse
workers need to know how to reduce their risks of exposure to disease from these

Conclusion______________________________ 214
animals. Combined with this training would be education about producing a clean
and safe meat product.
Education should not be limited to slaughterhouse workers. The general public
should be more aware of the risks of eating contaminated or infected meat and
encouraged to demand a better product. This will put pressure on butchers to
improve facilities for slaughter.
The veterinary department also needs to be aware of the diseases that are of
importance to veterinary public health in the region through reporting which should
form part of the regulations.
Regulations and reporting
The Department of Veterinary Services is responsible for the training and provision
of meat inspectors. Meat inspectors need to be adequately trained in the importance
of antemortem and postmortem inspection but there also needs to be enough meat
inspectors to conduct meat inspection across the region. Unfortunately the distances
between slaughterhouses combined with poor roads and insufficient transport make it
difficult for meat inspectors to reach all their assigned facilities in time.
There need to be adequate reporting structures to follow cases of disease back to the
farm. The poverty in the region means that there is a disincentive to cull animals for
disease. Hence cases of disease in animals are unlikely to be reported. Producers
need to be educated to the benefits of improved herd health by removing diseased
animals. This is the role of the veterinary department.
Conclusion______________________________ 215
Limitations
One of the factors against improving conditions in slaughterhouses is the cost. As
mentioned previously it is the local butchers who coordinate the slaughtering process
in western Kenya. The average return for a beef butcher in Kenya is US$50 per
animal. The smaller slaughterhouses in western Kenya are slaughtering less than one
animal per day. There is little incentive to improve conditions or invest in improved
hygiene when the costs will diminish the financial returns to the butcher. The
government charges for meat inspection are US$2 for cattle, US$0.80 for goats and
US$0.30 for pigs. For meat inspectors in western Kenya there is little incentive to
inspect meat at the smaller pig slaughterhouses as the cost of transport is likely to be
greater than the fee. Slaughterhouse workers are paid US$1.10 per animal
slaughtered in cattle slaughterhouses. Workers do not have the financial means to
purchase protective clothing, seek medical attention when required or abstain from
work if they are sick.
Raising awareness
“Prevention is better than cure” is an ancient idiom that we all know, particularly
when it comes to our own health and well-being. Unfortunately in the developing
world the systems that should predict and prevent public health and veterinary public
health disasters are weakened by underfunding, inadequate expertise and insufficient
incentive.
The answer is not simply more expert scientists to further our understanding of
zoonotic diseases and their pathogenesis. A greater understanding of the context of
the situation in Africa is needed including the social determinants of disease. An
Conclusion______________________________ 216
adequate public health and veterinary public health infrastructure is required to
support the rolling out of control measures that include education, surveillance,
quarantine, reporting and an appropriate response.
There is a drive to invest in technology to combat disease in Africa, to improve
diagnostics and develop vaccines. There is investment in emerging disease detection
given the current concerns about a global pandemic. There is unfortunately not the
same push to develop local infrastructure to support surveillance, reporting and
control of endemic disease. We still do not know the burden of brucellosis and
bovine tuberculosis in the developing world despite most industrialised nations being
able to control and even eradicate these diseases in their own countries.
A deeper understanding of the epidemiology of these diseases is needed through
primary research, and alongside this a better understanding of the social
epidemiology and drivers of disease. However without adequate means to use these
data and respond appropriately this information is useless to policy makers in
developing countries.
In order to implement changes in the slaughterhouses in western Kenya there needs
to be education of the workers, the butchers and the slaughterhouse owners of the
risks. There need to be incentives or disincentives to change conditions to protect
worker health. The risks related to poor hygiene in slaughterhouses are not just
worker health but also to the community. Contaminated meat can lead to the spread
of bacterial pathogens such as E. coli to the community. Education of the community
is required to buy meat that is produced in a safe manner and hence put pressure on
butchers to improve conditions.

Conclusion______________________________ 217
Rapid enforcement of changes in this region is likely to result in an increase in meat
coming from the informal market or home slaughter. A balance is required that
protects the worker and the consumer from disease. It is this authors considered
opinion that training and education should be at the forefront of any interventions
regarding zoonotic disease prevention in western Kenya.

References______________________________ 218
APPENDICES

References______________________________ 219
Appendix 1 Consent form
Study title: Slaughterhouse workers as sentinels of zoonotic disease emergence
Instructions
Enumerator to distribute read and explain to participant. Use English, Swahili
or local language as appropriate
One signed copy for hardcopy file, one signed copy for participant
We are visiting you to invite you to participate in a research project which aims to
understand the importance of zoonotic diseases in your community. Zoonotic diseases are
diseases that you may get from direct or indirect contact with animals. Our objective is
ultimately to learn to control these diseases better, and in particular, understand how
controlling such diseases may prevent them from infecting people. This is a research project
run jointly by the Kenya Medical Research Institute (KEMRI), International Livestock
Research Institute (ILRI) in Nairobi and the University of Edinburgh (UK). It is funded by
the Wellcome Trust in the UK.
To carry out this research, we would like to ask you some questions about your work, the
animals you work with, your health and health problems and also collect some samples for
further detailed analysis. The outcome of this research will be a better understanding of
zoonotic diseases. Findings from this investigation will help us advise both human and
animal health authorities in your region and the rest of Kenya and beyond about improving
health.
What is involved
Your participation will take approximately 30 minutes of your time. You have been selected
for this project because you work in a slaughterhouse. You are free to decline if you would
prefer not to take part. Taking part will involve:
1) Answering some general questions about your health and your work
2) Allowing us to take measurements such as your height and weight
3) Providing us with a sample of your faeces to look for parasites like worms
4) Providing is with a sample of your urine
5) Providing us with a sample of your sputum
6) Allowing our qualified technician/nurse to take a 15ml blood sample from your arm
- equivalent of 1 tablespoon. So that we can take these samples to the laboratory (in
Busia) and examine the blood for infections that you may have or have had in the
past and that can be detected in your blood.
7) Allowing our qualified technician/nurse to take a nasal swab.
Measurements and samples will be taken by a qualified clinician or technician. There will be
some discomfort associated with sampling blood, which will use a needle to collect blood
from your arm. This discomfort is transient.
Benefits to participants
We will offer you a general health check as part of this study – by taking measurements like
your height and weight and conducting an examination, we can advise you if you appear in
good or bad health and suggest whether we think you should attend a clinic for further tests.
We will advise you of the most appropriate facility for further consultation if required. If you
would like us to, we can also prepare a report which we will send to you to inform you of
what parasites we find in your faecal sample and blood sample – eg worms, malaria. This
health check and parasitology report that we are offering is free of charge to you, and if you

References______________________________ 220
choose not to participate in the sampling of the project, we will none-the-less carry out the
health check if you wish: participation is thus entirely voluntary and there is no consequence
to you for not participating should you choose not to.
Anonymity/secondary use of material
Beyond the health check and parasitology tests, your participation will be totally anonymous.
We will conduct further tests for a range of diseases on your sample, but it will no longer be
possible for us to identify you individually with your test results – the link between your
identity and your test results can therefore not be shared with anyone, and your name will
never appear in any reports. These anonymous samples will be stored and analysed at ILRI
or KEMRI or an appropriate international laboratory, and, while remaining anonymous, may
be used for further work on them in the future. Afterwards, samples will be stored and there
may be further examination of your samples, but again, these analyses will be anonymous
and cannot be linked to you individually. As we will be unable to locate a specific
individual’s samples from our storage (because the storage is anonymous), agreement to
participate makes implicit your agreement for the materials to be used in future studies. Your
answers to our questions, measurements and results will remain completely confidential to
all involved at all stages of the project – even other members of the project team will not be
able to link specific samples to you or even to know the name of the village the samples
came from. In the case of the parasitology results, if you choose to receive the results of
these tests, we will indicate on the report what steps you might follow for medical follow-up
– eg visiting your local district hospital.
The project has been reviewed and approved by KEMRI/Kenya National Ethical Review
Committee. For further questions, please contact Dr. Eric Fèvre, Busia PAZ/IDEAL
Laboratory, PO BOX 261, Busia for detailed questions or worries after the team has left (tel
Busia 05522233), or the Secretary, KEMRI Ethical Review Committee (020 272 2541) if
you have any concerns.
Participant statement
I confirm that I have understood the above description of the study and that I have had the
opportunity to ask questions about this study that I wish to ask. I confirm that I am happy to
provide answers to the questions that will be asked of me and that I am happy to allow the
project team to take the necessary samples for this project. I confirm that my samples may be
stored and shipped as is necessary for the completion of this project and may be stored
beyond the project for further medical research. I am aware that from the point of collection,
I will not be personally identifiable; I understand that the project will not routinely report
back the specific results of the tests to be carried out on my samples.
____________________________________ ___________________________________
Date Sublocation name
____________________________________ ___________________________________
Participant name Signature or thumb print
Enumerator statement
I confirm that I have fully explained to the subject the nature and purpose of the procedures
described above. Explained any risks and described the system of anonymous data gathering.
I have asked the subject if he or she has any further questions, and answered these questions
to the best of my ability.
Name Signature

References______________________________ 221
Appendix 2 Slaughterhouse individual questionnaire
General
1. Date --/--/----
2. Start time --:--
3. Recorder <name> (look up list)
Annie, Cheryl, Daniel, Fred, Isaac, James, Lauren,Maseno, Oliver, Omoto
4. Slaughterhouse barcode <number> Scan
5. Respondent age: -- (in age groups – as people do not know exact age)
6. Respondent sex: Male / Female
a. If female are you pregnant? Y/N/NR
i. If pregnant What stage? 1st, 2
nd, 3
rd trimester
7. Does this participant meet the selection requirement (over 18) and given informed
consent? Yes / No (Terminate)
8. Interviewee barcode SCAN <number>
9. Language of questionnaire administration (Language look up)
Teso; Samia; Bukusu; Luhya; Luo; Swahili; English; Kamba; Kalenjin; Other
10. Tribal origin (Tribe look up)
Teso; Luhya; Luo; Kikuyu; Samia; Saboat; European; Kamba; Kalenjin; Other
11. Principal religion (religion look up)
Roman catholic; Protestant; Other Christian; Muslim; Traditional religion; None;
Other; NR
12. Marital status (marital look up)
Single; Married; Divorced; Widowed; NR
13. Do you have children? Y/N/NR
a. If yes, how many living? (popup table – numbers up to 30)
14. Have you lived outside this province at any time for more than 6 months? Y/N/NR
a. Where did you live? Popup list provinces
15. How many people live in your homestead? (popup list numbers)
16. How many rooms in your homestead? (popup list numbers)
17. What level of education have you reached? (look up education)
No formal education; Pre-school; Primary; Secondary; Tertiary; College; University;
Vocational/technical school; Other; NR
18. Do any members of your homestead work in healthcare? Y/N/NR
a. What do they do? (look up healthcare)
Doctor, nurse, midwife, clinical officer, nursing assistant, admin, cleaner,
security, NR. other
19. Do you have contact with livestock outside of work? Y/N/NR
a. Which ones? (multiselection list)
Cattle, sheep, goats, pigs, poultry, rabbits, NR, Other
20. Do you or your family keep livestock at you normal place of residence? Y/N/NR
a. Which ones? (multiselection list)
Cattle, sheep, goats, pigs, poultry, rabbits, NR, Other
21. Do any members of your homestead work in livestock farming? Y/N/NR
a. What animals?
Cattle, sheep, goats, pigs, poultry, rabbits, NR, Other
22. Do you have contact with dogs? (look up freq)

References______________________________ 222
No; Daily; At least once a week; At least once per month; At least once per year;
Used to but no longer; NR
23. In the last 12 months have you been hunting? (look up freq)
No; Daily; At least once a week; At least once per month; At least once per year;
Used to but no longer; NR
Food preferences
24. Do you eat beef? Y/N/NR
a. How often do you eat beef? (look up freq)
Never; Daily; At least once a week; At least once per month; At least once per year;
Only on special occasions; Used to but no longer; NR
25. Do you eat pork? Y/N/NR
a. How often do you eat pork? (look up freq)
Never; Daily; At least once a week; At least once per month; At least once per year;
Only on special occasions; Used to but no longer; ND
26. In the last 12m have you drunk cow’s milk? Yes No NR
a. How do you take your milk? (multiselection)
Boiled; Soured; Raw; Pasteurised; Other (allow all answers)
27. In the last 12m have you drunk goat’s milk? Yes No NR
a. How do you take your milk? (multiselection)
Boiled; Soured; Raw; Pasteurised; Other
28. Do you take animal blood? Yes No NR
a. How do you take animal blood? (multiselection)
Boiled, Cooked, Raw, Other
29. Do you smoke cigarettes? (look up table freq)
No; Daily; At least once a week; At least once per month; At least once per year;
Used to but no longer; NR
a. If daily or weekly what is the number of cigarettes you smoke per week?
<number>
30. Do you consume alcohol? (look up freq)
No; Daily; At least once a week; At least once per month; At least once per year;
Used to but no longer; NR
Sanitation
31. Where do you obtain water (for personal use)? (look up water)
Private borehole; River; Shared borehole; Municipal water (tap); Well; Spring; Dam;
Pond: Other; Lake; NR
32. How often do you use the latrine when you need to defecate? (look up defacation)
Everytime; Mostly; Sometimes; Rarely; Never; NR
Health status
33. Have you had a period of illness in the past 12 months?
Yes No NR
a. If you have had a health problem, please list <open>
34. Have you had fever in the last 3 months? Y/N/NR
35. Have you had headache in the last 3 months? Y/N/NR
36. Have you had backache in the last 3 months? Y/N/NR
37. Have you had joint pain in the last 3 months? Y/N/NR
38. Have you had seizures in the last 3 months? Y/N/NR

References______________________________ 223
39. Have you had weightloss in the last 3 months? Y/N/NR
40. Have you had cough in the last 3 months? Y/N/NR
41. Have you had nausea in the last 3 months? Y/N/NR
42. Have you had vomiting in the last 3 months? Y/N/NR
43. Have you had diarrhoea in the last 3 months? Y/N/NR
44. Have you had loss of appetite in the last 3 months? Y/N/NR
45. Have you had abdominal pain in the last 3 months? Y/N/NR
46. Have you had a skin infection in the last 3 months? Y/N/NR
47. Have you had any boil in the last 3 months? Y/N/NR
48. Have you taken any medicines in the last 3months
Yes No Don’t know NR
a. If you have taken medications in the last month, tick all that apply
Unknown; Chloroquine; Other antemalarial; Anti-retroviral; Antibiotic; Anti-
tussive; Rehydration solution; Antiinflammatory or pain killer; Heart medication;
Insulin; Medication for seizures; Dewormers; Other; ND
49. Have you used any antimicrobial cream or ointment in the last 3 months? Y/N/NR
50. Usually, when you feel ill, where do you seek treatment? (look up treatment)
Don’t seek treatment; Family member; Community health worker; Traditional healer;
Chemist; Private clinic; Hospital; Self treatment; Neighbour; Church healer; Other;
NR
51. Have you visited a clinic, community health centre or doctor in the last 3 months?
Y/N/NR
52. Have you visited a hospital in the last 3 months? Y/N/NR
a. Have you been admitted (stayed overnight) to a hospital in the last
3months? Y/N/NR
53. Are you aware of ever having brucellosis?
Yes No Don’t know NR
54. Are you aware of ever having tuberculosis?
Yes No Don’t know NR
55. Are you aware of ever having q fever?
Yes No Don’t know NR
56. Are you aware of ever having tapeworm?
Yes No Don’t know NR
57. Are you aware of ever having Rift Valley fever?
Yes No Don’t know NR
Knowledge of food-borne and zoonotic disease
58. Are you aware of any disease you might catch from contact with animals?
Yes No Don’t know NR
a. Which symptoms/disease might you catch from animals? (multiselection)
Unknown disease; Malaria; Fever; Stomach pain; Diarrhoea; Respiratory
difficulties; Fever; Skin rash; Seizures; Brucellosis; Anthrax; TB; RVF; Q fever;
Sleeping sickness; Tapeworm; Leptospirosis; Salmonella; E.coli; Rabies;
Toxoplasma; Other; NR
If answered other please type________
59. Are you aware of any diseases that you might catch from eating meat? Y N DK NR
a. Which symptoms/disease might you catch from eating meat (multiselection)
Unknown disease; Malaria; Fever; Stomach pain; Diarrhoea; Respiratory
difficulties; Fever; Skin rash; Seizures; Brucellosis; Anthrax; TB; RVF; Q fever;

References______________________________ 224
Sleeping sickness; Tapeworm; Leptospirosis; Salmonella; E.coli; Rabies;
Toxoplasma; Other; NR
If answered other please type________
Slaughterhouse questions
60. How long have you been a slaughterhouse worker? <number years>
61. How long have you worked in this slaughterhouse? <number years>
62. Do you work in another slaughterhouse at present? Yes No NR
63. Which other SH? ___________
64. How many days per week do you work as a slaughterhouse worker? 1 2 3 4 5 6 7
65. How many hours per day do you work? 1 2 3 4 5 6 7 8 9 10 11 12
66. What is your occupation in the SH? (look up Job in SH)
Slaughterman; Flayer; SH owner; Butchery owner; Clean the intestines; Cleaner;
Other: NR
67. Do you have another occupation? Yes /No/NR
68. What is this occupation? (popup Y/N/NR)
a. What is this occupation? (look up occupation)
Meat business owner; Farmer; Trader; Shop keeper; Student; Driver; Butcher;
Fisherman; Boda driver; Carpenter; Mason; Taxi driver; Other; NR
If other enter details:
69. Are you involved directly in slaughter/flaying? Y/N/NR
a. How many animals do you personally slaughter a day on average?
<number>
b. Who provides you equipment? Look up list
Butcher; Meat inspector; SH owner; Worker; Other; NR
c. Is your equipment used exclusively within the slaughterhouse? Y N DK
d. How often do you clean your equipment? (look up wash freq)
Between animals, Before slaughtering; After slaughtering; Daily; Weekly; Never;
NR
e. What do you use to clean your equipment? (multilist cleaning)
Water; Bleach; Ammonia; Soap; Washing powder; Nothing; NR
f. How often do you or someone else sharpen your equipment? (look up freq)
Daily; Weekly; Monthly; Never; NR
g. Have you been for a medical check up recently (in the last 6 months)?
Y/N/NR
h. Do you have a license for slaughtering? Y/N/NR
70. Do you wear protective clothing eg. Coveralls, overalls, apron?
Always/Sometimes/Never
a. What protective clothing? (Look up clothing)
Coveralls, Overalls, Apron, Lab coat, Other. NR
b. Who provides?
Meat inspector; Butcher; Worker; SH owner; Other; NR
71. Do you change clothes when you leave the slaughterhouse?
Yes No NR
72. Where do you wash your clothes/shoes after slaughtering?
River; Home; At the slab; Give to someone; Other; NR
73. Do you wear footwear in the slaughterhouse? Y/N/NR
Always/Sometimes/Never
a. What type?
Sandals, Boots, Shoes, Rubber boots, Running shoes, Other, NR

References______________________________ 225
b. Who provides?
Meat inspector; Butcher; Worker; SH owner; Other; NR
74. Do you wear gloves when slaughtering? Always/Sometimes/Never
75. When do you wash your hands? (tick all that apply) (multiselection)
Before slaughtering; After slaughtering; Between animals; Before I go home;
After I use the latrine; NR
76. Is there soap provided for hand washing?
Always/Sometimes/Never
77. Do you injure yourself at work and how often? (look up freq)
Daily, Weekly, Monthly, Never
78. Do you eat at the slaughterhouse? (Look up meat inspector freg)
Every time we slaughter; Most times(once a week); Sometimes (once a month);
Rarely (once a year); Never; NR; DK
79. What would you do with a sick animal? (look up sick animal)
Send home; slaughter last and condemn; slaughter and sell; slaughter and keep for
own consumption, Treat, Ask doctor, Slaughter and ask doctor, Other, NR
80. What would you do with an animal that dies on the way or at the slaughterhouse?
Send home; slaughter last and condemn; slaughter and sell; slaughter and keep for
own consumption, Treat, Ask doctor, Slaughter and ask doctor, Other, NR
81. What animals do you slaughter/flay/clean?
Cattle only, Sheep/goats only; Cattle and Sheep/goats; Pig only; Pigs and cattle;
Pigs and sheep/goats; NR
IF cattle
82. Have you seen these lesions (show picture of tuberculous lung/liver)? Pictures are
available in appendix 7
Yes; No; Don’t know; NR
If yes:
a. How often? (look up freq)
Daily; Weekly; Monthly; Yearly; DK
b. Named correctly Yes; No;
c. What do you do with these animals? (look up organ disposal)
Slaughter as normal, Dispose of entire carcass, Remove affected organs
83. Have you seen these lesions (show picture of brucellosis lesions)?
Yes; No; Don’t know; NR
If yes:
a. How often? (look up freq)
Daily; Weekly; Monthly; Yearly; DK
b. Named correctly Yes; No;
c. What do you do with these animals? (look up organ disposal)
Slaughter as normal, Dispose of, Remove affected organs
84. Have you seen these lesions (show picture of skin lesions on people)?
Yes; No; Don’t know; NR
If yes:
a. How often? (look up freq)
Daily; Weekly; Monthly; Yearly; DK
b. Named correctly Yes; No;
85. Have you seen these lesions (show picture of echinococcus)?
Yes; No; Don’t know; NR
If yes:
a. How often? (look up freq)

References______________________________ 226
Daily; Weekly; Monthly; Yearly; DK
b. Named correctly Yes; No;
c. What do you do with these animals? (look up organ disposal)
Slaughter as normal, Dispose of, Remove affected organs
If pigs
86. Have you seen these lesions (show picture of Taenia cysts)?
Yes; No; Don’t know; NR
If yes:
a. How often? (look up freq)
Daily; Weekly; Monthly; Yearly; DK
b. Named correctly Yes; No;
c. What do you do with these animals? (look up organ disposal)
Slaughter as normal, Dispose of, Remove affected organs
87. How often does the meat inspector visit? (look up freq)
Every time we slaughter; Most times (once a week); Sometimes (once a month);
Rarely (once a year); Never; NR; DK
88. Does the meat inspector examine the animals before they are slaughtered?
Always, Sometimes, Never, NR
a. Does he/she ever refuse the slaughtering of an animal?
Yes/No/NR
b. How often does the meat inspector refuse to allow an animal to be
slaughtered?
Every time we slaughter; Most times (once a week); Sometimes (once a
month); Rarely (once a year); Never; NR; DK
c. For what reason would the meat inspector refuse slaughter? Multilist
Sickness, Diarrhoea, Coughing, Injury, Emaciation, Death. Other. DK, NR
89. How often does the meat inspector ever condemn animal or part of an animal
(organ)? (look up freq)
Every time we slaughter; Most times (once a week); Sometimes (once a month);
Rarely (once a year); Never; NR; DK
a. Which parts? Liver, Kidney, Heart. Lung, Intestines, Muscle
b. What happens to these organs? (look up organ disposal)
Pit, Dog, Home
90. Does the meat inspector ever condemn an entire carcass? Y/N/NR
a. How often?
Every time we slaughter; Most times (once a week); Sometimes (once a month);
Rarely (once a year); Never; NR; DK
b. What happens to the carcass?
Pit, Dog, Home
91. In the last 12 months have you seen rats around the slaughterhouse? (look up freq)
No; Daily; At least once a week; At least once per month; At least once per year;
Used to but no longer; NR
92. In the last 12 months have you seen wildlife around the slaughterhouse? (look up
freq)
No; Daily; At least once a week; At least once per month; At least once per year;
Used to but no longer; NR
a. What wildlife have you seen? (multiselection list)
Bats, rodents, Mongoose, birds, Snakes, lizards, monkeys, other, NR
Observational

References______________________________ 227
93. Weight
94. Height
95. Midupper Arm Circumference
96. Temperature
97. Splenomegaly
98. Hepatomegaly
99. Abdominal distension
100. Membrane palour
101. Jaundice
102. Limb oedema
103. Rash
104. Wounds requiring treatment
105. Does the individual have a BCG scar?
106. Does the worker appear drunk?
107. Red top barcode
108. Purple top bar code
109. Was a stool sample collected?
a. Barcode
110. Was a stool swab sample collected?
a. barcode
111. Was a sputum sample collected?
a. barcode
112. Was a nasal swab sample collected?
a. barcode
113. Thick film barcode
114. Thin film barcode

References______________________________ 228
Appendix 3 Slaughterhouse foremen questionnaire
1. Date --/--/----
2. Start time --:--
3. Recorder <name>
4. Slaughterhouse barcode <number>
5. Sex of respondent
6. Language of questionnaire
7. Job in slaughterhouse
8. How many slaughter men
9. How many are flayers
10. How many are licensed
11. Which animals are slaughtered?
Cattle only, Cattle and sheep/goats, Pigs only, Pigs and cattle, Pigs and sheep/goats.
If cattle/sheep/goats
Number of cattle slaughtered per week (average)
How are the cattle transported?
Number of sheep/goats slaughtered per week (average)
How are the sheep/goats transported?
If pigs
Number of pigs slaughtered per week (average)
How are the pigs transported?
12. Where is the meat from this slaughterhouse sold?
Locally
Exported to other districts
13. How is the meat transported?
14. What would you do with a sick animal?
15. What would you do with a dead animal?
16. How often does the meat inspector visit the slaughterhouse?
Daily Weekly Fortnightly Monthly
17. Does the meat inspector examine animals before slaughter?
18. Does the meat inspector refuse to allow slaughter?
19. For what reasons does he refuse to allow slaughter?
20. How often?
21. Does the meat inspector condemn organs?
22. How often does the meat inspector condemn organs?
23. For what reason does the meat inspector condemn organs?
24. What organs does the meat inspector most commonly condemn?
25. Does the meat inspector condemn the entire carcass?
26. How often does the meat inspector condemn the carcass?

References______________________________ 229
27. For what reason does the meat inspector condemn the carcass?
28. What method of euthanasia do you employ?
29. Is specialized protective clothing worn whilst in the slaughterhouse?
Y N DK
30. Type: Overalls, Apron, Lab coat
31. Who provides this clothing?
32. Is this clothing worn exclusively in the slaughterhouse?
33. Where is this clothing/footwear cleaned/laundered?
At the slab, at individual homes,
34. Is specialized protective footwear worn whilst in the slaughterhouse?
Y N DK
35. Type Boots, Closed shoes, Slippers
36. Is this provided by the SH? Y N DK
37. What specialized equipment is used within the slaughterhouse?
Winch; Trolley; Saw; knives; Axe
38. How often is the equipment cleaned?
Between animals, Before slaughtering; After slaughtering; Daily; Weekly; Never; NR
39. What do you use to clean your equipment?
Water; Bleach; Ammonia; Soap; Nothing; NR
40. Is this equipment used exclusively within the slaughterhouse? Y N DK
41. How often do you clean the slab?
Between animals, Before slaughtering; After slaughtering; Daily; Weekly; Never; NR
42. What do you use to clean the slab?
Water; Bleach; Ammonia; Soap; Nothing; NR
43. Do dogs come to the slaughterhouse?
Never; Daily; At least once a week; At least once per month; At least once per year;
Used to but no longer; ND
a. Do you feed the dogs internal organs of animals?
Always Sometimes Never
44. Do cats come to the slaughterhouse?
Never; Daily; At least once a week; At least once per month; At least once per year;
Used to but no longer; ND
a. Do you feed the cats internal organs of animals?
Always Sometimes Never
45. What disposal method is employed for carcass waste?
Pit; Bury; Throw away; Feed to dogs; Sell; Take home; NR
46. What disposal method is employed for condemned carcasses?
Pit; Bury; Throw away; Feed to dogs; Sell; Take home; NR
47. Where do you obtain your water for slaughtering?
Borehole; River; Pump; Tap; Well; Spring; Other; NR
48. Is there a place for hand washing? Y/N
49. Is soap provided for hand washing? Y/N
50. Is there a latrine? Y/N
51. In the last 12 months have you seen rats around the slaughterhouse?
No; Daily; At least once a week; At least once per month; At least once per year;
Used to but no longer; ND
52. In the last 12 months have you seen wildlife around the slaughterhouse?
References______________________________ 230
No; Daily; At least once a week; At least once per month; At least once per year;
Used to but no longer; ND
53. What wildlife have you seen around the slaughterhouse?
Bushbuck; Other bovid; Bats; Mongoose; Snake; Monitor lizard; Monkey; Wild birds;
Other
54. Structure of slaughterhouse floor
Earth Cement Tile Timber
55. Structure of sides
No sides Timber Unburnt bricks Burnt bricks Stone Cement
Mud
56. Structure of roof
No roof Tile Thatch Iron sheets
57. Is there electricity in the slaughterhouse? Y/N
58. How is water access?
59. Is there a latrine in the compound?
60. Type of latrine
Latrine completely closed Partially closed Open pit
61. Evidence of latrine use
62. Evidence of animal scavenging around the latrine
63. Did you see workers wearing PPE>
64. Type?
65. Did you see workers wearing shoes?
66. Type
67. Did you see workers wearing gloves?
68. Name of market
69. GPS Northing
70. GPS Easting
71. Altitude
72. GPS code
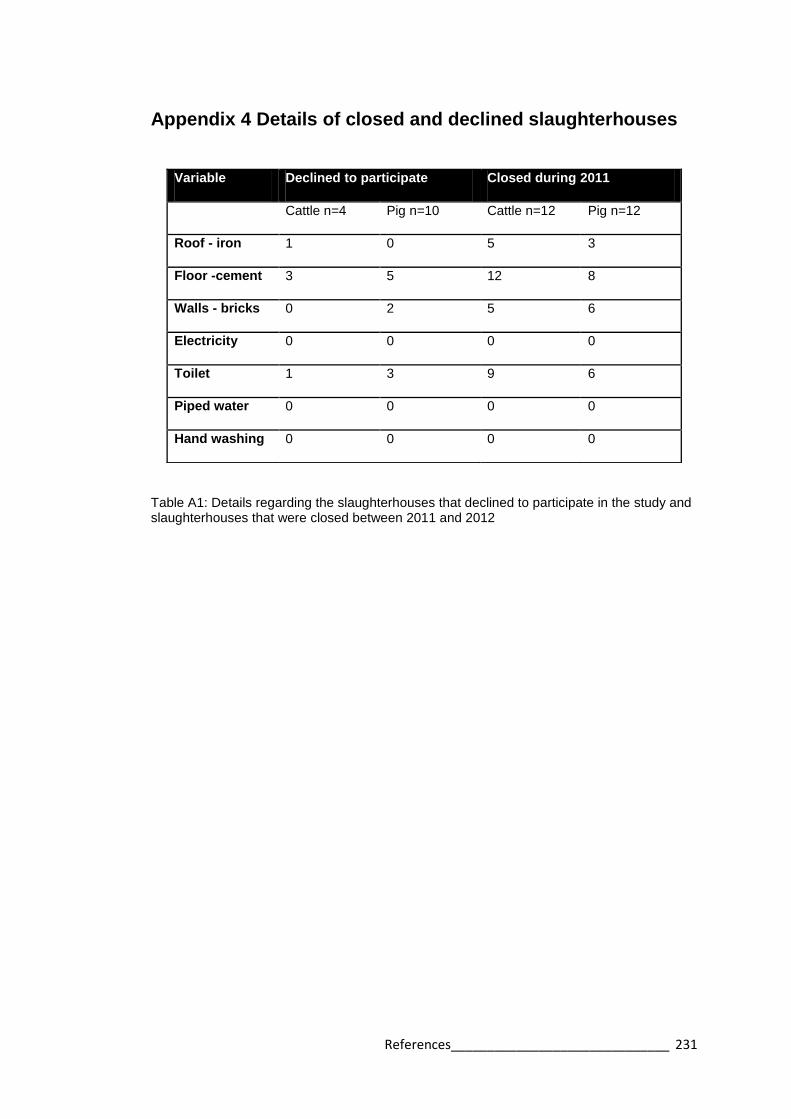
References______________________________ 231
Appendix 4 Details of closed and declined slaughterhouses
Table A1: Details regarding the slaughterhouses that declined to participate in the study and slaughterhouses that were closed between 2011 and 2012
Variable Declined to participate Closed during 2011
Cattle n=4 Pig n=10 Cattle n=12 Pig n=12
Roof - iron 1 0 5 3
Floor -cement 3 5 12 8
Walls - bricks 0 2 5 6
Electricity 0 0 0 0
Toilet 1 3 9 6
Piped water 0 0 0 0
Hand washing 0 0 0 0

References______________________________ 232
Appendix 5 Results from cross sectional survey
Table A2: Infrastructure and practices of the slaughterhouses as reported by foreman
Variable Mixed
Ruminan
t%
n=31^
Cattle
% (95%CI)
n=53
Pigs only
% (95%CI)
n=58
Total
% (95%CI)
n=142
Chi squared, p
–value
Structural factors
Roof present 90 75 (72-79) 45 (40-50) 65 (63-67) Χ2=21.53, df=2
p<0.001
Cement floor 100 100 74 (70-78) 89 (87-90) Χ2=23.39, df=2
p<0.001
Solid walls 97 79 (76-82) 53 (48-58) 72 (69-74) Χ2=20.25, df=2
p<0.001
Electricity 3 0 2 (0.4-3) 1.4 (1-2) Χ2=1.48, df=2
p<0.001
Sanitation
Toilet 61 57 (53-60) 62 (57-67) 60 (57-62) Χ2=0.38, df=2
p=0.117
Piped waterƗ 6 6 (4-7) 0 3 (3-4) Χ2=3.82, df=2
p<0.001
Source of water
Borehole
Municipal
River
Well
65
13
3
19
70 (67-73)
13 (11-16)
8 (6-9)
9 (7-12)
64 (59-69)
7 (4-9)
10 (7-13)
19 (15-23)
66 (64-68)
10 (9-12)
8 (7-9)
16 (14-17)
Χ2=3.83, df=2
p<0.001
Hand-washing
place
35 19 (16-22) 14 (10-17) 20 (18-22) Χ2=5.76, df=2
p=<0.001
Cleaned with
soap
90 83 (80-86) 62 (57-67) 75 (73-78) Χ2=10.92, df=2
p<0.001
Dogs present 71 74 (70-78) 85 (81-88) 78 (76-80) Χ2=2.89, df=2
p<0.001
Rats present 10 6 (4-7) 19 (15-23) 12 (11-14) Χ2=4.87, df=2
p<0.001
Personal hygiene
Protective
clothing worn
55 36 (32-39) 17 (13-21) 32 (29-34) Χ2=13.38, df=2
p<0.001
Worker buys
clothing
90 (87-
93)
78 (71-85) 67 (51-82) 78 (73-84)
Boots worn 52 45 (41-48) 16 (12-19) 34 (31-36) Χ2=16.33, df=2
p<0.001
Worker buys
boots
92 (87-
97)
84 (77-91) 72 (54-90) 84 (78-89
Soap provided 81 64 (61-68) 57 (52-62) 64 (62-67) Χ2=4.75, df=2
p<0.001
Meat inspection
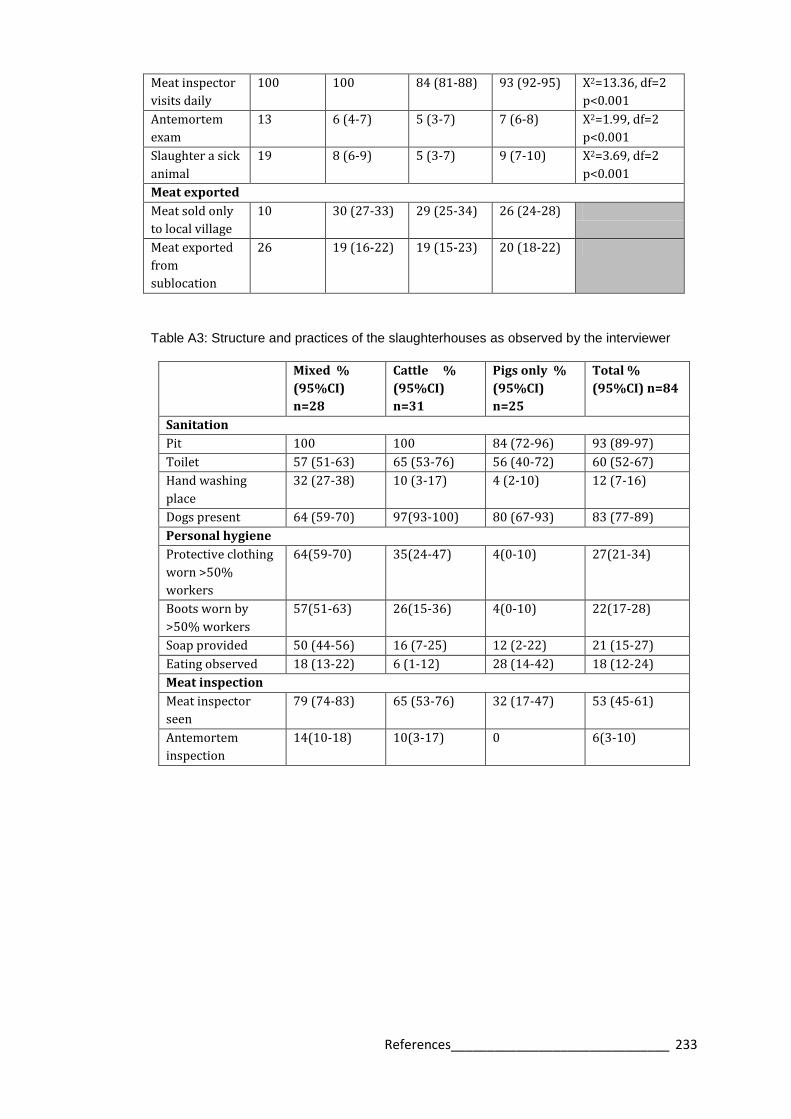
References______________________________ 233
Meat inspector
visits daily
100 100 84 (81-88) 93 (92-95) Χ2=13.36, df=2
p<0.001
Antemortem
exam
13 6 (4-7) 5 (3-7) 7 (6-8) Χ2=1.99, df=2
p<0.001
Slaughter a sick
animal
19 8 (6-9) 5 (3-7) 9 (7-10) Χ2=3.69, df=2
p<0.001
Meat exported
Meat sold only
to local village
10 30 (27-33) 29 (25-34) 26 (24-28)
Meat exported
from
sublocation
26 19 (16-22) 19 (15-23) 20 (18-22)
Table A3: Structure and practices of the slaughterhouses as observed by the interviewer
Mixed %
(95%CI)
n=28
Cattle %
(95%CI)
n=31
Pigs only %
(95%CI)
n=25
Total %
(95%CI) n=84
Sanitation
Pit 100 100 84 (72-96) 93 (89-97)
Toilet 57 (51-63) 65 (53-76) 56 (40-72) 60 (52-67)
Hand washing
place
32 (27-38) 10 (3-17) 4 (2-10) 12 (7-16)
Dogs present 64 (59-70) 97(93-100) 80 (67-93) 83 (77-89)
Personal hygiene
Protective clothing
worn >50%
workers
64(59-70) 35(24-47) 4(0-10) 27(21-34)
Boots worn by
>50% workers
57(51-63) 26(15-36) 4(0-10) 22(17-28)
Soap provided 50 (44-56) 16 (7-25) 12 (2-22) 21 (15-27)
Eating observed 18 (13-22) 6 (1-12) 28 (14-42) 18 (12-24)
Meat inspection
Meat inspector
seen
79 (74-83) 65 (53-76) 32 (17-47) 53 (45-61)
Antemortem
inspection
14(10-18) 10(3-17) 0 6(3-10)

References______________________________ 234
Table A4: Demographics of slaughterhouse workers in western Kenya
Variable Mixed
% (95%CI)
n=274
Cattle %
(95%CI)
n=292
Pigs only
% (95%CI)
n=172
Total %
(95%CI)
n=738
Chi squared
Gender
Male 96(94-97) 97(97-98) 97(96-98) 97(96-97) Χ2=0.96, df=2
p=0.188 Female 4(3-6) 3(2-4) 3(2-4) 3(3-4)
Age group (years)
18-27 20(17-23) 19(17-21) 37(33-41) 23(21-25) Χ2=51.60, df=6
p<0.001 28-37 31(27-34) 27(25-30) 35(31-39) 30(28-32)
38-47 19(16-22) 21(19-24) 22(18-25) 20(19-22)
49+ 31(27-34) 32(30-35) 6(4-7) 26(24-28)
Education
None 10(8-12) 14(12-16) 6(4-7) 10(9-12) Χ2=8.97, df=4
p<0.001 Primary 75(71-78) 70(68-73) 81(78-84) 74(73-76)
Secondary 16(13-18) 16(14-18) 13(10-16) 15(14-17)
Duration of work (years)
<5 38(35-42) 50(47-53) 56(51-60) 46(44-48) Χ2=39.19, df=6
p<0.001 6-10 26(23-30) 22(20-25) 30(26-34) 26(24-27)
11-15 15(12-18) 6(5-8) 9(7-12) 11(9-12)
16+ 20(17-23) 21(19-24) 5(3-7) 17(16-19)
Job in the slaughterhouse
Cleaner 4(3-5) 5(4-6) 5(3-7) 4(4-5)
Cleans
intestines
8(6-10) 7(6-9) 0 6(5-7)
Flayer 75(72-78) 74(72-77) 93(91-95) 71(69-73)
Slaughterman 11(9-14) 12(10-14) 0* 9(8-10)
Other 2(1-3) 1(1-2) 2(1-3) 2(1-2)

References______________________________ 235
Table A5: Personal hygiene and sanitation in slaughterhouses
Variable Mixed % (95%CI) n=274
Cattle % (95%CI) n=292
Pigs only % (95%CI) n=172
Total % (95%CI) n=738
Chi squared
Personal hygiene
Wear protective clothing
69(66-73) 49(46-51) 27(23-30) 53(51-55) Χ2=79.82, df=2 p<0.001
Wear boots 68(64-71) 41(38-44) 22(19-26) 49(46-51) Χ2=95.14, df=2 p<0.001
Soap available 50(46-54) 62(59-65) 68(64-72) 58(56-60) Χ2=16.40, df=2 p<0.001
Eat at the slaughterhouse
27(23-30) 5(5-7) 37(33-41) 21(20-23) Χ2=70.06, df=2 p<0.001
Smoke daily 22(19-25) 27(24-29) 19(16-22) 23(21-25) Χ2=2.88, df=2 p=0.010
Take alcohol daily
33(30-37) 31(28-33) 32(28-36) 32(30-34) Χ2=2.13, df=2 p=0.032
Drunk at interview
12(9-14) 13(11-15) 5(4-7) 11(10-12) Χ2=6.66, df=2 p<0.001
Use the latrine everytime
73(70-76) 78(75-80) 78(75-82) 76(74-78) Χ2=2.44, df=2 p=0.024
Meat inspection
Meat inspector visits
98(97-99) 99(99-100) 84(81-87) 96(95-96) Χ2=59.91, df=2 p<0.001
Antemortem exam
44(41-48) 48(45-51) 34(30-38) 44(42-46) Χ2=12.99, df=2 p=<0.001
Slaughter sick animal
23(19-26) 14(12-15) 15(12-18) 18(16-19) Χ2=9.12, df=2 p<0.001
Zoonoses awareness
Know animals give disease to people
34(31-38) 30(27-32) 29(25-33) 31(29-33) Χ2=2.47, df=2 p=0.020
Know disease can be transmitted from meat
45(41-49) 38(35-40) 42(38-46) 42(40-44) Χ2=2.96, df=2 p=0.009
Named a zoonosis
8(6-10) 8(6-10) 9(6-11) 8(7-9) Χ2=0.11, df=2 p=0.859
Named a disease from meat
9(6-11) 8(6-10) 7(5-9) 8(7-9) Χ2=0.49, df=2 p=0.492

References______________________________ 236
Table A6: Health status of the slaughterhouse workers in western Kenya at the time of interview.
Variable Mixed
%(95%CI)
n=274
Cattle %
(95%CI)
n=292
Pigs only
% (95%CI)
n=172
Total %
(95%CI)
n=738
Chi squared
Recent illness (visit
to doctor in past 3
months)
18(15-21) 18(16-20) 16(13-19) 18(16-19) Χ2=0.30, df=2
p=0.613
Previously had
Tuberculosis
7(5-9) 1(1-2) 1(0-1) 4(3-4) Χ2=17.39, df=2
p<0.001
Previously had
Brucellosis
2(1-3) 1(0-1) 1(0-1) 1(1-2) Χ2=1.63, df=2
p=0.048
Malaria (post 12
months)
50(46-54) 45(42-47) 46(42-50) 47(45-49) Χ2=1.67, df=2
p=0.067
Typhoid (past 12
months)
17(14-20) 11(10-13) 8(6-10) 13(12-14) Χ2=8.32, df=2
p<0.001
Respiratory illness
(past 12 months)
14(11-17) 9(8-11) 5(3-7) 10(9-12) Χ2=10.11, df=2
p<0.001
Gastrointestinal
illness (last 12
months)
6(4-7) 3(2-4) 1(0-2) 4(3-4) Χ2=6.18, df=2
p<0.001
Sustain injuries at
work at least once a
month
25(22-29) 25(22-27) 26(22-29) 25(23-27) Χ2=0.05, df=2
p=0.927
Have wounds at the
time of examination
7(5-9) 9(8-11) 8(6-10) 8(7-9) Χ2=1.26, df=2
p=0.150
Antibiotic (past 3
months)
19(16-22) 17(15-19) 14(11-17) 17(16-19) Χ2=1.55, df=2
p=0.08
Anti-inflammatory
(past 3 months)
44 (40-48) 43(41-46) 52(47-56) 45(43-47) Χ2=3.13, df=2
p=0.007
Antimalarial (past 3
months)
20(17-23) 25(23-28) 23(20-27) 23(21-24) Χ2=2.34, df=2
p=0.022

References______________________________ 237
Appendix 6 Spatial analysis
Figure A1 Differences between univariable K functions to test for spatial clustering for 5 zoonoses in slaughterhouse workers in western Kenya, 2012. The difference between the univariable K functions is denoted here by K1-K2 while r represents the radius. Upper and lower 95%confidence limits for the K functions are indicated by dotted lines. A) Leptospirosis, B) Q fever, C) RVF, D) Taeniasis, E) Cysticercosis
A
B
C

References______________________________ 238
D
E

References______________________________ 239
Appendix 7 Images for zoonotic disease recognition
Anthrax
http://commons.wikimedia.org/wiki/File:Anthrax_PHIL_2033.png
https://people.uwec.edu/piercech/bio/Pictures/cutaneous%20anthrax.jpg
Bovine tuberculosis
http://www.fao.org/docrep/003/t0756e/T0756E68.jpg
http://www.michigan.gov/images/deerlungsnodules1_74474_7.jpg
Brucellosis
http://www.vetnext.com/fotos/BRU_006.jpg
http://www.fao.org/docrep/003/t0756e/T0756E71.jpg
Cysticercosis
http://smallfarms.oregonstate.edu/sites/default/files/sfnarchive_img/sp12cysticercosis.jpg
Echinococcosis
http://www.michigan.gov/images/echinococcusgranulosis2_124096_7.jpg

References______________________________ 240
Appendix 8 Variables for multivariable models Chapter 5
Table A7 Full list of slaughterhouse level variables used for multivariable analysis of slaughterhouse worker seropositivity
Variable
Structural
Roof present
Cement floor
Solid walls
Electricity
Sanitation
Toilet
Piped water
Source of water
Borehole
Municipal
River
Well
Hand-washing place
Cleaned with soap
Dogs present
Rats present
Personal hygiene
Protective clothing worn
Worker buys clothing
Boots worn
Worker buys boots
Soap provided
Meat inspection
Meat inspector visits daily
Antemortem exam
Slaughter a sick animal

References______________________________ 241
Table A8 Full list of individual level variables used for multivariable analysis of slaughterhouse worker seropositivity
Variable Personal hygiene
Gender Wear protective clothing
Male Wear boots
Female Soap available
Age groups (years) Eat at the slaughterhouse
18-27 Smoke daily
28-37 Take alcohol daily
38-47 Drunk at interview
49+ Use the latrine everytime
Education Sustain injuries at work at least once a month
None Meat inspection
Primary Meat inspector visits
Secondary Antemortem exam
Duration of work (years) Slaughter sick animal
<5 Zoonoses awareness
6-10 Know animals give disease to people
11-15 Know disease can be transmitted from meat
16+ Named a zoonosis
Job in the slaughterhouse Named a disease from meat
Cleaner Health
Cleans intestines HIV
Flayer Wounds at time of interview
Slaughterman Febrile at interview
Other Malaria diagnosed
Water source Entamoeba histolytica
Borehole Iodamoeba butschulii
Spring Ascaris spp
River Hookworm
Well Trichuris spp.
Municipal S. mansoni

References______________________________ 242
Appendix 9 PAZ individual questionnaire
1 Start date and time
Please tick the box to automatically record the start time
2 Recorder ID
1-Eric; 2-Lian; 3-James; 4-Omoto; 5-Fredrick; 6-Jenipher
3 Homestead ID [barcode]
Please can the barcode
4 Does that participant meet the selection criteria (age over 5, not in last trimester of
pregnancy)?
Has informed consent been acquired?
5 Interviewee ID [barcode]
Please STICK the barcode in the file and SCAN it here
6 Language of questionnaireadministration
Teso, Samia, Bukusu, Luhya, Luo, Swahili
7 Participants age
NR, <1, 1-4, 5-9, 10-14, 15-19, 20-24, 25-29, 30-34, 35-39, 40-44, 45-49, 50-54, 55-59, 60-
64, 65-69, 70-74, 75-79, 80+
8 Participants sex
Male, Female, ND
9 Tribal origin
Teso, Luhya, Luo, Kikuyu, Samia, Saboat
10 Prinicipal religion (or the individual themselves)
Roman catholic, Protestant, Pentacostal, Baptist, Other Christian, Muslim
11Marital status
Single, Married, Divorced, Widowed, NR
12 How long have you lived in this village?
<1yr, 1-5 years, >5 years, NR
13 How many pregnancies have you had?
NR, None, 1, 2, 3, 4
14 Are you pregnant at present?
Yes, No, NR
15 If pregnant, what stage of pregnancy?
1st trimester, 2nd trimester, 3rd trimester
16 How many living children do you have?
NR, 1, 2, 3, 4, 5
17 What level of education have you reached?
No formal education, Pre-school, Primary, Secondary, Tertiary, College
18 What is your major occupation? Select ONE
Farmer, Trader, Shop keeper, Full time parent, Student, Driver
19 If other, please enter details of occupation
20 How many days do you leave your village each week?
Eg how many days did you leave the village THIS week?
Never, Less than once per week, 1, 2, 3. 4
21 On average, how many hours do you spend outside the village on each trip?
22 Do you have contact with dogs?
Never, Daily, At least once per week, At least once a month, At least once a year, Used to
but not anymore
23 Is there a dog living on this compound?
Yes, No, Don't know, ND

References______________________________ 243
24 How long has any dog lived here?
<1yr, 1-3 years, >3yrs, Unknown
25 Do you feed internal organs of animals to this dog?
Yes, No, Don't know, ND
26 Does/do your dog(s) ever receive drugs or injections?
Yes, No, Don't know, ND
27 What drugs/vaccines did the dog receive?
Worms, Mange, Fleas, Ticks, Vomiting, Diarrhoea
28 Is there a cat on the compound?
Yes, No, Don't know, ND
29 Do you have contact with any cats? (even if one dosen't live on this compound)
Never, Daily, At least once per week, At least once a month, At least once a year, Used to
but not anymore
30 In the last 12 months, have you been hunting?
No, Daily, At least once per week, At least once a month, At least once a year, Used to but
not anymore
31 In the last 12 months, have you been fishing (river or lake)?
No, Daily, At least once per week, At least once a month, At least once a year, Used to but
not anymore
32 In the last 12 months, have you been involved with taking animals (your own or someone
elses) for grazing?
No, Daily, At least once per week, At least once a month, At least once a year, Used to but
not anymore
33 In the last 12 months, have you been involved with feeding livestock within or outside the
home?
No, Daily, At least once per week, At least once a month, At least once a year, Used to but
not anymore
34 In the last 12 months, have you been involved with milking cattle within or outside the
home?
No, Daily, At least once per week, At least once a month, At least once a year, Used to but
not anymore
35 In the last 12 months, have you been invovled in milking goats or sheep within or
outside the home?
No, Daily, At least once per week, At least once a month, At least once a year, Used to but
not anymore
36 In the last 12 months, have you been involved with dealing with births of new animals
within or outside the home?
No, Daily, At least once per week, At least once a month, At least once a year, Used to but
not anymore
37 In the last 12 months, have you been involved with handling animals that have aborted or
aborted material?
No, Daily, At least once per week, At least once a month, At least once a year, Used to but
not anymore
38 In the last 12 months have you been invovled with the slaughter of animals within or
outside the home?
No, Daily, At least once per week, At least once a month, At least once a year, Used to but
not anymore
39 In the last 12 months, have you been involved with manure preparation within or outside
the home?

References______________________________ 244
No, Daily, At least once per week, At least once a month, At least once a year, Used to but
not anymore
40 In the last 12 months, have you been involved with skinning dead animals within or
outside the home?
No, Daily, At least once per week, At least once a month, At least once a year, Used to but
not anymore
41 In the last 12 months, have you been involved with burying dead animals within or outside
the home?
No, Daily, At least once per week, At least once a month, At least once a year, Used to but
not anymore
42 Do livestock have access to the building you sleep in?
Yes, No, NR
43 Which livestock have access to the buildings in which you sleep?
(Tick all that apply)
Cattle, Pigs, Goats, Sheep, Chickens, Ducks
44 In the last 12 months, have you seen wildlife around the home?
No, Daily, At least once per week, At least once a month, At least once a year, NR
45 What wildlife have you seen around the home? (any non domestic species should be
listed; tick all that apply).
Bushbuck, Other bovid, Bats, Mongoose, Snake, Monitor lizard
46 In the last 12 months, have you seen rats around the home?
Daily, Sometimes, Never, NR
47 Food preferences section
48 Do you ever eat meat?
Yes, No, NR
49 How often do you eat beef?
Never, Daily, At least once a week, At least once per month, At least once per year, Only on
special occasions
50 How do you like your beef cooked?
Boiling, Barbeque, Fried, Dried, Smoked, Raw
51 To what extent do you like your beef cooked?
Still red, Slightly pink, Brown on outside, Brown all through, Raw, Other
52 How often do you eat pork?
Never, Daily, At least once a week, At least once per month, At least once per year, Only on
special occasions
53 How do you like your pork cooked?
Boiling, Barbeque, Fried, Dried, Smoked, Raw
54 To what extent do you like your pork cooked?
Juicy, Dry, White, With blood, Fully roasted, Still red
55 Would you consider buying pork that looks like this
(SHOW PICTURE OF PORK WITH CYSTS)
Frequently, Sometimes, Never, NR
56 In the last 12 months, where have you obtained meat? Tick all that apply.
I have never obtained meat, Butchery shop, Market, Own animals, Neighbour, Family
member
57 In the last 12 months, have you eaten meat outside the home?
Yes, No, NR
58 In the last 12 months, where have you eaten meat outside the homestead? Tick all that
apply.
Neighbour, Roadside, Hotel, School, Other

References______________________________ 245
59 In the last 12 months, have you drunk cows milk?
Yes, No, NR
60 How often do you drink cows milk?
Daily, At least once a week, At least once per month, At least once per year, Only on special
occasions, NR
61 Where do you obtain cows milk?
Own herd, Neighbour, Shop, Market, Other, NR
62 In the last 12 months, how have you taken cows milk for drinking?
Boiled, Soured, Raw, Pasteurised, Other
63 In the last 12 months, have you drunk goats milk?
Yes, No, NR
64 How often do you drink goats milk?
Daily, At least once a week, At least once per month, At least once per year, Only on special
occasions, NR
65 Where do you obtain goats milk?
Own herd, Neighbour, Shop, Market, Other, NR
66 In the last 12 months, how have you taken goats milk?
Boiled, Soured, Raw, Pasteurised, Other
67 In the last 12 months, have you drunk animal blood?
Yes, No, NR
68 In the last 12 months, how often have you taken animal blood?
Daily, At least once a week, At least once per month, At least once per year, Only on special
occasions, NR
69 In the last 12 months, where have you obtained animal blood?
Own herd, Neighbour, Shop, Butchery/slab, Market, Other
70 Water and hygiene section
71 Where did you obtain your water from in the last wet season?
Borehole, River, Pump, Tap, Well, Spring
72 Where did you obtain your water from in the last dry season?
Borehole, River, Pump, Tap, Well, Spring
73 Are you involved in collecting water?
Yes, No, NR
74 This month, have you treated water before drinking it?
No, Boil, Add chlorine, Add iodine, Filter, Other
75 In the last month, how often have you used the latrine when you need to defecate?
Always, Frequently, Sometimes, Never, NR
76 Health status section
77 Have you had a period of illness in the past 12 months?
Yes, No, NR
78 If you have had a health problem, please list
79 Usually when you feel ill, where do you seek treatment?
Don't seek treatment, Family member, Community health worker, Traditional healer,
Chemist, Private clinic
80 Have you ever had worms in your faeces?
Yes, No, Don't know, NR
81 If you have had worms in your faeces, when was the last episode?
Currently ill, <1week ago, <1 month ago, 1-3 months ago, 3-6 months ago, 6 mon-1yr ago
82 Where did you seek treatment for worms?
Don't seek treatment, Family member, Community health worker, Traditional healer,
Chemist, Private clinic

References______________________________ 246
83 Have you ever seen blood in your urine?
Yes, No, Don't know, NR
84 If you have had blood in your urine, when was the last episode?
Currently ill, <1week ago, <1 month ago, 1-3 months ago, 3-6 months ago, 6 mon-1yr ago
85 Have you ever had problems breathing?
Yes, No, Don't know, NR
86 If you have had problems breathing, when was the last episode?
Currently ill, <1week ago, <1 month ago, 1-3 months ago, 3-6 months ago, 6 mon-1yr ago
87 Describe symptoms of breathing problems
88 Where did you seek treatment for breathing difficulties?
Don't seek treatment, Family member, Community health worker, Traditional healer,
Chemist, Private clinic
89 Have you ever had fever?
Yes, No, Don't know, NR
90 If you have had fever, when was the last episode?
Currently ill, <1week ago, <1 month ago, 1-3 months ago, 3-6 months ago, 6 mon-1yr ago
91 Where did you seek treatment for this fever?
Don't seek treatment, Family member, Community health worker, Traditional healer,
Chemist, Private clinic
92 Have you had diagnosed malaria?
Yes, No, Don't know, NR
93 If yes, when was the last episode?
Currently ill, <1week ago, <1 month ago, 1-3 months ago, 3-6 months ago, 6 mon-1yr ago
94 If you have had diagnosed malaria, where did you seek treatment?
Don't seek treatment, Family member, Community health worker, Traditional healer,
Chemist, Private clinic
95 Have you ever had a dog bite?
Yes, No, Don't know, NR
96 If you have had a dog bite, when did this last occur?
<1week ago, <1 month ago, 1-3 months ago, 3-6 months ago, 6 mon-1yr ago, >1yr ago
97 In response to this dog bite, what did you do?
Nothing, Received injection, Received several injections, Obtained tablets, Consulted health
worker, Taken to hospital
98 If other treatment for dog bite, enter details
99 Have you been bitten by another animal in the last 12 months?
No, Cat, Rat, Pig, Cow, Goat/sheep
100 When was this other animal bite?
<1week ago, <1 month ago, 1-3 months ago, 3-6 months ago, 6 mon-1yr ago, >1yr ago
101 Are you aware of ever having had brucellosis?
Yes, No, Don't know, NR
102 Are you aware of ever having had tuberculosis?
Yes, No, Don't know, NR
103 Are you aware of ever having had q-fever?
Yes, No, Don't know, NR
104 Are you aware of ever having had sleeping sickness?
Yes, No, Don't know, NR
105 Are you aware of ever having had tapeworm?
Yes, No, Don't know, NR
106 Are you aware of ever havinghad Rift Valley Fever?
Yes, No, Don't know, NR

References______________________________ 247
107 Have you taken any medicines in the last one month?
Yes, No, Don't know, NR
108 If you have taken medicines in the last month, tick all that apply...
Unknown, Chloroquine, Other antemalarial, Anti-retroviral, Antibiotic, Anti-tussives
109 Are you currently taking any medicines?
Yes, No, Don't know, NR
110 If you are currently taking medicines, please enter all that apply...
Unknown, Chloroquine, Other antemalarial, Anti-retroviral, Antibiotic, Anti-tussives
111 Have you had the following in the last 3 months: fever/chills?
Yes, No, Don't know, ND
112 Have you had the following in the last 3 months: joint pain?
Yes, No, Don't know, ND
113 Have you had the following in the last 3 months: backache?
Yes, No, Don't know, ND
114 Have you had the following in the last 3 months: headache?
Yes, No, Don't know, ND
115 Have you had the following in the last 3 months: loss of vision?
Yes, No, Don't know, ND
116 Have you had the following in the last 3 months: chest pain?
Yes, No, Don't know, ND
117 Have you had the following in the last 3 months: general weakness?
Yes, No, Don't know, ND
118 Have you had the following in the last 3 months: lack of coordination?
Yes, No, Don't know, ND
119 Have you had the following in the last 3 months: seizures?
Yes, No, Don't know, ND
120 Have you had the following in the last 3 months: confusion?
Yes, No, Don't know, ND
121 Have you had the following in the last 3 months: loss of appetite?
Yes, No, Don't know, ND
122 Have you had the following in the last 3 months: sudden weight loss?
Yes, No, Don't know, ND
123 Have you had the following in the last 3 months: cough?
Yes, No, Don't know, ND
124 Have you had the following in the last 3 months: shortness of breath?
Yes, No, Don't know, ND
125 Have you had the following in the last 3 months: adenitis?
Yes, No, Don't know, ND
126 Have you had the following in the last 3 months: abdominal discomfort?
Yes, No, Don't know, ND
127 Have you had the following in the last 3 months: nausea/vomiting?
Yes, No, Don't know, ND
128 Have you had the following in the last 3 months: diarrhoea?
Yes, No, Don't know, ND
129 Have you attended hospital in the last 5 years?
Yes, No, Don't know, ND
130 What was the visit to hospital for?
Injury, Childbirth, Acute sickness, Fever or malaria, TB, Sleeping sickness
131 If visited hospital for another reason, please enter details
132 Do you smoke cigarettes?

References______________________________ 248
Daily, Weekly, Monthly, On special occasions, Previously but not anymore, Never
133 If daily or weekly, what is the number of cigarettes you smoke per week?
134 Do you know if you were vaccinated as a child?
Yes, No, Don't know, NR
135 Do you know if you have ever received vaccinations against the following disease:
rabies?
Yes, No, Don't know, NR
136 Do you know if you have ever received vaccinations against the following disease: TB?
Yes, No, Don't know, NR
137 Do you know if you have ever received vaccinations against the following disease:
tetanus?
Yes, No, Don't know, NR
138 Do you know if you have ever received vaccinations against the following disease:
polio?
Yes, No, Don't know, NR
139 Do you know if you have ever received vaccinations against the following disease:
influenza?
Yes, No, Don't know, NR
140 Do you know if you have ever received vaccinations against the following disease:
mumps?
Yes, No, Don't know, NR
141 Do you know if you have ever received vaccinations against the following disease:
measles?
Yes, No, Don't know, NR
142 Do you know if you have ever received vaccinations against
the following disease: rubella?
Yes, No, Don't know, NR
143 Do you know if you have ever received vaccinations againstthe following disease:
typhoid?
Yes, No, Don't know, NR
144 Do you know if you have ever received vaccinations against the following disease:
diptheria?
Yes, No, Don't know, NR
145 Do you know if you have ever received vaccinations against the following disease:
cholera?
Yes, No, Don't know, NR
146 Do you know if you have ever received vaccinations against the following disease:
hepatitis A?
Yes, No, Don't know, NR
147 Do you know if you have ever received vaccinations against the following disease:
hepatitis B?
Yes, No, Don't know, NR
148 Do you know if you have ever received vaccinations againstthe following disease:
meningitis?
Yes, No, Don't know, NR
149 Do you know if you have ever received vaccinations againstthe following disease: yellow
fever?
Yes, No, Don't know, NR
150 Knowledge about food-borne and zoonotic diseases
151 Are you aware of any diseases you might catch from contact with animals?

References______________________________ 249
Yes, No, Don't know, NR
152 Which symptoms/diseases might you catch from cattle?
Unknown diseases, Malaria, Fever, Stomach pain, Diarrhoea, Respiratory difficulties
153 Which diseases/symptoms might you catch from pigs?
Unknown diseases, Malaria, Fever, Stomach pain, Diarrhoea, Respiratory difficulties
154 Which diseases/symptoms might you catch from sheep or goats?
Unknown diseases, Malaria, Fever, Stomach pain, Diarrhoea, Respiratory difficulties
155 Which symtoms/diseases might you catch from dogs or cats?
Unknown diseases, Malaria, Fever, Stomach pain, Diarrhoea, Respiratory difficulties
156 Are you aware of any diseases you might catch from eating meat?
No, Don't know, Unknown diseases, Malaria, Stomach pain, Diarrhoea
157 Direct measurements section
158 Weight (kg)
159 Height (cm)
160 Mid-Upper Arm Circumference (MUAC) (mm) If over 340mm enter 341
161 Temperature (degrees C)
162 Splenomegaly
Yes, No, Don't know, Refused Examination
163 Hepatomegaly
Yes, No, Don't know, Refused Examination
164 Abdominal distension
Yes, No, Don't know, Refused Examination
165 Membrane palour
Yes, No, Don't know, Refused Examination
166 Jaundice
Yes, No, Don't know, Refused Examination
167 Limb oedema
Yes, No, Don't know, Refused Examination
168 Rash
Yes, No, Don't know, Refused Examination
169 Wounds requiring treament?
Yes, No, Don't know, Refused Examination
170 BARCODE: Take a red top blood sample. Please scan the barcode
171 BARCODE: Take a green top blood sample. Please scan the barcode
172 BARCODE: Take a purple top blood sample. Please scan the barcode
173 Was a stool sample collectedfrom this participant?
Yes, No
174 BARCODE: Scan the stool sample barcode for thisparticipant.
175 BARCODE: Please scan the barcode for the thick film
176 BARCODE: Please scan the barcode for the thin film
177 Almost finished! Tick the box to enter the time and date of questionnaire completion.

References______________________________ 250
Appendix 10 PAZ homestead questionnaire
1 Enter date and time start
2 Homestead unique ID [BARCODE]
3 Name of household head
4 Sex of the respondent
Male, Female, ND
5 Language of questionnaire administration
Teso, Samia, Bukusu, Luhya, Luo, Swahili
6 If the answer was "Other language," please type the language name here
7 How many people currently live in the homestead? (by homestead we mean all dwellings
within the compound)
8 How many people
9 Field: How many people aged 1-4
10 How many people aged 5-9
11 How many people aged 10-14
12 How many people aged 15-19
13 How many people aged 20-24
14 How many people aged 25-29
15 How many people aged 30-34
16 How many people aged 35-39
17 How many people aged 40-44
18 How many people aged 45-49
19 How many people aged 50-54
20 How many people aged 55-59
21 How many people aged 60-64
22 How many people aged 65-69
23 How many people aged 70-74
24 How many people aged 75-79
25 How many people aged 80-84
26 How many people 85+
27 autocount age
28 Age sum checker
If the ages do not add up, you will see an error. If no error appears, click NEXT and proceed.
29 Livestock ownership census Please now enter details relating to livestock ownership
30 Does this homestead keep cattle?
Yes, No, ND
31 Cattle: number of male calves
32 Cattle: number of female calves
33 Cattle: number of weaned males
34 Cattle: number of weaned females
35 Cattle: number of adult male (castrate)
36 Cattle: number of adult males (entire)
37 Cattle: number of adult females
38 Does this homestead keep pigs?
Yes, No, ND
39 Pigs: number of suckling piglets
40 Pigs: weaned males not yet mated
41 Pigs: weaned females non parous

References______________________________ 251
42 Pigs: sows pregnant or parity
43 Pigs: boars that have bred
44 Does this home keep sheep?
Yes, No, ND
45 How many sheep does this home keep?
46 Does this home keep goats?
Yes, No, ND
47 How many goats does this homestead keep?
48 Does this home keep chickens?
Yes, No, ND
49 Does this home keep ducks?
Yes, No, ND
50 Does this home own/keep dogs?
Yes, No, ND
51 Does this home own/keep cats?
Yes, No, ND
52 Does this home keep any other livestock?
Yes, No, ND
53 Please enter other livestock kept
54 What is your source of water for cooking/drinking in the DRY season? Tick ALL that apply
Borehole, Dam/Pond, River, Well, Spring, Piped
55 What is your source of water for cooking/drinking in the WET season? Tick ALL that apply
Borehole, Dam/Pond, River, Well, Spring, Piped
56 In the last month, have you treated your water at your homestead before drinking it?
No, Boil, Add chlorine, Add iodine, Waterguard, Aquatabs
57 What is the main cooking fuel in the household?
Open fire – firewood, Open fire – charcoal, Gas stove, Jico stove, Paraffin stove, Solar stove
58 Has your village experienced flooding in last 12 months - to extent that crops were
damaged?
Yes, No, ND
59 When was flooding last experienced?
This week, This month, Last 6 months, Last 12 months
60 Has your village experienced drought in the last 12 months, to the extent that plants
started to fail?
Yes, No, ND
61 When was drought last experienced?
This week, This month, Last 6 months, Last 12 months
62 Do you grow crops?
Yes, No, ND
63 Why do you grow crops? Tick all that apply
For the homestead, To sell
64 Access to medical care questions Please answer questions relating to medical care
65 Where does the majority of your household access medical facilities?
Community heath workers, Traditional healer, Chemist, Hospital, Health centre, Church
healer
66 Medical care access – other, please write response below
67 Distance to most used medical facility (km)
68 How do you normally get to the medical facility?
Walk, Boda boda (bicyle), Boda boda (motorbike),Own bike, Own Motorbike, Matatu
69 How much would it normally cost you to get to the medical facility?

References______________________________ 252
Enter value in KSh
70 Does this homestead keep ANY animals? (you will have already asked this question)
Yes, No
71 Where do you access veterinary services? Tick all that apply
Never accessed, Gov't vet, Private vet, Family/myself, Vet drug supplier, Extension service
72 Where do you access veterinary services - other? If OTHER, enter details
73 Have you used veterinary services in the last 12 months?
Yes, No, ND
74 Does this homestead keep Cattle? (you will already have asked this question)
Yes, No
75 Why do you keep cattle? Tick all that apply
ND, milk for the home, milk to sell, meat for the home, meat to sell, manure
76 Do you ever buy cattle or have you received cattle as a gift from outside the homestead?
Yes, No, ND
77 How long ago did you last buy/acquire new cattle?
<1 month ago, 1<2 months, 2<3 months, 3<6 months, 6months -1 year, >1yr ago
78 Where do you usually buy cattle/receive cattle from?
Market within sublocation, Market in other sublocation, Other source within sublocation,
Other source in other sublocation
79 Name of market
80 If bulls are kept do you rent or lend them for breeding
Do you rent your bulls for breeding?
Yes, No, NR
81 Do your cows/bulls engage in communal breeding?
Yes, No, ND
82 Have you ever experienced abortion in your herd?
Yes, No, NR
83 How long ago was the last abortion?
1 month ago, 2 months ago, 3 months ago, Up to 6 months ago, Up to 1yr ago, More than
1yr
84 What did you do with the aborted material?
Left it alone, Buried it, Burnt it, Fed it to animals, Ate it, Took it to the bush
85 How often are your cows milked?
No lactating cattle, Do not milk cows, 1x daily, 2x daily, 3x daily, Once every two days
86 Are cattle herded with goats or sheep?
(the farmers own or other small ruminants)
Yes, No, ND
87 How do you graze/feed cattle in the dry season?
Zero grazing, Herded as single herd, Herded with other herds, Tethered, Free (communal)
grazing, NR
88 How do you graze/feed cattle in the wet season?
Zero grazing, Herded as single herd, Herded with other herds, Tethered, Free (communal)
grazing, NR
89 Do you use anything to control worms in your cattle?
Yes, No, ND
90 What do you use to control worms in cattle?
Drench (unknown drug), tablets/bolus (unkown drug), Pour on (unknown drug), Injection
(unknown drug), Traditional remedy, Albendazole
91 How often do you use this cattle deworming product?
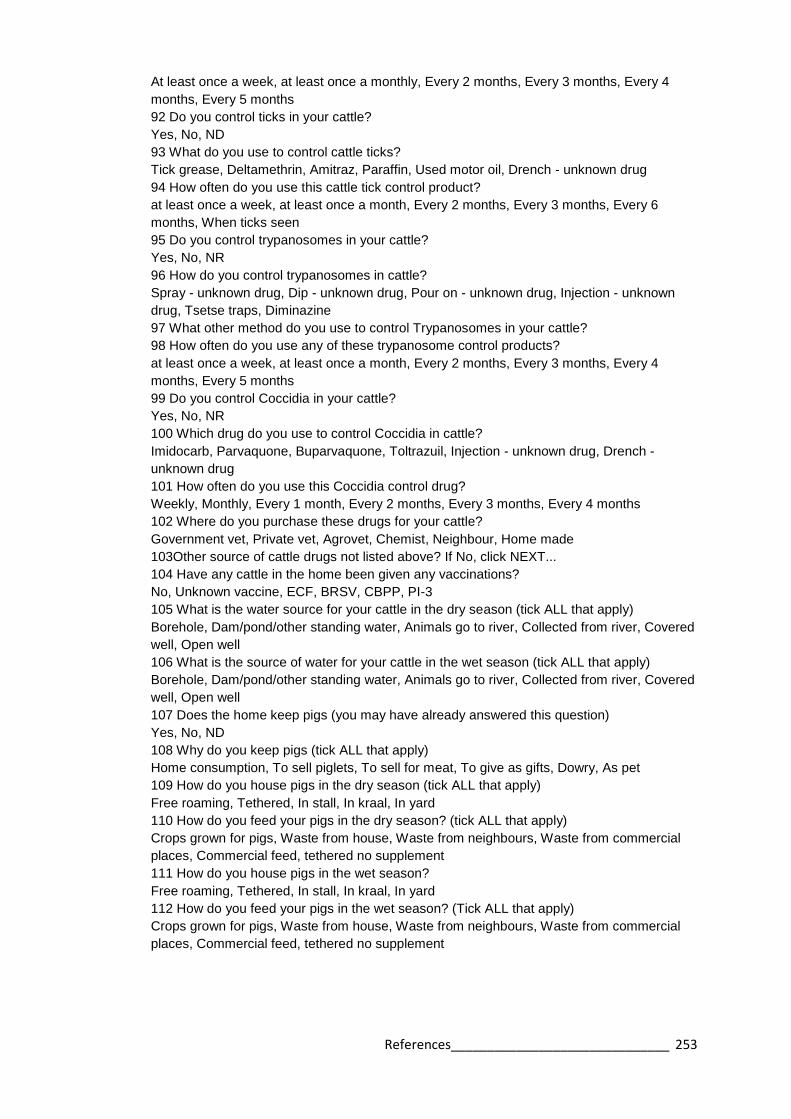
References______________________________ 253
At least once a week, at least once a monthly, Every 2 months, Every 3 months, Every 4
months, Every 5 months
92 Do you control ticks in your cattle?
Yes, No, ND
93 What do you use to control cattle ticks?
Tick grease, Deltamethrin, Amitraz, Paraffin, Used motor oil, Drench - unknown drug
94 How often do you use this cattle tick control product?
at least once a week, at least once a month, Every 2 months, Every 3 months, Every 6
months, When ticks seen
95 Do you control trypanosomes in your cattle?
Yes, No, NR
96 How do you control trypanosomes in cattle?
Spray - unknown drug, Dip - unknown drug, Pour on - unknown drug, Injection - unknown
drug, Tsetse traps, Diminazine
97 What other method do you use to control Trypanosomes in your cattle?
98 How often do you use any of these trypanosome control products?
at least once a week, at least once a month, Every 2 months, Every 3 months, Every 4
months, Every 5 months
99 Do you control Coccidia in your cattle?
Yes, No, NR
100 Which drug do you use to control Coccidia in cattle?
Imidocarb, Parvaquone, Buparvaquone, Toltrazuil, Injection - unknown drug, Drench -
unknown drug
101 How often do you use this Coccidia control drug?
Weekly, Monthly, Every 1 month, Every 2 months, Every 3 months, Every 4 months
102 Where do you purchase these drugs for your cattle?
Government vet, Private vet, Agrovet, Chemist, Neighbour, Home made
103Other source of cattle drugs not listed above? If No, click NEXT...
104 Have any cattle in the home been given any vaccinations?
No, Unknown vaccine, ECF, BRSV, CBPP, PI-3
105 What is the water source for your cattle in the dry season (tick ALL that apply)
Borehole, Dam/pond/other standing water, Animals go to river, Collected from river, Covered
well, Open well
106 What is the source of water for your cattle in the wet season (tick ALL that apply)
Borehole, Dam/pond/other standing water, Animals go to river, Collected from river, Covered
well, Open well
107 Does the home keep pigs (you may have already answered this question)
Yes, No, ND
108 Why do you keep pigs (tick ALL that apply)
Home consumption, To sell piglets, To sell for meat, To give as gifts, Dowry, As pet
109 How do you house pigs in the dry season (tick ALL that apply)
Free roaming, Tethered, In stall, In kraal, In yard
110 How do you feed your pigs in the dry season? (tick ALL that apply)
Crops grown for pigs, Waste from house, Waste from neighbours, Waste from commercial
places, Commercial feed, tethered no supplement
111 How do you house pigs in the wet season?
Free roaming, Tethered, In stall, In kraal, In yard
112 How do you feed your pigs in the wet season? (Tick ALL that apply)
Crops grown for pigs, Waste from house, Waste from neighbours, Waste from commercial
places, Commercial feed, tethered no supplement

References______________________________ 254
113 Please repeat: are pigs fed waste (from homestead or hotels) during any season?
Yes, No, ND
114 If pigs are fed waste, do you cook it prior to feeding to the pigs?
Yes, No, ND
115 Please repeat: are pigs housed during any season?
Yes, No, ND
116 What is the flooring in the pig housing?
Mud, Concrete, Slatted, Other
117 Do you use anything to control worms in your pigs?
Yes, No, ND
118 What do you administer to control worms in pigs?
Don't know, Drench (unknown drug), Tablet/bolus (unknown drug), Pour on (unknown drug),
Injection (unknown drug), Albendazole
119 How often do you use this pig worm control product?
at least once a week, at least once a month, Every 2 months, Every 3 months, Every 4
months, Every 5 months
120 Do you control ticks in your pigs?
Yes, No, ND
121 What do you use to control ticks in pigs?
Tick grease, Deltamethrin, Amitraz, Paraffin, Used motor oil, Drench - unknown drug
122 How often do you use this pig tick control product?
at least once a week, at least once a month, Every 2 months, Every 3 months, Every 4
months, Every 5 months
123 Where do you purchase these drugs for your pigs?
Government vet, Private vet, Agrovet, Chemist, Neighbour, Home made
124 Have the pigs on the homestead been vaccinated against anything?
Yes, No, Don't know, ND
125 Pig vaccine - does the farmer know which vaccine it was?
Enter YES for known vaccine
Enter NO for unknown vaccine
Yes, No, ND
126 Name of pig vaccine if known
127 Are there any significant problems with your pigs?
No, Worms, Ticks, ASF, Sudden mortality, unknown cause, Dystocia
128 Some questions about the slaughtering of animals will follow
129 Do you ever slaughter your own animals?
Yes, Only Chickens, No, NR
130 Where do you slaughter cattle?
At the homestead, Away from homestead, Don't slaughter cattle, NR
131 How often do you slaughter cattle?
Daily, Weekly, Monthly, Special occasions only, At least once every 6 months, At least once
per year
132 Where do you slaughter your pigs?
At the homestead, Away from homestead, Don't slaughter pig, NR
133 How often do you slaughter pigs?
Daily, Weekly, Monthly, At least once in 6 months, At least once per year, Less than once
per year
134 Do you slaughter goats or sheep at home?
Yes, No, Don't know, NR
135 Are your pigs inspected at slaughter?

References______________________________ 255
Yes, No, Don't know, NR
136 Who inspected the meat for cysts?
Myself, Neighbour, Government inspector, Private vet, Other
137 If cysts are found, what do you do with the meat?
Have never found cysts, Dispose of carcass, Cut out cycts and use meat, Sell to others,
Treat as normal, Other
138 Do you buy meat from the butcher/market?
Yes, No, Don't know
139 How many houses (dwellings occupied by humans) are there on the compound?
140 Roof - how many with iron sheets?
141 Roof - how many with thatch?
142 Roof- how many with tiles?
143 Roof: how many with other materials?
144 The result of your data entry for roof questions is:
Field: Roof sum checker If the roof types do not add up, you will see an error. If no error
appears, click NEXT and proceed.
146 Walls: how many with mud (no bricks)?
147 Walls: how many with unburnt bricks?
148 Walls: how many burnt mud bricks?
149 Walls: count burnt bricks and cement?
150 Walls: count mud with cement?
Field: Walls: how many with timber walls?
152 Walls: how many cement only?
153 Walls: how many stone walls?
154 Walls: how many with other materials?
155 Walls calc checker
156 Walls sum checker If the wall types do not add up, you will see an error. If no error
appears, click NEXT and proceed.
157 Floor: how many have earth?
158 Floors: how many cemented?
159 Floors: how many tiled?
160 Floors: how many wooden?
161 Floor: how many other materials?
162 Floor calc checker
163 Floor sum checker If the floor types do not add up, you will see an error. If no error
appears, click NEXT and proceed.
164 Is there a latrine in the compound?
Yes, No, ND
165 What type of latrine is there on the compound? (this question is mainly to determine
possible animal access, so completely closed
Latrine completely closed, Partially closed, Open pit
166 Is there evidence of latrine use on a regular basis?
Yes, No, ND
167 Is there evidence of scavenging by animals around the latrine?
Yes, No, ND
168 Electricity: do you have the following in your home? Tick ALL that apply
Electricity (from mains), Electricity from generator, Electricity from a car battery, Electricity
from solar power, None of the above
169 Household electric goods: do you have the following in your home? Tick ALL that
APPLY

References______________________________ 256
Radio, Mobile phone, Mobile phone charger, Television, None of the above
170 Furniture: do you have the following in your home? Tick ALL that APPLY
Cupboard, Wooden bed, Bednet, Sofa with cushions, Clock, Watch
171 Transport: do you have the following in your home? Tick ALL that APPLY
Bicycle, Motorbike, Car, None of the above
172 Have you ever been involved in any other programmes (research, government,
interventions, medical or veterinary?
Yes, No, Don't know
173 If other programmes, please explain
174 This is the end of the questionnaire to the farmer. Please THANK the farmer for their
participation
175 GPS northing
176 GPS easting
177 GPS elevation Please enter the altitude as recorded by the GPS (in metres)
178 GPS code Enter the code given to the GPS unit used
179 Enter the record number recorded in the GPS device
180 Enter date and time end

References______________________________ 257
Appendix 11 Variables for multivariable models Chapter 7
Table A9 Full list of individual and homestead level variables used for multivariable analysis of participant seropositivity
Variable Risk factors for zoonoses
Gender Home slaughter
Male Skinning animals
Female Deal with animals births
Age Handling abortion material
<35 Handling manure
35 Milking cows
Education Milking goats
None Hunting
Primary Contact with dogs
Secondary See rats around homestead
Occupation Drink animal blood
Farmer Eat beef
Other Eat pork
Dietary Drink cow’s milk
Eat beef Drink goat’s milk
Eat pork Keep cattle
Drink cows milk Keep sheep
Drink goats milk Keep goats
Health Keep pigs
HIV Keep chickens
Wounds at time of interview Miscellaneous
Febrile at interview Smoking behaviour
Malaria diagnosed Latrine use
Entamoeba histolytica Water source
Iodamoeba butschulii Borehole
Ascaris spp Spring
Hookworm River
Trichuris spp. Well
S. mansoni Municipal

References______________________________ 258
References
ABELA-RIDDER, B., SIKKEMA, R. & HARTSKEERL, R. A. 2010. Estimating the
burden of human leptospirosis. Int J Antimicrob Agents, 36 Suppl 1, S5-7.
ABO-SHEHADA, M. N., ODEH, J. S., ABU-ESSUD, M. & ABUHARFEIL, N.
1996. Seroprevalence of brucellosis among high risk people in northern
Jordan. Int J Epidemiol, 25, 450-4.
ABU-ELYAZEED, R., EL-SHARKAWY, S., OLSON, J., BOTROS, B.,
SOLIMAN, A., SALIB, A., CUMMINGS, C. & ARTHUR, R. 1996.
Prevalence of anti-Rift-Valley-fever IgM antibody in abattoir workers in the
Nile delta during the 1993 outbreak in Egypt. Bull World Health Organ, 74,
155-8.
ADAZU, K., LINDBLADE, K. A., ROSEN, D. H., ODHIAMBO, F., OFWARE, P.,
KWACH, J., VAN EIJK, A. M., DECOCK, K. M., AMORNKUL, P.,
KARANJA, D., VULULE, J. M. & SLUTSKER, L. 2005. Health and
demographic surveillance in rural western Kenya: a platform for evaluating
interventions to reduce morbidity and mortality from infectious diseases. Am
J Trop Med Hyg, 73, 1151-8.
ADLER, B., MURPHY, A. M., LOCARNINI, S. A. & FAINE, S. 1980. Detection of
specific anti-leptospiral immunoglobulins M and G in human serum by solid-
phase enzyme-linked immunosorbent assay. J Clin Microbiol, 11, 452-7.
ALI, S., ALI, Q., NEUBAUER, H., MELZER, F., ELSCHNER, M., KHAN, I.,
ABATIH, E. N., ULLAH, N., IRFAN, M. & AKHTER, S. 2013.
Seroprevalence and risk factors associated with brucellosis as a professional
hazard in Pakistan. Foodborne Pathog Dis, 10, 500-5.
ALLAN, J. C. & CRAIG, P. S. 2006. Coproantigens in taeniasis and echinococcosis.
Parasitol Int, 55 Suppl, S75-80.
ALLAN, J. C., VELASQUEZ-TOHOM, M., TORRES-ALVAREZ, R., YURRITA,
P. & GARCIA-NOVAL, J. 1996. Field trial of the coproantigen-based
diagnosis of Taenia solium taeniasis by enzyme-linked immunosorbent assay.
Am J Trop Med Hyg, 54, 352-6.
ALSTON, J. M. & BROWN, H. C. 1935. Prevalence of Weil's Disease in Certain
Occupations. Br Med J, 2, 339-40.
ANYANGU, A. S., GOULD, L. H., SHARIF, S. K., NGUKU, P. M., OMOLO, J.
O., MUTONGA, D., RAO, C. Y., LEDERMAN, E. R., SCHNABEL, D.,
PAWESKA, J. T., KATZ, M., HIGHTOWER, A., NJENGA, M. K., FEIKIN,
D. R. & BREIMAN, R. F. 2010. Risk factors for severe Rift Valley fever
infection in Kenya, 2007. Am J Trop Med Hyg, 83, 14-21.
ARAJ, G. F., BROWN, G. M., HAJ, M. M. & MADHVAN, N. V. 1988. Assessment
of Brucellosis Card test in screening patients for brucellosis. Epidemiol
Infect, 100, 389-98.
ARAJ, G. F., LULU, A. R., MUSTAFA, M. Y. & KHATEEB, M. I. 1986.
Evaluation of ELISA in the diagnosis of acute and chronic brucellosis in
human beings. J Hyg (Lond), 97, 457-69.
ARI, M. D., GURACHA, A., FADEEL, M. A., NJUGUNA, C., NJENGA, M. K.,
KALANI, R., ABDI, H., WARFU, O., OMBALLA, V., TETTEH, C.,
BREIMAN, R. F., PIMENTEL, G. & FEIKIN, D. R. 2011. Challenges of

References______________________________ 259
establishing the correct diagnosis of outbreaks of acute febrile illnesses in
Africa: the case of a likely Brucella outbreak among nomadic pastoralists,
northeast Kenya, March-July 2005. Am J Trop Med Hyg, 85, 909-12.
ASAAVA, L. L., KITALA, P. M., GATHURA, P. B., NANYINGI, M. O.,
MUCHEMI, G. & SCHELLING, E. 2009. A survey of bovine
cysticercosis/human taeniosis in Northern Turkana District, Kenya. Prev Vet
Med, 89, 197-204.
ASH, L. R., ORIHEL, T.C. AND SAVIOLI, L. 1994. Bench Aids for the Diagnosis
of intestinal parasites. Geneva: World Health Organisation.
AUSTRALIAN GOVERNMENT, D. O. H. (ed.) 2013. The Australian Immunisation
Handbook, Canberra, ACT, Australia: Commonwealth of Australia.
AZHAR, E. I., MADANI, T. A., KAO, M. & JAMJOOM, G. A. 2010. A
seroepidemiological study of rift valley fever virus among slaughter houses
workers in Saudi Arabia. International Journal of Medicine and Medical
Sciences, 2, 111-115.
BADDELEY, A. A. T., R. 2005. spatstat: An R Package for Analyzing Spatial Point
Patterns. Journal of Statistical Software [Online], 12. Available:
http://www.jstatsoft.org/v12/i06/. [Accessed August 4th 2014].
BAJANI, M. D., ASHFORD, D. A., BRAGG, S. L., WOODS, C. W., AYE, T.,
SPIEGEL, R. A., PLIKAYTIS, B. D., PERKINS, B. A., PHELAN, M.,
LEVETT, P. N. & WEYANT, R. S. 2003. Evaluation of four commercially
available rapid serologic tests for diagnosis of leptospirosis. J Clin Microbiol,
41, 803-9.
BALL, M. G. 1966. Animal hosts of leptospires in Kenya and Uganda. Am J Trop
Med Hyg, 15, 523-30.
BARCELLOS, C. & SABROZA, P. C. 2001. The place behind the case:
leptospirosis risks and associated environmental conditions in a flood-related
outbreak in Rio de Janeiro. Cad Saude Publica, 17 Suppl, 59-67.
BATES, D., MAECHLER, M., BOLKER, B. AND WALKER, S. 2014. lme4:
Linear mixed-effects models using Eigen and S4. R package version 1.0-6
[Online]. Available: http://CRAN.R-project.org/package=lme4 [Accessed
July 11th 2014].
BEHESHTI, S., REZAIAN, G. R., AZAD, F., FAGHIRI, Z. & TAHERI, F. 2010.
Seroprevalence of brucellosis and risk factors related to high risk
occupational groups in Kazeroon, South of Iran. Int J Occup Environ Med, 1,
62-8.
BENGTSSOM, L. P. A. W. J. H. (ed.) 1988. Farm structures in tropical climates,
Rome: Food and Agriculture Organisation of the United Nations.
BENSCHOP, J., HEUER, C., JAROS, P., COLLINS-EMERSON, J., MIDWINTER,
A. & WILSON, P. 2009. Sero-prevalence of leptospirosis in workers at a
New Zealand slaughterhouse. N Z Med J, 122, 39-47.
BERNARD, H., BROCKMANN, S. O., KLEINKAUF, N., KLINC, C., WAGNER-
WIENING, C., STARK, K. & JANSEN, A. 2012. High seroprevalence of
Coxiella burnetii antibodies in veterinarians associated with cattle obstetrics,
Bavaria, 2009. Vector Borne Zoonotic Dis, 12, 552-7.
BHARTI, A. R., NALLY, J. E., RICALDI, J. N., MATTHIAS, M. A., DIAZ, M. M.,
LOVETT, M. A., LEVETT, P. N., GILMAN, R. H., WILLIG, M. R.,
References______________________________ 260
GOTUZZO, E. & VINETZ, J. M. 2003. Leptospirosis: a zoonotic disease of
global importance. Lancet Infect Dis, 3, 757-71.
BIGGS, H. M., GALLOWAY, R. L., BUI, D. M., MORRISSEY, A. B., MARO, V.
P. & CRUMP, J. A. 2013. Leptospirosis and human immunodeficiency virus
co-infection among febrile inpatients in northern Tanzania. Vector Borne
Zoonotic Dis, 13, 572-80.
BIKAS, C., JELASTOPULU, E., LEOTSINIDIS, M. & KONDAKIS, X. 2003.
Epidemiology of human brucellosis in a rural area of north-western
Peloponnese in Greece. Eur J Epidemiol, 18, 267-74.
BLAAUW, G. J., NOTERMANS, D. W., SCHIMMER, B., MEEKELENKAMP, J.,
REIMERINK, J. H., TEUNIS, P. & SCHNEEBERGER, P. M. 2012. The
application of an enzyme-linked immunosorbent assay or an
immunofluorescent assay test leads to different estimates of seroprevalence of
Coxiella burnetii in the population. Epidemiol Infect, 140, 36-41.
BLACKSELL, S. D., SMYTHE, L., PHETSOUVANH, R., DOHNT, M.,
HARTSKEERL, R., SYMONDS, M., SLACK, A., VONGSOUVATH, M.,
DAVONG, V., LATTANA, O., PHONGMANY, S., KEOLOUANGKOT,
V., WHITE, N. J., DAY, N. P. & NEWTON, P. N. 2006. Limited diagnostic
capacities of two commercial assays for the detection of Leptospira
immunoglobulin M antibodies in Laos. Clin Vaccine Immunol, 13, 1166-9.
BROADWAY, M. J. 2002. The British Slaughtering Industry: A Dying Business?
Geography, 87, 268-280.
BROADWAY, M. J. & WARD, T. 1990. Recent changes in the structure and
location of the US meatpacking industry. Geography, 75, 76-79.
BROOKE, R. J., KRETZSCHMAR, M. E., MUTTERS, N. T. & TEUNIS, P. F.
2013. Human dose response relation for airborne exposure to Coxiella
burnetii. BMC Infect Dis, 13, 488.
BROWN, G. L., COLWELL, D. C. & HOOPER, W. L. 1968. An outbreak of Q
fever in Staffordshire. J Hyg (Lond), 66, 649-55.
BROWN, P. D., MCKENZIE, M., PINNOCK, M. & MCGROWDER, D. 2011.
Environmental risk factors associated with leptospirosis among butchers and
their associates in Jamaica. Int J Occup Environ Med, 2, 47-57.
BUDIHAL, S. V. & PERWEZ, K. 2014. Leptospirosis diagnosis: competancy of
various laboratory tests. J Clin Diagn Res, 8, 199-202.
BURRIDGE, J. D., MARSHALL, S. W. & LAING, R. M. 1997. Work-related hand
and lower-arm injuries in New Zealand, 1979 to 1988. Aust N Z J Public
Health, 21, 451-4.
CACCIAPUOTI, B., CICERONI, L., MAFFEI, C., DI STANISLAO, F., STRUSI,
P., CALEGARI, L., LUPIDI, R., SCALISE, G., CAGNONI, G. & RENGA,
G. 1987. A waterborne outbreak of leptospirosis. Am J Epidemiol, 126, 535-
45.
CAI, C., PERRY, M. J., SOROCK, G. S., HAUSER, R., SPANJER, K. J.,
MITTLEMAN, M. A. & STENTZ, T. L. 2005. Laceration injuries among
workers at meat packing plants. Am J Ind Med, 47, 403-10.
CAMPAGNOLO, E. R., WARWICK, M. C., MARX, H. L., JR., COWART, R. P.,
DONNELL, H. D., JR., BAJANI, M. D., BRAGG, S. L., ESTEBAN, J. E.,
ALT, D. P., TAPPERO, J. W., BOLIN, C. A. & ASHFORD, D. A. 2000.
References______________________________ 261
Analysis of the 1998 outbreak of leptospirosis in Missouri in humans exposed
to infected swine. J Am Vet Med Assoc, 216, 676-82.
CARPIO, A., ESCOBAR, A. & HAUSER, W. A. 1998. Cysticercosis and epilepsy: a
critical review. Epilepsia, 39, 1025-40.
CARRIERI, M. P., TISSOT-DUPONT, H., REY, D., BROUSSE, P., RENARD, H.,
OBADIA, Y. & RAOULT, D. 2002. Investigation of a slaughterhouse-related
outbreak of Q fever in the French Alps. Eur J Clin Microbiol Infect Dis, 21,
17-21.
CERNYSEVA, M. I., KNJAZEVA, E. N. & EGOROVA, L. S. 1977. Study of the
plate agglutination test with rose bengal antigen for the diagnosis of human
brucellosis. Bull World Health Organ, 55, 669-74.
CETINKAYA, B., KALENDER, H., ERTAS, H. B., MUZ, A., ARSLAN, N.,
ONGOR, H. & GURCAY, M. 2000. Seroprevalence of coxiellosis in cattle,
sheep and people in the east of Turkey. Vet Rec, 146, 131-6.
CHAN, O. Y., PAUL, D. R. & SNG, E. H. 1987. Leptospirosis among abattoir
workers--a serological survey. Singapore Med J, 28, 293-6.
CHEESBROUGH, M. 2006. District laboratory practice in tropical countries,
Volume 2. Cambridge: Cambridge University Press.
CHRISTOVA, I., TASSEVA, E. & MANEV, H. 2003. Human leptospirosis in
Bulgaria, 1989-2001: epidemiological, clinical, and serological features.
Scand J Infect Dis, 35, 869-72.
CLOTTEY, S. J. A. 1985. Manual for the slaughter of small ruminants in developing
countries. Rome. Food and Agriculture Organisation of the United Nations.
CODEX ALIMENTARIUS COMMISSION 2005. Code of Hygienic Practice for
Meat. Rome, Italy: Food and Agriculture Organistion of the United Nations.
CORBEL, M. J. 1997. Brucellosis: an overview. Emerg Infect Dis, 3, 213-21.
COUSINS, D. V., WILLIAMS, S. N. & DAWSON, D. J. 1999. Tuberculosis due to
Mycobacterium bovis in the Australian population: DNA typing of isolates,
1970-1994. Int J Tuberc Lung Dis, 3, 722-31.
CRADDOCK, A. L. & GEAR, J. 1955. Q fever in Nakuru, Kenya. Lancet, 269,
1167-9.
CRAIG, P. & ITO, A. 2007. Intestinal cestodes. Curr Opin Infect Dis, 20, 524-32.
CRUMP, J. A., MORRISSEY, A. B., NICHOLSON, W. L., MASSUNG, R. F.,
STODDARD, R. A., GALLOWAY, R. L., OOI, E. E., MARO, V. P.,
SAGANDA, W., KINABO, G. D., MUIRURI, C. & BARTLETT, J. A. 2013.
Etiology of severe non-malaria febrile illness in Northern Tanzania: a
prospective cohort study. PLoS Negl Trop Dis, 7, e2324.
CUMBERLAND, P., EVERARD, C. O., WHEELER, J. G. & LEVETT, P. N. 2001.
Persistence of anti-leptospiral IgM, IgG and agglutinating antibodies in
patients presenting with acute febrile illness in Barbados 1979-1989. Eur J
Epidemiol, 17, 601-8.
DAMES, S., TONNERRE, C., SAINT, S. & JONES, S. R. 2005. Clinical problem-
solving. Don't know much about history. N Engl J Med, 352, 2338-42.
DAVIES, F. G., LINTHICUM, K. J. & JAMES, A. D. 1985. Rainfall and epizootic
Rift Valley fever. Bull World Health Organ, 63, 941-3.
DAVIES, T. M., HAZELTON, M. L. & J.C., M. 2011. sparr: Analyzing Spatial
Relative Risk Using Fixed and Adaptive Kernel Density Estimation in R

References______________________________ 262
Journal of Statistical Software [Online], 39(1). Available:
http://www.jstatsoft.org/v39/i01/. [Accessed August 5th 2014].
DE GEUS, A., WOLFF, J. W. & TIMMER, V. E. 1977. Clinical leptospirosis in
Kenya (II): A field study in Nyanza Province. East Afr Med J, 54, 125-32.
DE GLANVILLE, W. A. 2014. Exploring household vulnerability to infectious
disease in a farming community in western Kenya. PhD, University of
Edinburgh.
DE LANGE, M. M., SCHIMMER, B., VELLEMA, P., HAUTVAST, J. L.,
SCHNEEBERGER, P. M. & VAN DUIJNHOVEN, Y. T. 2014. Coxiella
burnetii seroprevalence and risk factors in sheep farmers and farm residents
in The Netherlands. Epidemiol Infect, 142, 1231-44.
DE SOUZA, M. C., VASCONCELOS, A. G., REBELO, M. S., REBELO, P. A. &
CRUZ, O. G. 2014. Profile of patients with lung cancer assisted at the
National Cancer Institute, according to their smoking status, from 2000 to
2007. Rev Bras Epidemiol, 17, 175-88.
DEMERS, R. Y., FRANK, R., DEMERS, P. & CLAY, M. 1985. Leptospiral
exposure in Detroit rodent control workers. Am J Public Health, 75, 1090-1.
DEPUY, W., BENKA, V., MASSEY, A., DEEM, S. L., KINNAIRD, M., O'BRIEN,
T., WANYOIKE, S., NJOKA, J., BUTT, B., FOUFOPOULOS, J.,
EISENBERG, J. N. & HARDIN, R. 2014. Q Fever Risk Across a Dynamic,
Heterogeneous Landscape in Laikipia County, Kenya. Ecohealth.
DESAKORN, V., WUTHIEKANUN, V., THANACHARTWET, V.,
SAHASSANANDA, D., CHIERAKUL, W., APIWATTANAPORN, A.,
DAY, N. P., LIMMATHUROTSAKUL, D. & PEACOCK, S. J. 2012.
Accuracy of a commercial IgM ELISA for the diagnosis of human
leptospirosis in Thailand. Am J Trop Med Hyg, 86, 524-7.
DEVLEESSCHAUWER, B., TORGERSON, P., CHARLIER, J., LEVECKE, B.,
PRAET, N., DORNY, P., BERKVENS, D. & SPEYBROECK, N. 2013.
prevalence: Tools for prevalence assessment studies R package version 0.1.0
[Online]. Available: http://cran.r-project.org/package=prevalence [Accessed
August 3rd 2014].
DIAZ, R., CASANOVA, A., ARIZA, J. & MORIYON, I. 2011. The Rose Bengal
Test in human brucellosis: a neglected test for the diagnosis of a neglected
disease. PLoS Negl Trop Dis, 5, e950.
DOBLE, L. & FEVRE, E. M. 2010. Focusing on neglected zoonoses. Vet Rec, 166,
546-7.
DOHOO, I., MARTIN, W., STRYHN, H. 2003. Veterinary Epidemiologic Research,
Charlottestown, Canada, AVC Inc.
DORJEE, S., HEUER, C., JACKSON, R., WEST, D. M., COLLINS-EMERSON, J.
M., MIDWINTER, A. C. & RIDLER, A. L. 2011. Assessment of
occupational exposure to leptospirosis in a sheep-only abattoir. Epidemiol
Infect, 139, 797-806.
DREYFUS, A., BENSCHOP, J., COLLINS-EMERSON, J., WILSON, P., BAKER,
M. G. & HEUER, C. 2014. Sero-prevalence and risk factors for leptospirosis
in abattoir workers in New Zealand. Int J Environ Res Public Health, 11,
1756-75.

References______________________________ 263
DUPUIS, G., PETER, O., PEACOCK, M., BURGDORFER, W. & HALLER, E.
1985. Immunoglobulin responses in acute Q fever. J Clin Microbiol, 22, 484-
7.
DWOLATZKY, B., TRENGOVE, E., STRUTHERS, H., MCINTYRE, J. A. &
MARTINSON, N. A. 2006. Linking the global positioning system (GPS) to a
personal digital assistant (PDA) to support tuberculosis control in South
Africa: a pilot study. Int J Health Geogr, 5, 34.
EFFLER, P. V., BOGARD, A. K., DOMEN, H. Y., KATZ, A. R., HIGA, H. Y. &
SASAKI, D. M. 2002. Evaluation of eight rapid screening tests for acute
leptospirosis in Hawaii. J Clin Microbiol, 40, 1464-9.
EKLUND, C. M., PARKER, R. R. & LACKMAN, D. B. 1947. A case of Q fever
probably contracted by exposure to ticks in nature. Public Health Rep, 62,
1413-6.
EMANUEL, M. L., MACKERRAS, I. M. & SMITH, D. J. 1964. The Epidemiology
of Leptospirosis in North Queensland. I. General Surgery of Animal Hosts. J
Hyg (Lond), 62, 451-84.
ESHITERA, E. E., GITHIGIA, S. M., KITALA, P., THOMAS, L. F., FEVRE, E.
M., HARRISON, L. J., MWIHIA, E. W., OTIENO, R. O., OJIAMBO, F. &
MAINGI, N. 2012. Prevalence of porcine cysticercosis and associated risk
factors in Homa Bay District, Kenya. BMC Vet Res, 8, 234.
EVANS, M. A. B., G. . 2000. Leptospirosis outbreak in Eco Challenge 2000
participants. Eurosurveillance Weekly [Online], 4:000921. Available:
http://www.eurosurv.org/2000/000921.htm. [Accessed August 6th 2014].
FAINE, S., ADLER, B., BOLIN, C. ANDPEROLAT. P. 1999. Leptospira and
Leptospirosis, Melbourne, MediSci.
FAO. 2002. Improved animal health for poverty reduction and sustainable
livelihoods. . Available: http://www.fao.org/3/a-y3542e.pdf [Accessed
August 6th 2014].
FAO 2004. Good Practices for the Meat Industry. FAO Animal Production and
Health. Rome, Italy: Food and Agriculture Organisaiton of the United
Nations.
FAO 2005. Livestock Sector Brief - Kenya. Rome: Food and Agriculture
Organisation.
FAO 2010. Abattoir Development. Options and designs for hygienic basic and
medium sized abattoirs. Rome: Food and Agricilture Organisation of the
United Nations.
FARMER, E. A. M., J. 2012. End Market Analysis of Kenyan Livestock and Meat:
A Desk Study. USAID microREPORT #184 [Online]. Available:
https://www.microlinks.org/sites/microlinks/files/resource/files/Kenya_Livest
ock_End_Market_Study.pdf [Accessed August 6th 2014].
FARR, R. W. 1995. Leptospirosis. Clin Infect Dis, 21, 1-6; quiz 7-8.
FINDLAY, G. M. & HOWARD, E. M. 1951. Notes on Rift Valley fever. Arch
Gesamte Virusforsch, 4, 411-23.
FISHER, J. C., BANG, H. & KAPIGA, S. H. 2007. The association between HIV
infection and alcohol use: a systematic review and meta-analysis of African
studies. Sex Transm Dis, 34, 856-63.
FITZGERALD, A. J. 2010. A Social History of the Slaughterhouse: From Inception
to Contemporary Implications. Research in Human Ecology, 17, 58-69.

References______________________________ 264
FLEURY, A., HERNANDEZ, M., AVILA, M., CARDENAS, G., BOBES, R. J.,
HUERTA, M., FRAGOSO, G., URIBE-CAMPERO, L., HARRISON, L. J.,
PARKHOUSE, R. M. & SCIUTTO, E. 2007. Detection of HP10 antigen in
serum for diagnosis and follow-up of subarachnoidal and intraventricular
human neurocysticercosis. J Neurol Neurosurg Psychiatry, 78, 970-4.
GARCIA, H. H. & DEL BRUTTO, O. H. 2005. Neurocysticercosis: updated
concepts about an old disease. Lancet Neurol, 4, 653-61.
GEMMELL, M. A., MATYAS, Z., PAWLOWSKI, Z. AND SOULSBY, E.J.L. (ed.)
1983. Guidelines for surveillance, prevention and control of
taeniasis/cysticercosis, Geneva: World Health Organisation.
GHIMIRE, L., DHAKAL, S., PANDEYA, Y.R., CHAULAGAIN, S., MAHATO,
B.R., SATYAL, R.C., SINGH, D.K. 2013. Assessment of pork handlers’
knowledge and hygienic status of pig meat shops of Chitwan district focusing
campylobacteriosis risk factors. International Journal of Infection and
Microbiology, 2, 17-21.
GILBERT, M. J., BOS, M. E., DUIM, B., URLINGS, B. A., HERES, L.,
WAGENAAR, J. A. & HEEDERIK, D. J. 2012. Livestock-associated MRSA
ST398 carriage in pig slaughterhouse workers related to quantitative
environmental exposure. Occup Environ Med, 69, 472-8.
GLOBAL ANTIBIOTIC RESISTANCE PARTNERSHIP, K. W. G. 2011. Situation
Analysis and Recommendations: Antibiotic Use and Resistance in Kenya.
Washington, DC and New Delhi Center for Disease Dynamics, Economics &
Policy.
GOMES-NEVES, E., ANTUNES, P., TAVARES, A., THEMUDO, P., CARDOSO,
M. F., GARTNER, F., COSTA, J. M. & PEIXE, L. 2012. Salmonella cross-
contamination in swine abattoirs in Portugal: Carcasses, meat and meat
handlers. Int J Food Microbiol, 157, 82-7.
GOVERNMENT OF KENYA 2012. Meat Control Act. Revised Edition ed.:
National Council for Law Reporting.
GREENACRE, M. J. & BLASIUS, J. (eds.) 2006. Multiple correspondence analysis
and related methods, Boca Raton: Chapman & Hall-CRC.
HADDA, V., KHILNANI, G. & KEDIA, S. 2009. Brucellosis presenting as pyrexia
of unknown origin in an international traveller: a case report. Cases J, 2,
7969.
HALL, A., LATHAM, M. C., CROMPTON, D. W. & STEPHENSON, L. S. 1981.
Taenia saginata (Cestoda) in western Kenya: the reliability of faecal
examinations in diagnosis. Parasitology, 83, 91-101.
HALLIDAY, J. E., KNOBEL, D. L., ALLAN, K. J., DE, C. B. B. M., HANDEL, I.,
AGWANDA, B., CUTLER, S. J., OLACK, B., AHMED, A.,
HARTSKEERL, R. A., NJENGA, M. K., CLEAVELAND, S. & BREIMAN,
R. F. 2013. Urban leptospirosis in Africa: a cross-sectional survey of
Leptospira infection in rodents in the Kibera urban settlement, Nairobi,
Kenya. Am J Trop Med Hyg, 89, 1095-102.
HANDZEL, T., KARANJA, D. M., ADDISS, D. G., HIGHTOWER, A. W.,
ROSEN, D. H., COLLEY, D. G., ANDOVE, J., SLUTSKER, L. & SECOR,
W. E. 2003. Geographic distribution of schistosomiasis and soil-transmitted
helminths in Western Kenya: implications for anthelminthic mass treatment.
Am J Trop Med Hyg, 69, 318-23.

References______________________________ 265
HANNERZ, H. & TUCHSEN, F. 2001. Hospital admissions among male drivers in
Denmark. Occup Environ Med, 58, 253-60.
HARRISON, L. J., JOSHUA, G. W., WRIGHT, S. H. & PARKHOUSE, R. M. 1989.
Specific detection of circulating surface/secreted glycoproteins of viable
cysticerci in Taenia saginata cysticercosis. Parasite Immunol, 11, 351-70.
HART, R. J., GALLAGHER, J. & WAITKINS, S. 1984. An outbreak of
leptospirosis in cattle and man. Br Med J (Clin Res Ed), 288, 1983-4.
HELLENBRAND, W., BREUER, T. & PETERSEN, L. 2001. Changing
epidemiology of Q fever in Germany, 1947-1999. Emerg Infect Dis, 7, 789-
96.
HERENDA, D., CHAMBERS, P.G., ETTRIQUI, A., SENEVIRATNA, P., DA
SILVA, T.J.P. 1994. Manual on meat inspection for developing countries.
Rome: Food and Agriculture Organisation of the United Nations.
HERMANS, T., JEURISSEN, L., HACKERT, V. & HOEBE, C. 2014. Land-applied
goat manure as a source of human Q-fever in the Netherlands, 2006-2010.
PLoS One, 9, e96607.
HOFFMAN, D. L. A. D. L., J. 1992. Interpreting Multiple Correspondence Analysis
as a Multidimensional Scaling Method. Marketing Letters, 3, 259-272.
HUSSON, F., JOSSE, J., LE, S. AND MAZET, J. . 2014. FactoMineR: Multivariate
Exploratory Data Analysis and Data Mining with R. . R package version
1.26. Available: http://CRAN.R-project.org/package=FactoMineR [Accessed
August 3rd 2014].
HUSSON, F., JOSSE,J. AND PAGES, J. 2010. Principal component methods -
hierarchical clustering - partitional clustering: why would we need to choose
for visualizing data? Technical report - Agrocampus.
IRMAK, H., BUZGAN, T., EVIRGEN, O., AKDENIZ, H., DEMIROZ, A. P.,
ABDOEL, T. H. & SMITS, H. L. 2004. Use of the Brucella IgM and IgG
flow assays in the serodiagnosis of human brucellosis in an area endemic for
brucellosis. Am J Trop Med Hyg, 70, 688-94.
JACKSON, L. A., KAUFMANN, A. F., ADAMS, W. G., PHELPS, M. B.,
ANDREASEN, C., LANGKOP, C. W., FRANCIS, B. J. & WENGER, J. D.
1993. Outbreak of leptospirosis associated with swimming. Pediatr Infect Dis
J, 12, 48-54.
KADOHIRA, M., MCDERMOTT, J. J., SHOUKRI, M. M. & KYULE, M. N. 1997.
Variations in the prevalence of antibody to brucella infection in cattle by
farm, area and district in Kenya. Epidemiol Infect, 118, 35-41.
KAGIRA, J. M., MAINA, N., NJENGA, J., KARANJA, S. M., KARORI, S. M. &
NGOTHO, J. M. 2011. Prevalence and types of coinfections in sleeping
sickness patients in kenya (2000/2009). J Trop Med, 2011, 248914.
KAHLON, S. S., PETERS, C. J., LEDUC, J., MUCHIRI, E. M., MUIRURI, S.,
NJENGA, M. K., BREIMAN, R. F., WHITE, A. C., JR. & KING, C. H.
2010. Severe Rift Valley fever may present with a characteristic clinical
syndrome. Am J Trop Med Hyg, 82, 371-5.
KAPLAN, M. M. & BERTAGNA, P. 1955. The geographical distribution of Q
fever. Bull World Health Organ, 13, 829-60.
KARIUKI, S., ONSARE, R., MWITURIA, J., NG'ETICH, R., NAFULA, C.,
KARIMI, K., KARIMI, P., NJERUH, F., IRUNGU, P. AND MITEMA, E.
2013. Improving food safety in meat value chains in Kenya. Food Protection
References______________________________ 266
Trends [Online]. Available:
http://www.fao.org/fileadmin/user_upload/agns/news_events/AMR_in_Keny
a.pdf [Accessed August 6th 2014].
KHAIRANI-BEJO, S., BAHAMAN, A.R., ZAMRI-SAAD, M. AND MUTALIB,
A.R. 2004. The Survival of Leptospira interrogans Serovar Hardjo in the
Malaysian environment. Journal of Animala and Veterinary Advances, 3,
123-129.
KING, C. H., KAHLON, S. S., MUIRURI, S. & LABEAUD, A. D. 2010. Facets of
the Rift Valley fever outbreak in Northeastern Province, Kenya, 2006-2007.
Am J Trop Med Hyg, 82, 363.
KIPYEGEN, C. K., SHIVAIRO, R. S. & ODHIAMBO, R. O. 2012. Prevalence of
intestinal parasites among HIV patients in Baringo, Kenya. Pan Afr Med J,
13, 37.
KNBS, I. M. A. K. N. B. O. S. 2010. Kenya Demographic and Health Survey 2008-
09. Available: http://dhsprogram.com/pubs/pdf/FR229/FR229.pdf [Accessed
August 6th 2014].
KNOBEL, D. L., MAINA, A. N., CUTLER, S. J., OGOLA, E., FEIKIN, D. R.,
JUNGHAE, M., HALLIDAY, J. E., RICHARDS, A. L., BREIMAN, R. F.,
CLEAVELAND, S. & NJENGA, M. K. 2013. Coxiella burnetii in humans,
domestic ruminants, and ticks in rural western Kenya. Am J Trop Med Hyg,
88, 513-8.
KUPPALLI, K., CHANDRASEKARAN, E., DEL RIO, C., MAYER, K. AND
KUMARASAMY, N. 2011. Prevalence and Outcomes of Leptospirosis
Infection in HIV Infected Patients in South India. Infectious Diseases Society
of America (IDSA). Boston, MA, USA.
KWAN, I., MAPSTONE, J. & ROBERTS, I. 2002. Interventions for increasing
pedestrian and cyclist visibility for the prevention of death and injuries.
Cochrane Database Syst Rev, CD003438.
LABEAUD, A. D., OCHIAI, Y., PETERS, C. J., MUCHIRI, E. M. & KING, C. H.
2007. Spectrum of Rift Valley fever virus transmission in Kenya: insights
from three distinct regions. Am J Trop Med Hyg, 76, 795-800.
LEVETT, P. N. 2001. Leptospirosis. Clin Microbiol Rev, 14, 296-326.
LI, C. Y. & SUNG, F. C. 1999. A review of the healthy worker effect in occupational
epidemiology. Occup Med (Lond), 49, 225-9.
LIJMER, J. G., MOL, B. W., HEISTERKAMP, S., BONSEL, G. J., PRINS, M. H.,
VAN DER MEULEN, J. H. & BOSSUYT, P. M. 1999. Empirical evidence
of design-related bias in studies of diagnostic tests. JAMA, 282, 1061-6.
LONG, D. 1990. The role of state sponsored and cooperatively organized support
services in meat production, processing, and marketing in developing
countries. In: MACK, S. (ed.) Strategies for sustainable animal agriculture
in developing countries Proceedings of the FAO Expert Consultation. Rome,
Italy: Food and Agiculture Organisation of United Nations.
LUMLEY, T. 2004. Analysis of complex survey samples. Journal of Statistical
Software [Online], 9. Available: www.jstatsoft.org/v09/i08/ [Accessed
August 6th 2014].
LUMLEY, T. 2012. survey: analysis of complex survey samples. R package version
3.28-2.

References______________________________ 267
MADANI, T. A., AL-MAZROU, Y. Y., AL-JEFFRI, M. H., MISHKHAS, A. A.,
AL-RABEAH, A. M., TURKISTANI, A. M., AL-SAYED, M. O.,
ABODAHISH, A. A., KHAN, A. S., KSIAZEK, T. G. & SHOBOKSHI, O.
2003. Rift Valley fever epidemic in Saudi Arabia: epidemiological, clinical,
and laboratory characteristics. Clin Infect Dis, 37, 1084-92.
MAECHLER, M., ROUSSEEUW, P., STRUYF, A., HUBERT, M., HORNIK, K.
2013. cluster: Cluster Analysis Basics and Extensions. . R package version
1.14.4.
MAFOJANE, N. A., APPLETON, C. C., KRECEK, R. C., MICHAEL, L. M. &
WILLINGHAM, A. L., 3RD 2003. The current status of neurocysticercosis in
Eastern and Southern Africa. Acta Trop, 87, 25-33.
MANN, I. 1984. Guidelines on small slaughterhouses and meat hygiene in
developing countries. In: KOULIKOVSKII, A., AND MATYAS, Z. (ed.).
Geneva: World Health Organisation.
MANTUR, B. G., BIRADAR, M. S., BIDRI, R. C., MULIMANI, M. S.,
VEERAPPA, KARIHOLU, P., PATIL, S. B. & MANGALGI, S. S. 2006.
Protean clinical manifestations and diagnostic challenges of human
brucellosis in adults: 16 years' experience in an endemic area. J Med
Microbiol, 55, 897-903.
MARMION, B. P. 1959. Q fever: recent developments and some unsolved problems.
Proc R Soc Med, 52, 613-6.
MASLEN, M. M. 2000. Human cases of cattle ringworm due to Trichophyton
verrucosum in Victoria, Australia. Australas J Dermatol, 41, 90-4.
MATOPE, G., BHEBHE, E., MUMA, J. B., LUND, A. & SKJERVE, E. 2010. Herd-
level factors for Brucella seropositivity in cattle reared in smallholder dairy
farms of Zimbabwe. Prev Vet Med, 94, 213-21.
MAUDLIN, I., EISLER, M. C. & WELBURN, S. C. 2009. Neglected and endemic
zoonoses. Philos Trans R Soc Lond B Biol Sci, 364, 2777-87.
MAURIN, M. & RAOULT, D. 1999. Q fever. Clin Microbiol Rev, 12, 518-53.
MCDERMOTT, J. J. & ARIMI, S. M. 2002. Brucellosis in sub-Saharan Africa:
epidemiology, control and impact. Vet Microbiol, 90, 111-34.
MCEWEN, S. A. 1987. Zoonoses in the slaughterhouse. Can Vet J, 28, 269-70.
MCQUISTON, J. H., CHILDS, J. E. & THOMPSON, H. A. 2002. Q fever. J Am Vet
Med Assoc, 221, 796-9.
MERLO, J., CHAIX, B., YANG, M., LYNCH, J. & RASTAM, L. 2005. A brief
conceptual tutorial of multilevel analysis in social epidemiology: linking the
statistical concept of clustering to the idea of contextual phenomenon. J
Epidemiol Community Health, 59, 443-9.
MOHAMED, M., MOSHA, F., MGHAMBA, J., ZAKI, S. R., SHIEH, W. J.,
PAWESKA, J., OMULO, S., GIKUNDI, S., MMBUJI, P., BLOLAND, P.,
ZEIDNER, N., KALINGA, R., BREIMAN, R. F. & NJENGA, M. K. 2010.
Epidemiologic and clinical aspects of a Rift Valley fever outbreak in humans
in Tanzania, 2007. Am J Trop Med Hyg, 83, 22-7.
MONAHAN, A. M., CALLANAN, J. J. & NALLY, J. E. 2009. Review paper: Host-
pathogen interactions in the kidney during chronic leptospirosis. Vet Pathol,
46, 792-9.
MUENDO, E. N., MBATHA, P. M., MACHARIA, J., ABDOEL, T. H., JANSZEN,
P. V., PASTOOR, R. & SMITS, H. L. 2012. Infection of cattle in Kenya with

References______________________________ 268
Brucella abortus biovar 3 and Brucella melitensis biovar 1 genotypes. Trop
Anim Health Prod, 44, 17-20.
MUKHTAR, F. 2010. Brucellosis in a high risk occupational group: seroprevalence
and analysis of risk factors. J Pak Med Assoc, 60, 1031-4.
MUMA, J., MWACALIMBA, K., MUNANG'ANDU, H., MATOPE, G., BANCHE,
G., JENKINS, A., SIAMUDAALA, V., MWEENE, A. & MARCOTTY, T.
2014. The contribution of veterinary medicine to public health and poverty
reduction in developing countries. Vet Ital, 50, 117-29.
MUMA, J. B., PANDEY, G. S., MUNYEME, M., MUMBA, C., MKANDAWIRE,
E. & CHIMANA, H. M. 2012. Brucellosis among smallholder cattle farmers
in Zambia: public health significance. Trop Anim Health Prod, 44, 915-20.
MURITHI, R. M., MUNYUA, P., ITHONDEKA, P. M., MACHARIA, J. M.,
HIGHTOWER, A., LUMAN, E. T., BREIMAN, R. F. & NJENGA, M. K.
2011. Rift Valley fever in Kenya: history of epizootics and identification of
vulnerable districts. Epidemiol Infect, 139, 372-80.
MUTHEE, A. M. 2006. Kenya Livestock Sector Study: an Analysis of Pastoralist
Livestock Products Market Value Chains and Potential External Markets for
Live Animals and Meat. Available:
http://www.bdsknowledge.org/dyn/bds/docs/552/kenyalivestockvaluechainre
port.pdf [Accessed August 6th 2014].
MWANJALI, G., KIHAMIA, C., KAKOKO, D. V., LEKULE, F., NGOWI, H.,
JOHANSEN, M. V., THAMSBORG, S. M. & WILLINGHAM, A. L., 3RD
2013. Prevalence and risk factors associated with human Taenia solium
infections in Mbozi District, Mbeya Region, Tanzania. PLoS Negl Trop Dis,
7, e2102.
NABUKENYA, I., KADDU-MULINDWA, D. & NASINYAMA, G. W. 2013.
Survey of Brucella infection and malaria among Abattoir workers in Kampala
and Mbarara Districts, Uganda. BMC Public Health, 13, 901.
NELSON, S. & KOLLS, J. K. 2002. Alcohol, host defence and society. Nat Rev
Immunol, 2, 205-9.
NGOWI, H. A., KASSUKU, A. A., CARABIN, H., MLANGWA, J. E., MLOZI, M.
R., MBILINYI, B. P. & WILLINGHAM, A. L., 3RD 2010. Spatial clustering
of porcine cysticercosis in Mbulu district, northern Tanzania. PLoS Negl Trop
Dis, 4, e652.
NGUKU, P. M., SHARIF, S. K., MUTONGA, D., AMWAYI, S., OMOLO, J.,
MOHAMMED, O., FARNON, E. C., GOULD, L. H., LEDERMAN, E.,
RAO, C., SANG, R., SCHNABEL, D., FEIKIN, D. R., HIGHTOWER, A.,
NJENGA, M. K. & BREIMAN, R. F. 2010. An investigation of a major
outbreak of Rift Valley fever in Kenya: 2006-2007. Am J Trop Med Hyg, 83,
5-13.
NIKOKAR, I., HOSSEINPOUR, M., ASMAR, M., PIRMOHBATEI, S.,
HAKEIMEI, F. & RAZAVEI, M. T. 2011. Seroprevalence of Brucellosis
among high risk individuals in Guilan, Iran. J Res Med Sci, 16, 1366-71.
NOOR, A. M., GETHING, P. W., ALEGANA, V. A., PATIL, A. P., HAY, S. I.,
MUCHIRI, E., JUMA, E. & SNOW, R. W. 2009. The risks of malaria
infection in Kenya in 2009. BMC Infect Dis, 9, 180.
NOUGAIREDE, A., FOSSATI, C., SALEZ, N., COHEN-BACRIE, S., NINOVE,
L., MICHEL, F., ABOUKAIS, S., BUTTNER, M., ZANDOTTI, C., DE
References______________________________ 269
LAMBALLERIE, X. & CHARREL, R. N. 2013. Sheep-to-human
transmission of Orf virus during Eid al-Adha religious practices, France.
Emerg Infect Dis, 19, 102-5.
O'CONNOR, B. A., TRIBE, I. G. & GIVNEY, R. 2014. A windy day in a sheep
saleyard: an outbreak of Q fever in rural South Australia. Epidemiol Infect, 1-
8.
ODHIAMBO, F. O., LASERSON, K. F., SEWE, M., HAMEL, M. J., FEIKIN, D.
R., ADAZU, K., OGWANG, S., OBOR, D., AMEK, N., BAYOH, N.,
OMBOK, M., LINDBLADE, K., DESAI, M., TER KUILE, F., PHILLIPS-
HOWARD, P., VAN EIJK, A. M., ROSEN, D., HIGHTOWER, A.,
OFWARE, P., MUTTAI, H., NAHLEN, B., DECOCK, K., SLUTSKER, L.,
BREIMAN, R. F. & VULULE, J. M. 2012. Profile: the KEMRI/CDC Health
and Demographic Surveillance System--Western Kenya. Int J Epidemiol, 41,
977-87.
OIE 2014. Rift Valley Fever. In: OIE, W. A. O. D. O. T. (ed.) OIE Terrestrial
Manual. OIE.
OJO, S. A. 1996. A survey of pathological conditions in slaughtered goats at Zaria
slaughter houses. In: LEBBIE, S. H. B. A. K., E. (ed.) Small Ruminant
Research and Development in Africa: Proceedings of the Third Biannual
Conference of the African Small Ruminant Research Network. Nairobi:
International Livestock Research Institute.
OMER, M. M., MUSA, M. T., BAKHIET, M. R. & PERRETT, L. 2010. Brucellosis
in camels, cattle and humans: associations and evaluation of serological tests
used for diagnosis of the disease in certain nomadic localities in Sudan. Rev
Sci Tech, 29, 663-9.
ONYANGO-ABUJE, J. A., NGINYI, J. M., RUGUTT, M. K., WRIGHT, S. H.,
LUMUMBA, P., HUGHES, G. & HARRISON, L. J. 1996.
Seroepidemiological survey of Taenia saginata cysticercosis in Kenya. Vet
Parasitol, 64, 177-85.
PALMER, M. V. & WATERS, W. R. 2011. Bovine tuberculosis and the
establishment of an eradication program in the United States: role of
veterinarians. Vet Med Int, 2011, 816345.
PAN AMERICAN HEALTH ORGANIZATION 2003 Cysticercosis. Zoonoses and
communicable diseases common to man and animals, vol. III, 3rd ed.
Washington, DC, : Pan American Health Organization, (Scientific and
Technical Publication No. 580).
PANBIO. 2008. Leptospira IgM ELISA [Online]. Sinnamon Park, Qld, Australia:
Panbio. Available: http://alere.co.jp/products02/panbio/leptospira_igm.pdf
[Accessed 28th May 2014].
PAPPAS, G., AKRITIDIS, N., BOSILKOVSKI, M. & TSIANOS, E. 2005.
Brucellosis. N Engl J Med, 352, 2325-36.
PAPPAS, G., PAPADIMITRIOU, P., AKRITIDIS, N., CHRISTOU, L. &
TSIANOS, E. V. 2006. The new global map of human brucellosis. Lancet
Infect Dis, 6, 91-9.
PARADIS E., C. J. S. K. 2004. APE: analyses of phylogenetics and evolution in R
language. Bioinformatics [Online], 20.
PAWESKA, J. T., MORTIMER, E., LEMAN, P. A. & SWANEPOEL, R. 2005. An
inhibition enzyme-linked immunosorbent assay for the detection of antibody

References______________________________ 270
to Rift Valley fever virus in humans, domestic and wild ruminants. J Virol
Methods, 127, 10-8.
PECK, R. N. & FITZGERALD, D. W. 2007. Cutaneous anthrax in the Artibonite
Valley of Haiti: 1992-2002. Am J Trop Med Hyg, 77, 806-11.
PEDERSEN, B. H., HANNERZ, H., TUCHSEN, F., MIKKELSEN, K. L. &
DYREBORG, J. 2010. Industry and injury related hospital contacts: a follow-
up study of injuries among working men in Denmark. J Occup Health, 52,
147-54.
PEREZ-TRALLERO, E., CILLA, G., MONTES, M., SAENZ-DOMINGUEZ, J. R.
& ALCORTA, M. 1995. Prevalence of Coxiella burnetii infection among
slaughterhouse workers in northern Spain. Eur J Clin Microbiol Infect Dis,
14, 71-3.
PETER, O., DUPUIS, G., BEE, D., LUTHY, R., NICOLET, J. & BURGDORFER,
W. 1988. Enzyme-linked immunosorbent assay for diagnosis of chronic Q
fever. J Clin Microbiol, 26, 1978-82.
PETER, O., DUPUIS, G., PEACOCK, M. G. & BURGDORFER, W. 1987.
Comparison of enzyme-linked immunosorbent assay and complement
fixation and indirect fluorescent-antibody tests for detection of Coxiella
burnetii antibody. J Clin Microbiol, 25, 1063-7.
PHIRI, I. K., NGOWI, H., AFONSO, S., MATENGA, E., BOA, M.,
MUKARATIRWA, S., GITHIGIA, S., SAIMO, M., SIKASUNGE, C.,
MAINGI, N., LUBEGA, G. W., KASSUKU, A., MICHAEL, L., SIZIYA, S.,
KRECEK, R. C., NOORMAHOMED, E., VILHENA, M., DORNY, P. &
WILLINGHAM, A. L., 3RD 2003. The emergence of Taenia solium
cysticercosis in Eastern and Southern Africa as a serious agricultural problem
and public health risk. Acta Trop, 87, 13-23.
POTASMAN, I., RZOTKIEWICZ, S., PICK, N. & KEYSARY, A. 2000. Outbreak
of Q fever following a safari trip. Clin Infect Dis, 30, 214-5.
PRABHU, M., NICHOLSON, W. L., ROCHE, A. J., KERSH, G. J.,
FITZPATRICK, K. A., OLIVER, L. D., MASSUNG, R. F., MORRISSEY,
A. B., BARTLETT, J. A., ONYANGO, J. J., MARO, V. P., KINABO, G. D.,
SAGANDA, W. & CRUMP, J. A. 2011. Q fever, spotted fever group, and
typhus group rickettsioses among hospitalized febrile patients in northern
Tanzania. Clin Infect Dis, 53, e8-15.
PRAET, N., VERWEIJ, J. J., MWAPE, K. E., PHIRI, I. K., MUMA, J. B., ZULU,
G., VAN LIESHOUT, L., RODRIGUEZ-HIDALGO, R., BENITEZ-ORTIZ,
W., DORNY, P. & GABRIEL, S. 2013. Bayesian modelling to estimate the
test characteristics of coprology, coproantigen ELISA and a novel real-time
PCR for the diagnosis of taeniasis. Trop Med Int Health, 18, 608-14.
R CORE TEAM. 2013. R: A language and environment for statistical computing.
Available: http://www.R-project.org/. [Accessed February 1st 2014].
RABINOWITZ, P., SCOTCH, M. & CONTI, L. 2009. Human and animal sentinels
for shared health risks. Vet Ital, 45, 23-4.
RAOULT, D., LEVY, P. Y., DUPONT, H. T., CHICHEPORTICHE, C.,
TAMALET, C., GASTAUT, J. A. & SALDUCCI, J. 1993. Q fever and HIV
infection. AIDS, 7, 81-6.
RAOULT, D. & MARRIE, T. 1995. Q fever. Clin Infect Dis, 20, 489-95; quiz 496.
References______________________________ 271
RAY, T. K., HUTIN, Y. J. & MURHEKAR, M. V. 2009. Cutaneous anthrax, West
Bengal, India, 2007. Emerg Infect Dis, 15, 497-9.
REVELLE, W. 2014. psych: Procedures for Personality and Psychological Research.
R package version 1.4.4 [Online]. Available: http://CRAN.R-
project.org/package=psych [Accessed July 3rd 2014].
RIEMANN, H. P., BRANT, P. C., BEHYMER, D. E. & FRANTI, C. E. 1975.
Toxoplasma gondii and Coxiella burneti antibodies among Brazilian
slaughterhouse employees. Am J Epidemiol, 102, 386-93.
ROEST, H. I., TILBURG, J. J., VAN DER HOEK, W., VELLEMA, P., VAN
ZIJDERVELD, F. G., KLAASSEN, C. H. & RAOULT, D. 2011. The Q
fever epidemic in The Netherlands: history, onset, response and reflection.
Epidemiol Infect, 139, 1-12.
SALES-ORTELLS, H. & MEDEMA, G. 2012. Screening-level risk assessment of
Coxiella burnetii (Q fever) transmission via aeration of drinking water.
Environ Sci Technol, 46, 4125-33.
SALL, A. A., MACONDO, E. A., SENE, O. K., DIAGNE, M., SYLLA, R.,
MONDO, M., GIRAULT, L., MARRAMA, L., SPIEGEL, A., DIALLO, M.,
BOULOY, M. & MATHIOT, C. 2002. Use of reverse transcriptase PCR in
early diagnosis of Rift Valley fever. Clin Diagn Lab Immunol, 9, 713-5.
SCHOONMAN, L. & SWAI, E. S. 2009. Risk factors associated with the
seroprevalence of leptospirosis, amongst at-risk groups in and around Tanga
city, Tanzania. Ann Trop Med Parasitol, 103, 711-8.
SCOLAMACCHIA, F., HANDEL, I. G., FEVRE, E. M., MORGAN, K. L.,
TANYA, V. N. & BRONSVOORT, B. M. 2010. Serological patterns of
brucellosis, leptospirosis and Q fever in Bos indicus cattle in Cameroon.
PLoS One, 5, e8623.
SERION. 2012. Serion Elisa Classic Coxiella burnetti [Online]. Wurzburg,
Germany. Available: http://www.virion-
serion.de/download/gebrauchsanweisung/coxiella_burnetii/IFU-Coxiella-DE-
EN-FR-IT-RU.pdf [Accessed 1st June 2014].
SHAH, D. 2009. Healthy worker effect phenomenon. Indian J Occup Environ Med,
13, 77-9.
SHARMA, S., VIJAYACHARI, P., SUGUNAN, A. P.,
NATARAJASEENIVASAN, K. & SEHGAL, S. C. 2006. Seroprevalence of
leptospirosis among high-risk population of Andaman Islands, India. Am J
Trop Med Hyg, 74, 278-83.
SHIEH, W. J., PADDOCK, C. D., LEDERMAN, E., RAO, C. Y., GOULD, L. H.,
MOHAMED, M., MOSHA, F., MGHAMBA, J., BLOLAND, P., NJENGA,
M. K., MUTONGA, D., SAMUEL, A. A., GUARNER, J., BREIMAN, R. F.
& ZAKI, S. R. 2010. Pathologic studies on suspect animal and human cases
of Rift Valley fever from an outbreak in Eastern Africa, 2006-2007. Am J
Trop Med Hyg, 83, 38-42.
SIGNORINI, M. L., LOTTERSBERGER, J., TARABLA, H. D. & VANASCO, N.
B. 2013. Enzyme-linked immunosorbent assay to diagnose human
leptospirosis: a meta-analysis of the published literature. Epidemiol Infect,
141, 22-32.
SIKASUNGE, C. S., PHIRI, I. K., PHIRI, A. M., DORNY, P., SIZIYA, S. &
WILLINGHAM, A. L., 3RD 2007. Risk factors associated with porcine

References______________________________ 272
cysticercosis in selected districts of Eastern and Southern provinces of
Zambia. Vet Parasitol, 143, 59-66.
SMALLEGANGE, R. C., VAN GEMERT, G. J., VAN DE VEGTE-BOLMER, M.,
GEZAN, S., TAKKEN, W., SAUERWEIN, R. W. & LOGAN, J. G. 2013.
Malaria infected mosquitoes express enhanced attraction to human odor.
PLoS One, 8, e63602.
SOARES, T. S., LATORRE MDO, R., LAPORTA, G. Z. & BUZZAR, M. R. 2010.
Spatial and seasonal analysis on leptospirosis in the municipality of Sao
Paulo, Southeastern Brazil, 1998 to 2006. Rev Saude Publica, 44, 283-91.
STALLONES, L. & XIANG, H. 2003. Alcohol consumption patterns and work-
related injuries among Colorado farm residents. Am J Prev Med, 25, 25-30.
STEVENSON, A. (ed.) 2013. Oxford English Dictionary, Oxford: Oxford University
Press.
STEVENSON, M. 2014a. epiR: An R package for the analysis of epidemiological
data. In: NUNES, T., HEUER, C., MARSHALL, J. SANCHEZ, J.,
THORNTON, R., REICZIGEL, J., ROBISON-COX, J., SEBASTIANI, P.,
SOLYMOS, P. AND YOSHIDA, K. (ed.) R package version 0.9-57.
STEVENSON, M. W. C. F. N., T., HEUER, C., MARSHALL, J., SANCHEZ, J.,
THORNTON, R., REICZIGEL, J., ROBISON-COX, J., SEBASTIANI, P.,
SOLYMOS, P. AND YOSHIDA, K. 2014b. epiR: An R package for the
analysis of epidemiological data. . R package version 0.9-57.
STOKER, M. G. & MARMION, B. P. 1955. The spread of Q fever from animals to
man; the natural history of a rickettsial disease. Bull World Health Organ, 13,
781-806.
SWAI, E. S. & SCHOONMAN, L. 2009. Human brucellosis: seroprevalence and
risk factors related to high risk occupational groups in Tanga Municipality,
Tanzania. Zoonoses Public Health, 56, 183-7.
TAYLOR, L. H., LATHAM, S. M. & WOOLHOUSE, M. E. 2001. Risk factors for
human disease emergence. Philos Trans R Soc Lond B Biol Sci, 356, 983-9.
TERRY, J., TRENT, M. & BARTLETT, M. 2000. A cluster of leptospirosis among
abattoir workers. Commun Dis Intell, 24, 158-60.
THOMAS, L. F. 2013. Epidemiology of Taenia solium Cysticercosis in western
Kenya. PhD, University of Edinburgh.
THORNTON, P. K., KRUSKA, R.L., HENNINGER, N., KRISTJANSON, P.M.,
REID, R.S., ATIENO, F., ODERO, A.N. AND NDEGWA, T. 2002.
Mapping poverty and livestock in the developing world. Available:
https://ilri.org/InfoServ/Webpub/fulldocs/mappingPLDW/index.htm
[Accessed August 7th 2014].
URQUHART, G. M. 1961. Epizootiological and experimental studies on bovine
cysticercosis in East Africa. J Parasitol, 47, 857-69.
VAN PEENEN, P. F., GUNDELFINGER, B. F., KOESHARJONO, C. & SEE, R.
1978. Seroepidemiological evidence for occupational exposure to Q fever in
Indonesia. J Occup Med, 20, 488-9.
VAN WOERDEN, H. C., MASON, B. W., NEHAUL, L. K., SMITH, R., SALMON,
R. L., HEALY, B., VALAPPIL, M., WESTMORELAND, D., DE MARTIN,
S., EVANS, M. R., LLOYD, G., HAMILTON-KIRKWOOD, M. &
WILLIAMS, N. S. 2004. Q fever outbreak in industrial setting. Emerg Infect
Dis, 10, 1282-9.
References______________________________ 273
VIJAYAKUMAR, T. S., DAVID, S., SELVARAJ, K., VISWANATHAN, T.,
KANNANGAI, R. & SRIDHARAN, G. 2005. Performance of a rapid
immunochromatographic screening test for detection of antibodies to human
immunodeficiency virus type 1 (HIV-1) and HIV-2: experience at a tertiary
care hospital in South India. J Clin Microbiol, 43, 4194-6.
WAAG, D., CHULAY, J., MARRIE, T., ENGLAND, M. & WILLIAMS, J. 1995.
Validation of an enzyme immunoassay for serodiagnosis of acute Q fever.
Eur J Clin Microbiol Infect Dis, 14, 421-7.
WAITKINS, S. A. 1986. Leptospirosis as an occupational disease. Br J Ind Med, 43,
721-5.
WAMALWA, K., CASTIELLO, M., OMBUI, J. N. & GATHUMA, J. 2012.
Capacity building: benchmark for production of meat with low levels of
bacterial contamination in local slaughterhouses in Somaliland. Trop Anim
Health Prod, 44, 427-33.
WANZALA, W., ONYANGO-ABUJE, J. A., KANG'ETHE, E. K., ZESSIN, K. H.,
KYULE, N. M., BAUMANN, M. P., OCHANDA, H. & HARRISON, L. J.
2003. Control of Taenia saginata by post-mortem examination of carcasses.
Afr Health Sci, 3, 68-76.
WHITNEY, E. A., MASSUNG, R. F., CANDEE, A. J., AILES, E. C., MYERS, L.
M., PATTERSON, N. E. & BERKELMAN, R. L. 2009. Seroepidemiologic
and occupational risk survey for Coxiella burnetii antibodies among US
veterinarians. Clin Infect Dis, 48, 550-7.
WHO. 2002. Future trends in veterinary public health. Report of a WHO study
group. WHO Technical Report Series No. 907. [Online]. Available:
http://whqlibdoc.who.int/trs/WHO_TRS_907.pdf [Accessed August 6th
2014].
WHO 2003. Human leptospirosis: guidance for diagnosis, surveillance and control.:
World Health Organization.
WHO. 2004. Leptospirosis in Kenya [Online]. World Health Organization.
Available: http://www.who.int/csr/don/2004_06_17a/en/ [Accessed August
8th 2014].
WHO 2006. The Control of Neglected Zoonotic Disease: A Route to Poverty
Alleviation, Geneva, World Health Organization.
WHO. 2010. Rift Valley Fever Fact Sheet [Online]. Geneva: World Health
Organization. Available:
http://www.who.int/mediacentre/factsheets/fs207/en/ [Accessed 28th May
2014].
WHO. 2014a. Malaria. Fact Sheet No. 94 [Online]. Available:
http://www.who.int/mediacentre/factsheets/fs094/en/ [Accessed August 24th
2014].
WHO. 2014b. Schistosomiasis. Fact Sheet No. 114 [Online]. Available:
http://www.who.int/mediacentre/factsheets/fs115/en/ [Accessed August 24
2014].
WILLINGHAM, A. L., 3RD & ENGELS, D. 2006. Control of Taenia solium
cysticercosis/taeniosis. Adv Parasitol, 61, 509-66.
WILSON, L. E., COUPER, S., PREMPEH, H., YOUNG, D., POLLOCK, K. G.,
STEWART, W. C., BROWNING, L. M. & DONAGHY, M. 2010.
References______________________________ 274
Investigation of a Q fever outbreak in a Scottish co-located slaughterhouse
and cutting plant. Zoonoses Public Health, 57, 493-8.
WINSLOW, W. E., MERRY, D. J., PIRC, M. L. & DEVINE, P. L. 1997. Evaluation
of a commercial enzyme-linked immunosorbent assay for detection of
immunoglobulin M antibody in diagnosis of human leptospiral infection. J
Clin Microbiol, 35, 1938-42.
WRIGHT, F. J., COOKE, E. R. & D'SOUZA, J. S. 1953. Observations on brucellosis
in Kenya. Trans R Soc Trop Med Hyg, 47, 117-29.
YOHANNES, M., GILL, J. P., GHATAK, S., SINGH, D. K. & TOLOSA, T. 2012.
Comparative evaluation of the Rose Bengal plate test, standard tube
agglutination test and complement fixation test for the diagnosis of human
brucellosis. Rev Sci Tech, 31, 979-84.
ZOCHOWSKI, W. J., PALMER, M. F. & COLEMAN, T. J. 2001. An evaluation of
three commercial kits for use as screening methods for the detection of
leptospiral antibodies in the UK. J Clin Pathol, 54, 25-30.