
董事會特性與實質盈餘管理review.management.ntu.edu.tw/paper/1333-P.pdf · 2013-06-05 ·...
38
363 Board Characteristics and Real Earnings Management 楊朝旭/國立成功大學會計學系暨財務金融研究所教授 Chaur-Shiuh Young, Professor, Department of Accountancy and Graduate Institute of Finance & Banking, National Cheng Kung University 蔡柳卿/國立嘉義大學財務金融學系教授 Liu-Ching Tsai, Professor, Department of Banking and Finance, National Chia-Yi University 陳家慧/國立成功大學會計學系暨財務金融研究所博士生 Chia-Hui Chen, Ph.D. Student, Department of Accountancy and Graduate Institute of Finance & Banking, National Cheng Kung University 廖思婷/勤業眾信聯合會計師事務所查帳員 Ssu-Ting Liao, Auditor, Deloitte & Touche Received 2011/8, Final revision received 2012/10 摘 要 本研究結合實質盈餘管理誘因及公司治理二脈文獻,探討董事會特性是否影響管理者因 為門檻壓力而從事實質盈餘管理。以 2003 年至 2006 年美國上市公司為樣本,本研究實 證結果發現績效門檻 ( 包括零盈餘、前期盈餘及分析師盈餘預測三項績效門檻 ) 會誘發 管理者從事實質盈餘管理。此外,當董事會的成員具備較高的獨立性或專業性時,可抑 制績效門檻誘因所導致的實質盈餘管理幅度。本研究之實證結果符合以下觀點:董事會 治理對於抑制實質盈餘管理,係扮演關鍵角色。 【關鍵字】董事會特性、實質盈餘管理、門檻誘因 Abstract This study combines the real-earnings-management literature and the corporate-governance literature to examine how board characteristics affect real earnings management induced by benchmark meeting/beating incentives. Using a sample of U.S. listed companies over the period of 2003-2006, we find that managers are more likely to exercise real earnings management in order to avoid negative earnings, sustain prior year’s earnings or meet/beat analysts’ consensus earnings forecast. With regard to the role of board characteristics, our results indicate that boards with higher independence and professionalism can effectively constrain earnings-thresholds-induced real earnings management. Our overall findings are consistent with the notion that board governance plays a vital role in restraining real earnings management. 【Keywords】board characteristics, real earnings management, threshold incentives 董事會特性與實質盈餘管理 臺大管理論叢 2012/12 第23 卷第1 期 363-400 DOI: 10.6226/NTURM2012.OCT.R12027 1213-台大管評-4校.indd 363 2012/12/20 下午 02:47:28
Transcript of 董事會特性與實質盈餘管理review.management.ntu.edu.tw/paper/1333-P.pdf · 2013-06-05 ·...

363
Board Characteristics and Real Earnings Management
楊朝旭/國立成功大學會計學系暨財務金融研究所教授Chaur-Shiuh Young, Professor, Department of Accountancy and Graduate Institute of Finance & Banking,
National Cheng Kung University
蔡柳卿/國立嘉義大學財務金融學系教授Liu-Ching Tsai, Professor, Department of Banking and Finance, National Chia-Yi University
陳家慧/國立成功大學會計學系暨財務金融研究所博士生Chia-Hui Chen, Ph.D. Student, Department of Accountancy and Graduate Institute of Finance & Banking,
National Cheng Kung University
廖思婷/勤業眾信聯合會計師事務所查帳員Ssu-Ting Liao, Auditor, Deloitte & Touche
Received 2011/8, Final revision received 2012/10
摘 要
本研究結合實質盈餘管理誘因及公司治理二脈文獻,探討董事會特性是否影響管理者因為門檻壓力而從事實質盈餘管理。以 2003年至 2006年美國上市公司為樣本,本研究實證結果發現績效門檻 (包括零盈餘、前期盈餘及分析師盈餘預測三項績效門檻 )會誘發管理者從事實質盈餘管理。此外,當董事會的成員具備較高的獨立性或專業性時,可抑制績效門檻誘因所導致的實質盈餘管理幅度。本研究之實證結果符合以下觀點:董事會治理對於抑制實質盈餘管理,係扮演關鍵角色。
【關鍵字】董事會特性、實質盈餘管理、門檻誘因
Abstract
This study combines the real-earnings-management literature and the corporate-governance literature to examine how board characteristics affect real earnings management induced by benchmark meeting/beating incentives. Using a sample of U.S. listed companies over the period of 2003-2006, we find that managers are more likely to exercise real earnings management in order to avoid negative earnings, sustain prior year’s earnings or meet/beat analysts’ consensus earnings forecast. With regard to the role of board characteristics, our results indicate that boards with higher independence and professionalism can effectively constrain earnings-thresholds-induced real earnings management. Our overall findings are consistent with the notion that board governance plays a vital role in restraining real earnings management.【Keywords】board characteristics, real earnings management, threshold incentives
董事會特性與實質盈餘管理
臺大管理論叢 2012/12第23卷第1期 363-400DOI: 10.6226/NTURM2012.OCT.R12027
1213-台大管評-4校.indd 363 2012/12/20 下午 02:47:28

董事會特性與實質盈餘管理
364
1. IntroductionThis study aims to examine two research questions: (1) whether firms with incentives
to meet or just beat earnings benchmarks engage in more real earnings management (hereafter, REM), where firms attempt to achieve desired earnings numbers by departing from normal operating activities; (2) whether better board governance, measured by independence, diligence, and professionalism, attenuates the REM made by firms with incentives to slightly meet or beat earnings benchmarks. There is substantial evidence that managers engage in earnings management by manipulating accounting accruals and using real activities (e.g. Schipper, 1989; Healy & Wahlen, 1999; Dechow & Skinner, 2000; Klein, 2002; Xie, Davidson III, & DaDalt, 2003; Roychowdhury, 2006; Chen, Elder, & Hsieh, 2007; Lo, 2008; Cohen & Zarowin, 2010; Gunny, 2010). Accruals management involves managers’ use of accounting methods and estimates within the flexibility offered by accounting standards, and has no direct cash flow consequences. In contrast, REM activities are accomplished by changing normal operating activities, such as sales manipulation, overproduction, and reduction of discretionary expenditures, which have cash flow effects.
After the Sarbanes-Oxley Act (SOX) was enacted in 2002, accrual manipulations decreased, in contrast to a significant increase in the level of REM. This implies that firms switched their earnings management tools from the former to the later (Graham, Harvey, & Rajgopal, 2005; Cohen, Dey, & Lys, 2008). There has thus been an increasing interest from researchers in managers’ REM behavior. For example, Graham et al. (2005) find that managers are willing to engage in REM to meet short-term earnings benchmarks, even though REM alters real activity levels that may lead to inferior future performance. Roychowdhury (2006) and Gunny (2010) also find empirical evidence that firms engage in sales manipulation, overproduction and reducing research and development (R&D) expenditures to beat earnings benchmarks. The literature on incentives for REM is proliferating, yet few studies have examined the role of corporate governance in this context. This is perhaps surprising, as due to a number of accounting scandals such as Enron and WorldCom, more attention has been paid to corporate governance from both academic and practitioners over the last decade. To close the gap in the literature about REM, this current study aims to examine whether board characteristics affect the level of REM driven by the incentives to meet or just beat specific earnings benchmarks. Based on the suggestion in prior literature that the board of directors acts as a control mechanism in earnings management, we argue that firms with more independent, diligent, or professional directors will have a lower level of REM driven by threshold incentives.
1213-台大管評-4校.indd 364 2012/12/20 下午 02:47:28

臺大管理論叢 第23卷第1期
365
Using a sample of US listed firms over the period from 2003 to 2006, we find that managers are more likely to engage in REM when they have incentives to meet or just beat earnings benchmarks. Moreover, we find that both board independence and board professionalism significantly reduce the level of REM in the presence of managerial incentives to meet or just beat earnings thresholds. However, there is no evidence to support that board diligence, as proxied by the number of board meetings during the year, can attenuate the level of REM induced by the incentive to achieve earnings benchmarks. Our additional analyses also show that REM activities are more intensified in the fourth quarter for quarter-earnings-benchmark meeting/beating firms. In summary, our results are consistent with the notion that board independence and board professionalism play the main role in restraining REM activities.
The contributions of this study are two-fold. First, prior research has primarily studied the effects of corporate governance on accruals management (Klein, 2002; Xie et al., 2003; Bradbury, Mak, & Tan, 2006; Chen et al., 2007). Our evidence offers additional insights into whether a board of directors serves as the pivotal mechanism for suppressing REM activities. Second, the current literature on the incentives for REM does not consider the role of corporate governance. On the other hand, the few studies that link corporate governance and the level of REM do not have consistent findings. One potential reason is that these studies fail to include earnings management incentives into their research frameworks. Our study thus contributes to the REM literature by integrating corporate governance, earnings benchmark meeting/beating incentives and REM activities. This offers a more complete picture of why managers engage in REM activities and how board governance can attenuate those manipulations.
The remainder of this paper is organized as follows. In Section 2, we summarize the relevant literature and develop our hypotheses. Section 3 presents research designs, including the research sample, variable definitions and empirical models. In Section 4, we present the empirical results and perform some sensitivity analyses. Finally, Section 5 concludes this research with a summary of the findings and some suggestions for future work.
1213-台大管評-4校.indd 365 2012/12/20 下午 02:47:28

董事會特性與實質盈餘管理
366
2. Literature Review and Hypotheses Development2.1 Earnings Benchmark Meeting/Beating and Real Earnings Management
According to the definition of earnings management provided by Healy and Wahlen (1999), “Earnings management occurs when managers use judgment in financial reporting and in structuring transactions to alter financial reports to either mislead some stakeholders about the underlying economic performance of the company or to influence contractual outcomes that depend on reported accounting practices.” Both accrual-based earnings management and changing normal business operations (i.e. REM) can window-dress financial reports. Schipper (1989) defines REM as “accomplishing by timing investment or financing decision to alter reported earnings or some subset of it.” More recently, Roychowdhury (2006) defines it as “departures from normal operational practices, motivated by managers’ desire to mislead at least some stakeholders into believing certain financial reporting goals have been met in the normal course of operations.” As a result of changing firms’ normal business operations, real activities manipulation has direct cash flow consequences.
Although REM alters normal business operations and potentially affects future operating performance, managers still rely on it to manage earnings. Graham et al. (2005) present a survey of top executives that examines their preferences with regard to the various ways of earnings management. They find many managers would rather choose real activities manipulation, such as reducing spending on R&D, advertising, and maintenance (80% of survey participants), as well as postponing new projects (55.3% of survey participants), in order to meet earnings benchmarks. Moreover, consistent with the conjectures made by Graham et al. (2005), Cohen et al. (2008) indicate that firms have switched from discretionary accruals to real activities manipulations to achieve earnings targets in the post-Sarbanes-Oxley (SOX) period.
There is widespread evidence of a significant discontinuity around various earnings thresholds (Hayn, 1995; Burgstahler & Dichev, 1997; Degeorge, Patel, & Zeckhauser, 1999), including earnings levels around zero (i.e., managers wish to avoid reporting a loss), earnings changes (avoid reporting an earnings decline) and beating analysts’ forecasts (reporting a positive earnings surprise). Recent studies combine evidence of benchmark beating (as the assumed incentive to manage earnings) with firm-specific measures of REM. These studies have tried to observe the extent to which benchmark beating firms also display evidence of abnormal business operations. For example, there is considerable evidence showing that managers reduce R&D expenditures to meet earnings benchmarks (Baber,
1213-台大管評-4校.indd 366 2012/12/20 下午 02:47:28

臺大管理論叢 第23卷第1期
367
Fairfield, & Haggard, 1991; Bushee, 1998; Dechow & Sloan, 1991). In addition to the reduction of R&D expenditures, sales manipulation and
overproduction are often used for REM (Roychowdhury, 2006; Gunny, 2010). Managers may aim to increase sales during the current period by giving price discounts or offering more relaxed credit terms in order to manipulate reported earnings, and may also attempt to engage in overproduction to manipulate the cost of goods sold to report higher earnings (Thomas & Zhang, 2002). Roychowdhury (2006) develops empirical measurements to detect real activities manipulation of discretionary expenses, sales manipulation and overproduction, and provides evidence that managers engage in REM to avoid reporting a loss. In addition, managers can also manipulate the timing of asset sales to manage earnings (Bartov, 1993; Herrmann, Inoue, & Thomas, 2003; Gunny, 2010). Taken together, we argue that firms with benchmark meeting/beating incentives are more likely to engage in REM and propose the first hypothesis as follows:H1: Firms with benchmark meeting/beating incentives are more likely to engage in real
earnings management than firms without these incentives.
2.2 Board Characteristics and Real Earnings Management2.2.1 Independence
Prior studies find evidence that independent directors are more likely to constrain earnings management. For example, Beasley (1996) and Dechow, Hutton, and Sloan (1996) find a negative relationship between the proportion of independent directors on the board and the possibility of fraudulent financial statements. Moreover, the proportion of outside directors is negatively associated with discretionary abnormal accruals for US firms (Klein, 2002; Xie et al., 2003), UK firms (Peasnell, Pope, & Young, 2005), and Australian firms (Davidson, Goodwin-Stewart, & Kent, 2005). As to board ownership, directors with higher stock ownership would be more likely to conspire with management to protect their own investments, thus losing their independence (Yang & Krishnan, 2005). Therefore, we predict that a board of directors with a lower percentage of shares is more effective in mitigating earnings management.
Dechow et al. (1996) find that the combination of chief executive officer and board chairman is positively associated with the probability of firms violating the Generally Accepted Accounting Principles. We thus argue that the separation of the roles of chief executive officer and chairman of the board facilitates a reduction in agency costs, and thus attenuates earnings management (Davidson et al., 2005; Bradbury et al., 2006). Finally, prior
1213-台大管評-4校.indd 367 2012/12/20 下午 02:47:28

董事會特性與實質盈餘管理
368
studies find that stock options may compromise directors’ independence and ability to effectively supervise management (e.g. Cullinan, Du, & Wright, 2008; Bebchuk, Grinstein, & Peyer, 2010). For example, Cullinan et al. (2008) find that independent directors with option grants are more likely to misstate revenues.
Taken together, board independence can play an important role in mitigating earnings management. However, there is no consistent empirical evidence on the association between board independence and REM. Although Osma (2008) and Visvanathan (2008) find that a board with a higher proportion of independent directors is more able to constrain REM, Garven (2009) finds hardly any relationship between board independence and REM. These mixed results may be due to the neglect of earnings management incentives in prior studies. Considering benchmark meeting/beating incentives, we predict that the level of REM of firms with such incentives is attenuated by the independence of the board of directors and propose the following hypothesis.H2: The relationship between the level of real earnings management and benchmark
meeting/beating incentives is attenuated by the independence of the board of directors.
2.2.2 DiligenceThe second dimension of board characteristics we examine is the diligence of board
directors, which is often measured by the number of director meetings. As board directors meet more often, we can assume that directors devote more time to better comprehend management strategies and question certain behaviors, such as earnings management. Vafeas (1999) finds that boards which meet frequently during periods of financial crisis are associated with improvements in operating performance. More directly, Xie et al. (2003) investigate the role of the board of directors in constraining earnings management and find there is a negative relationship between board meeting frequency and the level of discretionary accruals. To summarize, an active board is more likely to prevent firms from engaging in earnings management. Considering benchmark meeting/beating incentives, we predict that the level of REM of firms with incentives to meet or just beat benchmarks is attenuated by the diligence of the board of directors and propose the following hypothesis: H3: The relationship between the level of real earnings management and benchmark
meeting/beating incentives is attenuated by the diligence of the board of directors.
1213-台大管評-4校.indd 368 2012/12/20 下午 02:47:29

臺大管理論叢 第23卷第1期
369
2.2.3 ProfessionalismIn addition to independence and diligence, directors with the characteristic of
professionalism are more capable of monitoring the financial reporting quality. In this study, we consider two aspects of directors’ professionalism: tenure and outside directorships. First, with regard to the tenure, Beasley (1996) indicates that the tenure of outside directors on the board is negatively associated with the likelihood of fraudulent financial reporting. Similarly, Yang and Krishnan (2005) find that there is a negative relationship between the tenure and quarterly earnings management behavior. That is to say, the greater experience and knowledge that a longer tenure provides lead to a better understanding of company practices, and a higher possibility of effectively monitoring issues such as restraining earnings management.
Second, prior studies suggest that directors with multiple outside directorships have incentives to develop reputations as monitoring experts of well-run companies, and thus multiple outside directorships may be viewed as a signal of monitoring competence. For example, Bédard, Chtourou, and Courteau (2004) indicate that outside directorships, serving as a proxy for governance expertise, is negatively associated with the level of aggressive earnings management. Yang and Krishnan (2005) also find that the more outside directorships the audit committee has, the less quarterly earnings management the firm engages in. In short, multiple outside directorships help directors acquire governance expertise and learn best board practices.
In light of the important role of board professionalism in mitigating earnings management, we predict that the level of REM of firms with incentives to meet or just beat benchmarks is attenuated by the professionalism of the board of directors, and propose the following hypothesis:H4: The relationship between the level of real earnings management and benchmark
meeting/beating incentives is attenuated by the professionalism of the board of directors.
3. Empirical Methodology3.1 Regression Models
Following Roychowdhury (2006) and Gunny (2010), we first use Equation (1) to examine the relation between incentives to achieve earnings benchmarks and the level of REM.
1213-台大管評-4校.indd 369 2012/12/20 下午 02:47:29

董事會特性與實質盈餘管理
370
, , , , , , , ,5 70 1 2 3 4 6
,8
4i t i t i t i t i t i t i t i t
i t
REM BENCH MTB SIZE ROA LEV DA BIGLITIGATION
β β β β β β β ββ ε
= + + + + + + ++ +
(1)
Expanding Equation (1) by incorporating board characteristic variables, we use Equation (2) to examine whether board characteristics moderate the relationship between the benchmark meeting/beating incentive and REM.
, , , ,0 1 2 3
, , ,54
, , , ,76
_ _ _ _ _ _
i t i t i t i t
i t i t i t
i t i t i t i t
REM BENCH BD INDEPENDENCE BD DILIGENCEBD PROFESSIONALISM BD INDEPENDENCE BENCHBD DILIGENCE BENCH BD PROFESSIONALISM BENCH
γ γ γ γγ γγ γ
= + + + ++ × +
× + × +
, , , , , ,8 9 10 11 12 13
,14
4i t i t i t i t i t i t
i t
MTB SIZE ROA LEV DA BIGLITIGATION
γ γ γ γ γ γγ ε
+ + + + + ++ (2)
The measurement and predicted sign of all variables in the model are described in the next section.
3.2 Variables Definitions3.2.1 Proxies for Real Earnings Management (REM)
Following Roychowdhury (2006), we use abnormal cash flows, abnormal production costs, and abnormal discretionary expenses as proxies of REM. Roychowdhury (2006) argues that managers may manage earnings by sales manipulation, overproduction, and reduction of discretionary expenditures:
1. Sales manipulation. Firms accelerate the timing of sales by offering sales discount or more lenient credit terms. Under the assumption of a positive gross profit rate, this rise in sales will temporarily increase reported earnings. However, discounts and lenient credit terms will lead to an abnormal decrease in operating cash flows.
2. Overproduction. Managers may overproduce to report a lower cost of goods sold and then higher gross profits. Overproduction will lead to abnormal higher production costs and abnormal lower cash flows.
3. Reduction of discretionary expenditures. Roychowdhury (2006) argues that managers may cut discretionary expenditures, including sales and general administration expenses, R&D expenses and advertising expenses, to avoid a loss. Every dime cut from discretionary expenditures inflates earnings. If firms usually pay these expenditures by cash, this manipulation will not only result in abnormally low discretionary expenditures, but also an abnormal increase in cash flows.
1213-台大管評-4校.indd 370 2012/12/20 下午 02:47:29
臺大管理論叢 第23卷第1期
371
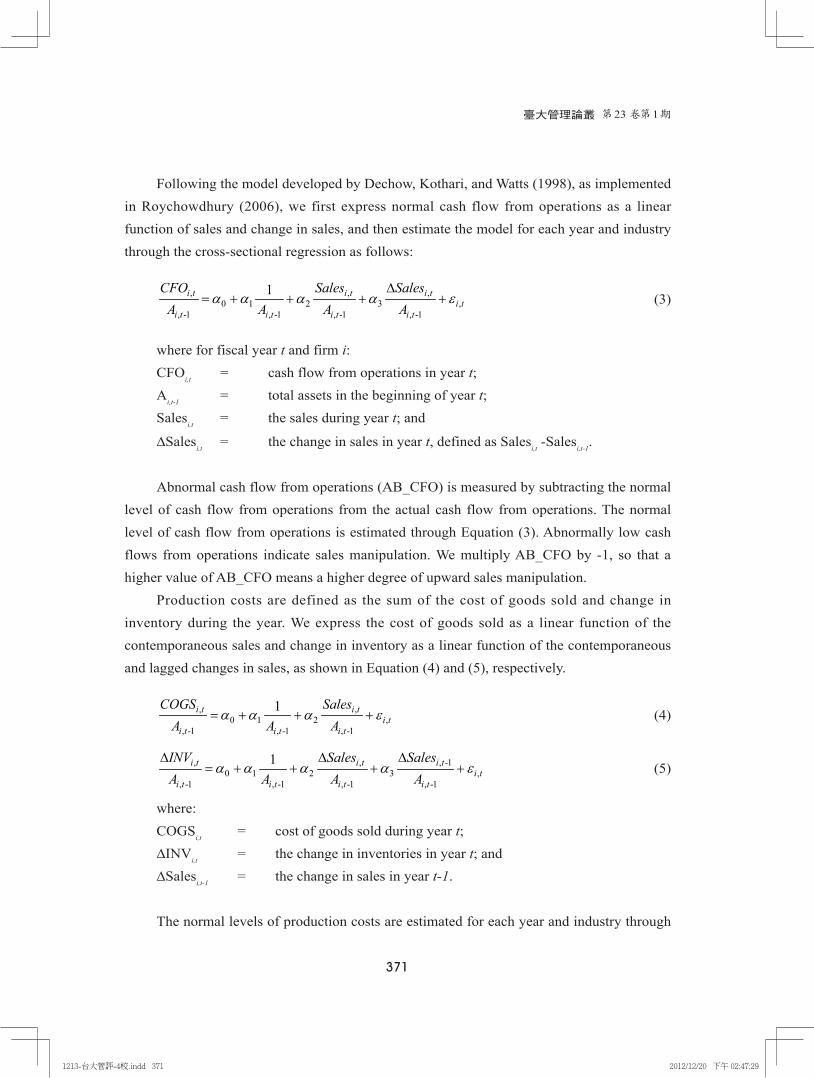
Following the model developed by Dechow, Kothari, and Watts (1998), as implemented in Roychowdhury (2006), we first express normal cash flow from operations as a linear function of sales and change in sales, and then estimate the model for each year and industry through the cross-sectional regression as follows:
, , ,0 1 2 3 ,
, -1 , -1 , -1 , -1
1i t i t i ti t
i t i t i t i t
CFO Sales SalesA A A A
α α α α ε∆
= + + + +
(3)
where for fiscal year t and firm i:CFOi,t = cash flow from operations in year t;Ai,t-1 = total assets in the beginning of year t;Salesi,t = the sales during year t; and
∆Salesi,t = the change in sales in year t, defined as Salesi,t -Salesi,t-1.
Abnormal cash flow from operations (AB_CFO) is measured by subtracting the normal level of cash flow from operations from the actual cash flow from operations. The normal level of cash flow from operations is estimated through Equation (3). Abnormally low cash flows from operations indicate sales manipulation. We multiply AB_CFO by -1, so that a higher value of AB_CFO means a higher degree of upward sales manipulation.
Production costs are defined as the sum of the cost of goods sold and change in inventory during the year. We express the cost of goods sold as a linear function of the contemporaneous sales and change in inventory as a linear function of the contemporaneous and lagged changes in sales, as shown in Equation (4) and (5), respectively.
, ,0 1 2 ,
, -1 , -1 , -1
1i t i ti t
i t i t i t
COGS SalesA A A
α α α ε= + + + (4)
, , , -10 1 2 3 ,
, -1 , -1 , -1 , -1
1i t i t i ti t
i t i t i t i t
INV Sales SalesA A A A
α α α α ε∆ ∆ ∆
= + + + + (5)
where:COGSi,t = cost of goods sold during year t;∆INVi,t = the change in inventories in year t; and∆Salesi,t-1 = the change in sales in year t-1.
The normal levels of production costs are estimated for each year and industry through
1213-台大管評-4校.indd 371 2012/12/20 下午 02:47:29

董事會特性與實質盈餘管理
372
the cross-sectional regression Equation (6).
, , , , -10 1 2 3 4 ,
, -1 , -1 , -1 , -1 , -1
1i t i t i t i ti t
i t i t i t i t i t
PROD Sales Sales SalesA A A A A
α α α α α ε∆ ∆
= + + + + + (6)
where:PRODi,t = the production costs in period t, defined as the sum of COGS and
the change in inventories.
Abnormal production costs (AB_PROD) are estimated by subtracting the normal level of production costs computed using the estimated coefficient from Equation (6) from actual production costs. A higher value of AB_PROD suggests a higher degree of overproduction.
Discretionary expenditures are modeled as a linear function of lagged sales. The normal levels of discretionary expenditures are estimated for each year and industry through the following cross-sectional regression:
, , -10 1 2 ,
, -1 , -1 , -1
1i t i ti t
i t i t i t
DISEXP SalesA A A
α α α ε= + + + (7)
where:DISEXPi,t = the discretionary expenditures in period t, defined as the sum of
advertising expenses, R&D expenses, and selling, general and administrative (SG&A) expenses;
Salesi,t-1 = the sales in during of year t.
Abnormal discretionary expenditures (AB_DISEXP) are computed by subtracting the normal level of discretionary expenditures from actual discretionary expenditures. The normal level of discretionary expenditures is the predicted value applying the estimated coefficient from Equation (7). Abnormally low discretionary expenditures indicate a reduction of discretionary expenditures. We multiply AB_DISEXP by -1, so that a higher value of AB_DISEXP means a greater reduction in discretionary expenditures.
3.2.2 Benchmark Meeting/Beating Incentives (BENCH)We identify a set of firms immediately above the thresholds as having incentives to
achieve the benchmarks, and thus being more likely to engage in REM. The three earnings
1213-台大管評-4校.indd 372 2012/12/20 下午 02:47:29

臺大管理論叢 第23卷第1期
373
thresholds investigated include zero earnings (avoiding loss), prior year’s earnings (avoiding earnings decline) and consensus analyst forecast (avoiding negative earnings surprises). BENCH is a dummy variable coded “1” if the firm meets or beats the benchmarks (i.e., earnings equal to or immediately above zero earnings, zero earnings changes and zero earnings surprise), and zero otherwise. More specifically, firms are identified as benchmark beaters when they report earnings, a change in earnings or earnings surprise (actual EPS minus analysts’ consensus forecast EPS) between zero and one percent of lagged total assets. According to H1, we expect the coefficient on BENCH to be positively significant (β1>0), indicating firms with incentives to achieve earnings benchmarks are more likely to engage in REM.
3.2.3 The Characteristics of Board of Directors1. Independence
Our measures of board independence are: (1) Proportion of independent directors’ (BD_IND), measured as the proportion of independent directors on the board (e.g. Bradbury et al., 2006; Chen et al., 2007; Osma, 2008; Visvanathan, 2008; Garven, 2009; Shiue, Lin, & Liu, 2009). Boards with a higher proportion of outside/independent directors are more independent, and thus are more effective in mitigating earnings management (e.g. Beasley, 1996; Dechow et al., 1996; Klein, 2002; Xie et al., 2003; Kao & Chen, 2004; Davidson et al., 2005; Peasnell et al., 2005); (2) Stock ownership (BD_SHARE), measured as the percentage of shares owned by board directors (Cullinan et al., 2008). Prior studies provide evidence showing that a lower percentage of shares ensures directors’ independence with regard to monitoring managers and mitigating earnings management (Jensen, 1993; Yang & Krishnan, 2005); (3) CEO/Chair Duality (NODUAL), which is a dummy variable that equals one if the CEO does not serve as the board chair, and 0 otherwise. A board with a chairman who is not also the firm’s chief executive officer is more independent, and thus more effective in mitigating earnings management (Davidson et al., 2005; Bradbury et al., 2006); (4) Stock option plans (BD_NOOPTION), which is a dummy variable that equals one if board members do not receive stock options as part of their compensation, and 0 otherwise. Stock option plans may compromise directors’ independence, and thus directors with stock options are less effective in mitigating earnings management (Bédard et al., 2004; Bebchuk et al., 2010; Cullinan et al., 2008).
To reduce measurement errors , we compute a composite variable (BD_INDEPENDENCE) representing the average within-sample percentile of BD_IND, BD_
1213-台大管評-4校.indd 373 2012/12/20 下午 02:47:30
董事會特性與實質盈餘管理
374
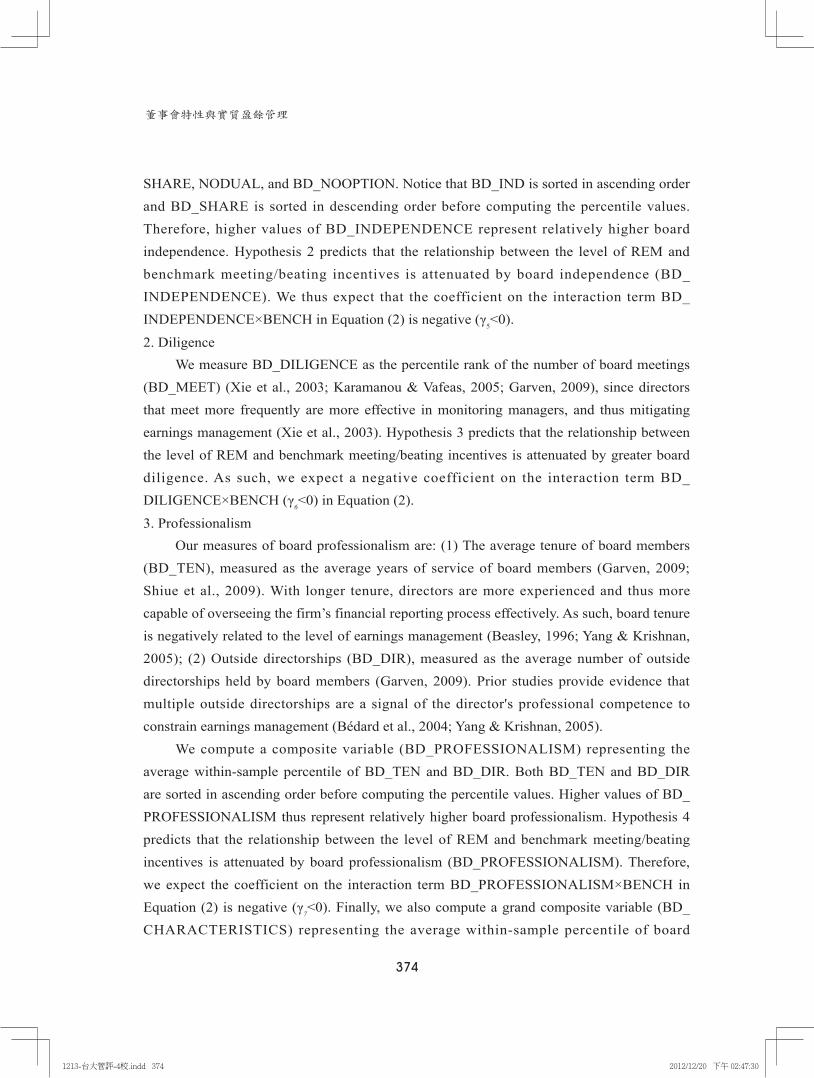
SHARE, NODUAL, and BD_NOOPTION. Notice that BD_IND is sorted in ascending order and BD_SHARE is sorted in descending order before computing the percentile values. Therefore, higher values of BD_INDEPENDENCE represent relatively higher board independence. Hypothesis 2 predicts that the relationship between the level of REM and benchmark meeting/beating incentives is attenuated by board independence (BD_INDEPENDENCE). We thus expect that the coefficient on the interaction term BD_INDEPENDENCE×BENCH in Equation (2) is negative (γ
5<0).
2. DiligenceWe measure BD_DILIGENCE as the percentile rank of the number of board meetings
(BD_MEET) (Xie et al., 2003; Karamanou & Vafeas, 2005; Garven, 2009), since directors that meet more frequently are more effective in monitoring managers, and thus mitigating earnings management (Xie et al., 2003). Hypothesis 3 predicts that the relationship between the level of REM and benchmark meeting/beating incentives is attenuated by greater board diligence. As such, we expect a negative coefficient on the interaction term BD_DILIGENCE×BENCH (γ6<0) in Equation (2).
3. ProfessionalismOur measures of board professionalism are: (1) The average tenure of board members
(BD_TEN), measured as the average years of service of board members (Garven, 2009; Shiue et al., 2009). With longer tenure, directors are more experienced and thus more capable of overseeing the firm’s financial reporting process effectively. As such, board tenure is negatively related to the level of earnings management (Beasley, 1996; Yang & Krishnan, 2005); (2) Outside directorships (BD_DIR), measured as the average number of outside directorships held by board members (Garven, 2009). Prior studies provide evidence that multiple outside directorships are a signal of the director's professional competence to constrain earnings management (Bédard et al., 2004; Yang & Krishnan, 2005).
We compute a composite variable (BD_PROFESSIONALISM) representing the average within-sample percentile of BD_TEN and BD_DIR. Both BD_TEN and BD_DIR are sorted in ascending order before computing the percentile values. Higher values of BD_PROFESSIONALISM thus represent relatively higher board professionalism. Hypothesis 4 predicts that the relationship between the level of REM and benchmark meeting/beating incentives is attenuated by board professionalism (BD_PROFESSIONALISM). Therefore, we expect the coefficient on the interaction term BD_PROFESSIONALISM×BENCH in Equation (2) is negative (γ7<0). Finally, we also compute a grand composite variable (BD_CHARACTERISTICS) representing the average within-sample percentile of board
1213-台大管評-4校.indd 374 2012/12/20 下午 02:47:30

臺大管理論叢 第23卷第1期
375
independence (BD_INDEPENDENCE), diligence (BD_DILIGENCE) and professionalism (BD_PROFESSIONALISM).
3.2.4 Control VariablesThere are systematic variations in growth prospects and size effects for abnormal cash
flow from operations, production costs and discretionary expenditures (Roychowdhury, 2006). Therefore, we include both market-to-book ratio (MTB) and firm size (SIZE) into the regression to control the effects of firm growth opportunities and firm size on REM measures, respectively. MTB is the ratio of market value of equity to book value of equity. SIZE is measured as the logarithm of the market value of equity at the beginning of the year. In addition, since the measurement errors derived from REM estimation models may be correlated with firm performance, we control for the net income scaled by lagged total assets (ROA) in our regression models (Roychowdhury, 2006; Visvanathan, 2008; Cohen & Zarowin, 2010; Gunny, 2010; Zang, 2012). Following Roychowdhury (2006), we do not establish expected signs on the associations between these three variables and REM.
Firms with a higher ratio of debt to equity are more likely to manipulate earnings (Watts & Zimmerman, 1986), and therefore we control for the debt to equity ratio (LEV), which is the ratio of total liabilities to total assets (Matsuura, 2008; Garven, 2009). The coefficient on LEV is expected to be positive, because firms with higher leverage have a higher probability of debt covenant violations, and thus are more likely to manage their earnings (Roychowdhury, 2006; Garven, 2009).
Several researchers demonstrate that firms simultaneously manipulate accrual-based earnings management and REM to fulfill their targets (Roychowdhury, 2006; Cohen & Zarowin, 2010; Gunny, 2010; Zang, 2012), so we add discretionary accruals (DA) to control for this, and expect it to be positively associated with REM (Cohen et al., 2008; Osma, 2008; Garven, 2009). Among the alternative models to detect accrual-based earnings management, the modified version of the Jones (1991) model is regarded as the most powerful one for detecting accrual-based earnings management (Dechow, Sloan, & Sweeney, 1995). Moreover, when estimating discretionary accruals, Kothari, Leone, and Wasley (2005) suggest that it is appropriate to control for firm performance through performance matching on return on assets, because accruals are correlated with firm performance. Therefore, we use the cross-sectional modified-Jones model, and incorporate return on assets (ROA) into it. That is, we use a performance-matched modified-Jones model to measure accrual-based earnings management. The model is estimated for the two-digit SIC-year grouping as
1213-台大管評-4校.indd 375 2012/12/20 下午 02:47:30

董事會特性與實質盈餘管理
376
follows:
, , ,0 1 2 3 4 , ,
, -1 , -1 , -1 , -1
1i t i t i ti t i t
i t i t i t i t
TA REV PPEROA
A A A Aα α α α α ε
∆= + + + + +
(8)
where, for fiscal year t and firm i,TAi,t = total accruals measured by EBXI i,t-CFO i,t, where EBXI is the
earnings before extraordinary items and discontinued operations and CFO is the operating cash flows (from continuing operations) taken from the statement of cash flows;
Ai,t-1 = total assets in the beginning of year t;∆REVi,t = the change in revenues from the preceding year;PPEi,t = gross value of property, plant, and equipment, andROAi,t = return on assets, defined as net income divided by total assets.
The coefficient estimates from Equation (8) are used to estimate the nondiscretionary accruals (NDAi,t) for each sample firms:
( )
, , ,, 0 1 2 3 4 ,
, -1 , -1 , -1
-1 i t i t i ti t i t
i t i t i t
REV REC PPENDA ROA
A A Aα α α α α
∆ ∆ = + + + +
(9)
where for fiscal year t and firm i:∆RECi,t = the change in accounts receivables from the preceding year; other
variables as defined above.
Discretionary accruals (DAi,t) are then estimated by subtracting nondiscretionary accruals (NDAi,t) from total accruals (TAi,t), defined as DAi,t=(TAi,t/Ai,t-1)-NDAi,t.
Moreover, we include indicators of whether firms are audited by one of the largest four audit firms (BIG4) and whether firms operate in an industry with higher litigation risk (LITIGATION) into the regressions. Regarding the BIG4 which proxies for auditor quality, based on prior evidence (Chi, Lisic, & Pevzner, 2011; Zang, 2012), we predict that BIG4 is positively associated with the level of REM. Prior studies suggest that managers make trade-off decisions between accrual earnings management and REM (Cohen et al., 2008; Cohen & Zarowin, 2010). Zang (2012) further suggests that this trade-off between the two earnings
1213-台大管評-4校.indd 376 2012/12/20 下午 02:47:31

臺大管理論叢 第23卷第1期
377
management approaches is determined by their relative costliness. That is, when the costs associated with accrual-based earnings management are high, firms use real activities manipulation more, and vice versa. One type of costs associated with accruals management is driven by the heightened scrutiny of auditors and regulators. The heightened scrutiny is particularly imposed on firms in the presence of high-quality auditors during the period after the passage of SOX. However, REM does not suffer from such costs because any real activity arrangement cannot be intervened by auditors and regulators, as long as it is recognized/disclosed based on accounting rules or is not illegal (Kim, Lisic, & Pevzner, 2010). Accordingly, we predict that firms’ managers tend to use REM more than accruals management when firms are audited by higher-quality auditors1. Finally, firms with higher litigation risk are more likely to draw regulators’ scrutiny and thus accruals manipulation is more costly for these firms. Therefore, we expect that firms with higher litigation risk prefer using higher level of REM, which leads to a positive prediction for LITIGATION. Finally, all continuous variables in the models are truncated at the 1st and 99th percentiles to mitigate the influence of outliers. We summarize all the variables in Table 1.
3.1 Data and Sample SelectionTable 2 outlines the sample selection. We start with all firms that have data available on
Compustat from 2003 to 2006. Analyst forecasts data are retrieved from I/B/E/S. The time period begins in 2003 to avoid the influence of SOX, as according to Cohen et al. (2008), firms have engaged in more REM activities after this act was passed.
Table 1 The Research Variables
VariablesPredicted Signs
in the ModelDefinitions
REMi,t
AB_CFOi,t The abnormal level of cash flow from operations.a
AB_PRODi,t The abnormal level of production costs.
AB_DISEXPi,t The abnormal level of discretionary expenditures.a
INCENTIVES
1 It is worth noting that auditors are not expected to play the same role in constraining REM as the board of directors. This is because directors are responsible for monitoring and limiting managers’ actions in their own self-interests at the expense of shareholders, such as managing real activities. However, auditors, without any influence over clients’ real activities, are responsible for confirming the proper presentation of financial reports.
1213-台大管評-4校.indd 377 2012/12/20 下午 02:47:31

董事會特性與實質盈餘管理
378
VariablesPredicted Signs
in the ModelDefinitions
BENCHi,t (+)
A dummy variable coded “1” if the firm meets or beats the benchmarks (i.e., earnings equal to or immediately above zero earnings, zero earnings changes and zero earnings surprise), and 0 otherwise.
BD_INDEPENDENCEi,t: (-)
A composite variable representing the average within-sample percentile of the following four board independence variables
BD_INDi,t (-) The proportion of independent directors on the board.
BD_SHAREi,t (+)The average percentage of shares owned by the board members.
NODUALi,t (-)A dummy variable that equals 1 if CEO is not the board chairman, and 0 otherwise.
BD_NOOPTIONi,t (-)A dummy variable that equals 1 if board members do not receive any stock options as part of their compensation, and 0 otherwise.
BD_DILIGENCEi,t: (-)
Board diligence, measured as a percentile-rank of BD_MEETi,t
BD_MEETi,t (-) The number of board meetings during the year.
BD_PROFESSIONALISMi,t: (-)
A composite variable representing the average within-sample percentile of the following two board professionalism variables
BD_TENi,t (-) The average years of service on the board of board members.
BD_DIRi,t (-)The average number of outside directorships held by board members.
CONTROLS
MTBi,t (?)The market-to-book ratio, the ratio of market value of equity to book value of equity.
SIZEi,t (?)The logarithm of the market value of equity at the beginning of the year.
ROAi,t (?) Income before extraordinary items scaled by lagged total assets.
LEVi,t (+) The ratio of total liabilities to total assets.
DAi,t (+)The discretionary accruals estimated using the “performance-matched” modified-Jones model.
BIG4i,t (+)A dummy variable that equals 1 if the firm engaged one of the largest four audit firms, and 0 otherwise.
LITIGATIONi,t (+)A dummy variable that equals 1 if the firm is in SIC codes 2833-2836, 3570-3577, 3600-3674, 7371-7379, and 8731-8734, and 0 otherwise.
a We multiply the abnormal levels of cash flow from operations and the abnormal levels of discretionary expenditures by -1, so that the higher values of these two variables represent higher REM.
1213-台大管評-4校.indd 378 2012/12/20 下午 02:47:31

臺大管理論叢 第23卷第1期
379
Moreover, we can collect more comprehensive data about board characteristic variables in this period. IPO firms are more likely to engage in REM, and thus are excluded in the initial sample. The analysis also excludes financial firms (SIC codes 6000 to 6500), firms in regulated industries (SIC codes 4400 to 5000) and public administration and other firms (SIC codes 9000 to 10000), because the models for estimating REM are not appropriate in these industries. We exclude firms with zero total assets, sales or market value of equity, because the denominator of some variables would be zero and, therefore, we would have undefined values. We also exclude firms with a negative book value of equity, because these are likely to be in financial distress. Finally, we exclude observations with values of continuous variables outside the 1st and 99th percentiles of the sample firms. This selection process results in a final sample of 9,817 firm-year observations for testing H1.
To test H2-H4, we merge the aforementioned 10,974 firm-year observations with board characteristics data. Directors’ compensation and the number of board meetings data is retrieved from ExecuComp database. The rest of the board characteristics data is collected from RiskMetrics database. After excluding firm-years without board characteristics data, the total number of firm-years in the final sample for testing H2-H4 is 2,047.
4. Empirical Analysis4.1 Descriptive Statistics
Table 3 provides the descriptive statistics of the research variables used in the analysis. The mean (median) of AB_CFO, AB_PROD, and AB_DISEXP is -0.0086, -0.0024, and 0.0249 (-0.0184, -0.0037, and 0.0575), respectively. On average, 28.53% of the sample firms report their earnings equal to or immediately above zero earnings, zero earnings changes or zero earnings surprise. These firms are identified as having incentives to meet or just beat earnings benchmarks. With respect to board characteristics, about 70.60% of directors are independent directors (BD_IND). The average proportion of shares owned by board members is 6.27% (BD_SHARE). 49.29% of the sample firms have the roles of the chief executive officer and the board chairman separated (NODUAL). Around 31.85% of sample firms do not issue stock options to their directors (BD_NOOPTION). For our sample firms, the mean number of board meetings is around 7.11 (BD_MEET). On average, directors have served 8.65 years on the board (BD_TEN) and hold 0.80 outside directorships (BD_DIR). The mean values of BD_INDEPENDENCE, BD_DILIGENCE, BD_PROFESSIONALISM and BD_CHARACTERISTICS are 1.8134, 0.5010, 1.0020 and 3.3163, respectively.
Regarding the control variables, the market to book value (MTB) is 3.3747 on average,
1213-台大管評-4校.indd 379 2012/12/20 下午 02:47:31

董事會特性與實質盈餘管理
380
while the mean logarithm of the market value of equity at the beginning of the year (SIZE) is 5.7904. The mean value of income before extraordinary items scaled by lagged total assets (ROA) is 0.0143. Sample firms have an average of 44.23% leverage ratio (LEV), and the average discretionary accrual (DA) is 0.0013. On average, 74.15% of sample firms are audited by one of Big-Four audit firms (BIG4). About 25.78% of sample firms are in high litigation industries (LITIGATION). The descriptive statistics for the sample used to test H2-H4 (N=2,047) are qualitatively the same as the aforementioned figures (untabulated).
Table 4 represents the Pearson (above diagonal) and Spearman (below diagonal) correlations among dependent and independent variables. The three measures of REM and discretionary accrual (DA) are all significantly correlated. For example, the correlation coefficient between abnormal cash flow from operations (AB_CFO) and discretionary accrual (DA) is significantly positive (Pearson correlation = 0.479). Consistent with Cohen and Zarowin (2010), these results imply that firms undertake accrual-based earnings management and REM at the same time.
Table 2 Sample Selection
Sample SelectionNumber of Firm-Year
Observations
Panel A: Sample for Testing H1
Initial sample from Compustat excluding IPO firms 39,199
Less:
Financial firms (SIC codes 6000 to 6500) (4,663)
Regulated industries (SIC codes 4400 to 5000) (3,264)
Public administration and other firms (SIC codes 9000 to 10000) (548) (8,475)
Missing financial data (17,878)
Firm-years with zero values of total assetsFirm-years with zero values of sales
(137)(587)
Firm-years with zero values of market value of equity (10) (18,612)
Firm-years with negative values of common shareholders' equity (1,138)
Sample before truncation 10,974
Firm-years with values of continuous variables outside the 1st and 99th percentiles (1,157)
Total number of firm-years in final sample for testing H1 9,817
Panel B: Sample for Testing H2-H4
Sample before truncation for testing H1 10,974
Less: Firm-years without board characteristics data from RiskMetrics (8,006)
1213-台大管評-4校.indd 380 2012/12/20 下午 02:47:31

臺大管理論叢 第23卷第1期
381
Firm-years without board characteristics data from ExecuComp (719)
Firm-years with values of continuous variables outside the 1st and 99th percentiles (202)
Total number of firm-years in final sample for testing H2-H4 2,047
Table 3 Descriptive Statistics
Variable N MeanLower
QuartileMedian
Upper Quartile
Standard Deviation
AB_CFOa 9,817 -0.0086 -0.0854 -0.0184 0.0519 0.1293
AB_PROD 9,817 -0.0024 -0.1196 -0.0037 0.1083 0.2073
AB_DISEXPb 9,817 0.0249 -0.0804 0.0575 0.1779 0.2428
BENCH 9,817 0.2853 0.0000 0.0000 1.0000 0.4516
MTB 9,817 3.3747 1.5694 2.3681 3.8020 3.5467
SIZE 9,817 5.7904 4.1748 5.8728 7.3160 2.2002
ROA 9,817 0.0143 -0.0099 0.0474 0.0979 0.1746
LEV 9,817 0.4423 0.2685 0.4358 0.5954 0.2165
DA 9,817 0.0013 -0.0408 -0.0001 0.0407 0.0820
BIG4 9,817 0.7415 0.0000 1.0000 1.0000 0.4378
LITIGATION 9,817 0.2578 0.0000 0.0000 1.0000 0.4375
BD_IND 2,047 0.7060 0.6000 0.7143 0.8182 0.1416
BD_SHARE 2,047 0.0627 0.0120 0.0279 0.0744 0.0860
NODUAL 2,047 0.4929 0.0000 0.0000 1.0000 0.5001
BD_NOOPTION 2,047 0.3185 0.0000 0.0000 1.0000 0.4660
BD_MEET 2,047 7.1148 5.0000 7.0000 8.0000 2.5597
BD_TEN 2,047 8.6546 6.0000 8.0000 10.7778 3.6835
BD_DIR 2,047 0.7987 0.3750 0.7500 1.1429 0.5324
BD_INDEPENDENCE 2,047 1.8134 1.2821 1.7908 2.3767 0.7921
BD_DILIGENCE 2,047 0.5010 0.2423 0.5104 0.7543 0.2857
BD_PROFESSIONALISM 2,047 1.0020 0.7512 1.0133 1.2526 0.3697
BD_CHARACTERISTICS 2,047 3.3163 2.6733 3.3074 3.9100 0.9340a The abnormal levels of cash flow from operations and discretionary expenditures are multiplied by -1 for easy comparison. b Variable definitions are shown in Table 1.
Benchmark meeting/beating incentives (BENCH) is significantly and positively
correlated with abnormal discretionary expenditures (AB_DISEXP), indicating that firms with benchmark beating incentives are more likely to manipulate discretionary expenditures downward. The logarithm of the market value of equity (SIZE) and Big-Four auditors (BIG4) are significantly and positively correlated (Pearson correlation = 0.556), reflecting
1213-台大管評-4校.indd 381 2012/12/20 下午 02:47:31

董事會特性與實質盈餘管理
382
that larger firms are more likely to choose Big-Four auditors. The largest correlation coefficient is 0.880 (between the board independence composite
variable BD_INDEPENDENCE and the grand board characteristics composite variable BD_CHARACTERISTICS), indicating that board independence serves as a main component of board characteristics. As to the correlations among the independent variables, we find no signs of any problem with collinearity. To further investigate this issue, we also examine the variance inflation factors in the later regression results.
4.2 Results for the Relation between Real Earnings Management and Benchmark Meeting/Beating Incentives
Table 5 presents the pooled regression results for testing hypothesis 1. We compute the t-statistics using the Huber/White robust standard errors (Rogers, 1993; White, 1980) with firm-level clustering to adjust standard errors for multiple observations from the same firm. The main variable of interest is the individual term BENCH. As shown in Table 5, BENCH is significantly and positively related to AB_CFO (coef. = 0.002, significant at the 5% level), AB_PROD (coef. = 0.004, significant at the 10% level) and AB_DISEXP (coef. = 0.010, significant at the 1% level), respectively. These results are consistent with the notion that firms attempt to achieve benchmark earnings numbers by departing from normal operating activities (Roychowdhury, 2006; Gunny, 2010).
With respect to the control variables, the coefficient on MTB is negative and significant at the 1% level in all models, indicating that high growth firms are less likely to engage in REM. The coefficient on LEV is positive and significant at the 1% level in all models, indicating that firms with higher debt to equity ratio are more likely to employ REM activities. Discretionary accruals (DA) are positively associated with both AB_CFO and AB_PROD (significant at the 1% level), suggesting that accrual-based earnings management and REM activities (sales manipulation and overproduction) are complementary. Contrary to our prediction, the relationship between BIG4 and AB_DISEXP is negative (coef. = -0.010, significant at the 5% level), implying that being audited by one of the Big-Four firms is another important mechanism in limiting the level of REM. The coefficients on LITIGATION are negative, suggesting that firms in high litigation industries are less likely to engage in REM because of the potential discipline from external monitoring forces.
1213-台大管評-4校.indd 382 2012/12/20 下午 02:47:31

臺大管理論叢 第23卷第1期
383
Tab
le 4
Co
rrela
tion
Ma
trix
Varia
bles
N1.
2.3.
4.5.
6.7.
8.9.
10.
11.
12.
13.
14.
15.
1.A
B_C
FO
a 9
,817
1.00
0 0.
282 *
**-0
.255
***
-0.1
07 **
*0.
025 *
*-0
.314
***
-0.6
62 **
*0.
080 *
**0.
479 *
**-0
.190
***
-0.0
01
0.00
4 0.
019
0.03
4 0.
023
2.A
B_P
RO
D 9
,817
0.33
1 ***
1.00
0 0.
494 *
**-0
.002
-0
.139
***
-0.0
80 **
*-0
.138
***
0.10
3 ***
0.17
9 ***
-0.0
37 **
*-0
.116
***
-0.0
13
0.03
6 -0
.044
**-0
.017
3.A
B_D
ISE
XP
b 9
,817
-0.1
83 **
*0.
499 *
**1.
000
0.08
3 ***
-0.2
36 **
*0.
175 *
**0.
237 *
**0.
069 *
**0.
027 *
**0.
107 *
**-0
.102
***
-0.0
12
0.05
9 ***
-0.0
37 *
-0.0
07
4.B
EN
CH
9,8
17-0
.097
***
-0.0
11
0.07
2 ***
1.00
0 -0
.029
***
0.22
1 ***
0.14
6 ***
0.05
8 ***
-0.0
21 **
0.13
8 ***
-0.0
67 **
*0.
001
-0.0
37 *
0.08
8 ***
0.02
4
5.M
TB
9,8
17-0
.200
***
-0.2
18 **
*-0
.217
***
0.00
3 1.
000
0.03
6 ***
-0.1
57 **
*0.
162 *
**-0
.063
***
-0.0
56 **
*0.
087 *
**0.
028
-0.0
62 **
*-0
.008
0.
001
6.S
IZE
9,8
17-0
.325
***
-0.0
95 **
*0.
146 *
**0.
221 *
**0.
198 *
**1.
000
0.32
0 ***
0.12
7 ***
-0.1
30 **
*0.
556 *
**-0
.046
***
0.21
8 ***
0.10
3 ***
0.33
5 ***
0.34
9 ***
7.R
OA
9,8
17-0
.603
***
-0.2
01 **
*0.
081 *
**0.
119 *
**0.
239 *
**0.
354 *
**1.
000
0.05
0 ***
0.09
2 ***
0.20
1 ***
-0.1
45 **
*0.
029
-0.1
34 **
*0.
031
-0.0
04
8.LE
V 9
,817
0.11
6 ***
0.11
8 ***
0.08
2 ***
0.06
4 ***
0.08
6 ***
0.16
3 ***
-0.0
40 **
*1.
000
0.01
9 *0.
090 *
**-0
.184
***
0.18
1 ***
0.07
7 ***
0.15
6 ***
0.23
9 ***
9.D
A 9
,817
0.53
2 ***
0.21
5 ***
0.03
4 ***
-0.0
24 **
-0.1
07 **
*-0
.151
***
-0.0
35 **
*0.
013
1.00
0 -0
.102
***
0.00
9 0.
022
-0.0
16
0.05
0 **
0.03
4
10.B
IG4
9,8
17-0
.165
***
-0.0
44 **
*0.
084 *
**0.
138 *
**0.
019 *
0.56
0 ***
0.16
5 ***
0.10
2 ***
-0.1
01 **
*1.
000
-0.0
33 **
*0.
055 *
*0.
024
0.00
4 0.
056 *
*
11.L
ITIG
ATIO
N 9
,817
-0.0
40 **
*-0
.129
***
-0.0
68 **
*-0
.067
***
0.11
2 ***
-0.0
54 **
*-0
.135
***
-0.1
94 **
*0.
005
-0.0
33 **
*1.
000
-0.0
67 **
*0.
100 *
**-0
.011
-0
.031
12.B
D_I
ND
EP
EN
DE
NC
E 2
,047
0.01
0 -0
.012
-0
.023
-0
.001
0.
028
0.21
0 ***
-0.0
07
0.16
9 ***
0.00
6 0.
054 *
*-0
.065
***
1.00
0 0.
052 *
*0.
041 *
0.88
0 ***
13.B
D_D
ILIG
EN
CE
2,0
470.
006
0.03
9 *0.
063 *
**-0
.036
-0
.060
***
0.08
7 ***
-0.1
44 **
*0.
085 *
**-0
.016
0.
026
0.09
9 ***
0.04
4 **
1.00
0 -0
.100
***
0.31
1 ***
14.B
D_P
RO
FE
SS
ION
ALI
SM
2,0
470.
034
-0.0
55 **
-0.0
40 *
0.09
1 ***
0.05
2 **
0.31
6 ***
0.03
6 0.
149 *
**0.
048 *
*0.
001
-0.0
13
0.03
1 -0
.095
***
1.00
0 0.
400 *
**
15.B
D_C
HA
RA
CT
ER
IST
ICS
2,0
470.
023
-0.0
15
-0.0
15
0.02
6 0.
027
0.32
2 ***
-0.0
44 **
0.23
0 ***
0.01
7 0.
054 *
*-0
.030
0.
866 *
**0.
303 *
**0.
384 *
**1.
000
a T
he a
bnor
mal
lev
els
of c
ash
flow
fro
m o
pera
tions
and
dis
cret
iona
ry e
xpen
ditu
res
are
mul
tiplie
d by
-1
for
easy
com
paris
on.
b T
he P
ears
on c
orre
latio
ns a
re i
n th
e ab
ove
diag
onal
and
Spe
arm
an c
orre
latio
ns a
re in
the
belo
w d
iago
nal.
c *, *
*, *
** d
enot
e tw
o-ta
iled
sign
ifica
nce
at th
e 0.
10, 0
.05,
and
0.0
1 le
vels
, res
pect
ivel
y.
1213-台大管評-4校.indd 383 2012/12/20 下午 02:47:32

董事會特性與實質盈餘管理
384
Table 5 Results for the Relation between Real Earnings Management and Benchmark Meeting/Beating Incentives
Variables Predicted Sign AB_CFOa AB_PROD AB_DISEXPa
Intercept ? -0.002 -0.001 0.013*
(-0.84) (-0.15) (1.87)
BENCH + 0.002** 0.004* 0.010***
(2.02) (1.29) (2.44)
MTB ? -0.002*** -0.010*** -0.017***
(-12.19) (-17.06) (-20.62)
SIZE ? -0.002*** -0.001 0.010***
(-6.09) (-1.51) (8.71)
ROA ? -0.586*** -0.262*** 0.219***
(-132.25) (-23.69) (14.71)
LEV + 0.053*** 0.115*** 0.086***
(21.42) (15.29) (9.17)
DA + 0.882*** 0.506*** 0.034
(120.21) (22.40) (1.28)
BIG4 + 0.001 -0.001 -0.010**
(0.60) (-0.10) (-1.83)
LITIGATION + -0.030*** -0.053*** -0.005
(-25.42) (-14.42) (-1.15)
Highest VIFc 1.7 1.7 1.7
Nd 9,387 9,161 9,322
Adj. R-square 84.77% 19.16% 14.36%
Model F 6,530.03*** 272.36*** 196.32***a The abnormal levels of cash flow from operations and discretionary expenditures are multiplied by -1, so that higher values of these two variables suggest higher degrees of REM. b The reported t-statistics (in parentheses) are estimated by the Huber/White heteroscedasticity-consistent robust standard errors (Rogers, 1993; White, 1980). c An analysis of the Variance Inflationary Factor (VIF) for each model reveals that VIFs are all smaller than 2, suggesting that multicollinearity is not an issue. d In order to mitigate the effect of outliers, we exclude the observations with the absolute value of the studentized residual from each regression greater than 2 (Belsley, Kuh, & Welsch, 1980). As such, there are different firm-year observations for each model. e *, **, *** denote significance at the 0.10, 0.05, and 0.01 levels, respectively (a one-tailed test for the coefficients with predicted sign, and a two-tailed test otherwise). f Variable definitions are shown in Table 1.
4.3 Results for the Relationship between Board Characteristics and Real Earnings ManagementTable 6 presents the empirical results for Model (9). All the models fit well with the
1213-台大管評-4校.indd 384 2012/12/20 下午 02:47:32

臺大管理論叢 第23卷第1期
385
adjusted R squared values, ranging from 9.36% to 79.74% (significant at 1% level). As shown in Table 6, the individual coefficients of board independence and board professionalism are significant and negative in the overproduction model and the discretionary expenditures model, respectively. These results indicate that board of directors pay attention to REM activities, even though managers operate without any benchmark beating/meeting incentives. However, the interaction terms between board characteristics and benchmark beating/meeting incentives are significant in a somewhat occasional manner, and these unstable results are attributed to the high degree of collinearity among the variables. Notice that we include all the individual effects and moderating effects of board characteristics in the same regression, which causes a collinearity problem (VIFs > 10). Due to the problem of collinearity, we do not include the individual effects of board characteristics and focus on the moderating effects of board characteristics in the subsequent analyses. The related results are summarized in Table 7.
Table 6 Results for the Relationship between Board Characteristics and Real Earnings Management-Full Model
Variables Predicted Sign AB_CFOa AB_PROD AB_DISEXPa
Intercept ? 0.011 0.027 0.004
(1.37) (1.08) (0.15)
BENCH + 0.008 0.040* 0.029
(1.08) (1.51) (1.02)
BD_INDEPENDENCE - 0.001 -0.008* -0.020***
(0.76) (-1.55) (-3.44)
BD _DILIGENCE - -0.014*** -0.017 -0.014
(-3.27) (-1.21) (-0.84)
BD_ PROFESSIONALISM - 0.003 -0.031*** -0.041***
(0.95) (-2.88) (-3.29)
BD_INDEPENDENCE - -0.003* -0.003 0.003
×BENCH (-1.34) (-0.36) (0.35)
BD _DILIGENCE - -0.001 0.030* 0.021
×BENCH (-0.21) (1.36) (0.81)
BD_ PROFESSIONALISM - 0.002 -0.034** -0.035**
×BENCH (0.48) (-1.94) (-1.87)
MTB ? -0.004*** -0.016*** -0.012***
(-8.68) (-11.54) (-6.92)
1213-台大管評-4校.indd 385 2012/12/20 下午 02:47:32

董事會特性與實質盈餘管理
386
SIZE ? -0.003*** 0.001 0.020***
(-4.21) (0.42) (7.04)
ROA ? -0.529*** -0.478*** -0.154***
(-33.53) (-10.38) (-2.79)
LEV + 0.073*** 0.146*** 0.068***
(12.74) (8.33) (3.47)
PAC + 0.836*** 0.725*** 0.294***
(43.30) (11.55) (4.25)
BIG4 + -0.008* 0.025* 0.018
(-1.47) (1.44) (0.87)
LITIGATION + -0.036*** -0.039*** 0.035***
(-15.27) (-5.13) (3.77)
Highest VIF 16.9 16.8 16.8
Nc 1,856 1,818 1,837
Adj. R-square 79.74% 35.61% 9.36%
Model F 522.39*** 72.78*** 14.54***a The abnormal levels of cash flow from operations and discretionary expenditures are multiplied by -1, so that higher values of these two variables suggest higher degrees of REM. b The reported t-statistics (in parentheses) are estimated by the Huber/White heteroscedasticity-consistent robust standard errors (Rogers, 1993; White, 1980). c In order to mitigate the effect of outliers, we exclude the observations with the absolute value of the studentized residual from each regression greater than 2 (Belsley et al., 1980). As such, there are different firm-year observations for each model. d *, **, *** denote significance at the 0.10, 0.05, and 0.01 levels, respectively (a one-tailed test for the coefficients with predicted sign, and a two-tailed test otherwise). e Variable definitions are shown in Table 1.
Panel A in Table 7 shows the results using abnormal cash flows from operations (AB_CFO) as the dependent variable. In model 1, the main variable of interest is BD_INDEPENDENCE×BENCH, and its coefficient is negative (-0.002) and significant at the 10% level, marginally supporting the second hypothesis (H2) that board independence constrains the benchmark-beating-incentive-derived sales manipulations. As predicted by H3, BD_ DILIGENCE×BENCH is also significantly negative (coef. = -0.017, significant at the 1% level), indicating that board diligence discourages firms from undertaking sales manipulations to meet or just beat earnings benchmarks. However, we do not find evidence to support H4, as the relationship between BD_PROFESSIONALISM×BENCH and AB_CFO is not significant.
The results using abnormal production costs (AB_PROD) as a proxy for overproduction are shown in Panel B of Table 7. We find that the coefficients on BD_
1213-台大管評-4校.indd 386 2012/12/20 下午 02:47:32

臺大管理論叢 第23卷第1期
387
INDEPENDENCE×BENCH (coef. = -0.013, significant at the 5% level) and on BD_PROFESSIONALISM×BENCH (coef. = -0.058, significant at the 1% level) are both significantly negative, suggesting that board independence and board professionalism attenuate overproduction for firms with benchmark meeting/beating incentives. These results are consistent with hypotheses 2 and 4. However, there is no significant evidence to support board diligence having any constraining effects on overproduction. Notice that the relationship between BIG4 and AB_PROD is positive, indicating that firms audited by one of the Big-Four auditors shift from accrual-based earnings management to overproduction. A possible reason for this is that accrual-based earnings management becomes more costly when a firm is audited by an auditor with higher audit quality.
Panel C of Table 7 provides the results for the effects of board characteristics on abnormal discretionary expenditures (AB_DISEXP). Consistent with hypotheses 2 and 4, the coefficients on the interaction terms BD_INDEPENDENCE×BENCH and BD_PROFESSIONALISM×BENCH are both negative and significant at the 1% level (with coefficients = -0.018 and -0.047, respectively). With respect to the control variables, the results are qualitatively the same as those reported in Table 5. Finally, when the three board characterist ics variables are combined into a grand composite variable BD_CHARACTERISTICS, we find that the coefficients on the interaction terms BD_CHARACTERISTICS×BENCH in all three panels (see the model 5 results) are consistently negative, confirming the board has a vital role to play in overseeing management’s REM activities, especially for firms with meeting/beating benchmark incentives.
Table 7 The Effects of Board Characteristics on REM for Firms with Benchmark Meeting/Beating Incentives
Panel A: The Results for Abnormal Levels of Cash Flow from Operations (AB_CFOa)
Variables Predicted sign Model 1 Model 2 Model 3 Model 4 Model 5
Intercept ? 0.021*** 0.020*** 0.023*** 0.020*** 0.020***
(2.96) (2.82) (3.36) (2.81) (2.78)
BENCH + 0.009*** 0.013*** -0.001 0.011** 0.013***
(2.51) (4.71) (-0.03) (1.97) (2.59)
BD_INDEPENDENCE - -0.002* -0.001
×BENCH (-1.33) (-0.58)
BD_DILIGENCE - -0.017*** -0.016***
×BENCH (-3.62) (-3.27)
1213-台大管評-4校.indd 387 2012/12/20 下午 02:47:33

董事會特性與實質盈餘管理
388
BD_PROFESSIONALISM - 0.005 0.003
×BENCH (1.25) (0.75)
BD_CHARACTERISTICS - -0.002**
×BENCH (-1.73)
MTB ? -0.004*** -0.004*** -0.004*** -0.004*** -0.004***
(-8.31) (-8.32) (-8.27) (-8.34) (-8.27)
SIZE ? -0.003*** -0.003*** -0.003*** -0.003*** -0.003***
(-4.26) (-4.30) (-4.74) (-4.27) (-3.97)
ROA ? -0.556*** -0.558*** -0.555*** -0.557*** -0.557***
(-36.08) (-36.45) (-35.99) (-36.37) (-36.19)
LEV + 0.061*** 0.062*** 0.060*** 0.062*** 0.061***
(11.14) (11.26) (10.95) (11.27) (11.05)
PAC + 0.874*** 0.879*** 0.876*** 0.876*** 0.876***
(46.29) (46.35) (46.29) (46.34) (46.22)
BIG4 + -0.012** -0.012** -0.012** -0.012** -0.012**
(-2.27) (-2.17) (-2.23) (-2.14) (-2.27)
LITIGATION + -0.037*** -0.036*** -0.037*** -0.036*** -0.037***
(-16.20) (-15.86) (-16.13) (-15.82) (-16.23)
Nc 1,954 1,956 1,955 1,955 1,955
Adj. R-square 79.91% 79.99% 79.91% 79.99% 79.90%
Model F 864.09*** 869.28*** 864.36*** 710.97*** 864.05***
Panel B: The Results for Abnormal Levels of Production Costs (AB_PROD)Variables Predicted sign Model 1 Model 2 Model 3 Model 4 Model 5
Intercept ? 0.003 0.010 -0.006 -0.008 -0.003
(0.13) (0.42) (-0.27) (-0.34) (-0.12)
BENCH + 0.038*** 0.003 0.074*** 0.078*** 0.061***
(2.83) (0.29) (4.10) (3.38) (3.14)
BD_INDEPENDENCE - -0.013** -0.013**
×BENCH (-2.01) (-2.11)
BD_DILIGENCE - 0.021 0.025*
×BENCH (1.14) (1.35)
BD_PROFESSIONALISM - -0.058*** -0.052***
×BENCH (-3.70) (-3.29)
BD_CHARACTERISTICS - -0.014***
×BENCH (-2.58)
MTB ? -0.018*** -0.018*** -0.018*** -0.018*** -0.018***
(-10.37) (-10.47) (-10.20) (-10.23) (-10.39)
SIZE ? -0.003 -0.003 -0.001 -0.001 -0.002
(-1.25) (-1.52) (-0.30) (-0.24) (-0.90)
1213-台大管評-4校.indd 388 2012/12/20 下午 02:47:33

臺大管理論叢 第23卷第1期
389
ROA ? -0.423*** -0.408*** -0.432*** -0.432*** -0.427***
(-10.76) (-10.32) (-10.85) (-10.90) (-10.82)
LEV + 0.131*** 0.129*** 0.130*** 0.132*** 0.134***
(7.65) (7.41) (7.47) (7.57) (7.77)
PAC + 0.757*** 0.741*** 0.761*** 0.762*** 0.757***
(11.61) (11.28) (11.53) (11.55) (11.61)
BIG4 + 0.033* 0.031* 0.027* 0.027* 0.032*
(1.61) (1.54) (1.37) (1.36) (1.58)
LITIGATION + -0.039*** -0.040*** -0.041*** -0.041*** -0.039***
(-5.11) (-5.17) (-5.29) (-5.35) (-5.08)
Nc 1,931 1,933 1,934 1,936 1,931
Adj. R-square 31.16% 30.58% 30.98% 31.06% 31.26%
Model F 98.05*** 95.58*** 97.42*** 80.25*** 98.50***
Panel C: The Results for Abnormal Levels of Discretionary Expenses (AB_DISEXP1)
Variables Predicted sign Model 1 Model 2 Model 3 Model 4 Model 5
Intercept ? -0.038 -0.025 -0.042 -0.048* -0.046*
(-1.48) (-0.99) (-1.60) (-1.82) (-1.76)
BENCH + 0.041*** 0.003 0.059*** 0.080*** 0.071***
(2.79) (0.25) (3.27) (3.41) (3.42)
BD_INDEPENDENCE - -0.018*** -0.017***
×BENCH (-2.56) (-2.48)
BD_DILIGENCE - 0.012 0.016
×BENCH (0.57) (0.77)
BD_PROFESSIONALISM - -0.047*** -0.046***
×BENCH (-3.04) (-2.92)
BD_CHARACTERISTICS - -0.019***
×BENCH (-3.22)
MTB ? -0.019*** -0.018*** -0.019*** -0.019*** -0.019***
(-8.61) (-8.29) (-8.62) (-8.66) (-8.62)
SIZE ? 0.016*** 0.015*** 0.017*** 0.018*** 0.017***
(6.47) (5.95) (6.82) (6.95) (6.74)
ROA ? -0.072 -0.072 -0.085 -0.083 -0.079
(-1.32) (-1.31) (-1.54) (-1.53) (-1.45)
LEV + 0.043** 0.036** 0.044** 0.047*** 0.045**
(2.20) (1.85) (2.27) (2.41) (2.31)
PAC + 0.325*** 0.325*** 0.321*** 0.318*** 0.319***
(4.74) (4.73) (4.68) (4.63) (4.65)
BIG4 + 0.024 0.024 0.020 0.020 0.024
(1.16) (1.15) (0.97) (0.99) (1.13)
1213-台大管評-4校.indd 389 2012/12/20 下午 02:47:33

董事會特性與實質盈餘管理
390
LITIGATION + 0.039*** 0.040*** 0.038*** 0.037*** 0.039***
(4.26) (4.37) (4.16) (4.00) (4.25)
Nc 1,951 1,952 1,949 1,951 1,950
Adj. R-square 9.52% 9.03% 9.69% 9.81% 9.62%
Model F 23.79*** 22.51*** 24.24*** 20.29*** 24.05***a The abnormal levels of cash flow from operations and discretionary expenditures are multiplied by -1, so that higher values of these two variables suggest higher degrees of REM. b The reported t-statistics (in parentheses) are estimated by the Huber/White heteroscedasticity-consistent robust standard errors (Rogers, 1993; White, 1980). c In order to mitigate the effect of outliers, we exclude the observations with the absolute value of the studentized residual from each regression greater than 2 (Belsley et al., 1980). As such, there are different firm-year observations for each model. d *, **, *** denote significance at the 0.10, 0.05, and 0.01 levels, respectively (a one-tailed test for the coefficients with predicted sign, and a two-tailed test otherwise). e Variable definitions are shown in Table 1.
4.4 Additional Analysis- Evidence with Quarterly DataPrior studies find discontinuities in quarterly earnings (Burgstahler & Dichev, 1997;
Degeorge et al., 1999), suggesting that managers also manipulate these. In this section, we thus provide evidence with quarterly data. BENCHQ1 (2, 3, or 4) is a dummy variable coded “1” if the firm meets or just beats the quarterly benchmarks at quarter one (two, three, or four), and zero otherwise. More specifically, we classify a firm as having met or just beaten benchmarks if it has a quarterly earnings, a change in quarterly earnings (compared to the earnings of the same quarter of the prior year) or earnings surprise (actual quarterly EPS minus analysts’ quarterly consensus forecast EPS) at quarter t between zero and one percent of lagged total assets. Notice that quarterly data on advertising expenses is unavailable in the dataset, and therefore the discretionary expenses variable is defined as the sum of SG&A expenses and R&D expenses here.
As shown in Table 8, BENCHQ4 has a significantly higher coefficient compared with the coefficients on BENCHQ1, BENCHQ2 and BENCHQ3 for both the AB_PROD and the AB_DISEXP models (the Wald tests results are all significant at the 1% level). This result indicates that managers with benchmark beating incentives are more likely to manage earnings upward in the fourth quarter by overproduction and reducing discretionary expenditures, so as to avoid negative quarterly earnings surprises, quarterly losses or quarterly earnings decreases. The board of directors should thus pay more attention to REM activities when the firm’s cumulative earnings at the end of the third quarter still cannot reach a desired annual earnings benchmark. We did not find the same earnings management pattern regarding sales manipulation, which deserves further research in the future.
1213-台大管評-4校.indd 390 2012/12/20 下午 02:47:33

臺大管理論叢 第23卷第1期
391
In light of the fact that managers are more eager to manipulate fourth quarter earnings, we next test whether the board of directors constrains REM activities when managers have benchmark beating incentives in this quarter. Focusing on fourth quarter data also avoids the problem of multi-collinearity. The empirical results are shown in Table 9. The coefficient on BENCHQ4 is significantly positive for the overproduction and discretionary expenses models, suggesting that managers attempt to boost fourth quarter earnings by overproduction and reducing d iscre t ionary expenses . Moreover, the in terac t ion te rm BD_CHARACTERISTICS×BENCHQ4 is significantly negative for both the overproduction and discretionary expenses models, suggesting that the board of directors constrains managers’ REM activities in the fourth quarter for firms with incentives to meet or just beat the quarter benchmarks. Table 9 also shows that the constraining power mainly comes from board independence and board professionalism, since the interaction terms between BENCHQ4 and both BD_INDEPENDENCE and BD_PROFESSIONALISM are significantly negative.
Table 8 Results for the Relation between REM and Benchmark Meeting/Beating Incentives - Evidence with Quarterly Data
Variables Predicted Sign AB_CFOa AB_PROD AB_DISEXPa
Intercept ? -0.003*** -0.005*** 0.001
(-3.38) (-4.33) (0.38)
BENCHQ1 + 0.005*** 0.002*** 0.002**
(12.29) ( 2.62) ( 2.24)
BENCHQ2 + 0.002*** 0.001* 0.001*
( 4.62) ( 1.48) (1.44)
BENCHQ3 + 0.001 0.002*** 0.001
( 0.37) ( 3.07) (0.05)
BENCHQ4 + -0.004*** 0.005*** 0.009***
(-8.76) ( 7.52) (12.48)
MTB ? -0.001*** -0.003*** -0.003***
(-8.82) (-19.90) (-23.39)
SIZE ? -0.001*** 0.001*** 0.002***
(-6.80) ( 2.87) ( 9.16)
ROA ? -0.786*** -0.237*** 0.178***
(-129.49) (-29.82) ( 20.73)
LEV + 0.023*** 0.028*** 0.021***
( 20.82) ( 16.26) (11.14)
PAC + 0.943*** 0.104*** -0.039***
(294.75) (24.32) (-8.97)
1213-台大管評-4校.indd 391 2012/12/20 下午 02:47:34

董事會特性與實質盈餘管理
392
BIG4 + 0.001* -0.003*** -0.005***
( 1.33) (-2.90) (-4.70)
LITIGATION + -0.007*** -0.011*** -0.005***
(-13.61) (-12.50) (-4.72)
Wald test (F value):
BENCHQ1= BENCHQ4 188.30*** 10.71*** 54.10***
BENCHQ2= BENCHQ4 94.57*** 17.43*** 62.59***
BENCHQ3= BENCHQ4 43.83*** 8.70*** 80.48***
Nc 26,381 26,100 26,385
Adj. R-square 89.71% 15.76% 13.68%
Model F 20,900.90*** 444.84*** 381.06***a The abnormal levels of cash flow from operations and discretionary expenditures are multiplied by -1, so that higher values of these two variables suggest higher degrees of REM. b The reported t-statistics (in parentheses) are estimated by the Huber/White heteroscedasticity-consistent robust standard errors (Rogers, 1993; White, 1980). c In order to mitigate the effect of outliers, we exclude the observations with the absolute value of the studentized residual from each regression greater than 2 (Belsley et al., 1980). As such, there are different firm-year observations for each model. d *, **, *** denote significance at the 0.10, 0.05, and 0.01 levels, respectively (a one-tailed test for the coefficients with predicted sign, and a two-tailed test otherwise). e BENCHQ1 (2, 3, or 4) is a dummy variable coded “1” if the firm meets or just beats the quarterly benchmarks at quarter one (two, three, or four), and zero otherwise. f The definitions of other variables are shown in Table 1.
5. ConclusionsDespite the proliferating literature on REM, little attention has been devoted to the
relationships among REM, benchmark meeting/beating incentives, and corporate governance. Specifically, one stream of research only focuses on the incentives for REM and neglects corporate governance, while another focuses on the direct relationship between corporate governance and REM, and neglects the incentives for earnings management. The existing evidence shows that board governance has mixed results for REM, and we argue this inconsistency comes from the oversimplified and incomplete research frameworks in prior studies. By integrating the two aforementioned streams of research, we document that firms with benchmark beating incentives are more likely to engage in REM and, more interestingly, this phenomenon is most pronounced in the fourth quarter. Moreover, we also find that a better board (measured by independence, diligence, and professionalism) does attenuate the REM undertaken by firms with incentives to slightly meet or beat earnings benchmarks.
1213-台大管評-4校.indd 392 2012/12/20 下午 02:47:34

臺大管理論叢 第23卷第1期
393
Our findings have several implications for regulators and investors. Because REM is not subject to external monitoring and scrutiny by regulators or auditors, it is more opaque and difficult to detect than accrual-based earnings management. In light of the effectiveness of board governance in constraining REM, our results thus support recent regulatory reforms to improve board governance to protect investors from fraudulent REM. In addition, our results should be of interest to investors who rely on board governance to limit REM. Investors should thus pay more attention to board characteristics, such as independence, diligence, and professionalism, when they suspect that a firm may be engaging in REM.
Table 9 The Effects of Board Characteristics on REM for Firms with Benchmark Meeting/Beating Incentives – Results for Quarter 4
VariablesPredicted
SignAB_CFOa AB_PROD AB_DISEXPa
Model 1 Model 2 Model 1 Model 2 Model 1 Model 2
Intercept ? 0.007 0.009* -0.007 0.006 -0.017** 0.001
(1.39) (1.83) (-0.92) (0.80) (-2.44) (0.02)
BENCHQ4 + 0.001 -0.002 0.022*** 0.003** 0.030*** 0.005***
(0.12) (1.14) (3.63) (1.68) (5.54) (2.62)
BD_INDEPENDENCE - -0.001 -0.003** -0.005***
×BENCHQ4 (-0.49) (-1.98) (-3.54)
BD_DILIGENCE - -0.008*** 0.001 0.002
×BENCHQ4 (-2.64) (0.04) (0.50)
BD_PROFESSIONALISM - 0.003 -0.013*** -0.017***
×BENCHQ4 (1.10) (-3.31) (-4.65)
BD_CHARACTERISTICS - -0.002** -0.003*** -0.006***
×BENCHQ4 (-2.17) (-2.84) (-5.35)
MTB ? -0.002*** -0.002*** -0.006*** -0.006*** -0.006*** -0.006***
(-4.32) (-4.51) (-8.57) (-8.57) (-8.73) (-8.75)
SIZE ? -0.002*** -0.002*** 0.002*** 0.002** 0.006*** 0.006***
(-4.42) (-3.49) (2.58) (2.49) (8.56) (8.33)
ROA ? -0.737*** -0.749*** -0.320*** -0.319*** -0.111*** -0.102***
(-29.50) (-29.11) (-10.18) (-10.18) (-3.64) (-3.28)
LEV + 0.034*** 0.035*** 0.025*** 0.025*** 0.001 0.002
(8.62) (8.93) (4.31) (4.32) (0.15) (0.32)
PAC + 0.932*** 0.930*** 0.156*** 0.159*** -0.012 -0.009
(72.03) (71.36) (8.87) (8.98) (-0.76) (-0.59)
1213-台大管評-4校.indd 393 2012/12/20 下午 02:47:34

董事會特性與實質盈餘管理
394
BIG4 + -0.003 -0.003 0.003 0.001 0.003 0.004
(-0.81) (-0.86) (0.45) (0.20) (0.56) (0.85)
LITIGATION + -0.015*** -0.016*** -0.010*** -0.009*** 0.003 0.004**
(-10.32) (-10.67) (-4.16) (-4.06) (1.26) (1.76)
Nc 1,926 1,926 1,933 1,936 1,949 1,949
Adj. R-square 86.71% 86.71% 23.91% 23.46% 8.66% 7.98%
Model F 1,143.09*** 1,397.05*** 56.18*** 66.90*** 17.78*** 19.77***a The abnormal levels of cash flow from operations and discretionary expenditures are multiplied by -1, so that higher values of these two variables suggest higher degrees of REM. b The reported t-statistics (in parentheses) are estimated by the Huber/White heteroscedasticity-consistent robust standard errors (Rogers, 1993; White, 1980). c In order to mitigate the effect of outliers, we exclude the observations with the absolute value of the studentized residual from each regression greater than 2 (Belsley et al., 1980). As such, there are different firm-year observations for each model. d *, **, *** denote significance at the 0.10, 0.05, and 0.01 levels, respectively (a one-tailed test for the coefficients with predicted sign, and a two-tailed test otherwise). e BENCHQ4 is a dummy variable coded “1” if the firm meets or just beats the quarterly benchmarks at quarter four, and zero otherwise. f The definitions of other variables are shown in Table 1.
1213-台大管評-4校.indd 394 2012/12/20 下午 02:47:34

臺大管理論叢 第23卷第1期
395
ReferencesBaber, W. R., Fairfield, P. M., & Haggard, J. A. 1991. The effect of concern about reported
income on discretionary spending decisions: The case of research and development. The Accounting Review, 66 (4): 818-829.
Bartov, E. 1993. The timing of asset sales and earnings manipulation. The Accounting Review, 68 (4): 840-855.
Beasley, M. S. 1996. An empirical analysis of the relation between the board of director composition and financial statement fraud. The Accounting Review, 71 (4): 443-465.
Bebchuk, L. A., Grinstein, Y., & Peyers, U. 2010. Lucky CEOs and lucky directors. The Journal of Finance, 65 (6): 2363-2401.
Bédard, J., Chtourou, S. M., & Courteau, L. 2004. The effect of audit committee expertise, independence, and activity on aggressive earnings management. Auditing: A Journal of Practice & Theory, 23 (2): 13-35.
Belsley, D., Kuh, E., & Welsch, R. 1980. Regression diagnostics. New York, NY: John Wiley & Sons.
Bradbury, M. E., Mak, Y. T., & Tan, S. M. 2006. Board characteristics, audit committee characteristics and abnormal accruals. Pacific Accounting Review, 18 (2): 47-68.
Burgstahler, D., & Dichev, I. 1997. Earnings management to avoid earnings decreases and losses. Journal of Accounting and Economics, 24 (1): 99-126.
Bushee, B. J. 1998. The influence of institutional investors on myopic R&D investment behavior. The Accounting Review, 73 (3): 305-333.
Chen, K. Y., Elder, R. J., & Hsieh, Y. M. 2007. Corporate governance and earnings management: The implications of corporate governance best-practice principles for Taiwanese listed companies. Journal of Contemporary Accounting & Economics, 3 (2): 73-105.
Chi, W., Lisic, L. L., & Pevzner, M. 2011. Is enhanced audit quality associated with greater real earnings management? Accounting Horizons, 25 (2): 315-335.
Cohen, D. A., Dey, A., & Lys, T. Z. 2008. Real and accrual-based earnings management in the Pre- and Post-Sarbanes-Oxley periods. The Accounting Review, 83 (3): 757-787.
Cohen, D. A., & Zarowin, P. 2010. Accrual-based and real earnings management activities around seasoned equity offerings. Journal of Accounting and Economics, 50 (1):
1213-台大管評-4校.indd 395 2012/12/20 下午 02:47:35

董事會特性與實質盈餘管理
396
2-19.Cullinan, C. P., Du, H., & Wright, G. B. 2008. Is there an association between director option
compensation and the likelihood of misstatement? Advances in Accounting, Incorporating Advances in International Accounting, 24 (1): 16-23.
Davidson, R., Goodwin-Stewart, J., & Kent, P. 2005. Internal governance structures and earnings management. Accounting and Finance, 45 (2): 241-267.
Dechow, P. M., Hutton, A. P., & Sloan, R. G. 1996. Economic consequences of accounting for stock-based compensation. Journal of Accounting Research, 34 (Supplement): 1-20.
Dechow, P. M., Kothari, S. P., & Watts, R. L. 1998. The relation between earnings and cash flows. Journal of Accounting and Economics, 25 (2): 133-168.
Dechow, P. M., & Skinner, D. J. 2000. Earnings management: Reconciling the views of accounting academics, practitioners, and regulators. Acounting Horizons, 14 (2): 235-250.
Dechow, P. M., & Sloan, R. G. 1991. Executive incentives and the horizon problem: An empirical investigation. Journal of Accounting and Economics, 14 (1): 51-89.
Dechow, P. M., Sloan, R. G., & Sweeney, A. P. 1995. Detecting earnings management. The Accounting Review, 70 (2): 193-225.
Degeorge, F., Patel, J., & Zeckhauser, R. 1999. Earnings management to exceed thresholds. Journal of Business, 72 (1): 1-33.
Garven, S. A. 2009. The effect of board and audit committee characteristics on real earnings management: Do boards and audit committees play a role in its constraint? Working paper, The University of Alabama.
Graham, J. R., Harvey, C. R., & Rajgopal, S. 2005. The economic implications of corporate financial reporting. Journal of Accounting and Economics, 40 (1-3): 3-73.
Gunny, K. A. 2010. The relation between earnings management using real activities manipulation and future performance: Evidence from meeting earnings benchmarks. Contemporary Accounting Research, 27 (3): 855-888.
Hayn, C. 1995. The information content of losses. Journal of Accounting and Economics, 20 (2): 125-153.
Healy, P. M., & Wahlen, J. M. 1999. A review of the earnings management literature and its implications for standard setting. Accounting Horizons, 13 (4): 365-383.
Herrmann, D., Inoue, T., & Thomas, W. B. 2003. The sale of assets to manage earnings in Japan. Journal of Accounting Research, 41 (1): 89-108.
1213-台大管評-4校.indd 396 2012/12/20 下午 02:47:35

臺大管理論叢 第23卷第1期
397
Jensen, M. C. 1993. The modern industrial revolution, exit and the failure of internal control systems. The Journal of Finance, 48 (3): 831-880.
Jones, J. J. 1991. Earnings management during import relief investigations. Journal of Accounting Research, 29 (2): 193-228.
Kao, L., & Chen, A. 2004. The effects of board characteristics on earnings management. Corporate Ownership and Control, 1 (3): 96-107.
Karamanou, I., & Vafeas, N. 2005. The association between corporate boards, audit committees, and management earnings forecasts: An empirical analysis. Journal of Accounting Research, 43 (3): 453-486.
Kim, B. H., Lisic, L. L., & Pevzner, M. 2010. Debt covenant slacks and real earnings management. Working paper, George Mason University.
Klein, A. 2002. Audit committee, board of director characteristics, and earnings management. Journal of Accounting and Economics, 33 (3): 375-400.
Kothari, S. P., Leone, A. J., & Wasley, C. E. 2005. Performance matched discretionary accrual measures. Journal of Accounting and Economics, 39 (1): 163-197.
Lo, K. 2008. Earnings management and earnings quality. Journal of Accounting and Economics, 45 (2/3): 350-357.
Matsuura, S. 2008. On the relation between real earnings management and accounting earnings management: Income smoothing perspective. Journal of International Business Research, 7 (3): 63-77.
Osma, B. G. 2008. Board independence and real earnings management: The case of R&D expenditure. Corporate Governance, 16 (2): 116-131.
Peasnell, K. V., Pope, P. F., & Young, S. 2005. Board monitoring and earnings management: Do outside directors influence abnormal accruals? Journal of Business Finance & Accounting, 32 (7/8): 1311-1346.
Rogers, W. 1993. Stata Technical Bulletin. Regression standard errors in clustered samples. College Station, TX: Stata Press.
Roychowdhury, S. 2006. Earnings management through real activities manipulation. Journal of Accounting and Economics, 42 (3): 335-370.
Schipper, K. 1989. Commentary on earnings management. Accounting Horizons, 3 (4): 91-102.
Shiue, M. J., Lin, C. J., & Liu, Y. P. 2009. Board characteristics and overvalued equity: Evidence from Taiwan. International Research Journal of Finance and Economics, 32: 104-113.
1213-台大管評-4校.indd 397 2012/12/20 下午 02:47:35

董事會特性與實質盈餘管理
398
Thomas, J. K., & Zhang, H. 2002. Inventory changes and future returns. Review of Accounting Studies, 7 (2/3): 163-187.
Vafeas, N. 1999. Board meeting frequency and firm performance. Journal of Financial Economics, 53 (1): 113-142.
Visvanathan, G. 2008. Corporate governance and real earnings management. Academy of Accounting and Financial Studies Journal, 12 (1): 9-22.
Watts, R. L., & Zimmerman, J. L. 1986. Positive accounting theory. Englewood Cliffs, NJ: Prentice-Hall.
White, H. 1980. A heteroskedasticity-consistent covariance matrix estimator and a direct test for heteroskedasticity. Econometrica, 48 (4): 817-838.
Xie, B., Davidson III, W. N., & DaDalt, P. J. 2003. Earnings management and corporate governance: The role of the board and the audit committee. Journal of Corporate Finance, 9 (3): 295-316.
Yang, J. S., & Krishnan, J. 2005. Audit committees and quarterly earnings management. International Journal of Auditing, 9 (3): 201-219.
Zang, A. Y. 2012. Evidence on the trade-off between real activities manipulation and accrual-based earnings management. The Accounting Review, 87 (2): 675-703.
1213-台大管評-4校.indd 398 2012/12/20 下午 02:47:35

臺大管理論叢 第23卷第1期
399
作者簡介*楊朝旭
國立政治大學會計學研究所博士,目前為國立成功大學會計學系暨財務金融研究
所教授兼系主任;主要研究領域為管理會計與財務會計。學術論文曾發表於 Journal of Business Finance and Accounting、Review of Quantitative Finance and Accounting、Journal of Business Research、Supply Chain Management: An International Journal、Journal of Business and Industrial Marketing、Asia Pacific Management Review、Journal of Intellectual Capital、Taiwan Accounting Review、《證券市場發展季刊》、《台大管理論叢》、《會計評論》、《管理評論》、《管理學報》、《中山管理評論》、《管
理與系統》等期刊。
蔡柳卿
國立政治大學會計學研究所博士,目前為國立嘉義大學財務金融學系教授。主要
研究領域為財務會計、管理會計、公司治理與智慧資本。學術論文發表於 Journal of Business Finance and Accounting、Review of Quantitative Finance and Accounting、Journal of Business Research、Asia Pacific Management Review、Taiwan Accounting Review、《證券市場發展季刊》、《台大管理論叢》、《會計評論》、《管理評論》等期刊。
陳家慧
國立成功大學會計學研究所博士生,主要研究領域為財務會計。
廖思婷
國立成功大學會計學系碩士,目前為勤業眾信會計師事務所查帳員,主要研究領
域為財務會計。
本文榮獲財團法人宋作楠先生紀念教育基金會一○○年度碩士論文獎。
作者們感謝財團法人宋作楠先生紀念教育基金會及匿名評審人之寶貴意見。
* E-mail: [email protected]
1213-台大管評-4校.indd 399 2012/12/20 下午 02:47:35

董事會特性與實質盈餘管理
400
1213-台大管評-4校.indd 400 2012/12/20 下午 02:47:35


![財爺:本年度定有盈餘 - LION ROCK DAILY2 2].0/2 2 2].0/2 2 2]2 £ b ß 2 Ü2 O2 w £ b ß P2,: 預算案諮詢冀更了解訴求精英運動員基金或加碼 財爺:本年度定有盈餘](https://static.fdocuments.net/doc/165x107/5e382290c1c81a700f1aec65/ecioeoece-lion-rock-2-202-2-202-2-22-b-2-oe2.jpg)


