
Engineered Nanocomposite Materials for Microwave ...
189
University of South Florida Scholar Commons Graduate eses and Dissertations Graduate School 3-13-2017 Engineered Nanocomposite Materials for Microwave/Millimeter-Wave Applications of Fused Deposition Modeling Juan De Dios Castro University of South Florida, [email protected] Follow this and additional works at: hp://scholarcommons.usf.edu/etd Part of the Electromagnetics and Photonics Commons , and the Materials Science and Engineering Commons is Dissertation is brought to you for free and open access by the Graduate School at Scholar Commons. It has been accepted for inclusion in Graduate eses and Dissertations by an authorized administrator of Scholar Commons. For more information, please contact [email protected]. Scholar Commons Citation Castro, Juan De Dios, "Engineered Nanocomposite Materials for Microwave/Millimeter-Wave Applications of Fused Deposition Modeling" (2017). Graduate eses and Dissertations. hp://scholarcommons.usf.edu/etd/6643
Transcript of Engineered Nanocomposite Materials for Microwave ...
University of South FloridaScholar Commons
Graduate Theses and Dissertations Graduate School
3-13-2017
Engineered Nanocomposite Materials forMicrowave/Millimeter-Wave Applications ofFused Deposition ModelingJuan De Dios CastroUniversity of South Florida, [email protected]
Follow this and additional works at: http://scholarcommons.usf.edu/etd
Part of the Electromagnetics and Photonics Commons, and the Materials Science andEngineering Commons
This Dissertation is brought to you for free and open access by the Graduate School at Scholar Commons. It has been accepted for inclusion inGraduate Theses and Dissertations by an authorized administrator of Scholar Commons. For more information, please [email protected].
Scholar Commons CitationCastro, Juan De Dios, "Engineered Nanocomposite Materials for Microwave/Millimeter-Wave Applications of Fused DepositionModeling" (2017). Graduate Theses and Dissertations.http://scholarcommons.usf.edu/etd/6643
Engineered Nanocomposite Materials for Microwave/Millimeter-Wave Applications of
Fused Deposition Modeling
by
Juan De Dios Castro
A dissertation submitted in partial fulfillment
of the requirements for the degree of
Doctor of Philosophy
Department of Electrical Engineering
College of Engineering
University of South Florida
Major Professor: Jing Wang, Ph.D.
Thomas M. Weller, Ph.D.
Andrew Hoff, Ph.D.
Nathan Crane, Ph.D.
Hariharan Srikanth, Ph.D.
Date of Approval:
March 13, 2017
Keywords: 3-D printing, additive manufacturing (AM), antennas, dielectrics, predictive models
Copyright © 2017, Juan De Dios Castro

DEDICATION
To my son Isaac
ACKNOWLEDGMENTS
My special recognition to CONACYT (The Mexican National Council for Science and
Technology) for providing funding for my doctoral degree. I want to express my appreciation to
my advisor and major professor Dr. Jing Wang, first for accepting me to be part of his research
group in fall 2012, second for his academic coaching and mentoring for me to become a better
scholar and professional in my field of study during this period of my life, and lastly for all the
recommendations and opportunities that He has shared with me.
Also, I’d like to thank Dr. Thomas Weller for his guidance and academic advice and
providing me research appointments for two years when I mostly need them. Similarly, I’d like to
thank Dr. Andrew Hoff for being my mentor as a graduate teaching assistant (GTA) for about three
years, it was an invaluable experience learning semiconductor processing under his supervision,
first as a student, later as GTA. Also, I’d like to thank Dr. Bernard Batson for his support and care
about my progress even before I started this journey, always following my progress and looking
for opportunities for me. Special thanks to my colleagues Eduardo Rojas-Nastrucci, who help me
in many aspects of my work in particular 3D-printing training for FDM and deposition of
conductive traces by micro-dispensing, and Dr. Maria Cordoba-Erazo for the near-field microwave
microscopy (NFMM) measurements in two of the composites presented in this dissertation.
I’d like to thank all the research peers from the RF-MEMS Transducers Laboratory
(including the ones that graduated already), and the research assistants from the WAMI Center at
USF that I have met in this last five years of my journey. Special thanks to the research assistants
that have used some of the composite materials from this work, we have published together some
peer reviewed conference proceedings papers; Mohamed Abdin, Denise Lugo, Anthony Ross, and
Ramiro Ramirez.
I would like to thank the staff at the NREC, especially to Jay Bieber for his SEM and EDS
training and recommendations related to characterization of materials. Dr. Yusuf Emirov for the
AFM and TEM training, Rich Everly for the metrology, photolithography, and DRIE training,
and Robert Tufts for the XRD training and for leading the NREC facility.
Last but not least, I like to express my gratitude to my family for their love, to my son Isaac
for being my inspiration, my mother, Maria Castro, and my sister Maria de Jesus Bojorquez Castro
for always giving me words of support when I need them and for always be there for me. I am
grateful for the moral support received from my brothers, Martin and Joel.
This work has been supported by the National Science Foundation under the ECCS-
1232183 grant, ARMY #W911NF-13-1-0109 grant, 94388 RF Nanomaterials, and Transducers
Foundation, and CONACYT (the Mexican National Council for Science and Technology) under
the CVU #259947 grant.
i
TABLE OF CONTENTS
LIST OF TABLES v
LIST OF FIGURES vii
ABSTRACT xiv
CHAPTER 1: INTRODUCTION 1 1.1 Overview 1 1.2 Dissertation Organization 3
1.3 Contributions 4
CHAPTER 2: BACKGROUND AND LITERATURE REVIEW 7 2.1 Overview of Direct Digital Manufacturing (DDM) 7
2.1.1 Fused Deposition Modeling (FDM) 7
2.1.2 Direct-Print Additive Manufacturing (Micro-Dispensing Technique) 8 2.2 DDM in the RF/microwave Community 9
2.3 High-Dielectric Materials in Electronic Applications 12 2.4 Fundamental Characteristics of High-k Composites 14
2.4.1 Capacitance and Electric Energy Storage of Materials 14 2.4.2 Polarization and Relaxation in Dielectric Materials 15 2.4.3 Dielectric Strength of Polymer Matrix Composites (PMC) 17
2.5 Functional Composite Materials in Microwave Applications 18 2.6 Expanding the Materials Options for 3D-Printed Microwave Applications 21
2.7 Motivation 22 2.7.1 Comparison of High-Performance FDM Microwave Composites
and Thermoplastics 23
CHAPTER 3: ENHANCEMENT OF MICROWAVE PROPERTIES IN COMPOSITE
MATERIALS 25 3.1 Note to Reader 25
3.2 Introduction 25 3.3 Experimental Procedure 27 3.4 Fabrication Process of Polymer Matrix Composites 28
3.4.1 Polymer and Ceramic Materials 28 3.4.2 Preparation of Composite Materials and Specimens 29
3.5 Characterization of Bulk Ceramic Materials 30 3.5.1 XRD Analysis 30 3.5.2 Energy Dispersive Spectroscopy (EDS) Analysis 32
3.6 Characterization of Polymer-Ceramic Composites 35
ii
3.6.1 SEM Analysis 35
3.6.2 Near-Field Microwave Microscopy (NFMM) Analysis 37 3.6.3 Extraction of the Microwave Dielectric Properties 40
3.6.3.1 Cavity Perturbation Technique 40
3.7 Theoretical Models for Effective Dielectric Permittivity of Polymer-Matrix
Composites 43 3.7.1 Raleigh Model 44 3.7.2 Hanai-Bruggeman Model 44 3.7.3 Volume-fraction Average Model 45
3.7.4 Maxwell Model 45 3.7.5 Maxwell-Garnett Model 45 3.7.6 Jaysundere-Smith Model 48
3.8 Measured Dielectric Properties of Polymer-Matrix Composites 48
3.9 Theoretical Model Prediction of Dielectric Loss (tan δd) in PMCs 52 3.10 Results and Discussions 54
3.11 Conclusion 57
CHAPTER 4: FLEXIBLE EM COMPOSITES AND THEIR APPLICATION TO
K-BAND ANTENNAS 61 4.1 Note to Reader 61
4.2 Introduction 61 4.3 Experimental Procedure 62
4.4 Preparation and Characterization PDMS-Ceramic Composites 62 4.4.1 Ceramics Sintering Process 62 4.4.2 XRD, EDS, and SEM Analysis 63
4.4.3 Preparation of Polymer-Ceramic Composites 66
4.5 Characterization of DPAM-Printed Antennas 74 4.5.1 Design of a 19.6 GHz Edge-Fed Microstrip Patch Antenna with
PDMS-MgCaTiO2 Composites 74
4.5.2 Challenges with Direct Print Additive Manufacturing (Micro-
Dispensing) Technology together with Composite Materials 75
4.5.3 Characterization of a 19.6 GHz Edge-Fed Patch Antenna Printed
over a PDMS-MgCaTiO2 Substrate 77
4.6 Stress and Strain RF Testing Analysis of a 4.2 GHz Flexible Patch Antenna
Based on a 37 vol. % PDMS-MgCaTiO2 Composite Material 81 4.7 Conclusion 85
CHAPTER 5: CERAMIC-THERMOPLASTIC COMPOSITES FOR FDM 87 5.1 Note to Reader 87 5.2 Introduction 87
5.3 Experimental Procedure 88 5.4 Fabrication of Thermoplastic Composites 88
5.4.1 Choice of Thermoplastic Matrix and Ceramic Fillers 88 5.4.2 Sintered Ceramics Processing 89 5.4.3 FDM Feedstock Hot Melt Compounding Process 90 5.4.4 Particle Size Analysis of Sintered High-k Ceramic Fillers 92
iii
5.4.5 FDM 3D-Printing Process of Ceramic-Thermoplastic Composites 95
5.4.6 Models for Effective Permittivity 99 5.4.7 Model Prediction of the Dielectric Loss Tangent in FDM
Composites 104
5.4.8 Thin-Sheet Specimen Dielectric Characterization 105 5.5 Measured Properties of FDM-Printed Samples 107
5.5.1 Measured Dielectric Properties of Pure Thermoplastics and
Ceramic-Thermoplastic Composite Materials 107 5.5.2 Comparison of Dielectric Properties of EM Composites vs. Prior
Works 110 5.5.3 Dielectric Properties of Thermoplastic Composites in Comparison
with State-of-the-Art RF Laminates 111 5.5.4 Repeatability Assessment of Cavity Resonator Measurements in
FDM Composites 111 5.5.5 Effect of Fillers Sintering Temperature on FDM Composites 113
5.6 Conclusion 115
CHAPTER 6: DIRECT DIGITAL MANUFACTURING OF KU-BAND ANTENNAS
BASED ON FDM-READY CERAMIC-THERMOPLASTIC COMPOSITES 117 6.1 Note to Reader 117
6.2 Microwave Performance Assessment of FDM Composites 117 6.2.1 3D-printed Edge-Fed Microstrip Patch Antennas 117
6.2.2 Surface Treatment Recommendations for FDM Composites 120 6.2.3 Edge-Fed Patch Antennas Performance 122
6.3 Conclusion 129
CHAPTER 7: MILLIMETER-WAVE PERFORMANCE AND THERMAL
PROPERTIES ASSESSMENT OF FDM-COMPATIBLE COMPOSITES 130 7.1 Note to Reader 130
7.2 Introduction 130 7.3 Measured Properties of 3D-printed Samples 131
7.3.1 Millimeter-Wave Performance Assessment 131 7.3.2 Thermal Assessment of Pure Thermoplastics and Ceramic-
Thermoplastic Composites 137 7.4 Conclusion 140
CHAPTER 8: CONCLUSIONS AND FUTURE WORK 142
8.1 Future Work and Recommendations 142 8.2 Conclusions 143 8.3 Acknowledgments for Sponsors and Facilities 145
REFERENCES 147
APPENDICES 155
Appendix A: Copyright Permissions 156

iv
ABOUT THE AUTHOR END PAGE
v
LIST OF TABLES
Table 2.1 Bulk DC conductivity of CB028 silver paste 9
Table 2.2 Mechanisms that contribute to the displacement of charges in
materials [27] 13
Table 3.1 The fundamental properties of ceramic fillers and sintering conditions 28
Table 3.2 Element weight fractions based on EDS of MgCaTiO2 at two sintering
conditions 33
Table 3.3 Average particle sizes and lattice parameters of MgCaTiO2 measured by
SEM and XRD 34
Table 3.4 Average particle sizes and lattice parameters of TiO2 measured by SEM
and XRD 34
Table 3.5 Element weight fractions based on EDS of TiO2 at different sintering
conditions 35
Table 3.6 Measured EM properties of polymer-ceramic composites with fillers
sintered at different conditions 55
Table 3.7 Comparison of measured EM properties between this work and prior
reports up to K-band 60
Table 4.1 Summary of the studied sintering conditions 63
Table 4.2 Lattice parameters of Ba0.55Sr0.45TiO3 measured by XRD 65
Table 4.3 Element weight fractions based on EDS of Ba0.55Sr0.45TiO3 at different
sintering conditions 65
Table 4.4 The key properties of ceramic fillers and sintering conditions in this
chapter’s materials 72
Table 4.5 Comparison of measured dielectric and loss properties of polymer-ceramic
composites 72
vi
Table 4.6 Comparison of measured EM properties vs. those reported by prior works
up to K-band 73
Table 4.7 Antennas dimensions 77
Table 4.8 Performance comparison of edge-fed patch antenna designs 79
Table 5.1 Vendor-specified dielectric properties of ceramic fillers 88
Table 5.2 Sintering conditions and densities of ceramic fillers 89
Table 5.3 Properties of FDM-compatible materials from this work compared with
other works 101
Table 5.4 Measured EM dielectric properties of microwave materials up to the
Ku-band 116
Table 6.1 Key antenna dimensions 118
Table 6.2 Edge-fed patch antennas performance comparison 122
Table 7.1 Comparison of measured EM properties of composite materials vs. prior
works in the mm-wave spectrum up to V-band 136
Table 7.2 Measured thermal properties of FDM materials tested in this dissertation
with a TMA Q400 instrument 141
vii
LIST OF FIGURES
Figure 2.1 Conceptual illustration of a typical FDM or micro-dispensing printing
process 9
Figure 2.2 (a) 2.4 Bluetooth/Wi-Fi planar inverted “F” antenna, photograph
courtesy of Deffenbaugh et al. [6] © IMAPS 2013 10
Figure 2.3 Miniaturized 2.45 GHz balun using high-k composites 11
Figure 2.4 Phased array antenna (PAA) unit cell fabricated with direct digital
manufacturing (DDM) 12
Figure 2.5 Comparison of measured dielectric permittivity up to 69 GHz of both a
pure COP (ZEONEX® RS420) and a 30 vol. % COP-MgCaTiO2 EM
composites, which are compared with commercial microwave
laminates from Rogers Corporation [27] 23
Figure 2.6 Comparison of measured dielectric loss properties up to 69 GHz of both
a pure COP (ZEONEX® RS420) and a 30 vol. % COP-MgCaTiO2 EM
composites with commercial microwave laminates from Rogers
Corporation [27] 24
Figure 3.1 Measured XRD patterns of MgCaTiO2 ceramic powders after different
sintering processes 31
Figure 3.2 Measured XRD patterns of TiO2 ceramic powder after different
processes 32
Figure 3.3 (a) Tested energy dispersive spectroscopy (EDS) spectrum of MgCaTiO2
ceramic powders sintered at 1100°C 33
Figure 3.4 (a) Tested energy dispersive spectroscopy (EDS) spectrum of TiO2
ceramic powders sintered at 1100°C 35
Figure 3.5 SEM analysis of MgCaTiO2 samples sintered at 1100°C, showing (a) a
zoom-out view photo of MgCaTiO2 agglomerates 36
Figure 3.6 SEM analysis of TiO2 samples sintered at 1100°C, showing (a) a
zoom-out view photo of TiO2 agglomerates 37
viii
Figure 3.7 36 vol. % PDMS-MgCaTiO2 composites with fillers sintered at
1100ºC: (a) NFMM surface topography 39
Figure 3.8 Ideal arrangements of two-phase PMCs 46
Figure 3.9 Distribution of particles in a PMC 47
Figure 3.10 Comparison between the measured dielectric permittivities and
predicted dielectric permittivities given by the models including
Raleigh (Equation (3.20)), Hanai-Bruggeman (Equation (3.21)) and
Maxwell (Equation (3.23)) models, by using the vendor-provided
properties of unsintered raw powders and measured properties of
PDMS 49
Figure 3.11 Comparison of the model-predicted permittivity of PDMS-based
composites embedded with different fillers at various volume ratios
based on Equations (3.20)-(3.23) 51
Figure 3.12 (a) Comparison of measured properties for the four types of composites
vs. predictions by the Hanai-Bruggeman’s model (Equation (3.21)) 52
Figure 3.13 Comparison between the measured dielectric losses (tan δd) with the
losses predicted by the Raju model based on Equation (3.31) by using
the properties of unsintered raw powders and measured properties of
PDMS 53
Figure 3.14 Measured dielectric properties of PDMS and PDMS-ceramic thin-sheet
samples with 36 vol. % MgCaTiO2 fillers sintered at different
temperatures 55
Figure 3.15 Measured dielectric properties of PDMS and PDMS-ceramic thin-sheet
samples with 38 vol. % TiO2 fillers sintered at different temperatures 56
Figure 3.16 Comparison of measured EM properties of PDMS-ceramic composite
samples with commercial RF and microwave laminates (i.e., FR-4 and
TMM10i®) 57
Figure 4.1 Measured x-ray diffraction (XRD) patterns of Ba0.55Sr0.45TiO3 ceramic
powders after different processes 64
Figure 4.2 (a) Tested energy dispersive spectroscopy (EDS) spectrum of
Ba0.55Sr0.45TiO3 ceramic powders sintered at 1100°C 66
Figure 4.3 SEM photos PDMS composite samples 67
ix
Figure 4.4 SEM photos the MgCaTiO2 particles under different sintering
conditions 68
Figure 4.5 Measured EM properties of PDMS-MgCaTiO2 composites with
37% fillers sintered at 1100C or 1500C 69
Figure 4.6 Measured EM properties of the PDMS-Ba0.55Sr0.45TiO3 composites
with 39 vol. % fillers sintered at 1100C and 1340C 70
Figure 4.7 High-frequency measured dielectric properties of the
PDMS-Ba0.55Sr0.45TiO3 composites with 39 vol. % and 49 vol. %
fillers sintered at 1340C, as well as PDMS-MgCaTiO2 composites
with 49 % fillers sintered at 1100C 70
Figure 4.8 Schematic-view scanned AFM surface profiles of PDMS based
composites 71
Figure 4.9 Schematic diagram of a DPAM-printed rectangular edge-fed patch
antenna by using a 37 vol. % PDMS-MgCaTiO2 EM composite
material 76
Figure 4.10 Design and implementation of the edge-fed microstrip patch antennas
showing (a) EM simulated current distribution in the patch antenna
with the critical dimensions specified by ADS Momentum 76
Figure 4.11 DPAM-printed 19.6 GHz edge-fed patch antennas printed with different
setups 77
Figure 4.12 Comparison between measured and simulated return losses for the
printed 19.6 GHz edge-fed patch antenna along with a reference device
implemented with a Rogers RT/duroid® 5880 laminate board and others
mentioned in Table 4.8 78
Figure 4.13 Comparison between gain vs. frequency for all the antennas 79
Figure 4.14 EM simulation result of the 19.6 GHz edge-fed patch antennas by using
ANSYS Electronics Desktop 18 (HFSS 2017), showing the radiation
patterns comparison for all the antenna designs 80
Figure 4.15 Evaluation of a microstrip patch antenna built over a foldable 37 vol. %
PDMS-MgCaTiO2 composite substrate with 4.2 GHz nominal frequency
under stress and bend tests 82
Figure 4.16 Measured return loss of a flexible 4.2 GHz 37 vol. % PDMS-MgCaTiO2
patch antenna at different bending angles 83
x
Figure 4.17 Comparison of measured antenna gain vs. frequency between
4.2 GHz (unbent) patch antenna designed over pure PDMS material
and a patch antenna built over a 37 vol. % PDMS-MgCaTiO2
composite substrate with unsintered fillers 83
Figure 4.18 Normalized measured vs. simulated radiation patterns the 4.2 GHz
(unbent) patch antennas in (a) H-plane and (b) E-Plane 84
Figure 5.1 SEM photos of two generations of newly developed ceramic-
thermoplastic filaments, by using different ball milling times and
with fillers sintered at 1100ºC and 1200ºC for three hours 91
Figure 5.2 SEM photos of two generations of newly developed ceramic-
thermoplastic filaments based on a 30 vol. % COP-TiO2, by using
different ball milling times and with fillers sintered at 1100ºC and
1200ºC for three hours 93
Figure 5.3 Size distribution by number/percentage (%) of 1200ºC sintered TiO2
particles post-processed by different high-energy ball milling times 94
Figure 5.4 SEM surface view photos of 3D-printed specimens: including (a) an
FDM printed 30 vol. % COP-TiO2 thin-sheet with filters sintered 1100ºC 96
Figure 5.5 Energy dispersive spectroscopy (EDS) mapping taken over a 24 µm2
area of the FDM-printed EM composite made of 30 vol. %
COP-MgCaTiO2 with fillers sintered at 1200ºC 97
Figure 5.6 Scanned 2D surface profiles of FDM 3D-printed thin-sheet samples
made of 30 vol. % COP-MgCaTiO2 composites under different
processing conditions 98
Figure 5.7 AFM Schematic-view scanned (bottom side) surface profiles of (a)
a 25 vol. % COP-MgCaTiO2 thin-sheet specimen [50] © IMAPS 2015 99
Figure 5.8 Comparison of model-predicted permittivity of COP-based composites
embedded with different fillers at varied volume fractions based on
Equations (3.20)-(3.23) 102
Figure 5.9 The effective permittivity predicted by the models based on Equations
(3.20), (3.21), (3.23) 103
Figure 5.10 Comparison of the model-predicted and measured dielectric loss
tangents for two types of composites 105
Figure 5.11 RF dielectric/loss properties characterization setup based upon the cavity
perturbation technique for 3D-printed 310 µm-thick specimens 106
xi
Figure 5.12 Loaded and unloaded FDM-printed samples and filaments using pure
COP and COP composites 106
Figure 5.13 Measured dielectric properties of three versions of cyclo-olefin polymer,
such as ZEONEX® RS420, ZEONEX® RS420-LDS and ZEONOR®
1420R, compared to Cycolac™ MG47 ABS 108
Figure 5.14 Comparison of measured high-frequency dielectric and loss properties
of pure COP (ZEONEX® RS420) versus other FDM thermoplastics
and a low-loss RF laminate (RT/duroid® 5880) 108
Figure 5.15 Comparison of the measured dielectric properties of ZEONEX® RS420
COP-based composites loaded with high-k fillers sintered at 1100°C
versus ABS composites with fillers sintered at 1340°C and other
composites 109
Figure 5.16 Comparison of measured and model-estimated permittivity by the
Maxwell and Hanai-Bruggeman models in Equation (3.23) and
Equation (3.21) 110
Figure 5.17 Assessment of measured properties of newly developed 30 vol. %
COP-TiO2 composites with fillers sintered at 1100°C and high-end
RF laminates 111
Figure 5.18 (a) Measured dielectric permittivity (with mean value and error bar
specified) of an FDM-printed thin-sheet specimen composed of
30 vol. % COP-TiO2 composites loaded with 1100°C sintered and
re-pulverized fillers 112
Figure 5.19 Assessment of measured dielectric properties of 30 vol. % COP-TiO2
composites with two different sintering conditions for the TiO2 ceramic
fillers at 1100°C and 1200°C 114
Figure 5.20 Assessment of measured dielectric properties of 30 vol. % COP-TiO2
composites vs. other state-of-the-art microwave materials 115
Figure 6.1 (a) Schematic diagram of a 3D-printed rectangular edge-fed patch by
using a 25 vol. % COP-MgCaTiO2 EM composite material 118
Figure 6.2 Top-view image of additive manufactured 16.5 GHz antennas over COP
and RT/duroid® 5870 substrates (left) as well as 17.2 GHz/16.7 GHz
antennas over 25 vol. % COP-MgCaTiO2 and RT/duroid® 5870
substrates (right) 119
xii
Figure 6.3 Antenna return loss characterization setup for a 16.5GHz antenna
manufactured by a DDM process with a 360 µm-thick pure COP
substrate 119
Figure 6.4 SEM photos of micro-dispensed silver paste (CB028) 121
Figure 6.5 Comparison of the measured and simulated S11 of the 17.2 GHz
antenna DDM-printed based on COP loaded with MgCaTiO2 fillers
and a reference antenna at 16.7 GHz DPAM-printed over Rogers
RT/duroid® 5870 laminate 123
Figure 6.6 The measured and simulated S11 of the 16.5 GHz antennas based
on DDM-printed COP substrate, which is compared with a reference
DPAM-printed antenna over a Rogers RT/duroid® 5870 laminate at
16.4 GHz 123
Figure 6.7 Edge-fed patch antennas in an anechoic chamber during antenna
pattern measurements 124
Figure 6.8 Measured gain vs. frequency for 17.2 GHz antenna DDM-printed
on a COP-MgCaTiO2 composite substrate and a 16.7 GHz reference
antenna DPAM-printed over an RT/duroid®5870 substrate 125
Figure 6.9 Measured and simulated gain vs. frequency for antennas DDM-printed
on pure (unloaded) COP at 16.5 GHz, which are compared with a
16.4 GHz reference design DPAM-printed over a Rogers RT/duroid®
5870 substrate 125
Figure 6.10 Measured (normalized) radiation patterns of the DDM-printed 17.2
GHz antenna by COP-MgCaTiO2 composites, which is compared
with a reference DPAM-printed antenna over a Rogers RT/duroid®
5870 laminate core at 16.7 GHz 127
Figure 6.11 Measured (normalized) radiation patterns of the DDM-printed 16.5
GHz antenna composed of pure (unloaded) COP, which is compared
with a 16.4 GHz reference antenna DPAM-printed over a Rogers
RT/duroid® 5870 laminate core 128
Figure 7.1 SEM photos of 30 vol. % COP-MgCaTiO2 composite FDM-printed
samples 131
Figure 7.2 Comparison of measured dielectric and loss properties up to 69 GHz
of both a pure COP (ZEONEX® RS420) and a 30 vol. %
COP-MgCaTiO2 EM composites based FDM-printed cylindrical
specimens 132
xiii
Figure 7.3 Comparison of measured dielectric permittivity up to 69 GHz of
both a pure COP (ZEONEX® RS420) and a 30 vol. %
COP-MgCaTiO2 EM composites with commercial microwave
laminates from Rogers Corporation [27] 134
Figure 7.4 Comparison of measured dielectric loss properties up to 69 GHz of
both a pure COP (ZEONEX® RS420) and a 30 vol. %
COP-MgCaTiO2 EM composites with commercial microwave
laminates from Rogers Corporation [27] 135
Figure 7.5 Comparison of measured CTEs of 3D-printed pure (unloaded)
thermoplastics 139
Figure 7.6 Comparison of measured CTEs of 3D-printed three variations of COP
and COP-ceramic based composites 139
xiv
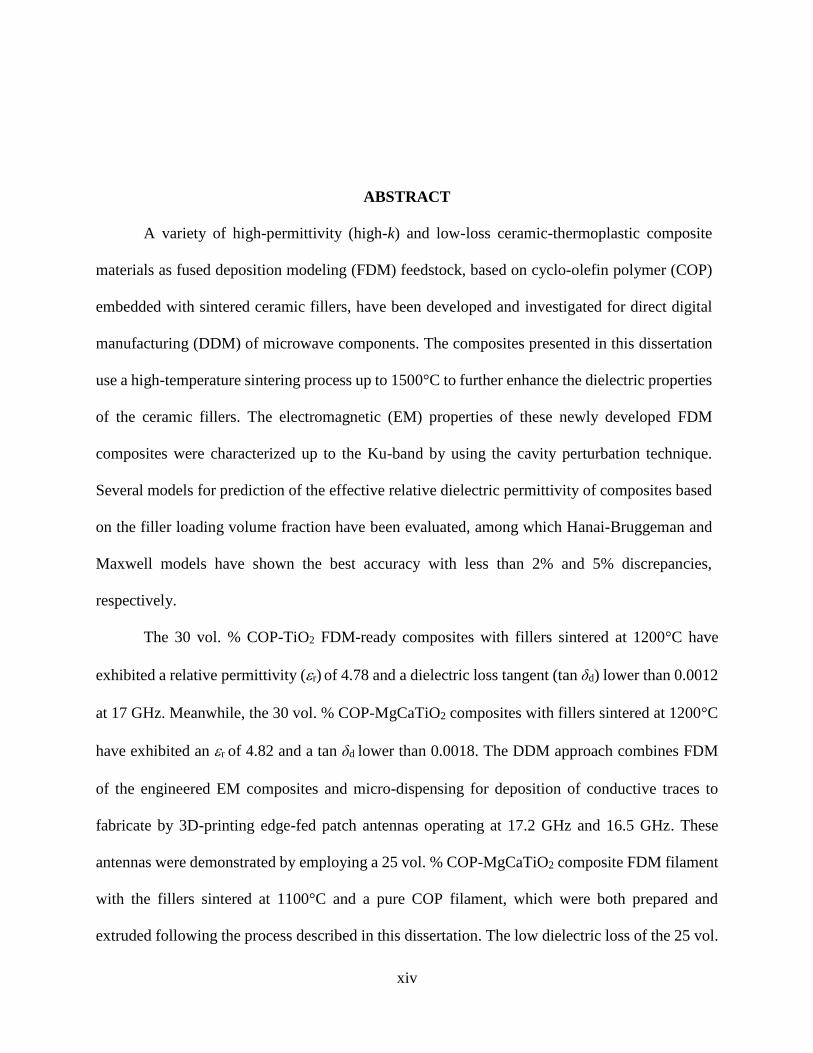
ABSTRACT
A variety of high-permittivity (high-k) and low-loss ceramic-thermoplastic composite
materials as fused deposition modeling (FDM) feedstock, based on cyclo-olefin polymer (COP)
embedded with sintered ceramic fillers, have been developed and investigated for direct digital
manufacturing (DDM) of microwave components. The composites presented in this dissertation
use a high-temperature sintering process up to 1500°C to further enhance the dielectric properties
of the ceramic fillers. The electromagnetic (EM) properties of these newly developed FDM
composites were characterized up to the Ku-band by using the cavity perturbation technique.
Several models for prediction of the effective relative dielectric permittivity of composites based
on the filler loading volume fraction have been evaluated, among which Hanai-Bruggeman and
Maxwell models have shown the best accuracy with less than 2% and 5% discrepancies,
respectively.
The 30 vol. % COP-TiO2 FDM-ready composites with fillers sintered at 1200°C have
exhibited a relative permittivity (r) of 4.78 and a dielectric loss tangent (tan δd) lower than 0.0012
at 17 GHz. Meanwhile, the 30 vol. % COP-MgCaTiO2 composites with fillers sintered at 1200°C
have exhibited an r of 4.82 and a tan δd lower than 0.0018. The DDM approach combines FDM
of the engineered EM composites and micro-dispensing for deposition of conductive traces to
fabricate by 3D-printing edge-fed patch antennas operating at 17.2 GHz and 16.5 GHz. These
antennas were demonstrated by employing a 25 vol. % COP-MgCaTiO2 composite FDM filament
with the fillers sintered at 1100°C and a pure COP filament, which were both prepared and
extruded following the process described in this dissertation. The low dielectric loss of the 25 vol.
xv
% COP-MgCaTiO2 composite material (tan δd lower than 0.0018) has been leveraged to achieve a
peak realized gain of 6 dBi. Also, the high-permittivity (εr of 4.74), which corresponds to an index
of refraction of 2.17, results in a patch area miniaturization of 50% when compared with an antenna
designed and DPAM-printed over a Rogers RT/duroid® 5870 laminate core through micro-
dispensing of CB028 silver paste. This reference antenna exhibited a measured peak realized gain
of 6.27 dBi that is comparable.
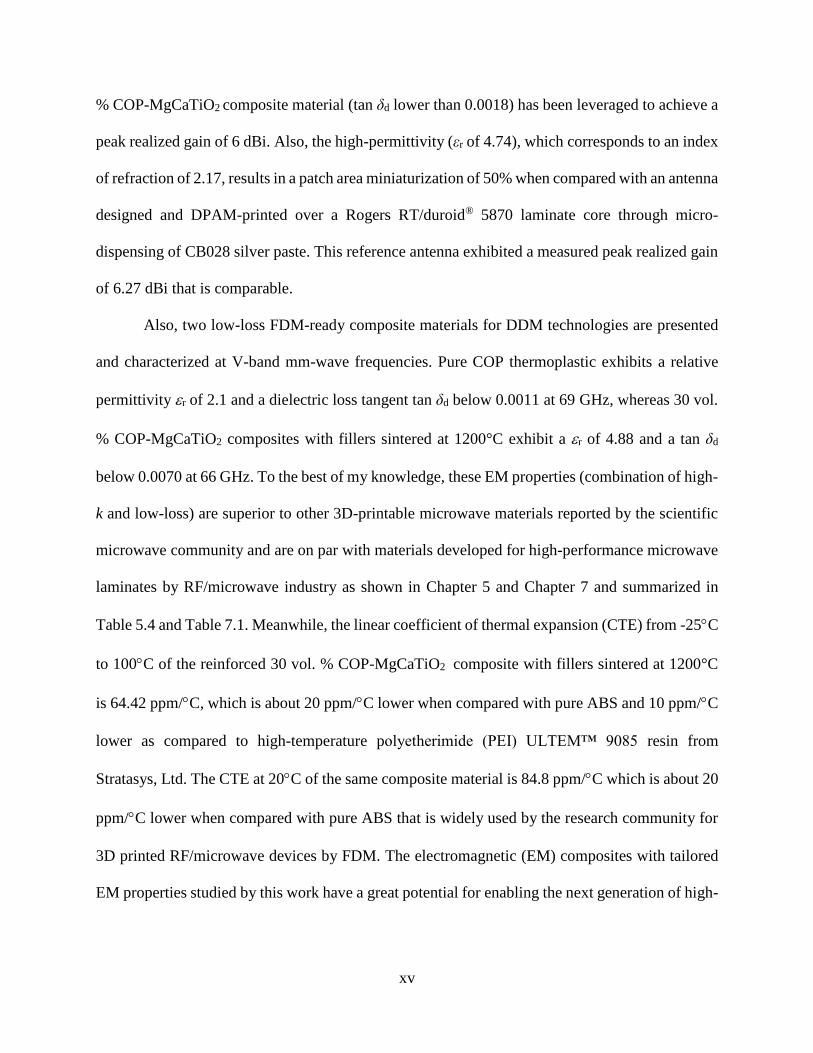
Also, two low-loss FDM-ready composite materials for DDM technologies are presented
and characterized at V-band mm-wave frequencies. Pure COP thermoplastic exhibits a relative
permittivity r of 2.1 and a dielectric loss tangent tan δd below 0.0011 at 69 GHz, whereas 30 vol.
% COP-MgCaTiO2 composites with fillers sintered at 1200°C exhibit a r of 4.88 and a tan δd
below 0.0070 at 66 GHz. To the best of my knowledge, these EM properties (combination of high-
k and low-loss) are superior to other 3D-printable microwave materials reported by the scientific
microwave community and are on par with materials developed for high-performance microwave
laminates by RF/microwave industry as shown in Chapter 5 and Chapter 7 and summarized in
Table 5.4 and Table 7.1. Meanwhile, the linear coefficient of thermal expansion (CTE) from -25C
to 100C of the reinforced 30 vol. % COP-MgCaTiO2 composite with fillers sintered at 1200°C
is 64.42 ppm/C, which is about 20 ppm/C lower when compared with pure ABS and 10 ppm/C
lower as compared to high-temperature polyetherimide (PEI) ULTEM™ 9085 resin from
Stratasys, Ltd. The CTE at 20C of the same composite material is 84.8 ppm/C which is about 20
ppm/C lower when compared with pure ABS that is widely used by the research community for
3D printed RF/microwave devices by FDM. The electromagnetic (EM) composites with tailored
EM properties studied by this work have a great potential for enabling the next generation of high-

xvi
performance 3D-printed RF/microwave devices and antennas operating at the Ku-band, K-band,
and mm-wave frequencies.
1
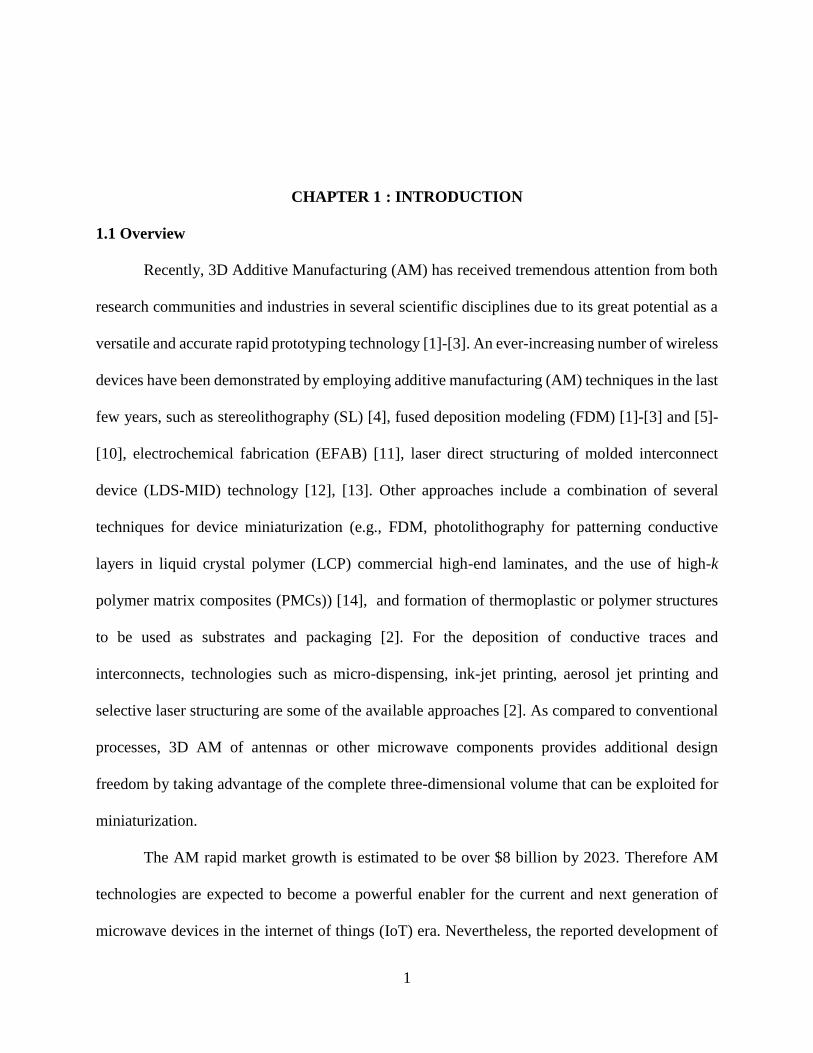
CHAPTER 1 : INTRODUCTION
1.1 Overview
Recently, 3D Additive Manufacturing (AM) has received tremendous attention from both
research communities and industries in several scientific disciplines due to its great potential as a
versatile and accurate rapid prototyping technology [1]-[3]. An ever-increasing number of wireless
devices have been demonstrated by employing additive manufacturing (AM) techniques in the last
few years, such as stereolithography (SL) [4], fused deposition modeling (FDM) [1]-[3] and [5]-
[10], electrochemical fabrication (EFAB) [11], laser direct structuring of molded interconnect
device (LDS-MID) technology [12], [13]. Other approaches include a combination of several
techniques for device miniaturization (e.g., FDM, photolithography for patterning conductive
layers in liquid crystal polymer (LCP) commercial high-end laminates, and the use of high-k
polymer matrix composites (PMCs)) [14], and formation of thermoplastic or polymer structures
to be used as substrates and packaging [2]. For the deposition of conductive traces and
interconnects, technologies such as micro-dispensing, ink-jet printing, aerosol jet printing and
selective laser structuring are some of the available approaches [2]. As compared to conventional
processes, 3D AM of antennas or other microwave components provides additional design
freedom by taking advantage of the complete three-dimensional volume that can be exploited for
miniaturization.
The AM rapid market growth is estimated to be over $8 billion by 2023. Therefore AM
technologies are expected to become a powerful enabler for the current and next generation of
microwave devices in the internet of things (IoT) era. Nevertheless, the reported development of
2
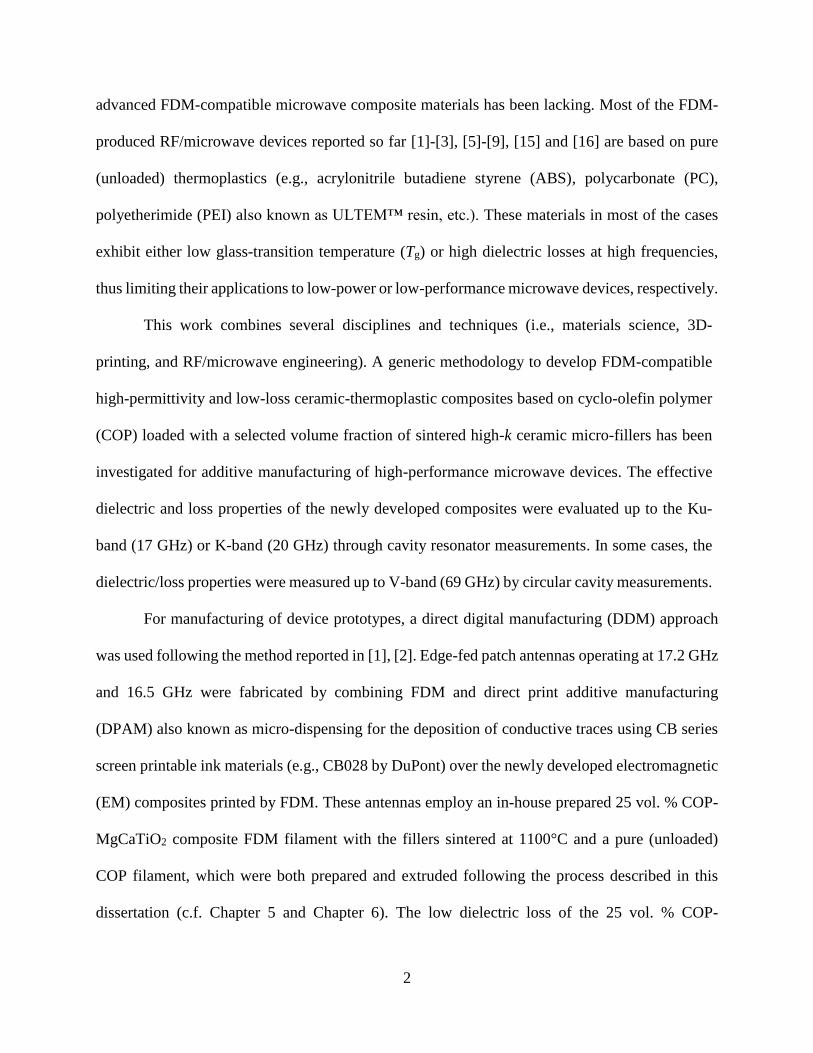
advanced FDM-compatible microwave composite materials has been lacking. Most of the FDM-
produced RF/microwave devices reported so far [1]-[3], [5]-[9], [15] and [16] are based on pure
(unloaded) thermoplastics (e.g., acrylonitrile butadiene styrene (ABS), polycarbonate (PC),
polyetherimide (PEI) also known as ULTEM™ resin, etc.). These materials in most of the cases
exhibit either low glass-transition temperature (Tg) or high dielectric losses at high frequencies,
thus limiting their applications to low-power or low-performance microwave devices, respectively.
This work combines several disciplines and techniques (i.e., materials science, 3D-
printing, and RF/microwave engineering). A generic methodology to develop FDM-compatible
high-permittivity and low-loss ceramic-thermoplastic composites based on cyclo-olefin polymer
(COP) loaded with a selected volume fraction of sintered high-k ceramic micro-fillers has been
investigated for additive manufacturing of high-performance microwave devices. The effective
dielectric and loss properties of the newly developed composites were evaluated up to the Ku-
band (17 GHz) or K-band (20 GHz) through cavity resonator measurements. In some cases, the
dielectric/loss properties were measured up to V-band (69 GHz) by circular cavity measurements.
For manufacturing of device prototypes, a direct digital manufacturing (DDM) approach
was used following the method reported in [1], [2]. Edge-fed patch antennas operating at 17.2 GHz
and 16.5 GHz were fabricated by combining FDM and direct print additive manufacturing
(DPAM) also known as micro-dispensing for the deposition of conductive traces using CB series
screen printable ink materials (e.g., CB028 by DuPont) over the newly developed electromagnetic
(EM) composites printed by FDM. These antennas employ an in-house prepared 25 vol. % COP-
MgCaTiO2 composite FDM filament with the fillers sintered at 1100°C and a pure (unloaded)
COP filament, which were both prepared and extruded following the process described in this
dissertation (c.f. Chapter 5 and Chapter 6). The low dielectric loss of the 25 vol. % COP-
3
MgCaTiO2 composite material has been leveraged to achieve a peak realized gain of 6 dBi. Also,
a patch area miniaturization of 50% was achieved when compared with an antenna designed and
DPAM-printed over a Rogers RT/duroid® 5870 laminate core through micro-dispensing of CB028
silver paste. This reference antenna exhibited a measured peak realized gain of 6.27 dBi.
In this dissertation, two types of newly developed composite materials were characterized
up to the V-band (69 GHz) frequencies by using a circular cavity resonator. As compared to ABS,
polylactic acid (PLA), polypropylene (PP) and polycarbonate (PC), pure COP and filler-reinforced
COP composites offer higher Tg, better chemical inertness to solvents and strong acids, and
superior dielectric/loss properties. In particular, it exhibits low dielectric loss tangent (tan δd lower
than 0.0011 and tan δd lower than 0.0070) up to V-band frequencies for unloaded and ceramic-
loaded specimens, respectively. Such attributes offer an exceptional performance potential for
wireless systems operating in unique hostile or harsh environments, such as satellite systems in
space, aerospace and automotive applications, etc.
1.2 Dissertation Organization
This dissertation is organized into eight chapters. The first chapter presents an introduction
and overview of the forecasted additive manufacturing market and its potential impacts to wireless
communications, followed by the reported progress in microwave devices by the microwave
community by using AM technologies. Then the focus is steered towards the FDM technology
while describing the main findings of this dissertation research. Chapter 2 provides a background
and literature review of DDM with a primary focus on FDM and their application to RF/microwave
devices. The motivation of this work is elaborated that is to address the lack of high-permittivity
and low-loss 3D-printable materials that severely hinders the ability for AM to be employed for
manufacturing RF and microwave electronics in a middle to high-volume manufacturing scale.
4
Chapter 3 presents a generic methodology to enhance the microwave dielectric properties
of polymer-ceramic EM composites with MgCaTiO2 and TiO2 micro-fillers through a high-
temperature sintering process. A new kind of high-permittivity and low-loss EM composites based
on sintered Ba0.55Sr0.45Tio3 and MgCaTiO2 micro-fillers for additive manufacturing and their
application to 3D-printed K-band antennas are presented in chapter 4. Chapter 5 introduced the
preparation and dielectric modeling of ceramic-thermoplastic composites in the form of FDM
feedstock materials. Ceramic-thermoplastic composites for FDM and their application to fully 3D-
printed antennas operating in the Ku-band are then presented in Chapter 6. Chapter 7 covers
millimeter-wave characterization and thermal analysis of ceramic-thermoplastic composites for
FDM process. Chapter 8 presents conclusion and viable directions for future research work related
to engineered composite materials for 3D-printed microwave components.
1.3 Contributions
To the best of my knowledge, fully 3D-printed microwave devices by a DDM process
operating in the Ku-band employing a new kind of engineered EM COP-based
composites were published for the first time by this dissertation work [10], [17].
A new class of FDM-ready, high-k and low-loss feedstock filament materials has been
prepared and characterized up to 70 GHz.
Assessment of several models for prediction of the effective dielectric permittivity of
composites by filler loading volume fraction has been evaluated, among which Hanai-
Bruggeman and Maxwell models have shown the best accuracy up to 40% filler volume
fraction. Also, the preliminary model prediction of the dielectric loss in the composite
materials is explored in this dissertation.
5
Moreover, several newly developed COP-based electromagnetic (EM) composites are
amongst the best of their class on high-permittivity and low-loss (i.e., εr5 and tan δd
less than 0.0012) up to the Ku-band. These FDM-ready feedstock composites possess
better properties, particularly in terms of dielectric losses than some state-of-the-art
microwave laminates, (e.g., Rogers RO4003®, TMM3®, and isola Tachyon®, and isola
I-Tera® MT). Also, these properties approach the lowest dielectric losses of high-end
microwave laminates exhibited by Rogers RT/duroid® 5880/5870, ARLON CLTE-
XT™, and AD250C™ (see Table 5.4 and Figure 5.17).
Several Composite materials with dielectric losses on par with the state-of-art Rogers
high-frequency microwave laminates have been developed. In particular, r of 4.56 and
tan δd lower than 0.0014 have been realized, which are 2x and 3x better than those of
ABS (a widely used thermoplastic materials for additive manufacturing), respectively.
Two composite materials characterized at the mm-wave frequencies up to the V-band
(69 GHz). In particular, pure (unloaded) COP thermoplastic exhibits a relative
permittivity of 2.1 and a loss tangent below 0.0011 at 69 GHz, whereas 30 vol. % COP-
MgCaTiO2 composites with fillers sintered at 1200°C show a relative permittivity of
4.88 and a loss tangent below 0.0070 at 66 GHz.
Fully additive manufactured Ku-band 17 GHz patch antennas have been successfully
demonstrated by using 25 vol. % COP-MgCaTiO2 composites and silver paste,
showing a 16 dB return loss and a peak gain of 6 dBi. It is 50% smaller than a reference
design built with Rogers RT/duroid® 5870 microwave laminate core with a similar
gain.
6
This new class of high-k, low-loss composite materials has shown some promising
attributes for enabling the next generation of high-performance 3D-printed RF and
microwave devices such as antennas operating in the Ku-band, K-band and the mm-
wave frequencies.
The CTE at 20C of the 30 vol. % COP-MgCaTiO2 composites with fillers sintered at
1200C is 84.8 ppm/C, which is about 20 ppm/C lower when compared with the ABS
that is widely used by the research community for 3D printed RF/microwave devices
by FDM [1]-[3], [6]-[9].
Pure COP ZEONOR® (1420R) exhibited a dielectric permittivity r of 2.15 and a
dielectric loss tangent tan δd lower than 0.0016 (as shown in Table 5.3 and Figure 5.13),
and a Tg of 126C. This type of COP has exhibited the lower linear CTE of 62 ppm/°C
(from -25°C to 100°C) and the lowest CTE of 61.4 ppm/°C (at 20°C) amongst the three
variations of 3D-printed COPs, which are better than most of the thermoplastics shown
in Table 7.2, also very close to the thermal performance of high-temperature ULTEM™
9085 resin and PPSF/PPSU materials from Stratasys, Ltd. Hence, it is an excellent
candidate as a thermoplastic matrix for the next generation of FDM-ready EM
composites based on COP polymer matrix.
7
CHAPTER 2 : BACKGROUND AND LITERATURE REVIEW
2.1 Overview of Direct Digital Manufacturing (DDM)
The typical DDM process is a manufacturing methodology to develop systems with the
least amount of human interaction and tooling as possible. This process integrates multi-material
to fabricate functional parts by 3D-printing techniques. 3D-printing is a method to manufacture a
part in a line-by-line and layer-by-layer fashion combining several materials and technologies [1].
In this dissertation, fused deposition modeling (FDM) of pure thermoplastics as shown in Table
5.3 or engineered EM composites as shown in Table 5.4 and Table 7.1 followed by the deposition
of conductive traces by using a printable silver paste (i.e., CB028 from DuPont) through the micro-
dispensing technique are investigated. Another multi-material approaches successfully explored
by the research community is the combination of FDM and electroplating as reported by D’Auria
et al. [18], and polymer poly-jetting with inkjet printing by Kimionis et al. [19].
2.1.1 Fused Deposition Modeling (FDM)
Fused deposition modeling (FDM) are trademarks of Stratasys, Ltd. FDM technology was
patented in 1992 by Scott Crump, founder of Stratasys, Inc. The patent is entitled “Apparatus and
method for creating three-dimensional objects” [20], followed by some improved and revised
versions of the technology and processes as reported in [21], [22]. FDM is also known as fused
filament fabrication (FFF) in the “RepRap” project giving a phrase legally unconstrained in its use
[2]. In some cases, it is known as Plastic Jet Printing (PJP). The FDM or FFF technology uses a
filament feedstock material, pellets or powder-like material. The process starts by melting the
material by passing it through a heated section in the 3D printer. The molten material is then
8
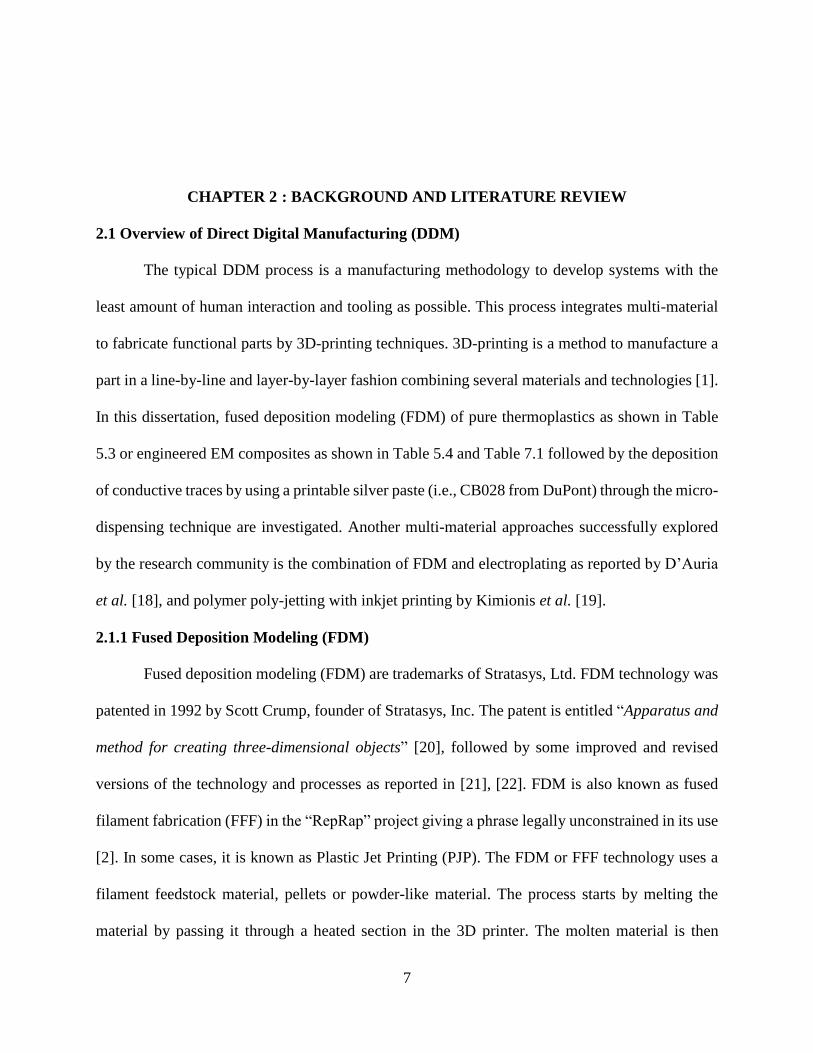
pressed through a small heated nozzle or tip with the desired diameter and expelled onto the surface
of the printed sample [1].
FDM technology is often used for fast prototyping with the primary goal to decrease the
design cycle in a typical R&D process by combining a rapid manufacturing process where several
iterations can be tried at a very low cost until the desired design is achieved by exploring a high-
volume manufacturing process. Typical FDM materials include PLA, ABS, polyphenylsulfone
(PPSF), PC, PEI also known as ULTEM™ resin, and others [23], the 3D-printing process by FDM
is shown in Figure 2.1. These materials in most of the cases exhibit either low Tg or high dielectric
loss at high frequencies, hence limiting their applications to low-power or low-performance
microwave devices, respectively.
2.1.2 Direct-Print Additive Manufacturing (Micro-Dispensing Technique)
Direct print additive manufacturing (DPAM) also known as micro-dispensing is a process
that works similarly to FDM, where pressure is used to push material through a nozzle with the
desired diameter as shown in Figure 2.1 [23]. Typically conductors, resistors, and dielectrics can
be printed through micro-dispensing by mixing chosen materials in solvent suspension [1], [24].
However, the common challenges with the deposition of conductive traces by using slurry type
pastes, such as a printable silver paste (CB028), are the required post-process heating to achieve a
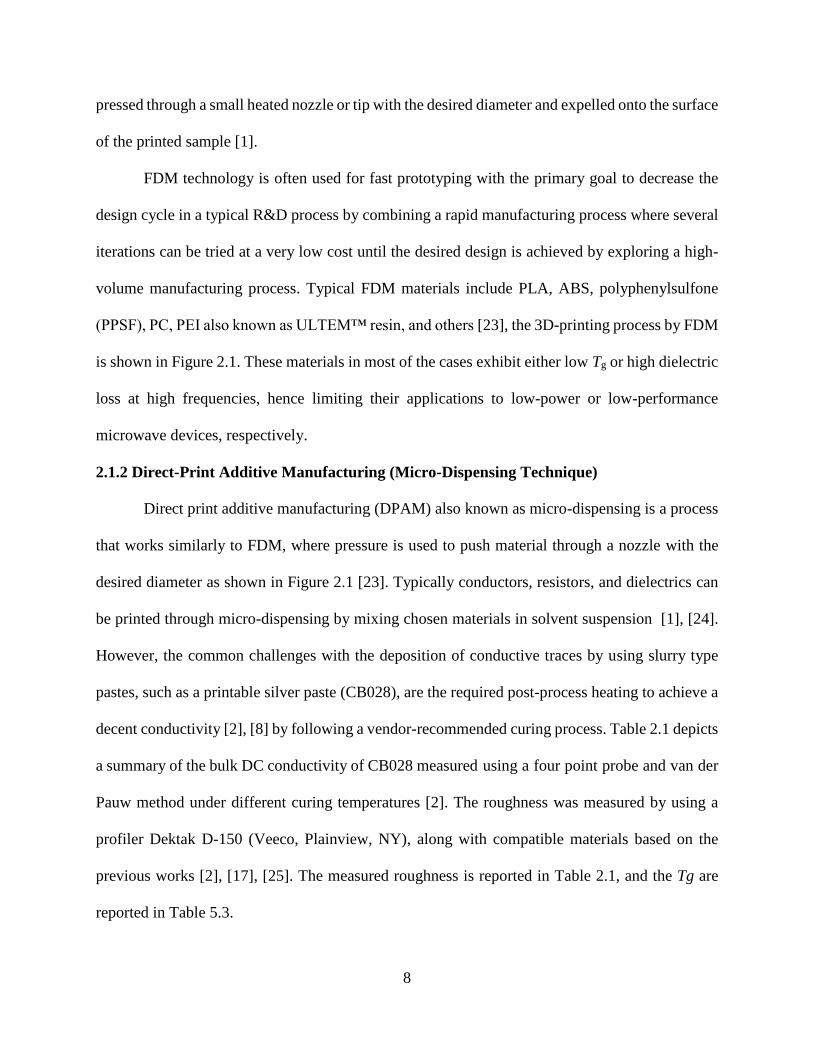
decent conductivity [2], [8] by following a vendor-recommended curing process. Table 2.1 depicts
a summary of the bulk DC conductivity of CB028 measured using a four point probe and van der
Pauw method under different curing temperatures [2]. The roughness was measured by using a
profiler Dektak D-150 (Veeco, Plainview, NY), along with compatible materials based on the
previous works [2], [17], [25]. The measured roughness is reported in Table 2.1, and the Tg are
reported in Table 5.3.
9
Figure 2.1 – Conceptual illustration of a typical FDM or micro-dispensing printing process.
Image courtesy of Church et al. [1] © IEEE 2017. See permission in Appendix A.
Table 2.1 – Bulk DC conductivity of CB028 silver paste
Cure Temp.
(°C)
Conductivity
(S/m), [2]
Compatible
Materials, [2], [17]
Roughness
(Ra), [25]
60 1.75e6 PLA,PP
3.68 µm 90 2.62e6 ABS,PC-ABS,COP
130 3.94e6 COP, PC
160 4.63e6 PEI, PPSF/PPSU
2.2 DDM in the RF/microwave Community
The main goal of DDM processes for microwave applications is to develop structural
microwave electronics by combining several techniques (e.g., FDM, micro-dispensing, pick-and-
place, milling, laser-machining, micro-machining, etc.) preferably with the least amount of human
interaction and tooling as possible. Hence, ideal strategies should avoid micro-machining as much
as possible, due to its subtractive-manufacturing nature that typically involves several processes
(e.g., chemicals, sacrificial layers (waste), masks, etc.). By combining several DDM techniques
and AM systems, it is possible to fabricate non-planar or multilayer microwave structures that
would be difficult to be accomplished by using conventional micro-machining processes along
10
with planar microwave laminates or semiconductor substrates. Some non-planar devices fabricated
by DDM techniques in prior works are shown in Figure 2.2 (b), Figure 2.3, and Figure 2.4.
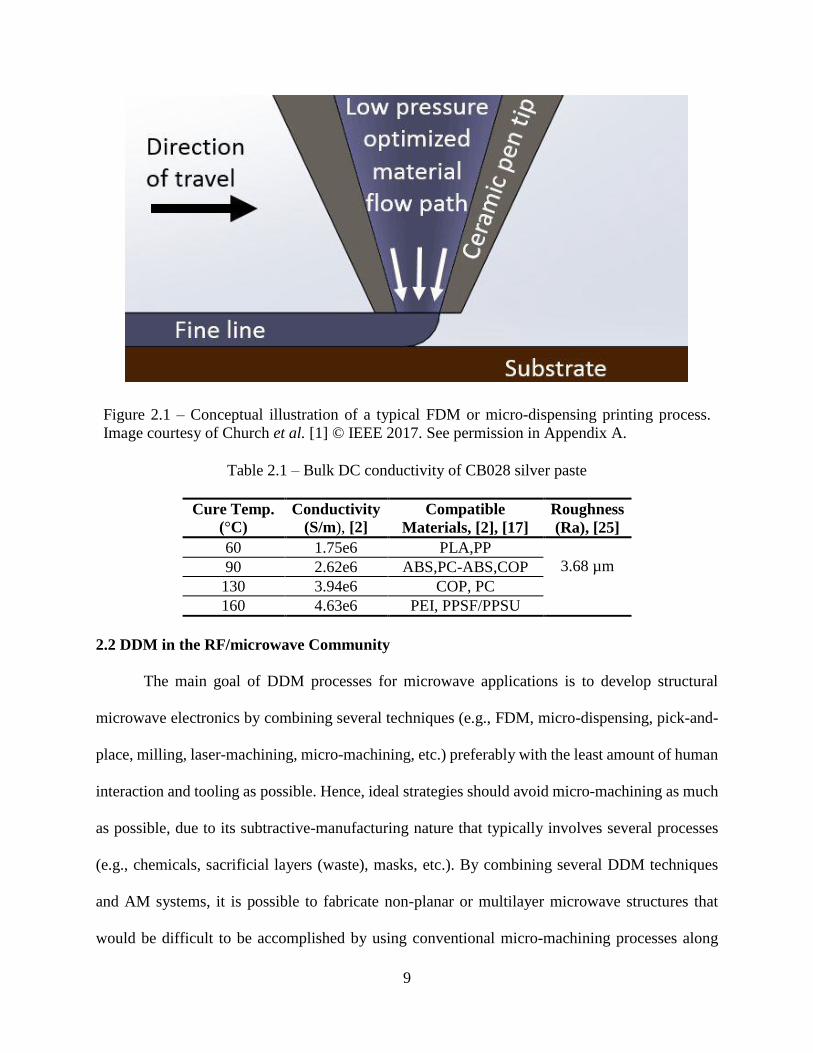
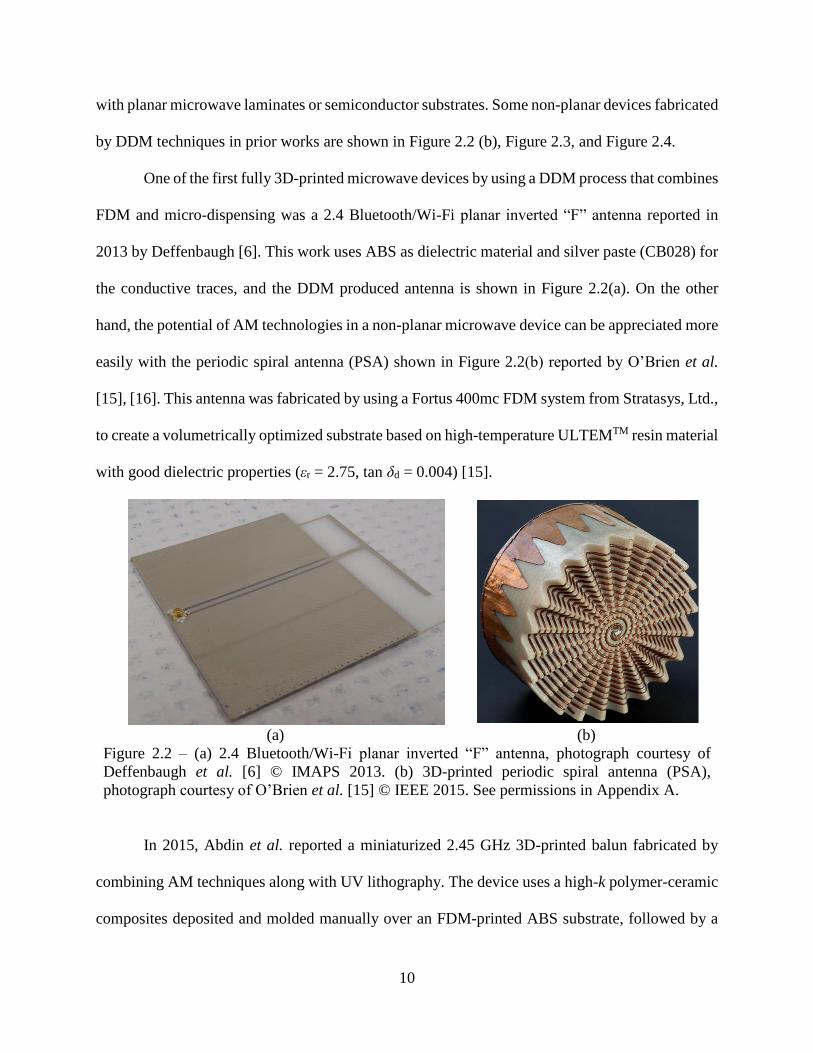
One of the first fully 3D-printed microwave devices by using a DDM process that combines
FDM and micro-dispensing was a 2.4 Bluetooth/Wi-Fi planar inverted “F” antenna reported in
2013 by Deffenbaugh [6]. This work uses ABS as dielectric material and silver paste (CB028) for
the conductive traces, and the DDM produced antenna is shown in Figure 2.2(a). On the other
hand, the potential of AM technologies in a non-planar microwave device can be appreciated more
easily with the periodic spiral antenna (PSA) shown in Figure 2.2(b) reported by O’Brien et al.
[15], [16]. This antenna was fabricated by using a Fortus 400mc FDM system from Stratasys, Ltd.,
to create a volumetrically optimized substrate based on high-temperature ULTEMTM resin material
with good dielectric properties (εr = 2.75, tan δd = 0.004) [15].
(a) (b)
Figure 2.2 – (a) 2.4 Bluetooth/Wi-Fi planar inverted “F” antenna, photograph courtesy of
Deffenbaugh et al. [6] © IMAPS 2013. (b) 3D-printed periodic spiral antenna (PSA),
photograph courtesy of O’Brien et al. [15] © IEEE 2015. See permissions in Appendix A.
In 2015, Abdin et al. reported a miniaturized 2.45 GHz 3D-printed balun fabricated by
combining AM techniques along with UV lithography. The device uses a high-k polymer-ceramic
composites deposited and molded manually over an FDM-printed ABS substrate, followed by a
-20
-10
0
10
-40
-30
-20
-10
0
0.5 1 1.5 2 2.5 3
Bro
adsi
de
Gai
n (d
B)
S11
(dB
)Frequency (GHz)
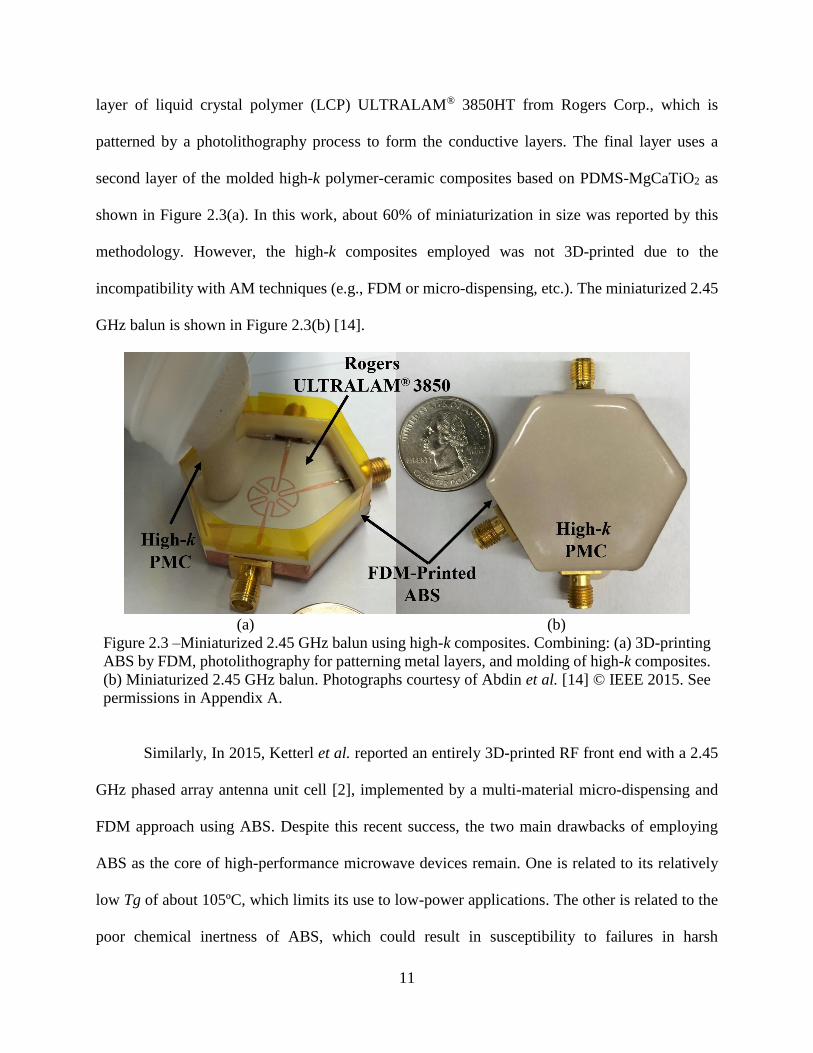
11
layer of liquid crystal polymer (LCP) ULTRALAM® 3850HT from Rogers Corp., which is
patterned by a photolithography process to form the conductive layers. The final layer uses a
second layer of the molded high-k polymer-ceramic composites based on PDMS-MgCaTiO2 as
shown in Figure 2.3(a). In this work, about 60% of miniaturization in size was reported by this
methodology. However, the high-k composites employed was not 3D-printed due to the
incompatibility with AM techniques (e.g., FDM or micro-dispensing, etc.). The miniaturized 2.45
GHz balun is shown in Figure 2.3(b) [14].
(a) (b)
Figure 2.3 –Miniaturized 2.45 GHz balun using high-k composites. Combining: (a) 3D-printing
ABS by FDM, photolithography for patterning metal layers, and molding of high-k composites.
(b) Miniaturized 2.45 GHz balun. Photographs courtesy of Abdin et al. [14] © IEEE 2015. See
permissions in Appendix A.
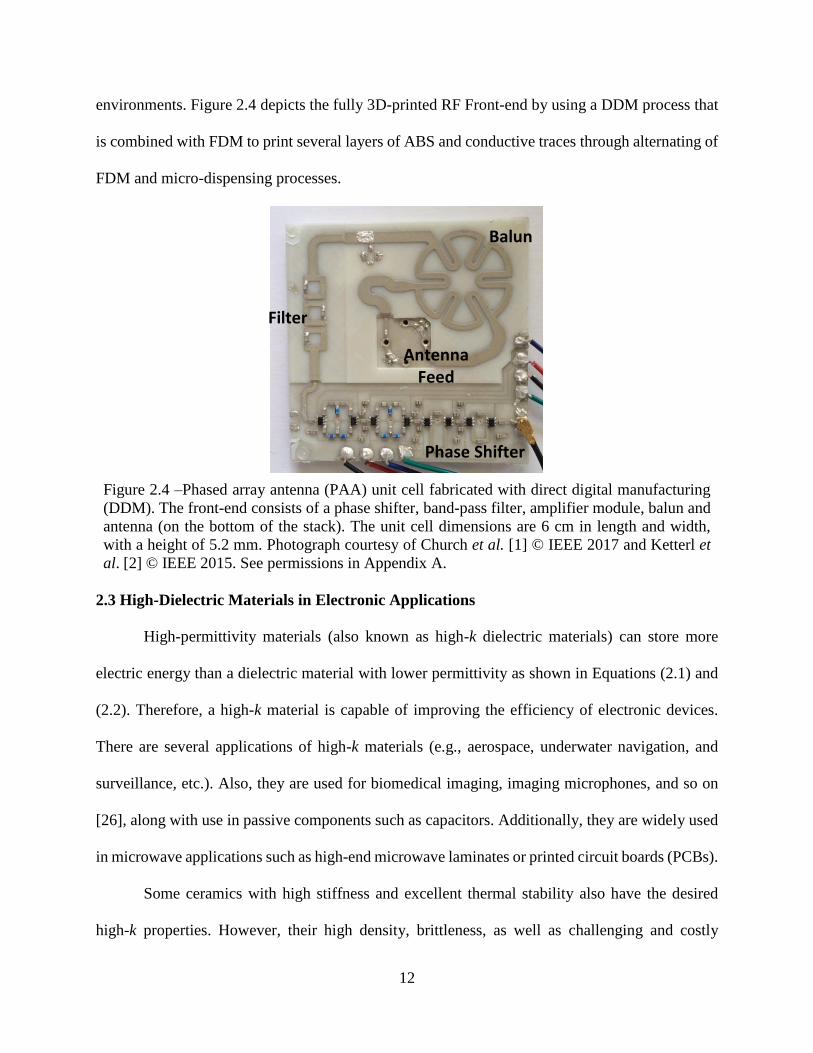
Similarly, In 2015, Ketterl et al. reported an entirely 3D-printed RF front end with a 2.45
GHz phased array antenna unit cell [2], implemented by a multi-material micro-dispensing and
FDM approach using ABS. Despite this recent success, the two main drawbacks of employing
ABS as the core of high-performance microwave devices remain. One is related to its relatively
low Tg of about 105ºC, which limits its use to low-power applications. The other is related to the
poor chemical inertness of ABS, which could result in susceptibility to failures in harsh
12
environments. Figure 2.4 depicts the fully 3D-printed RF Front-end by using a DDM process that
is combined with FDM to print several layers of ABS and conductive traces through alternating of
FDM and micro-dispensing processes.
Figure 2.4 –Phased array antenna (PAA) unit cell fabricated with direct digital manufacturing
(DDM). The front-end consists of a phase shifter, band-pass filter, amplifier module, balun and
antenna (on the bottom of the stack). The unit cell dimensions are 6 cm in length and width,
with a height of 5.2 mm. Photograph courtesy of Church et al. [1] © IEEE 2017 and Ketterl et
al. [2] © IEEE 2015. See permissions in Appendix A.
2.3 High-Dielectric Materials in Electronic Applications
High-permittivity materials (also known as high-k dielectric materials) can store more
electric energy than a dielectric material with lower permittivity as shown in Equations (2.1) and
(2.2). Therefore, a high-k material is capable of improving the efficiency of electronic devices.
There are several applications of high-k materials (e.g., aerospace, underwater navigation, and
surveillance, etc.). Also, they are used for biomedical imaging, imaging microphones, and so on
[26], along with use in passive components such as capacitors. Additionally, they are widely used
in microwave applications such as high-end microwave laminates or printed circuit boards (PCBs).
Some ceramics with high stiffness and excellent thermal stability also have the desired
high-k properties. However, their high density, brittleness, as well as challenging and costly
Balun
Antenna Feed
Filter
Phase Shifter
13
processing conditions hinder their wide use as high-k dielectrics in some practical applications.
Due to the mechanical flexibility and tunable properties, polymer matrix composites (PMC) are a
very attractive option for electronic applications. Nevertheless, typically organic polymers exhibit
quite low dielectric permittivity of 2-3, in very rare cases their relative permittivity can go beyond
10 [26]. And this is the main reason why engineered composite materials play a significant role in
microwave applications, and it will be discussed further in the following chapters.
Some strategies to engineer PMC with well-tailored EM properties have been explored in
the last years [26], such as random composites of polymers, field structured composites, and
synthesis of new polymers. In particular, to raise the dielectric permittivity, the addition of high-k
fillers to form polymer-ceramic composites with the fillers ranging from metals, ceramics, carbon-
based materials, and organic fillers (e.g., conductive oligomer and conductive polymer matrices)
have shown some great promises [26]. In this dissertation, ceramic-polymer composites prepared
by adding sintered high-k ceramic fillers in a strategically-chosen polymer host matrix have been
systematically investigated, which are detailed in the following chapters.
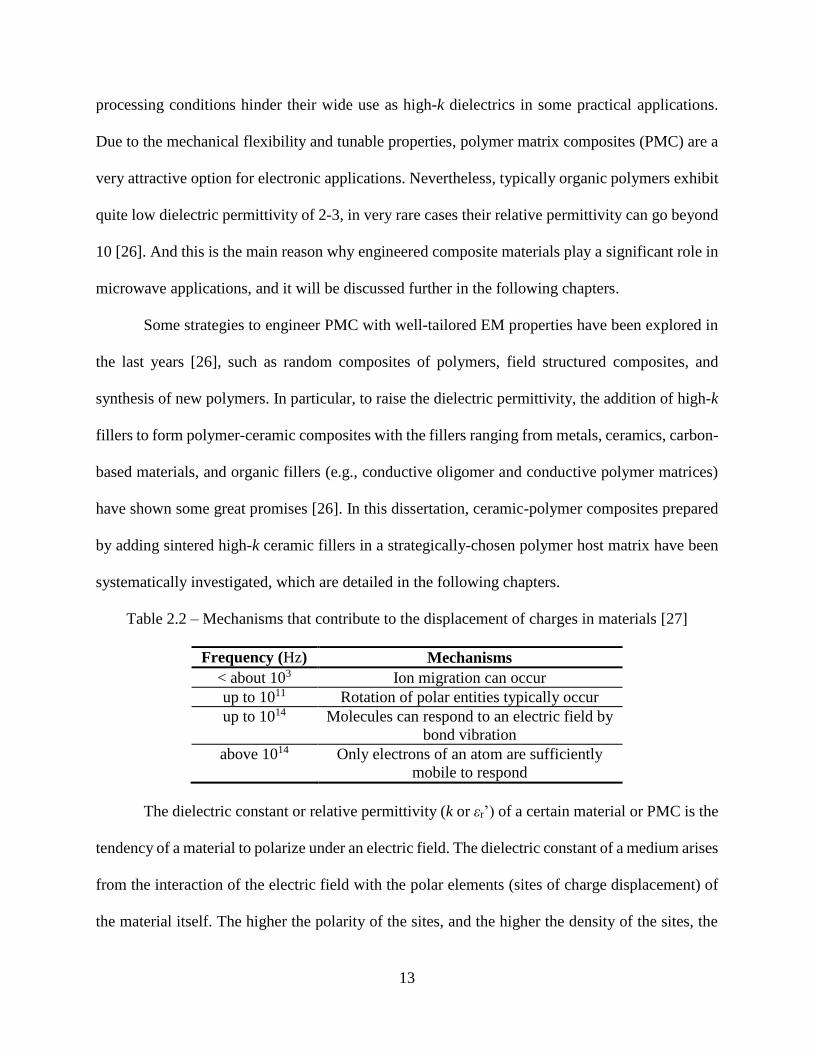
Table 2.2 – Mechanisms that contribute to the displacement of charges in materials [27]
Frequency (Hz) Mechanisms
< about 103 Ion migration can occur
up to 1011 Rotation of polar entities typically occur
up to 1014 Molecules can respond to an electric field by
bond vibration
above 1014 Only electrons of an atom are sufficiently
mobile to respond
The dielectric constant or relative permittivity (k or εr’) of a certain material or PMC is the
tendency of a material to polarize under an electric field. The dielectric constant of a medium arises
from the interaction of the electric field with the polar elements (sites of charge displacement) of
the material itself. The higher the polarity of the sites, and the higher the density of the sites, the
14
higher the dielectric constant typically is for a certain material as elaborated by Horn [27]. The
conventional mechanisms that contribute to the displacement of charges in a material vary with
frequency as shown in Table 2.2. Hence, as frequency increases the dielectric contact of a material
tends to decrease depending on its composition as explained by Horn [27].
The dielectric loss or loss tangent (tan δd or εr”/εr’) is the ratio of the apparent power
consumed by a material to the real power consumed. Typically, the dielectric loss is reduced when
the time it takes for a dipole moment of a molecule reaches equilibrium with the electric field
rapidly. Usually, the dielectric loss arises from the molecular and atomic friction caused by the
charge displacement during the polarization process [27]. Ideally, a lossless material would switch
polarization in synchronization with the applied electric field. Dielectric loss tangent (tan δd) may
increase or decrease by frequency depending on the properties of the material. The dielectric loss
often increases by frequency, and it is one of the most critical material parameters that needs to be
engineered as low as possible at high frequencies for high-performance microwave applications.
2.4 Fundamental Characteristics of High-k Composites
2.4.1 Capacitance and Electric Energy Storage of Materials
A capacitor is made of two conductive electrodes (plates) separated by a dielectric material.
When a potential (V) is applied between these electrodes, the capacitor can store electric charge
(Q) in coulombs given by Equation (2.1):
Q = CV (2.1)
where C is the capacitance in farads (F). Also, the capacitance of a capacitor with parallel plate
electrodes is given by Equation (2.2):
C = 휀0휀r
𝐴
𝑑
(2.2)
15
where ε0 is the dielectric permittivity of vacuum 8.85418 pF/m, εr is the relative permittivity of the
dielectric material, A is the area of overlap of the two parallel plate electrodes in m2, and d is the
separation between the parallel plate electrodes in m.
2.4.2 Polarization and Relaxation in Dielectric Materials
As explained in Table 2.2 the permittivity of materials depends on the frequency of the
applied electric field, and generally, the frequency dependence reveals the possible existence of
dispersive behaviors over the electromagnetic spectrum [26]. Dielectric relaxation is the temporary
delay in the dielectric permittivity of a material usually caused by the time delay in molecular
polarization under a changing electric field in a dielectric medium. The relaxation can be described
in terms of permittivity as a function of frequency, which can be outlined by the Debye Equation
(2.7). The complex permittivity of a material as a function of frequency is given by Equation (2.3):
휀∗(𝜔) = 휀′(𝜔) + 𝑗휀"(𝜔) (2.3)
where ω is the angular frequency ω=2πf, and ε’(ω) is the real part of the dielectric permittivity,
which represents the contribution to the polarization responsible for the energy storage in the
material. The ε”(ω) is the imaginary part, known as the loss factor, typically shows the dissipative
effects with a finite value higher than zero in dispersive regions [26]. The dissipation behavior
(dielectric loss or loss tangent) can be expressed by dielectric loss tangent given by Equation (2.4):
tan 𝜕(𝜔)𝑑 =
휀"(𝜔)
휀′(𝜔)
(2.4)
In a homogeneous material, such as a PMC, the polarization and ε”(ω) result from several
contributions. As per Dang et al. [26], the individual contribution to ε”(ω) can be added up to give
the effective relative complex permittivity (ε*eff) expressed by Equation (2.5):
휀∗𝑒𝑓𝑓(𝜔) = 휀∗(𝜔) + ∑휀∗
𝑀𝑊,𝑖(𝜔)
𝑖
+ 𝑗(𝜎𝐷𝐶
𝜔휀0) (2.5)
16
where ε*(ω) is the permittivity of all components, ε*MW,i(ω) is the permittivity of interfaces, and
σDC is the DC electrical conductivity. Equation (2.5) can be simplified to Equation (2.6):
휀∗
𝑒𝑓𝑓(𝜔) = (휀′(𝜔) + ∑휀′𝑀𝑊,𝑖(𝜔)
𝑖
) + 𝑗 (휀"(𝜔) + ∑휀"𝑀𝑊,𝑖(𝜔)
𝑖
+ (𝜎𝐷𝐶
𝜔휀0
)) (2.6)
where ε’MW,i accounts for the ith interfacial contribution. As per Dang et al. all the dispersive
phenomena related with the intrinsic polarization are considered by ε*(ω) in Equation (2.5). In the
presence of multiple intrinsic relaxations, ε*(ω) can be expressed as a superposition of individual
contributions. Each of these relaxation processes is either orientational or interfacial. In the case
of a material based on identical and non-interacting dipoles whose relaxation is characterized by a
unique time constant τ (also known as dipole relaxation time), Debye derived a relaxation function
for the complex permittivity in the dispersion region [26], [60]. The Debye model in the frequency
domain is given by Equation (2.7) reported by Dang et al. [26]:
휀∗(𝜔) = 휀∞ +휀𝑠 − 휀∞
1 + 𝑗𝜔𝜏
(2.7)
where εs and ε∞ are the static low-frequency (relaxed) and the high-frequency (unrelaxed) values
of permittivity, respectively. Equation (2.7) can be rewritten to show the real part given by
Equation (2.8):
휀′(𝜔) = 휀∞ +휀𝑠 − 휀∞
1 + 𝜔2𝜏2
(2.8)
While the Equation (2.7) can be rewritten showing the imaginary part given by Equation (2.9):
휀"(𝜔) =
(휀𝑠 − 휀∞)𝜔𝜏
1 + 𝜔2𝜏2
(2.9)
In general, the Debye model tends to fail when describing the relaxation phenomena in
complex systems. Havriliak-Negami model proposed a more accurate model by phenomenological
approach [26], [29], [60] given by Equation (2.10), which includes the possibility of distribution
17
of different time constants through the introduction in Equation (2.8) of two shape parameters α
and β [26] as shown in Equation (2.10):
휀"(𝜔) = 휀∞ +
(휀𝑠 − 휀∞)
[1 + (𝑗𝜔𝜏)1−𝛼]𝛽 (0 < 𝛼 < 1, 0 < 𝛽 < 1)
(2.10)
It is worthwhile mentioning that the dielectric losses in materials not only dissipate energy
but also deteriorate the insulation properties of materials. The power density (W) dissipated into
the dielectric medium is a function of electric field given by Equation (2.11):
W ≈ ω|�⃗� |2휀"
𝑒𝑓𝑓(𝜔) (2.11)
2.4.3 Dielectric Strength of Polymer Matrix Composites (PMC)
In 2012, Dang et al. [26] reported several relationships to estimate the dielectric strength
in PMCs. Since high-k PMCs are typically used to store electric energy, the material dielectric
strength is an important parameter that should be taken into account during engineering composites
for electronic applications. The maximum energy storage density (Wmax) in Jm-3 is calculated by
Equation (2.12):
W𝑚𝑎𝑥 ≈
1
2휀0휀r𝐸
2𝑏𝑟𝑒𝑎𝑘
(2.12)
where Ebreak is the material dielectric strength. Considering a homogenous material and elastic
body at low strains, the nominal breakdown field of the materials is given by Equation (2.13):
E𝑏𝑟𝑒𝑎𝑘 =𝑉𝑏𝑟𝑒𝑎𝑘
𝑡= 𝑒−1/2√
𝑌
2휀0휀r≅ 0.6√
𝑌
2휀0휀r′
(2.13)
where Y is the elastic modulus, and εr is the relative dielectric permittivity of the material, ε0 is the
permittivity of vacuum, Vbreak is the breakdown voltage of the sample with thickness t at rest. It is
observed that by increasing the relative dielectric permittivity in a composite material, the
dielectric strength tends to decrease. Equation (2.13) provides a good approximation [26]. Another
18
model is based on local field theory of dielectric media, which considers a material exposed to an
electric field �⃗� . As a result, the local electric field (Elocal), which is also known as the Lorentz local
field, is induced given by Equation (2.14). It is the field that acts on an individual polarizable unit
(e.g., molecule or atom) [26].
Elocal =
휀′ + 2
3�⃗�
(2.14)
where ε’ is the relative permittivity of the material adjacent to the local polarizable unit (not
including the unit itself). Another relationship that takes into account the relative permittivity and
dielectric strength of the polymer matrix (εm’, Ebreak-matrix), as well as these properties of the final
composites (εc, Ebreak-composite) is given by Equation (2.15). It typically provides a good property
estimation [26].
휀𝑚′ + 2
3Ebreak,matrix =
휀𝑐′ + 2
3Ebreak,composite
(2.15)
2.5 Functional Composite Materials in Microwave Applications
Preparation of PMC materials comprised of low-loss polymers loaded with high-
permittivity ceramic particles is a very useful technique to raise the dielectric permittivity and
explore miniaturization of microwave components by increasing the index of refraction in
microwave materials given by Equation (2.16). In particular, dielectric ceramics have been widely
used for microwave applications as the key element of dielectric resonators and filters [30]-[31].
Due to the ease of processing, excellent compatibility with additive manufacturing and
their versatile properties (e.g., thermal, mechanical and electromagnetic), low-cost polymer
composites have emerged as a promising functional material for microwave device applications
[32]. For instance, antenna miniaturization has been demonstrated by using composite materials
with evenly dispersed high-permeability [32]-[37] or high-permittivity ceramic fillers [38]-[42], as
19
well as mosaics of two dielectric materials [43]-[46]. The latter composites are arranged according
to a particular design known as “textured dielectrics” in the microwave community, which
employs spatially variant dielectric composites [43] with the index of refraction n and also the
miniaturization factor is given by Equation (2.16):
𝑛 = √𝜇r휀r (2.16)
Similarly, the zero-order antenna bandwidth over a magneto-dielectric substrate with thickness t
can be approximated by Equation (2.17) as reported by Mosallaei et al. [37]:
BW ≈96√
rr
𝑡0
√2[4 + 17√rr]
(2.17)
The well-known Equation (2.18) gives the wavelength of a signal propagating through a medium.
𝑔 =
0
√𝜇r휀r =
𝑐0
𝑓√𝜇r휀r
(2.18)
where λg, λ0, c0, µr, and εr are the wavelength in the material, the wavelength in vacuum, the speed
of light in free-space, relative permeability and relative dielectric permittivity, respectively [32],
[33].
In 2006, Koulouridis et al. reported characteristics of several high-permittivity flexible
polymer-ceramic composites by loading Polydimethylsiloxane (PDMS) (Dow Corning, Midland,
MI) with ceramic powders, which were supplied by (Trans-Tech, Inc., Adamstown, MD and Ferro
corp., Cleveland, OH). They reported PDMS-BT-BaTiO3 composites with measured dielectric
properties of r of 20 and tan δd lower than 0.04 as well as PDMS-MgCaTiO2 and PDMS-BiBaNdTi
composites with measured r of about 8.5 and tan δd lower than 0.009 [39]. Nonetheless, these
composites were only characterized up to 1 GHz, which renders uncertainties for applications
20
beyond the ultra-high-frequency (UHF) range given the fact that dielectric properties of EM
composite materials are frequency dependent.
The work reported by Koulouridis et al. in 2006 has allowed the microwave community to
exploit this approach in the last decade and develop new methodologies for microwave composite
materials. This method has been widely explored more recently as reported by Cure [41], by Shi
et al. [42], our group [38], [40] and some variations by Koulouridis et al. [39]. Tunable magneto-
dielectric composites have been reported previously by Morales et al. by using PDMS embedded
with chemically synthesized Fe3O4 nanoparticles [34], [35], [36]. Antenna miniaturization has
been achieved by using composite materials with embedded high-permittivity [17], [10], [38]-[42]
and [49] or high-permeability [32]-[37] particle fillers.
In 2013, Cure et al. reported a newly developed RF planar substrate that is composed of
PDMS with embedded NdTiO3 ceramic powders at different loading concentrations. Specifically,
20 vol. % PDMS-NdTiO3 composites were built into a 4 GHz microstrip patch antenna which
exhibited a gain of 3 dBi along with a 5.8% bandwidth and a 42% size reduction [41]. Nonetheless,
all composites above were filled with unsintered micro-fillers and were only characterized up to 1
GHz. In 2014, Shi et al. reported the fabrication of a PDMS-SrTiO3 composite sample with tested
r of 8.40 and tan δd of 0.017 up to 10 GHz [42]. In July 2015, Zhang et al. reported a high-k and
low-loss composite material based on Bisphenol-A cyanate ester resin (BADCy) and
Ni0.5Ti0.5NbO4 fillers sintered at 700C with measured r of 22.79 and tan δd of about 0.00417 up
to 9 GHz [47]. This work shows great potential for its applications in high EM frequencies. Despite
this recent success, these molded rigid composites are only suited as a direct substitute of planar
printed circuit boards (PCBs). In 2014, the temperature dependence of dielectric properties (at
frequencies from 100 Hz to 1 MHz) for 0.94MgTiO3-0.06Ca0.8Sr0.2TiO3 (MT-CST) ceramics
21
sintered at 1300ºC for four hours was reported by Zhang et al. These ceramics were prepared by
the conventional solid-state reaction process [48]. In 2015, we published a study of ceramic-
thermoplastic composites based on cyclo-olefin polymer (COP) with sintered ceramic fillers well
suited for FDM. In particular, 25 vol. % COP- MgCaTiO2 have exhibited r of 4.74 and tan δd
lower than 0.0018 up to 17 GHz, while 25 vol. % COP-Ba0.55Sr0.45TiO3 have exhibited r of 4.88
and tan δd lower than 0.0071 at frequencies up to 10 GHz [17], [49].
2.6 Expanding the Materials Options for 3D-Printed Microwave Applications
Currently, the microwave community is exploring engineered composite materials that are
compatible with AM 3D-printing technologies, such as FDM, due to the great potential as enabler
methodology for the next generation of wireless devices in the Internet of Things (IoT) era. In
particular, the work reported by Grant et al. [73], by Isakov et al. [74], by Castles et al. [75], by
Arbaoui et al. [81] and by Castro et al. in this dissertation work [10], [17], [49], [50] are focused
on EM composites for microwave applications by using FDM as a chosen 3D-printing technology.
In 2015, Isakov et al. reported three types of composite materials with high dielectric
permittivity of about seven based on ABS loaded with BaTiO3 or Ba0.64Sr0.36TiO3 micro-fillers
[74]. However, these 3D-printed ABS-composites by a FDM process has a relatively low Tg of
about 100°C as listed in Table 5.3 and they exhibit a high dielectric loss tangent greater than 0.034,
which is worse than the dielectric losses of even low-performance FR-4 laminates. Due to the high
dielectric losses of the bulk BaTiO3 or Ba0.64Sr0.36TiO3 ceramic powders, the composites based on
these two types of fillers are anticipated to exhibit high dielectric losses as reported in [40], [49],
and [79].
Similarly, Castles et al. also reported a composite material with a dielectric permittivity of
8.72 along with a high dielectric loss tangent of 0.0273 [75], which is worse than that of the FR-4
22
laminates, thus hindering its applications for high gain antennas or high-performance microwave
devices. On the other hand, Isakov et al. [74] reported another type of composite material based
on Polypropylene (PP) loaded with CaTiO3 with a εr of 5 and a fairly low dielectric loss tangent
tan δd of 0.0051. Despite the decent dielectric properties, the loss is still noticeably higher than that
of state-of-the-art microwave laminates that typically exhibit dielectric loss tangents lower than
0.003. Also, the Tg of PP is about -14°C and the melting temperature is 176°C as shown in Table
5.3, which are too low for lots of practical device applications.
2.7 Motivation
In the last five years, several RF/microwave devices have been successfully demonstrated
by using 3D AM technologies as reported in [2]-[9], which makes AM a promising enabler for the
next generation of high-frequency devices and systems. However, there are important challenges
to be overcome to adopt the AM technology for microwave device applications. In particular, the
lack of functional EM materials, such as high-permittivity and low-loss 3D printable materials,
severely hinders the ability for AM to be employed for manufacturing RF/microwave electronics
at high frequencies (e.g., Ku, K, and V bands). Also, the lack of high-conductivity printable inks
for DPAM is another key challenge that is currently being investigated and addressed by some
researchers in the microwave community.
The primary goal of this dissertation is to develop a generic methodology for preparation
of EM composites with well-tailored EM properties for fully 3D-printed and high-performance
RF/microwave devices fabricated by DDM processes, by using FDM and micro-dispensing for the
deposition of ceramic-thermoplastic composites and conductive traces, respectively. It is
worthwhile mentioning that some of the EM composites might be compatible with other 3D-
printing technologies or planar processes such as high-frequency microwave laminates.
23
2.7.1 Comparison of High-Performance FDM Microwave Composites and Thermoplastics
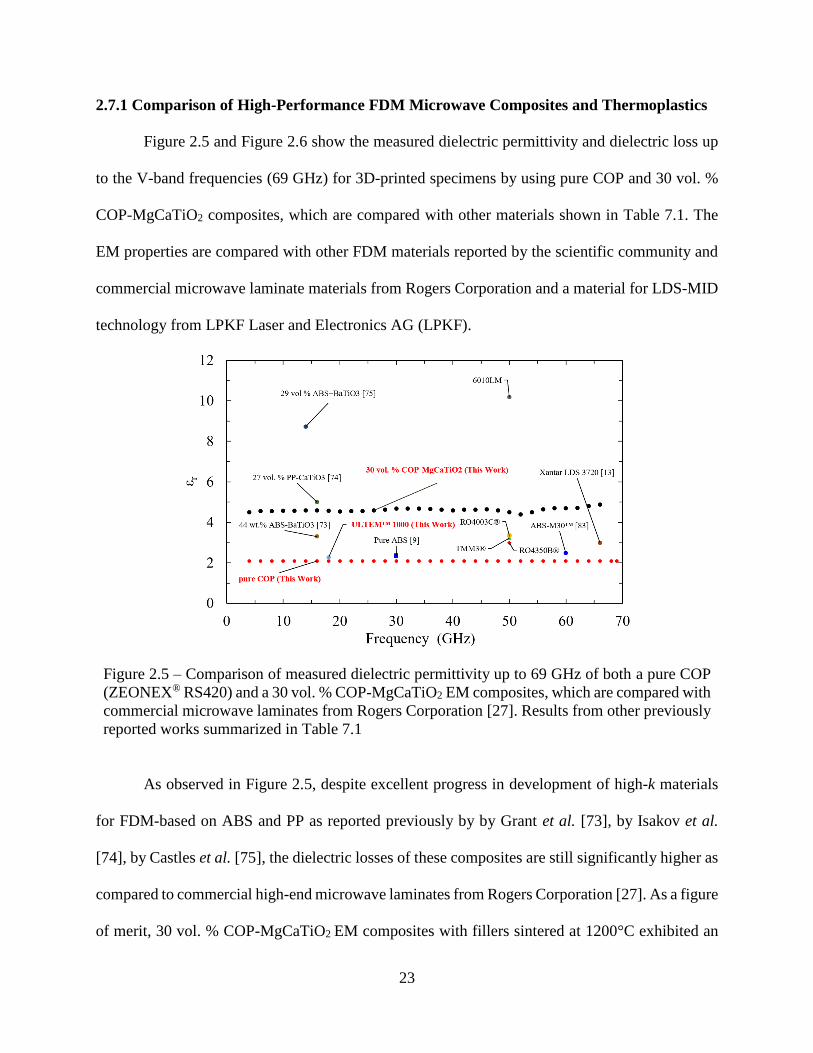
Figure 2.5 and Figure 2.6 show the measured dielectric permittivity and dielectric loss up
to the V-band frequencies (69 GHz) for 3D-printed specimens by using pure COP and 30 vol. %
COP-MgCaTiO2 composites, which are compared with other materials shown in Table 7.1. The
EM properties are compared with other FDM materials reported by the scientific community and
commercial microwave laminate materials from Rogers Corporation and a material for LDS-MID
technology from LPKF Laser and Electronics AG (LPKF).
Figure 2.5 – Comparison of measured dielectric permittivity up to 69 GHz of both a pure COP
(ZEONEX® RS420) and a 30 vol. % COP-MgCaTiO2 EM composites, which are compared with
commercial microwave laminates from Rogers Corporation [27]. Results from other previously
reported works summarized in Table 7.1
As observed in Figure 2.5, despite excellent progress in development of high-k materials
for FDM-based on ABS and PP as reported previously by by Grant et al. [73], by Isakov et al.
[74], by Castles et al. [75], the dielectric losses of these composites are still significantly higher as
compared to commercial high-end microwave laminates from Rogers Corporation [27]. As a figure
of merit, 30 vol. % COP-MgCaTiO2 EM composites with fillers sintered at 1200°C exhibited an
24
excellent balance of high-permittivity and low dielectric loss when it is compared with results by
prior works [73], [74], and [75]. Moreover, the FDM-ready composites exhibit better dielectric
properties than pure ABS-M30™ characterized at 60 GHz reported by Bisognin et al. [83], which
are almost on par with some high-end microwave laminates, as seen in Figure 2.5 and Figure 2.6
[27].
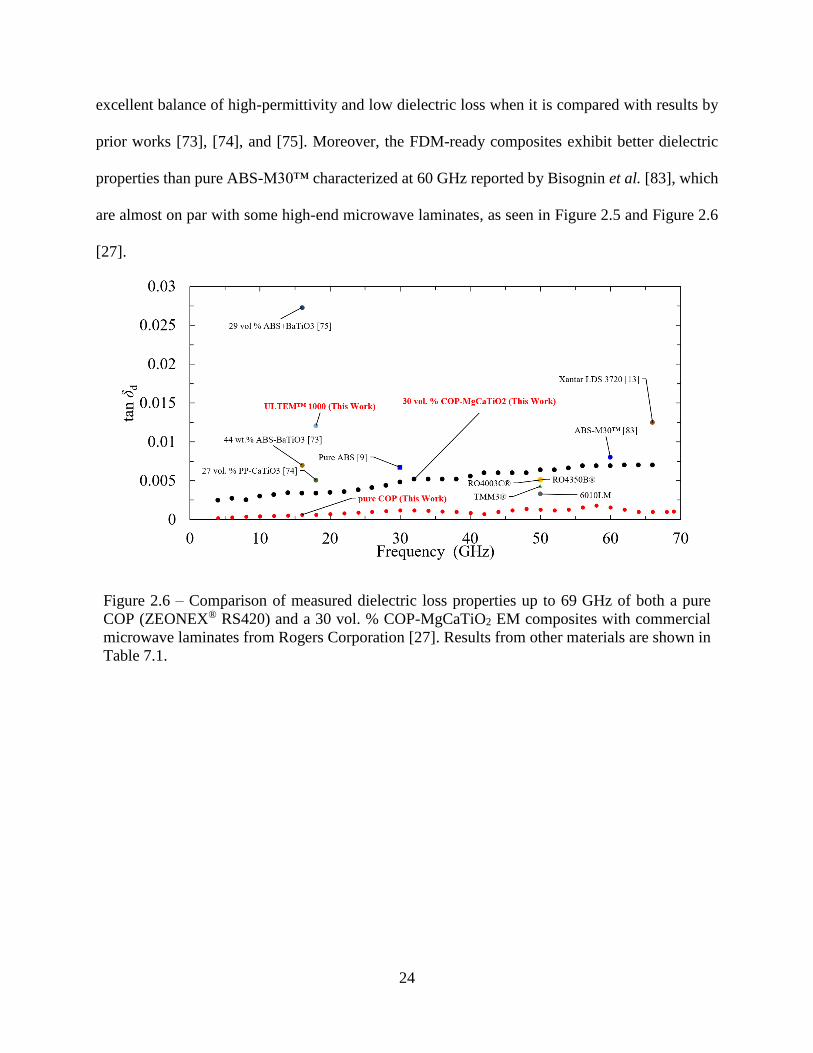
Figure 2.6 – Comparison of measured dielectric loss properties up to 69 GHz of both a pure
COP (ZEONEX® RS420) and a 30 vol. % COP-MgCaTiO2 EM composites with commercial
microwave laminates from Rogers Corporation [27]. Results from other materials are shown in
Table 7.1.
25
CHAPTER 3 :
ENHANCEMENT OF MICROWAVE PROPERTIES IN COMPOSITE MATERIALS
3.1 Note to Reader
Portions of this chapter, including figures have been submitted to peer-review in the
Journal of American Ceramic Society [76].
3.2 Introduction
One of the key goals of this chapter is to evaluate the impact of a high-temperature sintering
process as an effective enhancing strategy on the resultant dielectric and loss properties (i.e.,
relative permittivity εr and dielectric loss tangent tan δd) of EM composite materials composed of
Polydimethylsiloxane (PDMS) loaded with sintered MgCaTiO2 and TiO2 ceramic fillers. Five
types of flexible high-permittivity and low-loss polymer-ceramic EM composite materials based
on PDMS elastomer host-matrix reinforced by MgCaTiO2 and TiO2 microfillers are rigorously
investigated and presented. The ceramic fillers are analyzed with x-ray diffraction (XRD), energy
dispersive spectroscopy (EDS) and scanning electron microscope (SEM) for morphology and
crystallinity before and after a high-temperature sintering process steps. All the EM composites
were loaded with ceramic fillers sintered at temperatures up to 1500C with concentrations as high
as 49% by volume. The TiO2 and MgCaTiO2 based composites were characterized up to 17 GHz
by the cavity resonator method and at 5 GHz using a custom-built near-field microwave
microscopy (NFMM) system. For frequencies up to 17 GHz, the 36 vol. % PDMS-MgCaTiO2
composites with 1100C sintered fillers have exhibited a stable r of 10.27 and tan δd lower than
0.021, which correspond to an enhancement of 20% in relative permittivity and 29% in dielectric
26
loss tangent when compared to the specimen loaded with unsintered raw ceramic powders.
Furthermore the 36 vol. % PDMS-MgCaTiO2 composites with 1500C sintered fillers have
exhibited a stable r of 9.93 and loss tangent (tan δd) lower than 0.021 for frequencies up to 17
GHz, which correspond to an enhancement of 16.41% in relative permittivity and 28% in dielectric
loss tangent. Evidently, there is an optimum sintering temperature for improving the effective
dielectric and loss properties of MgCaTiO2 microfillers. The 49 vol. % PDMS-MgCaTiO2
composites with 1100C sintered fillers have exhibited a r of 16.33 and loss tangent (tan δd) lower
than 0.021 at 19 GHz. Similarly, 38 vol. % PDMS-TiO2 sample with particles sintered at 1100C
has exhibited a dielectric permittivity of r of 9.73 and slightly a higher loss tangent (tan δd lower
than 0.031) at frequencies up to 17 GHz, which suggests an enhancement of 9.8% in relative
permittivity but a 27% increase of the dielectric loss tangent as compared to those of specimen
loaded with unsintered raw TiO2 powders. This indicates that an optimal sintering
condition/temperature exists.
Meanwhile, 38 vol. % PDMS-TiO2 composites with fillers sintered at 1500C have shown
a stable r of 8.3 and loss tangent (tan δd) lower than 0.025 at frequencies up to 17 GHz, which
suggests a slight decrease of 7% in relative permittivity and a 3% increase of the dielectric loss
tangent. The uniform dispersion of sintered ceramic high-k microfillers has effectively increased
the effective permittivity for all the samples compared to that of pure PDMS host matrix.
Meanwhile, the inclusion of the ceramic powders after the sintering process, in particular, has
significantly decreased the dielectric losses of the MgCaTiO2 based composite samples up to 30%.
The near-field microwave microscopy (NFMM) analysis revealed that the MgCaTiO2 ceramic
particles are more uniformly distributed than the TiO2 particles over an area of 50 m 50 m,
which might contribute to the superior improvements in the dielectric and loss properties.
27
3.3 Experimental Procedure
In this chapter three sintering temperatures up to the ceramics’ melting points reported in
Table 3.1 are evaluated to find the best sintering conditions to enhance the effective dielectric and
loss properties at microwave frequencies in composite materials based on PDMS. For this purpose,
polymer-ceramic composite samples were prepared with MgCaTiO2 or TiO2 fillers under “as-is”
unsintered condition or sintered at 1100C and 1500C for 3 hours. The high-temperature sintering
process is a critical step for enhancing the dielectric and loss properties of the ceramic powders.
The assessment of dielectric properties was carried out via cavity resonators based on the cavity
perturbation theory [57]-[59]. A 0.5 mm-thick molded thin-sheet specimen composed of different
volume concentrations of MgCaTiO2 or TiO2 ceramic fillers (sintered at 1100C or 1500ºC for
three hours) loaded PDMS composites were prepared and characterized. The 36 vol. % PDMS-
MgCaTiO2 composite molded specimen has exhibited a measured r of 10.27 and loss tangent tan
δd lower than 0.021 between 0.4 GHz and 17 GHz. Furthermore, a PDMS-MgCaTiO2 composite
sample loaded with 49 vol. % MgCaTiO2 has exhibited a measured r of 16.33 and a loss tangent
tan δd lower than 0.021 between 0.4 GHz and 20 GHz. Similarly 38 vol. % PDMS-TiO2 sample
with particles sintered at 1100C has exhibited a dielectric permittivity of r of 9.73 and a loss
tangent (tan δd lower than 0.031) at frequencies up to 17 GHz. Meanwhile, a 38 vol. % PDMS-
TiO2 composite sample with TiO2 microfillers sintered at 1500C has shown r of 8.3 and tan δd
lower than 0.025 between 0.4 GHz and 17 GHz. Moreover, the flexibility of the high-k composite
substrates seems to be well suited for future RF/microwave device prototypes that conform to
uneven or curved surfaces for applications up to the Ku-band and K-band frequencies.
In this study, the best EM characteristics were achieved for composite specimens filled
with either MgCaTiO2 or TiO2 particles, which were sintered at 1100C for three hours, indicating
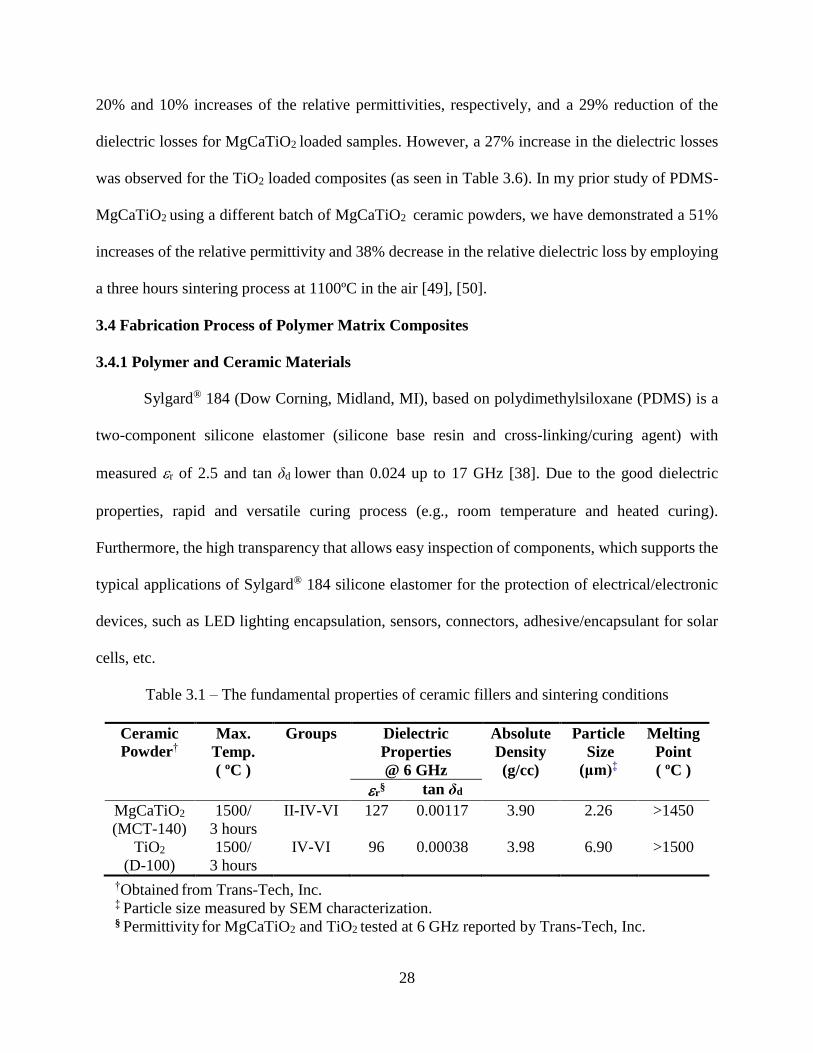
28
20% and 10% increases of the relative permittivities, respectively, and a 29% reduction of the
dielectric losses for MgCaTiO2 loaded samples. However, a 27% increase in the dielectric losses
was observed for the TiO2 loaded composites (as seen in Table 3.6). In my prior study of PDMS-
MgCaTiO2 using a different batch of MgCaTiO2 ceramic powders, we have demonstrated a 51%
increases of the relative permittivity and 38% decrease in the relative dielectric loss by employing
a three hours sintering process at 1100ºC in the air [49], [50].
3.4 Fabrication Process of Polymer Matrix Composites
3.4.1 Polymer and Ceramic Materials
Sylgard® 184 (Dow Corning, Midland, MI), based on polydimethylsiloxane (PDMS) is a
two-component silicone elastomer (silicone base resin and cross-linking/curing agent) with
measured r of 2.5 and tan δd lower than 0.024 up to 17 GHz [38]. Due to the good dielectric
properties, rapid and versatile curing process (e.g., room temperature and heated curing).
Furthermore, the high transparency that allows easy inspection of components, which supports the
typical applications of Sylgard® 184 silicone elastomer for the protection of electrical/electronic
devices, such as LED lighting encapsulation, sensors, connectors, adhesive/encapsulant for solar
cells, etc.
Table 3.1 – The fundamental properties of ceramic fillers and sintering conditions
Ceramic
Powder†
Max.
Temp.
( ºC )
Groups Dielectric
Properties
@ 6 GHz
Absolute
Density
(g/cc)
Particle
Size
(μm)‡
Melting
Point
( ºC )
r§ tan δd
MgCaTiO2
(MCT-140)
1500/
3 hours
II-IV-VI 127 0.00117 3.90 2.26 >1450
TiO2
(D-100)
1500/
3 hours
IV-VI 96 0.00038 3.98 6.90 >1500
†Obtained from Trans-Tech, Inc. ‡ Particle size measured by SEM characterization. § Permittivity for MgCaTiO2 and TiO2 tested at 6 GHz reported by Trans-Tech, Inc.
29
Both MgCaTiO2 and TiO2 ceramic powders utilized in this study, which are intentionally
agglomerated into 50-100 µm spherical granules for improved powder flow and compaction, are
acquired from Trans-Tech, Inc. [53]. The important dielectric properties at 6 GHz and sintering
conditions for the aforementioned ceramic particles are summarized in Table 3.1.
3.4.2 Preparation of Composite Materials and Specimens
For the high-temperature sintering process, zirconia trays are used together with two
sintering furnaces both operating in air. One is an Omegalux LMF-3550 box furnace (Omega
Engineering, Stamford, CT) that works up to 1100C and the other is a KSL 1700X box furnace
(MTI Corporation, Richmond, CA) that operates up to 1700C. The applied sintering conditions
are described in Table 3.1. After the sintering process, the densified and crystallized ceramic
powders are re-pulverized using a MM 400 high-energy ball mill (Retsch, Haan, Germany) to
obtain an average particle size of ~50 μm or smaller as shown in Figure 3.5(d) in order to allow
more uniform dispersion of the high-k particle fillers in the polymer-ceramic composites.
The preparation of PDMS-ceramic particle composites starts with mixing of the two
components of the PDMS silicone elastomer in a 10:1 ratio between the resin and curing agent,
using an ARE-310 planetary centrifugal mixer (THINKY, Tokyo, Japan) at 2000 rpm for 2
minutes, followed by a 30 second deaerating step (also known as “degassing”) at 2200 rpm for
removing any trapped air bubbles [40]. The second phase is to determine the volume ratio between
the sintered ceramic fillers and the host polymer based on the measured tapped powder density
reported in Table 3.3 and Table 3.4. The ARE-310 planetary centrifugal mixer is used again to mix
the ceramic powders and the host elastomer (PDMS) at the desired volume concentration to ensure
a homogenous dispersion. The resultant polymer-ceramic composites are then poured into the
custom-designed hot compression molds followed by a degassing step at 22 in-Hg using an
30
Isotemp 281A vacuum oven (Fisher Scientific, Waltham, MA) to remove the air bubbles. A
degassing time of more than two hours is needed for samples with high filler loading ratio beyond
30% in volume, including purging steps every 10 minutes. The sample is then compression molded
and cured at 100C for one hour.
3.5 Characterization of Bulk Ceramic Materials
3.5.1 XRD Analysis
The X-ray diffraction (XRD) analysis was performed by using a X’Pert Pro diffractometer
(Panalytical, Almelo, Netherlands) to evaluate the phase composition and purity before and after
the sintering processes at the different temperatures shown in Table 3.3. These XRD analyses were
carried out to study the effects of the various sintering processes on the morphology, composition,
and crystal structure of the ceramic microfillers. It was observed that the sintering process slightly
modified the chemical composition of the compound powders of MgCaTiO2 and TiO2 as shown
by the XRD patterns in Figure 3.1 and Figure 3.2, respectively, as well as the semi-quantitative
analysis results from the energy dispersive spectroscopy (EDS) in Table 3.2 and Table 3.5,
respectively. Figure 3.1 presents the XRD patterns for MgCaTiO2 before and after a three hours
sintering step at 1100C or 1500C, while the corresponding lattice parameters are reported in
Table 3.3. Similarly, Figure 3.2 shows the XRD patterns for TiO2 samples before and after a
sintering step at 1100C or 1500C, while the corresponding lattice parameters are given in Table
3.4. No major differences in the d-spacings [Å] in the corresponding peaks measured with the X-
Ray spectra for MgCaTiO2 and TiO2 ceramics were observed as shown in Figure 3.1 and Figure
3.2, respectively. However, changes were observed in the peak intensity along the (012) and (213)
crystal orientations for MgCaTiO2 samples. Similarly, variations were observed in the peak
intensity along (110), (101) and (211) the crystal orientations for TiO2 samples.
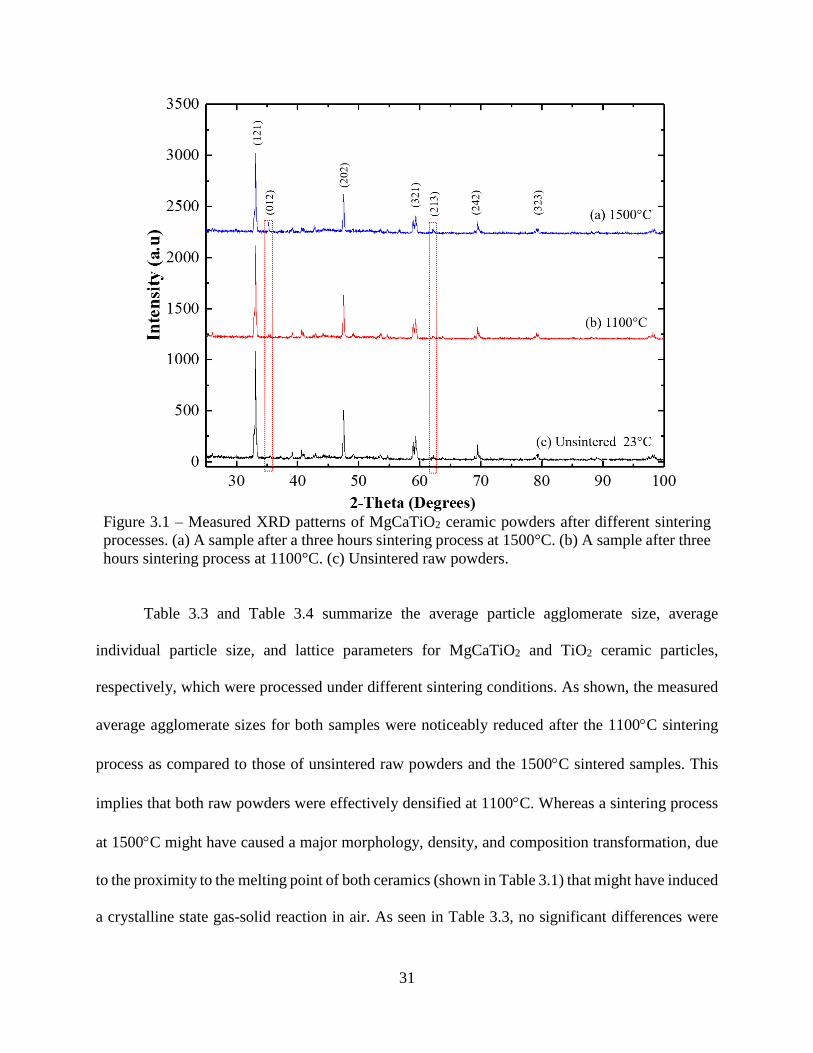
31
Figure 3.1 – Measured XRD patterns of MgCaTiO2 ceramic powders after different sintering
processes. (a) A sample after a three hours sintering process at 1500°C. (b) A sample after three
hours sintering process at 1100°C. (c) Unsintered raw powders.
Table 3.3 and Table 3.4 summarize the average particle agglomerate size, average
individual particle size, and lattice parameters for MgCaTiO2 and TiO2 ceramic particles,
respectively, which were processed under different sintering conditions. As shown, the measured
average agglomerate sizes for both samples were noticeably reduced after the 1100C sintering
process as compared to those of unsintered raw powders and the 1500C sintered samples. This
implies that both raw powders were effectively densified at 1100C. Whereas a sintering process
at 1500C might have caused a major morphology, density, and composition transformation, due
to the proximity to the melting point of both ceramics (shown in Table 3.1) that might have induced
a crystalline state gas-solid reaction in air. As seen in Table 3.3, no significant differences were

32
observed in the average cell volumes for MgCaTiO2 due to the applied sintering conditions. On
the contrary, the sintering process at 1500C have resulted in densification and enlargement of the
TiO2 particle unit cell as shown Table 3.4.
Figure 3.2 – Measured XRD patterns of TiO2 ceramic powder after different processes. (a) A
sample after three hours 1500°C sintering process. (b) A sample after a three hours 1100°C
sintering process. (c) Unsintered raw powders.
3.5.2 Energy Dispersive Spectroscopy (EDS) Analysis
The elemental analysis was performed by EDS, using an S-800 field emission scanning
electron microscope (FE-SEM) (Hitachi Ltd., Tokyo, Japan), which is equipped with an EDS
system (EDAX Inc., Mahwah, NJ). The EDS analysis clearly shows how the elements reacted
under the different applied sintering temperatures and conditions. Table 3.2 provides semi-
quantitative elemental composition analysis for MgCaTiO2 microfillers, while the corresponding
EDS spectrum is shown in Figure 3.3. Moreover, Table 3.5 provides a semi-quantitative elemental
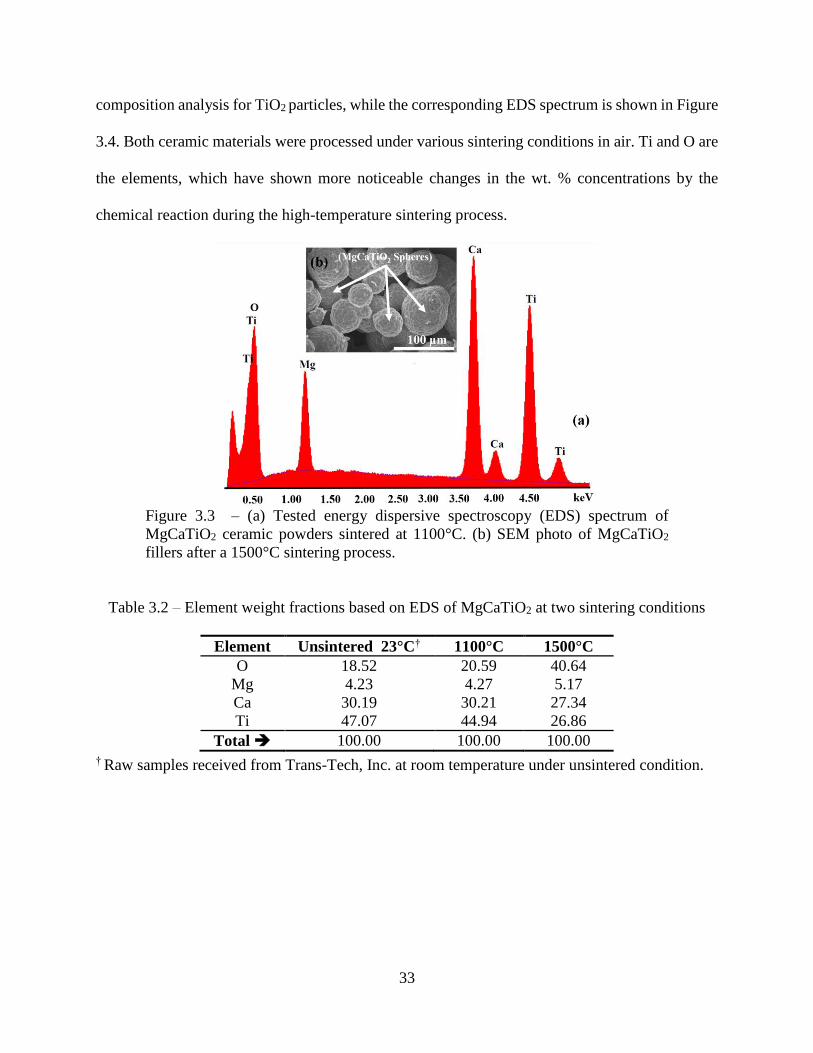
33
composition analysis for TiO2 particles, while the corresponding EDS spectrum is shown in Figure
3.4. Both ceramic materials were processed under various sintering conditions in air. Ti and O are
the elements, which have shown more noticeable changes in the wt. % concentrations by the
chemical reaction during the high-temperature sintering process.
Figure 3.3 – (a) Tested energy dispersive spectroscopy (EDS) spectrum of
MgCaTiO2 ceramic powders sintered at 1100°C. (b) SEM photo of MgCaTiO2
fillers after a 1500°C sintering process.
Table 3.2 – Element weight fractions based on EDS of MgCaTiO2 at two sintering conditions
Element Unsintered 23°C† 1100°C 1500°C
O 18.52 20.59 40.64
Mg 4.23 4.27 5.17
Ca 30.19 30.21 27.34
Ti 47.07 44.94 26.86
Total 100.00 100.00 100.00
† Raw samples received from Trans-Tech, Inc. at room temperature under unsintered condition.
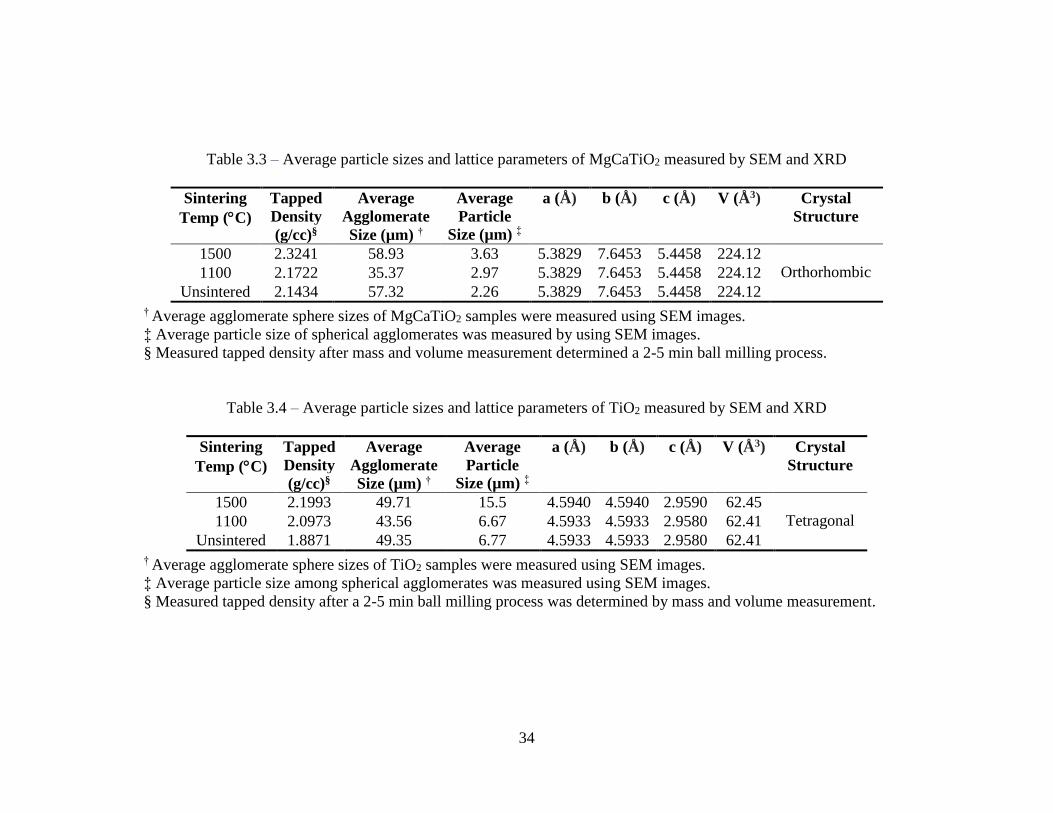
34
Table 3.3 – Average particle sizes and lattice parameters of MgCaTiO2 measured by SEM and XRD
Sintering
Temp (C)
Tapped
Density
(g/cc)§
Average
Agglomerate
Size (µm) †
Average
Particle
Size (µm) ‡
a (Å) b (Å) c (Å) V (Å3) Crystal
Structure
1500 2.3241 58.93 3.63 5.3829 7.6453 5.4458 224.12
Orthorhombic 1100 2.1722 35.37 2.97 5.3829 7.6453 5.4458 224.12
Unsintered 2.1434 57.32 2.26 5.3829 7.6453 5.4458 224.12
† Average agglomerate sphere sizes of MgCaTiO2 samples were measured using SEM images.
‡ Average particle size of spherical agglomerates was measured by using SEM images.
§ Measured tapped density after mass and volume measurement determined a 2-5 min ball milling process.
Table 3.4 – Average particle sizes and lattice parameters of TiO2 measured by SEM and XRD
Sintering
Temp (C)
Tapped
Density
(g/cc)§
Average
Agglomerate
Size (µm) †
Average
Particle
Size (µm) ‡
a (Å) b (Å) c (Å) V (Å3) Crystal
Structure
1500 2.1993 49.71 15.5 4.5940 4.5940 2.9590 62.45
Tetragonal 1100 2.0973 43.56 6.67 4.5933 4.5933 2.9580 62.41
Unsintered 1.8871 49.35 6.77 4.5933 4.5933 2.9580 62.41
† Average agglomerate sphere sizes of TiO2 samples were measured using SEM images.
‡ Average particle size among spherical agglomerates was measured using SEM images.
§ Measured tapped density after a 2-5 min ball milling process was determined by mass and volume measurement.
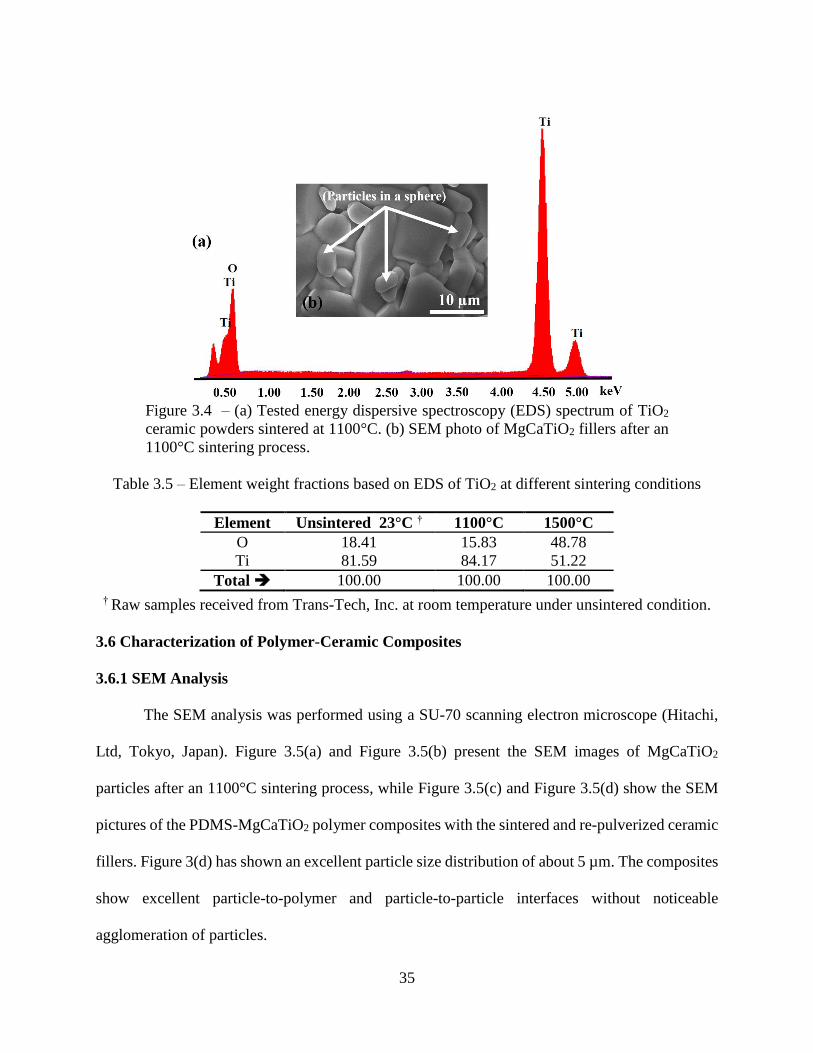
35
Figure 3.4 – (a) Tested energy dispersive spectroscopy (EDS) spectrum of TiO2
ceramic powders sintered at 1100°C. (b) SEM photo of MgCaTiO2 fillers after an
1100°C sintering process.
Table 3.5 – Element weight fractions based on EDS of TiO2 at different sintering conditions
Element Unsintered 23°C † 1100°C 1500°C
O 18.41 15.83 48.78
Ti 81.59 84.17 51.22
Total 100.00 100.00 100.00
† Raw samples received from Trans-Tech, Inc. at room temperature under unsintered condition.
3.6 Characterization of Polymer-Ceramic Composites
3.6.1 SEM Analysis
The SEM analysis was performed using a SU-70 scanning electron microscope (Hitachi,
Ltd, Tokyo, Japan). Figure 3.5(a) and Figure 3.5(b) present the SEM images of MgCaTiO2
particles after an 1100°C sintering process, while Figure 3.5(c) and Figure 3.5(d) show the SEM
pictures of the PDMS-MgCaTiO2 polymer composites with the sintered and re-pulverized ceramic
fillers. Figure 3(d) has shown an excellent particle size distribution of about 5 µm. The composites
show excellent particle-to-polymer and particle-to-particle interfaces without noticeable
agglomeration of particles.
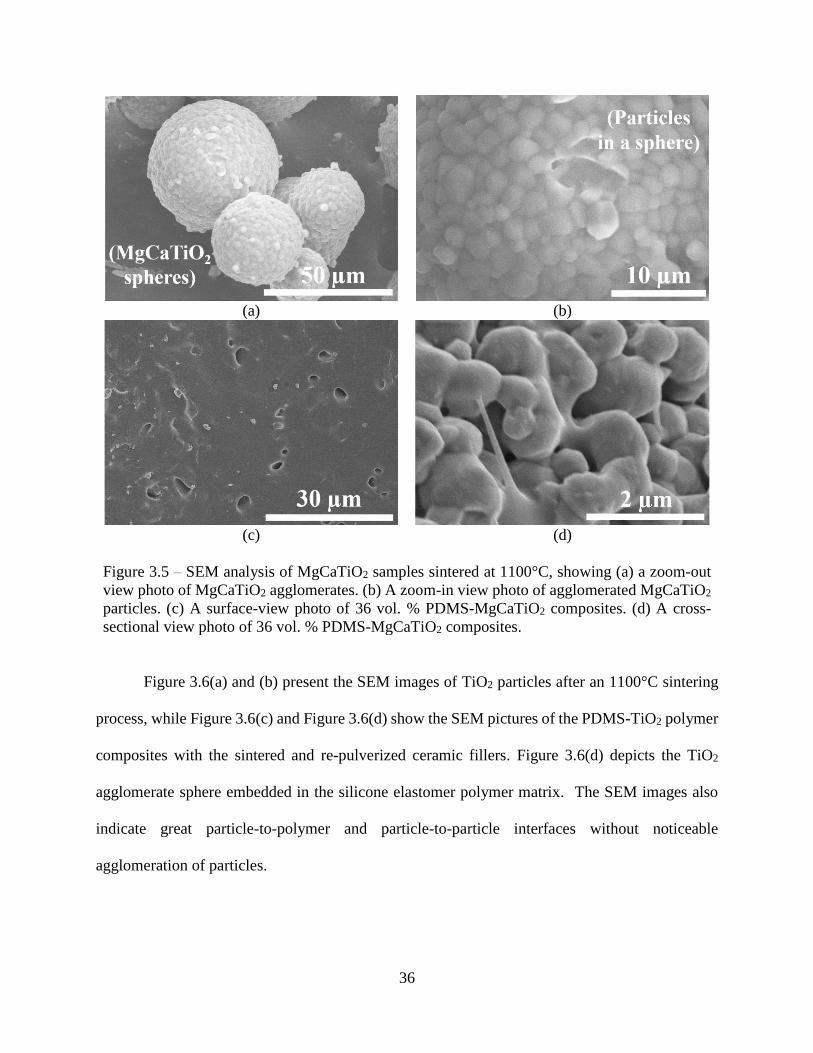
36
(a) (b)
(c) (d)
Figure 3.5 – SEM analysis of MgCaTiO2 samples sintered at 1100°C, showing (a) a zoom-out
view photo of MgCaTiO2 agglomerates. (b) A zoom-in view photo of agglomerated MgCaTiO2
particles. (c) A surface-view photo of 36 vol. % PDMS-MgCaTiO2 composites. (d) A cross-
sectional view photo of 36 vol. % PDMS-MgCaTiO2 composites.
Figure 3.6(a) and (b) present the SEM images of TiO2 particles after an 1100°C sintering
process, while Figure 3.6(c) and Figure 3.6(d) show the SEM pictures of the PDMS-TiO2 polymer
composites with the sintered and re-pulverized ceramic fillers. Figure 3.6(d) depicts the TiO2
agglomerate sphere embedded in the silicone elastomer polymer matrix. The SEM images also
indicate great particle-to-polymer and particle-to-particle interfaces without noticeable
agglomeration of particles.
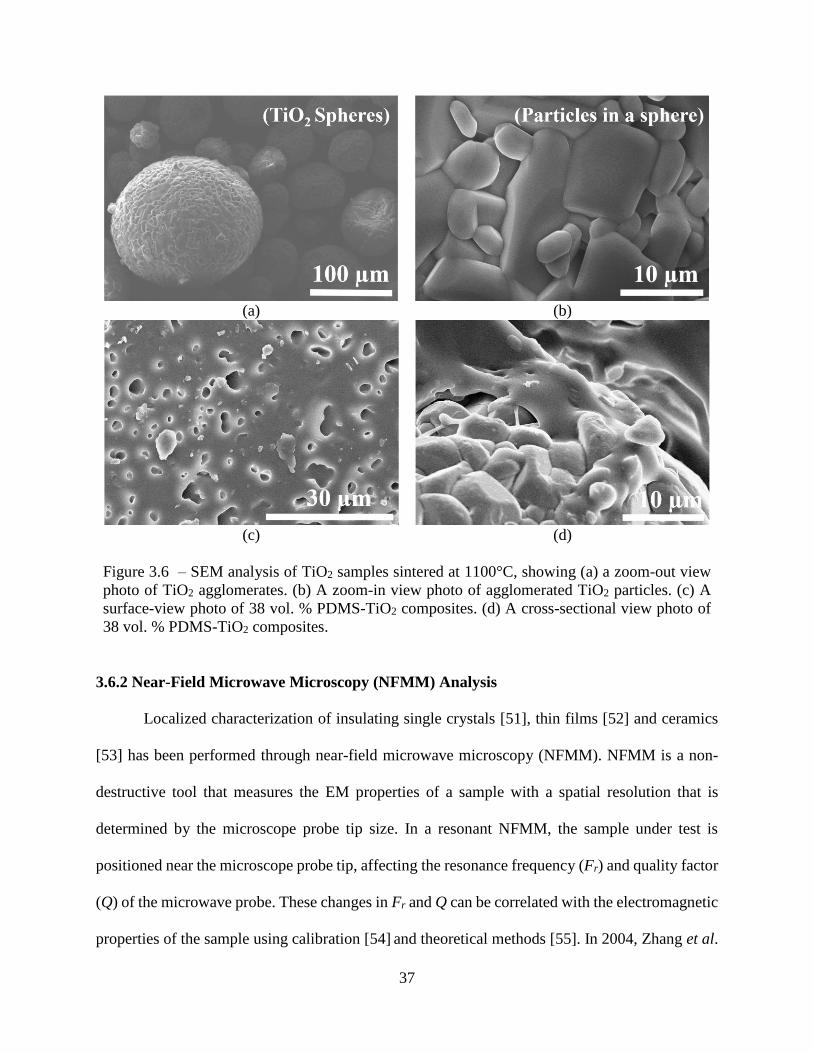
37
(a) (b)
(c) (d)
Figure 3.6 – SEM analysis of TiO2 samples sintered at 1100°C, showing (a) a zoom-out view
photo of TiO2 agglomerates. (b) A zoom-in view photo of agglomerated TiO2 particles. (c) A
surface-view photo of 38 vol. % PDMS-TiO2 composites. (d) A cross-sectional view photo of
38 vol. % PDMS-TiO2 composites.
3.6.2 Near-Field Microwave Microscopy (NFMM) Analysis
Localized characterization of insulating single crystals [51], thin films [52] and ceramics
[53] has been performed through near-field microwave microscopy (NFMM). NFMM is a non-
destructive tool that measures the EM properties of a sample with a spatial resolution that is
determined by the microscope probe tip size. In a resonant NFMM, the sample under test is
positioned near the microscope probe tip, affecting the resonance frequency (Fr) and quality factor
(Q) of the microwave probe. These changes in Fr and Q can be correlated with the electromagnetic
properties of the sample using calibration [54] and theoretical methods [55]. In 2004, Zhang et al.
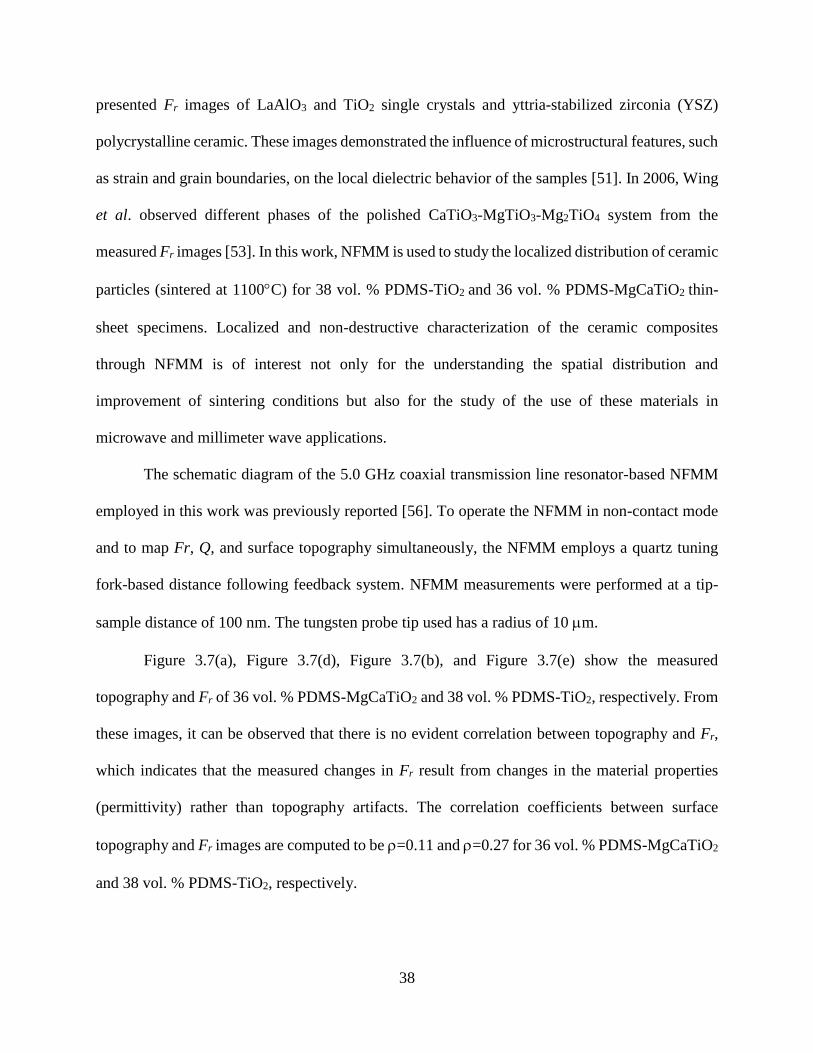
38
presented Fr images of LaAlO3 and TiO2 single crystals and yttria-stabilized zirconia (YSZ)
polycrystalline ceramic. These images demonstrated the influence of microstructural features, such
as strain and grain boundaries, on the local dielectric behavior of the samples [51]. In 2006, Wing
et al. observed different phases of the polished CaTiO3-MgTiO3-Mg2TiO4 system from the
measured Fr images [53]. In this work, NFMM is used to study the localized distribution of ceramic
particles (sintered at 1100C) for 38 vol. % PDMS-TiO2 and 36 vol. % PDMS-MgCaTiO2 thin-
sheet specimens. Localized and non-destructive characterization of the ceramic composites
through NFMM is of interest not only for the understanding the spatial distribution and
improvement of sintering conditions but also for the study of the use of these materials in
microwave and millimeter wave applications.
The schematic diagram of the 5.0 GHz coaxial transmission line resonator-based NFMM
employed in this work was previously reported [56]. To operate the NFMM in non-contact mode
and to map Fr, Q, and surface topography simultaneously, the NFMM employs a quartz tuning
fork-based distance following feedback system. NFMM measurements were performed at a tip-
sample distance of 100 nm. The tungsten probe tip used has a radius of 10 m.
Figure 3.7(a), Figure 3.7(d), Figure 3.7(b), and Figure 3.7(e) show the measured
topography and Fr of 36 vol. % PDMS-MgCaTiO2 and 38 vol. % PDMS-TiO2, respectively. From
these images, it can be observed that there is no evident correlation between topography and Fr,
which indicates that the measured changes in Fr result from changes in the material properties
(permittivity) rather than topography artifacts. The correlation coefficients between surface
topography and Fr images are computed to be =0.11 and =0.27 for 36 vol. % PDMS-MgCaTiO2
and 38 vol. % PDMS-TiO2, respectively.
39
(a) (d)
(b) (e)
(c) (f)
Figure 3.7 – 36 vol. % PDMS-MgCaTiO2 composites with fillers sintered at 1100ºC: (a) NFMM
surface topography. (b) NFMM Fr. (c) Cross-sectional SEM image. Similarly, 38 vol. % PDMS-
TiO2 composites with fillers sintered at 1100ºC: (d) NFMM surface topography. (e) NFMM Fr.
(f) Cross-sectional SEM image.
These results confirm that the correlation is negligible. Additionally, from Figure 3.7(b)
and Figure 3.7(e), it can be observed that Fr is not constant over the 50 m 50 m area but varies
by about 1.5 MHz (36 vol. % PDMS-MgCaTiO2) and 2 MHz (38 vol. % PDMS-TiO2), which
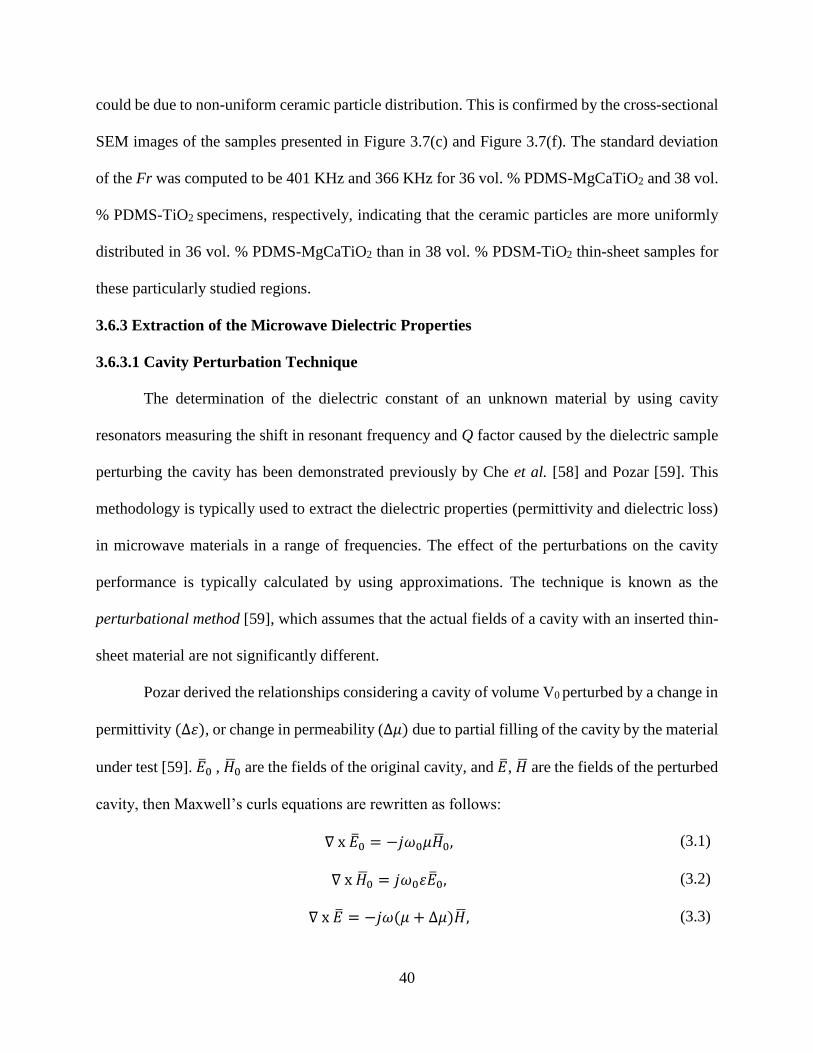
40
could be due to non-uniform ceramic particle distribution. This is confirmed by the cross-sectional
SEM images of the samples presented in Figure 3.7(c) and Figure 3.7(f). The standard deviation
of the Fr was computed to be 401 KHz and 366 KHz for 36 vol. % PDMS-MgCaTiO2 and 38 vol.
% PDMS-TiO2 specimens, respectively, indicating that the ceramic particles are more uniformly
distributed in 36 vol. % PDMS-MgCaTiO2 than in 38 vol. % PDSM-TiO2 thin-sheet samples for
these particularly studied regions.
3.6.3 Extraction of the Microwave Dielectric Properties
3.6.3.1 Cavity Perturbation Technique
The determination of the dielectric constant of an unknown material by using cavity
resonators measuring the shift in resonant frequency and Q factor caused by the dielectric sample
perturbing the cavity has been demonstrated previously by Che et al. [58] and Pozar [59]. This
methodology is typically used to extract the dielectric properties (permittivity and dielectric loss)
in microwave materials in a range of frequencies. The effect of the perturbations on the cavity
performance is typically calculated by using approximations. The technique is known as the
perturbational method [59], which assumes that the actual fields of a cavity with an inserted thin-
sheet material are not significantly different.
Pozar derived the relationships considering a cavity of volume V0 perturbed by a change in
permittivity (∆휀), or change in permeability (∆𝜇) due to partial filling of the cavity by the material
under test [59]. �̅�0 , �̅�0 are the fields of the original cavity, and �̅�, �̅� are the fields of the perturbed
cavity, then Maxwell’s curls equations are rewritten as follows:
∇ x �̅�0 = −𝑗𝜔0𝜇�̅�0, (3.1)
∇ x �̅�0 = 𝑗𝜔0휀�̅�0, (3.2)
∇ x �̅� = −𝑗𝜔(𝜇 + ∆𝜇)�̅�, (3.3)

41
∇ x �̅� = 𝑗𝜔(휀 + ∆휀)�̅�, (3.4)
where �̅� is the magnetic field in (A/m), and �̅� is the electric field in (V/m), 𝜔0 is the resonant
frequency of the original cavity, and 𝜔 is the resonant frequency of the perturbed cavity. By
multiplying (3.1) by �̅�, and multiplying (3.4) by �̅�0∗ , the following expressions can be derived:
�̅� · ∇ x �̅�0∗ = 𝑗𝜔0𝜇�̅� · �̅�0
∗, (3.5)
�̅�0∗ · ∇ x �̅� = 𝑗𝜔(휀 + ∆휀)�̅�0
∗ · �̅�, (3.6)
Subtracting (3.5) from (3.6) and using the vector identity, Equation (3.7) can be derived:
∇ · (�̅� x �̅�) = �̅� · ∇ x �̅� − �̅� · ∇ x �̅� (3.7)
Resulting in Equation (3.8):
∇ · (�̅�0∗ x �̅�) = 𝑗𝜔0𝜇�̅� · �̅�0
∗ − 𝑗𝜔(휀 + ∆휀)�̅�0∗ · �̅� (3.8)
Now multiplying (3.2) by �̅� and multiplying (3.3) by �̅�0∗ , the following equations are given:
�̅� · ∇ x �̅�0∗ = −𝑗𝜔0휀�̅�0
∗ · �̅�, (3.9)
�̅�0∗ · ∇ x �̅� = −𝑗𝜔(𝜇 + ∆𝜇)�̅�0
∗ · �̅�, (3.10)
Subtracting (3.9) from (3.10) and using the vector, identity Equation (3.7), Equation (3.11) can be
obtained:
∇ · (�̅� x �̅�0∗) = −𝑗𝜔(𝜇 + ∆𝜇)�̅�0
∗ · �̅� + 𝑗𝜔0휀�̅�0∗ · �̅�, (3.11)
Adding (3.8) and (3.11), and integrating over the volume V0 and using the divergence theorem,
the left part is volume integral, and the right part is surface integral, as shown by Equation (3.12):
∫ ∇ · (�̅�0∗ x �̅� + �̅� x �̅�0
∗)𝑑𝑣
𝑉0
= ∮ (�̅�0∗ x �̅� + �̅� x �̅�0
∗) ·𝑆0
𝑑𝑠 = 0
= 𝑗 ∫{[𝜔0휀 − 𝜔(휀 + ∆휀)]�̅�0∗ · �̅� + [𝜔0𝜇 − 𝜔(𝜇 + ∆𝜇)]�̅�0
∗ · �̅�}𝑑𝑣,
𝑉0
(3.12)
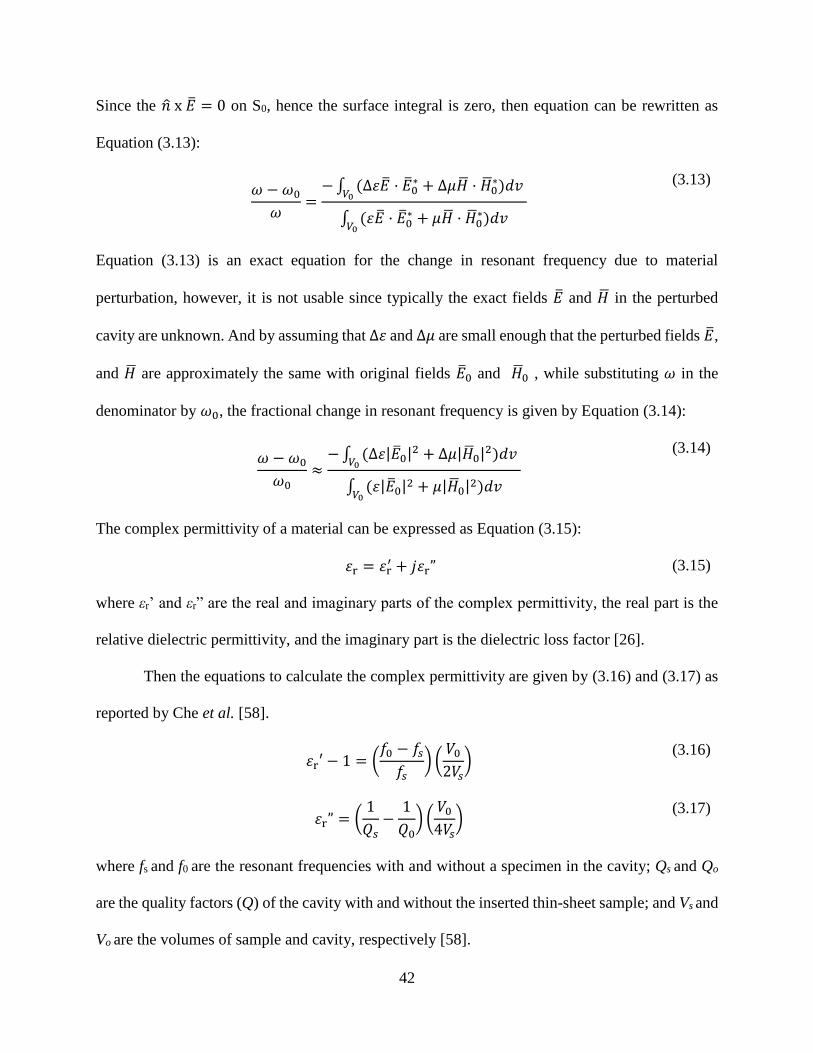
42
Since the �̂� x �̅� = 0 on S0, hence the surface integral is zero, then equation can be rewritten as
Equation (3.13):
𝜔 − 𝜔0
𝜔=
−∫ (∆휀�̅� · �̅�0∗ + ∆𝜇�̅� · �̅�0
∗)𝑑𝑣𝑉0
∫ (휀�̅� · �̅�0∗ + 𝜇�̅� · �̅�0
∗)𝑑𝑣𝑉0
(3.13)
Equation (3.13) is an exact equation for the change in resonant frequency due to material
perturbation, however, it is not usable since typically the exact fields �̅� and �̅� in the perturbed
cavity are unknown. And by assuming that ∆휀 and ∆𝜇 are small enough that the perturbed fields �̅�,
and �̅� are approximately the same with original fields �̅�0 and �̅�0 , while substituting 𝜔 in the
denominator by 𝜔0, the fractional change in resonant frequency is given by Equation (3.14):
𝜔 − 𝜔0
𝜔0≈
−∫ (∆휀|�̅�0|2 + ∆𝜇|�̅�0|
2)𝑑𝑣𝑉0
∫ (휀|�̅�0|2 + 𝜇|�̅�0|2)𝑑𝑣𝑉0
(3.14)
The complex permittivity of a material can be expressed as Equation (3.15):
휀r = 휀r′ + 𝑗휀r” (3.15)
where εr’ and εr” are the real and imaginary parts of the complex permittivity, the real part is the
relative dielectric permittivity, and the imaginary part is the dielectric loss factor [26].
Then the equations to calculate the complex permittivity are given by (3.16) and (3.17) as
reported by Che et al. [58].
휀r′ − 1 = (
𝑓0 − 𝑓𝑠𝑓𝑠
) (𝑉0
2𝑉𝑠)
(3.16)
휀r” = (
1
𝑄𝑠−
1
𝑄0) (
𝑉0
4𝑉𝑠)
(3.17)
where fs and f0 are the resonant frequencies with and without a specimen in the cavity; Qs and Qo
are the quality factors (Q) of the cavity with and without the inserted thin-sheet sample; and Vs and
Vo are the volumes of sample and cavity, respectively [58].
43
Once the complex permittivity of the material under test is calculated, we can then
determine the effective conductivity σe and dielectric loss tangent tan δd as shown below:
𝜎𝑒 = 𝜔휀” = 2𝜋𝑓휀0휀r" (3.18)
tan 𝛿d =
휀r”
휀r′
(3.19)
The microwave dielectric characteristics of several types of multilayer dielectric resonators
fabricated by employing MgTiO3-CaTiO3 powders synthesized by a solid-state reaction process
characterized using a finite-element analysis with transverse electric (TE01δ) resonant mode has
been reported previously by Li et al. [31]. These resonators were built by stacking different types
of ceramic powders. However, the dielectric properties of these layered resonators were
characterized only at 6.9 GHz, which also renders uncertainties for any applications at higher GHz
frequencies beyond the C-band [31].
In this work, the microwave dielectric properties of PDMS-ceramic composite substrates
at microwave frequencies were characterized by using Equations (3.16)-(3.19) and using an
8720ES 20 GHz network analyzer (Keysight Technologies, Santa Rosa, CA) and two different
commercial thin dielectric sheet cavity resonators 125HC and 015 fixtures (Damaskos, Inc.,
Concordville, PA). The model 125HC test fixture that works in the transverse electromagnetic
(TEM) mode is designed for the low-frequency band of 0.4 to 4.4 GHz, while the model 015 test
fixture that works in the transverse electric (TE) mode covers the high-frequency band of 6.2 to
19.4 GHz, which corresponds to K-band frequencies.
3.7 Theoretical Models for Effective Dielectric Permittivity of Polymer-Matrix Composites
In this section, different models reported in [26], [60]-[69] are applied to the PMCs to
predict the relative dielectric permittivity and to evaluate their accuracy by comparing the model
predictions with measured data. These models are based on mixing rules to estimate the effective
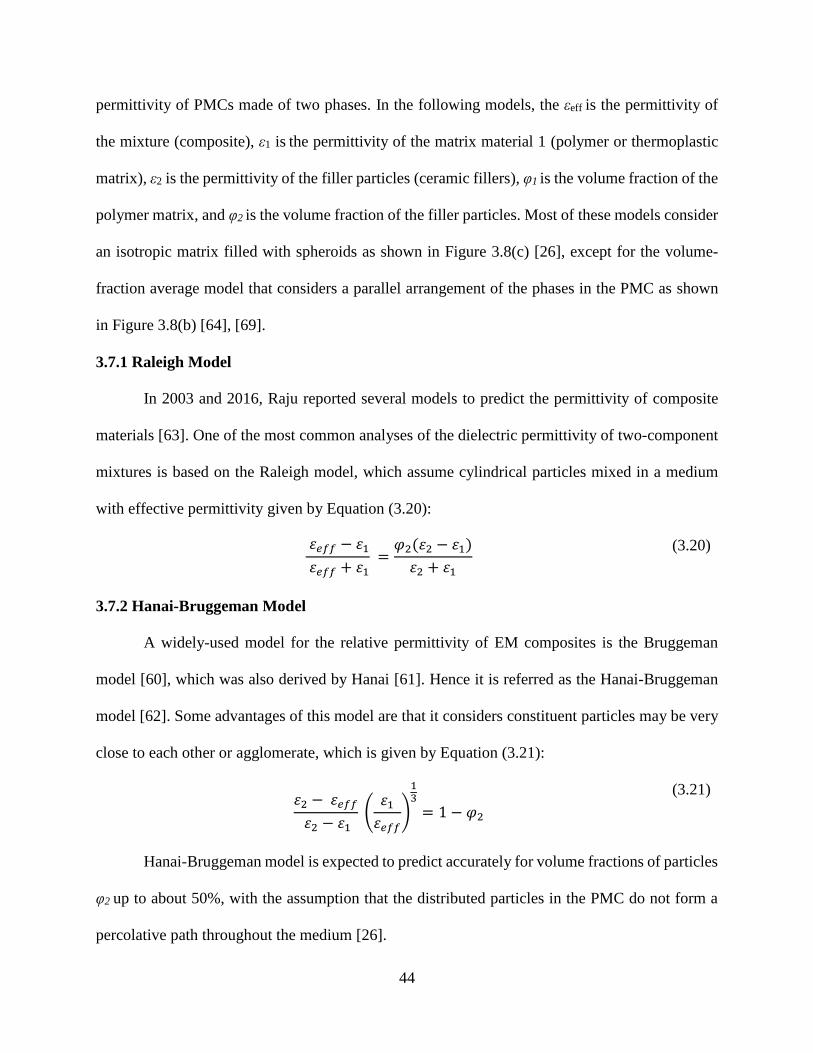
44
permittivity of PMCs made of two phases. In the following models, the εeff is the permittivity of
the mixture (composite), ε1 is the permittivity of the matrix material 1 (polymer or thermoplastic
matrix), ε2 is the permittivity of the filler particles (ceramic fillers), φ1 is the volume fraction of the
polymer matrix, and φ2 is the volume fraction of the filler particles. Most of these models consider
an isotropic matrix filled with spheroids as shown in Figure 3.8(c) [26], except for the volume-
fraction average model that considers a parallel arrangement of the phases in the PMC as shown
in Figure 3.8(b) [64], [69].
3.7.1 Raleigh Model
In 2003 and 2016, Raju reported several models to predict the permittivity of composite
materials [63]. One of the most common analyses of the dielectric permittivity of two-component
mixtures is based on the Raleigh model, which assume cylindrical particles mixed in a medium
with effective permittivity given by Equation (3.20):
휀𝑒𝑓𝑓 − 휀1
휀𝑒𝑓𝑓 + 휀1 =
𝜑2(휀2 − 휀1)
휀2 + 휀1
(3.20)
3.7.2 Hanai-Bruggeman Model
A widely-used model for the relative permittivity of EM composites is the Bruggeman
model [60], which was also derived by Hanai [61]. Hence it is referred as the Hanai-Bruggeman
model [62]. Some advantages of this model are that it considers constituent particles may be very
close to each other or agglomerate, which is given by Equation (3.21):
휀2 − 휀𝑒𝑓𝑓
휀2 − 휀1 (
휀1
휀𝑒𝑓𝑓)
13
= 1 − 𝜑2
(3.21)
Hanai-Bruggeman model is expected to predict accurately for volume fractions of particles
φ2 up to about 50%, with the assumption that the distributed particles in the PMC do not form a
percolative path throughout the medium [26].
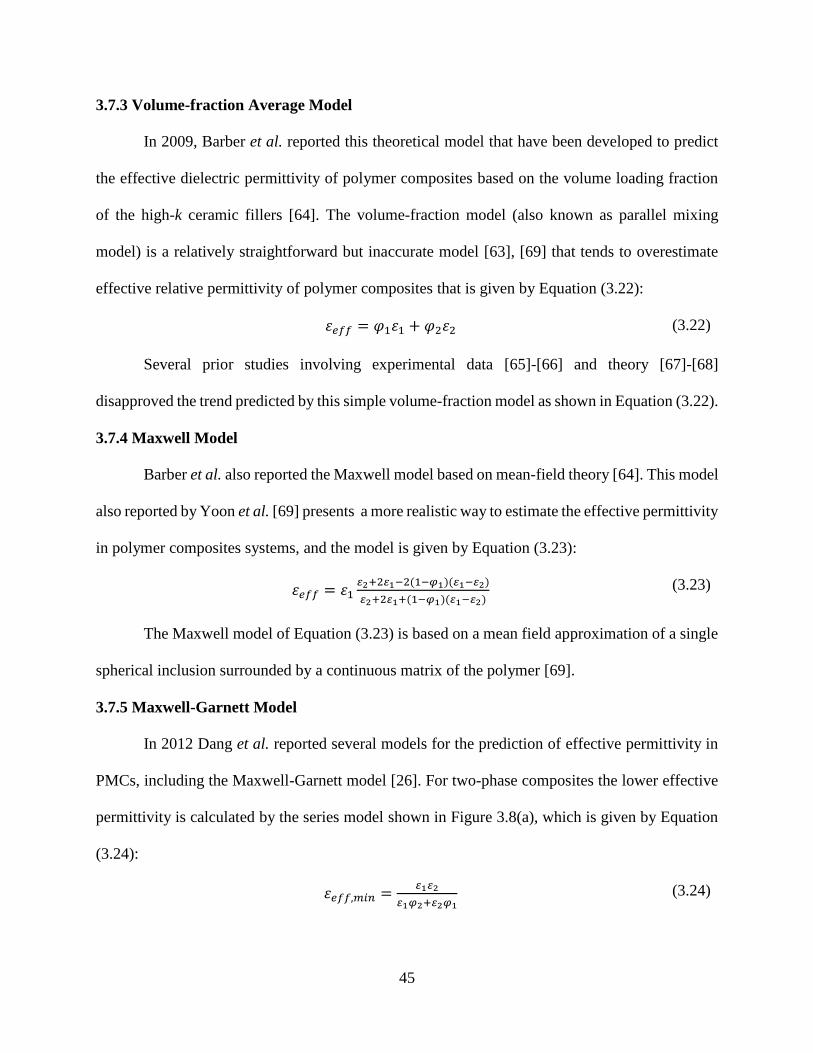
45
3.7.3 Volume-fraction Average Model
In 2009, Barber et al. reported this theoretical model that have been developed to predict
the effective dielectric permittivity of polymer composites based on the volume loading fraction
of the high-k ceramic fillers [64]. The volume-fraction model (also known as parallel mixing
model) is a relatively straightforward but inaccurate model [63], [69] that tends to overestimate
effective relative permittivity of polymer composites that is given by Equation (3.22):
휀𝑒𝑓𝑓 = 𝜑1휀1 + 𝜑2휀2 (3.22)
Several prior studies involving experimental data [65]-[66] and theory [67]-[68]
disapproved the trend predicted by this simple volume-fraction model as shown in Equation (3.22).
3.7.4 Maxwell Model
Barber et al. also reported the Maxwell model based on mean-field theory [64]. This model
also reported by Yoon et al. [69] presents a more realistic way to estimate the effective permittivity
in polymer composites systems, and the model is given by Equation (3.23):
휀𝑒𝑓𝑓 = 휀12+2 1−2(1−𝜑1)( 1− 2)
2+2 1+(1−𝜑1)( 1− 2) (3.23)
The Maxwell model of Equation (3.23) is based on a mean field approximation of a single
spherical inclusion surrounded by a continuous matrix of the polymer [69].
3.7.5 Maxwell-Garnett Model
In 2012 Dang et al. reported several models for the prediction of effective permittivity in
PMCs, including the Maxwell-Garnett model [26]. For two-phase composites the lower effective
permittivity is calculated by the series model shown in Figure 3.8(a), which is given by Equation
(3.24):
휀𝑒𝑓𝑓,𝑚𝑖𝑛 = 1 2
1𝜑2+ 2𝜑1 (3.24)
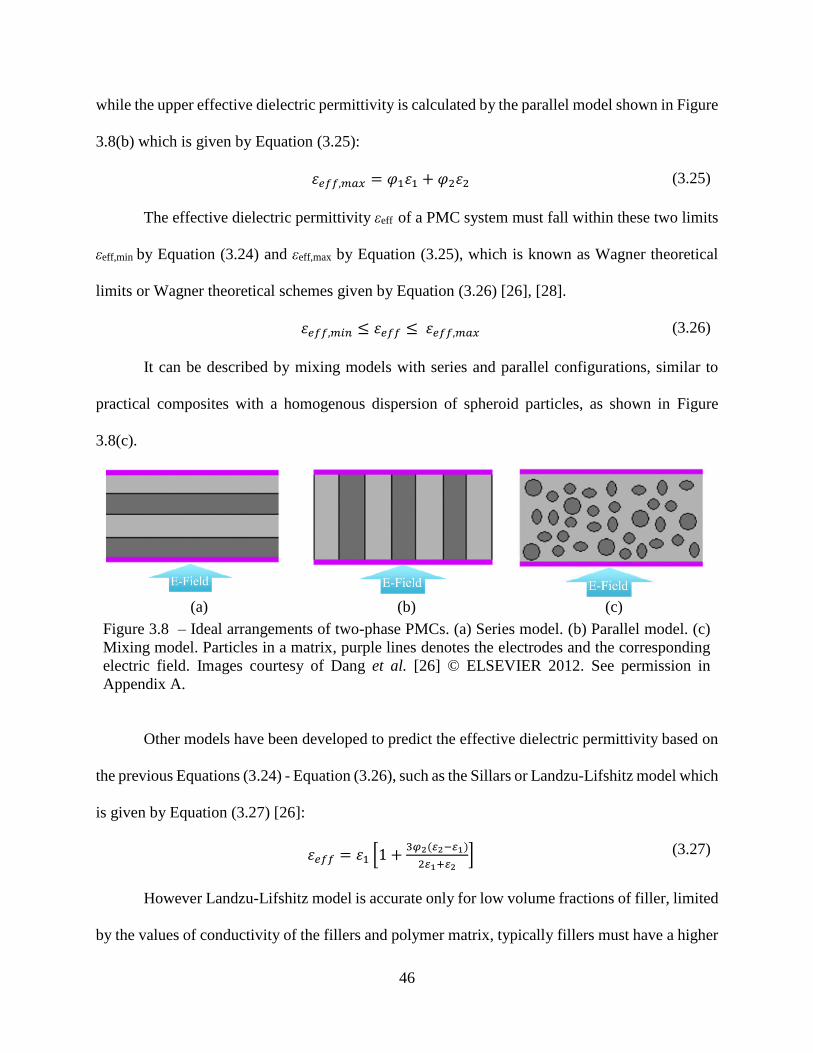
46
while the upper effective dielectric permittivity is calculated by the parallel model shown in Figure
3.8(b) which is given by Equation (3.25):
휀𝑒𝑓𝑓,𝑚𝑎𝑥 = 𝜑1휀1 + 𝜑2휀2 (3.25)
The effective dielectric permittivity εeff of a PMC system must fall within these two limits
εeff,min by Equation (3.24) and εeff,max by Equation (3.25), which is known as Wagner theoretical
limits or Wagner theoretical schemes given by Equation (3.26) [26], [28].
휀𝑒𝑓𝑓,𝑚𝑖𝑛 ≤ 휀𝑒𝑓𝑓 ≤ 휀𝑒𝑓𝑓,𝑚𝑎𝑥 (3.26)
It can be described by mixing models with series and parallel configurations, similar to
practical composites with a homogenous dispersion of spheroid particles, as shown in Figure
3.8(c).
(a) (b) (c)
Figure 3.8 – Ideal arrangements of two-phase PMCs. (a) Series model. (b) Parallel model. (c)
Mixing model. Particles in a matrix, purple lines denotes the electrodes and the corresponding
electric field. Images courtesy of Dang et al. [26] © ELSEVIER 2012. See permission in
Appendix A.
Other models have been developed to predict the effective dielectric permittivity based on
the previous Equations (3.24) - Equation (3.26), such as the Sillars or Landzu-Lifshitz model which
is given by Equation (3.27) [26]:
휀𝑒𝑓𝑓 = 휀1 [1 +3𝜑2( 2− 1)
2 1+ 2] (3.27)
However Landzu-Lifshitz model is accurate only for low volume fractions of filler, limited
by the values of conductivity of the fillers and polymer matrix, typically fillers must have a higher
47
electrical resistivity than that of the polymer matrix for the model to be accurate. Therefore a more
precise model known as the Maxwell-Garnet model is developed that is given by Equation (3.28)
[26]:
휀𝑒𝑓𝑓 = 휀1 [1 +3𝜑2( 2− 1)
(1−𝜑2)( 2− 1)+3 1] (3.28)
Maxwell-Garnet model given by Equation (3.28) considers spherical fillers dispersed in a
medium and this model does not consider the resistivity of the filler or matrix, which is an
advantage when compared with Landzu-Lifshitz model. In some references, Maxwell-Garnet
model is expressed in other forms, and it is referred with other names (e.g., Maxwell-Wagner,
Rayleigh, Lorentz-Lorenz or Kernner-Böttcher) [26]. For instance, another expression for the
Maxwell-Garnet model is given by Equation (3.29):
휀𝑒𝑓𝑓 − 휀1
휀𝑒𝑓𝑓 + 2휀1 = 𝜑2 [
(휀2 − 휀1)
휀2 + 2휀1]
(3.29)
However Maxwell-Garnet model Equation (3.29) is applicable only to spherical particles
[26].
(a) (b)
Figure 3.9 – Distribution of particles in a PMC. (a) A low concentration of fillers. (b)
High-concentration of fillers. Images courtesy of Dang et al. [26] © ELSEVIER 2012.
See permission in Appendix A.
48
Maxwell-Garnet model is only valid for low filler concentrations as shown in Figure 3.9(a).
Since the interaction between filler particles is relatively weak, it is typically neglected by this
model.
3.7.6 Jaysundere-Smith Model
At higher concentration of particles, the interaction of them is more significant due to the
closer distance between them as depicted in Figure 3.9(b) for PMCs with a higher concentration
of fillers, in particular, nanosized filler particles. By taking into account, the interaction between
filler particles, Jaysundere-Smith model calculated the electric field with a dielectric sphere
embedded in a continuous dielectric medium while considering the polarization of contiguous
particles, which is given by Equation (3.30) [26]:
휀𝑒𝑓𝑓 =
1𝜑1+ 2𝜑23𝜀1
(2𝜀1+𝜀2)[1+3𝜑2
(𝜀2−𝜀1)
2𝜀1+𝜀2]
𝜑1+𝜑23𝜀1
(2𝜀1+𝜀2)[1+3𝜑2
(𝜀2−𝜀1)
2𝜀1+𝜀2]
(3.30)
3.8 Measured Dielectric Properties of Polymer-Matrix Composites
The properties of polydimethylsiloxane (PDMS) silicone elastomer were measured,
revealing r of 2.5 and tan δd lower than 0.024 at 17 GHz [40]. At the same time, the dielectric
properties of MgCaTiO2 and TiO2 ceramic powders were characterized at 6 GHz with reported r
of 127.26 and tan δd lower than 0.0017 for MgCaTiO2 along with r of 95.76 and tan δd lower than
0.00038 for TiO2 raw samples, respectively. Figure 3.10 depicts the comparison between the
measured dielectric permittivity compared with the predicted results based on three models (i.e.,
Equations (3.20), (3.21) and (3.23)) including Raleigh, Hanai-Bruggeman, and Maxwell models.
The volume-fraction average model is omitted in Figure 3.10 due to its significant discrepancy.
For this study, samples at different concentrations were prepared to evaluate the accuracy of these
models, including 36 vol. % and 20 vol. % PDMS-MgCaTiO2 composites, and 38 vol. % and 20
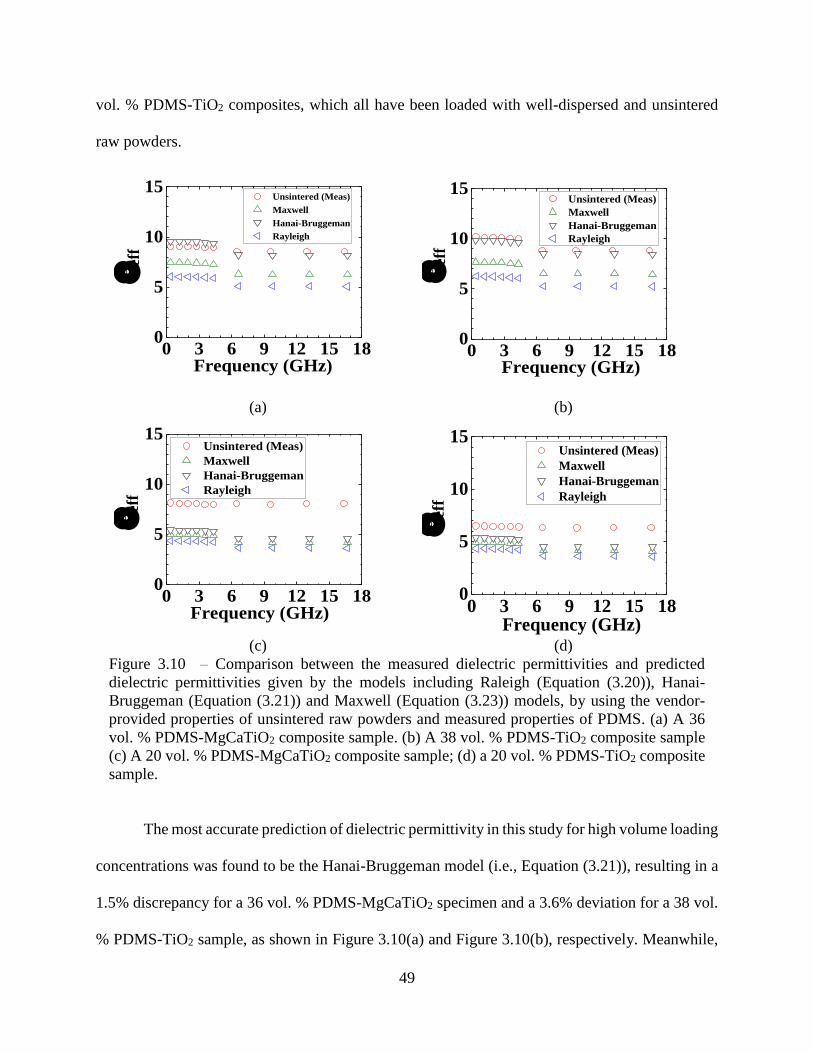
49
vol. % PDMS-TiO2 composites, which all have been loaded with well-dispersed and unsintered
raw powders.
0 3 6 9 12 15 180
5
10
15
Frequency (GHz)
eff
Unsintered (Meas)
Maxwell
Hanai-Bruggeman
Rayleigh
0 3 6 9 12 15 180
5
10
15
Frequency (GHz)
eff
Unsintered (Meas)
Maxwell
Hanai-Bruggeman
Rayleigh
(a) (b)
0 3 6 9 12 15 180
5
10
15
Frequency (GHz)
eff
Unsintered (Meas)
Maxwell
Hanai-Bruggeman
Rayleigh
0 3 6 9 12 15 18
0
5
10
15
Frequency (GHz)
eff
Unsintered (Meas)
Maxwell
Hanai-Bruggeman
Rayleigh
(c) (d)
Figure 3.10 – Comparison between the measured dielectric permittivities and predicted
dielectric permittivities given by the models including Raleigh (Equation (3.20)), Hanai-
Bruggeman (Equation (3.21)) and Maxwell (Equation (3.23)) models, by using the vendor-
provided properties of unsintered raw powders and measured properties of PDMS. (a) A 36
vol. % PDMS-MgCaTiO2 composite sample. (b) A 38 vol. % PDMS-TiO2 composite sample
(c) A 20 vol. % PDMS-MgCaTiO2 composite sample; (d) a 20 vol. % PDMS-TiO2 composite
sample.
The most accurate prediction of dielectric permittivity in this study for high volume loading
concentrations was found to be the Hanai-Bruggeman model (i.e., Equation (3.21)), resulting in a
1.5% discrepancy for a 36 vol. % PDMS-MgCaTiO2 specimen and a 3.6% deviation for a 38 vol.
% PDMS-TiO2 sample, as shown in Figure 3.10(a) and Figure 3.10(b), respectively. Meanwhile,
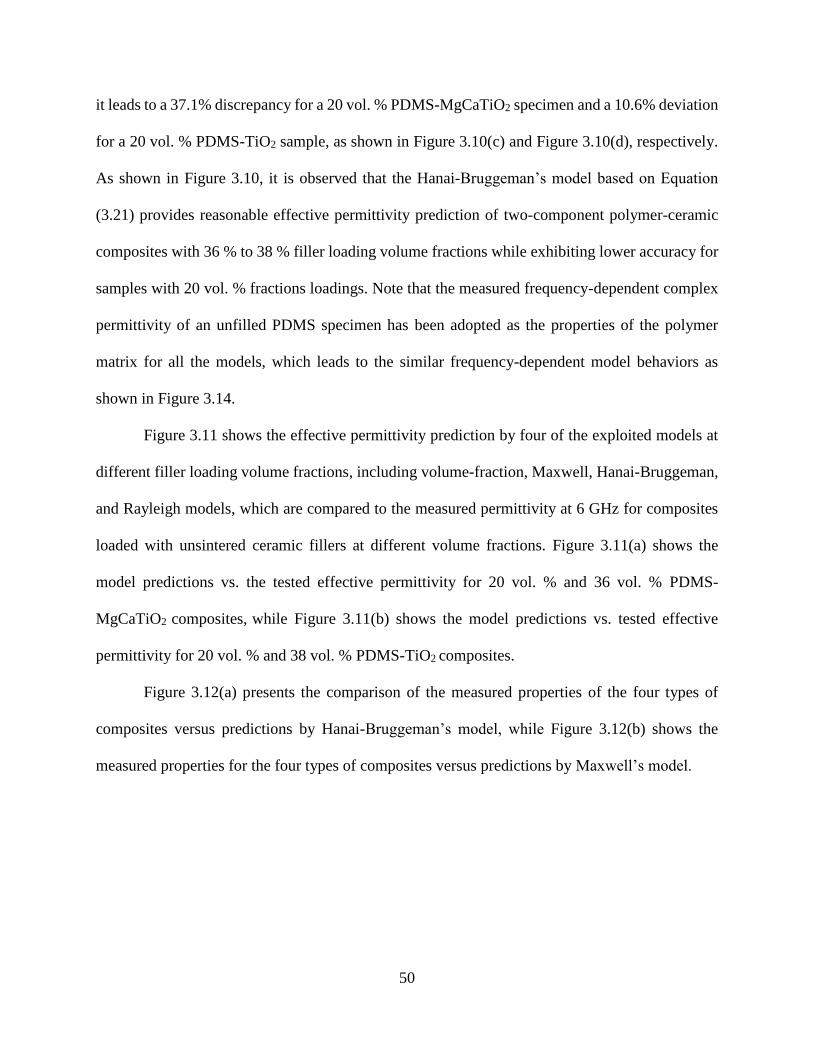
50
it leads to a 37.1% discrepancy for a 20 vol. % PDMS-MgCaTiO2 specimen and a 10.6% deviation
for a 20 vol. % PDMS-TiO2 sample, as shown in Figure 3.10(c) and Figure 3.10(d), respectively.
As shown in Figure 3.10, it is observed that the Hanai-Bruggeman’s model based on Equation
(3.21) provides reasonable effective permittivity prediction of two-component polymer-ceramic
composites with 36 % to 38 % filler loading volume fractions while exhibiting lower accuracy for
samples with 20 vol. % fractions loadings. Note that the measured frequency-dependent complex
permittivity of an unfilled PDMS specimen has been adopted as the properties of the polymer
matrix for all the models, which leads to the similar frequency-dependent model behaviors as
shown in Figure 3.14.
Figure 3.11 shows the effective permittivity prediction by four of the exploited models at
different filler loading volume fractions, including volume-fraction, Maxwell, Hanai-Bruggeman,
and Rayleigh models, which are compared to the measured permittivity at 6 GHz for composites
loaded with unsintered ceramic fillers at different volume fractions. Figure 3.11(a) shows the
model predictions vs. the tested effective permittivity for 20 vol. % and 36 vol. % PDMS-
MgCaTiO2 composites, while Figure 3.11(b) shows the model predictions vs. tested effective
permittivity for 20 vol. % and 38 vol. % PDMS-TiO2 composites.
Figure 3.12(a) presents the comparison of the measured properties of the four types of
composites versus predictions by Hanai-Bruggeman’s model, while Figure 3.12(b) shows the
measured properties for the four types of composites versus predictions by Maxwell’s model.
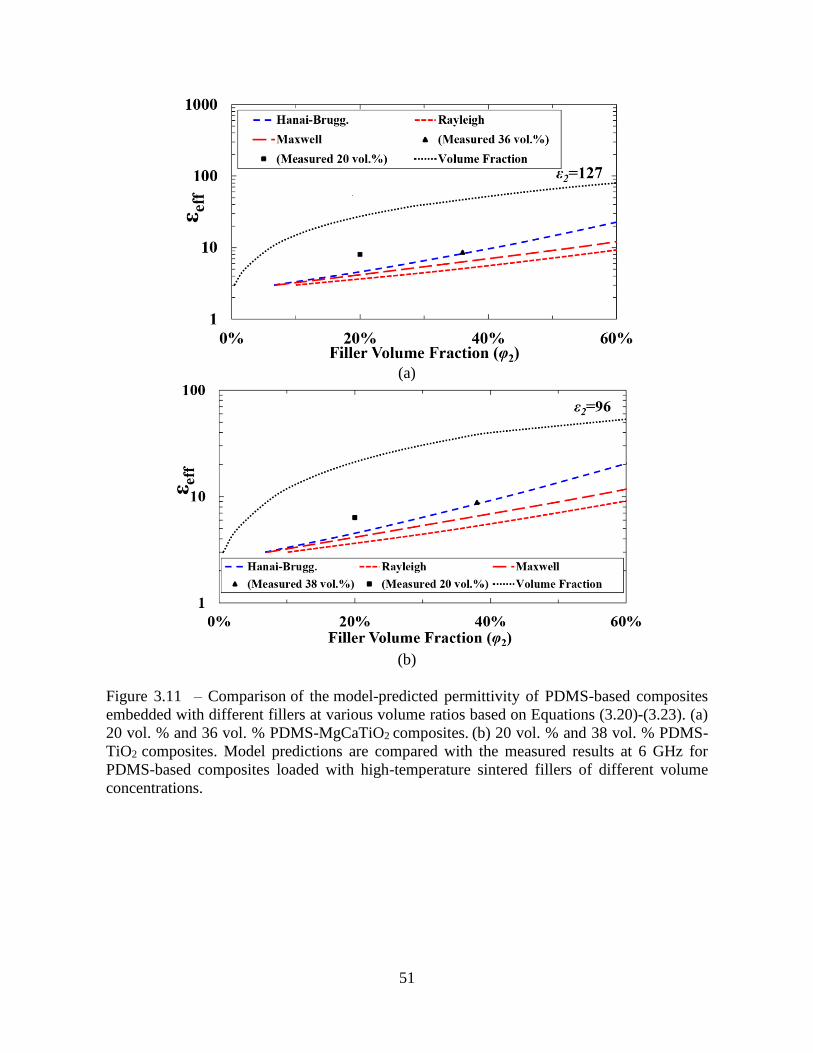
51
(a)
(b)
Figure 3.11 – Comparison of the model-predicted permittivity of PDMS-based composites
embedded with different fillers at various volume ratios based on Equations (3.20)-(3.23). (a)
20 vol. % and 36 vol. % PDMS-MgCaTiO2 composites. (b) 20 vol. % and 38 vol. % PDMS-
TiO2 composites. Model predictions are compared with the measured results at 6 GHz for
PDMS-based composites loaded with high-temperature sintered fillers of different volume
concentrations.
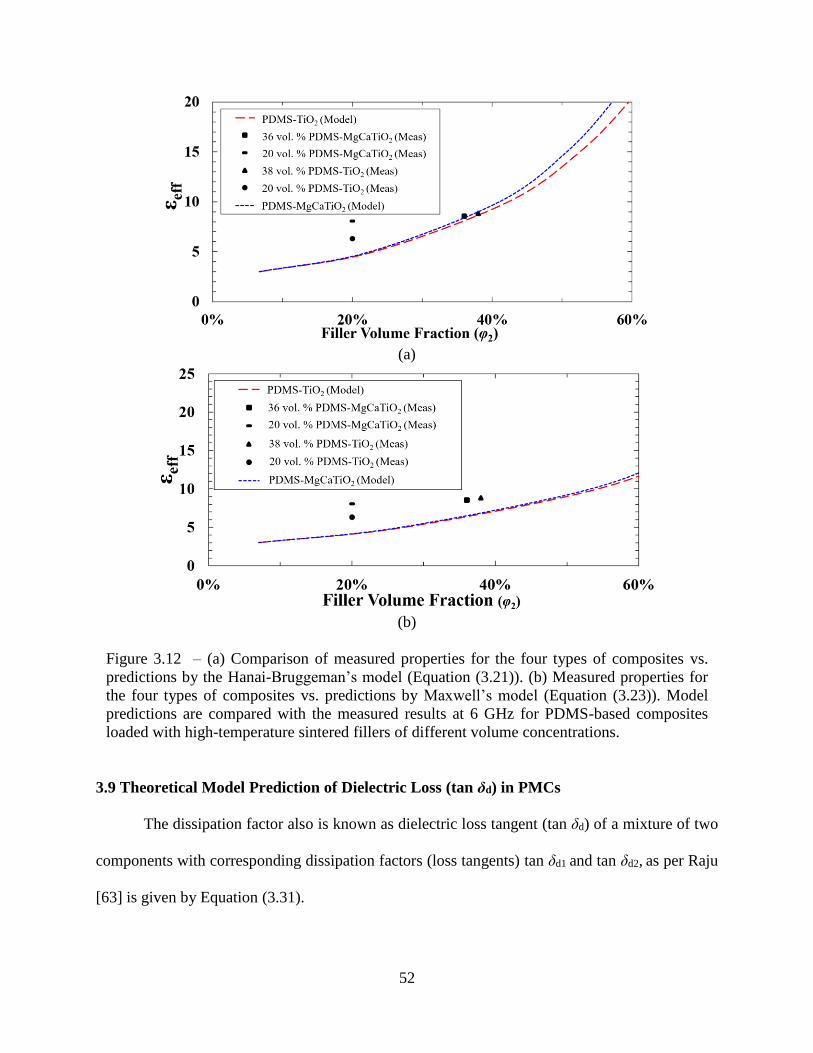
52
(a)
(b)
Figure 3.12 – (a) Comparison of measured properties for the four types of composites vs.
predictions by the Hanai-Bruggeman’s model (Equation (3.21)). (b) Measured properties for
the four types of composites vs. predictions by Maxwell’s model (Equation (3.23)). Model
predictions are compared with the measured results at 6 GHz for PDMS-based composites
loaded with high-temperature sintered fillers of different volume concentrations.
3.9 Theoretical Model Prediction of Dielectric Loss (tan δd) in PMCs
The dissipation factor also is known as dielectric loss tangent (tan δd) of a mixture of two
components with corresponding dissipation factors (loss tangents) tan δd1 and tan δd2, as per Raju
[63] is given by Equation (3.31).
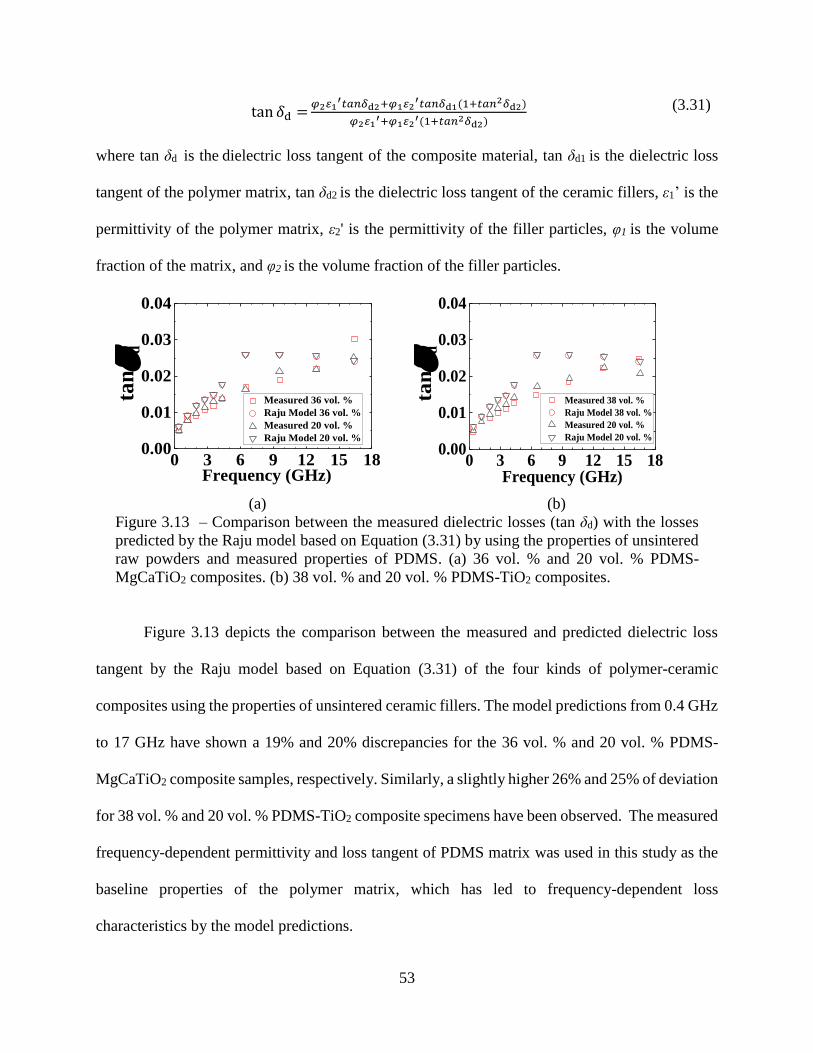
53
tan 𝛿d =𝜑2 1
′𝑡𝑎𝑛𝛿d2+𝜑1 2′𝑡𝑎𝑛𝛿d1(1+𝑡𝑎𝑛2𝛿d2)
𝜑2 1′+𝜑1 2
′(1+𝑡𝑎𝑛2𝛿d2) (3.31)
where tan δd is the dielectric loss tangent of the composite material, tan δd1 is the dielectric loss
tangent of the polymer matrix, tan δd2 is the dielectric loss tangent of the ceramic fillers, ε1’ is the
permittivity of the polymer matrix, ε2' is the permittivity of the filler particles, φ1 is the volume
fraction of the matrix, and φ2 is the volume fraction of the filler particles.
0 3 6 9 12 15 180.00
0.01
0.02
0.03
0.04
tan
d
Frequency (GHz)
Measured 36 vol. %
Raju Model 36 vol. %
Measured 20 vol. %
Raju Model 20 vol. %
0 3 6 9 12 15 180.00
0.01
0.02
0.03
0.04
tan
d
Frequency (GHz)
Measured 38 vol. %
Raju Model 38 vol. %
Measured 20 vol. %
Raju Model 20 vol. %
(a) (b)
Figure 3.13 – Comparison between the measured dielectric losses (tan δd) with the losses
predicted by the Raju model based on Equation (3.31) by using the properties of unsintered
raw powders and measured properties of PDMS. (a) 36 vol. % and 20 vol. % PDMS-
MgCaTiO2 composites. (b) 38 vol. % and 20 vol. % PDMS-TiO2 composites.
Figure 3.13 depicts the comparison between the measured and predicted dielectric loss
tangent by the Raju model based on Equation (3.31) of the four kinds of polymer-ceramic
composites using the properties of unsintered ceramic fillers. The model predictions from 0.4 GHz
to 17 GHz have shown a 19% and 20% discrepancies for the 36 vol. % and 20 vol. % PDMS-
MgCaTiO2 composite samples, respectively. Similarly, a slightly higher 26% and 25% of deviation
for 38 vol. % and 20 vol. % PDMS-TiO2 composite specimens have been observed. The measured
frequency-dependent permittivity and loss tangent of PDMS matrix was used in this study as the
baseline properties of the polymer matrix, which has led to frequency-dependent loss
characteristics by the model predictions.
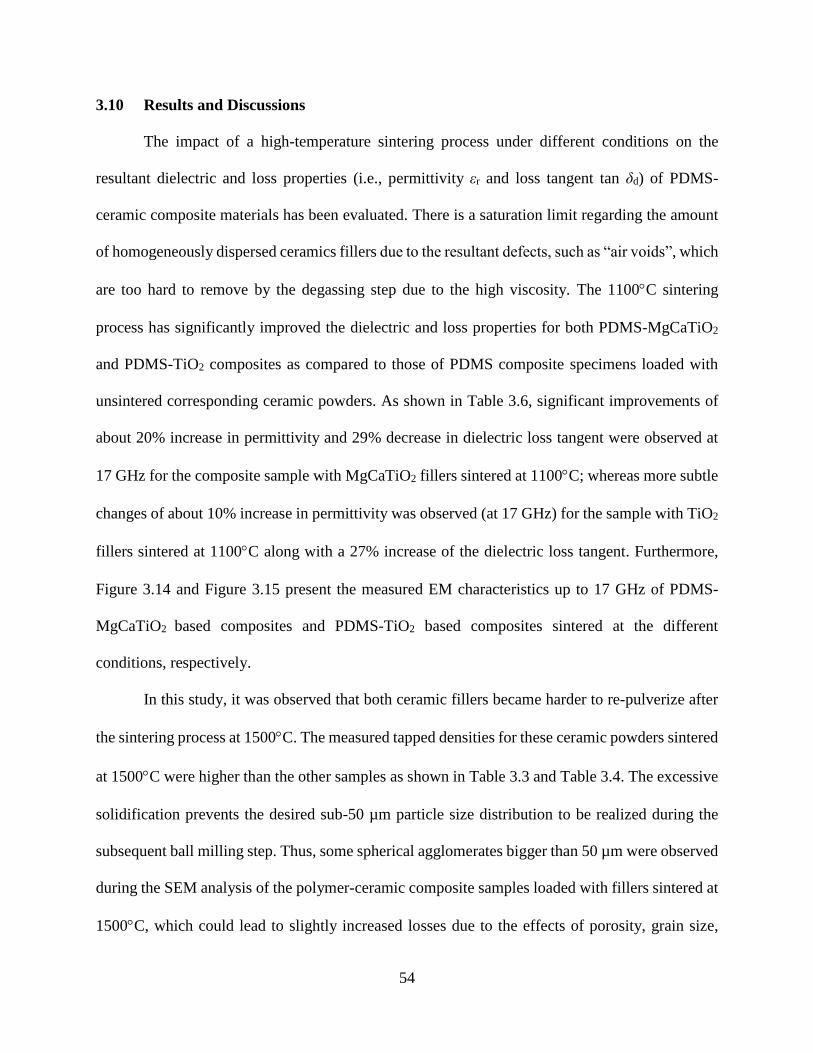
54
3.10 Results and Discussions
The impact of a high-temperature sintering process under different conditions on the
resultant dielectric and loss properties (i.e., permittivity εr and loss tangent tan δd) of PDMS-
ceramic composite materials has been evaluated. There is a saturation limit regarding the amount
of homogeneously dispersed ceramics fillers due to the resultant defects, such as “air voids”, which
are too hard to remove by the degassing step due to the high viscosity. The 1100C sintering
process has significantly improved the dielectric and loss properties for both PDMS-MgCaTiO2
and PDMS-TiO2 composites as compared to those of PDMS composite specimens loaded with
unsintered corresponding ceramic powders. As shown in Table 3.6, significant improvements of
about 20% increase in permittivity and 29% decrease in dielectric loss tangent were observed at
17 GHz for the composite sample with MgCaTiO2 fillers sintered at 1100C; whereas more subtle
changes of about 10% increase in permittivity was observed (at 17 GHz) for the sample with TiO2
fillers sintered at 1100C along with a 27% increase of the dielectric loss tangent. Furthermore,
Figure 3.14 and Figure 3.15 present the measured EM characteristics up to 17 GHz of PDMS-
MgCaTiO2 based composites and PDMS-TiO2 based composites sintered at the different
conditions, respectively.
In this study, it was observed that both ceramic fillers became harder to re-pulverize after
the sintering process at 1500C. The measured tapped densities for these ceramic powders sintered
at 1500C were higher than the other samples as shown in Table 3.3 and Table 3.4. The excessive
solidification prevents the desired sub-50 µm particle size distribution to be realized during the
subsequent ball milling step. Thus, some spherical agglomerates bigger than 50 µm were observed
during the SEM analysis of the polymer-ceramic composite samples loaded with fillers sintered at
1500C, which could lead to slightly increased losses due to the effects of porosity, grain size,
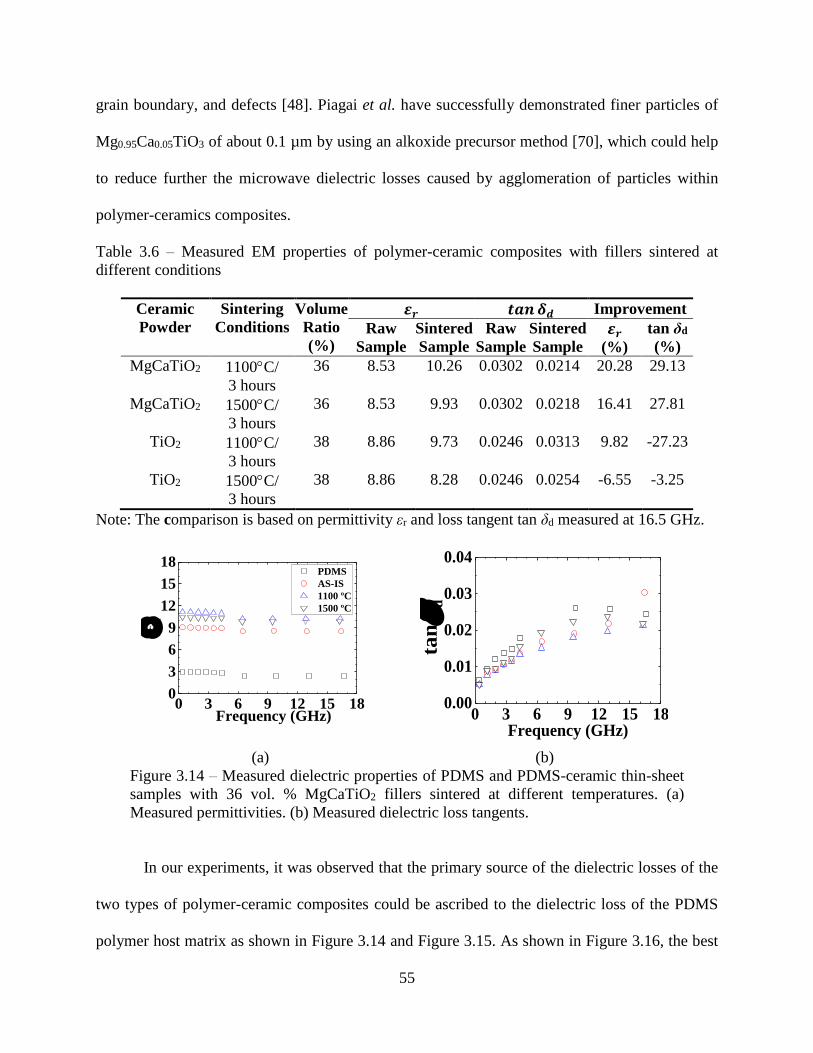
55
grain boundary, and defects [48]. Piagai et al. have successfully demonstrated finer particles of
Mg0.95Ca0.05TiO3 of about 0.1 µm by using an alkoxide precursor method [70], which could help
to reduce further the microwave dielectric losses caused by agglomeration of particles within
polymer-ceramics composites.
Table 3.6 – Measured EM properties of polymer-ceramic composites with fillers sintered at
different conditions
Ceramic
Powder
Sintering
Conditions
Volume
Ratio
(%)
𝜺𝒓 𝒕𝒂𝒏𝜹𝒅 Improvement
Raw
Sample
Sintered
Sample
Raw
Sample
Sintered
Sample
𝜺𝒓
(%)
tan δd
(%)
MgCaTiO2 1100C/
3 hours
36 8.53 10.26 0.0302 0.0214 20.28 29.13
MgCaTiO2 1500C/
3 hours
36 8.53 9.93 0.0302 0.0218 16.41 27.81
TiO2 1100C/
3 hours
38 8.86 9.73 0.0246 0.0313 9.82 -27.23
TiO2 1500C/
3 hours
38 8.86 8.28 0.0246 0.0254 -6.55 -3.25
Note: The comparison is based on permittivity εr and loss tangent tan δd measured at 16.5 GHz.
0 3 6 9 12 15 180
3
6
9
12
15
18 PDMS
AS-IS
1100 ºC
1500 ºC
r
Frequency (GHz)
0 3 6 9 12 15 180.00
0.01
0.02
0.03
0.04
tan
d
Frequency (GHz)
(a) (b)
Figure 3.14 – Measured dielectric properties of PDMS and PDMS-ceramic thin-sheet
samples with 36 vol. % MgCaTiO2 fillers sintered at different temperatures. (a)
Measured permittivities. (b) Measured dielectric loss tangents.
In our experiments, it was observed that the primary source of the dielectric losses of the
two types of polymer-ceramic composites could be ascribed to the dielectric loss of the PDMS
polymer host matrix as shown in Figure 3.14 and Figure 3.15. As shown in Figure 3.16, the best
56
balance between high-permittivity and low-loss at high-frequency region was achieved with the
36 vol. % and 49 vol. % PDMS-MgCaTiO2 composite specimens. Composite materials with
MgCaTiO2 and TiO2 fillers have shown nearly frequency-independent permittivities. At the same
time, loss tangents slightly lower than that of pure PDMS have been realized as opposed to prior
works [38]-[42] as shown in Table 3.7. Evidently, the incorporation of low-loss and high-k ceramic
fillers not only effectively increases the permittivity but also in most of the cases slightly lowers
the overall effective dielectric loss.
0 3 6 9 12 15 180
3
6
9
12
15
18
r
Frequency (GHz)
PDMS
AS-IS
1100 ºC
1500 ºC
0 3 6 9 12 15 180.00
0.01
0.02
0.03
0.04
tan
d
Frequency (GHz)
(a) (b)
Figure 3.15 – Measured dielectric properties of PDMS and PDMS-ceramic thin-sheet
samples with 38 vol. % TiO2 fillers sintered at different temperatures. (a) Measured
permittivities. (b) Measured dielectric loss tangents.
As shown in Figure 3.16, the measured dielectric permittivity and loss tangent of the 36
vol. % and 49 vol. % PDMS-MgCaTiO2 composites are superior to those of widely-used “FR-4”
epoxy microwave laminates with woven fiberglass enforcement at frequencies up to 20 GHz and
8 GHz, respectively. In fact, these results are no longer far behind the characteristics of some
commercial rigid high-end microwave laminates such as TMM13i® from Rogers Corporation,
which are composed of hydrocarbon thermoset polymer loaded with BaTiO microfillers and the
RT/duroid® 6010LM laminate, which consist of ceramic-PTFE composites based on TiO2
microfillers, respectively [71], [72]. Therefore, this new class of mass-producible high-k, low-loss,
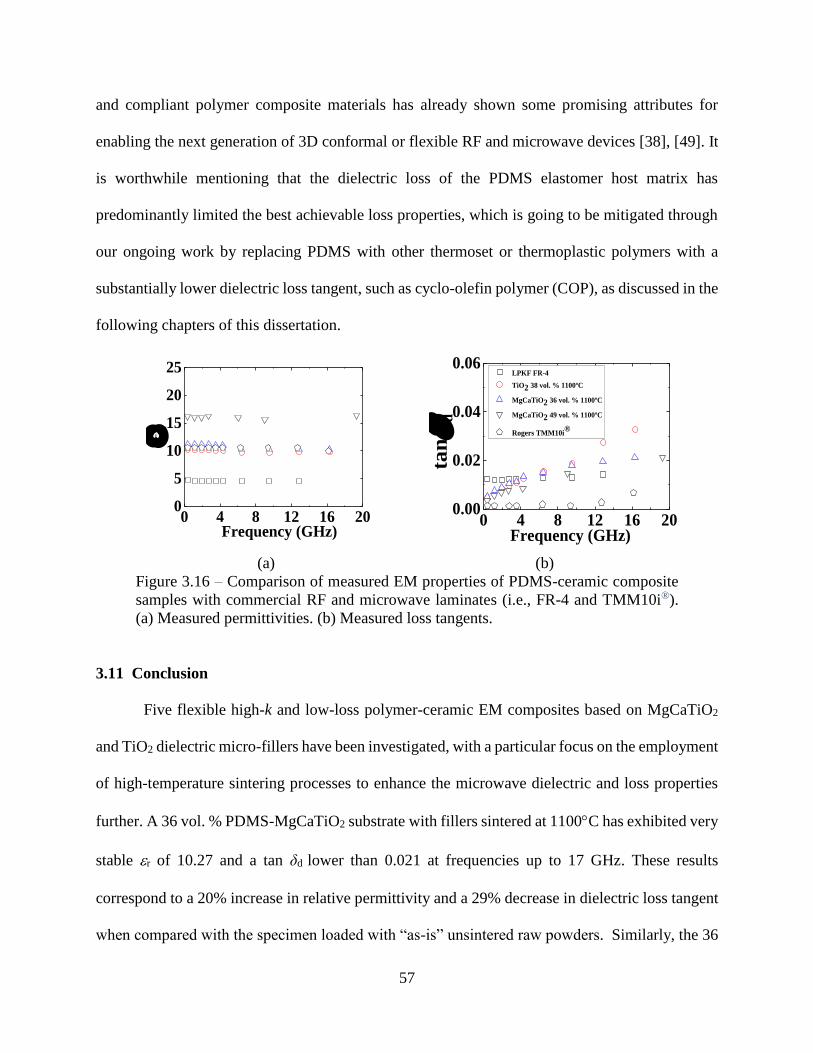
57
and compliant polymer composite materials has already shown some promising attributes for
enabling the next generation of 3D conformal or flexible RF and microwave devices [38], [49]. It
is worthwhile mentioning that the dielectric loss of the PDMS elastomer host matrix has
predominantly limited the best achievable loss properties, which is going to be mitigated through
our ongoing work by replacing PDMS with other thermoset or thermoplastic polymers with a
substantially lower dielectric loss tangent, such as cyclo-olefin polymer (COP), as discussed in the
following chapters of this dissertation.
0 4 8 12 16 200
5
10
15
20
25
r
Frequency (GHz)
0 4 8 12 16 200.00
0.02
0.04
0.06 LPKF FR-4
TiO2 38 vol. % 1100ºC
MgCaTiO2 36 vol. % 1100ºC
MgCaTiO2 49 vol. % 1100ºC
Rogers TMM10i®
tan
d
Frequency (GHz)
(a) (b)
Figure 3.16 – Comparison of measured EM properties of PDMS-ceramic composite
samples with commercial RF and microwave laminates (i.e., FR-4 and TMM10i®).
(a) Measured permittivities. (b) Measured loss tangents.
3.11 Conclusion
Five flexible high-k and low-loss polymer-ceramic EM composites based on MgCaTiO2
and TiO2 dielectric micro-fillers have been investigated, with a particular focus on the employment
of high-temperature sintering processes to enhance the microwave dielectric and loss properties
further. A 36 vol. % PDMS-MgCaTiO2 substrate with fillers sintered at 1100C has exhibited very
stable r of 10.27 and a tan δd lower than 0.021 at frequencies up to 17 GHz. These results
correspond to a 20% increase in relative permittivity and a 29% decrease in dielectric loss tangent
when compared with the specimen loaded with “as-is” unsintered raw powders. Similarly, the 36
58
vol. % PDMS-MgCaTiO2 composites with 1500C sintered fillers have exhibited a stable r of
9.93 and tan δd lower than 0.021 at frequencies up to 17 GHz. These results correspond to an
enhancement of 16% regarding relative permittivity and a 28% decrease in dielectric loss tangent
when compared with the specimen loaded with the same concentration of unsintered raw powders.
Moreover the 49 vol. % loaded PDMS-MgCaTiO2 composite thin-sheet specimen with particles
sintered at 1100C has exhibited a dielectric permittivity r of 16.33 and a low tan δd lower than
0.021 at frequencies up to 19 GHz. On the contrary, 38 vol. % PDMS-TiO2 sample with particles
sintered at 1100C has exhibited a r of 9.73 and slightly higher tan δd lower than 0.031 at
frequencies up to 17 GHz, which suggests an enhancement of 10% in relative permittivity along
with a 27% increase of the dielectric loss tangent as compared to those of specimen loaded with
unsintered raw powders. Meanwhile, a 38 vol. % PDMS-TiO2 sample with particles sintered at
1500C has exhibited a very stable r of 8.28 and a tan δd lower than 0.025 at frequencies up to 17
GHz, which suggests a 7% decrease of in the relative permittivity and a 3% increase of the
dielectric loss tangent. Localized characterization of the ceramic composites was performed using
a custom-built near-field microwave microscopy (NFMM) tool operating at 5 GHz. NFMM
images revealed the non-uniform distribution of the MgCaTiO2 and TiO2 ceramic particles in the
host matrix. It was found that over an area of 50 m 50 m, less particle filler dispersion
uniformity is achieved for PDMS-TiO2 composites as compared to that of PDMS-MgCaTiO2
composites. It is worthwhile mentioning that the measured microwave dielectric properties of both
composite elastomer substrates are superior to that of the widely-used FR-4 printed circuit boards
with respect to both higher relative permittivity and similar dielectric losses. These new classes of
high-k, low-loss, and compliant polymer-ceramic composite materials has already shown some

59
promising attributes for enabling the next generation of 3D conformal or flexible RF and
microwave devices up to the Ku and K-bands.
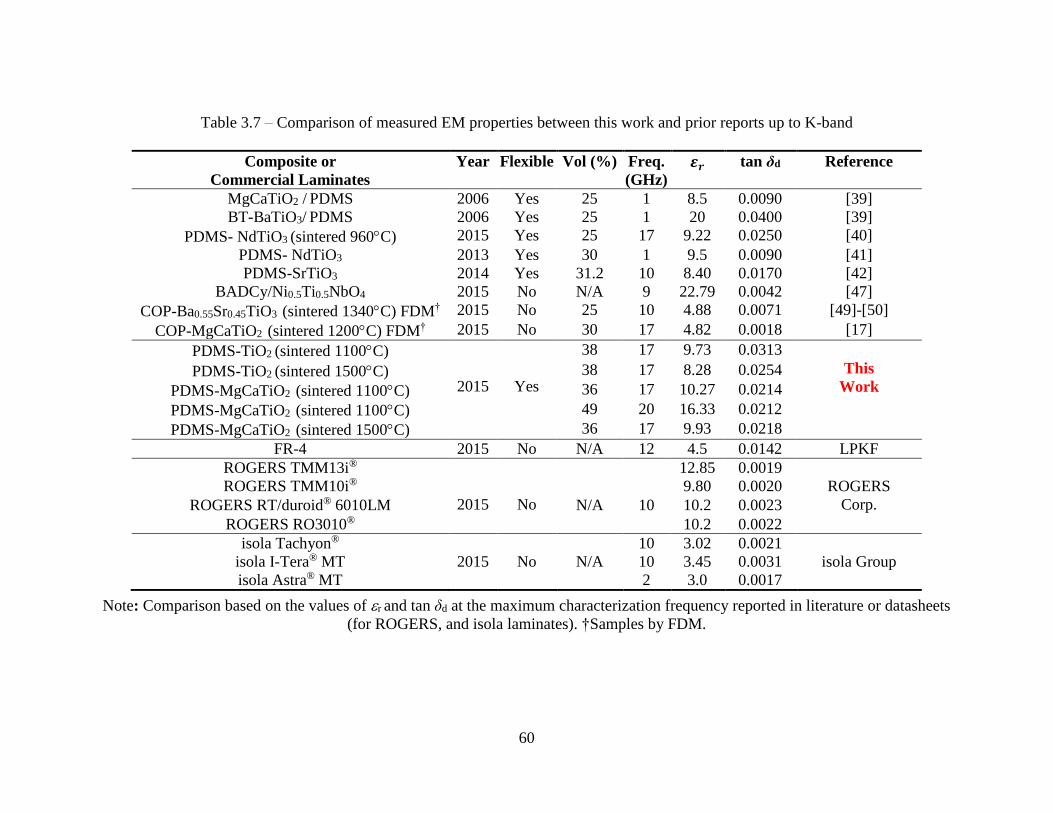
60
Table 3.7 – Comparison of measured EM properties between this work and prior reports up to K-band
Composite or
Commercial Laminates
Year Flexible Vol (%) Freq.
(GHz)
𝜺𝒓 tan δd Reference
MgCaTiO2 / PDMS 2006 Yes 25 1 8.5 0.0090 [39]
BT-BaTiO3/ PDMS 2006 Yes 25 1 20 0.0400 [39]
PDMS- NdTiO3 (sintered 960C) 2015 Yes 25 17 9.22 0.0250 [40]
PDMS- NdTiO3 2013 Yes 30 1 9.5 0.0090 [41]
PDMS-SrTiO3 2014 Yes 31.2 10 8.40 0.0170 [42]
BADCy/Ni0.5Ti0.5NbO4 2015 No N/A 9 22.79 0.0042 [47]
COP-Ba0.55Sr0.45TiO3 (sintered 1340C) FDM† 2015 No 25 10 4.88 0.0071 [49]-[50]
COP-MgCaTiO2 (sintered 1200C) FDM† 2015 No 30 17 4.82 0.0018 [17]
PDMS-TiO2 (sintered 1100C)
2015
Yes
38 17 9.73 0.0313
This
Work PDMS-TiO2 (sintered 1500C) 38 17 8.28 0.0254
PDMS-MgCaTiO2 (sintered 1100C) 36 17 10.27 0.0214
PDMS-MgCaTiO2 (sintered 1100C) 49 20 16.33 0.0212
PDMS-MgCaTiO2 (sintered 1500C) 36 17 9.93 0.0218
FR-4 2015 No N/A 12 4.5 0.0142 LPKF
ROGERS TMM13i®
2015
No
12.85 0.0019
ROGERS
Corp.
ROGERS TMM10i® 9.80 0.0020
ROGERS RT/duroid® 6010LM N/A 10 10.2 0.0023
ROGERS RO3010® 10.2 0.0022
isola Tachyon® 10 3.02 0.0021
isola I-Tera® MT 2015 No N/A 10 3.45 0.0031 isola Group
isola Astra® MT 2 3.0 0.0017
Note: Comparison based on the values of r and tan δd at the maximum characterization frequency reported in literature or datasheets
(for ROGERS, and isola laminates). †Samples by FDM.
61
CHAPTER 4 :
FLEXIBLE EM COMPOSITES AND THEIR APPLICATION TO K-BAND ANTENNAS
4.1 Note to Reader
Portions of this chapter, including figures have been previously published in [38], [40],
[49], and [50], which have been reproduced with permission from IEEE Microwave Theory and
Techniques Society, and from the International Microelectronics Assembly and Packaging Society
and Microelectronics Foundation. Permissions are included in Appendix A.
4.2 Introduction
In this chapter, four types of high-permittivity and low-loss EM composites based on a
Polydimethylsiloxane (PDMS) reinforced by Ba0.55Sr0.45TiO3 or MgCaTiO2 micro-particle fillers
with volume loading concentration up to 49 vol. % have been prepared and characterized up to 20
GHz using cavity resonators. These high-k ceramic powders were sintered at temperatures up to
1500C to further enhance their dielectric properties. The 49 vol. % loaded PDMS-Ba0.55Sr0.45TiO3
composites loaded with 1340C sintered fillers have exhibited a dielectric permittivity r of 23.51
and a dielectric loss tangent tan δd less than 0.047 at frequencies up to 20 GHz. Meanwhile the 39
vol. % loaded PDMS-Ba0.55Sr0.45TiO3 composites with 1340C sintered fillers have an r of 15.02
and a tan δd less than 0.042 at frequencies up to 16 GHz. On the other hand, the 37 vol. % loaded
PDMS-MgCaTiO2 composites with 1100C sintered fillers have an r of 12.19 and a tan δd less
than 0.021 at frequencies up to 20 GHz. The 49 vol. % loaded PDMS-MgCaTiO2 composite
specimen has a measured r of 16.33 and a tan δd less than 0.021 between 0.4 and 20 GHz. As a
demonstration of a device prototype, a 19.6 GHz microstrip patch antenna was printed by
62
employing a molded PDMS-MgCaTiO2 composite substrate and micro-dispensed silver paste
(CB028) to form the conductive layer, which has achieved 20 dB return loss and about 10%
bandwidth. Evidently, these newly developed polymer-ceramic composites are well suited for
applications up to the K-band and are amenable to be adopted to 3D printing technologies.
4.3 Experimental Procedure
In this chapter, the systematic sample preparation approach discussed in Chapter 3 has been
adopted to develop high-k and low-loss polymer-ceramic composites based on different ceramic
fillers sintered under different conditions. Four types of polymer-ceramic composites were
prepared by homogeneous dispersion of high-k titanate fillers, such as MgCaTiO2 from Trans-Tech
Inc. and Ba0.55Sr0.45TiO3 from Ferro Corporation with particle loading concentration up to 49 vol.
%. The measured material properties are shown in Table 4.4.
This chapter reports an assessment of applications of PDMS-ceramic composites to
fabricate flexible substrates for the implementation of microstrip edge-fed patch antennas
operating at 19.6 GHz. Note that the batch of MgCaTiO2 (MCT-140) material used in this study is
different than the material used and reported in Chapter 3. In particular, different bulk dielectric
properties have been observed as shown in Table 4.4.
4.4 Preparation and Characterization PDMS-Ceramic Composites
4.4.1 Ceramics Sintering Process
For the high-temperature sintering process, zirconia trays are used together with two
sintering furnaces both in air. One is an Omegalux LMF-3550 box furnace (Omega Engineering,
Stamford, CT) that works up to 1100C and the other is a KSL 1700X box furnace (MTI
Corporation, Richmond, CA) that operates up to 1700C. The applied sintering conditions are
described in Table 4.1. These temperatures were strategically selected to evaluate how the ceramic
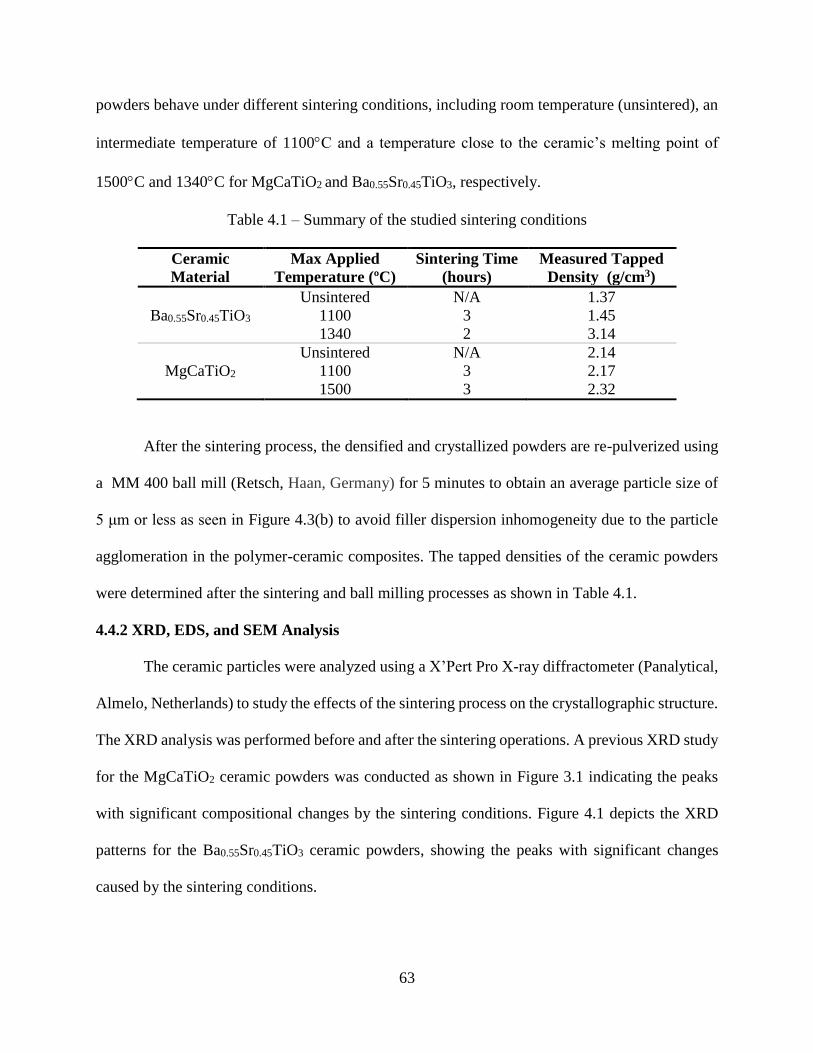
63
powders behave under different sintering conditions, including room temperature (unsintered), an
intermediate temperature of 1100C and a temperature close to the ceramic’s melting point of
1500C and 1340C for MgCaTiO2 and Ba0.55Sr0.45TiO3, respectively.
Table 4.1 – Summary of the studied sintering conditions
Ceramic
Material
Max Applied
Temperature (ºC)
Sintering Time
(hours)
Measured Tapped
Density (g/cm3)
Unsintered N/A 1.37
Ba0.55Sr0.45TiO3 1100 3 1.45
1340 2 3.14
Unsintered N/A 2.14
MgCaTiO2 1100 3 2.17
1500 3 2.32
After the sintering process, the densified and crystallized powders are re-pulverized using
a MM 400 ball mill (Retsch, Haan, Germany) for 5 minutes to obtain an average particle size of
5 μm or less as seen in Figure 4.3(b) to avoid filler dispersion inhomogeneity due to the particle
agglomeration in the polymer-ceramic composites. The tapped densities of the ceramic powders
were determined after the sintering and ball milling processes as shown in Table 4.1.
4.4.2 XRD, EDS, and SEM Analysis
The ceramic particles were analyzed using a X’Pert Pro X-ray diffractometer (Panalytical,
Almelo, Netherlands) to study the effects of the sintering process on the crystallographic structure.
The XRD analysis was performed before and after the sintering operations. A previous XRD study
for the MgCaTiO2 ceramic powders was conducted as shown in Figure 3.1 indicating the peaks
with significant compositional changes by the sintering conditions. Figure 4.1 depicts the XRD
patterns for the Ba0.55Sr0.45TiO3 ceramic powders, showing the peaks with significant changes
caused by the sintering conditions.
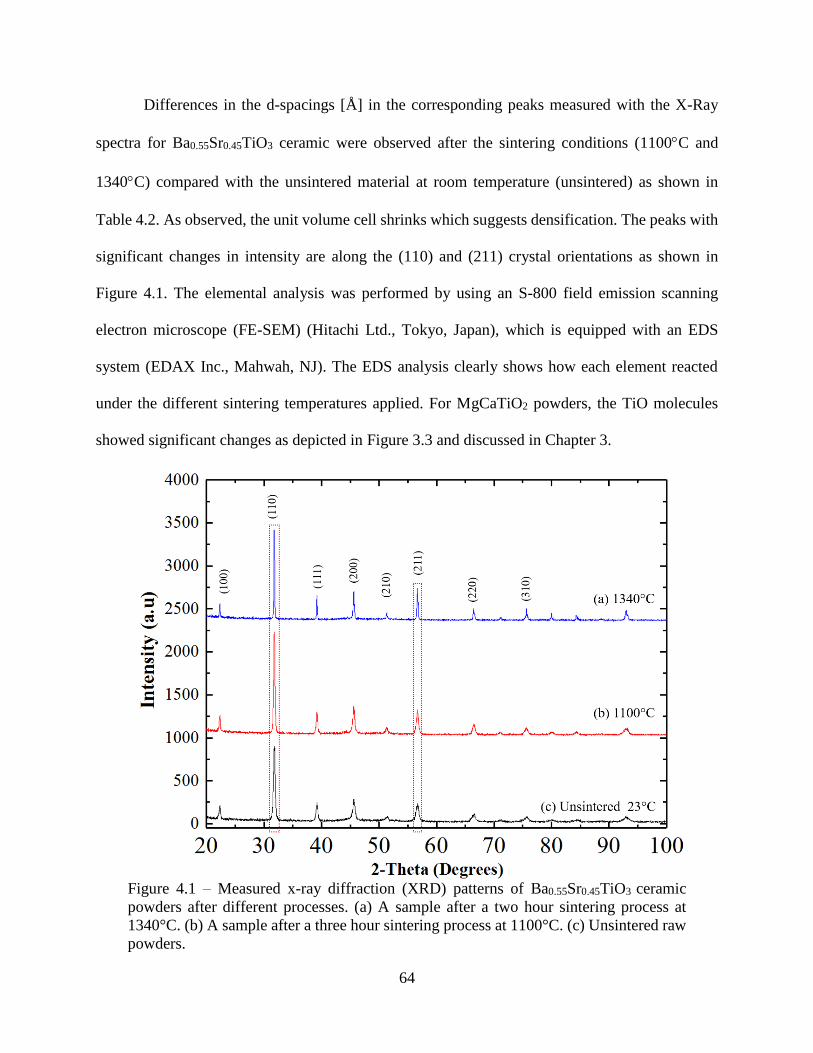
64
Differences in the d-spacings [Å] in the corresponding peaks measured with the X-Ray
spectra for Ba0.55Sr0.45TiO3 ceramic were observed after the sintering conditions (1100C and
1340C) compared with the unsintered material at room temperature (unsintered) as shown in
Table 4.2. As observed, the unit volume cell shrinks which suggests densification. The peaks with
significant changes in intensity are along the (110) and (211) crystal orientations as shown in
Figure 4.1. The elemental analysis was performed by using an S-800 field emission scanning
electron microscope (FE-SEM) (Hitachi Ltd., Tokyo, Japan), which is equipped with an EDS
system (EDAX Inc., Mahwah, NJ). The EDS analysis clearly shows how each element reacted
under the different sintering temperatures applied. For MgCaTiO2 powders, the TiO molecules
showed significant changes as depicted in Figure 3.3 and discussed in Chapter 3.
Figure 4.1 – Measured x-ray diffraction (XRD) patterns of Ba0.55Sr0.45TiO3 ceramic
powders after different processes. (a) A sample after a two hour sintering process at
1340°C. (b) A sample after a three hour sintering process at 1100°C. (c) Unsintered raw
powders.
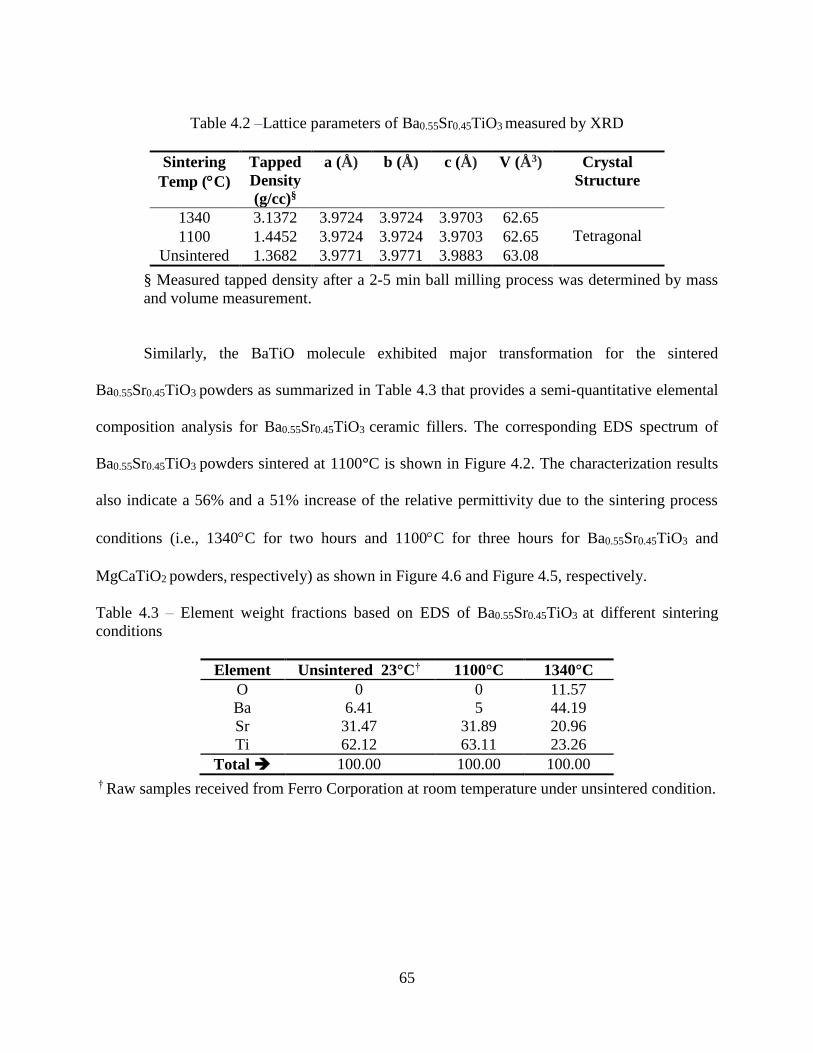
65
Table 4.2 –Lattice parameters of Ba0.55Sr0.45TiO3 measured by XRD
Sintering
Temp (C)
Tapped
Density
(g/cc)§
a (Å) b (Å) c (Å) V (Å3) Crystal
Structure
1340 3.1372 3.9724 3.9724 3.9703 62.65
Tetragonal 1100 1.4452 3.9724 3.9724 3.9703 62.65
Unsintered 1.3682 3.9771 3.9771 3.9883 63.08
§ Measured tapped density after a 2-5 min ball milling process was determined by mass
and volume measurement.
Similarly, the BaTiO molecule exhibited major transformation for the sintered
Ba0.55Sr0.45TiO3 powders as summarized in Table 4.3 that provides a semi-quantitative elemental
composition analysis for Ba0.55Sr0.45TiO3 ceramic fillers. The corresponding EDS spectrum of
Ba0.55Sr0.45TiO3 powders sintered at 1100°C is shown in Figure 4.2. The characterization results
also indicate a 56% and a 51% increase of the relative permittivity due to the sintering process
conditions (i.e., 1340C for two hours and 1100C for three hours for Ba0.55Sr0.45TiO3 and
MgCaTiO2 powders, respectively) as shown in Figure 4.6 and Figure 4.5, respectively.
Table 4.3 – Element weight fractions based on EDS of Ba0.55Sr0.45TiO3 at different sintering
conditions
Element Unsintered 23°C† 1100°C 1340°C
O 0 0 11.57
Ba 6.41 5 44.19
Sr 31.47 31.89 20.96
Ti 62.12 63.11 23.26
Total 100.00 100.00 100.00
† Raw samples received from Ferro Corporation at room temperature under unsintered condition.
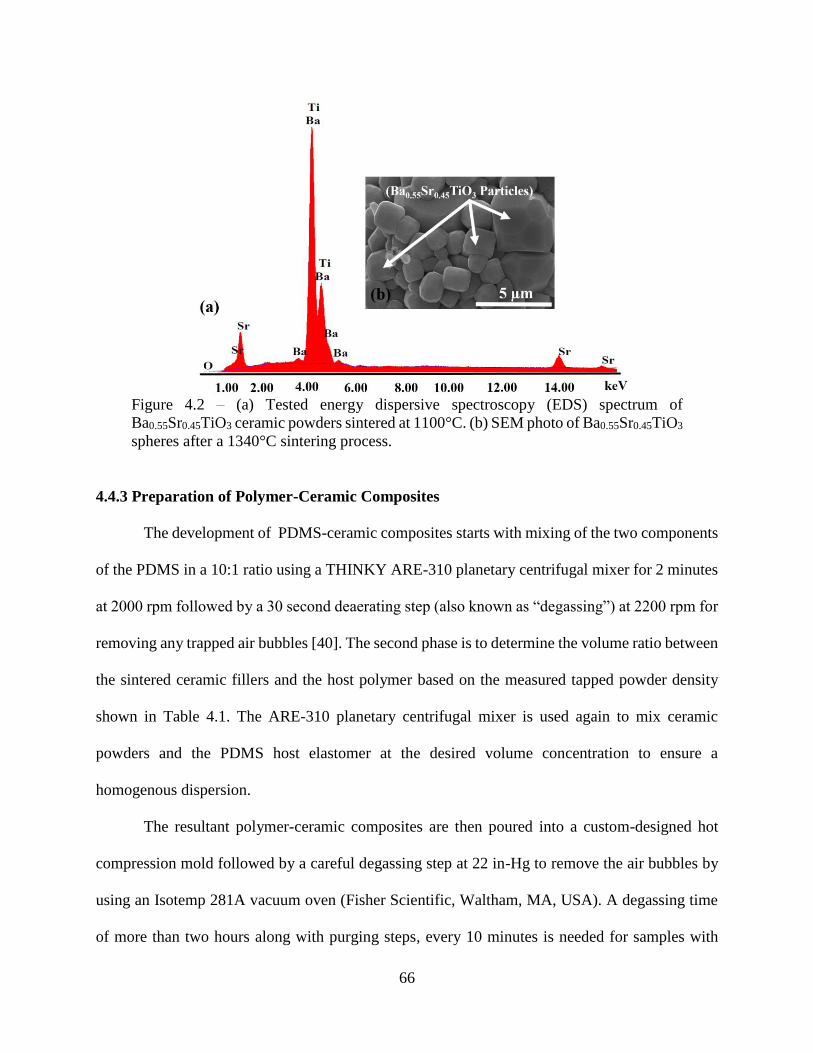
66
Figure 4.2 – (a) Tested energy dispersive spectroscopy (EDS) spectrum of
Ba0.55Sr0.45TiO3 ceramic powders sintered at 1100°C. (b) SEM photo of Ba0.55Sr0.45TiO3
spheres after a 1340°C sintering process.
4.4.3 Preparation of Polymer-Ceramic Composites
The development of PDMS-ceramic composites starts with mixing of the two components
of the PDMS in a 10:1 ratio using a THINKY ARE-310 planetary centrifugal mixer for 2 minutes
at 2000 rpm followed by a 30 second deaerating step (also known as “degassing”) at 2200 rpm for
removing any trapped air bubbles [40]. The second phase is to determine the volume ratio between
the sintered ceramic fillers and the host polymer based on the measured tapped powder density
shown in Table 4.1. The ARE-310 planetary centrifugal mixer is used again to mix ceramic
powders and the PDMS host elastomer at the desired volume concentration to ensure a
homogenous dispersion.
The resultant polymer-ceramic composites are then poured into a custom-designed hot
compression mold followed by a careful degassing step at 22 in-Hg to remove the air bubbles by
using an Isotemp 281A vacuum oven (Fisher Scientific, Waltham, MA, USA). A degassing time
of more than two hours along with purging steps, every 10 minutes is needed for samples with
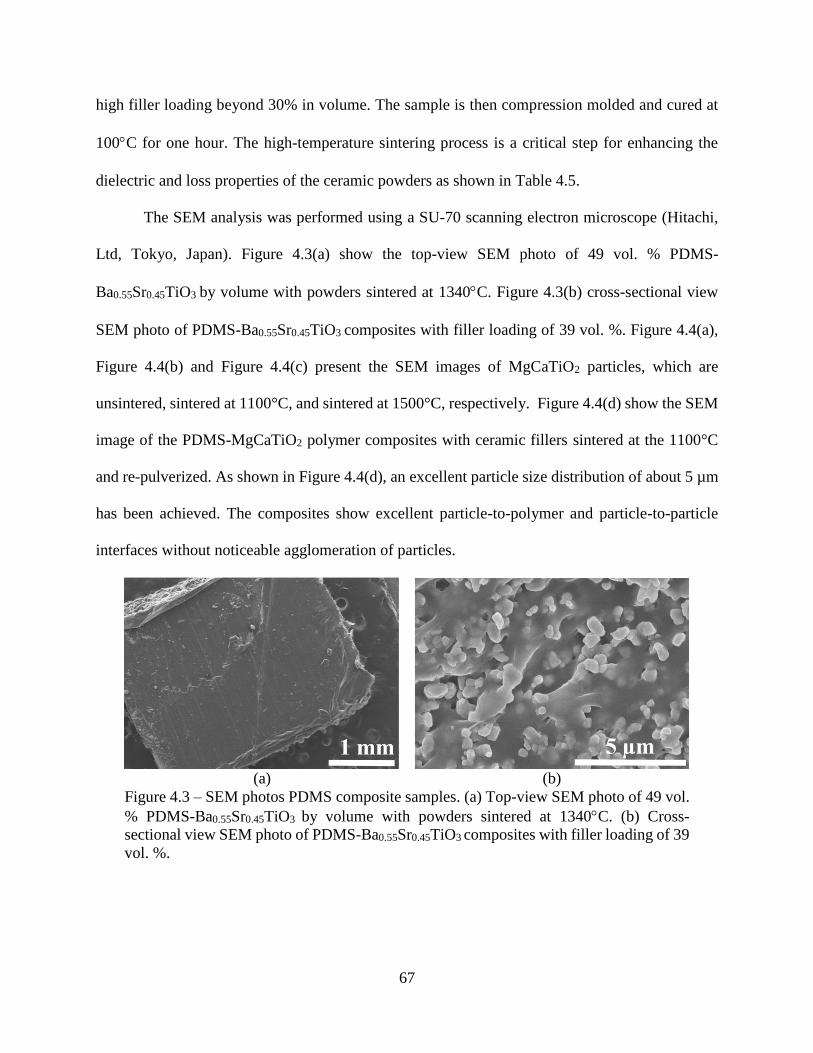
67
high filler loading beyond 30% in volume. The sample is then compression molded and cured at
100C for one hour. The high-temperature sintering process is a critical step for enhancing the
dielectric and loss properties of the ceramic powders as shown in Table 4.5.
The SEM analysis was performed using a SU-70 scanning electron microscope (Hitachi,
Ltd, Tokyo, Japan). Figure 4.3(a) show the top-view SEM photo of 49 vol. % PDMS-
Ba0.55Sr0.45TiO3 by volume with powders sintered at 1340C. Figure 4.3(b) cross-sectional view
SEM photo of PDMS-Ba0.55Sr0.45TiO3 composites with filler loading of 39 vol. %. Figure 4.4(a),
Figure 4.4(b) and Figure 4.4(c) present the SEM images of MgCaTiO2 particles, which are
unsintered, sintered at 1100°C, and sintered at 1500°C, respectively. Figure 4.4(d) show the SEM
image of the PDMS-MgCaTiO2 polymer composites with ceramic fillers sintered at the 1100°C
and re-pulverized. As shown in Figure 4.4(d), an excellent particle size distribution of about 5 µm
has been achieved. The composites show excellent particle-to-polymer and particle-to-particle
interfaces without noticeable agglomeration of particles.
(a) (b)
Figure 4.3 – SEM photos PDMS composite samples. (a) Top-view SEM photo of 49 vol.
% PDMS-Ba0.55Sr0.45TiO3 by volume with powders sintered at 1340C. (b) Cross-
sectional view SEM photo of PDMS-Ba0.55Sr0.45TiO3 composites with filler loading of 39
vol. %.
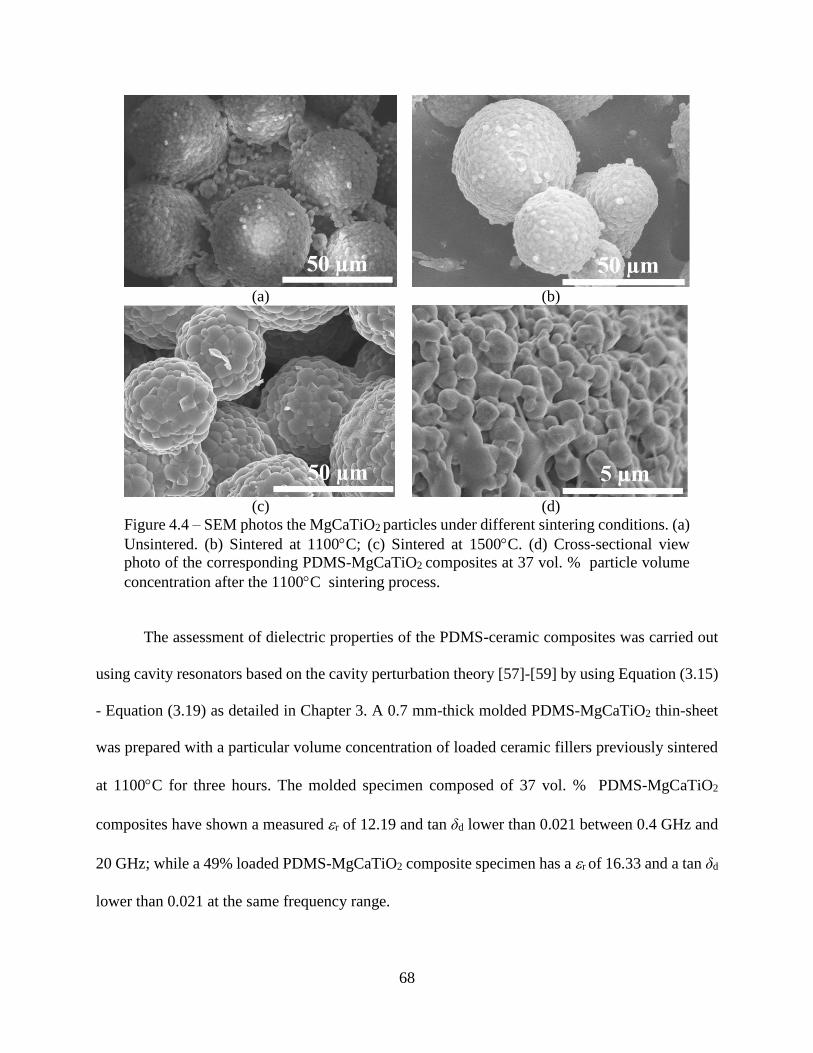
68
(a) (b)
(c) (d)
Figure 4.4 – SEM photos the MgCaTiO2 particles under different sintering conditions. (a)
Unsintered. (b) Sintered at 1100C; (c) Sintered at 1500C. (d) Cross-sectional view
photo of the corresponding PDMS-MgCaTiO2 composites at 37 vol. % particle volume
concentration after the 1100C sintering process.
The assessment of dielectric properties of the PDMS-ceramic composites was carried out
using cavity resonators based on the cavity perturbation theory [57]-[59] by using Equation (3.15)
- Equation (3.19) as detailed in Chapter 3. A 0.7 mm-thick molded PDMS-MgCaTiO2 thin-sheet
was prepared with a particular volume concentration of loaded ceramic fillers previously sintered
at 1100C for three hours. The molded specimen composed of 37 vol. % PDMS-MgCaTiO2
composites have shown a measured r of 12.19 and tan δd lower than 0.021 between 0.4 GHz and
20 GHz; while a 49% loaded PDMS-MgCaTiO2 composite specimen has a r of 16.33 and a tan δd
lower than 0.021 at the same frequency range.
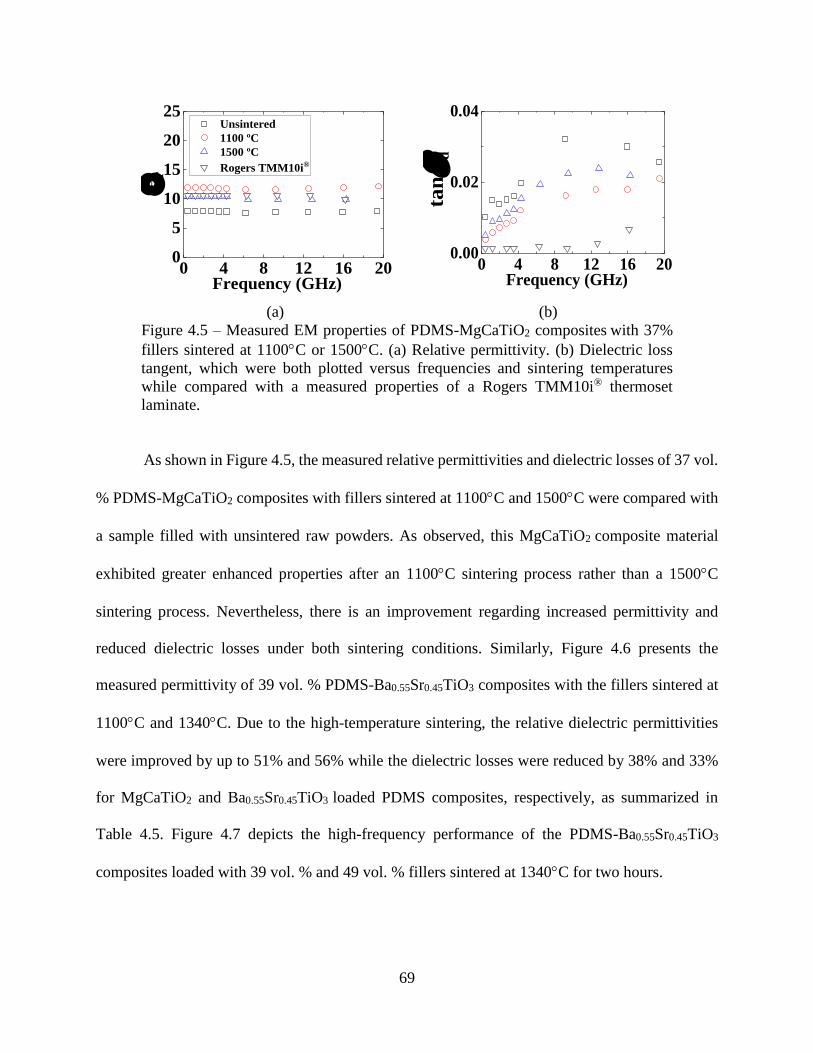
69
0 4 8 12 16 200
5
10
15
20
25
r
Frequency (GHz)
Unsintered
1100 ºC
1500 ºC
Rogers TMM10i®
0 4 8 12 16 200.00
0.02
0.04
tan
d
Frequency (GHz)
(a) (b)
Figure 4.5 – Measured EM properties of PDMS-MgCaTiO2 composites with 37%
fillers sintered at 1100C or 1500C. (a) Relative permittivity. (b) Dielectric loss
tangent, which were both plotted versus frequencies and sintering temperatures
while compared with a measured properties of a Rogers TMM10i® thermoset
laminate.
As shown in Figure 4.5, the measured relative permittivities and dielectric losses of 37 vol.
% PDMS-MgCaTiO2 composites with fillers sintered at 1100C and 1500C were compared with
a sample filled with unsintered raw powders. As observed, this MgCaTiO2 composite material
exhibited greater enhanced properties after an 1100C sintering process rather than a 1500C
sintering process. Nevertheless, there is an improvement regarding increased permittivity and
reduced dielectric losses under both sintering conditions. Similarly, Figure 4.6 presents the
measured permittivity of 39 vol. % PDMS-Ba0.55Sr0.45TiO3 composites with the fillers sintered at
1100C and 1340C. Due to the high-temperature sintering, the relative dielectric permittivities
were improved by up to 51% and 56% while the dielectric losses were reduced by 38% and 33%
for MgCaTiO2 and Ba0.55Sr0.45TiO3 loaded PDMS composites, respectively, as summarized in
Table 4.5. Figure 4.7 depicts the high-frequency performance of the PDMS-Ba0.55Sr0.45TiO3
composites loaded with 39 vol. % and 49 vol. % fillers sintered at 1340C for two hours.
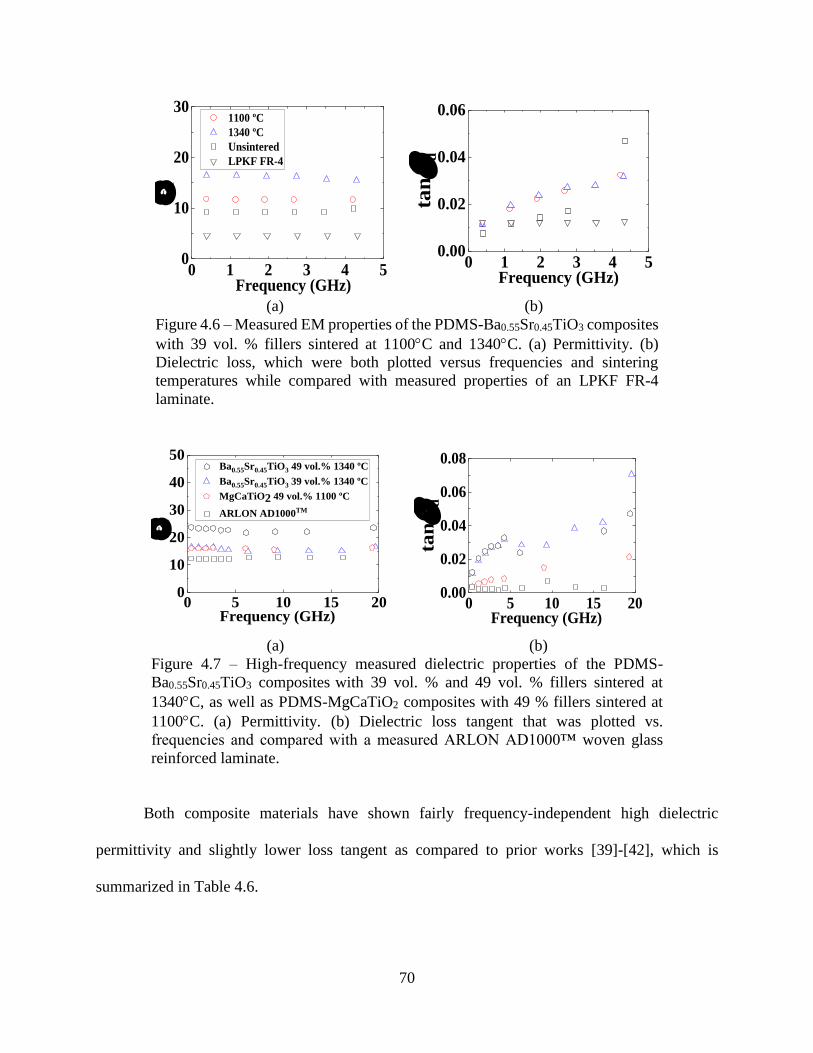
70
0 1 2 3 4 50
10
20
30 1100 ºC
1340 ºC
Unsintered
LPKF FR-4
r
Frequency (GHz)
0 1 2 3 4 50.00
0.02
0.04
0.06
tan
d
Frequency (GHz)
(a) (b)
Figure 4.6 – Measured EM properties of the PDMS-Ba0.55Sr0.45TiO3 composites
with 39 vol. % fillers sintered at 1100C and 1340C. (a) Permittivity. (b)
Dielectric loss, which were both plotted versus frequencies and sintering
temperatures while compared with measured properties of an LPKF FR-4
laminate.
0 5 10 15 200
10
20
30
40
50 Ba0.55Sr0.45TiO3 49 vol.% 1340 ºC
Ba0.55Sr0.45TiO3 39 vol.% 1340 ºC
MgCaTiO2 49 vol.% 1100 ºC
ARLON AD1000TM
r
Frequency (GHz) 0 5 10 15 20
0.00
0.02
0.04
0.06
0.08
tan
d
Frequency (GHz)
(a) (b)
Figure 4.7 – High-frequency measured dielectric properties of the PDMS-
Ba0.55Sr0.45TiO3 composites with 39 vol. % and 49 vol. % fillers sintered at
1340C, as well as PDMS-MgCaTiO2 composites with 49 % fillers sintered at
1100C. (a) Permittivity. (b) Dielectric loss tangent that was plotted vs.
frequencies and compared with a measured ARLON AD1000™ woven glass
reinforced laminate.
Both composite materials have shown fairly frequency-independent high dielectric
permittivity and slightly lower loss tangent as compared to prior works [39]-[42], which is
summarized in Table 4.6.
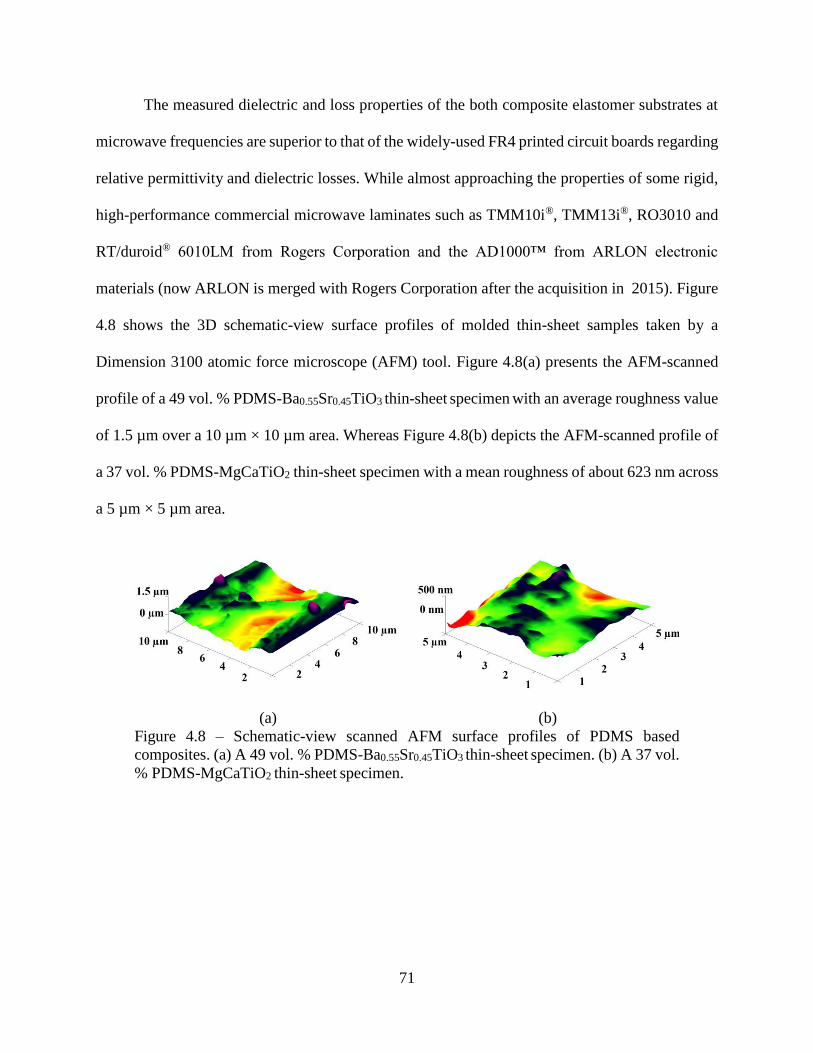
71
The measured dielectric and loss properties of the both composite elastomer substrates at
microwave frequencies are superior to that of the widely-used FR4 printed circuit boards regarding
relative permittivity and dielectric losses. While almost approaching the properties of some rigid,
high-performance commercial microwave laminates such as TMM10i®, TMM13i®, RO3010 and
RT/duroid® 6010LM from Rogers Corporation and the AD1000™ from ARLON electronic
materials (now ARLON is merged with Rogers Corporation after the acquisition in 2015). Figure
4.8 shows the 3D schematic-view surface profiles of molded thin-sheet samples taken by a
Dimension 3100 atomic force microscope (AFM) tool. Figure 4.8(a) presents the AFM-scanned
profile of a 49 vol. % PDMS-Ba0.55Sr0.45TiO3 thin-sheet specimen with an average roughness value
of 1.5 µm over a 10 µm × 10 µm area. Whereas Figure 4.8(b) depicts the AFM-scanned profile of
a 37 vol. % PDMS-MgCaTiO2 thin-sheet specimen with a mean roughness of about 623 nm across
a 5 µm × 5 µm area.
(a) (b)
Figure 4.8 – Schematic-view scanned AFM surface profiles of PDMS based
composites. (a) A 49 vol. % PDMS-Ba0.55Sr0.45TiO3 thin-sheet specimen. (b) A 37 vol.
% PDMS-MgCaTiO2 thin-sheet specimen.

72
Table 4.5 – Comparison of measured dielectric and loss properties of polymer-ceramic composites
Ceramic
Powder
Firing
Temperature
( ºC )
Volume
Ratio
Firing
Time
(hours)
𝜺𝒓 𝒕𝒂𝒏𝝏𝒅 Improvement
Raw
Sample
Sintered
Sample
Raw
Sample
Sintered
Sample
𝜺𝒓
(%)
tan δd
(%)
Ba0.55Sr0.45TiO3 1100 39% 3 9.94 11.69 0.0470 0.0324 17.61 31.06
Ba0.55Sr0.45TiO3 1340 39% 2 9.94 15.50 0.0470 0.0317 55.94 32.55
MgCaTiO2 1100 37% 3 7.82 11.80 0.0197 0.0122 51.00 38.07
MgCaTiO2 1500 37% 3 7.82 10.35 0.0197 0.0154 32.37 21.69
Note: The permittivity εr and tan δd were measured at 4.3 GHz. Raw samples are unsintered samples.
Table 4.4 – The key properties of ceramic fillers and sintering conditions in this chapter’s materials
Ceramic
Material
Max.
Temp.
( ºC )
Groups Dielectric
Properties
Absolute
Density
(g/cc)
Particle
Size
(μm)‡
Melting
Point
( ºC ) r tan δd
MgCaTiO2
(MCT-140) †
1500/
3 hours
II-IV-VI 148 0.0012 3.85 2.26 >1450
Ba0.55Sr0.45TiO3§ 1340/
2 hours
II-IV-VI 2367 0.0019 5.70 0.87 >1340
†Obtained from Trans-Tech, Inc., Dielectric Properties at 6 GHz ‡ Particle size measured in a sphere during SEM characterization
§Obtained from Ferro Corporation., Dielectric Properties at 1 kHz
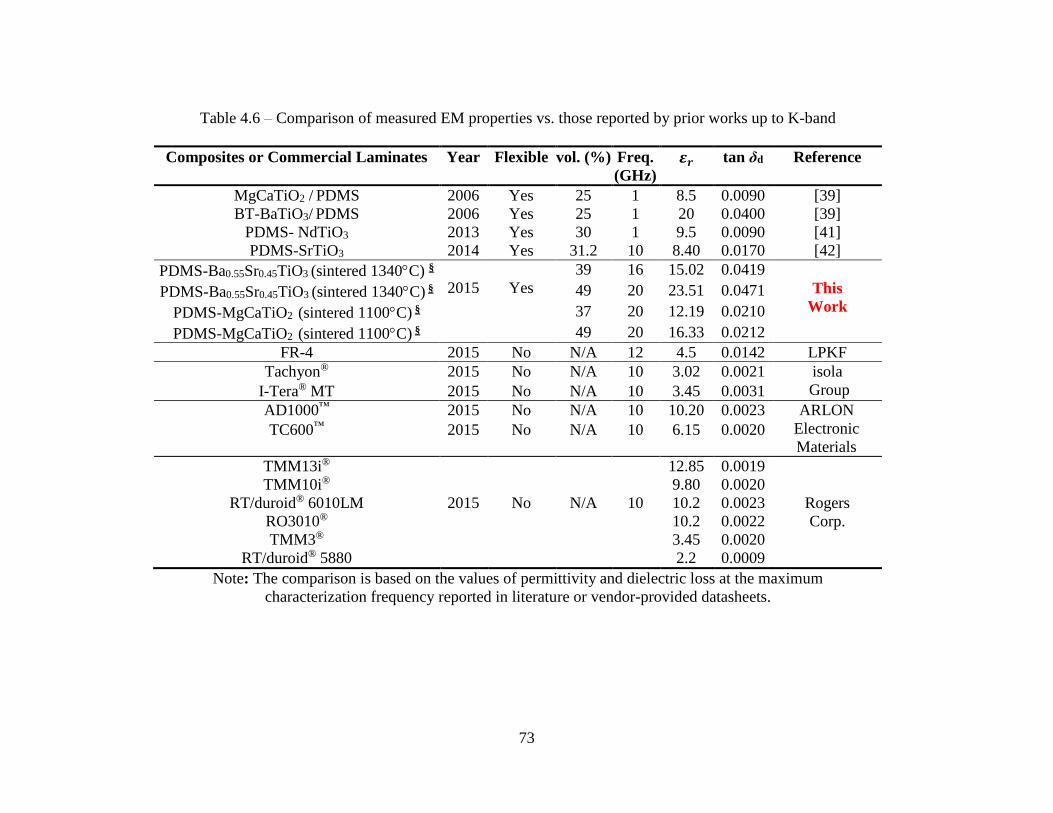
73
Table 4.6 – Comparison of measured EM properties vs. those reported by prior works up to K-band
Composites or Commercial Laminates Year Flexible vol. (%) Freq.
(GHz)
𝜺𝒓 tan δd Reference
MgCaTiO2 / PDMS 2006 Yes 25 1 8.5 0.0090 [39]
BT-BaTiO3/ PDMS 2006 Yes 25 1 20 0.0400 [39]
PDMS- NdTiO3 2013 Yes 30 1 9.5 0.0090 [41]
PDMS-SrTiO3 2014 Yes 31.2 10 8.40 0.0170 [42]
PDMS-Ba0.55Sr0.45TiO3 (sintered 1340C) §
2015
Yes
39 16 15.02 0.0419
This
Work PDMS-Ba0.55Sr0.45TiO3 (sintered 1340C) § 49 20 23.51 0.0471
PDMS-MgCaTiO2 (sintered 1100C) § 37 20 12.19 0.0210
PDMS-MgCaTiO2 (sintered 1100C) § 49 20 16.33 0.0212
FR-4 2015 No N/A 12 4.5 0.0142 LPKF
Tachyon® 2015 No N/A 10 3.02 0.0021 isola
Group I-Tera® MT 2015 No N/A 10 3.45 0.0031
AD1000™ 2015 No N/A 10 10.20 0.0023 ARLON
Electronic
Materials TC600™ 2015 No N/A 10 6.15 0.0020
TMM13i®
2015
No
12.85 0.0019
Rogers
Corp.
TMM10i® 9.80 0.0020
RT/duroid® 6010LM N/A 10 10.2 0.0023
RO3010® 10.2 0.0022
TMM3® 3.45 0.0020
RT/duroid® 5880 2.2 0.0009
Note: The comparison is based on the values of permittivity and dielectric loss at the maximum
characterization frequency reported in literature or vendor-provided datasheets.

74
4.5 Characterization of DPAM-Printed Antennas
4.5.1 Design of a 19.6 GHz Edge-Fed Microstrip Patch Antenna with PDMS-MgCaTiO2
Composites
The key aim to design and implement an edge-fed patch antenna prototype at 19.6 GHz
was to demonstrate the EM properties and device capabilities up to K-band (18-27 GHz) of the 37
vol. % PDMS-MgCaTiO2 composites. During the antenna design process, the edge-fed microstrip
patch was selected to avoid the need for ultra-small inset feeds, the dimensions for the rectangular
patch were determined using equations reported by Balanis [80] in Equations (4.1) - (4.6), and the
dielectric properties reported in Figure 4.5.
Since the waves travel in both the composite substrate and the air; the effective dielectric
constant εreff is used to account for the effect of the fringing field and wave propagation through a
microstrip line as shown in Equation (4.1).
휀𝑟𝑒𝑓𝑓 =
휀r + 1
2+
휀r − 1
2[1 + 12
ℎ
𝑊𝑝]−1/2
(4.1)
𝑊𝑝
ℎ> 1
where h is the substrate thickness, and Wp is the patch width.
The normalized patch antenna feedline extension length can be approximated by using the
following Equation (4.2):
∆𝐿
ℎ= 0.412
(휀𝑟𝑒𝑓𝑓 + 0.3) (𝑊𝑝ℎ
+ 0.264)
(휀𝑟𝑒𝑓𝑓 − 0.258)(𝑊𝑝ℎ
+ 0.8)
(4.2)
The effective patch length is given by Equation (4.3):
𝐿𝑒𝑓𝑓 = 𝐿 + 2∆𝐿 =
𝜆g
2
(4.3)
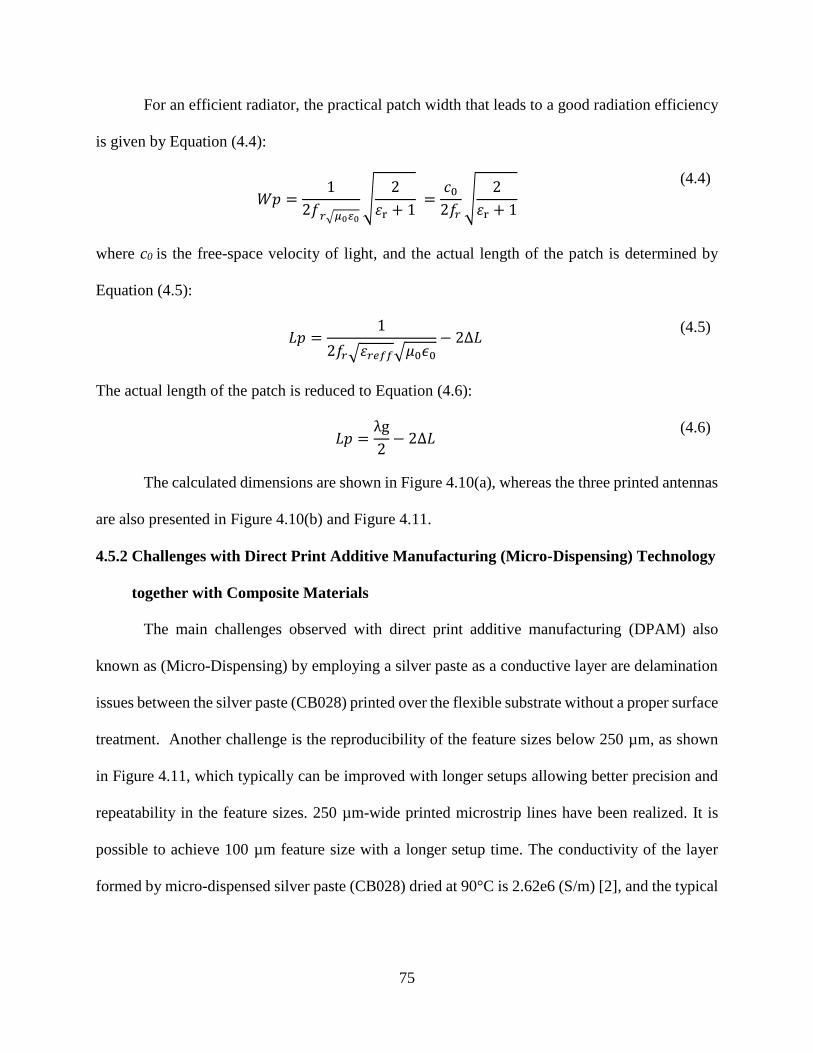
75
For an efficient radiator, the practical patch width that leads to a good radiation efficiency
is given by Equation (4.4):
𝑊𝑝 =1
2𝑓𝑟√𝜇0 0
√2
휀r + 1 =
𝑐0
2𝑓𝑟√
2
휀r + 1
(4.4)
where c0 is the free-space velocity of light, and the actual length of the patch is determined by
Equation (4.5):
𝐿𝑝 =
1
2𝑓𝑟√휀𝑟𝑒𝑓𝑓√𝜇0𝜖0
− 2∆𝐿 (4.5)
The actual length of the patch is reduced to Equation (4.6):
𝐿𝑝 =
λg
2− 2∆𝐿
(4.6)
The calculated dimensions are shown in Figure 4.10(a), whereas the three printed antennas
are also presented in Figure 4.10(b) and Figure 4.11.
4.5.2 Challenges with Direct Print Additive Manufacturing (Micro-Dispensing) Technology
together with Composite Materials
The main challenges observed with direct print additive manufacturing (DPAM) also
known as (Micro-Dispensing) by employing a silver paste as a conductive layer are delamination
issues between the silver paste (CB028) printed over the flexible substrate without a proper surface
treatment. Another challenge is the reproducibility of the feature sizes below 250 µm, as shown
in Figure 4.11, which typically can be improved with longer setups allowing better precision and
repeatability in the feature sizes. 250 µm-wide printed microstrip lines have been realized. It is
possible to achieve 100 µm feature size with a longer setup time. The conductivity of the layer
formed by micro-dispensed silver paste (CB028) dried at 90°C is 2.62e6 (S/m) [2], and the typical
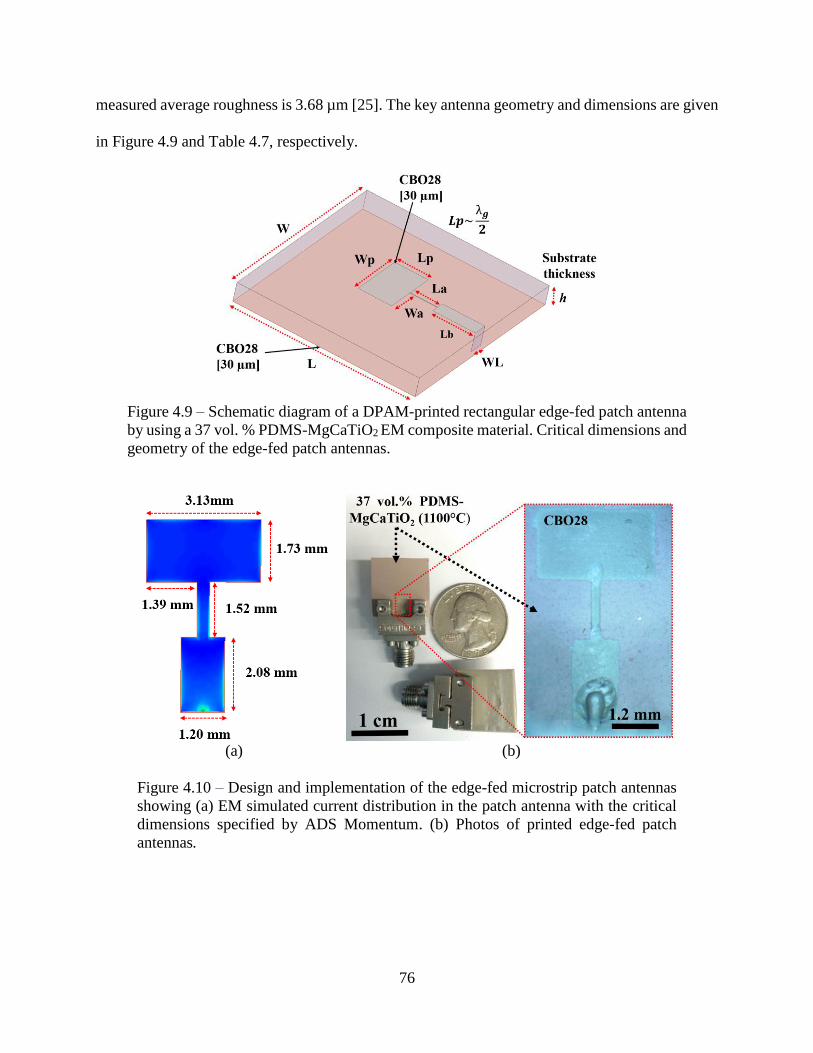
76
measured average roughness is 3.68 µm [25]. The key antenna geometry and dimensions are given
in Figure 4.9 and Table 4.7, respectively.
Figure 4.9 – Schematic diagram of a DPAM-printed rectangular edge-fed patch antenna
by using a 37 vol. % PDMS-MgCaTiO2 EM composite material. Critical dimensions and
geometry of the edge-fed patch antennas.
(a) (b)
Figure 4.10 – Design and implementation of the edge-fed microstrip patch antennas
showing (a) EM simulated current distribution in the patch antenna with the critical
dimensions specified by ADS Momentum. (b) Photos of printed edge-fed patch
antennas.
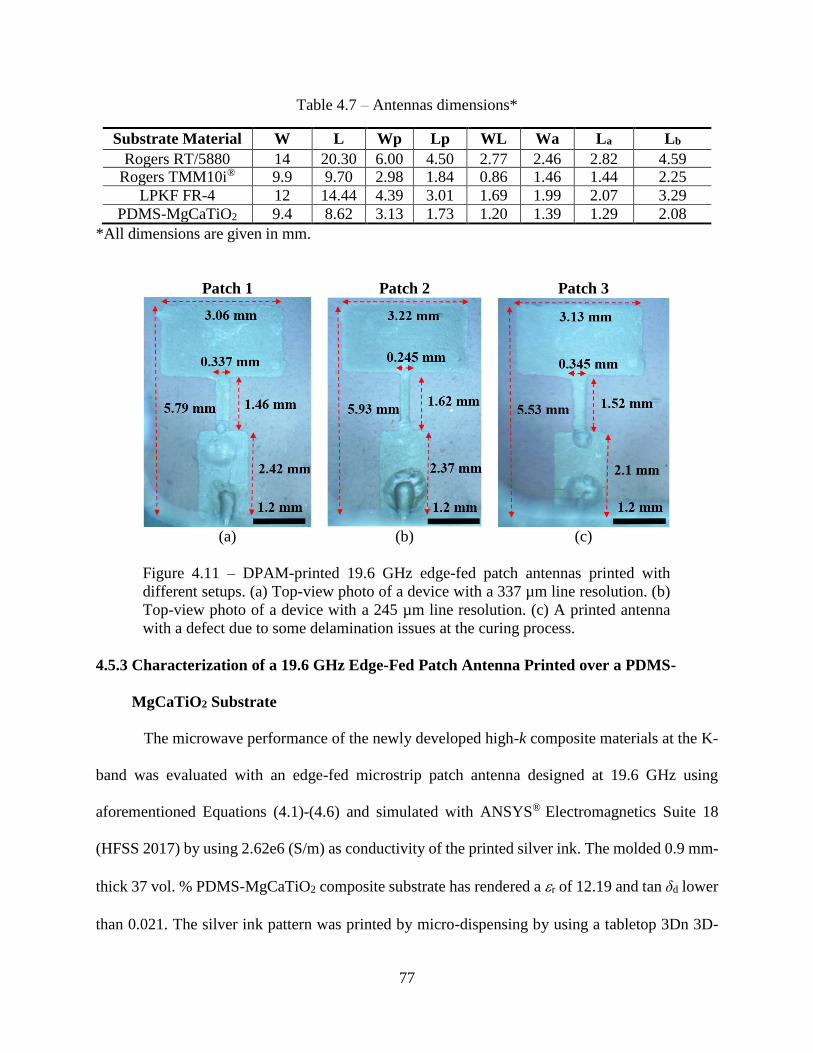
77
Table 4.7 – Antennas dimensions*
Substrate Material W L Wp Lp WL Wa La Lb
Rogers RT/5880 14 20.30 6.00 4.50 2.77 2.46 2.82 4.59 Rogers TMM10i® 9.9 9.70 2.98 1.84 0.86 1.46 1.44 2.25
LPKF FR-4 12 14.44 4.39 3.01 1.69 1.99 2.07 3.29
PDMS-MgCaTiO2 9.4 8.62 3.13 1.73 1.20 1.39 1.29 2.08
*All dimensions are given in mm.
4.5.3 Characterization of a 19.6 GHz Edge-Fed Patch Antenna Printed over a PDMS-
MgCaTiO2 Substrate
The microwave performance of the newly developed high-k composite materials at the K-
band was evaluated with an edge-fed microstrip patch antenna designed at 19.6 GHz using
aforementioned Equations (4.1)-(4.6) and simulated with ANSYS® Electromagnetics Suite 18
(HFSS 2017) by using 2.62e6 (S/m) as conductivity of the printed silver ink. The molded 0.9 mm-
thick 37 vol. % PDMS-MgCaTiO2 composite substrate has rendered a r of 12.19 and tan δd lower
than 0.021. The silver ink pattern was printed by micro-dispensing by using a tabletop 3Dn 3D-
Patch 1 Patch 2 Patch 3
(a) (b) (c)
Figure 4.11 – DPAM-printed 19.6 GHz edge-fed patch antennas printed with
different setups. (a) Top-view photo of a device with a 337 µm line resolution. (b)
Top-view photo of a device with a 245 µm line resolution. (c) A printed antenna
with a defect due to some delamination issues at the curing process.
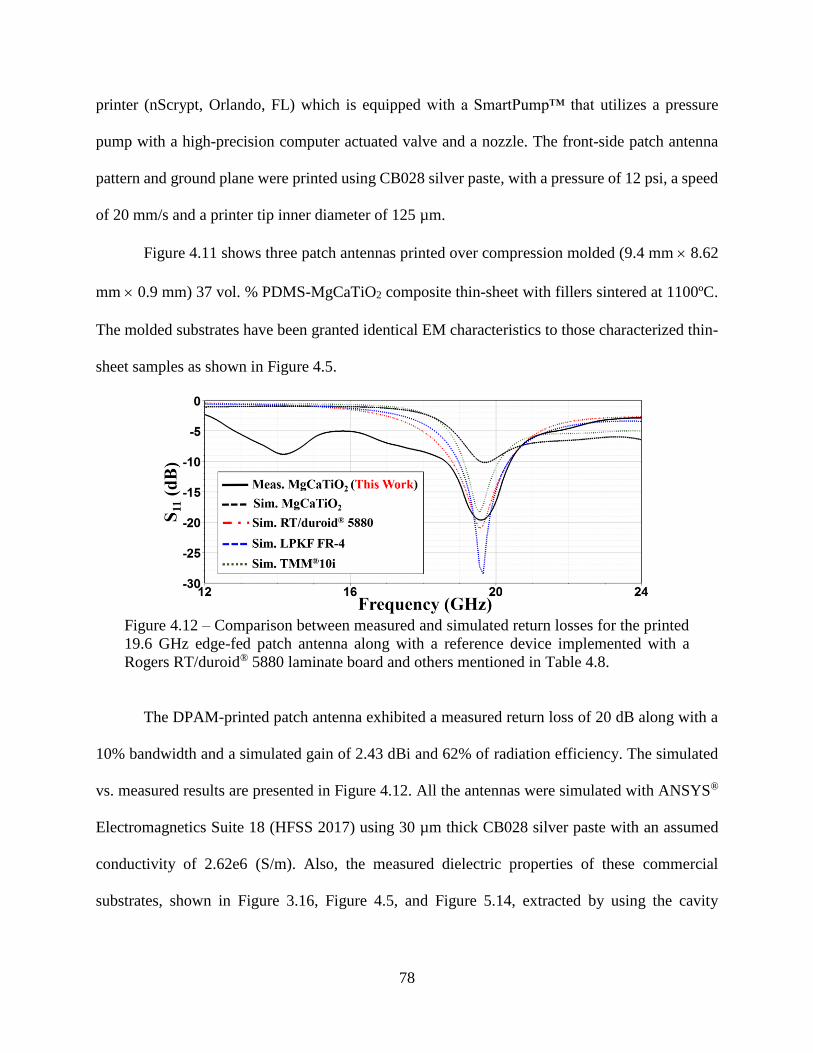
78
printer (nScrypt, Orlando, FL) which is equipped with a SmartPump™ that utilizes a pressure
pump with a high-precision computer actuated valve and a nozzle. The front-side patch antenna
pattern and ground plane were printed using CB028 silver paste, with a pressure of 12 psi, a speed
of 20 mm/s and a printer tip inner diameter of 125 µm.
Figure 4.11 shows three patch antennas printed over compression molded (9.4 mm 8.62
mm 0.9 mm) 37 vol. % PDMS-MgCaTiO2 composite thin-sheet with fillers sintered at 1100ºC.
The molded substrates have been granted identical EM characteristics to those characterized thin-
sheet samples as shown in Figure 4.5.
Figure 4.12 – Comparison between measured and simulated return losses for the printed
19.6 GHz edge-fed patch antenna along with a reference device implemented with a
Rogers RT/duroid® 5880 laminate board and others mentioned in Table 4.8.
The DPAM-printed patch antenna exhibited a measured return loss of 20 dB along with a
10% bandwidth and a simulated gain of 2.43 dBi and 62% of radiation efficiency. The simulated
vs. measured results are presented in Figure 4.12. All the antennas were simulated with ANSYS®
Electromagnetics Suite 18 (HFSS 2017) using 30 µm thick CB028 silver paste with an assumed
conductivity of 2.62e6 (S/m). Also, the measured dielectric properties of these commercial
substrates, shown in Figure 3.16, Figure 4.5, and Figure 5.14, extracted by using the cavity
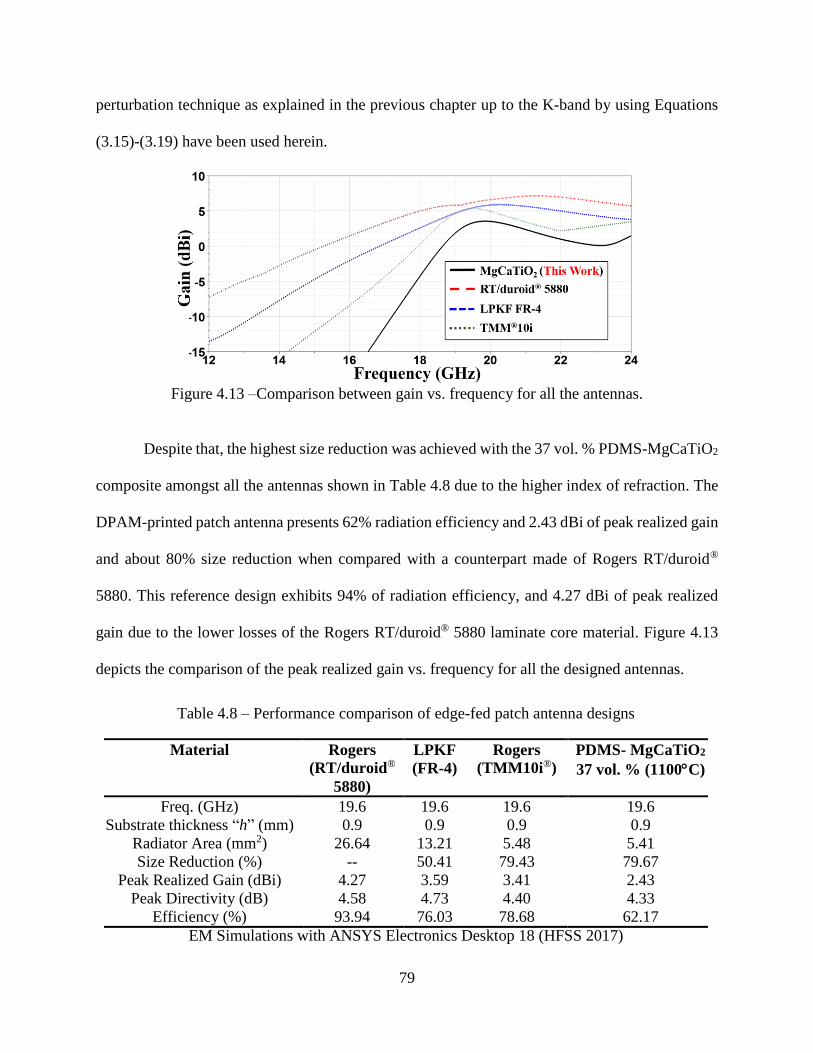
79
perturbation technique as explained in the previous chapter up to the K-band by using Equations
(3.15)-(3.19) have been used herein.
Figure 4.13 –Comparison between gain vs. frequency for all the antennas.
Despite that, the highest size reduction was achieved with the 37 vol. % PDMS-MgCaTiO2
composite amongst all the antennas shown in Table 4.8 due to the higher index of refraction. The
DPAM-printed patch antenna presents 62% radiation efficiency and 2.43 dBi of peak realized gain
and about 80% size reduction when compared with a counterpart made of Rogers RT/duroid®
5880. This reference design exhibits 94% of radiation efficiency, and 4.27 dBi of peak realized
gain due to the lower losses of the Rogers RT/duroid® 5880 laminate core material. Figure 4.13
depicts the comparison of the peak realized gain vs. frequency for all the designed antennas.
Table 4.8 – Performance comparison of edge-fed patch antenna designs
Material Rogers
(RT/duroid®
5880)
LPKF
(FR-4)
Rogers
(TMM10i®)
PDMS- MgCaTiO2
37 vol. % (1100C)
Freq. (GHz) 19.6 19.6 19.6 19.6
Substrate thickness “h” (mm) 0.9 0.9 0.9 0.9
Radiator Area (mm2) 26.64 13.21 5.48 5.41
Size Reduction (%) -- 50.41 79.43 79.67
Peak Realized Gain (dBi) 4.27 3.59 3.41 2.43
Peak Directivity (dB) 4.58 4.73 4.40 4.33
Efficiency (%) 93.94 76.03 78.68 62.17
EM Simulations with ANSYS Electronics Desktop 18 (HFSS 2017)
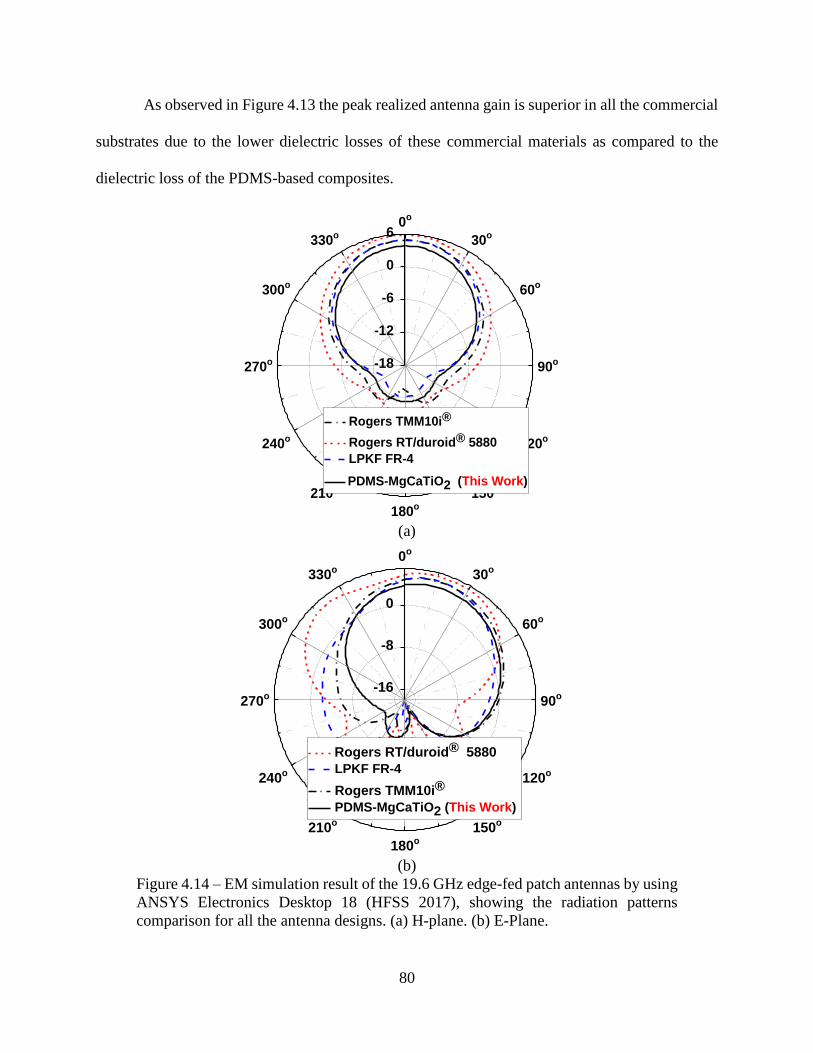
80
As observed in Figure 4.13 the peak realized antenna gain is superior in all the commercial
substrates due to the lower dielectric losses of these commercial materials as compared to the
dielectric loss of the PDMS-based composites.
0o
30o
60o
90o
120o
150o
180o
210o
240o
270o
300o
330o
-18
-12
-6
0
6
Rogers TMM10i®
Rogers RT/duroid® 5880
LPKF FR-4
PDMS-MgCaTiO2 (This Work)
(a)
0o
30o
60o
90o
120o
150o
180o
210o
240o
270o
300o
330o
-16
-8
0
Rogers RT/duroid® 5880
LPKF FR-4
Rogers TMM10i®
PDMS-MgCaTiO2 (This Work)
(b)
Figure 4.14 – EM simulation result of the 19.6 GHz edge-fed patch antennas by using
ANSYS Electronics Desktop 18 (HFSS 2017), showing the radiation patterns
comparison for all the antenna designs. (a) H-plane. (b) E-Plane.
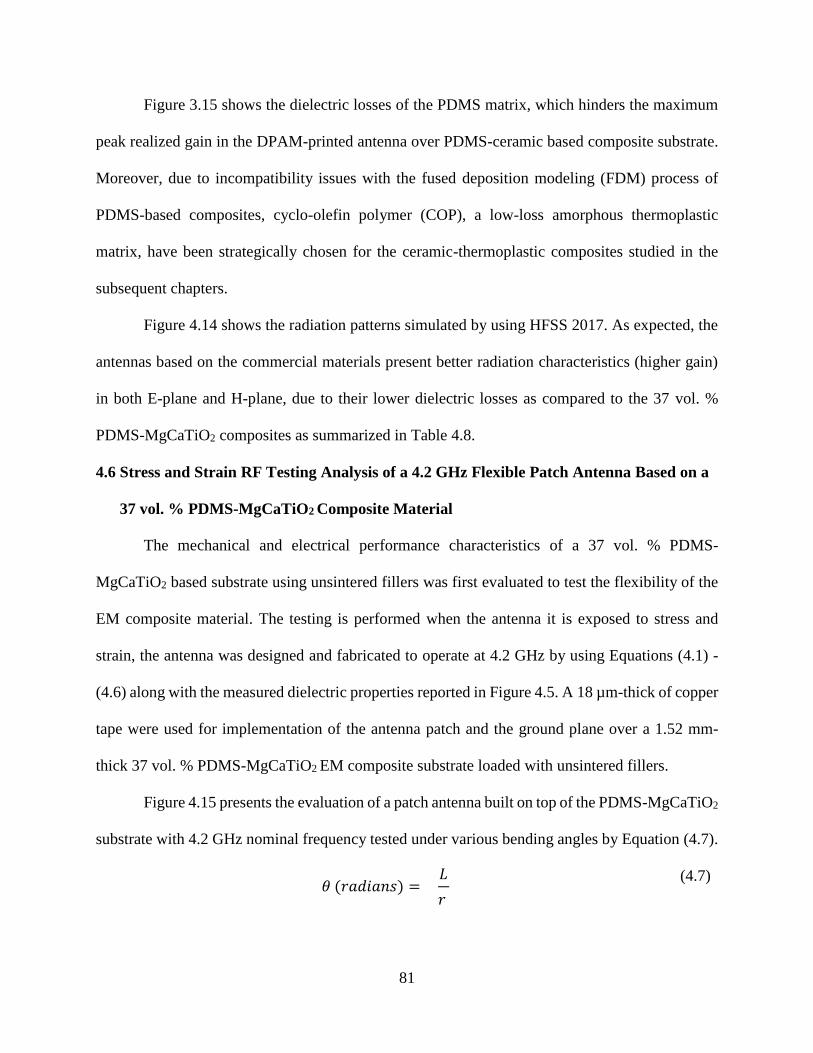
81
Figure 3.15 shows the dielectric losses of the PDMS matrix, which hinders the maximum
peak realized gain in the DPAM-printed antenna over PDMS-ceramic based composite substrate.
Moreover, due to incompatibility issues with the fused deposition modeling (FDM) process of
PDMS-based composites, cyclo-olefin polymer (COP), a low-loss amorphous thermoplastic
matrix, have been strategically chosen for the ceramic-thermoplastic composites studied in the
subsequent chapters.
Figure 4.14 shows the radiation patterns simulated by using HFSS 2017. As expected, the
antennas based on the commercial materials present better radiation characteristics (higher gain)
in both E-plane and H-plane, due to their lower dielectric losses as compared to the 37 vol. %
PDMS-MgCaTiO2 composites as summarized in Table 4.8.
4.6 Stress and Strain RF Testing Analysis of a 4.2 GHz Flexible Patch Antenna Based on a
37 vol. % PDMS-MgCaTiO2 Composite Material
The mechanical and electrical performance characteristics of a 37 vol. % PDMS-
MgCaTiO2 based substrate using unsintered fillers was first evaluated to test the flexibility of the
EM composite material. The testing is performed when the antenna it is exposed to stress and
strain, the antenna was designed and fabricated to operate at 4.2 GHz by using Equations (4.1) -
(4.6) along with the measured dielectric properties reported in Figure 4.5. A 18 µm-thick of copper
tape were used for implementation of the antenna patch and the ground plane over a 1.52 mm-
thick 37 vol. % PDMS-MgCaTiO2 EM composite substrate loaded with unsintered fillers.
Figure 4.15 presents the evaluation of a patch antenna built on top of the PDMS-MgCaTiO2
substrate with 4.2 GHz nominal frequency tested under various bending angles by Equation (4.7).
𝜃 (𝑟𝑎𝑑𝑖𝑎𝑛𝑠) =
𝐿
𝑟
(4.7)
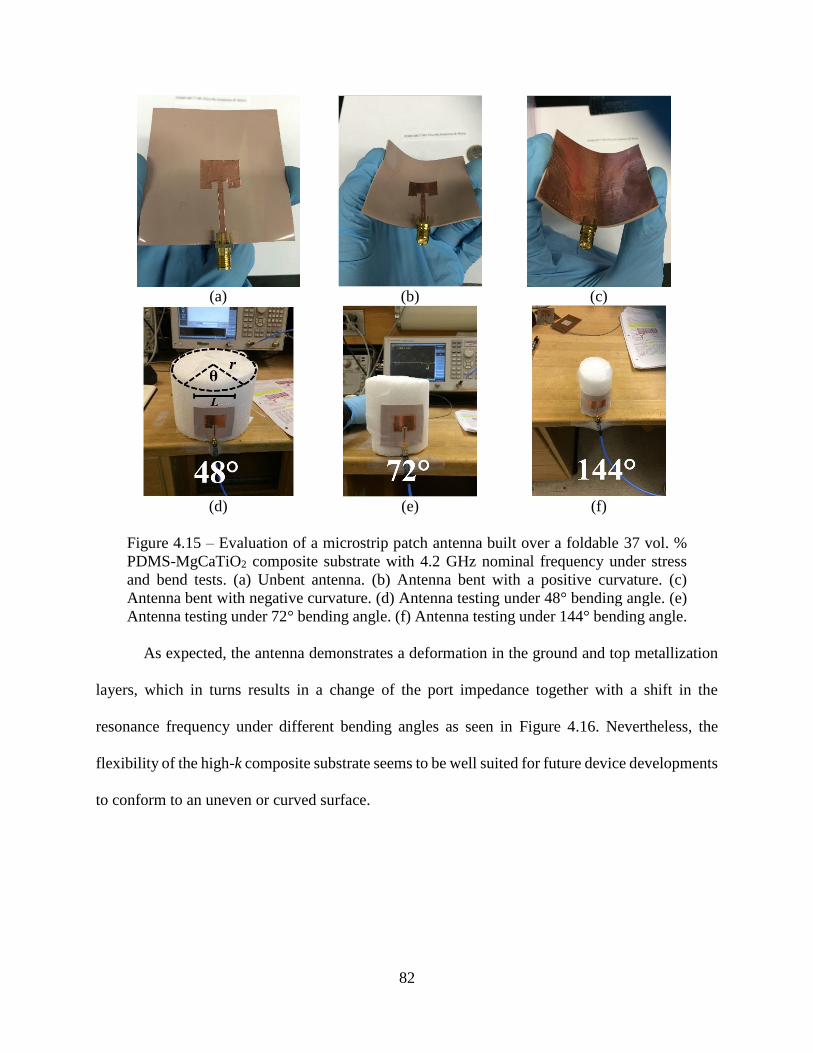
82
(a) (b) (c)
(d) (e) (f)
Figure 4.15 – Evaluation of a microstrip patch antenna built over a foldable 37 vol. %
PDMS-MgCaTiO2 composite substrate with 4.2 GHz nominal frequency under stress
and bend tests. (a) Unbent antenna. (b) Antenna bent with a positive curvature. (c)
Antenna bent with negative curvature. (d) Antenna testing under 48° bending angle. (e)
Antenna testing under 72° bending angle. (f) Antenna testing under 144° bending angle.
As expected, the antenna demonstrates a deformation in the ground and top metallization
layers, which in turns results in a change of the port impedance together with a shift in the
resonance frequency under different bending angles as seen in Figure 4.16. Nevertheless, the
flexibility of the high-k composite substrate seems to be well suited for future device developments
to conform to an uneven or curved surface.
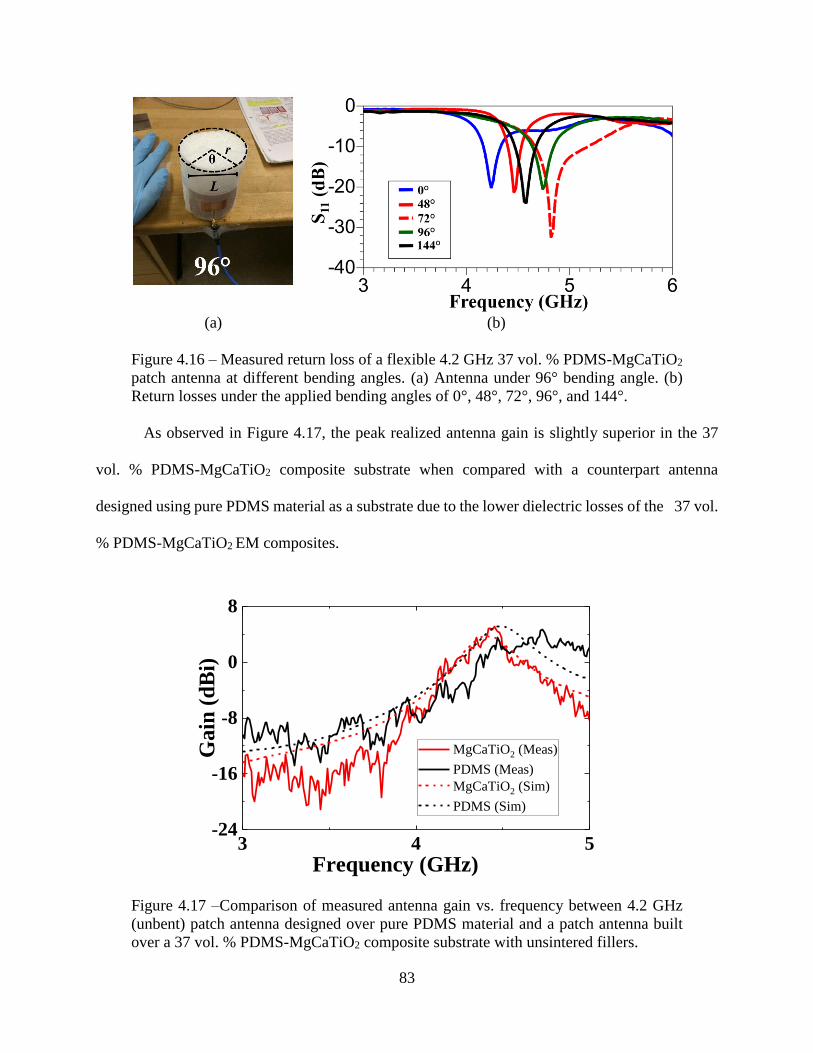
83
(a) (b)
Figure 4.16 – Measured return loss of a flexible 4.2 GHz 37 vol. % PDMS-MgCaTiO2
patch antenna at different bending angles. (a) Antenna under 96° bending angle. (b)
Return losses under the applied bending angles of 0°, 48°, 72°, 96°, and 144°.
As observed in Figure 4.17, the peak realized antenna gain is slightly superior in the 37
vol. % PDMS-MgCaTiO2 composite substrate when compared with a counterpart antenna
designed using pure PDMS material as a substrate due to the lower dielectric losses of the 37 vol.
% PDMS-MgCaTiO2 EM composites.
3 4 5-24
-16
-8
0
8
Frequency (GHz)
Gain
(d
Bi)
MgCaTiO2 (Meas)
PDMS (Meas)
MgCaTiO2 (Sim)
PDMS (Sim)
Figure 4.17 –Comparison of measured antenna gain vs. frequency between 4.2 GHz
(unbent) patch antenna designed over pure PDMS material and a patch antenna built
over a 37 vol. % PDMS-MgCaTiO2 composite substrate with unsintered fillers.
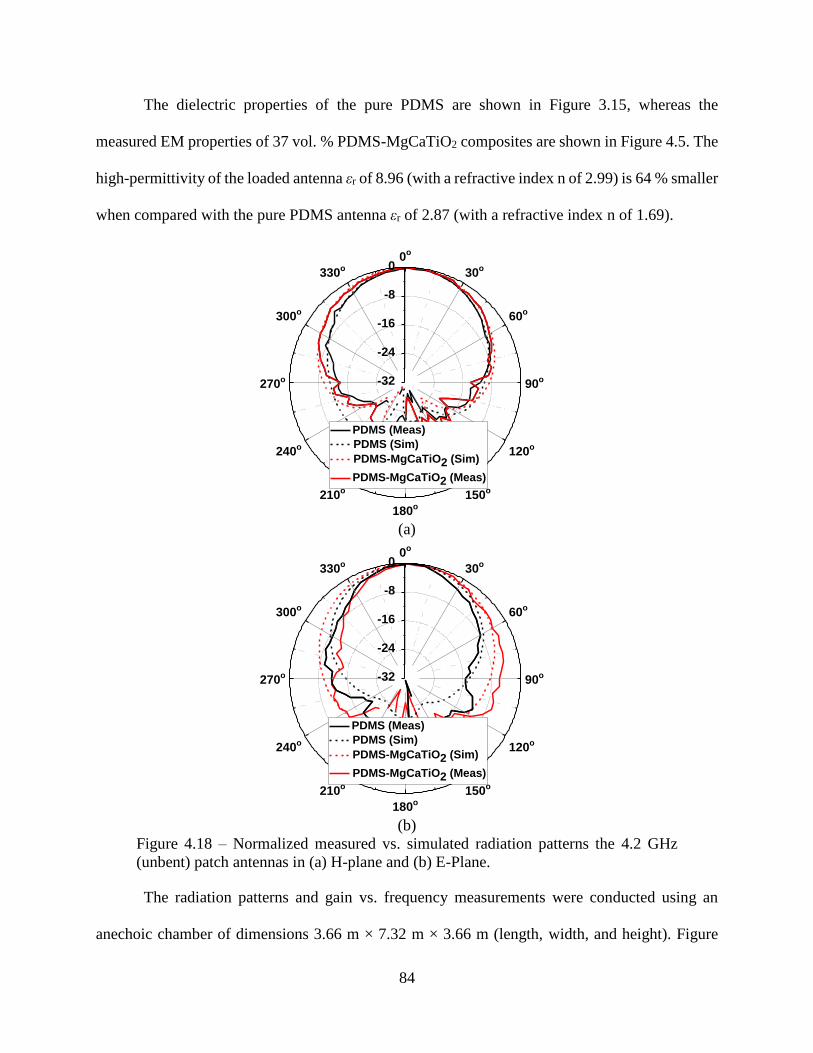
84
The dielectric properties of the pure PDMS are shown in Figure 3.15, whereas the
measured EM properties of 37 vol. % PDMS-MgCaTiO2 composites are shown in Figure 4.5. The
high-permittivity of the loaded antenna εr of 8.96 (with a refractive index n of 2.99) is 64 % smaller
when compared with the pure PDMS antenna εr of 2.87 (with a refractive index n of 1.69).
0o
30o
60o
90o
120o
150o
180o
210o
240o
270o
300o
330o
-32
-24
-16
-8
0
PDMS (Meas)
PDMS (Sim)
PDMS-MgCaTiO2 (Sim)
PDMS-MgCaTiO2 (Meas)
(a)
0o
30o
60o
90o
120o
150o
180o
210o
240o
270o
300o
330o
-32
-24
-16
-8
0
PDMS (Meas)
PDMS (Sim)
PDMS-MgCaTiO2 (Sim)
PDMS-MgCaTiO2 (Meas)
(b)
Figure 4.18 – Normalized measured vs. simulated radiation patterns the 4.2 GHz
(unbent) patch antennas in (a) H-plane and (b) E-Plane.
The radiation patterns and gain vs. frequency measurements were conducted using an
anechoic chamber of dimensions 3.66 m × 7.32 m × 3.66 m (length, width, and height). Figure
85
4.18 shows the comparison between the measured and simulated normalized H-plane and E-plane
radiation patterns for the 4.2 GHz antenna based on 37 vol. % PDMS-MgCaTiO2 composites that
are compared with a pure PDMS antenna. Figure 4.18(a) depicts an excellent agreement in the H-
plane characteristics for both antennas. Both antennas exhibit small back lobes which agree with
the EM simulations. Figure 4.18(a) shows the comparison between the simulated and measured E-
plane radiation patterns, which also agrees with the EM simulations.
4.7 Conclusion
Four different high-k and low-loss polymer-ceramic EM composite materials have been
developed by employing a high-temperature sintering process up to 1500C to further enhance the
dielectric and loss properties. 39 vol. % PDMS-Ba0.55Sr0.45TiO3 composites loaded with 1340C
sintered fillers have shown a dielectric permittivity (r) of 15.02 and a tan δd less than 0.042 at
frequencies up to 16 GHz. Similarly, 49 vol. % loaded PDMS-Ba0.55Sr0.45TiO3 sample has
exhibited very stable r of 23.51 and a tan δd lower than 0.047 at frequencies up to 20 GHz. 37 vol.
% loaded PDMS-MgCaTiO2 substrate has shown very stable dielectric permittivity (r) of 12.19
and a tan δd lower than 0.021 at frequencies up to 20 GHz. Also, a 19.6 GHz patch antenna was
successfully demonstrated by 3D printing over a 37 vol. % PDMS-MgCaTiO2 composite substrate
to form the metallization layer by using a CB028 silver paste from DuPont. The printed patch
antenna exhibited a measured return loss of 20 dB along with a 10% bandwidth and a simulated
gain of 3 dBi and 71% of efficiency. The antenna size is reduced by 80% when compared with a
counterpart design based on Rogers RT/duroid® 5880 material. The printed antenna was rigorously
compared with reference designs implemented using several state-of-the-art commercial
laminates. This new class of mass-producible high-k, low-loss, and bendable polymer composite

86
materials has already shown some promising attributes for enabling the next generation of 3D
conformal RF and microwave devices.
87
CHAPTER 5 :
CERAMIC-THERMOPLASTIC COMPOSITES FOR FDM
5.1 Note to Reader
Portions of this chapter, including figures, have been previously published in [10], [17],
[49], and [50], and they have been reproduced with permissions from IEEE Microwave Theory
and Techniques Society, the International Microelectronics Assembly and Packaging Society and
Microelectronics Foundation. Permissions are included in Appendix A.
5.2 Introduction
A new kind of high-permittivity (high-k) and low-loss composite material for FDM
technology based on a COP thermoplastic matrix embedded with sintered ceramic fillers was
developed and characterized up to Ku-band. FDM printed samples made of 30 vol. % COP-
MgCaTiO2 composites, with filler particles sintered at 1200ºC, show a εr of 4.82 and a tan δd below
0.0018. Meanwhile, 3D-printed samples composed of 25 vol. % COP-Ba0.55Sr0.45TiO3 with
particles sintered at 1340ºC exhibit a εr of 4.92 and a tan δd lower than 0.0114. Also, 30 vol. %
COP-TiO2 specimens with filler particles sintered at 1200ºC exhibit a εr of 4.78 and a tan δd lower
than 0.0012, whereas ABS-Ba0.55Sr0.45TiO3 specimens with a 6% volume fraction loading of
microparticle fillers sintered at 1340ºC have demonstrated a εr of 3.98 and a tan δd less than 0.0086.
Edge-fed microstrip patch antennas operating at 17 GHz were fabricated by a direct digital
manufacturing (DDM) approach that combines FDM of EM composites and micro-dispensing for
deposition of conductive traces and compared with reference designs implemented using
commercial microwave laminates regarding antenna size and performance. Evidently, the newly
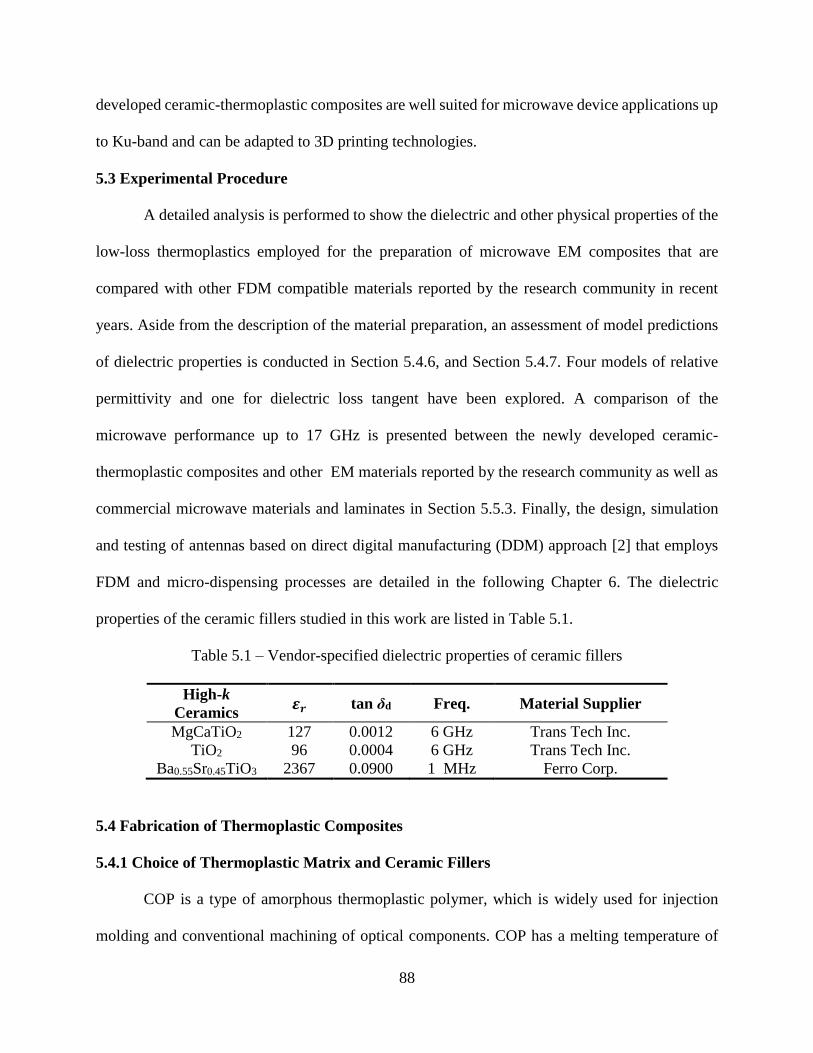
88
developed ceramic-thermoplastic composites are well suited for microwave device applications up
to Ku-band and can be adapted to 3D printing technologies.
5.3 Experimental Procedure
A detailed analysis is performed to show the dielectric and other physical properties of the
low-loss thermoplastics employed for the preparation of microwave EM composites that are
compared with other FDM compatible materials reported by the research community in recent
years. Aside from the description of the material preparation, an assessment of model predictions
of dielectric properties is conducted in Section 5.4.6, and Section 5.4.7. Four models of relative
permittivity and one for dielectric loss tangent have been explored. A comparison of the
microwave performance up to 17 GHz is presented between the newly developed ceramic-
thermoplastic composites and other EM materials reported by the research community as well as
commercial microwave materials and laminates in Section 5.5.3. Finally, the design, simulation
and testing of antennas based on direct digital manufacturing (DDM) approach [2] that employs
FDM and micro-dispensing processes are detailed in the following Chapter 6. The dielectric
properties of the ceramic fillers studied in this work are listed in Table 5.1.
Table 5.1 – Vendor-specified dielectric properties of ceramic fillers
High-k
Ceramics 𝜺𝒓 tan δd Freq. Material Supplier
MgCaTiO2 127 0.0012 6 GHz Trans Tech Inc.
TiO2 96 0.0004 6 GHz Trans Tech Inc.
Ba0.55Sr0.45TiO3 2367 0.0900 1 MHz Ferro Corp.
5.4 Fabrication of Thermoplastic Composites
5.4.1 Choice of Thermoplastic Matrix and Ceramic Fillers
COP is a type of amorphous thermoplastic polymer, which is widely used for injection
molding and conventional machining of optical components. COP has a melting temperature of
89
about 230ºC and a Tg of 136ºC. Also, it is chemically inert to strong acids and solvents, which is
superior to other widely used thermoplastics such as ABS.
Table 5.2 – Sintering conditions and densities of ceramic fillers
Ceramic
Micro-Fillers
Temp.
(ºC )
Firing Time
(hours)
Tapped Density
(g/cm3)
MgCaTiO2 1100 3 2.17
MgCaTiO2 1200 3 1.85
TiO2 1100 3 2.09
TiO2 1200 3 2.00
Ba0.55Sr0.45TiO3 1340 2 3.14
More importantly, COP also exhibits excellent EM properties with a permittivity of 2.12
and a low tan δd lower than 0.0009 up to 17 GHz, which is on par with that of Rogers RT/duroid®
5880 laminates and very likely the lowest loss among thermoplastics. The densities and sintering
conditions for ceramic fillers are given in Table 5.2, while a list of previously reported FDM-
compatible thermoplastics in comparison with the thermoplastics explored in this work is
presented in Table 5.3.
5.4.2 Sintered Ceramics Processing
The high-k ceramic powders were sintered at temperatures up to 1340C by using a two
different furnaces: a HST 12/400 horizontal split, single zone tube furnace (Carbolite, GERO, UK)
that operates up to 1200C, and a KSL 1700X box furnace (MTI Corporation, Richmond, CA) that
operates up to 1700C, to further enhance their dielectric and loss properties as reported previously
in [50] and [76]. This sintering process allows us to achieve the highest εr and lowest tan δd with
the smallest volume fraction of ceramic fillers required for the final EM composites, hence
avoiding feedstock filament brittleness. The used sintering conditions and resultant filler densities
are listed in Table 5.2. Figure 5.1 shows the SEM photos by using a SU-70 SEM (Hitachi, Ltd,
Tokyo, Japan) of two generations of FDM-ready feedstock composites materials made of COP-
90
MgCaTiO2 loaded with 25 vol. % and 30 vol. % ceramic fillers sintered for three hours at 1100ºC
and 1200ºC, respectively. Figure 5.2 shows the SEM photos of two generations of COP-TiO2
composites loaded with 30 vol. % ceramic fillers sintered for three hours at 1200ºC.
5.4.3 FDM Feedstock Hot Melt Compounding Process
The measured particle tapped densities are 0.55 g/cm3 for COP ZEONEX® (RS420), 0.602
g/cm3 for ABS Cycolac™ (MG47), and 0.61 g/cm3 for ABS448T. The typically tapped density of
the ceramic fillers is about 3 to 5 times higher than the density of the thermoplastics used in this
work as listed in Table 5.2, hence 30 vol. % was kept as the highest high-k filler volume fraction,
thus circumventing possible feedstock filament brittleness and high viscosity of the molten
composites during the actual FDM (3D-printing) process.
The 30 vol. % COP-MgCaTiO2 FDM feedstock filament preparation process starts with
the re-pulverization of sintered ceramics using an MM 400 mixer mill (Retsch, Haan, Germany)
or an XQM-2 high-energy planetary ball milling instrument (Changsha TENCAN powder
technology Co., Ltd., China). In some cases, a sieving process is applied to ensure that the
maximum particle sizes are below 40 μm as shown in Figure 5.2(a). The COP or ABS
thermoplastic matrixes and sintered ceramic particles are then uniformly pre-blended along with a
Solplus™ DP310 hyperdispersant (Lubrizol Corporation, Wickliffe, Ohio) by using an ARE-310
planetary centrifugal mixer (THINKY, Tokyo, Japan). Solplus™ DP310 is a 100% active
polymeric dispersant, typically used for improved processing in thermoplastic masterbatch and
compounding such as improve pigment/filler dispersion and stability in thermoplastics. The 30
vol. % COP-MgCaTiO2 formulation was prepared by using 10% wt. of dispersant, 59 % wt. of
sintered MgCaTiO2 particles at 1200ºC and 30 % wt. of COP, the corresponding volume fractions
formulation are 17 vol. % of a dispersant, 30 vol. % of sintered MgCaTiO2 particles at 1200ºC and
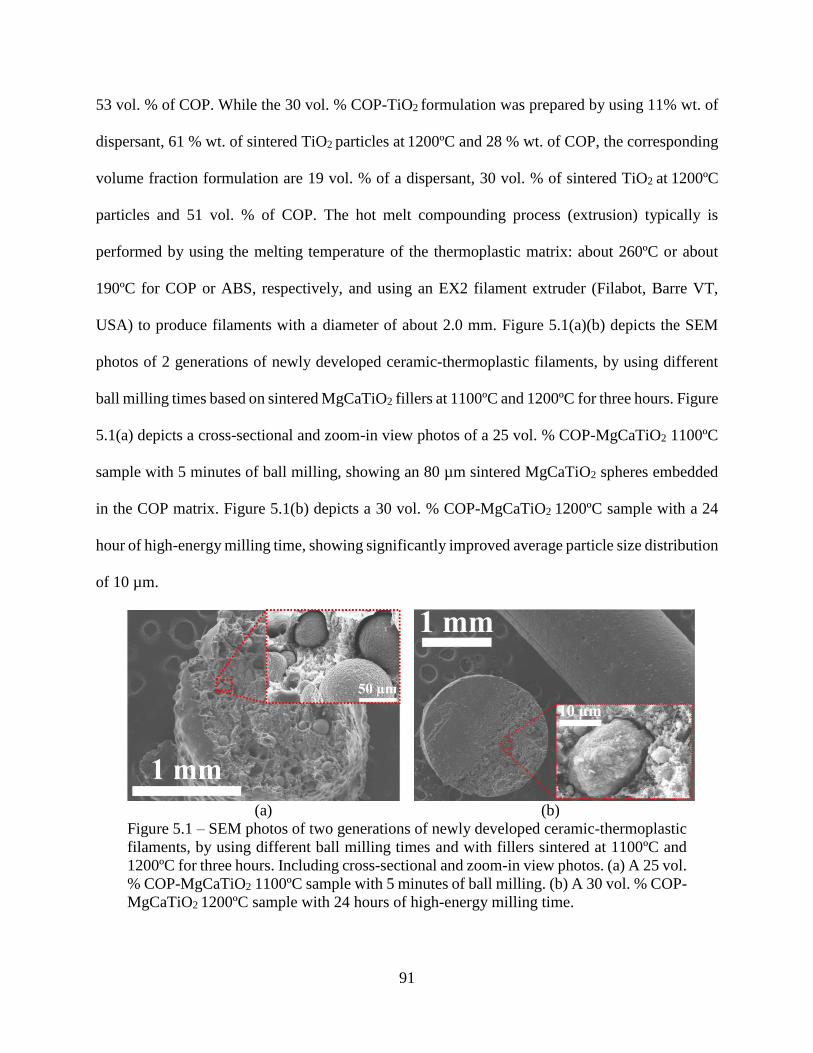
91
53 vol. % of COP. While the 30 vol. % COP-TiO2 formulation was prepared by using 11% wt. of
dispersant, 61 % wt. of sintered TiO2 particles at 1200ºC and 28 % wt. of COP, the corresponding
volume fraction formulation are 19 vol. % of a dispersant, 30 vol. % of sintered TiO2 at 1200ºC
particles and 51 vol. % of COP. The hot melt compounding process (extrusion) typically is
performed by using the melting temperature of the thermoplastic matrix: about 260ºC or about
190ºC for COP or ABS, respectively, and using an EX2 filament extruder (Filabot, Barre VT,
USA) to produce filaments with a diameter of about 2.0 mm. Figure 5.1(a)(b) depicts the SEM
photos of 2 generations of newly developed ceramic-thermoplastic filaments, by using different
ball milling times based on sintered MgCaTiO2 fillers at 1100ºC and 1200ºC for three hours. Figure
5.1(a) depicts a cross-sectional and zoom-in view photos of a 25 vol. % COP-MgCaTiO2 1100ºC
sample with 5 minutes of ball milling, showing an 80 µm sintered MgCaTiO2 spheres embedded
in the COP matrix. Figure 5.1(b) depicts a 30 vol. % COP-MgCaTiO2 1200ºC sample with a 24
hour of high-energy milling time, showing significantly improved average particle size distribution
of 10 µm.
(a) (b)
Figure 5.1 – SEM photos of two generations of newly developed ceramic-thermoplastic
filaments, by using different ball milling times and with fillers sintered at 1100ºC and
1200ºC for three hours. Including cross-sectional and zoom-in view photos. (a) A 25 vol.
% COP-MgCaTiO2 1100ºC sample with 5 minutes of ball milling. (b) A 30 vol. % COP-
MgCaTiO2 1200ºC sample with 24 hours of high-energy milling time.
92
5.4.4 Particle Size Analysis of Sintered High-k Ceramic Fillers
The nanoparticle size analysis was performed by using a Zetasizer Nano-S dynamic light
scattering system (Malvern Instruments, Malvern, Worcestershire, UK) for re-pulverized TiO2
particles sintered at 1200ºC. The high-energy ball milling process was performed by using an
XQM-2 high-energy ball mill (Changsha TENCAN powder technology Co., Ltd., China). The
comparison of different high-energy ball milling times vs. size distribution is shown in Figure 5.3.
It is worthwhile mentioning that the improved average particle size distribution with a mean
particle size of 1300 nm was measured after a 24 hours ball milling process. Hence, 24 hours was
kept as a high-energy ball milling time to standardize the particle size distribution as close as
possible to 2000 nm (2 µm) with all the ceramic fillers used in this dissertation as shown in Figure
5.3(e). It is important to mention that the achieved particle size distribution and average particle
size strongly depends on the type of sintered particles. For instance, an average MgCaTiO2 particle
size of about 18 µm was observed after a 24 hours of ball milling time, as shown in Figure 5.5(a).
Figure 5.2 depicts the SEM photos of 2 generations of newly developed FDM-ready
ceramic-thermoplastic filaments based on sintered TiO2 fillers at 1100ºC and 1200ºC for three
hours, by using different ball milling times. Figure 5.1(a) depicts a cross-sectional and zoom-in
view photos of a 30 vol. % COP-TiO2 1100ºC sample after 5 minutes of ball milling process,
followed by filtering with a 50 µm sieve. Figure 5.2(b) presents a 30 vol. % COP-TiO2 filament
with 1200C sintered fillers treated by a 24 hours of high-energy milling process, showing an
average particle size of 1.3 µm.
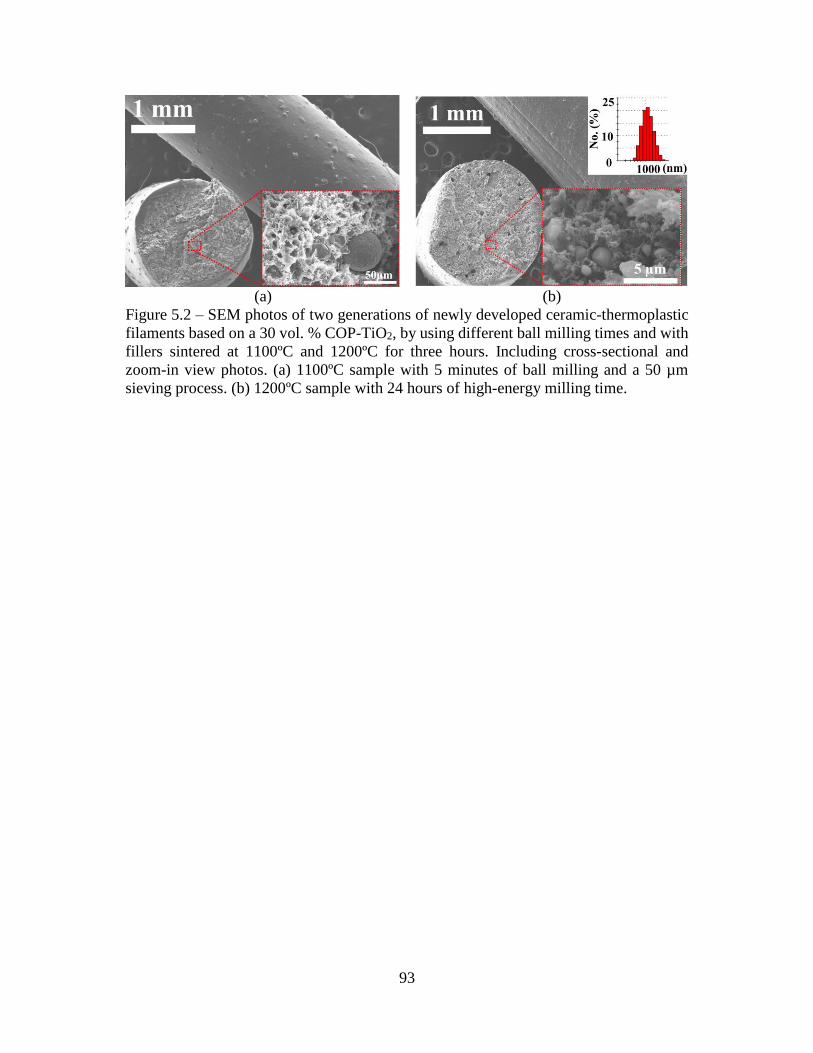
93
(a) (b)
Figure 5.2 – SEM photos of two generations of newly developed ceramic-thermoplastic
filaments based on a 30 vol. % COP-TiO2, by using different ball milling times and with
fillers sintered at 1100ºC and 1200ºC for three hours. Including cross-sectional and
zoom-in view photos. (a) 1100ºC sample with 5 minutes of ball milling and a 50 µm
sieving process. (b) 1200ºC sample with 24 hours of high-energy milling time.
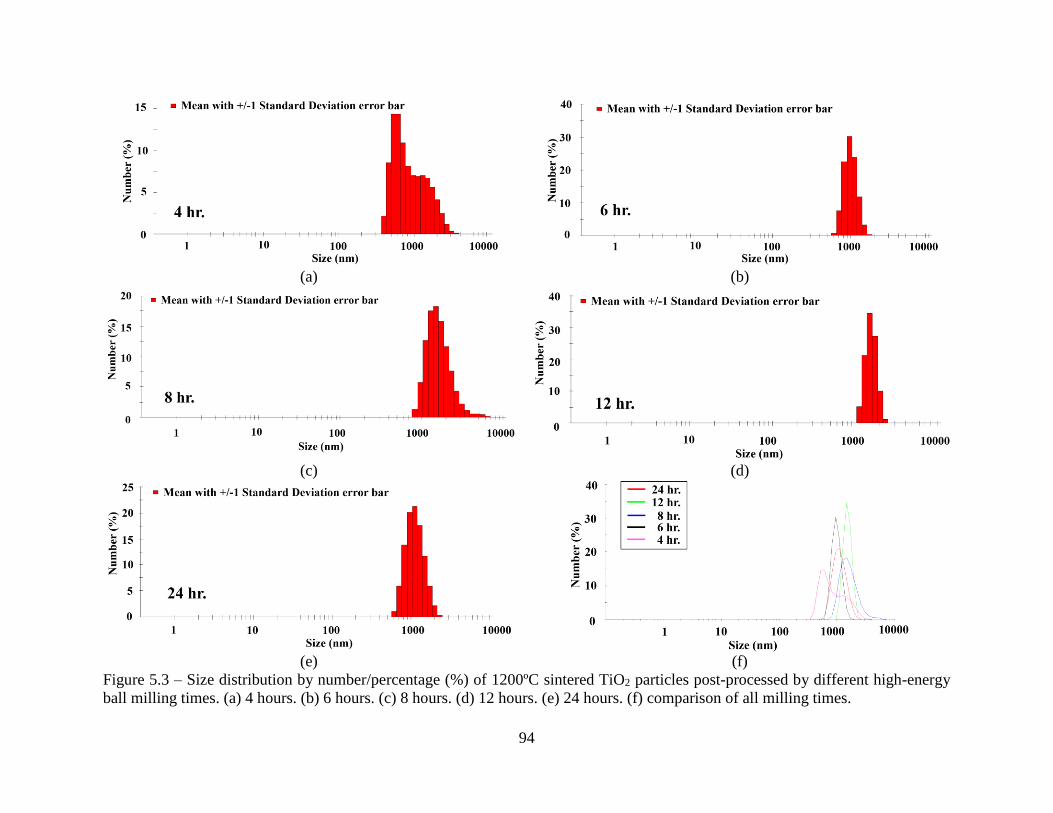
94
(a) (b)
(c) (d)
(e) (f)
Figure 5.3 – Size distribution by number/percentage (%) of 1200ºC sintered TiO2 particles post-processed by different high-energy
ball milling times. (a) 4 hours. (b) 6 hours. (c) 8 hours. (d) 12 hours. (e) 24 hours. (f) comparison of all milling times.
95
5.4.5 FDM 3D-Printing Process of Ceramic-Thermoplastic Composites
The FDM-ready feedstock composites were 3D-printed by using a tabletop 3Dn 3D-printer
(nScrypt, Orlando, FL) by following a fused deposition modeling (FDM) process. The 3D-printer
is equipped with a device known as nFD™, which is driven by a high-precision computer
controlled system that allows deposition of thermoplastic composite materials at XYZ coordinated
locations. A 1.8 mm diameter FDM feedstock material composed 30 vol. % COP-MgCaTiO2 with
fillers sintered at 1200ºC for three hours was 3D-printed by setting the nozzle heater at 290ºC and
using a nozzle tip known as ceramic nTIP™ with 325 µm inner diameter and 425 µm outer
diameter. The 3D-printer base plate (also called bed) was heated at 170ºC. This 3D-printing setting
to result in a first layer thickness of 0.2 mm, an extrusion multiplier of 0.9, and a printing speed of
7 mm/s. A printing speed lower than 10 mm/s is recommended to avoid filament feedstock
breakage for filler loaded feedstock materials.
Figure 5.4 shows a surface SEM images of a 3D-printed specimen. Figure 5.4(a) shows a
sample made of 30 vol. % COP-TiO2 thermoplastic composites with a measured surface roughness
of about 25 µm as shown in Figure 5.6. Figure 5.4(b) presents a specimen made of 25 vol. % COP-
MgCaTiO2 thermoplastic composites showing one of the embedded MgCaTiO2 microspheres.
Figure 5.5 depicts a cross-sectional EDS mapping study over a 25 µm2 area of an FDM-
printed 30 vol. % COP-MgCaTiO2 specimen prepared by a metallographic specimen preparation
process. The sample was sputter coated with a 20 nm of gold/palladium (Au/Pd) metal alloy. The
mapping was performed by using an S-800 field emission scanning electron microscope (FE-SEM)
(Hitachi Ltd., Tokyo, Japan) equipped with an EDS system (EDAX Inc., Mahwah, NJ). Figure
5.5(a) was taken by using an SU-70 SEM (Hitachi, Ltd, Tokyo, Japan). As shown, the ceramic
particles with an average particle size of 18 µm and some agglomeration in the form of micro-
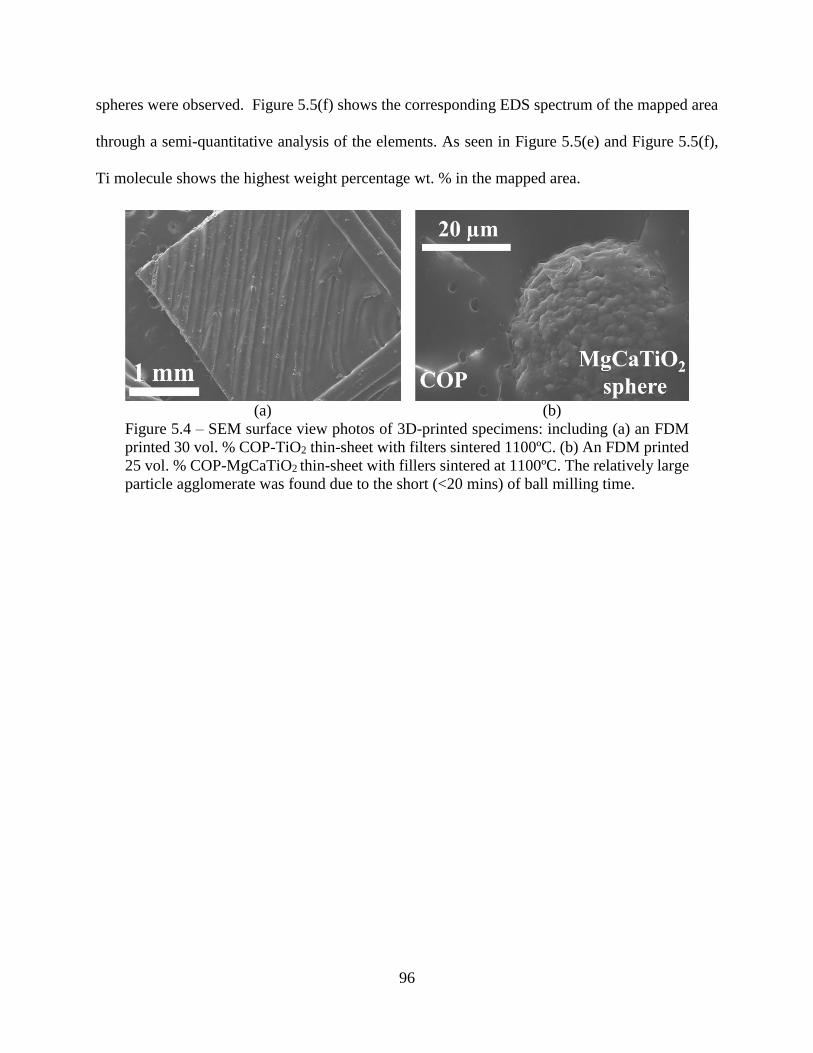
96
spheres were observed. Figure 5.5(f) shows the corresponding EDS spectrum of the mapped area
through a semi-quantitative analysis of the elements. As seen in Figure 5.5(e) and Figure 5.5(f),
Ti molecule shows the highest weight percentage wt. % in the mapped area.
(a) (b)
Figure 5.4 – SEM surface view photos of 3D-printed specimens: including (a) an FDM
printed 30 vol. % COP-TiO2 thin-sheet with filters sintered 1100ºC. (b) An FDM printed
25 vol. % COP-MgCaTiO2 thin-sheet with fillers sintered at 1100ºC. The relatively large
particle agglomerate was found due to the short (<20 mins) of ball milling time.
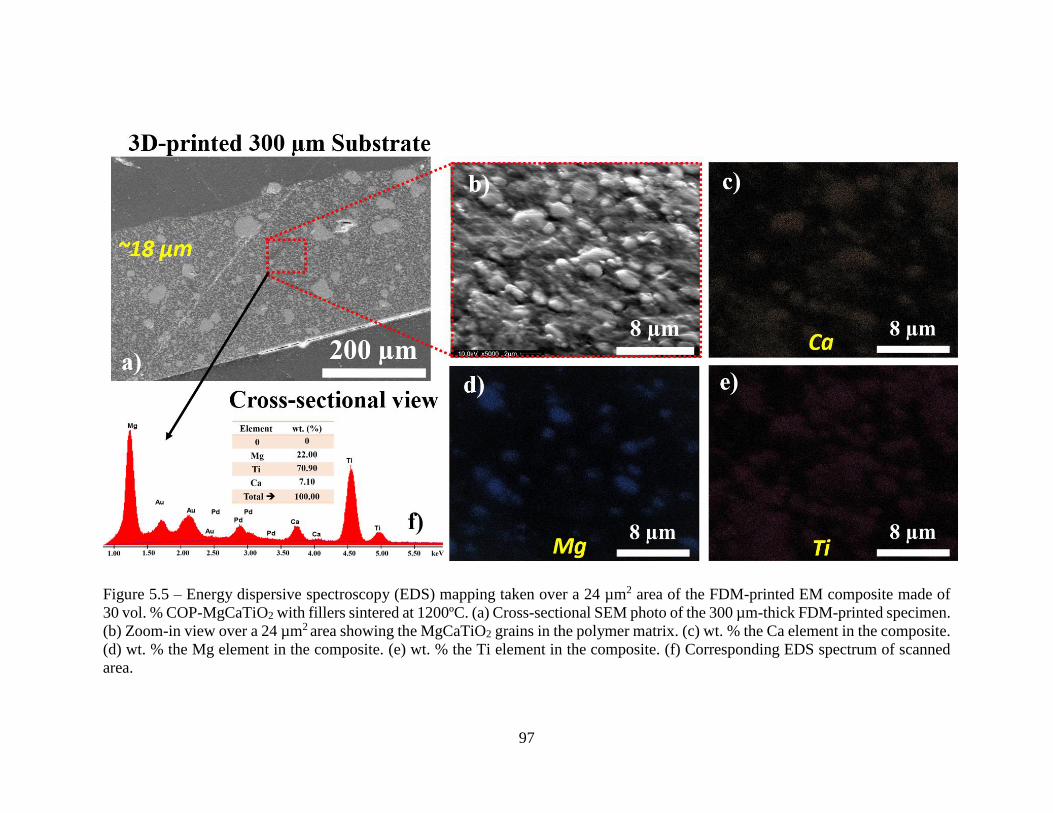
97
Figure 5.5 – Energy dispersive spectroscopy (EDS) mapping taken over a 24 µm2 area of the FDM-printed EM composite made of
30 vol. % COP-MgCaTiO2 with fillers sintered at 1200ºC. (a) Cross-sectional SEM photo of the 300 µm-thick FDM-printed specimen.
(b) Zoom-in view over a 24 µm2 area showing the MgCaTiO2 grains in the polymer matrix. (c) wt. % the Ca element in the composite.
(d) wt. % the Mg element in the composite. (e) wt. % the Ti element in the composite. (f) Corresponding EDS spectrum of scanned
area.
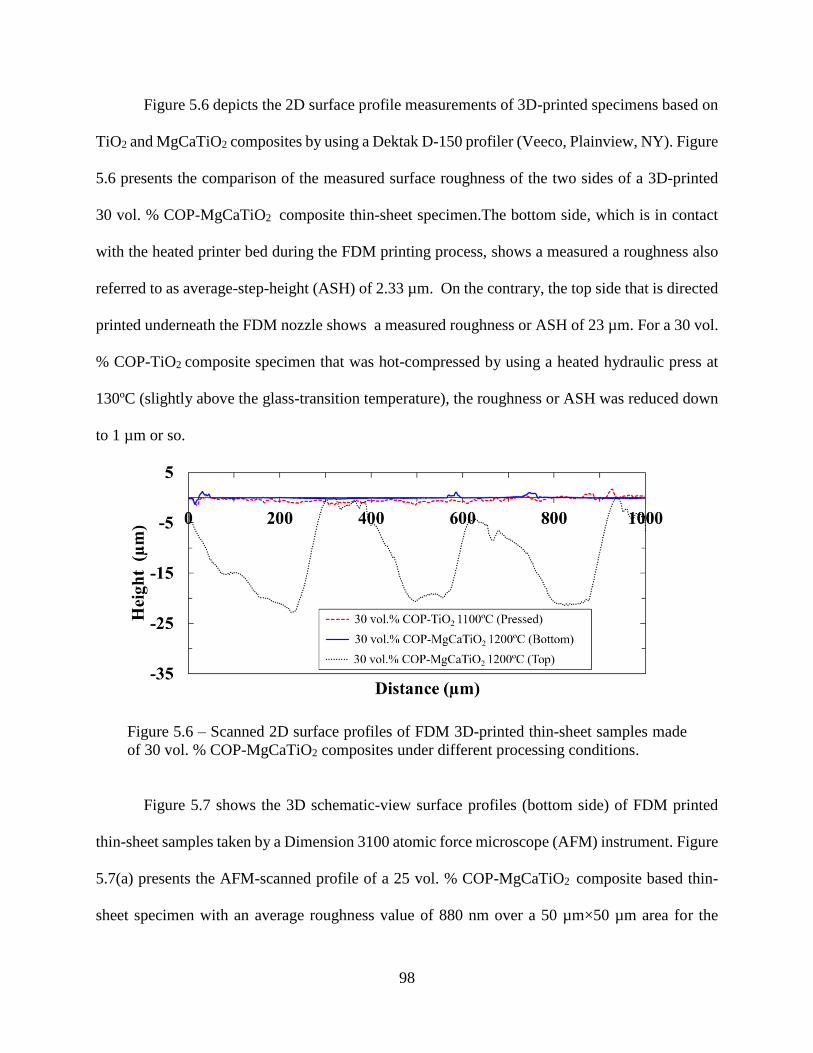
98
Figure 5.6 depicts the 2D surface profile measurements of 3D-printed specimens based on
TiO2 and MgCaTiO2 composites by using a Dektak D-150 profiler (Veeco, Plainview, NY). Figure
5.6 presents the comparison of the measured surface roughness of the two sides of a 3D-printed
30 vol. % COP-MgCaTiO2 composite thin-sheet specimen.The bottom side, which is in contact
with the heated printer bed during the FDM printing process, shows a measured a roughness also
referred to as average-step-height (ASH) of 2.33 µm. On the contrary, the top side that is directed
printed underneath the FDM nozzle shows a measured roughness or ASH of 23 µm. For a 30 vol.
% COP-TiO2 composite specimen that was hot-compressed by using a heated hydraulic press at
130ºC (slightly above the glass-transition temperature), the roughness or ASH was reduced down
to 1 µm or so.
Figure 5.6 – Scanned 2D surface profiles of FDM 3D-printed thin-sheet samples made
of 30 vol. % COP-MgCaTiO2 composites under different processing conditions.
Figure 5.7 shows the 3D schematic-view surface profiles (bottom side) of FDM printed
thin-sheet samples taken by a Dimension 3100 atomic force microscope (AFM) instrument. Figure
5.7(a) presents the AFM-scanned profile of a 25 vol. % COP-MgCaTiO2 composite based thin-
sheet specimen with an average roughness value of 880 nm over a 50 µm×50 µm area for the
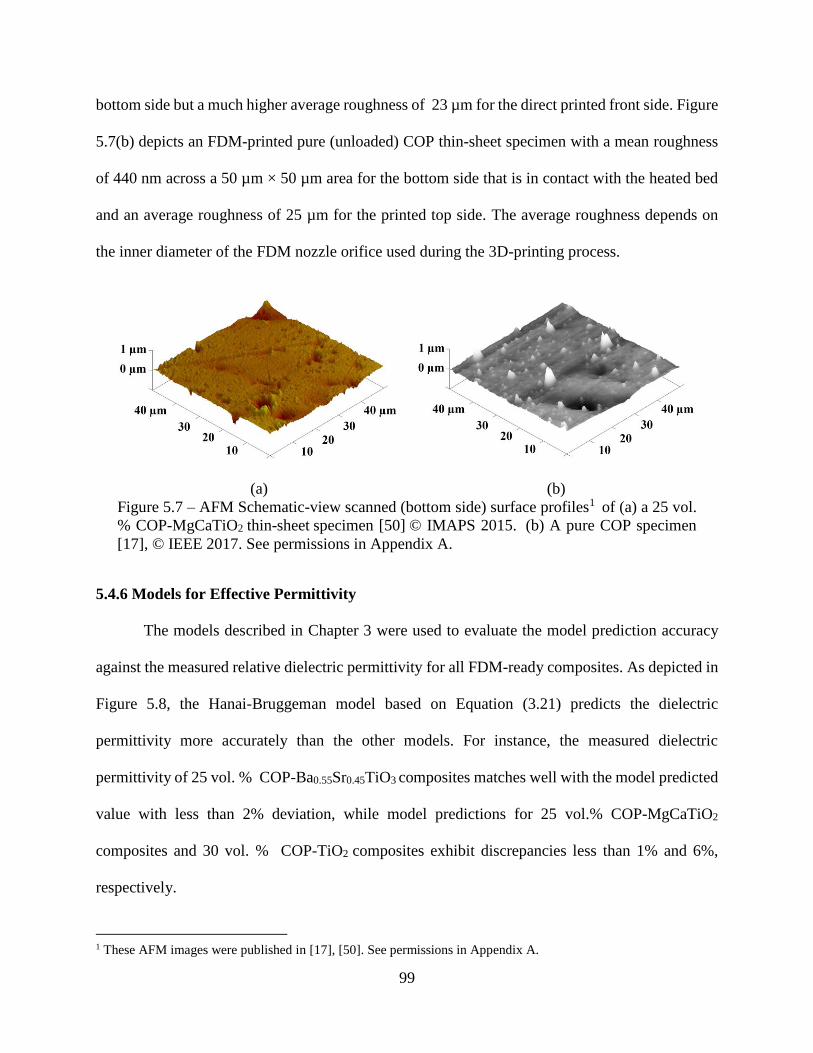
99
bottom side but a much higher average roughness of 23 µm for the direct printed front side. Figure
5.7(b) depicts an FDM-printed pure (unloaded) COP thin-sheet specimen with a mean roughness
of 440 nm across a 50 µm × 50 µm area for the bottom side that is in contact with the heated bed
and an average roughness of 25 µm for the printed top side. The average roughness depends on
the inner diameter of the FDM nozzle orifice used during the 3D-printing process.
(a) (b)
Figure 5.7 – AFM Schematic-view scanned (bottom side) surface profiles1 of (a) a 25 vol.
% COP-MgCaTiO2 thin-sheet specimen [50] © IMAPS 2015. (b) A pure COP specimen
[17], © IEEE 2017. See permissions in Appendix A.
5.4.6 Models for Effective Permittivity
The models described in Chapter 3 were used to evaluate the model prediction accuracy
against the measured relative dielectric permittivity for all FDM-ready composites. As depicted in
Figure 5.8, the Hanai-Bruggeman model based on Equation (3.21) predicts the dielectric
permittivity more accurately than the other models. For instance, the measured dielectric
permittivity of 25 vol. % COP-Ba0.55Sr0.45TiO3 composites matches well with the model predicted
value with less than 2% deviation, while model predictions for 25 vol.% COP-MgCaTiO2
composites and 30 vol. % COP-TiO2 composites exhibit discrepancies less than 1% and 6%,
respectively.
1 These AFM images were published in [17], [50]. See permissions in Appendix A.
100
Meanwhile, the Maxwell model based on Equation (3.23) predicts the permittivities of 25
vol. % COP-Ba0.55Sr0.45TiO3 composites, 25 vol. % COP-MgCaTiO2 composites, and 30 vol. %
COP-TiO2 composites, with less than 4%, 5%, and 1.3% deviation as compared to the measured
properties, respectively. On the other hand, the Rayleigh model based on Equation (3.20) leads to
slightly less accurate predictions for the 25 vol. % COP-Ba0.55Sr0.45TiO3 composites, 25 vol. %
COP-MgCaTiO2 composites, and 30 vol. % COP-TiO2 composites, with discrepancies of 13%,
13.5%, and 7.2%, respectively, when compared with actual measured properties.
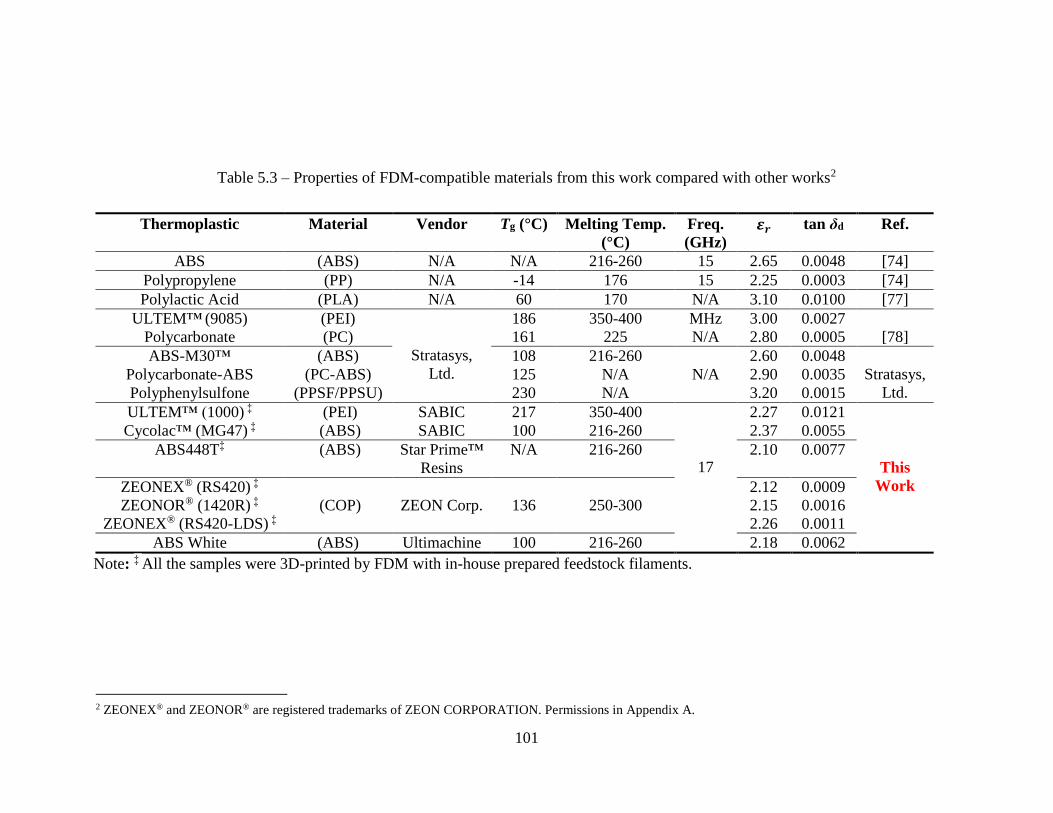
101
Table 5.3 – Properties of FDM-compatible materials from this work compared with other works2
2 ZEONEX® and ZEONOR® are registered trademarks of ZEON CORPORATION. Permissions in Appendix A.
Thermoplastic Material Vendor Tg (°C) Melting Temp.
(°C)
Freq.
(GHz)
𝜺𝒓 tan δd Ref.
ABS (ABS) N/A N/A 216-260 15 2.65 0.0048 [74]
Polypropylene (PP) N/A -14 176 15 2.25 0.0003 [74]
Polylactic Acid (PLA) N/A 60 170 N/A 3.10 0.0100 [77]
ULTEM™ (9085) (PEI)
Stratasys,
Ltd.
186 350-400 MHz 3.00 0.0027
[78] Polycarbonate (PC) 161 225 N/A 2.80 0.0005
ABS-M30™ (ABS) 108 216-260 2.60 0.0048
Stratasys,
Ltd.
Polycarbonate-ABS (PC-ABS) 125 N/A N/A 2.90 0.0035
Polyphenylsulfone (PPSF/PPSU) 230 N/A 3.20 0.0015
ULTEM™ (1000) ‡ (PEI) SABIC 217 350-400
17
2.27 0.0121
This
Work
Cycolac™ (MG47) ‡ (ABS) SABIC 100 216-260 2.37 0.0055
ABS448T‡ (ABS) Star Prime™
Resins
N/A 216-260 2.10 0.0077
ZEONEX® (RS420) ‡ 2.12 0.0009
ZEONOR® (1420R) ‡ (COP) ZEON Corp. 136 250-300 2.15 0.0016
ZEONEX® (RS420-LDS) ‡ 2.26 0.0011
ABS White (ABS) Ultimachine 100 216-260 2.18 0.0062
Note: ‡ All the samples were 3D-printed by FDM with in-house prepared feedstock filaments.
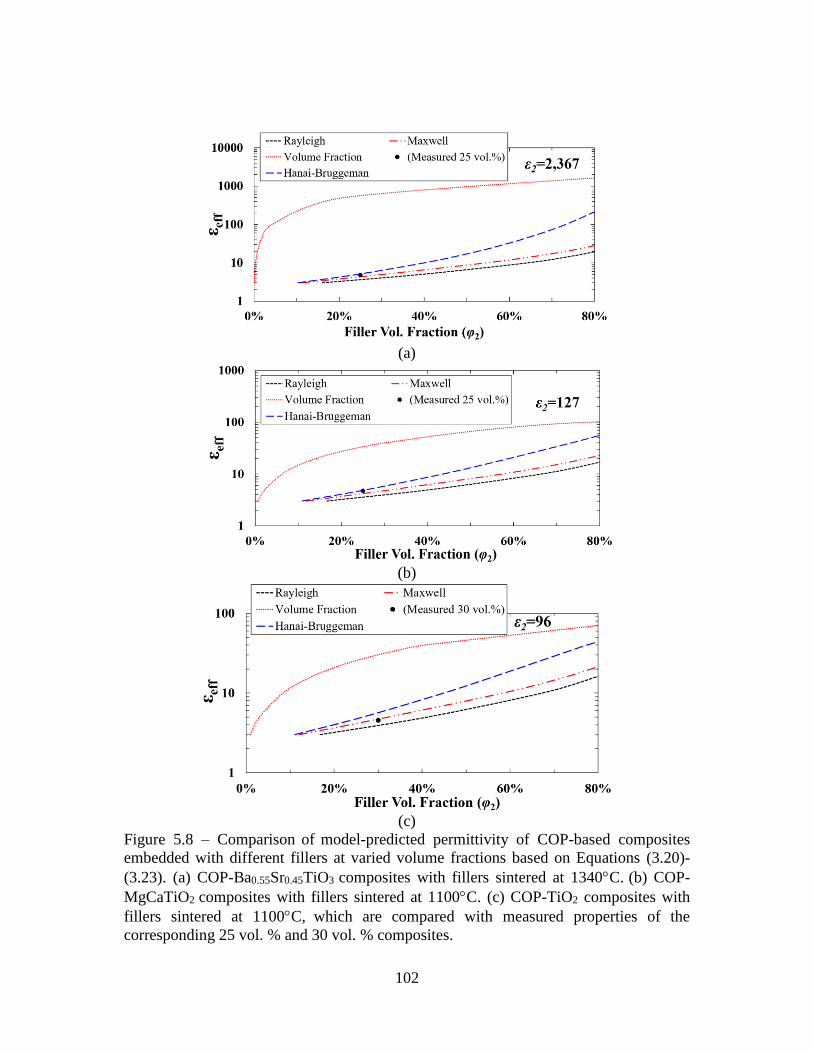
102
(a)
(b)
(c)
Figure 5.8 – Comparison of model-predicted permittivity of COP-based composites
embedded with different fillers at varied volume fractions based on Equations (3.20)-
(3.23). (a) COP-Ba0.55Sr0.45TiO3 composites with fillers sintered at 1340C. (b) COP-
MgCaTiO2 composites with fillers sintered at 1100C. (c) COP-TiO2 composites with
fillers sintered at 1100C, which are compared with measured properties of the
corresponding 25 vol. % and 30 vol. % composites.
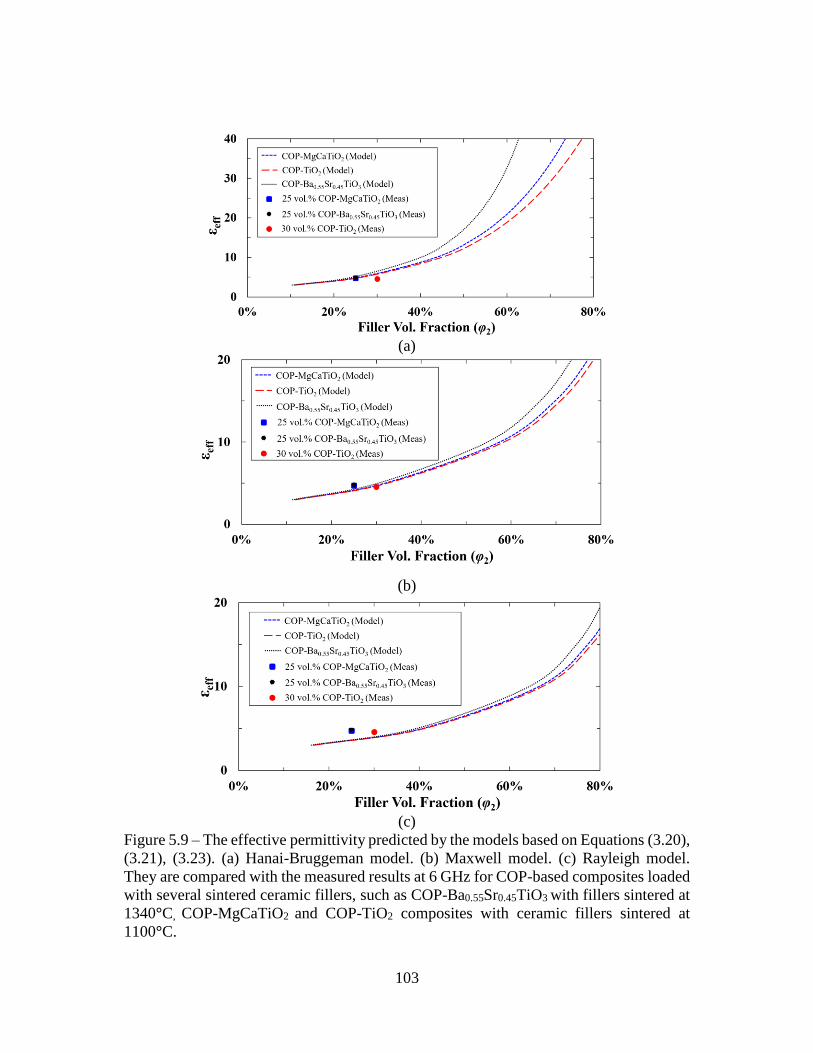
103
(a)
(b)
(c)
Figure 5.9 – The effective permittivity predicted by the models based on Equations (3.20),
(3.21), (3.23). (a) Hanai-Bruggeman model. (b) Maxwell model. (c) Rayleigh model.
They are compared with the measured results at 6 GHz for COP-based composites loaded
with several sintered ceramic fillers, such as COP-Ba0.55Sr0.45TiO3 with fillers sintered at
1340°C, COP-MgCaTiO2 and COP-TiO2 composites with ceramic fillers sintered at
1100°C.
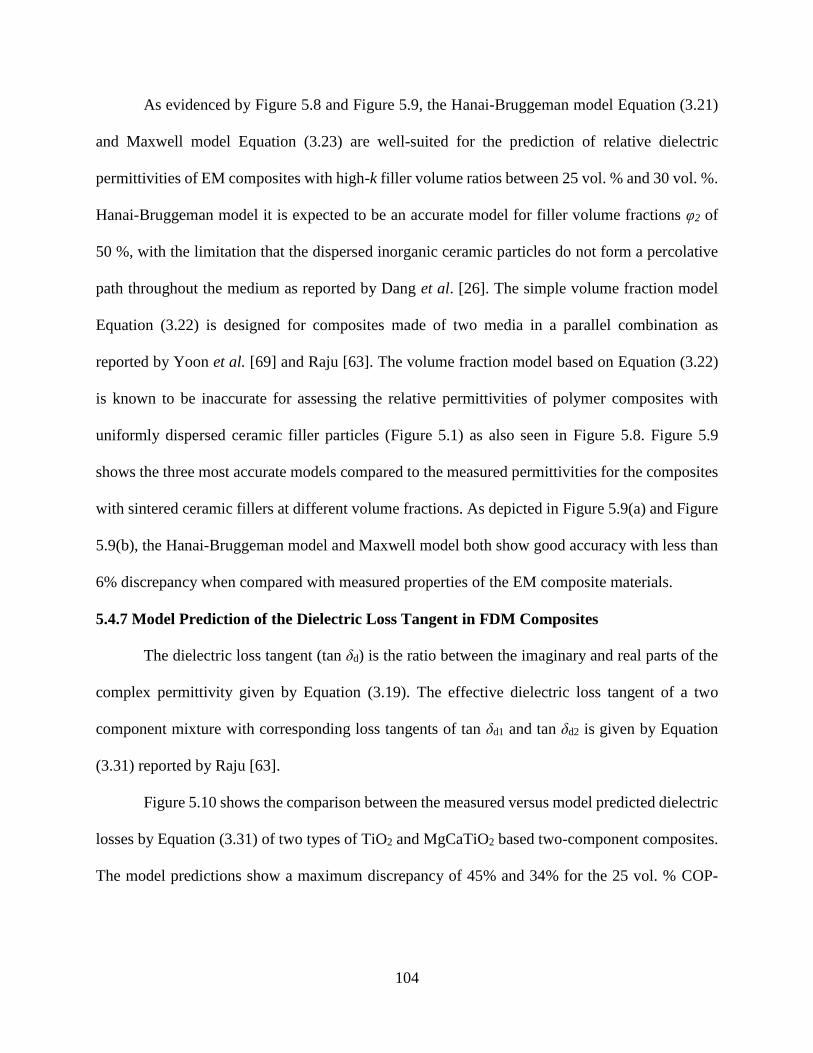
104
As evidenced by Figure 5.8 and Figure 5.9, the Hanai-Bruggeman model Equation (3.21)
and Maxwell model Equation (3.23) are well-suited for the prediction of relative dielectric
permittivities of EM composites with high-k filler volume ratios between 25 vol. % and 30 vol. %.
Hanai-Bruggeman model it is expected to be an accurate model for filler volume fractions φ2 of
50 %, with the limitation that the dispersed inorganic ceramic particles do not form a percolative
path throughout the medium as reported by Dang et al. [26]. The simple volume fraction model
Equation (3.22) is designed for composites made of two media in a parallel combination as
reported by Yoon et al. [69] and Raju [63]. The volume fraction model based on Equation (3.22)
is known to be inaccurate for assessing the relative permittivities of polymer composites with
uniformly dispersed ceramic filler particles (Figure 5.1) as also seen in Figure 5.8. Figure 5.9
shows the three most accurate models compared to the measured permittivities for the composites
with sintered ceramic fillers at different volume fractions. As depicted in Figure 5.9(a) and Figure
5.9(b), the Hanai-Bruggeman model and Maxwell model both show good accuracy with less than
6% discrepancy when compared with measured properties of the EM composite materials.
5.4.7 Model Prediction of the Dielectric Loss Tangent in FDM Composites
The dielectric loss tangent (tan δd) is the ratio between the imaginary and real parts of the
complex permittivity given by Equation (3.19). The effective dielectric loss tangent of a two
component mixture with corresponding loss tangents of tan δd1 and tan δd2 is given by Equation
(3.31) reported by Raju [63].
Figure 5.10 shows the comparison between the measured versus model predicted dielectric
losses by Equation (3.31) of two types of TiO2 and MgCaTiO2 based two-component composites.
The model predictions show a maximum discrepancy of 45% and 34% for the 25 vol. % COP-
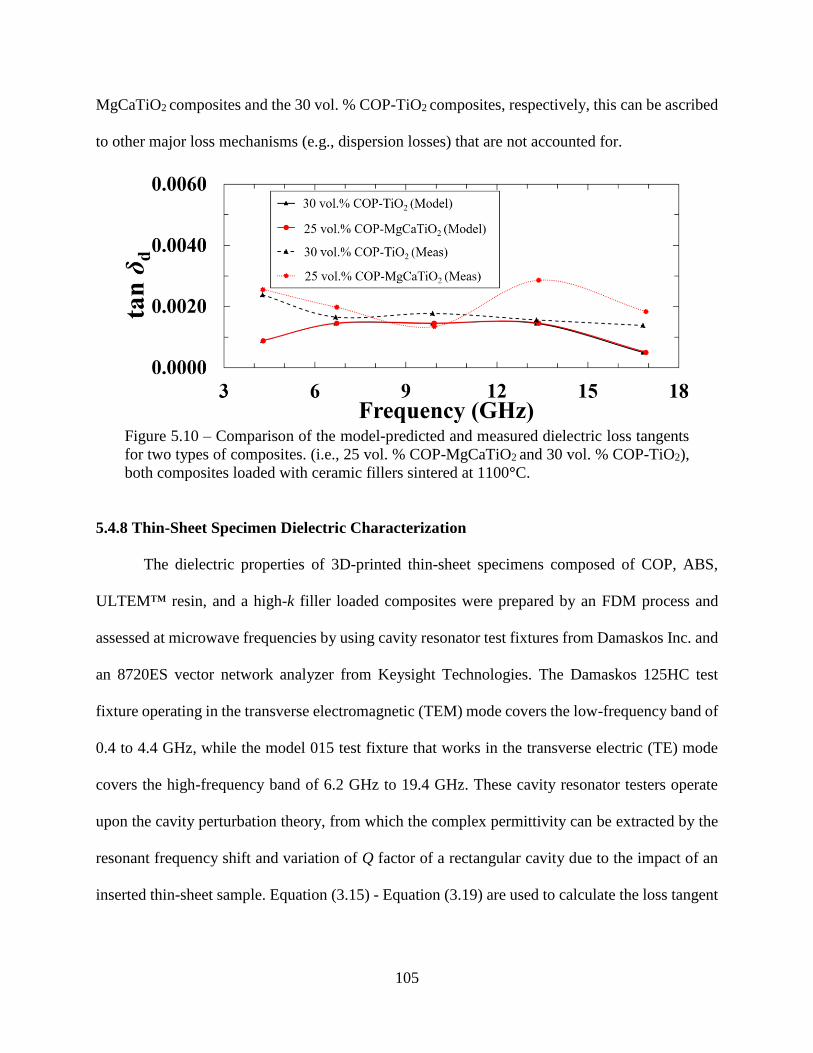
105
MgCaTiO2 composites and the 30 vol. % COP-TiO2 composites, respectively, this can be ascribed
to other major loss mechanisms (e.g., dispersion losses) that are not accounted for.
Figure 5.10 – Comparison of the model-predicted and measured dielectric loss tangents
for two types of composites. (i.e., 25 vol. % COP-MgCaTiO2 and 30 vol. % COP-TiO2),
both composites loaded with ceramic fillers sintered at 1100°C.
5.4.8 Thin-Sheet Specimen Dielectric Characterization
The dielectric properties of 3D-printed thin-sheet specimens composed of COP, ABS,
ULTEM™ resin, and a high-k filler loaded composites were prepared by an FDM process and
assessed at microwave frequencies by using cavity resonator test fixtures from Damaskos Inc. and
an 8720ES vector network analyzer from Keysight Technologies. The Damaskos 125HC test
fixture operating in the transverse electromagnetic (TEM) mode covers the low-frequency band of
0.4 to 4.4 GHz, while the model 015 test fixture that works in the transverse electric (TE) mode
covers the high-frequency band of 6.2 GHz to 19.4 GHz. These cavity resonator testers operate
upon the cavity perturbation theory, from which the complex permittivity can be extracted by the
resonant frequency shift and variation of Q factor of a rectangular cavity due to the impact of an
inserted thin-sheet sample. Equation (3.15) - Equation (3.19) are used to calculate the loss tangent
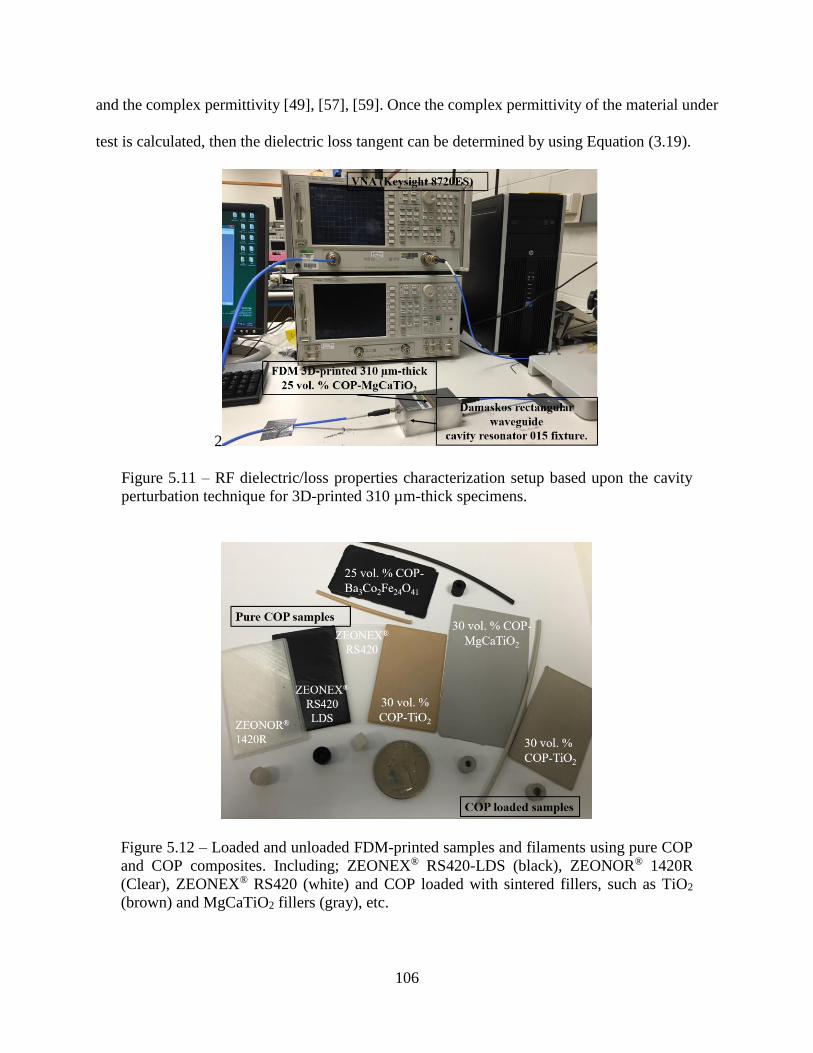
106
and the complex permittivity [49], [57], [59]. Once the complex permittivity of the material under
test is calculated, then the dielectric loss tangent can be determined by using Equation (3.19).
2
Figure 5.11 – RF dielectric/loss properties characterization setup based upon the cavity
perturbation technique for 3D-printed 310 µm-thick specimens.
Figure 5.12 – Loaded and unloaded FDM-printed samples and filaments using pure COP
and COP composites. Including; ZEONEX® RS420-LDS (black), ZEONOR® 1420R
(Clear), ZEONEX® RS420 (white) and COP loaded with sintered fillers, such as TiO2
(brown) and MgCaTiO2 fillers (gray), etc.
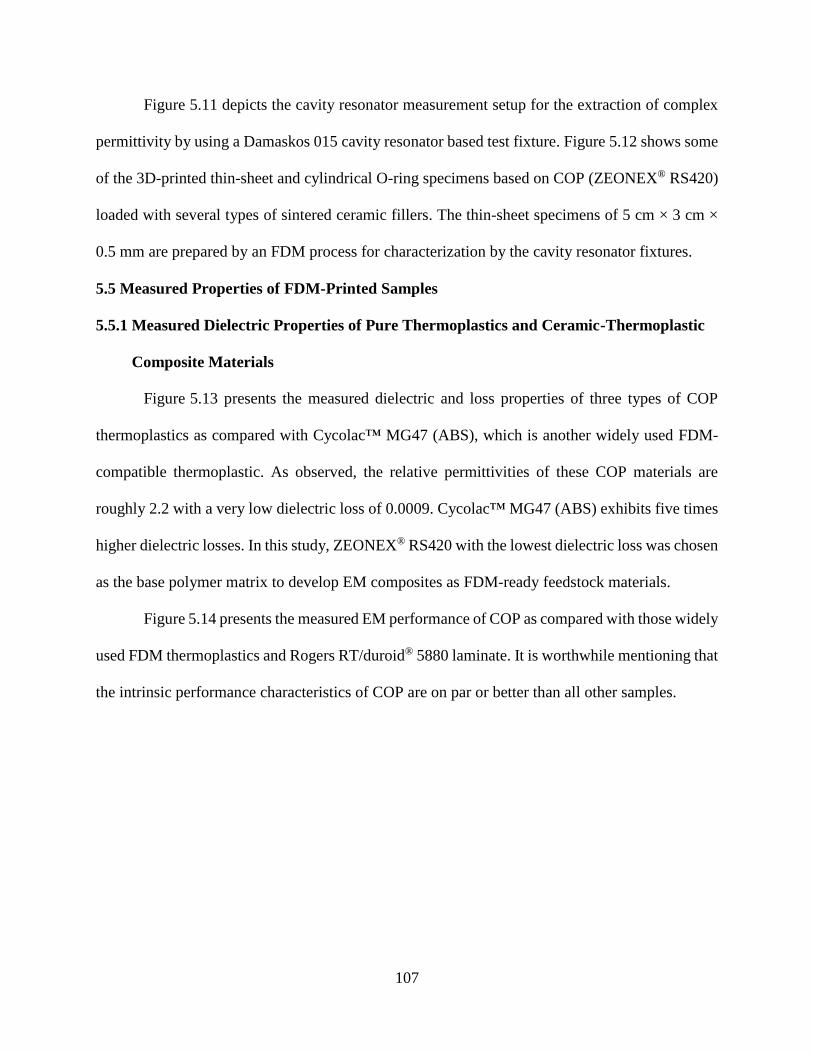
107
Figure 5.11 depicts the cavity resonator measurement setup for the extraction of complex
permittivity by using a Damaskos 015 cavity resonator based test fixture. Figure 5.12 shows some
of the 3D-printed thin-sheet and cylindrical O-ring specimens based on COP (ZEONEX® RS420)
loaded with several types of sintered ceramic fillers. The thin-sheet specimens of 5 cm × 3 cm ×
0.5 mm are prepared by an FDM process for characterization by the cavity resonator fixtures.
5.5 Measured Properties of FDM-Printed Samples
5.5.1 Measured Dielectric Properties of Pure Thermoplastics and Ceramic-Thermoplastic
Composite Materials
Figure 5.13 presents the measured dielectric and loss properties of three types of COP
thermoplastics as compared with Cycolac™ MG47 (ABS), which is another widely used FDM-
compatible thermoplastic. As observed, the relative permittivities of these COP materials are
roughly 2.2 with a very low dielectric loss of 0.0009. Cycolac™ MG47 (ABS) exhibits five times
higher dielectric losses. In this study, ZEONEX® RS420 with the lowest dielectric loss was chosen
as the base polymer matrix to develop EM composites as FDM-ready feedstock materials.
Figure 5.14 presents the measured EM performance of COP as compared with those widely
used FDM thermoplastics and Rogers RT/duroid® 5880 laminate. It is worthwhile mentioning that
the intrinsic performance characteristics of COP are on par or better than all other samples.
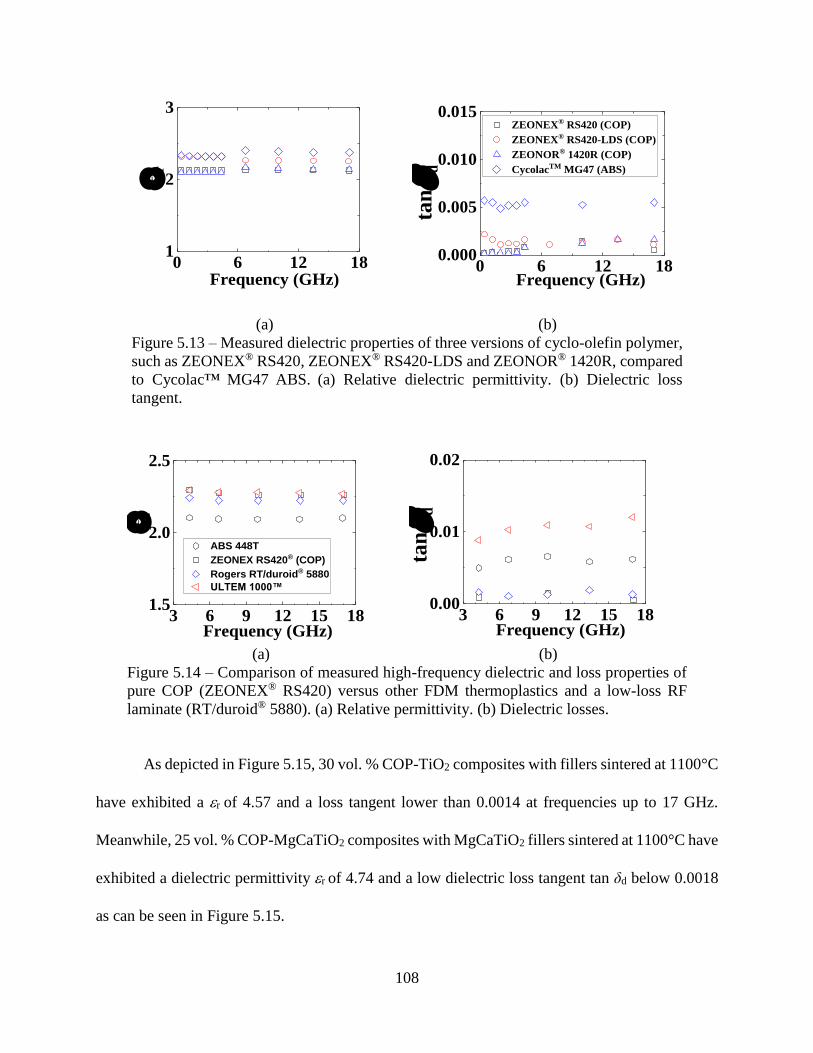
108
0 6 12 181
2
3
Frequency (GHz)
r
0 6 12 180.000
0.005
0.010
0.015 ZEONEX® RS420 (COP)
ZEONEX® RS420-LDS (COP)
ZEONOR® 1420R (COP)
CycolacTM MG47 (ABS)
Frequency (GHz)
tan
d
(a) (b)
Figure 5.13 – Measured dielectric properties of three versions of cyclo-olefin polymer,
such as ZEONEX® RS420, ZEONEX® RS420-LDS and ZEONOR® 1420R, compared
to Cycolac™ MG47 ABS. (a) Relative dielectric permittivity. (b) Dielectric loss
tangent.
3 6 9 12 15 181.5
2.0
2.5
r
Frequency (GHz)
ABS 448T
ZEONEX RS420® (COP)
Rogers RT/duroid® 5880
ULTEM 1000™
3 6 9 12 15 180.00
0.01
0.02
tan
d
Frequency (GHz)
(a) (b)
Figure 5.14 – Comparison of measured high-frequency dielectric and loss properties of
pure COP (ZEONEX® RS420) versus other FDM thermoplastics and a low-loss RF
laminate (RT/duroid® 5880). (a) Relative permittivity. (b) Dielectric losses.
As depicted in Figure 5.15, 30 vol. % COP-TiO2 composites with fillers sintered at 1100°C
have exhibited a r of 4.57 and a loss tangent lower than 0.0014 at frequencies up to 17 GHz.
Meanwhile, 25 vol. % COP-MgCaTiO2 composites with MgCaTiO2 fillers sintered at 1100°C have
exhibited a dielectric permittivity r of 4.74 and a low dielectric loss tangent tan δd below 0.0018
as can be seen in Figure 5.15.
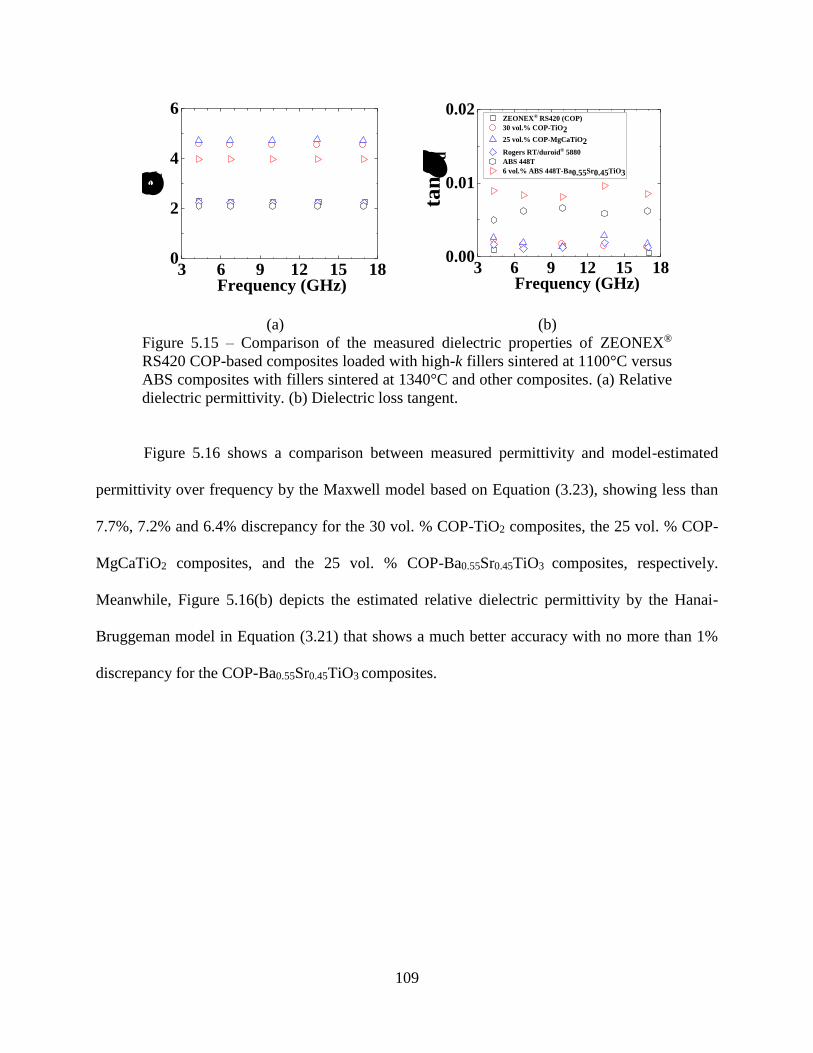
109
3 6 9 12 15 180
2
4
6
Frequency (GHz)
r
3 6 9 12 15 180.00
0.01
0.02
tan
d
ZEONEX® RS420 (COP)
30 vol.% COP-TiO2
25 vol.% COP-MgCaTiO2
Rogers RT/duroid® 5880
ABS 448T
6 vol.% ABS 448T-Ba0.55Sr0.45TiO3
Frequency (GHz)
(a) (b)
Figure 5.15 – Comparison of the measured dielectric properties of ZEONEX®
RS420 COP-based composites loaded with high-k fillers sintered at 1100°C versus
ABS composites with fillers sintered at 1340°C and other composites. (a) Relative
dielectric permittivity. (b) Dielectric loss tangent.
Figure 5.16 shows a comparison between measured permittivity and model-estimated
permittivity over frequency by the Maxwell model based on Equation (3.23), showing less than
7.7%, 7.2% and 6.4% discrepancy for the 30 vol. % COP-TiO2 composites, the 25 vol. % COP-
MgCaTiO2 composites, and the 25 vol. % COP-Ba0.55Sr0.45TiO3 composites, respectively.
Meanwhile, Figure 5.16(b) depicts the estimated relative dielectric permittivity by the Hanai-
Bruggeman model in Equation (3.21) that shows a much better accuracy with no more than 1%
discrepancy for the COP-Ba0.55Sr0.45TiO3 composites.
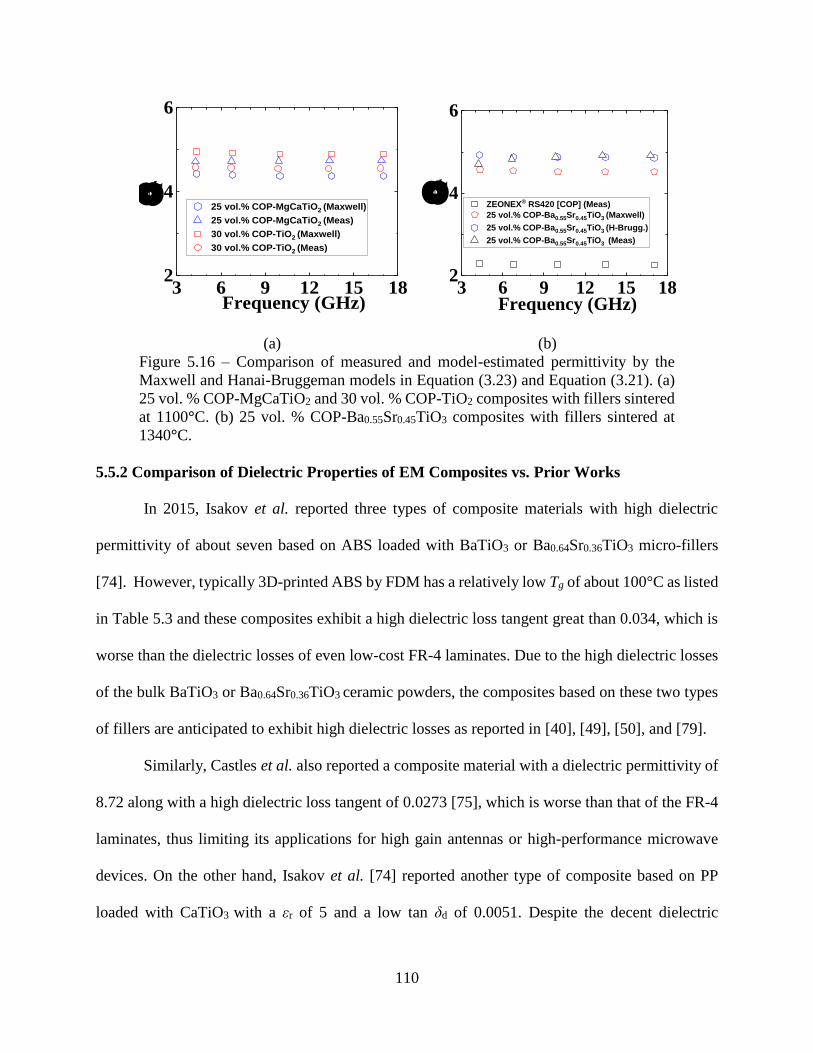
110
3 6 9 12 15 182
4
6
25 vol.% COP-MgCaTiO2 (Maxwell)
25 vol.% COP-MgCaTiO2 (Meas)
30 vol.% COP-TiO2 (Maxwell)
30 vol.% COP-TiO2 (Meas)
Frequency (GHz)
r
3 6 9 12 15 182
4
6
ZEONEX® RS420 [COP] (Meas)
25 vol.% COP-Ba0.55Sr0.45TiO3 (Maxwell)
25 vol.% COP-Ba0.55Sr0.45TiO3 (H-Brugg.)
25 vol.% COP-Ba0.55Sr0.45TiO3 (Meas)
r
Frequency (GHz)
(a) (b)
Figure 5.16 – Comparison of measured and model-estimated permittivity by the
Maxwell and Hanai-Bruggeman models in Equation (3.23) and Equation (3.21). (a)
25 vol. % COP-MgCaTiO2 and 30 vol. % COP-TiO2 composites with fillers sintered
at 1100°C. (b) 25 vol. % COP-Ba0.55Sr0.45TiO3 composites with fillers sintered at
1340°C.
5.5.2 Comparison of Dielectric Properties of EM Composites vs. Prior Works
In 2015, Isakov et al. reported three types of composite materials with high dielectric
permittivity of about seven based on ABS loaded with BaTiO3 or Ba0.64Sr0.36TiO3 micro-fillers
[74]. However, typically 3D-printed ABS by FDM has a relatively low Tg of about 100°C as listed
in Table 5.3 and these composites exhibit a high dielectric loss tangent great than 0.034, which is
worse than the dielectric losses of even low-cost FR-4 laminates. Due to the high dielectric losses
of the bulk BaTiO3 or Ba0.64Sr0.36TiO3 ceramic powders, the composites based on these two types
of fillers are anticipated to exhibit high dielectric losses as reported in [40], [49], [50], and [79].
Similarly, Castles et al. also reported a composite material with a dielectric permittivity of
8.72 along with a high dielectric loss tangent of 0.0273 [75], which is worse than that of the FR-4
laminates, thus limiting its applications for high gain antennas or high-performance microwave
devices. On the other hand, Isakov et al. [74] reported another type of composite based on PP
loaded with CaTiO3 with a εr of 5 and a low tan δd of 0.0051. Despite the decent dielectric
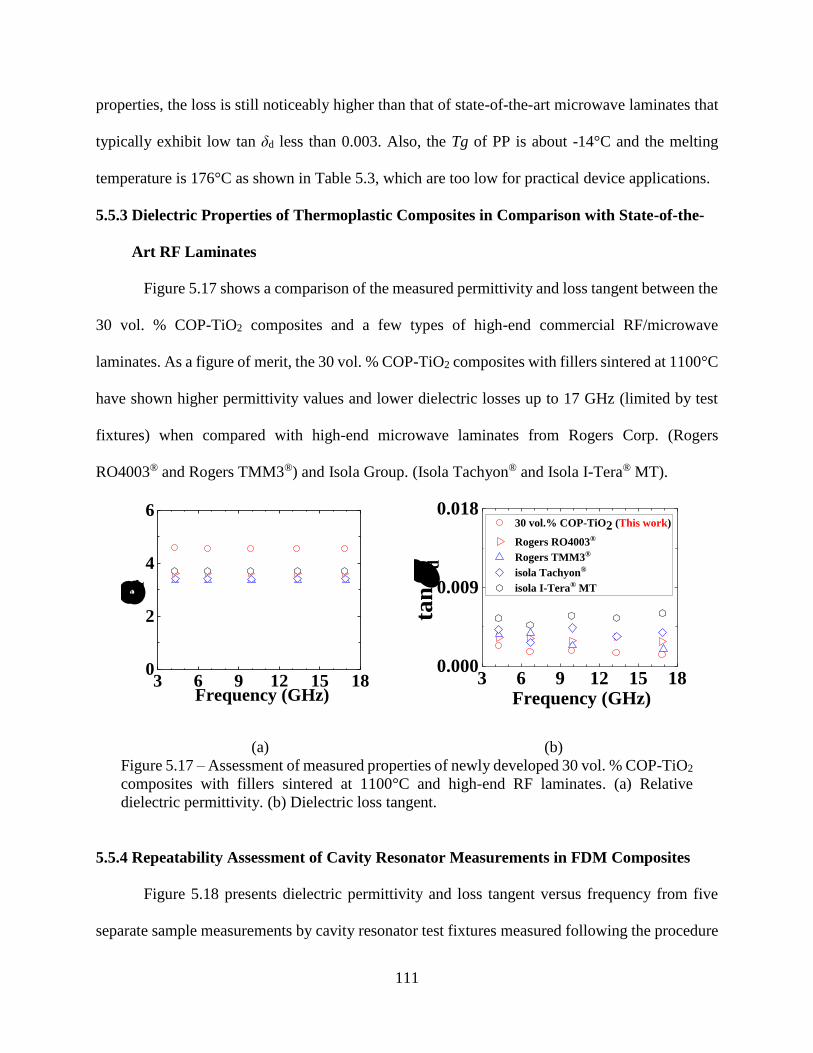
111
properties, the loss is still noticeably higher than that of state-of-the-art microwave laminates that
typically exhibit low tan δd less than 0.003. Also, the Tg of PP is about -14°C and the melting
temperature is 176°C as shown in Table 5.3, which are too low for practical device applications.
5.5.3 Dielectric Properties of Thermoplastic Composites in Comparison with State-of-the-
Art RF Laminates
Figure 5.17 shows a comparison of the measured permittivity and loss tangent between the
30 vol. % COP-TiO2 composites and a few types of high-end commercial RF/microwave
laminates. As a figure of merit, the 30 vol. % COP-TiO2 composites with fillers sintered at 1100°C
have shown higher permittivity values and lower dielectric losses up to 17 GHz (limited by test
fixtures) when compared with high-end microwave laminates from Rogers Corp. (Rogers
RO4003® and Rogers TMM3®) and Isola Group. (Isola Tachyon® and Isola I-Tera® MT).
3 6 9 12 15 180
2
4
6
Frequency (GHz)
r
3 6 9 12 15 180.000
0.009
0.018 30 vol.% COP-TiO2 (This work)
Rogers RO4003®
Rogers TMM3®
isola Tachyon®
isola I-Tera® MT
Frequency (GHz)
tan
d
(a) (b)
Figure 5.17 – Assessment of measured properties of newly developed 30 vol. % COP-TiO2
composites with fillers sintered at 1100°C and high-end RF laminates. (a) Relative
dielectric permittivity. (b) Dielectric loss tangent.
5.5.4 Repeatability Assessment of Cavity Resonator Measurements in FDM Composites
Figure 5.18 presents dielectric permittivity and loss tangent versus frequency from five
separate sample measurements by cavity resonator test fixtures measured following the procedure
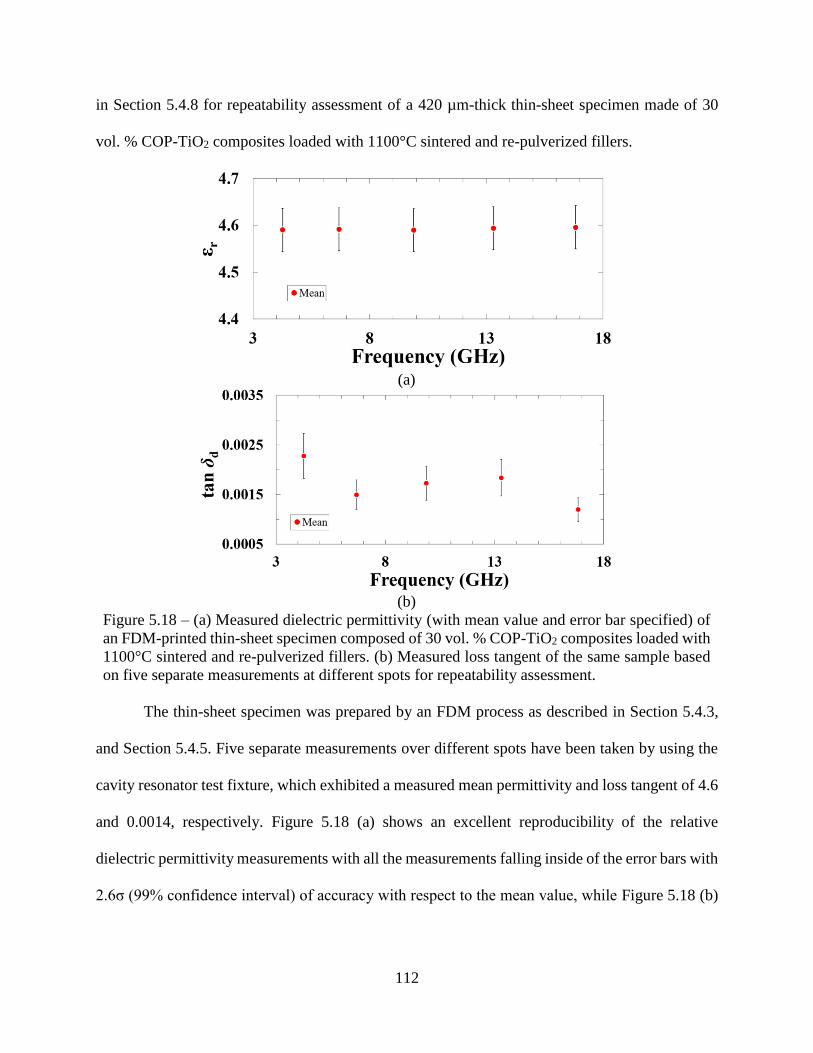
112
in Section 5.4.8 for repeatability assessment of a 420 µm-thick thin-sheet specimen made of 30
vol. % COP-TiO2 composites loaded with 1100°C sintered and re-pulverized fillers.
(a)
(b)
Figure 5.18 – (a) Measured dielectric permittivity (with mean value and error bar specified) of
an FDM-printed thin-sheet specimen composed of 30 vol. % COP-TiO2 composites loaded with
1100°C sintered and re-pulverized fillers. (b) Measured loss tangent of the same sample based
on five separate measurements at different spots for repeatability assessment.
The thin-sheet specimen was prepared by an FDM process as described in Section 5.4.3,
and Section 5.4.5. Five separate measurements over different spots have been taken by using the
cavity resonator test fixture, which exhibited a measured mean permittivity and loss tangent of 4.6
and 0.0014, respectively. Figure 5.18 (a) shows an excellent reproducibility of the relative
dielectric permittivity measurements with all the measurements falling inside of the error bars with
2.6σ (99% confidence interval) of accuracy with respect to the mean value, while Figure 5.18 (b)
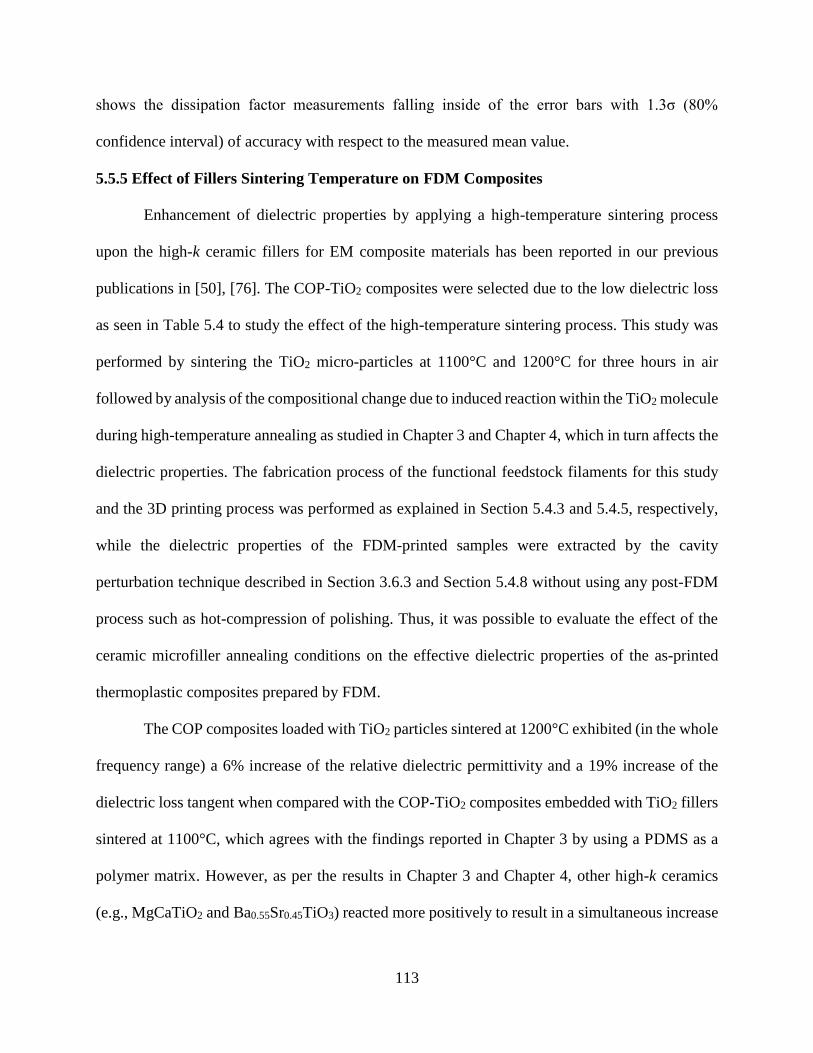
113
shows the dissipation factor measurements falling inside of the error bars with 1.3σ (80%
confidence interval) of accuracy with respect to the measured mean value.
5.5.5 Effect of Fillers Sintering Temperature on FDM Composites
Enhancement of dielectric properties by applying a high-temperature sintering process
upon the high-k ceramic fillers for EM composite materials has been reported in our previous
publications in [50], [76]. The COP-TiO2 composites were selected due to the low dielectric loss
as seen in Table 5.4 to study the effect of the high-temperature sintering process. This study was
performed by sintering the TiO2 micro-particles at 1100°C and 1200°C for three hours in air
followed by analysis of the compositional change due to induced reaction within the TiO2 molecule
during high-temperature annealing as studied in Chapter 3 and Chapter 4, which in turn affects the
dielectric properties. The fabrication process of the functional feedstock filaments for this study
and the 3D printing process was performed as explained in Section 5.4.3 and 5.4.5, respectively,
while the dielectric properties of the FDM-printed samples were extracted by the cavity
perturbation technique described in Section 3.6.3 and Section 5.4.8 without using any post-FDM
process such as hot-compression of polishing. Thus, it was possible to evaluate the effect of the
ceramic microfiller annealing conditions on the effective dielectric properties of the as-printed
thermoplastic composites prepared by FDM.
The COP composites loaded with TiO2 particles sintered at 1200°C exhibited (in the whole
frequency range) a 6% increase of the relative dielectric permittivity and a 19% increase of the
dielectric loss tangent when compared with the COP-TiO2 composites embedded with TiO2 fillers
sintered at 1100°C, which agrees with the findings reported in Chapter 3 by using a PDMS as a
polymer matrix. However, as per the results in Chapter 3 and Chapter 4, other high-k ceramics
(e.g., MgCaTiO2 and Ba0.55Sr0.45TiO3) reacted more positively to result in a simultaneous increase
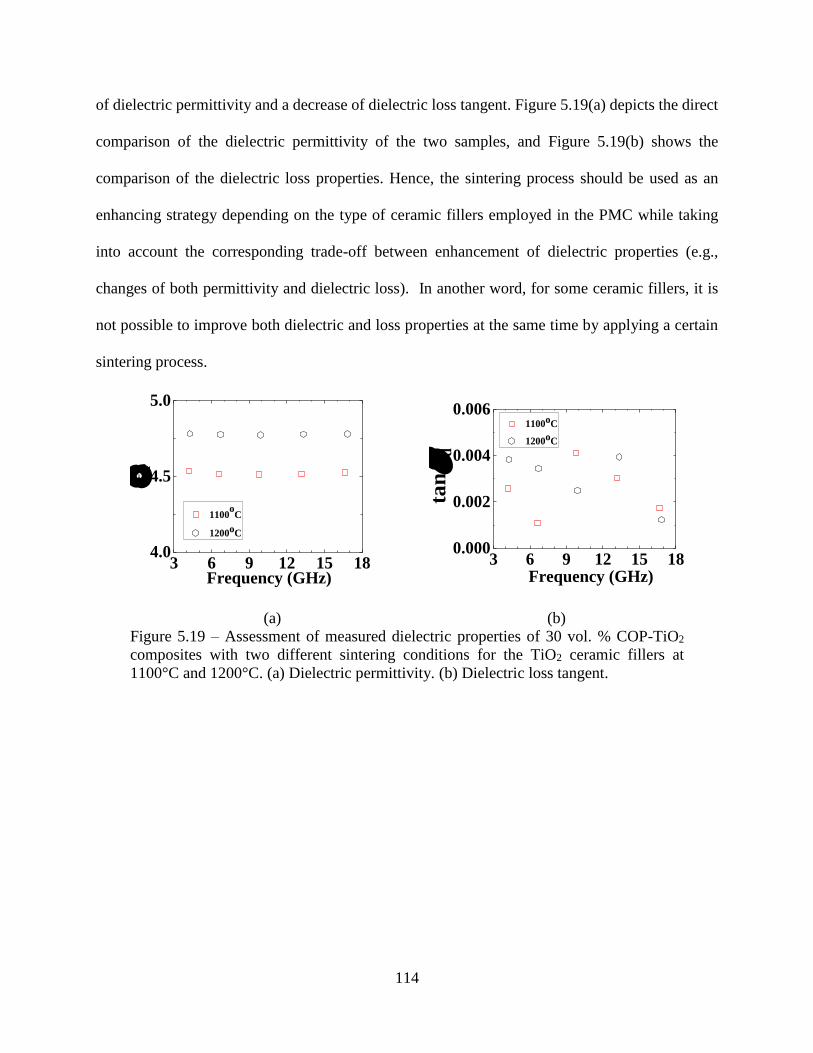
114
of dielectric permittivity and a decrease of dielectric loss tangent. Figure 5.19(a) depicts the direct
comparison of the dielectric permittivity of the two samples, and Figure 5.19(b) shows the
comparison of the dielectric loss properties. Hence, the sintering process should be used as an
enhancing strategy depending on the type of ceramic fillers employed in the PMC while taking
into account the corresponding trade-off between enhancement of dielectric properties (e.g.,
changes of both permittivity and dielectric loss). In another word, for some ceramic fillers, it is
not possible to improve both dielectric and loss properties at the same time by applying a certain
sintering process.
3 6 9 12 15 184.0
4.5
5.0
Frequency (GHz)
1100o
C
1200oC
r
3 6 9 12 15 180.000
0.002
0.004
0.006
tan
d
Frequency (GHz)
1100oC
1200oC
(a) (b)
Figure 5.19 – Assessment of measured dielectric properties of 30 vol. % COP-TiO2
composites with two different sintering conditions for the TiO2 ceramic fillers at
1100°C and 1200°C. (a) Dielectric permittivity. (b) Dielectric loss tangent.
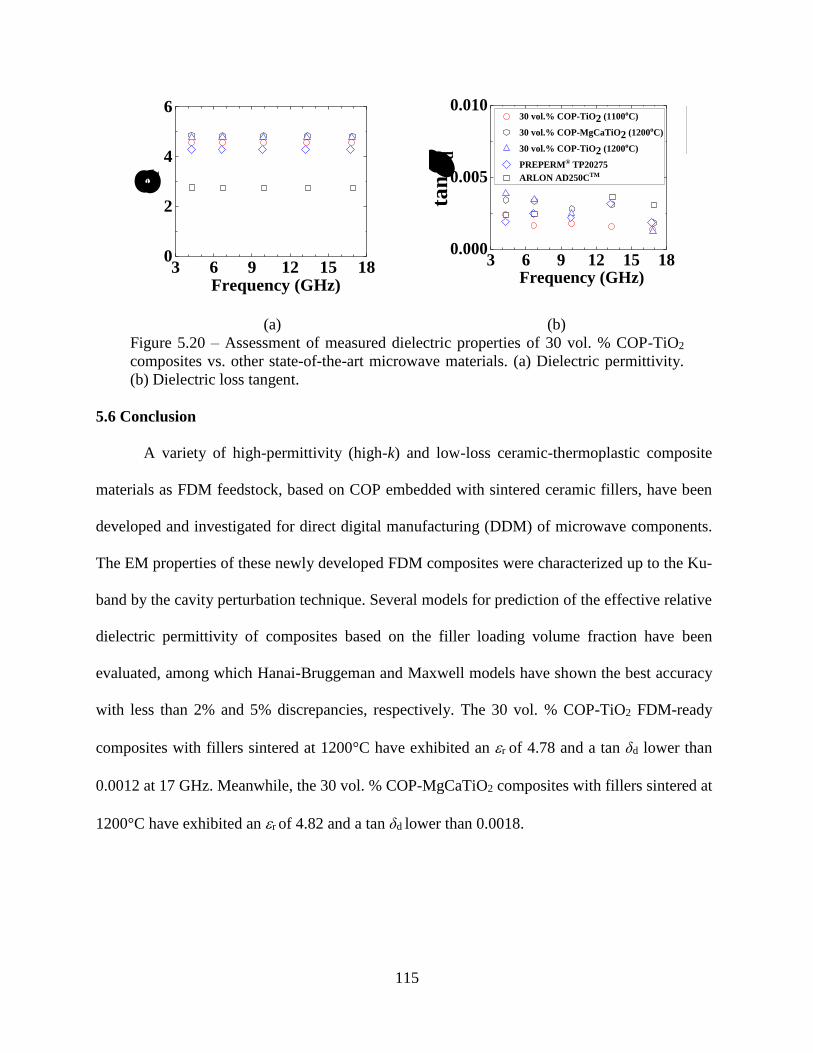
115
3 6 9 12 15 180
2
4
6
Frequency (GHz)
r
3 6 9 12 15 180.000
0.005
0.010 Zeonex+TiO2
COP-MaCaTiO2 1200C 30%
COP-TiO2 1200C 30%
PREMIX TP20275
AD250C
Frequency (GHz)
tan
d
30 vol.% COP-TiO2 (1100oC)
30 vol.% COP-MgCaTiO2 (1200oC)
30 vol.% COP-TiO2 (1200oC)
PREPERM® TP20275
ARLON AD250CTM
(a) (b)
Figure 5.20 – Assessment of measured dielectric properties of 30 vol. % COP-TiO2
composites vs. other state-of-the-art microwave materials. (a) Dielectric permittivity.
(b) Dielectric loss tangent.
5.6 Conclusion
A variety of high-permittivity (high-k) and low-loss ceramic-thermoplastic composite
materials as FDM feedstock, based on COP embedded with sintered ceramic fillers, have been
developed and investigated for direct digital manufacturing (DDM) of microwave components.
The EM properties of these newly developed FDM composites were characterized up to the Ku-
band by the cavity perturbation technique. Several models for prediction of the effective relative
dielectric permittivity of composites based on the filler loading volume fraction have been
evaluated, among which Hanai-Bruggeman and Maxwell models have shown the best accuracy
with less than 2% and 5% discrepancies, respectively. The 30 vol. % COP-TiO2 FDM-ready
composites with fillers sintered at 1200°C have exhibited an r of 4.78 and a tan δd lower than
0.0012 at 17 GHz. Meanwhile, the 30 vol. % COP-MgCaTiO2 composites with fillers sintered at
1200°C have exhibited an r of 4.82 and a tan δd lower than 0.0018.
116
Table 5.4 – Measured EM dielectric properties of microwave materials up to the Ku-band
Material/Composite Year Technology Filler Freq.
(GHz)
𝜺𝒓 tan δd Ref.
ABS-BaTiO3 2015 FDM 44 wt. % 15 3.30 0.0070 [73]
ABS-Ba0.64Sr0.36TiO3 30 vol. % 6.70 0.0368
ABS-BaTiO3 2015 FDM 27 vol. % 15 7.00 0.0342 [74]
PP - CaTiO3 27 vol. % 5.00 0.0051
BaTiO3/ABS 2016 FDM 29 vol. % 14.13 8.72 0.0273 [75]
PPE (PREPERM® TP20275) 2015 FDM N/A 17 4.42 0.0019 PREMIX
ABS-Ba0.55Sr0.45TiO3 (sintered 1340C) † 6 vol. %
17
3.98 0.0086
This
Work
COP-TiO2 (sintered 1100C) ‡ 30 vol. % 4.57 0.0014
COP-TiO2 (sintered 1200C) ‡ 2016 FDM 30 vol. % 4.78 0.0012
COP-MgCaTiO2 (sintered 1100C) ‡ 25 vol. % 4.74 0.0018
COP-MgCaTiO2 (sintered 1200C) ‡ 30 vol. % 4.82 0.0018
COP-Ba0.55Sr0.45TiO3 (sintered 1340C) ‡ 25 vol. % 4.92 0.0114
Vectra 840i LDS 3.80 0.0025
[13] Grilamid 1SVX-50H LDS 2014 LDS-MID N/A 30 4.00 0.0100
Xantar LDS 3720 2.90 0.0075
COP/MgO 2015 Molded Disk 30 vol. % 12 3.83 0.0005 [86]
FR-4 2015 Laminate N/A 12 4.50 0.0142 LPKF
CLTE-XT™ 2015 Laminate N/A 10 2.94 0.0012 ARLON Elect.
Materials AD250C™ 2015 Laminate N/A 10 2.50 0.0014
Tachyon® 2015 Laminate N/A 10 3.02 0.0021 isola
Group I-Tera® MT 2015 Laminate N/A 10 3.45 0.0031
RO4003C® 10 3.55 0.0027
Rogers
Corp.
TMM3® 2015 Laminate N/A 10 3.45 0.0020
RT/duroid® 5880 10 2.20 0.0009
RT/duroid® 5870 10 2.33 0.0012
Note: †‡ All the samples were 3D-printed by FDM with in-house prepared feedstock filaments. †‡ Filed provisional disclosure.
Laser Direct Structureable (LDS)-Molded Interconnect Device (MID), LDS-MID Materials.
ARLON, Rogers and isola laminates values were taken from vendors’ datasheets.
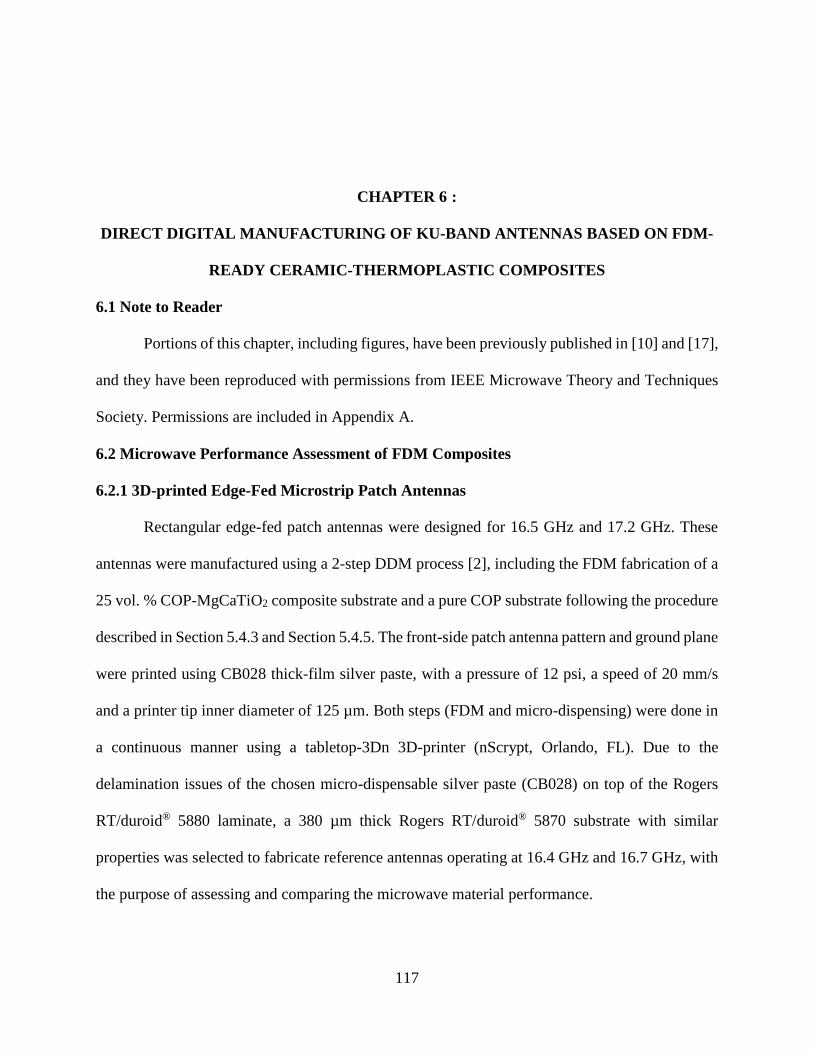
117
CHAPTER 6 :
DIRECT DIGITAL MANUFACTURING OF KU-BAND ANTENNAS BASED ON FDM-
READY CERAMIC-THERMOPLASTIC COMPOSITES
6.1 Note to Reader
Portions of this chapter, including figures, have been previously published in [10] and [17],
and they have been reproduced with permissions from IEEE Microwave Theory and Techniques
Society. Permissions are included in Appendix A.
6.2 Microwave Performance Assessment of FDM Composites
6.2.1 3D-printed Edge-Fed Microstrip Patch Antennas
Rectangular edge-fed patch antennas were designed for 16.5 GHz and 17.2 GHz. These
antennas were manufactured using a 2-step DDM process [2], including the FDM fabrication of a
25 vol. % COP-MgCaTiO2 composite substrate and a pure COP substrate following the procedure
described in Section 5.4.3 and Section 5.4.5. The front-side patch antenna pattern and ground plane
were printed using CB028 thick-film silver paste, with a pressure of 12 psi, a speed of 20 mm/s
and a printer tip inner diameter of 125 µm. Both steps (FDM and micro-dispensing) were done in
a continuous manner using a tabletop-3Dn 3D-printer (nScrypt, Orlando, FL). Due to the
delamination issues of the chosen micro-dispensable silver paste (CB028) on top of the Rogers
RT/duroid® 5880 laminate, a 380 µm thick Rogers RT/duroid® 5870 substrate with similar
properties was selected to fabricate reference antennas operating at 16.4 GHz and 16.7 GHz, with
the purpose of assessing and comparing the microwave material performance.
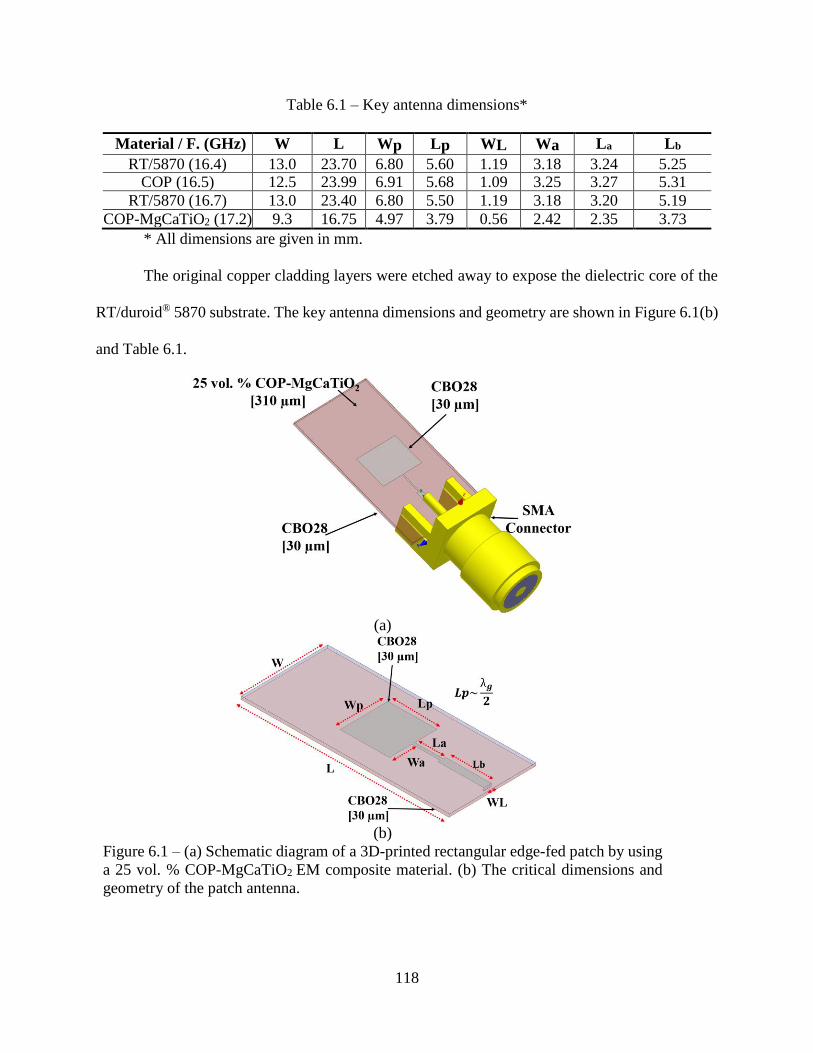
118
Table 6.1 – Key antenna dimensions*
Material / F. (GHz) W L Wp Lp WL Wa La Lb
RT/5870 (16.4) 13.0 23.70 6.80 5.60 1.19 3.18 3.24 5.25 COP (16.5) 12.5 23.99 6.91 5.68 1.09 3.25 3.27 5.31
RT/5870 (16.7) 13.0 23.40 6.80 5.50 1.19 3.18 3.20 5.19
COP-MgCaTiO2 (17.2) 9.3 16.75 4.97 3.79 0.56 2.42 2.35 3.73
* All dimensions are given in mm.
The original copper cladding layers were etched away to expose the dielectric core of the
RT/duroid® 5870 substrate. The key antenna dimensions and geometry are shown in Figure 6.1(b)
and Table 6.1.
(a)
(b)
Figure 6.1 – (a) Schematic diagram of a 3D-printed rectangular edge-fed patch by using
a 25 vol. % COP-MgCaTiO2 EM composite material. (b) The critical dimensions and
geometry of the patch antenna.
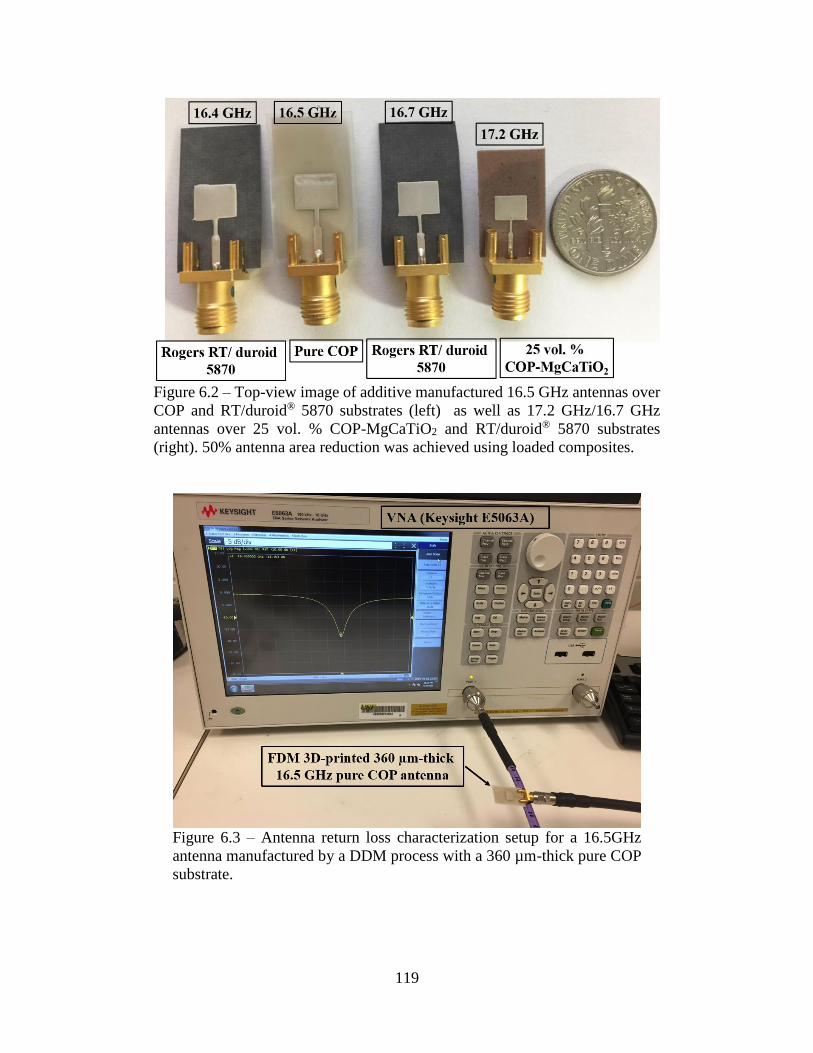
119
Figure 6.2 – Top-view image of additive manufactured 16.5 GHz antennas over
COP and RT/duroid® 5870 substrates (left) as well as 17.2 GHz/16.7 GHz
antennas over 25 vol. % COP-MgCaTiO2 and RT/duroid® 5870 substrates
(right). 50% antenna area reduction was achieved using loaded composites.
Figure 6.3 – Antenna return loss characterization setup for a 16.5GHz
antenna manufactured by a DDM process with a 360 µm-thick pure COP
substrate.
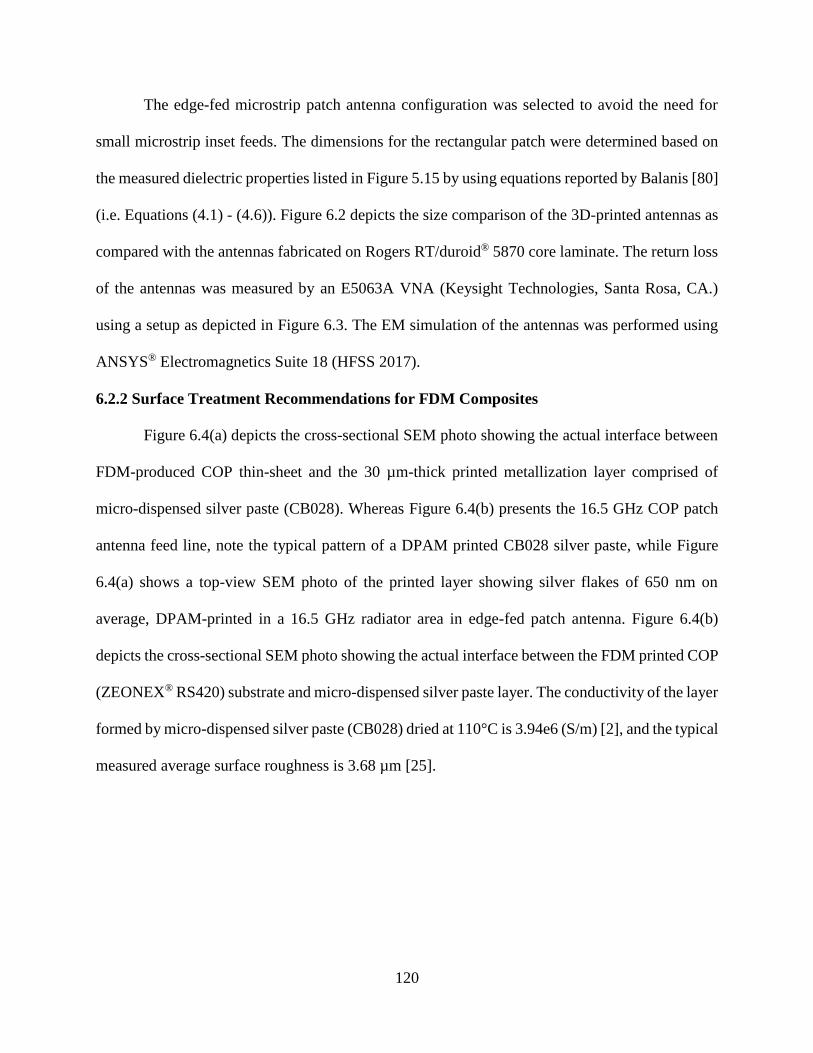
120
The edge-fed microstrip patch antenna configuration was selected to avoid the need for
small microstrip inset feeds. The dimensions for the rectangular patch were determined based on
the measured dielectric properties listed in Figure 5.15 by using equations reported by Balanis [80]
(i.e. Equations (4.1) - (4.6)). Figure 6.2 depicts the size comparison of the 3D-printed antennas as
compared with the antennas fabricated on Rogers RT/duroid® 5870 core laminate. The return loss
of the antennas was measured by an E5063A VNA (Keysight Technologies, Santa Rosa, CA.)
using a setup as depicted in Figure 6.3. The EM simulation of the antennas was performed using
ANSYS® Electromagnetics Suite 18 (HFSS 2017).
6.2.2 Surface Treatment Recommendations for FDM Composites
Figure 6.4(a) depicts the cross-sectional SEM photo showing the actual interface between
FDM-produced COP thin-sheet and the 30 µm-thick printed metallization layer comprised of
micro-dispensed silver paste (CB028). Whereas Figure 6.4(b) presents the 16.5 GHz COP patch
antenna feed line, note the typical pattern of a DPAM printed CB028 silver paste, while Figure
6.4(a) shows a top-view SEM photo of the printed layer showing silver flakes of 650 nm on
average, DPAM-printed in a 16.5 GHz radiator area in edge-fed patch antenna. Figure 6.4(b)
depicts the cross-sectional SEM photo showing the actual interface between the FDM printed COP
(ZEONEX® RS420) substrate and micro-dispensed silver paste layer. The conductivity of the layer
formed by micro-dispensed silver paste (CB028) dried at 110°C is 3.94e6 (S/m) [2], and the typical
measured average surface roughness is 3.68 µm [25].
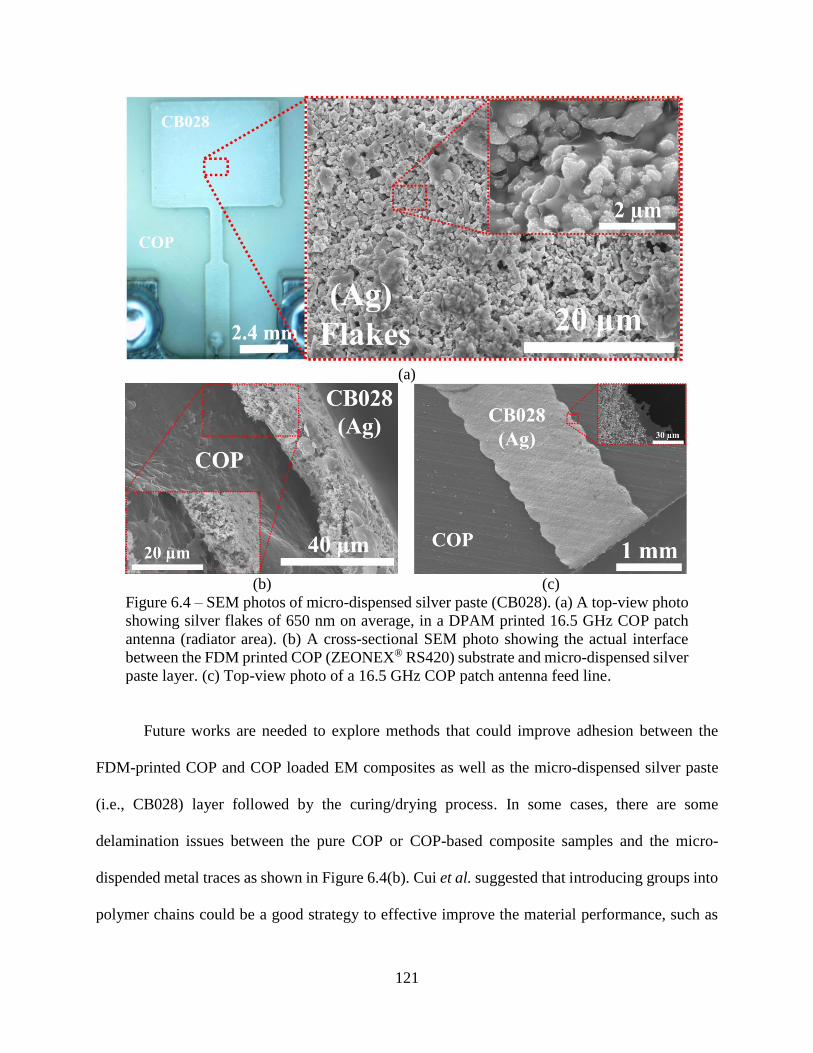
121
(a)
(b) (c)
Figure 6.4 – SEM photos of micro-dispensed silver paste (CB028). (a) A top-view photo
showing silver flakes of 650 nm on average, in a DPAM printed 16.5 GHz COP patch
antenna (radiator area). (b) A cross-sectional SEM photo showing the actual interface
between the FDM printed COP (ZEONEX® RS420) substrate and micro-dispensed silver
paste layer. (c) Top-view photo of a 16.5 GHz COP patch antenna feed line.
Future works are needed to explore methods that could improve adhesion between the
FDM-printed COP and COP loaded EM composites as well as the micro-dispensed silver paste
(i.e., CB028) layer followed by the curing/drying process. In some cases, there are some
delamination issues between the pure COP or COP-based composite samples and the micro-
dispended metal traces as shown in Figure 6.4(b). Cui et al. suggested that introducing groups into
polymer chains could be a good strategy to effective improve the material performance, such as
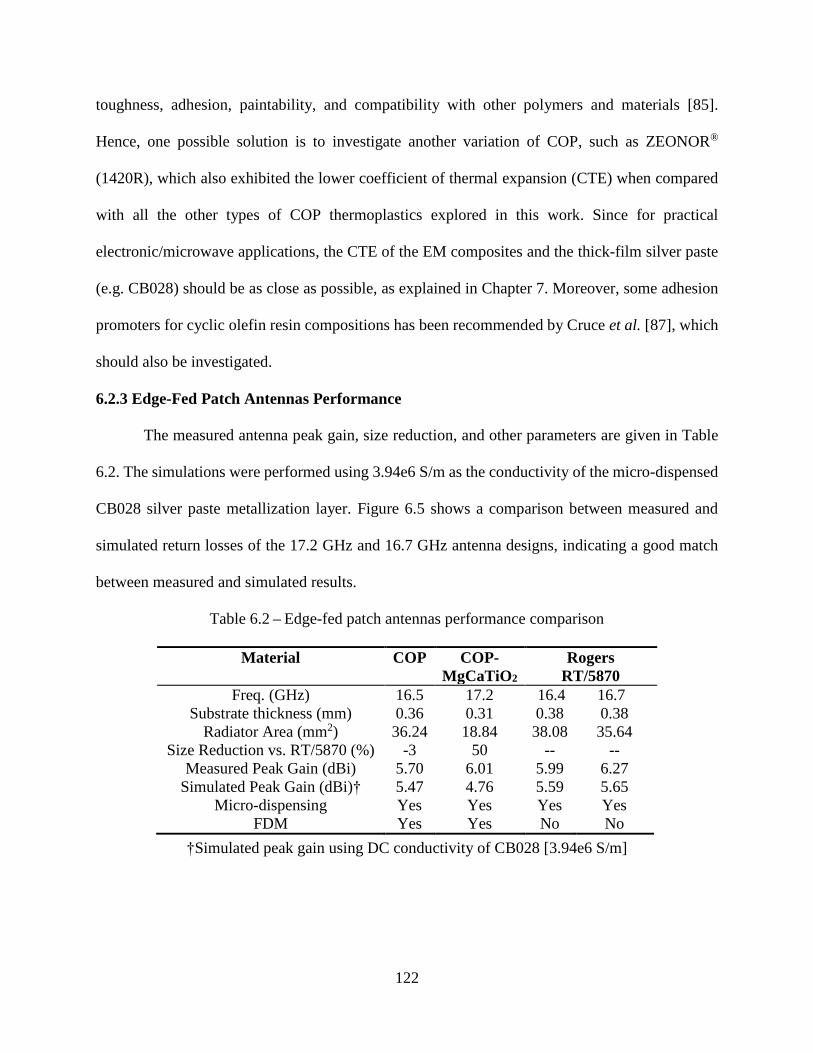
122
toughness, adhesion, paintability, and compatibility with other polymers and materials [85].
Hence, one possible solution is to investigate another variation of COP, such as ZEONOR®
(1420R), which also exhibited the lower coefficient of thermal expansion (CTE) when compared
with all the other types of COP thermoplastics explored in this work. Since for practical
electronic/microwave applications, the CTE of the EM composites and the thick-film silver paste
(e.g. CB028) should be as close as possible, as explained in Chapter 7. Moreover, some adhesion
promoters for cyclic olefin resin compositions has been recommended by Cruce et al. [87], which
should also be investigated.
6.2.3 Edge-Fed Patch Antennas Performance
The measured antenna peak gain, size reduction, and other parameters are given in Table
6.2. The simulations were performed using 3.94e6 S/m as the conductivity of the micro-dispensed
CB028 silver paste metallization layer. Figure 6.5 shows a comparison between measured and
simulated return losses of the 17.2 GHz and 16.7 GHz antenna designs, indicating a good match
between measured and simulated results.
Table 6.2 – Edge-fed patch antennas performance comparison
Material COP COP-
MgCaTiO2
Rogers
RT/5870
Freq. (GHz) 16.5 17.2 16.4 16.7
Substrate thickness (mm) 0.36 0.31 0.38 0.38
Radiator Area (mm2) 36.24 18.84 38.08 35.64
Size Reduction vs. RT/5870 (%) -3 50 -- --
Measured Peak Gain (dBi) 5.70 6.01 5.99 6.27
Simulated Peak Gain (dBi)† 5.47 4.76 5.59 5.65
Micro-dispensing Yes Yes Yes Yes
FDM Yes Yes No No
†Simulated peak gain using DC conductivity of CB028 [3.94e6 S/m]
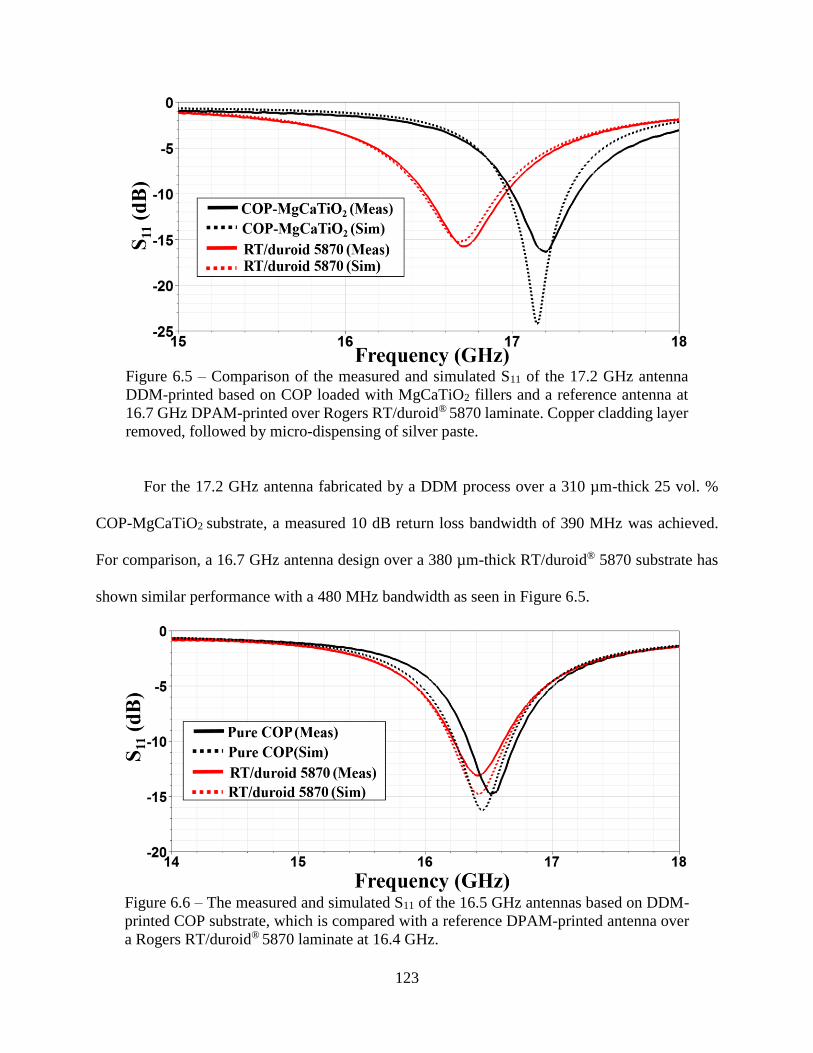
123
Figure 6.5 – Comparison of the measured and simulated S11 of the 17.2 GHz antenna
DDM-printed based on COP loaded with MgCaTiO2 fillers and a reference antenna at
16.7 GHz DPAM-printed over Rogers RT/duroid® 5870 laminate. Copper cladding layer
removed, followed by micro-dispensing of silver paste.
For the 17.2 GHz antenna fabricated by a DDM process over a 310 µm-thick 25 vol. %
COP-MgCaTiO2 substrate, a measured 10 dB return loss bandwidth of 390 MHz was achieved.
For comparison, a 16.7 GHz antenna design over a 380 µm-thick RT/duroid® 5870 substrate has
shown similar performance with a 480 MHz bandwidth as seen in Figure 6.5.
Figure 6.6 – The measured and simulated S11 of the 16.5 GHz antennas based on DDM-
printed COP substrate, which is compared with a reference DPAM-printed antenna over
a Rogers RT/duroid® 5870 laminate at 16.4 GHz.
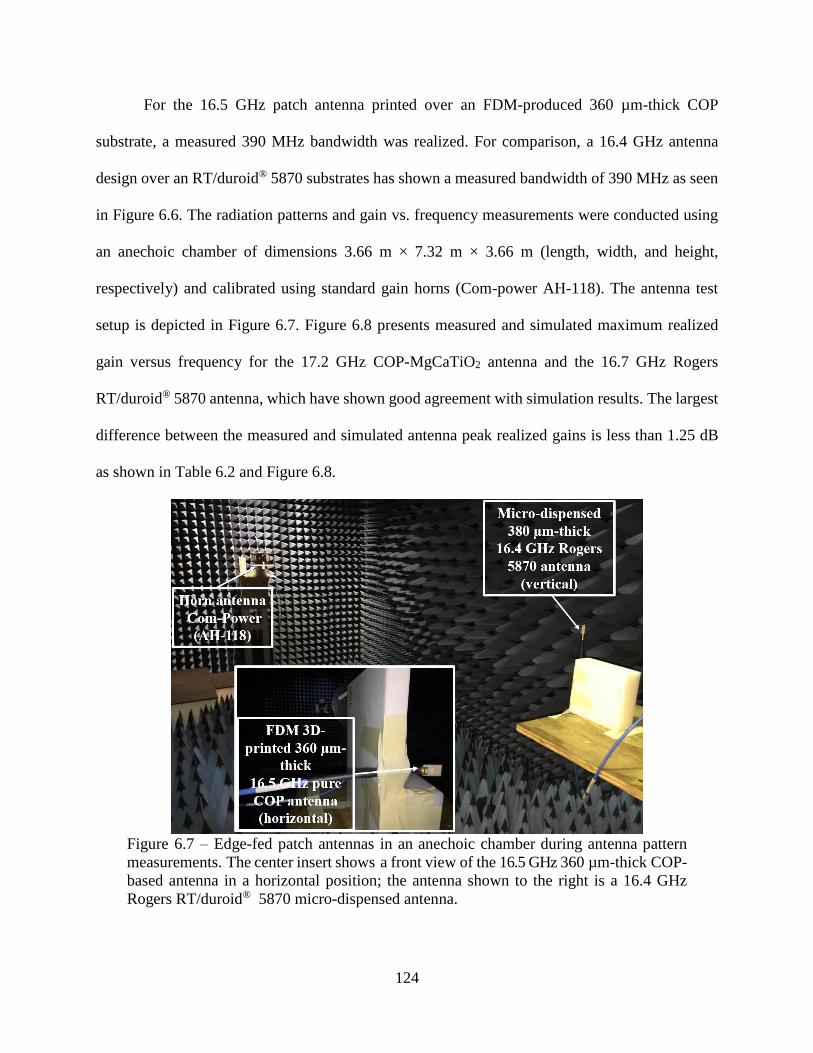
124
For the 16.5 GHz patch antenna printed over an FDM-produced 360 µm-thick COP
substrate, a measured 390 MHz bandwidth was realized. For comparison, a 16.4 GHz antenna
design over an RT/duroid® 5870 substrates has shown a measured bandwidth of 390 MHz as seen
in Figure 6.6. The radiation patterns and gain vs. frequency measurements were conducted using
an anechoic chamber of dimensions 3.66 m × 7.32 m × 3.66 m (length, width, and height,
respectively) and calibrated using standard gain horns (Com-power AH-118). The antenna test
setup is depicted in Figure 6.7. Figure 6.8 presents measured and simulated maximum realized
gain versus frequency for the 17.2 GHz COP-MgCaTiO2 antenna and the 16.7 GHz Rogers
RT/duroid® 5870 antenna, which have shown good agreement with simulation results. The largest
difference between the measured and simulated antenna peak realized gains is less than 1.25 dB
as shown in Table 6.2 and Figure 6.8.
Figure 6.7 – Edge-fed patch antennas in an anechoic chamber during antenna pattern
measurements. The center insert shows a front view of the 16.5 GHz 360 µm-thick COP-
based antenna in a horizontal position; the antenna shown to the right is a 16.4 GHz
Rogers RT/duroid® 5870 micro-dispensed antenna.
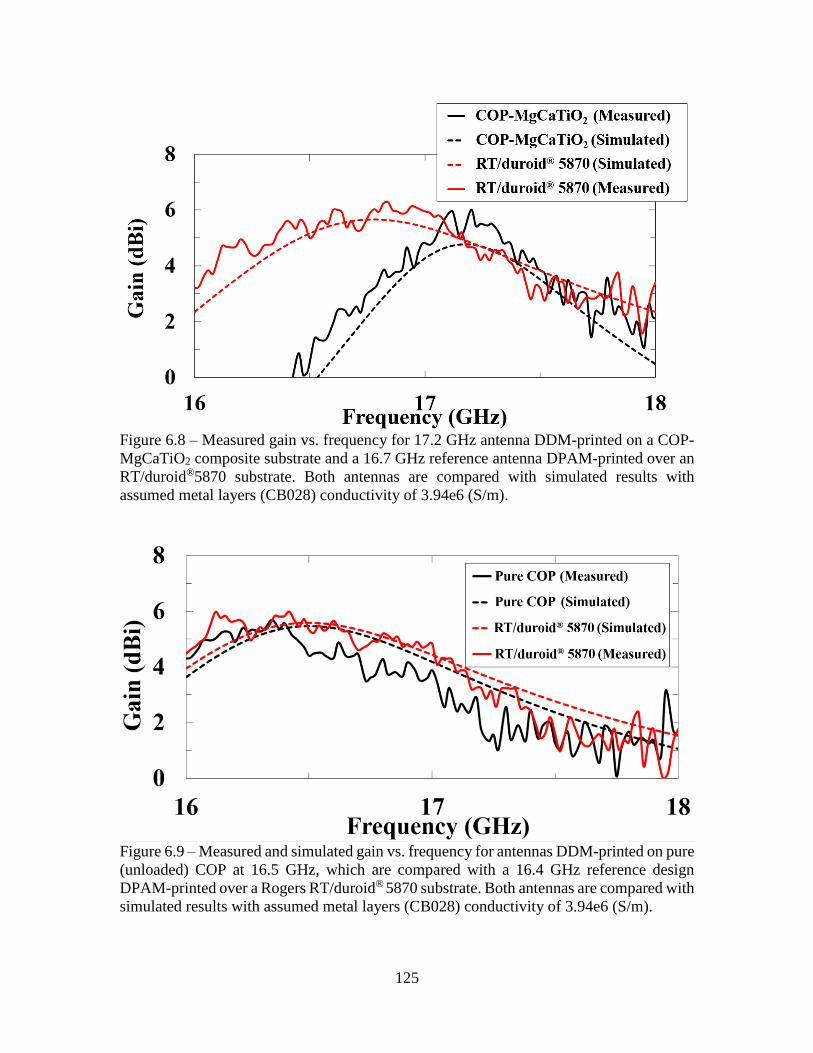
125
Figure 6.8 – Measured gain vs. frequency for 17.2 GHz antenna DDM-printed on a COP-
MgCaTiO2 composite substrate and a 16.7 GHz reference antenna DPAM-printed over an
RT/duroid®5870 substrate. Both antennas are compared with simulated results with
assumed metal layers (CB028) conductivity of 3.94e6 (S/m).
Figure 6.9 – Measured and simulated gain vs. frequency for antennas DDM-printed on pure
(unloaded) COP at 16.5 GHz, which are compared with a 16.4 GHz reference design
DPAM-printed over a Rogers RT/duroid® 5870 substrate. Both antennas are compared with
simulated results with assumed metal layers (CB028) conductivity of 3.94e6 (S/m).
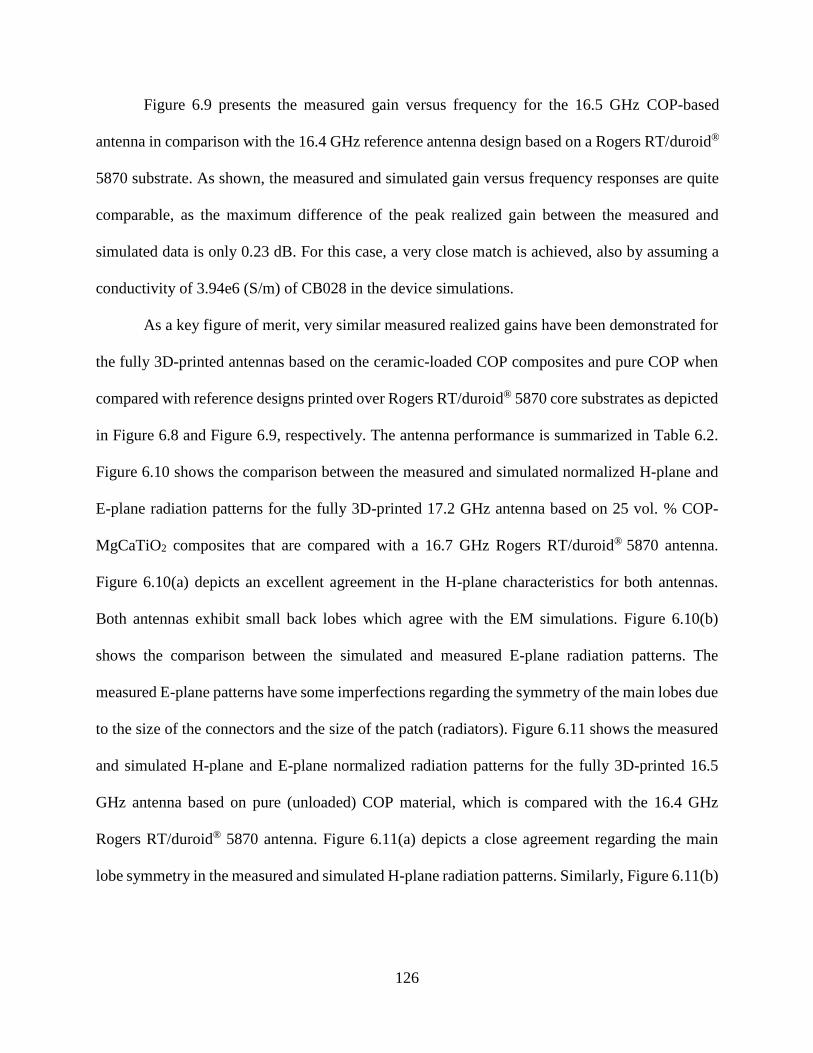
126
Figure 6.9 presents the measured gain versus frequency for the 16.5 GHz COP-based
antenna in comparison with the 16.4 GHz reference antenna design based on a Rogers RT/duroid®
5870 substrate. As shown, the measured and simulated gain versus frequency responses are quite
comparable, as the maximum difference of the peak realized gain between the measured and
simulated data is only 0.23 dB. For this case, a very close match is achieved, also by assuming a
conductivity of 3.94e6 (S/m) of CB028 in the device simulations.
As a key figure of merit, very similar measured realized gains have been demonstrated for
the fully 3D-printed antennas based on the ceramic-loaded COP composites and pure COP when
compared with reference designs printed over Rogers RT/duroid® 5870 core substrates as depicted
in Figure 6.8 and Figure 6.9, respectively. The antenna performance is summarized in Table 6.2.
Figure 6.10 shows the comparison between the measured and simulated normalized H-plane and
E-plane radiation patterns for the fully 3D-printed 17.2 GHz antenna based on 25 vol. % COP-
MgCaTiO2 composites that are compared with a 16.7 GHz Rogers RT/duroid® 5870 antenna.
Figure 6.10(a) depicts an excellent agreement in the H-plane characteristics for both antennas.
Both antennas exhibit small back lobes which agree with the EM simulations. Figure 6.10(b)
shows the comparison between the simulated and measured E-plane radiation patterns. The
measured E-plane patterns have some imperfections regarding the symmetry of the main lobes due
to the size of the connectors and the size of the patch (radiators). Figure 6.11 shows the measured
and simulated H-plane and E-plane normalized radiation patterns for the fully 3D-printed 16.5
GHz antenna based on pure (unloaded) COP material, which is compared with the 16.4 GHz
Rogers RT/duroid® 5870 antenna. Figure 6.11(a) depicts a close agreement regarding the main
lobe symmetry in the measured and simulated H-plane radiation patterns. Similarly, Figure 6.11(b)
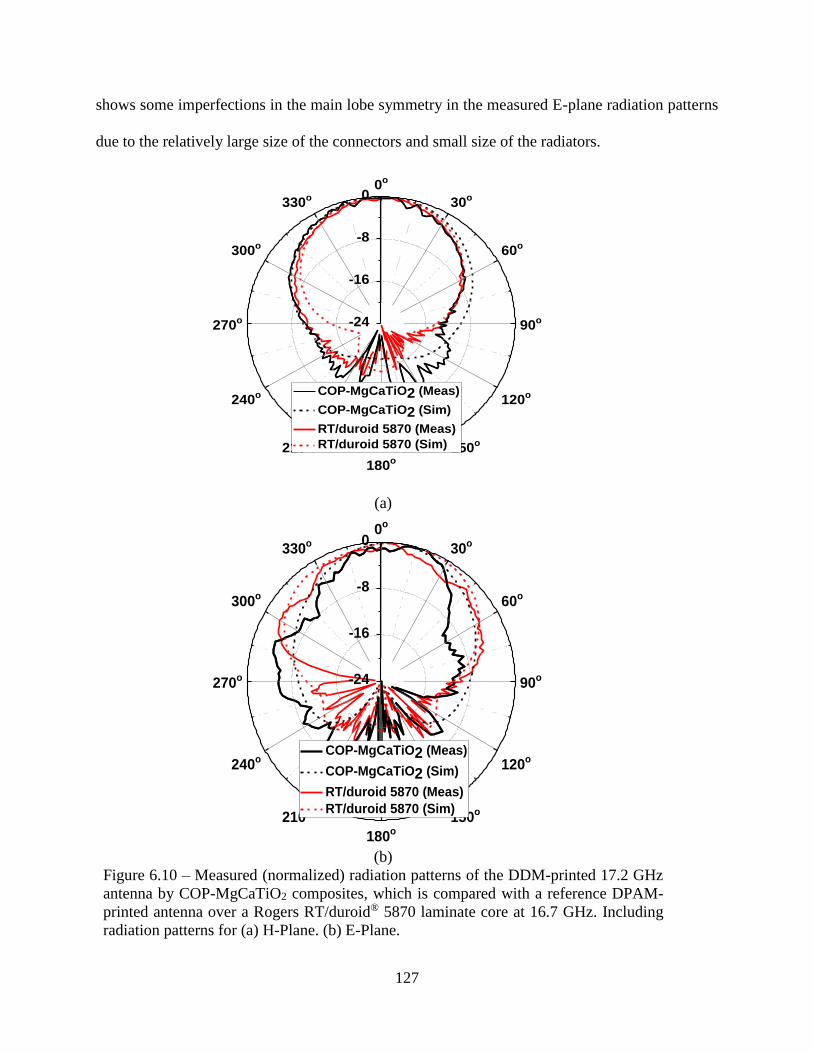
127
shows some imperfections in the main lobe symmetry in the measured E-plane radiation patterns
due to the relatively large size of the connectors and small size of the radiators.
0o
30o
60o
90o
120o
150o
180o
210o
240o
270o
300o
330o
-24
-16
-8
0
COP-MgCaTiO2 (Meas)
COP-MgCaTiO2 (Sim)
RT/duroid 5870 (Meas)
RT/duroid 5870 (Sim)
(a)
0o
30o
60o
90o
120o
150o
180o
210o
240o
270o
300o
330o
-24
-16
-8
0
COP-MgCaTiO2 (Meas)
COP-MgCaTiO2 (Sim)
RT/duroid 5870 (Meas)
RT/duroid 5870 (Sim)
(b)
Figure 6.10 – Measured (normalized) radiation patterns of the DDM-printed 17.2 GHz
antenna by COP-MgCaTiO2 composites, which is compared with a reference DPAM-
printed antenna over a Rogers RT/duroid® 5870 laminate core at 16.7 GHz. Including
radiation patterns for (a) H-Plane. (b) E-Plane.
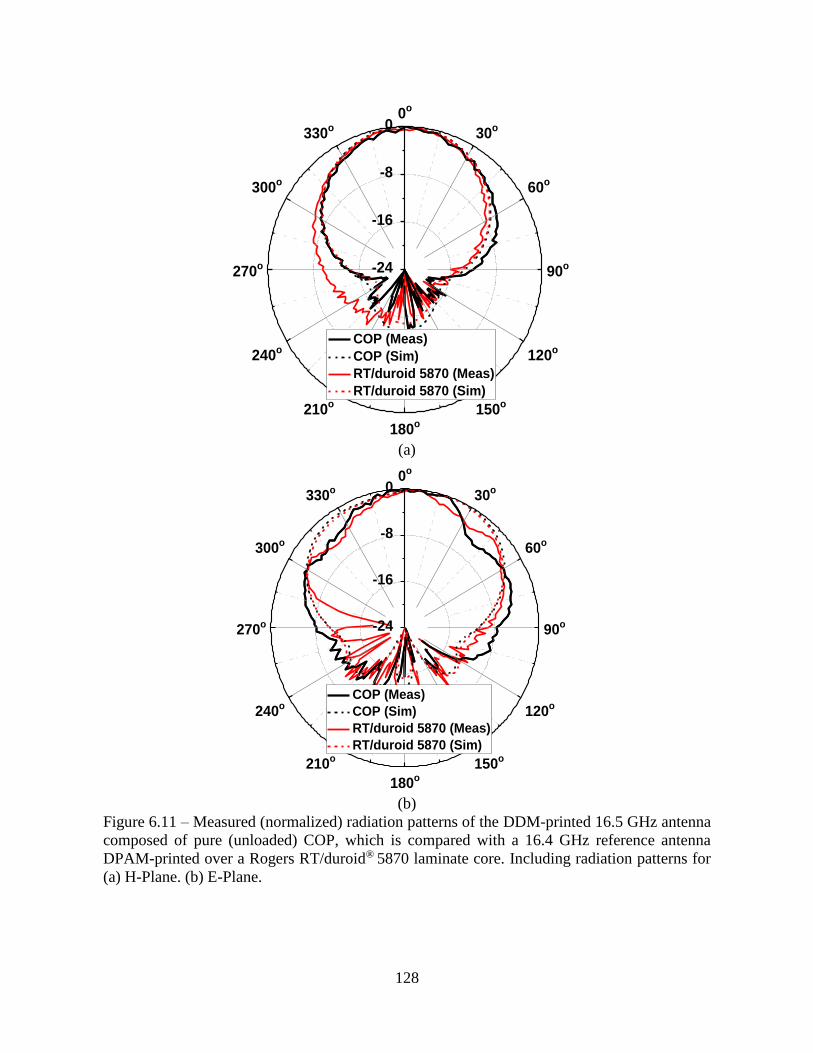
128
0o
30o
60o
90o
120o
150o
180o
210o
240o
270o
300o
330o
-24
-16
-8
0
COP (Meas)
COP (Sim)
RT/duroid 5870 (Meas)
RT/duroid 5870 (Sim)
(a)
0o
30o
60o
90o
120o
150o
180o
210o
240o
270o
300o
330o
-24
-16
-8
0
COP (Meas)
COP (Sim)
RT/duroid 5870 (Meas)
RT/duroid 5870 (Sim)
(b)
Figure 6.11 – Measured (normalized) radiation patterns of the DDM-printed 16.5 GHz antenna
composed of pure (unloaded) COP, which is compared with a 16.4 GHz reference antenna
DPAM-printed over a Rogers RT/duroid® 5870 laminate core. Including radiation patterns for
(a) H-Plane. (b) E-Plane.
129
6.3 Conclusion
Edge-fed patch antennas operating at 17.2 GHz and 16.5 GHz were manufactured by
DDM that employs a 25 vol. % COP-MgCaTiO2 composite FDM filament with the fillers sintered
at 1100°C and a pure COP filament, which were both prepared and extruded following the process
described in this dissertation. The low dielectric loss of the 25 vol. % COP-MgCaTiO2 composite
material has been leveraged to achieve a peak realized a gain of 6 dBi. Also, a patch area
miniaturization of 50% was achieved when compared with an antenna designed and DPAM-
printed over a Rogers RT/duroid® 5870 laminate core through micro-dispensing of CB028 thick-
film silver paste. This reference antenna exhibited a measured peak realized gain of 6.27 dBi. The
electromagnetic composites with tailored EM properties studied by this work have shown some
great potential for the next generation of fully 3D-printed and high-performance RF/microwave
devices.
130
CHAPTER 7 :
MILLIMETER-WAVE PERFORMANCE AND THERMAL PROPERTIES
ASSESSMENT OF FDM-COMPATIBLE COMPOSITES
7.1 Note to Reader
Portions of this chapter, including figures, are in publication process at the 2017 IEEE AP-
S Symposium on Antennas and Propagation and USNC-URSI Radio Science Meeting [82].
7.2 Introduction
Characterization of EM composite materials suited for DDM technologies at the mm-wave
frequencies up to 69 GHz is presented in this chapter. A COP thermoplastic matrix reinforced by
MgCaTiO2 micro-fillers sintered at 1200ºC has been prepared and characterized up to 67 GHz (V-
band). Pure COP exhibits a relative permittivity of 2.1 and a loss tangent below 0.0011 up to 69
GHz. Moreover, 30 vol. % COP-MgCaTiO2 composites show a relative permittivity of 4.88 and a
loss tangent below 0.0070 at 66 GHz. The newly characterized composites show the some of the
lowest dielectric losses reported for FDM materials that are ideal for microwave applications at
mm-wave frequencies as shown in Table 7.1. Evidently, these newly developed polymer-ceramic
composites are well suited for applications at the mm-wave frequencies and can be adapted to 3D-
printing technologies.
The reported progress in AM-compatible functional mm-wave EM composite materials,
specifically those compatible with FDM, has been lacking especially regarding more options other
than the standard thermoplastics [2]-[3] such as ABS, Polycarbonate (PC), and polyetherimide
(PEI) also known as ULTEM™ resin. To the best of my knowledge, this work reports FDM-ready
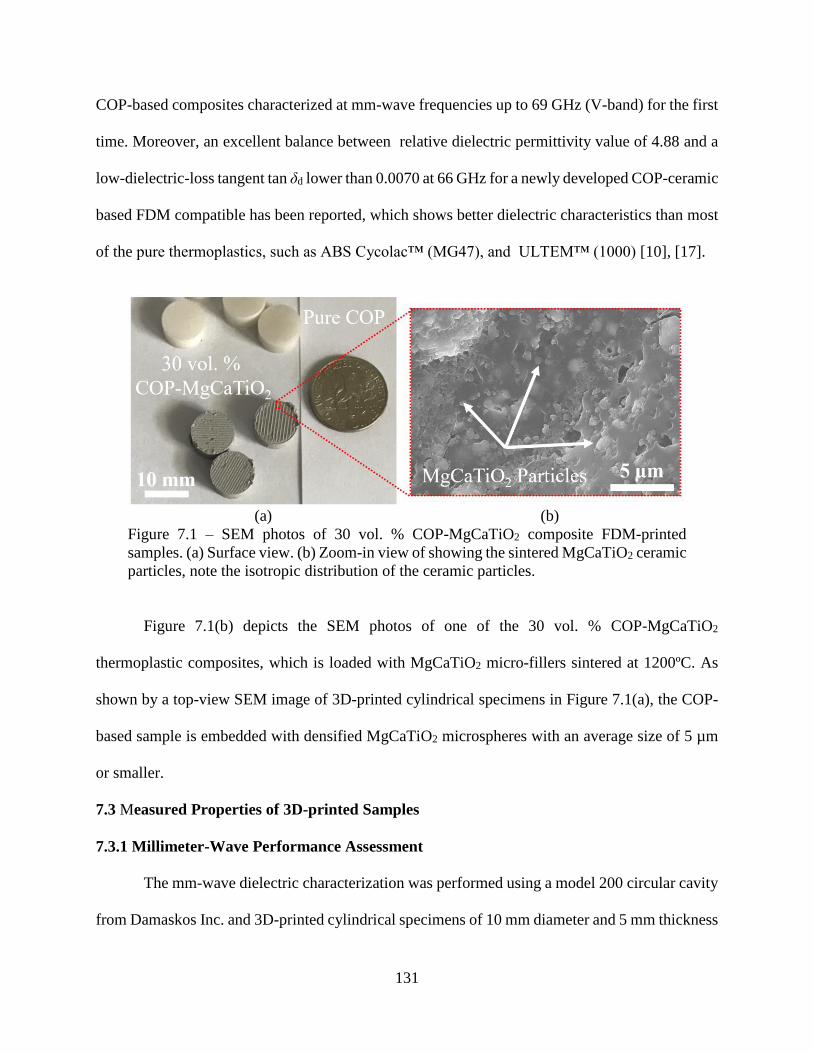
131
COP-based composites characterized at mm-wave frequencies up to 69 GHz (V-band) for the first
time. Moreover, an excellent balance between relative dielectric permittivity value of 4.88 and a
low-dielectric-loss tangent tan δd lower than 0.0070 at 66 GHz for a newly developed COP-ceramic
based FDM compatible has been reported, which shows better dielectric characteristics than most
of the pure thermoplastics, such as ABS Cycolac™ (MG47), and ULTEM™ (1000) [10], [17].
(a) (b)
Figure 7.1 – SEM photos of 30 vol. % COP-MgCaTiO2 composite FDM-printed
samples. (a) Surface view. (b) Zoom-in view of showing the sintered MgCaTiO2 ceramic
particles, note the isotropic distribution of the ceramic particles.
Figure 7.1(b) depicts the SEM photos of one of the 30 vol. % COP-MgCaTiO2
thermoplastic composites, which is loaded with MgCaTiO2 micro-fillers sintered at 1200ºC. As
shown by a top-view SEM image of 3D-printed cylindrical specimens in Figure 7.1(a), the COP-
based sample is embedded with densified MgCaTiO2 microspheres with an average size of 5 µm
or smaller.
7.3 Measured Properties of 3D-printed Samples
7.3.1 Millimeter-Wave Performance Assessment
The mm-wave dielectric characterization was performed using a model 200 circular cavity
from Damaskos Inc. and 3D-printed cylindrical specimens of 10 mm diameter and 5 mm thickness
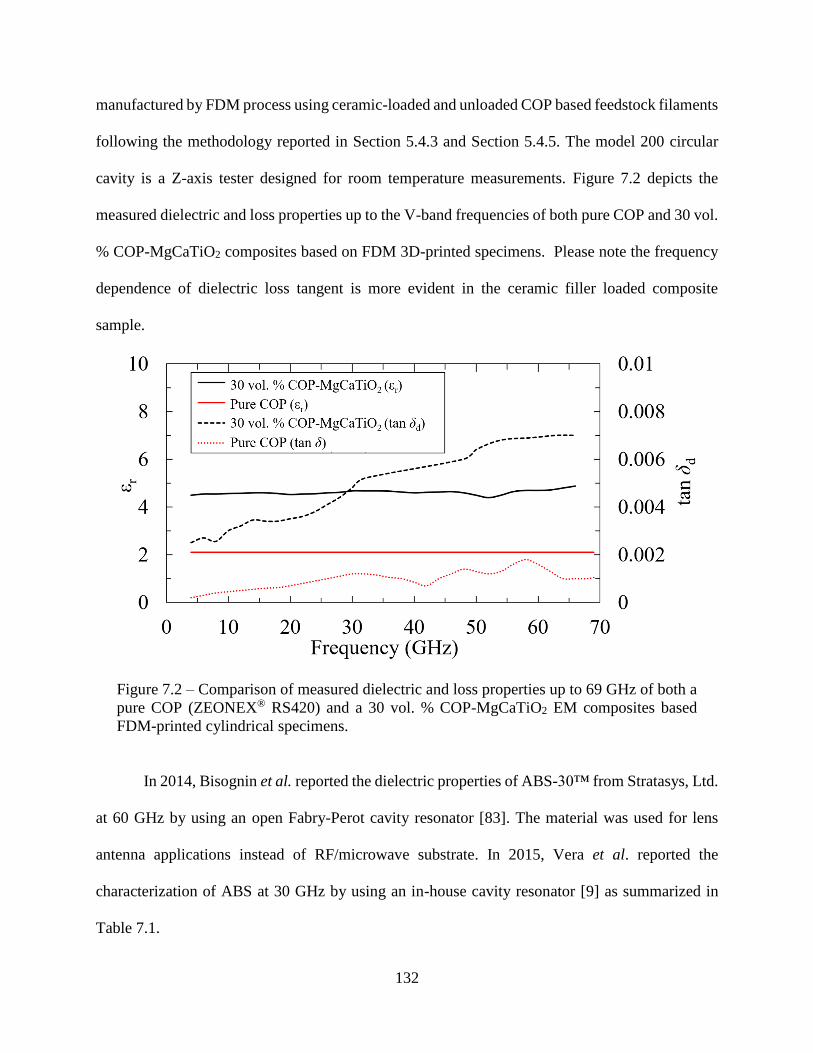
132
manufactured by FDM process using ceramic-loaded and unloaded COP based feedstock filaments
following the methodology reported in Section 5.4.3 and Section 5.4.5. The model 200 circular
cavity is a Z-axis tester designed for room temperature measurements. Figure 7.2 depicts the
measured dielectric and loss properties up to the V-band frequencies of both pure COP and 30 vol.
% COP-MgCaTiO2 composites based on FDM 3D-printed specimens. Please note the frequency
dependence of dielectric loss tangent is more evident in the ceramic filler loaded composite
sample.
Figure 7.2 – Comparison of measured dielectric and loss properties up to 69 GHz of both a
pure COP (ZEONEX® RS420) and a 30 vol. % COP-MgCaTiO2 EM composites based
FDM-printed cylindrical specimens.
In 2014, Bisognin et al. reported the dielectric properties of ABS-30™ from Stratasys, Ltd.
at 60 GHz by using an open Fabry-Perot cavity resonator [83]. The material was used for lens
antenna applications instead of RF/microwave substrate. In 2015, Vera et al. reported the
characterization of ABS at 30 GHz by using an in-house cavity resonator [9] as summarized in
Table 7.1.
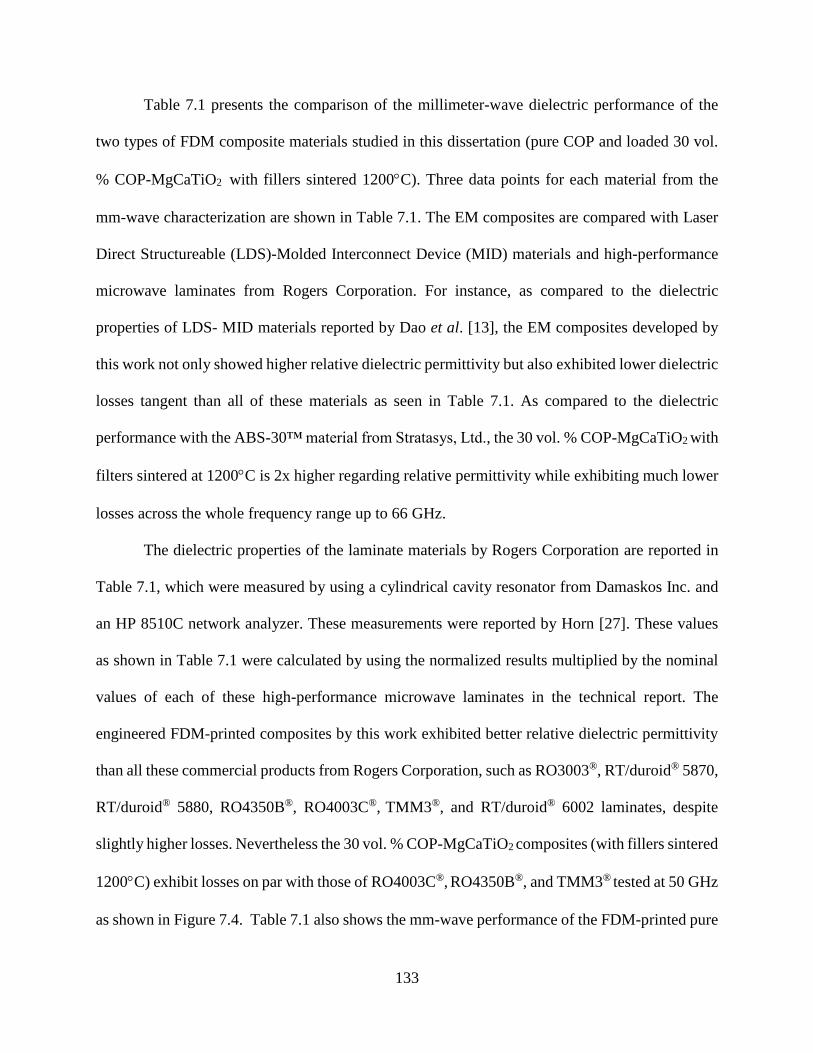
133
Table 7.1 presents the comparison of the millimeter-wave dielectric performance of the
two types of FDM composite materials studied in this dissertation (pure COP and loaded 30 vol.
% COP-MgCaTiO2 with fillers sintered 1200C). Three data points for each material from the
mm-wave characterization are shown in Table 7.1. The EM composites are compared with Laser
Direct Structureable (LDS)-Molded Interconnect Device (MID) materials and high-performance
microwave laminates from Rogers Corporation. For instance, as compared to the dielectric
properties of LDS- MID materials reported by Dao et al. [13], the EM composites developed by
this work not only showed higher relative dielectric permittivity but also exhibited lower dielectric
losses tangent than all of these materials as seen in Table 7.1. As compared to the dielectric
performance with the ABS-30™ material from Stratasys, Ltd., the 30 vol. % COP-MgCaTiO2 with
filters sintered at 1200C is 2x higher regarding relative permittivity while exhibiting much lower
losses across the whole frequency range up to 66 GHz.
The dielectric properties of the laminate materials by Rogers Corporation are reported in
Table 7.1, which were measured by using a cylindrical cavity resonator from Damaskos Inc. and
an HP 8510C network analyzer. These measurements were reported by Horn [27]. These values
as shown in Table 7.1 were calculated by using the normalized results multiplied by the nominal
values of each of these high-performance microwave laminates in the technical report. The
engineered FDM-printed composites by this work exhibited better relative dielectric permittivity
than all these commercial products from Rogers Corporation, such as RO3003®, RT/duroid® 5870,
RT/duroid® 5880, RO4350B®, RO4003C®, TMM3®, and RT/duroid® 6002 laminates, despite
slightly higher losses. Nevertheless the 30 vol. % COP-MgCaTiO2 composites (with fillers sintered
1200C) exhibit losses on par with those of RO4003C®, RO4350B®, and TMM3® tested at 50 GHz
as shown in Figure 7.4. Table 7.1 also shows the mm-wave performance of the FDM-printed pure
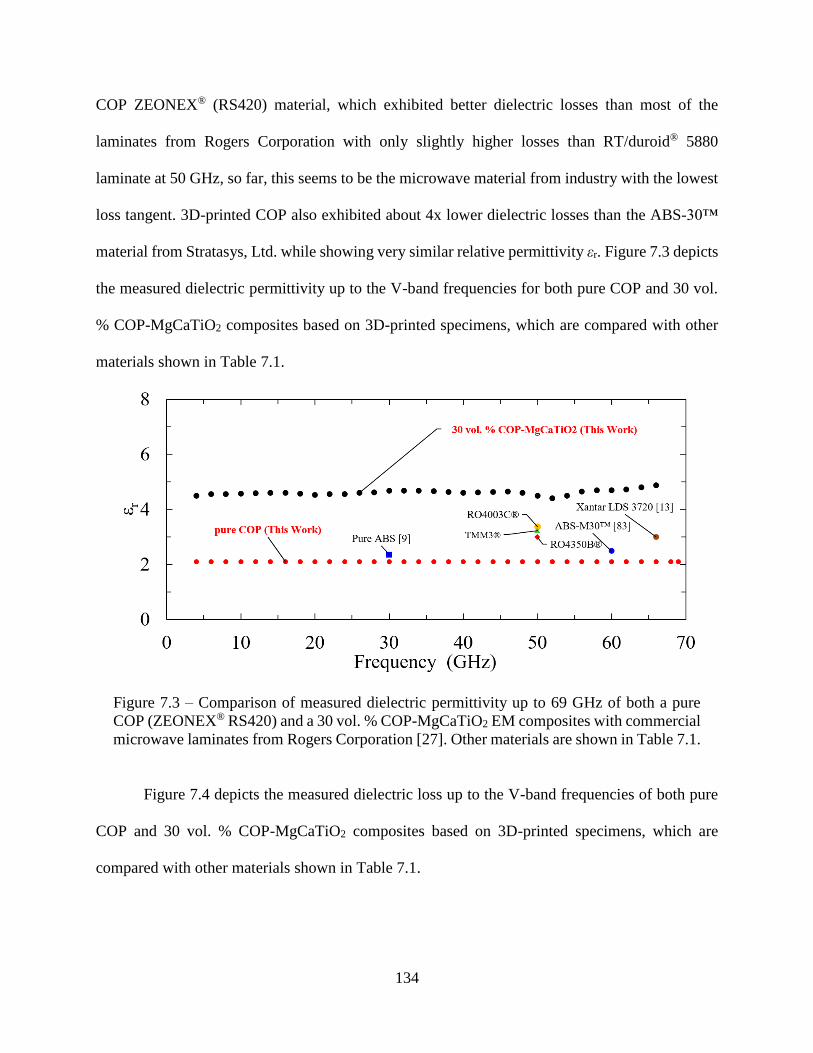
134
COP ZEONEX® (RS420) material, which exhibited better dielectric losses than most of the
laminates from Rogers Corporation with only slightly higher losses than RT/duroid® 5880
laminate at 50 GHz, so far, this seems to be the microwave material from industry with the lowest
loss tangent. 3D-printed COP also exhibited about 4x lower dielectric losses than the ABS-30™
material from Stratasys, Ltd. while showing very similar relative permittivity εr. Figure 7.3 depicts
the measured dielectric permittivity up to the V-band frequencies for both pure COP and 30 vol.
% COP-MgCaTiO2 composites based on 3D-printed specimens, which are compared with other
materials shown in Table 7.1.
Figure 7.3 – Comparison of measured dielectric permittivity up to 69 GHz of both a pure
COP (ZEONEX® RS420) and a 30 vol. % COP-MgCaTiO2 EM composites with commercial
microwave laminates from Rogers Corporation [27]. Other materials are shown in Table 7.1.
Figure 7.4 depicts the measured dielectric loss up to the V-band frequencies of both pure
COP and 30 vol. % COP-MgCaTiO2 composites based on 3D-printed specimens, which are
compared with other materials shown in Table 7.1.
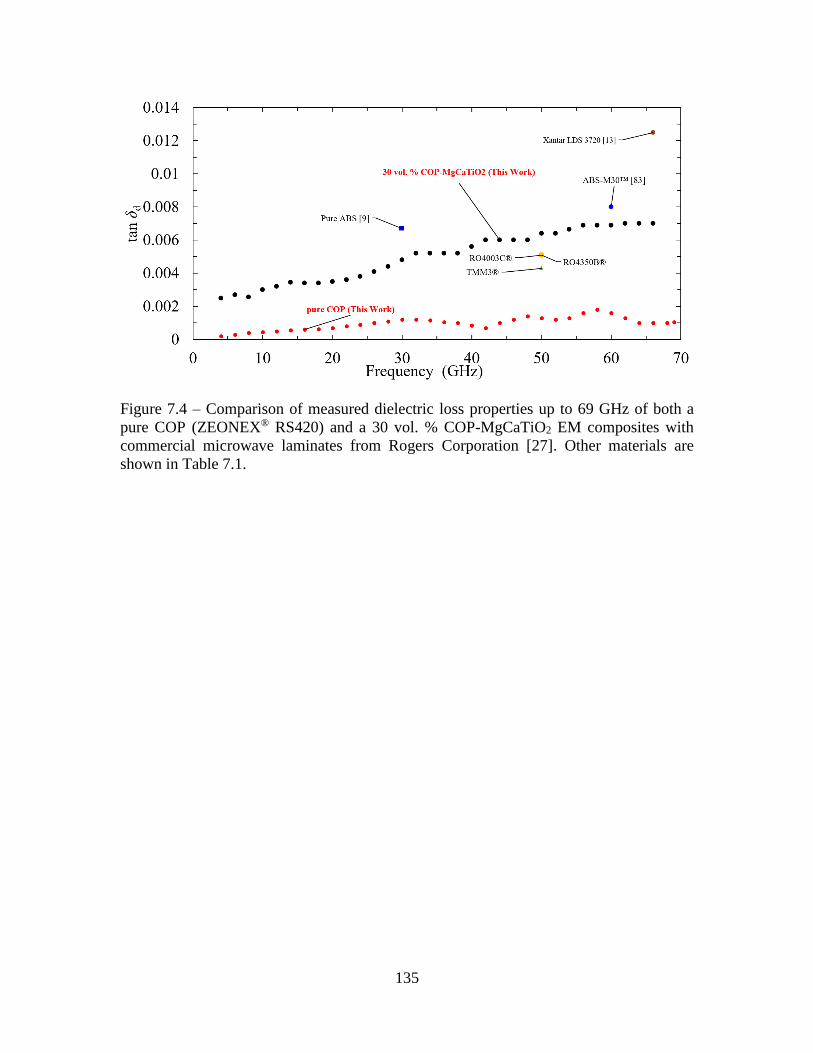
135
Figure 7.4 – Comparison of measured dielectric loss properties up to 69 GHz of both a
pure COP (ZEONEX® RS420) and a 30 vol. % COP-MgCaTiO2 EM composites with
commercial microwave laminates from Rogers Corporation [27]. Other materials are
shown in Table 7.1.
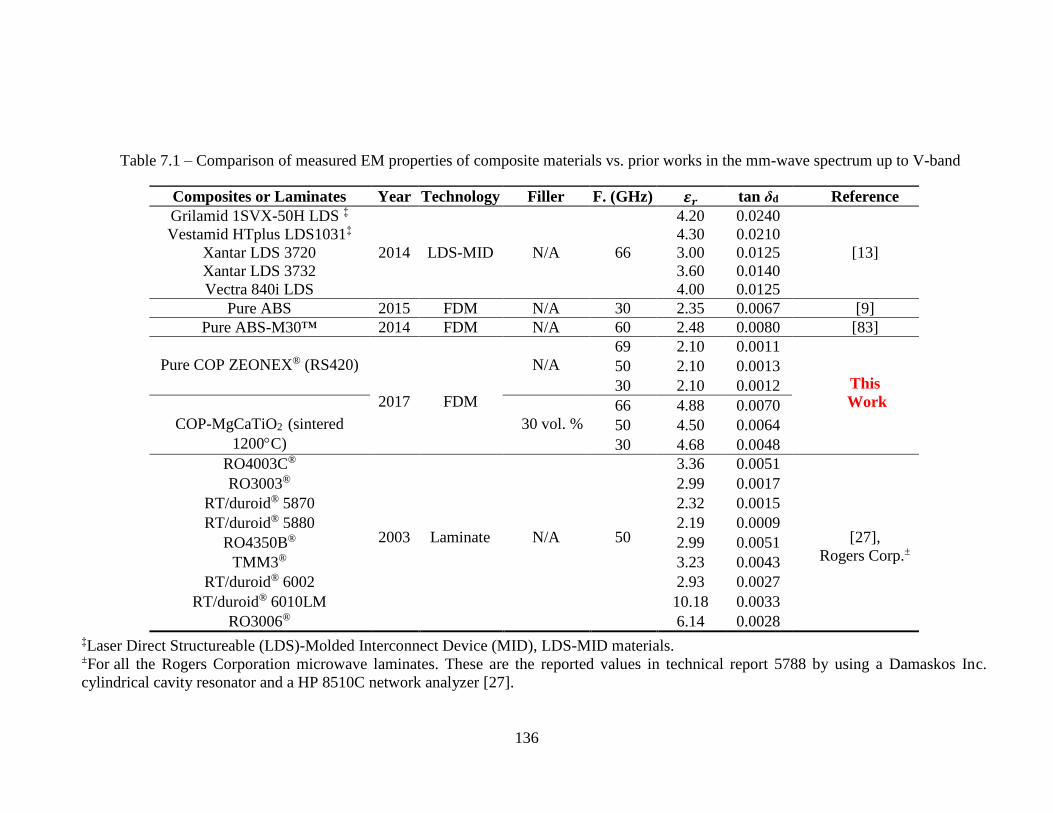
136
Table 7.1 – Comparison of measured EM properties of composite materials vs. prior works in the mm-wave spectrum up to V-band
Composites or Laminates Year Technology Filler F. (GHz) 𝜺𝒓 tan δd Reference
Grilamid 1SVX-50H LDS ‡ 4.20 0.0240
Vestamid HTplus LDS1031‡ 4.30 0.0210
Xantar LDS 3720 2014 LDS-MID N/A 66 3.00 0.0125 [13]
Xantar LDS 3732 3.60 0.0140
Vectra 840i LDS 4.00 0.0125
Pure ABS 2015 FDM N/A 30 2.35 0.0067 [9]
Pure ABS-M30™ 2014 FDM N/A 60 2.48 0.0080 [83]
Pure COP ZEONEX® (RS420)
2017
FDM
N/A
69 2.10 0.0011
This
Work
50 2.10 0.0013
30 2.10 0.0012
COP-MgCaTiO2 (sintered
1200C)
30 vol. %
66 4.88 0.0070
50 4.50 0.0064
30 4.68 0.0048
RO4003C®
2003
Laminate
N/A
50
3.36 0.0051
[27],
Rogers Corp.±
RO3003® 2.99 0.0017
RT/duroid® 5870 2.32 0.0015
RT/duroid® 5880 2.19 0.0009
RO4350B® 2.99 0.0051
TMM3® 3.23 0.0043
RT/duroid® 6002 2.93 0.0027
RT/duroid® 6010LM 10.18 0.0033
RO3006® 6.14 0.0028
‡Laser Direct Structureable (LDS)-Molded Interconnect Device (MID), LDS-MID materials. ±For all the Rogers Corporation microwave laminates. These are the reported values in technical report 5788 by using a Damaskos Inc.
cylindrical cavity resonator and a HP 8510C network analyzer [27].
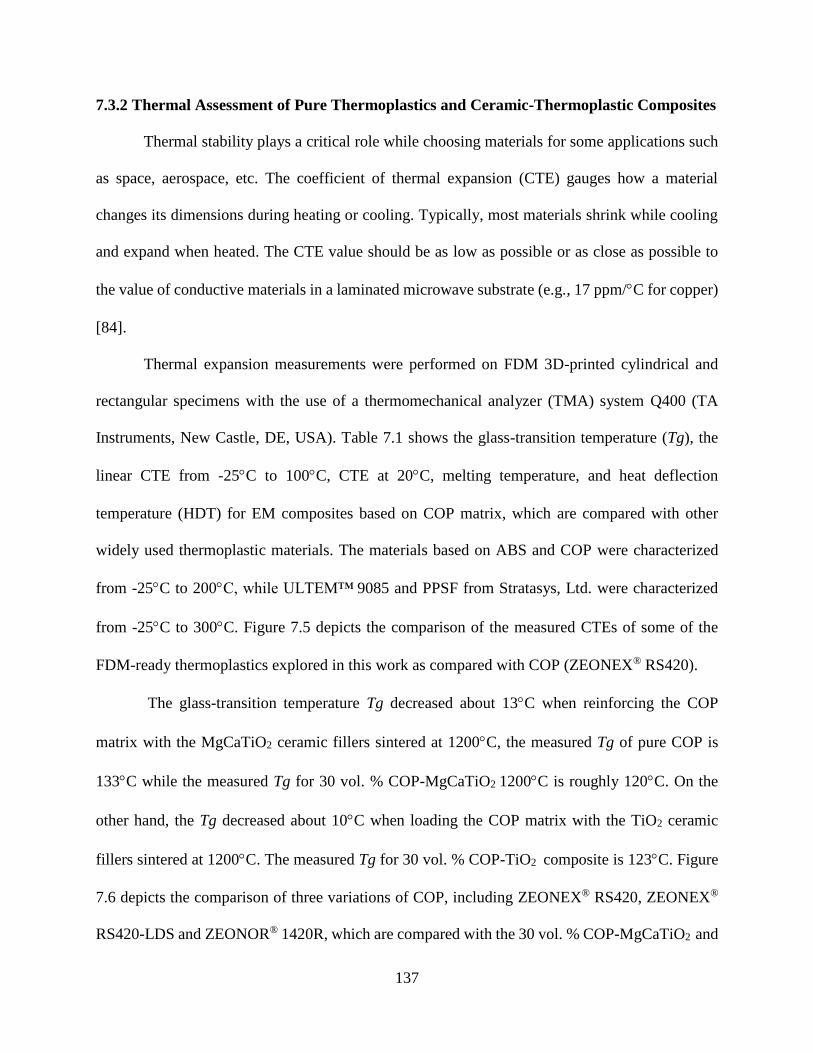
137
7.3.2 Thermal Assessment of Pure Thermoplastics and Ceramic-Thermoplastic Composites
Thermal stability plays a critical role while choosing materials for some applications such
as space, aerospace, etc. The coefficient of thermal expansion (CTE) gauges how a material
changes its dimensions during heating or cooling. Typically, most materials shrink while cooling
and expand when heated. The CTE value should be as low as possible or as close as possible to
the value of conductive materials in a laminated microwave substrate (e.g., 17 ppm/C for copper)
[84].
Thermal expansion measurements were performed on FDM 3D-printed cylindrical and
rectangular specimens with the use of a thermomechanical analyzer (TMA) system Q400 (TA
Instruments, New Castle, DE, USA). Table 7.1 shows the glass-transition temperature (Tg), the
linear CTE from -25C to 100C, CTE at 20C, melting temperature, and heat deflection
temperature (HDT) for EM composites based on COP matrix, which are compared with other
widely used thermoplastic materials. The materials based on ABS and COP were characterized
from -25C to 200C, while ULTEM™ 9085 and PPSF from Stratasys, Ltd. were characterized
from -25C to 300C. Figure 7.5 depicts the comparison of the measured CTEs of some of the
FDM-ready thermoplastics explored in this work as compared with COP (ZEONEX® RS420).
The glass-transition temperature Tg decreased about 13C when reinforcing the COP
matrix with the MgCaTiO2 ceramic fillers sintered at 1200C, the measured Tg of pure COP is
133C while the measured Tg for 30 vol. % COP-MgCaTiO2 1200C is roughly 120C. On the
other hand, the Tg decreased about 10C when loading the COP matrix with the TiO2 ceramic
fillers sintered at 1200C. The measured Tg for 30 vol. % COP-TiO2 composite is 123C. Figure
7.6 depicts the comparison of three variations of COP, including ZEONEX® RS420, ZEONEX®
RS420-LDS and ZEONOR® 1420R, which are compared with the 30 vol. % COP-MgCaTiO2 and
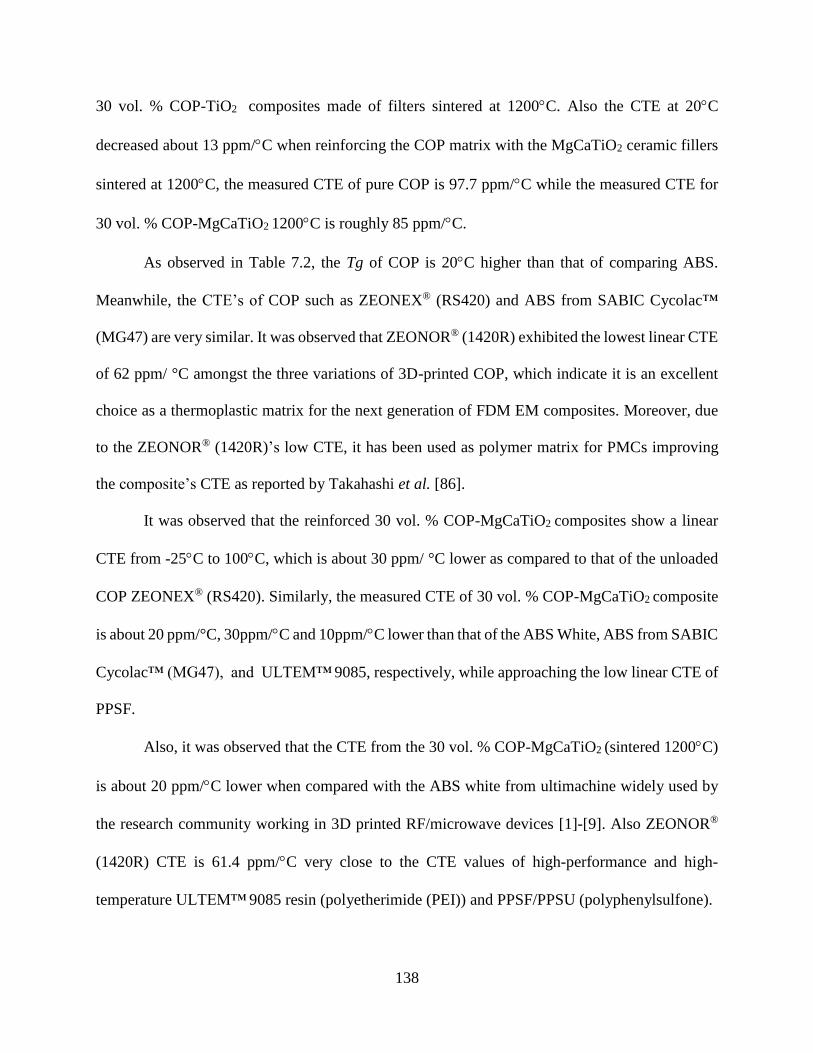
138
30 vol. % COP-TiO2 composites made of filters sintered at 1200C. Also the CTE at 20C
decreased about 13 ppm/C when reinforcing the COP matrix with the MgCaTiO2 ceramic fillers
sintered at 1200C, the measured CTE of pure COP is 97.7 ppm/C while the measured CTE for
30 vol. % COP-MgCaTiO2 1200C is roughly 85 ppm/C.
As observed in Table 7.2, the Tg of COP is 20C higher than that of comparing ABS.
Meanwhile, the CTE’s of COP such as ZEONEX® (RS420) and ABS from SABIC Cycolac™
(MG47) are very similar. It was observed that ZEONOR® (1420R) exhibited the lowest linear CTE
of 62 ppm/ °C amongst the three variations of 3D-printed COP, which indicate it is an excellent
choice as a thermoplastic matrix for the next generation of FDM EM composites. Moreover, due
to the ZEONOR® (1420R)’s low CTE, it has been used as polymer matrix for PMCs improving
the composite’s CTE as reported by Takahashi et al. [86].
It was observed that the reinforced 30 vol. % COP-MgCaTiO2 composites show a linear
CTE from -25C to 100C, which is about 30 ppm/ °C lower as compared to that of the unloaded
COP ZEONEX® (RS420). Similarly, the measured CTE of 30 vol. % COP-MgCaTiO2 composite
is about 20 ppm/°C, 30ppm/C and 10ppm/C lower than that of the ABS White, ABS from SABIC
Cycolac™ (MG47), and ULTEM™ 9085, respectively, while approaching the low linear CTE of
PPSF.
Also, it was observed that the CTE from the 30 vol. % COP-MgCaTiO2 (sintered 1200C)
is about 20 ppm/C lower when compared with the ABS white from ultimachine widely used by
the research community working in 3D printed RF/microwave devices [1]-[9]. Also ZEONOR®
(1420R) CTE is 61.4 ppm/C very close to the CTE values of high-performance and high-
temperature ULTEM™ 9085 resin (polyetherimide (PEI)) and PPSF/PPSU (polyphenylsulfone).
139
-50 0 50 100 150 200 250-200
-100
0
100
200
300
400
500
600
ABS [Ultimachine]
ZEONEX® RS420 [Zeon Corp.]
ABS [SABIC]
ULTEMTM 9085 [Stratasys, Ltd.]
PPSF/PPSU [Stratasys, Ltd.]D
imen
sio
n C
han
ge
(m
)
Temperature (C)
Figure 7.5 – Comparison of measured CTEs of 3D-printed pure
(unloaded) thermoplastics. Materials are shown in Table 7.2.
-50 0 50 100 150 200-200
-100
0
100
200
300
400
500
600
ZEONEX® (RS420)
ZEONOR® (1420R)
ZEONEX® (RS420-LDS)
30 vol. % COP-MgCaTiO2 1200C
30 vol. % COP-TiO2 1200C
Dim
ensi
on
Ch
ang
e (
m)
Temperature (C)
Figure 7.6 – Comparison of measured CTEs of 3D-printed three
variations of COP and COP-ceramic based composites. Materials are
shown in Table 7.2.
140
7.4 Conclusion
Two types of low-loss FDM composite materials for direct digital manufacturing (DDM)
technologies are developed and characterized at V-band frequencies. Pure COP thermoplastic
exhibits a relative permittivity of 2.1 and a loss tangent below 0.0011 at 69 GHz, whereas 30 vol.
% COP-MgCaTiO2 composites show a relative permittivity of 4.88 and a loss tangent below
0.0070 at 66 GHz. This new class of high-k, low-loss composite materials has shown some
promising attributes for enabling the next generation of high-performance 3D-printed RF and
microwave devices and antennas operating at the mm-wave frequencies.
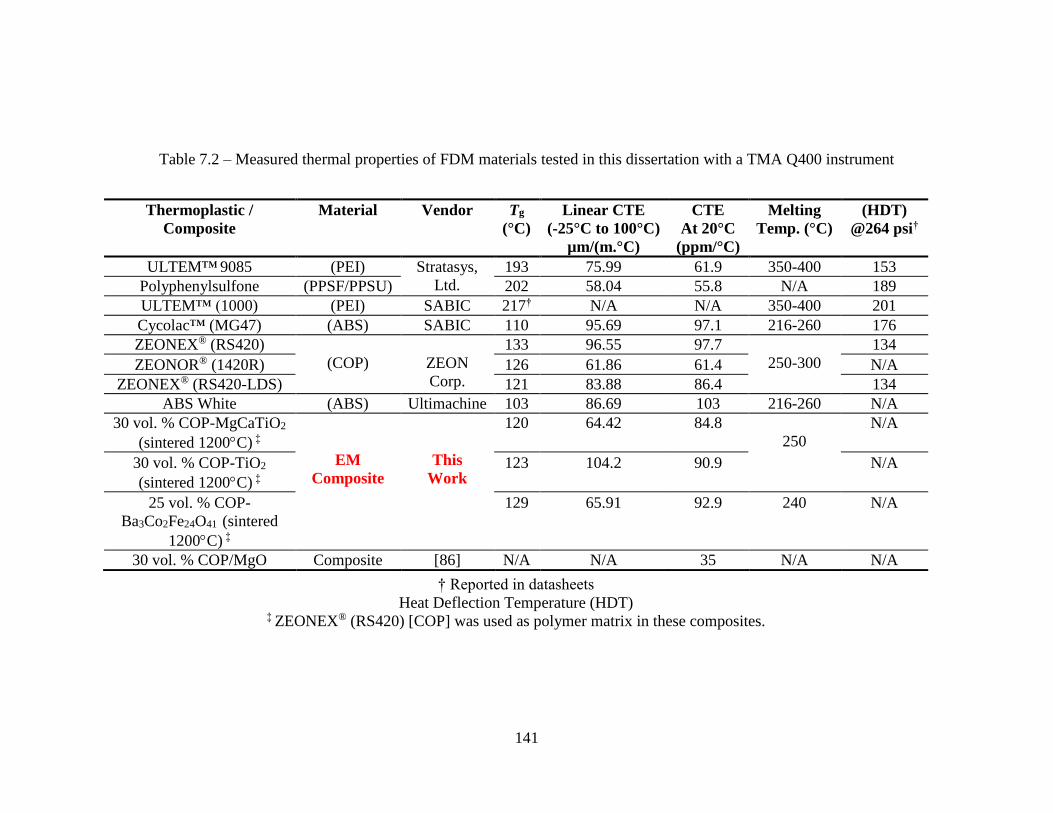
141
Table 7.2 – Measured thermal properties of FDM materials tested in this dissertation with a TMA Q400 instrument
Thermoplastic /
Composite
Material Vendor Tg
(°C)
Linear CTE
(-25°C to 100°C)
µm/(m.°C)
CTE
At 20°C
(ppm/°C)
Melting
Temp. (°C)
(HDT)
@264 psi†
ULTEM™ 9085 (PEI) Stratasys,
Ltd.
193 75.99 61.9 350-400 153
Polyphenylsulfone (PPSF/PPSU) 202 58.04 55.8 N/A 189
ULTEM™ (1000) (PEI) SABIC 217† N/A N/A 350-400 201
Cycolac™ (MG47) (ABS) SABIC 110 95.69 97.1 216-260 176
ZEONEX® (RS420)
(COP)
ZEON
Corp.
133 96.55 97.7
250-300
134
ZEONOR® (1420R) 126 61.86 61.4 N/A
ZEONEX® (RS420-LDS) 121 83.88 86.4 134
ABS White (ABS) Ultimachine 103 86.69 103 216-260 N/A
30 vol. % COP-MgCaTiO2
(sintered 1200C) ‡
EM
Composite
This
Work
120 64.42 84.8
250
N/A
30 vol. % COP-TiO2
(sintered 1200C) ‡
123 104.2 90.9 N/A
25 vol. % COP-
Ba3Co2Fe24O41 (sintered
1200C) ‡
129 65.91 92.9 240 N/A
30 vol. % COP/MgO Composite [86] N/A N/A 35 N/A N/A
† Reported in datasheets
Heat Deflection Temperature (HDT) ‡ ZEONEX® (RS420) [COP] was used as polymer matrix in these composites.
142
CHAPTER 8 : CONCLUSIONS AND FUTURE WORK
8.1 Future Work and Recommendations
Based on the results gained by this dissertation research work, there a few remaining
aspects listed as the following that needs further research investigations:
Explore new methodologies for increasing filler volume loading concentrations by
using solvent assisted dispersion processes via a solvent such as xylene or cyclohexane
that dissolves the thermoplastic COP while forming the final EM composites in the
solvent suspension;
Explore powder binder jetting techniques to increase the volume fraction of ceramic
fillers by not using a thermoplastic or polymer matrix for 3D-prinitng of microwave
structures and components;
Investigate micro-dispensing of filler-loaded composite pastes/slurries to further
extend highest achievable volume fraction ratio of ceramic fillers that increasing
permittivity for printable dielectrics;
Conduct more detailed studies on the effect of the surface coating materials at the
interface between inorganic fillers and organic matrix by exploring new kinds of
hyperdispersants, plasticizers, or another type of surface coating layers;
Study adhesion methods to improve the bonding between the COP and COP-ceramic
composites and the silver paste (CB028) layer after the micro-dispensing processes
followed by the curing/drying process such as introducing groups into polymer chains
as recommended by Cui et al. [85] or other methodologies. Similarly exploring
143
adhesion promoters for cyclic olefin resin compositions as suggested by Cruce et al.
[87];
Also for practical electronic/microwave applications and to improve reliability, the
CTE of the FDM-printed EM composite and the silver paste (CB028) should be as
close as possible, hence CTE characterization of CB028 from -25°C to 200°C is
recommended to be performed, if there is a significant mismatch, it is recommended to
explore a new metal paste, or develop a new FDM EM composite;
Demonstrate the low-loss characteristics of a printed 30 vol. % COP-TiO2 composite
substrate through the design of hairpin filters for Ku-band, which results in a simulated
insertion loss of 6 dB at a center frequency of 13 GHz. The preliminary design was
rigorously compared with a design based on a commercial laminate core (Rogers
RT/duroid® 5870), demonstrating 45% smaller size;
Based on the measured dielectric performance of ZEONOR® (1420R) with εr of 2.15
and a tan δd lower than 0.0016 (as shown in Table 5.3 and Figure 5.13), along with the
measured superb thermal properties (e.g., Tg of 126°C and the lowest CTE of 61.4
ppm/°C at 20°C amongst the three variations of 3D-printed COPs), which are better
than most of the thermoplastics shown in Table 7.2 and very close to the measured
values of ULTEM™ 9085 and (PPSF/PPSU) from Stratasys, Ltd., it is an excellent
candidate as a thermoplastic matrix for the next generation of FDM EM composites.
8.2 Conclusions
A variety of high-permittivity (high-k) and low-loss ceramic-thermoplastic composite
materials as fused deposition modeling (FDM) feedstocks, based on cyclo-olefin polymer (COP)
embedded with sintered ceramic fillers, have been developed and investigated for direct digital
144
manufacturing (DDM) of microwave components. The composites presented in this dissertation
use a high-temperature sintering process up to 1500°C to further enhance the dielectric properties
of the ceramic fillers. The electromagnetic (EM) properties of these newly developed FDM
composites were characterized up to the Ku-band by the cavity perturbation technique. Several
models for prediction of the effective relative dielectric permittivity of composites based on the
filler loading volume fraction have been evaluated, among which Hanai-Bruggeman and Maxwell
models have shown the best accuracy with less than 2% and 5% discrepancies, respectively.
The 30 vol. % COP-TiO2 FDM-ready composites with fillers sintered at 1200°C have
exhibited a relative permittivity (r) of 4.78 and a dielectric loss tangent (tan δd) lower than 0.0012
at 17 GHz. Meanwhile, the 30 vol. % COP-MgCaTiO2 composites with fillers sintered at 1200°C
have exhibited an r of 4.82 and a tan δd lower than 0.0018. The DDM approach combines FDM
of the engineered EM composites and micro-dispensing for deposition of conductive traces to
fabricate by 3D-printing edge-fed patch antennas operating at 17.2 GHz and 16.5 GHz. These
antenna devices were demonstrated by employing a 25 vol. % COP-MgCaTiO2 composite FDM
filament with the fillers sintered at 1100°C and a pure COP filament, which were both prepared
and extruded following the process described in this dissertation. The low dielectric loss of the
25 vol. % COP-MgCaTiO2 composite material (tan δd lower than 0.0018) has been leveraged to
achieve a peak realized gain of 6 dBi. Also, the high-permittivity (εr of 4.74), which corresponds
to an index of refraction of 2.17, results in a patch area miniaturization of 50% when compared
with an antenna designed and DPAM-printed over a Rogers RT/duroid® 5870 laminate core
through micro-dispensing of CB028 silver paste. This reference antenna exhibited a measured
peak realized gain of 6.27 dBi, which is on par with the printed 25 vol. % COP-MgCaTiO2 based
antenna.
145
Also, two low-loss FDM composite materials for DDM technologies are presented and
characterized at V-band (mm-wave) frequencies. Pure COP thermoplastic exhibits a dielectric
permittivity r of 2.1 and a low tangent tan δd below 0.0011 at 69 GHz, whereas 30 vol. % COP-
MgCaTiO2 composites with fillers sintered at 1200°C show an r of 4.88 and a tan δd below 0.0070
at 66 GHz. To the best of my knowledge, these EM properties (combination of high-permittivity
and low-loss) are superior to other 3D-printable microwave materials reported by the scientific
microwave community and are on par with materials developed for high-performance microwave
laminates by RF/microwave industry as shown in Chapter 7 and summarized in Table 7.1.
Meanwhile, the linear coefficient of thermal expansion (CTE) from -25°C to 100°C of the
reinforced 30 vol. % COP-MgCaTiO2 composite with fillers sintered at 1200°C is 64.42 ppm/°C,
which is about 20 ppm/°C lower when compared with pure ABS and 10 ppm/°C lower as compared
to high-temperature polyetherimide (PEI) ULTEM™ 9085 from Stratasys, Ltd. The CTE at 20°C
of the same composite material is 84.8 ppm/°C which is about 20 ppm/°C lower when compared
with pure ABS that is widely used by the research community for 3D printed RF/microwave
devices by FDM. The electromagnetic (EM) composites with tailored EM properties studied by
this work have a great potential for enabling the next generation of high-performance 3D-printed
RF/microwave devices and antennas operating at the Ku-band, K-band, and mm-wave frequencies.
8.3 Acknowledgments for Sponsors and Facilities
I’d like to thank Rogers corp., isola group, Ferro corp., Trans-Tech, Inc., Premix group,
ZEON corp. for providing samples or technical support in some experiments in this chapter. All
the SEM, XRD, EDS, AFM, 3D-printing process and 2D surface profile measurements were
conducted at the Nanotechnology Research and Education Center, (NREC-USF)3 facility in
3 NREC: http://www.nrec.usf.edu/
146
Tampa, FL. The nanocomposite fabrication processes were carried out at the RF-MEMS
Transducers Laboratory4, IDRB-USF Research Park in Tampa, FL., the complex permittivity and
permeability measurements in Ku-band and K-band, NFMM measurements were performed at the
Center for Wireless and Microwave Information Systems (WAMI)5, USF in Tampa, FL. High-
temperature sintering processes from (1340C to 1500C) in some samples were conducted at Dr.
Yoon, Yong-Kyu, Interdisciplinary Microsystems Lab, University of Florida (UF)6, Gainesville,
FL.
I’d like to thank Dr. Mike Hill from (Trans-Tech, Inc. a division of Skyworks) for providing
some recommendations in some experiments. Likewise Mark Nevitt from (ZEON Corporation)
for providing ZEONEX® RS420-LDS samples and others materials, similarly Charles Douglas
from Lubrizol Corporation for providing hyperdispersant samples. Moreover, I would like to thank
Art Perez, Ana Lopez Marcano and Benjamin Rice for their support in some experiments.
Additionally, I’d like to thank Janice Casagrande, Dr. Peter Krenz, Dr. David Rolando and Dr. Jeff
Tharp all of them from (ANSYS, Inc.), for their support related to EM simulations. Similarly, I’d
like to thank Dr. Nick Damaskos and team from Damaskos, Inc. in Chadds Ford, PA7 for the mm-
wave dielectric characterization in two samples presented in this dissertation. Also, I’d like to
thank Gail Borden and John Coonrod from Rogers Corporation for providing me with the technical
report 5788 for Rogers microwave laminates mm-wave characterization. Furthermore, I am very
grateful to Daniel Harshbarger, Tomas Lopez Lauterio, and Meenal R Vaidya, all of them from
Cummins Inc. for the opportunity to work with them in summer 2016.
4 RF-MEMS Transducers Laboratory: http://transducers.eng.usf.edu/ 5 WAMI Center: http://wami.eng.usf.edu/ 6 IMG-UF: http://www.img.ufl.edu/ 7 Damaskos, Inc.: http://www.damaskosinc.com/
147
REFERENCES
[1] K. H. Church, N. B. Crane, P. I. Defenbaugh, T. P. Ketterl, C. G. Neff, P. B. Nesbitt, J. T.
Nussbaum, C. Perkowski, H. Tsang, J. Castro, J. Wang, and T. M. Weller, “Multimaterial and
Multilayer Direct Digital Manufacturing of 3-D Structural Microwave Electronics,”
Proceedings of the IEEE, vol. 105, no.4, pp. 688–701, March 2017.
[2] T. P. Ketterl, Y. Vega, N. C. Arnal, J. W. I. Stratton, E. A. Rojas-Nastrucci, M. F. Cordoba-
Erazo, M. M. Abdin, C. W. Perkowski, P. I. Deffenbaugh, K. H. Church, and T. M. Weller,
“A 2.45 GHz Phased Array Antenna Unit Cell Fabricated Using 3-D Multi-Layer Direct
Digital Manufacturing,” IEEE Trans. Microwave Theory Techn., vol. 63, no. 12, pp. 4382–
4394, Dec. 2015.
[3] P.I. Deffenbaugh, R.C. Rumpf, and K.H. Church, “Broadband Microwave Frequency
Characterization of 3-D Printed Materials,” IEEE Transactions on Components, Packaging
and Manufacturing Technology, vol. 3, no. 12, pp. 2147–2155, Dec. 2013.
[4] N. Delhote, D. Baillargeat, S. Verdeyme, C. Delage, and C. Chaput, “Ceramic Layer-By-
Layer Stereolithography for the Manufacturing of 3-D Millimeter-Wave Filters,” IEEE
Transactions on Microwave Theory and Techniques, vol. 55, no. 3, pp. 548–554, Mar. 2007.
[5] J. O’Brien, M.Córdoba-Erazo, E. Rojas, J. Castro, M. Abdin, G. Mumcu, J. Wang, K. Church,
P. Deuffenbaugh, and T. Weller, “Miniaturization of Microwave Components and Antennas
Using 3D Manufacturing,” 9th. European Conference on Antennas and Propagation (EuCAP
2015), pp.1-4, Lisbon Portugal, Apr. 2015.
[6] P. Deffenbaugh, K. Church, J. Goldfarb, and X. Chen, “Fully 3D-printed 2.4 GHz
Bluetooth/Wi-Fi Antenna,” International Symposium on Microelectronics, IMAPS, vol. 2013,
no. 1, pp. 914–920, Jan. 2013.
[7] I.T. Nassar, T.M. Weller, and H. Tsang, “A 3D-printed Miniaturized Log-Periodic Dipole
Antenna,” IEEE Antennas and Propagation Society International Symposium (APSURSI), pp.
11-12, Memphis, TN, July 2014.
[8] P. I. Deffenbaugh, T. M. Weller, and K. H. Church, “Fabrication and Microwave
Characterization of 3-D Printed Transmission Lines,” IEEE Microwave and Wireless
Components Letters, vol. 25, no. 12, pp. 823–825, Dec. 2015.
[9] A.L.Vera-Lopez, E. Rojas, M.C-Erazo T. Weller, and J. Papapolymerou, “Ka-Band
Characterization and RF Design of Acrylonitrile Butadiene Styrene (ABS),” IEEE MTT-S
International Microwave Symposium (IMS), pp. 1-4, May 2015.
148
[10] J. Castro, E. Rojas, A. Ross, T. Weller, and J. Wang, “High-k and low-loss thermoplastic
composites for Fused Deposition Modeling and their application to 3D-printed Ku-band
antennas,” IEEE MTT-S International Microwave Symposium (IMS), pp.1-4, May 2016.
[11] M. Vaezi, H. Seitz, and S. Yang, “A review on 3D micro-additive manufacturing
technologies,” The International Journal of Advanced Manufacturing Technology, vol. 67,
no. 5–8, pp. 1721–1754, Nov. 2012.
[12] A. Friedrich, B. Geck, O. Klemp, and H. Kellermann, "On the design of a 3D LTE antenna
for automotive applications based on MID technology," European Microwave Conference
(EuMC), Nuremberg, pp. 640-643, Oct. 2013.
[13] Q. H. Dao, A. Friedrich, and B. Geck, “Characterization of Electromagnetic Properties of
MID Materials for High-Frequency Applications up to 67 GHz,” Advanced Materials
Research, vol. 1038, pp. 63–68, Sep. 2014.
[14] M. M. Abdin, J. Castro, J. Wang, and T. Weller, “Miniaturized 3D printed balun using high-
k composites,” 2015 IEEE 16th Annual Wireless and Microwave Technology Conference
(WAMICON), pp. 1-3, Apr. 2015.
[15] J. M. O’Brien, J. E. Grandfield, G. Mumcu, and T. M. Weller, “Miniaturization of a Spiral
Antenna Using Periodic Z-Plane Meandering,” IEEE Transactions on Antennas and
Propagation, vol. 63, no. 4, pp. 1843–1848, Apr. 2015.
[16] J. O’Brien, “Medium Power, Compact Periodic Spiral Antenna," Thesis, M.S. EE, Dept.
Elect. Eng., University of South Florida, Tampa, FL., USA, 2013.
[17] J. Castro, E. Rojas, A. Ross, T. Weller, and J. Wang, “Fabrication, Modeling, and Application
of Ceramic-Thermoplastic Composites for Fused Deposition Modeling of Microwave
Components,” IEEE Trans. On Microwave Theory and Techniques, vol. PP, issue. 99, pp. 1-
12, February 2017.
[18] M. D’Auria, W. J. Otter, J. Hazell, B. T. W. Gillatt, C. Long-Collins, N. M.Ridler, and S.
Lucyszyn, "3-D printed metal-pipe rectangular waveguides," IEEE Transactions on
Components, Packaging and Manufacturing Technology, vol. 5, no. 9, pp. 1339-1349, Sept.
2015.
[19] J. Kimionis, M. Isakov, B. S. Koh, A. Georgiadis and M. M. Tentzeris, "3D-printed origami
packaging with inkjet-printed antennas for RF harvesting sensors," IEEE Transactions on
Microwave Theory and Techniques, vol. 63, no. 12, pp. 4521-4532, Dec. 2015.
[20] S. Scott Crump, Stratasys, Inc., “Apparatus and method for creating three-dimensional
objects,” U.S. Patent 5,121,329, June 9th, 1992.
[21] S. Scott Crump, Stratasys, Inc., “Modeling Apparatus for three-dimensional objects,” U.S.
Patent 5,340,433 A, August 8th. 1994.
149
[22] S. Scott Crump, J.W. Comb, W.R. Priedeman, Jr. and R.L. Zinniel, Stratasys, Inc., “Process
of support removal for fused deposition modeling,” U.S. Patent 5,503,785 A, April, 2nd, 1996.
[23] P.I. Deffernbaugh, 3D-printed Electromagnetic Transmission and Electronic Structures
Fabricated on a Single Platform Using Advanced Process Integration Techniques, Ph.D.
Dissertation, The University of Texas at El Paso, Texas, USA, 2014.
[24] U. Robles, “3D Printed Impedance Elements by Micro-Dispensing," Thesis, M.S. EE, Dept.
Elect. and Comp. Eng., The University of Texas at El Paso, Texas, USA, 2013.
[25] M. F. Cordoba-Erazo, E. A. Rojas-Nastrucci, and T. Weller, “Simultaneous RF electrical
conductivity and topography mapping of smooth and rough conductive traces using
microwave microscopy to identify localized variations,” IEEE 16th Annual Wireless and
Microwave Technology Conference, (WAMICON), pp.1-4, Apr. 2015.
[26] Z.-M. Dang, J.-K. Yuan, J.-W. Zha, T. Zhou, S.-T. Li, and G.-H. Hu, “Fundamentals,
processes, and applications of high-permittivity polymer–matrix composites,” Progress in
Materials Science, vol. 57, no. 4, pp. 660–723, May 2012.
[27] A. Horn, “Dielectric constant and loss of selected grades of Rogers high-frequency circuit
substrates from 1-50 GHz,” Rogers Corp., Corporate Headquarters, One Technology Drive,
Rogers, CT 06263, Tech. Rep. 5788 (1-18), Sep. 2003.
[28] C. Gray, A. Roach, S. Rappaport, A. Dineen, R. Irion, “High Dielectric Constant, Low Loss
Additive Manufacturing Materials for RF/Microwave Applications”, IMAPS New England,
May 2016.
[29] S. Havriliak and S. Negami, “A complex plane representation of dielectric and mechanical
relaxation processes in some polymers,” Polymer, vol. 8, pp. 161–210, Jan. 1967.
[30] W. Wersing, “Microwave ceramics for resonators and filters,” Current Opinion in Solid State
and Materials Science, vol. 1, no. 5, pp. 715–731, Oct. 1996.
[31] L. Li, X. M. Chen, and X. C. Fan, “Characterization of MgTiO3-CaTiO3-Layered Microwave
Dielectric Resonators with TE01delta Mode,” Journal of the American Ceramic Society, vol.
89, no. 2, pp. 557–561, Feb. 2006.
[32] J. Castro, C. Morales, T. Weller, J. Wang, H. Srikanth, “Synthesis and characterization of
low-loss Fe3O4-PDMS magneto-dielectric polymer nanocomposites for RF applications,”
IEEE MTT-S Wireless and Microwave Technology Conference 2014, WAMICON 2014, pp.1-
5, Jun. 2014.
[33] Y. Shirakata, N. Hidaka, M. Ishitsuka, A. Teramoto, and T. Ohmi, “High Permeability and
Low Loss Ni-Fe Composite Material for High-Frequency Applications,” IEEE Transactions
on Magnetics, vol. 44, no. 9, pp. 2100-2106, Sep. 2008.
150
[34] C. Morales, J. Dewdney, S. Pal, S. Skidmore, K. Stojak, H. Srikanth, T. Weller, and J. Wang,
“Tunable Magneto-Dielectric Polymer Nanocomposites for Microwave Applications,” IEEE
Trans. Microwave Theory Techn., vol. 59, no. 2, pp. 302–310, Feb. 2011.
[35] C. Morales, J. Dewdney, S. Pal, K. Stojak, H. Srikanth, J. Wang, and T. Weller,
“Magnetically tunable nanocomposites for microwave applications,” 2010 IEEE MTT-S
International Microwave Symposium, May 2010.
[36] K. Stojak, S. Pal, H. Srikanth, C. Morales, J. Dewdney, T. Weller, and J. Wang, “Polymer
nanocomposites exhibiting magnetically tunable microwave properties,” Nanotechnology,
vol. 22, no. 13, p. 135602, Feb. 2011.
[37] H. Mosallaei, and K.Sarabandi, “Engineered meta-substrates for antenna miniaturization,”
Proc. of URSI EMTS, vol.1, pp.191-193, 2004.
[38] J. Castro, E. Rojas, T. Weller, J. Wang, “High-k and Low-Loss Polymer Composites with
Sintered Nd and Mg-Ca Titanates for 3D RF and Microwave Printed Devices: Fabrication
and Characterization,” IEEE MTT-S Wireless and Microwave Technology Conference
(WAMICON 2015), pp. 1-5, Cocoa, Beach FL., April. 2015.
[39] S. Koulouridis, G. Kiziltas, Y. Zhou, D. J. Hansford, and J. L. Volakis, “Polymer-Ceramic
Composites for Microwave Applications: Fabrication and Performance Assessment,” IEEE
Trans. Microwave Theory Techn., vol. 54, no. 12, pp. 4202–4208, Dec. 2006.
[40] J. Castro, T. Weller, J. Wang “An Improved Fabrication Method of High-k and Low-Loss
Polymer Composites with Sintered Ceramic Fillers for Microwave Applications,” IEEE MTT-
S International Microwave Symposium (IMS 2015), pp.1-4, May 2016.
[41] D. Cure, “Reconfigurable Low Profile Antennas Using Tunable High Impedance Surfaces”,
Ph.D. Dissertation, Dept. Elect. Eng., University of South Florida, Tampa FL., USA, Jan.
2013.
[42] Y. Shi, L. M. Bhowmik, A. K. Amert, and K. W. Whites, “An effective method for fabrication
of 3-D dielectric materials using polymer-ceramic composites,” 2014 IEEE Antennas and
Propagation Society International Symposium (APSURSI), pp. 225-226, Jul. 2014.
[43] G. Kiziltas, C. Yilmaz, J. L. Volakis, N. Kikuchi, and J. Halloran, “Design of metamaterial
textures for microwave applications,” IEEE Antennas and Propagation Society International
Symposium (IEEE Cat. No.02CH37313), 2002.
[44] G. Kiziltas, J. L. Volakis, and N. Kikuchi, “Metamaterial design via the density method,”
IEEE Antennas and Propagation Society International Symposium (IEEE Cat.
No.02CH37313), 2002.
151
[45] G. Kiziltas, D. Psychoudakis, J. L. Volakis, and N. Kikuchi, “Topology design optimization
of dielectric substrates for bandwidth improvement of a patch antenna,” IEEE Trans.
Antennas Propagat., vol. 51, no. 10, pp. 2732–2743, Oct. 2003.
[46] Y.-H.Koh, A. Knapp, J. W. Halloran, H.-W. Kim, and H.-E. Kim, “Co-Firing of Spatially
Varying Dielectric Ca-Mg-Silicate and Bi-Ba-Nd-Titanate Composite,” Journal of the
American Ceramic Society, vol. 88, no. 10, pp. 2690–2695, Oct. 2005.
[47] B. Zhang, F. Ye, S. Liu, Q. Liu, and Y. Gao, “High-k and ultra-low-loss
BADCy/Ni0.5Ti0.5NbO4 composites for PCB application fabricated by cold isostatic pressing
and vacuum assisted infiltration processes,” Journal of Materials Science: Materials in
Electronics, Jul. 2015.
[48] J. Zhang, Y. Zhou, B. Peng, Z. Xie, X. Zhang, and Z. Yue, “ Microwave Dielectric Properties
and Thermally Stimulated Depolarization Currents of MgF 2 -Doped Diopside Ceramics,”
Journal of the American Ceramic Society, vol. 97, no. 11, pp. 3537–3543, Aug. 2014.
[49] J. Castro, E. Rojas, T. Weller, and J. Wang, “Engineered Nanocomposites for Additive
Manufacturing of Microwave Electronics,” International Symposium on Microelectronics,
vol. 2015, no. 1, pp. 189–196, Jan. 2015.
[50] J. Castro, E.Rojas, T. Weller, and J. Wang, “High-permittivity and Low-Loss Electromagnetic
Composites based in Sintered Ba0.55Sr0.45TiO3 and MgCaTiO2 Fillers for Additive
Manufacturing and their Application to 3D-printed K-Band Antennas,” Journal of
Microelectronics and Electronic Packaging, vol. 13, no. 3, pp. 102–112, Jul. 2016.
[51] Q. Zhang and P. J. McGinn, "Imaging of oxide dielectrics by near-field microwave
microscopy," Journal of the European Ceramic Society, vol. 25, pp. 407-416, 4, Apr. 2005.
[52] C. Gao, B.Hu, I. Takeuchi, K.-S. Chang, X.-D. Xiang, and G. Wang, "Quantitative scanning
evanescent microwave microscopy and its applications in characterization of functional
materials libraries," Measurement Science and Technology, vol. 16, no.1, p. 248-260, Dec.
2004.
[53] Z. N. Wing, J. W. Halloran, Q. Zhang, and P. J. McGinn, "Variable Dielectrics in the Calcium
Magnesium Titanate System Characterized with Scanning Microwave Microscopy," Journal
of the American Ceramic Society, vol. 89, no. 5, pp. 1610-1614, May 2006.
[54] V.V. Talanov, A. Scherz, and A. R. Schwartz, "A Microfabricated Near-Field Scanned
Microwave Probe for Noncontact Dielectric Constant Metrology of Low-k Films," in
Microwave Symposium Digest, 2006. IEEE MTT-S International, pp. 1618-1621, 2006.
[55] C. Gao, and X.-D. Xiang, "Quantitative microwave near-field microscopy of dielectric
properties," Review of Scientific Instruments, vol. 69, pp. 3846-3851, Nov. 1998.
152
[56] M. F. Córdoba-Erazo, and T. M. Weller, "Near-Field Microwave Microscopy for Non-
Destructive Characterization of Polymer-Coated Samples," Submitted to Review of Scientific
Instruments, 2015.
[57] A.D. Vyas, V. A.Rana, D. H. Gadani, and A. N. Prajapati, “Cavity perturbation technique for
complex permittivity measurement of dielectric materials at X-band microwave frequency,”
2008 International Conference on Recent Advances in Microwave Theory and Applications,
Nov. 2008.
[58] W. Che, Z. Wang, Y. Chang, and P. Russer, “Permittivity Measurement of Biological
Materials with Improved Microwave Cavity Perturbation Technique,” 2008 38th. European
Microwave Conference, Oct. 2008.
[59] David Pozar, (2011, November 22nd), Microwave Engineering, (4th. edition), Wiley, New
York, NY.
[60] G. Bruggeman, “Calculation of Various Physics Constants in Heterogeneous Substances I
Dielectricity Constants and Conductivity of Mixed Bodies from Isotropic Substances,”
Annalen der Physik, Berlin, vol. 416, no. 7, pp. 636-664, 1935.
[61] T. Hanai, “Theory of the dielectric dispersion due to the interfacial polarization and its
application to emulsions,” Kolloid-Zeitschrift, vol. 171, no. 1, pp. 23-31, Jul. 1960.
[62] W. Zhou, B.B.Hinojosa, and J. C. Nino, “Applicability of the Bruggeman Equation for
Analyzing Dielectric Slurries Containing Ceramic Powders with High Permittivity,” Journal
of the American Ceramic Society, vol. 95, no. 2, pp. 457–460, Dec. 2011.
[63] G. Raju, (2016, May), Dielectrics in Electric Fields, (2nd. edition), CRC Press, Taylor &
Francis Group, Boca Raton, FL.
[64] P. Barber, S. Balasubramanian, Y. Anguchamy, S. Gong, A. Wibowo, H. Gao, H. J. Ploehn,
and H.-C. zur Loye, “Polymer Composite and Nanocomposite Dielectric Materials for Pulse
Power Energy Storage,” Materials, vol. 2, no. 4, pp. 1697–1733, Oct. 2009.
[65] C. Brosseau, “Modelling and simulation of dielectric heterostructures: a physical survey from
a historical perspective,” J. Phys. D: Appl. Phys., vol. 39, no. 7, pp. 1277–1294, Mar. 2006.
[66] V. Myroshnychenko and C. Brosseau, “Finite-element modeling method for the prediction of
the complex effective permittivity of two-phase random statistically isotropic
heterostructures,” Journal of Applied Physics, vol. 97, no. 4, p. 044101, 2005.
[67] C. P. Wong, T. Marinis, Jianmin Qu, and Yang Rao, “A precise numerical prediction of an
effective dielectric constant for polymer-ceramic composite based on effective-medium
theory,” IEEE Trans. Comp. Packag. Technol., vol. 23, no. 4, pp. 680–683, 2000.
153
[68] K.-L. Ying and T.-E. Hsieh, “Sintering behaviors and dielectric properties of nanocrystalline
barium titanate,” Materials Science and Engineering: B, vol. 138, no. 3, pp. 241–245, Apr.
2007.
[69] D.-H. Yoon, J. Zhang, and B. I. Lee, “Dielectric constant and mixing model of BaTiO3
composite thick films,” Materials Research Bulletin, vol. 38, no. 5, pp. 765–772, Apr. 2003.
[70] R. Piagai, I.-T. Kim, J.-G. Park, and Y.-H. Kim, “Preparation of Magnesium-Calcium
Titanate Powders by Alkoxide Precursor Method,” Journal of the American Ceramic Society,
vol. 81, no. 5, pp. 1361–1364, May 1998.
[71] G. S.Swei, and D.J. Arthur, Rogers Corporation, “Particulate Filled Composite Film and
Method of Making Same,” U.S. Patent 5,374,453, Dec. 20, 1994.
[72] D.J. Arthur, G. S.Swei, and P. X. Nguyen, Rogers Corporation, “Dielectric Composite,” U.S.
Patent 5,354,611, Oct. 11, 1994.
[73] P. S. Grant, F. Castles, Q. Lei, Y. Wang, J. M. Janurudin, D. Isakov, S. Speller, C. Dancer,
and C. R. M. Grovenor, “Manufacture of electrical and magnetic graded and anisotropic
materials for novel manipulations of microwaves,” Philosophical Transactions of the Royal
Society A: Mathematical, Physical and Engineering Sciences, vol. 373, no. 2049, pp. 1-14,
Jul. 2015.
[74] D. V. Isakov, Q. Lei, F. Castles, C. J. Stevens, C. R. M. Grovenor, and P. S. Grant, “3D-
printed anisotropic dielectric composite with meta-material features,” Materials & Design,
vol. 93, pp. 423–430, Mar. 2016.
[75] F. Castles, D. Isakov, A. Lui, Q. Lei, C. E. J. Dancer, Y. Wang, J. M. Janurudin, S. C. Speller,
C. R. M. Grovenor, and P. S. Grant, “Microwave dielectric characterization of 3D-printed
BaTiO3/ABS polymer composites,” Scientific Reports, vol. 6, pp.1-8, Mar. 2016.
[76] J. Castro, M. Cordoba, T. Weller, and J. Wang, “Enhancement of Microwave Dielectric
Properties of Polymer-Ceramic Electromagnetic Composites with MgCaTiO2 and TiO2
Micro-fillers through a High-Temperature Sintering Process,” Journal of American Ceramic
Society, submitted to be submitted to external peer-review on April 2017.
[77] T. Nakatsuka, “Polylactic acid-coated cable,” Fujikura Tech. Rev., pp. 39–45, 2011, Rev. 40.
[78] D. Espalin, D. Muse, E. MacDonald, and R. Wicker, “3-D printing multifunctionality:
Structures with electronics,” Int. J. Adv. Manuf. Tech., vol. 72, no. 5, pp. 963–978, Mar. 2014.
[79] Y. Sakabe, N. Wada, and Y. Hamaji, “Grain Size Effects on Dielectric Properties and Crystal
Structure of Fine-grained BaTiO3 Ceramics,” 1998 Journal of the Korean Physical Society,
vol. 32, pp. S260-S264, Feb. 1998.
154
[80] Constantine A. Balanis. (2005, April 4th.) Antenna Theory: Analysis and Design, (3rd.
Edition), Wiley-Interscience, New Jersey.
[81] Y. Arbaoui, P. Agaciak, A. Chevalier, V. Laur, A. Maalouf, J. Ville, P. Roquefort, T. Aubry,
and P. Queffelec, “3D-printed ferromagnetic composites for microwave applications,”
Journal of Materials Science, vol. 52, no. 9, pp. 4988–4996, Jan. 2017.
[82] J. Castro, E.Rojas, T. Weller, and J. Wang, “High-k and Low-Loss Electromagnetic
Composites for Direct Digital Manufacturing of mm-wave Devices,” IEEE Antennas and
Propagation Society International Symposium (APSURSI), accepted, March 2017.
[83] A. Bisognin, D. Titz, F. Ferrero, R. Pilard, C. A. Fernandes, J. R. Costa, C. Corre, P.
Calascibetta, J.-M. Riviere, A. Poulain, C. Badard, F. Gianesello, C. Luxey, P. Busson, D.
Gloria, and D. Belot, “3D printed plastic 60 GHz lens: Enabling innovative millimeter wave
antenna solution and system,” IEEE MTT-S International Microwave Symposium (IMS2014),
pp. 1-4, Jun. 2014.
[84] Coonrod, John. “PCB Materials Keep Demanding Satellite Communications On Track,” ROG
Blog. N.P., 2017.Web. 10 Mar. 2017.
[85] J. Cui, J.-X. Yang, Y.-G. Li, and Y.-S. Li, “Synthesis of High Performance Cyclic Olefin
Polymers (COPs) with Ester Group via Ring-Opening Metathesis Polymerization,” Polymers,
vol. 7, no. 8, pp. 1389–1409, Aug. 2015.
[86] S. Takahashi, Y. Imai, A. Kan, Y. Hotta, and H. Ogawa, “High-frequency dielectric and
mechanical properties of cyclo-olefin polymer/MgO composites,” Polymer Bulletin, vol. 72,
no. 7, pp. 1595–1601, Mar. 2015.
[87] C.J. Cruce, B. Edgecombe, P.W. Boothe, and M.A. Giardello, Materia, Inc., “Storage Stable
Adhesion Promoter Compositions for Cyclic Olefin Resin Compositions,” U.S. Patent
20,150,166,767 A1, June, 18th, 2015.

155
APPENDICES
156
Appendix A: Copyright Permissions
The permission below is for the use of Figure 2.1, and Figure 2.4 in Chapter 2.
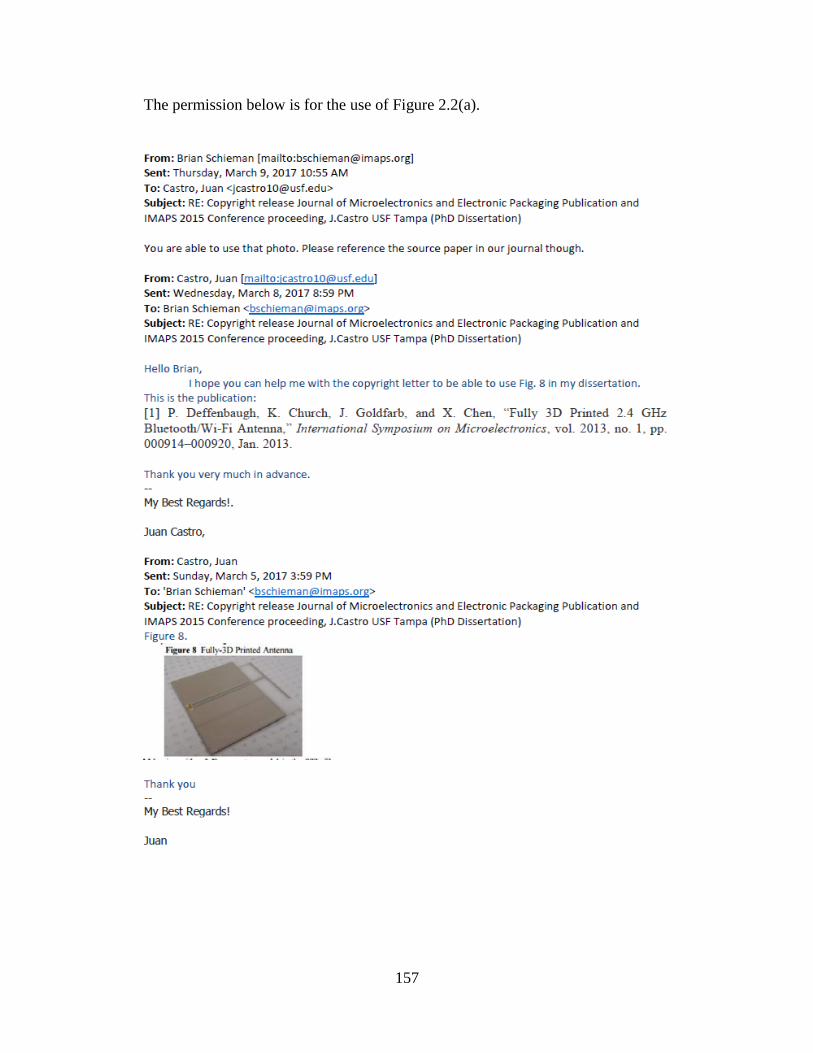
157
The permission below is for the use of Figure 2.2(a).
158
The permission below is for the use of Figure 2.2(b).
159
The permission below is for the use of Figure 2.3 in Chapter 2.
160
The permission below is for the use of Figure 2.4 in Chapter 2.
161
The permission below is for the use of Figure 3.8 and Figure 3.9 in Chapter 3.
162
The permission below is for the use of material in Chapter 3 and Chapter 4, and Figure
5.7(a).
163
The permission below is for the use of material in Chapter 3 and Chapter 4.
164
The permission below is for the use of material in Chapter 3 and Chapter 4.
165
The permission below is for the use of material in Chapter 5 and Chapter 6, and Figure
5.7(b).

166
The permission below is for the use of material in Chapter 5 and Chapter 6.
167
The permission below is for the use of ZEONEX® and ZEONOR® trademarks in all the
dissertation.
ABOUT THE AUTHOR
Juan Castro received a B.S. degree in Electrical Engineering (summa cum laude) and a
M.B.A degree from the Autonomous University of Baja California, Mexicali, Mexico, in 2005 and
2011, respectively. And he got a M.S. degree in Electrical Engineering from the University of
South Florida, Tampa, FL. USA, in 2014, where he is currently pursuing the Ph.D. degree in
Electrical Engineering. Juan has authored or coauthored over 12 professional journals and
conference publications in the RF/microwave field, and he has one provisional disclosure. His
current research interests include 3D-printed RF/microwave circuits and antennas based on
engineered electromagnetic nanocomposite materials.
Juan was the recipient of the 2017 dissertation fellowship of the honors society of Phi
Kappa Phi and the 2016 IEEE Microwave Theory and Techniques Society (IEEE MTT-S) graduate
fellowship. He was also the recipient of the 2016 SHPE engineering science symposium “Best
Student Paper Award” under the applied physics/electrical and computer engineering category, he
also received the “Best of Track” and “Outstanding Student Paper” awards under the IoT &
advanced applications track during the 48th International Symposium on Microelectronics (IMAPS
2015). In addtion, he received the 2015 USF research day poster competition award and 2014
HENAAC graduate STEM category technical poster award, and the 2012 doctorate fellowship by
CONACYT (the Mexican National Council for Science and Technology).
Juan has worked for several companies, including Panasonic in 2007, Medtronic (formerly
COVIDIEN) from 2008-2011, Nypro Healthcare (a Jabil company) from 2011-2012, and
Cummins Inc. in Columbus, IN in summer 2016.


![Nanocomposite [5]](https://static.fdocuments.net/doc/165x107/577c7ecf1a28abe054a26499/nanocomposite-5.jpg)
