An Engineered Fit-For-Purpose Polymer Nanocomposite Seal ...
132
University of New Mexico UNM Digital Repository Civil Engineering ETDs Engineering ETDs Fall 12-14-2018 An Engineered Fit-For-Purpose Polymer Nanocomposite Seal Repair Material for Wellbores Moneeb Genedy Follow this and additional works at: hps://digitalrepository.unm.edu/ce_etds Part of the Civil Engineering Commons is Dissertation is brought to you for free and open access by the Engineering ETDs at UNM Digital Repository. It has been accepted for inclusion in Civil Engineering ETDs by an authorized administrator of UNM Digital Repository. For more information, please contact [email protected]. Recommended Citation Genedy, Moneeb. "An Engineered Fit-For-Purpose Polymer Nanocomposite Seal Repair Material for Wellbores." (2018). hps://digitalrepository.unm.edu/ce_etds/219
Transcript of An Engineered Fit-For-Purpose Polymer Nanocomposite Seal ...

University of New MexicoUNM Digital Repository
Civil Engineering ETDs Engineering ETDs
Fall 12-14-2018
An Engineered Fit-For-Purpose PolymerNanocomposite Seal Repair Material for WellboresMoneeb Genedy
Follow this and additional works at: https://digitalrepository.unm.edu/ce_etds
Part of the Civil Engineering Commons
This Dissertation is brought to you for free and open access by the Engineering ETDs at UNM Digital Repository. It has been accepted for inclusion inCivil Engineering ETDs by an authorized administrator of UNM Digital Repository. For more information, please contact [email protected].
Recommended CitationGenedy, Moneeb. "An Engineered Fit-For-Purpose Polymer Nanocomposite Seal Repair Material for Wellbores." (2018).https://digitalrepository.unm.edu/ce_etds/219

i
Moneeb Genedy Candidate
Civil, Construction & Environmental Engineering Department
This dissertation is approved, and it is acceptable in quality
and form for publication:
Approved by the Dissertation Committee:
Mahmoud Reda Taha , Chairperson
John Stormont
Edward Matteo
Yu-Lin Shen
Harvey Goodman

ii
An Engineered Fit-For-Purpose Polymer Nanocomposite Seal Repair Material for
Wellbores
BY
Moneeb Genedy
B.S. Civil Engineering, Alexandria University, Egypt, 2008
M.S. Civil Engineering, University of New Mexico, USA, 2014
DISSERTATION
Submitted in Partial Fulfillment of the
Requirements for the Degree of
Doctor of Philosophy
Engineering
The University of New Mexico
Albuquerque, New Mexico
December, 2018

iii
DEDICATION
I would like to dedicate this work to my parents, Gamal Genedy and Samyah
Genedy, and my wife, Rania Ghallab, who have provided me with everything that I have
needed to succeed.

iv
ACKNOWLEDGMENTS
I would like to thank my advisor and committee chair, Dr. Mahmoud Reda Taha
for his help, support, and motivation through this program. Without Dr. Taha’s guidance
and advice, I would not have been able to finish this work. I am honored to work under
his supervision. I would also like to thank my committee members, Dr. John Stormont,
Dr. Edward Matteo, Dr. Yu-Lin Shen, and Mr. Harvey Goodman, for their support.
I would further acknowledge Mr. Ken Martinez for his sincere help to conduct
these experiments. In addition, I would like to extend a special thanks to my colleagues at
UNM for their help and support.
I would also like to acknowledge the funding agencies, Department of Energy and
Sandia National Laboratories, for funding this research. I would like also to extend my
appreciation to our industrial partners, Transpo Industries INC., Euclid Chemical, and
Grupo Cementos de Chihuahua (GCC) USA, for providing materials needed for this
investigation. Special thanks to Mr. Mike Stenko, Transpo Industries INC., for his
unconditional support to this research.

v
An Engineered Fit-For-Purpose Polymer Nanocomposite Seal Repair Material for
Wellbores
BY
Moneeb Genedy
B.S. Civil Engineering, Alexandria University, Egypt, 2008
M.S. Civil Engineering, University of New Mexico, USA, 2014
Ph.D. Engineering, University of New Mexico, USA, 2018
ABSTRACT
Seal integrity of wellbores has become of significant interest due to repeated
leakage and spill incidents occurring worldwide that jeopardize both human health and the
environment in addition to causing significant economic burden. This is attributed to the
fact that wellbores intersecting geographical formations contain potential leakage
pathways. The cement-steel and cement-rock formation interfaces are recognized as two
critical leakage pathways.
A seal repair material that has good bond strength with both steel and rock
formations in addition to the ability to completely fill thin microcracks is needed to restore
the seal integrity of wellbores. In this research, engineered polymer nanocomposites are
proposed for use as seal repair materials for wellbores. Novolac epoxy polymer
nanocomposites (PNCs) show more than 200% and 250% higher bond strength with steel
and shale, respectively, when compared with microfine cement. In addition, it was found
that Novolac epoxy PNCs have up to 545% and 761% higher displacement at peak load
and toughness than microfine cement respectively. Moreover, Novolac epoxy PNCs was
able to completely fill 800 m microcracks that microfine cement were not able to

vi
completely fill. Microstructural investigations using Fourier-Transform Infrared
spectroscopy (FTIR) and Dynamic Mechanical Analysis (DMA) showed that incorporating
aluminum nanoparticles (ANPs) in Novolac epoxy PNCs interrupted the polymerization
process, which allowed free epoxy groups to improve the bond strength of PNCs with both
shale and steel surfaces.
On the other hand, penetrability calculations based on contact angle and surface
tension of seal repair materials showed that nanomodified methyl methacrylate (NM-
MMA) incorporating 0.5 wt.% ANPs has higher potential to penetrate thin microannuli
than microfine cement and Novolac epoxy PNCs. NM-MMA was able to seal thin
microcracks as small as 30 m while microfine cement has very limited penetration in such
small microcracks. Furthermore, NM-MMA showed more than 1000%, 460%, and 8000%
higher apparent bond strength, displacement at failure, and toughness than microfine
cement respectively. Microstructural investigation using XRD analysis showed that
incorporating ANPs in MMA increased the degree of polymer crystallization enabling
significant improvement in polymer ductility, toughness, and reduced creep compliance.
A performance study of seal repair materials was evaluated based on their
efficiency to seal the cement-steel interface, their ability to withstand cyclic casing
pressure, and their ability to withstand harsh environmental conditions. The results showed
that microfine cement efficiency was limited to 24%. On the other hand, NM-MMA was
able to achieve seal efficiency as high as 103%. Moreover, NM-MMA was able to
withstand casing pressure cycles two orders of magnitude higher than microfine cement.
Finally, a durability investigation using a weight loss study showed that all PNC seal repair
materials have higher resistance to harsh environmental conditions than microfine cement.

vii
Preface
During the course of this PhD (2014-Now) the following papers have been published:
Genedy, M, Stenko, M, Stormont, J, Matteo, E.N., Dewers, T, Reda Taha, M.M. (2017).
Fit-for-purpose Methyl Methacrylate (MMA) polymer nanocomposite for
wellbore seal repair. Patent Filed, April 2018.
Genedy, M., Matteo, E., Stenko, M., Stormont, J., Reda Taha, M. M. Nanomodified
Methyl Methacrylate Polymer for Repair of Microscale Defects in Wellbore
Systems, Journal of Materials in Civil Engineering, Under Review.
Garner, A., Genedy, M., Kandil, U., & Taha, M. R. (2018). Controlling off-axis stiffness
and stress-relaxation of carbon fiber-reinforced polymer using alumina
nanoparticles. Journal of Composite Materials, 52(18), 2483-2491.
Genedy, M., & Taha, M. M. R. (2018). Examining Alternative Strengthening Method for
RC T-Beams Using CFRP and UHPC. Special Publication, 322, 10.1-10.14.
Genedy, M., Kandil, U. F., Matteo, E. N., Stormont, J., & Taha, M. M. R. (2017). A new
polymer nanocomposite repair material for restoring wellbore seal
integrity. International Journal of Greenhouse Gas Control, 58, 290-298.
Genedy, M., Chennareddy, R., Soliman, E. M., Kandil, U. F., & Taha, M. M. R. (2017).
Improving shear strength of bolted joints in pultruded glass fiber reinforced
polymer composites using carbon nanotubes. Journal of Reinforced Plastics and
Composites, 36(13), 958-971.
Douba, A. E. M., Genedy, M. G., Tarefder, R., & Taha, M. R. (2016) Improving Fracture
Toughness of Polymer Concrete Using MWCNTs. Proceedings of the 9th
International Conference on Fracture Mechanics of Concrete and Concrete
Structures.
Chennareddy, R., Genedy, M., Reda Taha, M. M., Tuwair, H., Elgawady, M. (2016).
Improving UV Radiation Resistance of FRP Using Carbon Nanotubes.

viii
Proceedings of 7th International Conference on Advanced Composite Materials
in Bridges and Structures, Vancouver, Canada.
Douba, A., Genedy, M., Matteo, E., Stormont, J., & Taha, M. R. (2015). Apparent Vs.
True Bond Strength of Steel and PC with Nanoalumina. Advanced Materials
Research, 1129.
Soliman, E., Genedy, M., Reda Taha, M. M. (2015). Short FRP Lap Splices Made Possible
Using Nanomaterials. Proceedings of 13th International Structural Engineering
Conference, Ain Shams University, Cairo, Egypt.
Genedy, M., Daghash, S., Soliman, E., & Taha, M. M. R. (2015). Improving Fatigue
Performance of GFRP Composite Using Carbon Nanotubes. Fibers, 3(1), 13-29.
Garner, A., Genedy, M., Tarefder, R., & Taha, M. R. (2015, May). Monitoring Fatigue
Damage in PC using Carbon Nanotubes. In Advanced Materials Research (Vol.
1129, pp. 94-101). Trans Tech Publications.
Genedy, M., Stormont, J., Matteo, E., & Taha, M. R. (2014). Examining epoxy-based
nanocomposites in wellbore seal repair for effective CO2 sequestration. Energy
Procedia, 63, 5798-5807.
Genedy, M., Daghash, S., Soliman, E., & Reda Taha, M. (2014). Improving Tensile
Strength of GFRP Using Carbon Nanotubes. in The 7th International Conference
on FRP Composites in Civil Engineering. 2014: Vancouver, Canada.
Reda Taha, M. M., Taha, E., Genedy, M. (2014). Monitoring Fatigue Damage Propagation
in GFRP Using Carbon Nanotubes. in The 7th International Conference on FRP
Composites in Civil Engineering. 2014: Vancouver, Canada.
Genedy, M., Begaye, M. Reda Taha, M. M. (2014). Upgrading GFRP Bolted Lap Joint
Capacity Using Carbon Nanotubes. Proceedings of American Society for
Composites 29th Technical Conference, 16th US-Japan Conference on Composite
Materials, San Diego, USA.
Genedy, M., Kim, J. J., Reda Taha, M. M., (2014). Innovative Strengthening of RC beams
using CFRP-UHPC composite. Proceedings of 7th International Conference on
FRP Composites in Civil Engineering (CICE 2014), Vancouver, Canada.

ix
Table of Contents
List of Figures ....................................................................................................... xii
List of Tables ...................................................................................................... xvii
Chapter 1. Introduction ........................................................................................ 1
1.1 Motivation and problem statement ............................................................ 1
1.2 Objective and contribution ........................................................................ 2
1.3 Dissertation layout..................................................................................... 6
Chapter 2. Literature Review ............................................................................... 7
2.1 Wellbore integrity ..................................................................................... 7
2.2 Evaluation of wellbores seal integrity ....................................................... 8
2.3 Restoring wellbore seal integrity............................................................... 9
2.4 Cement-steel interface ............................................................................. 12
2.5 Cement-rock formation interface ............................................................ 14
2.6 Polymer nanocomposites......................................................................... 15
Chapter 3. Experimental Methods and Results .................................................. 17
3.1 Material ................................................................................................... 17
3.1.1 Polymers ............................................................................................ 17
3.1.2 Cement .............................................................................................. 17
3.1.3 Shale .................................................................................................. 18
3.1.4 Steel ................................................................................................... 18

x
3.1.5 Filler .................................................................................................. 19
3.1.6 Nanomaterials.................................................................................... 19
3.1.7 Polymer nanocomposite preparation ................................................. 22
3.1.8 Polymer cement nanocomposite preparation (PCNC) ...................... 23
3.2 Phase I: Steel-cement interface ............................................................... 26
3.2.1 Bond strength with steel surface ....................................................... 26
3.2.2 Flowability of Polymer Cement Nanocomposites ............................ 30
3.2.3 Extended investigation of Novolac epoxy PCNCs incorporating
ANPs 32
3.3 Phase II: Cement-rock formation interface ............................................. 36
3.3.1 Push-out test ...................................................................................... 36
3.3.2 Viscosity of Polymer Nanocomposites ............................................. 43
3.3.3 Microscopic investigation ................................................................. 44
3.3.4 Fourier Transform Infrared (FTIR) Analysis .................................... 47
3.3.5 Dynamic Mechanical Analyses (DMA) ............................................ 49
3.4 Phase III: Penetrability study .................................................................. 54
3.4.1 Physical properties of seal repair material ........................................ 54
3.4.2 Bond strength .................................................................................... 60
3.4.3 Microscopic investigation ................................................................. 64
3.4.4 Dynamical Mechanical Analysis (DMA) .......................................... 66

xi
3.4.5 X-ray Diffraction (XRD) ................................................................... 70
3.5 Phase IV: Seal performance investigation .............................................. 73
3.5.1 Integrated seal testing ........................................................................ 73
3.5.2 Durability study ................................................................................. 88
Chapter 4. Conclusions ...................................................................................... 92
4.1 Conclusions ............................................................................................. 92
4.2 Limitations and future work .................................................................... 97
4.2.1 Bond strength .................................................................................... 97
4.2.2 Chemical exposure and environmental conditions............................ 97
4.2.3 Integrated seal testing ........................................................................ 97
4.2.4 Finite Element (FE) modeling ........................................................... 98
References ........................................................................................................... 100
Appendix A: Interface Characterization Readings ............................................. 113

xii
List of Figures
FIGURE 1.1: SUMMARY OF THE DESIRED PROPERTIES OF WELLBORE SEAL REPAIR MATERIAL. ......................... 3
FIGURE 1.2: FLOWCHART SUMMARIZES THE ELIMINATION PROCESS ADOPTED IN THE INVESTIGATION. ........... 4
FIGURE 2.1: SCHEMATIC REPRESENTATION OF ZONAL ISOLATION AND POTENTIAL LEAKAGE PATHWAYS
(CELIA ET AL. 2005). .............................................................................................................................. 7
FIGURE 2.2: RESTORING WELLBORE INTEGRITY BY INSTALLING AN ADDITIONAL CASING. ............................. 10
FIGURE 2.3: INJECTION PROCESS OF SEAL REPAIR MATERIAL: (A) FILL BOTTOM HOLE WITH HIGH DENSITY
BRINE UP TO 2-3 M BELOW THE INJECTION LEVEL, (B) FILL 5-10 M OF CASING WITH SEAL REPAIR
MATERIAL, (C) APPLY PRESSURE TO PUSH SEAL REPAIR MATERIAL INTO THE MICROCRACKS, (D)
MICROANNULUS AT CEMENT-ROCK INTERFACE BEFORE INJECTING SEAL REPAIR MATERIAL, AND (E)
SEALED MICROANNULUS AT CEMENT-ROCK INTERFACE. ..................................................................... 12
FIGURE 3.1: (A) CORING PROCESS OF MANCOS SHALE AND (B) MANCOS SHALE CORE. .................................. 18
FIGURE 3.2: TRANSMISSION ELECTRON MICROSCOPE (TEM) IMAGES OF MWCNTS. .................................... 20
FIGURE 3.3: STRUCTURE OF A SILICA TETRAHEDRAL SHEET (UP), AND AN ALUMINA OCTAHEDRAL SHEET
(DOWN) (MCLAREN AND CAMERON 1996). .......................................................................................... 21
FIGURE 3.4: TRANSMISSION ELECTRON MICROSCOPE (TEM) IMAGES OF ANPS. ............................................ 22
FIGURE 3.5: SCHEMATIC SHOWING THE STEPS TO PREPARE POLYMER NANOCOMPOSITES. ............................. 23
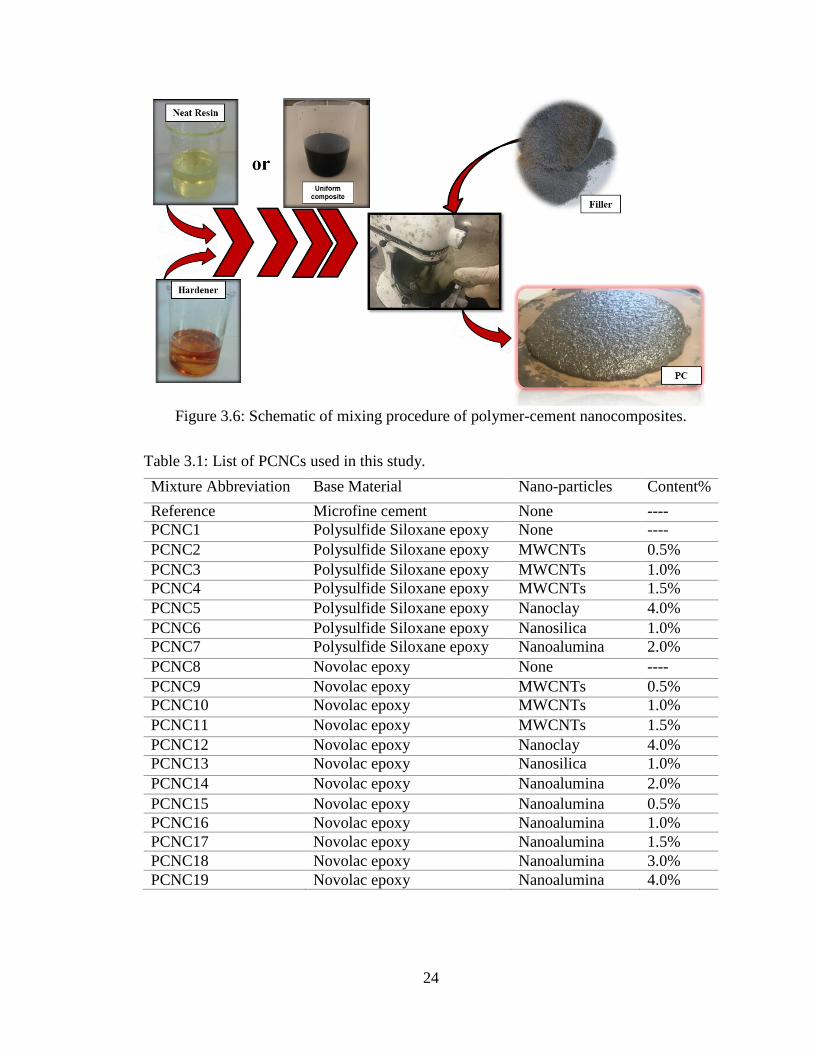
FIGURE 3.6: SCHEMATIC OF MIXING PROCEDURE OF POLYMER-CEMENT NANOCOMPOSITES. ......................... 24
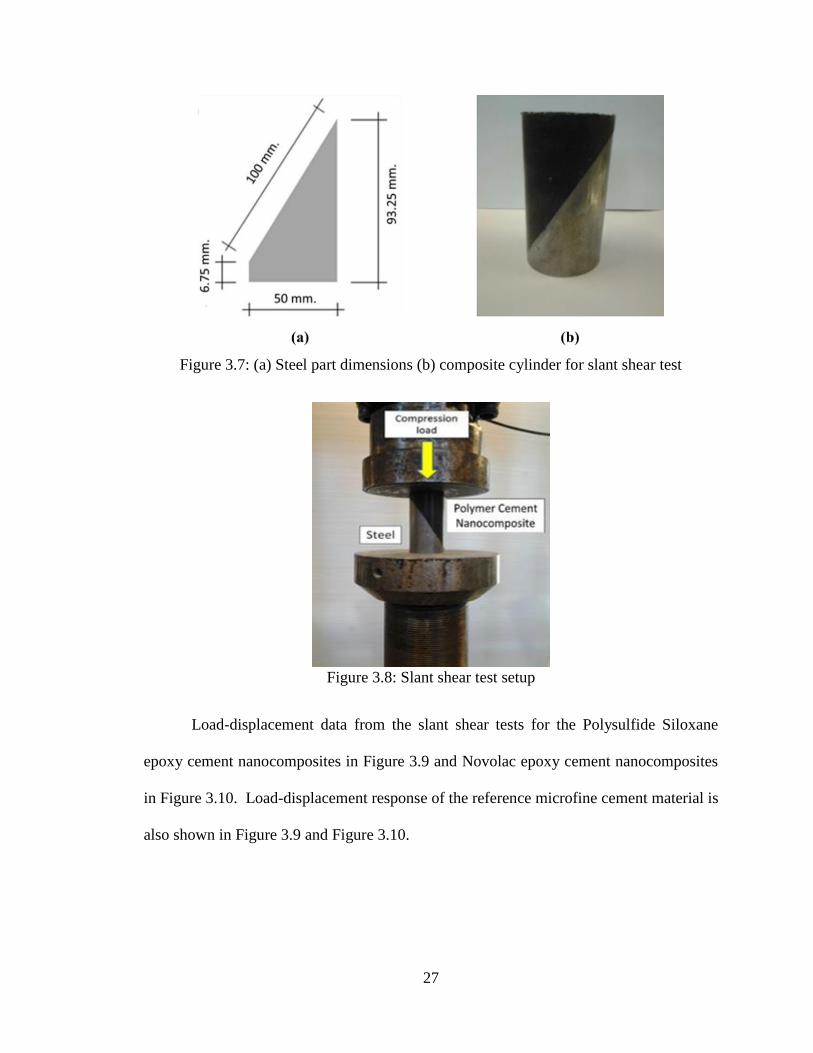
FIGURE 3.7: (A) STEEL PART DIMENSIONS (B) COMPOSITE CYLINDER FOR SLANT SHEAR TEST ....................... 27
FIGURE 3.8: SLANT SHEAR TEST SETUP .......................................................................................................... 27
FIGURE 3.9: LOAD-DISPLACEMENT CURVES OF REFERENCE MICROFINE CEMENT MATERIAL AND POLYSULFIDE
SILOXANE EPOXY CEMENT NANOCOMPOSITES ...................................................................................... 28
FIGURE 3.10: LOAD-DISPLACEMENT CURVES OF REFERENCE MICROFINE CEMENT MATERIAL AND NOVOLAC
EPOXY CEMENT NANOCOMPOSITES. ...................................................................................................... 28
FIGURE 3.11: MEAN BOND STRENGTH FOR REFERENCE MICROFINE CEMENT MATERIAL AND ALL FOURTEEN
POLYMER CEMENT NANOCOMPOSITES. ................................................................................................. 30
FIGURE 3.12: (A) FILLING THE FLOWABILITY CONE (B) TAKING READINGS USING TEST CALIBER. .................. 31

xiii
FIGURE 3.13: FLOWABILITY RESULTS FOR THE REFERENCE MICROFINE CEMENT MATERIAL AND ALL
FOURTEEN POLYMER NANOCOMPOSITES. .............................................................................................. 32
FIGURE 3.14: MEAN BOND STRENGTH FOR ALL NOVOLAC EPOXY PCNC....................................................... 33
FIGURE 3.15: FLOWABILITY RESULTS FOR ALL NOVOLAC EPOXY PCNC. ...................................................... 34
FIGURE 3.16: SCHEMATIC OF THE PUSH-OUT TEST SPECIMENS FOR (A) FIRST SET OF SPECIMENS AND (B)
SECOND SET OF SPECIMENS. .................................................................................................................. 37
FIGURE 3.17: PLACING SEAL REPAIR MATERIAL AT THE CEMENT-SHALE MICROANNULUS. ............................ 37
FIGURE 3.18: (A) PUSH-OUT TEST SETUP AND (B) PUSH-OUT TEST SCHEMATIC. ............................................. 38
FIGURE 3.19: MEDIAN LOAD-DISPLACEMENT CURVES OF SPECIMENS SEALED WITH MICROFINE CEMENT AND
EPOXY-BASED MATERIALS. ................................................................................................................... 39
FIGURE 3.20: THE BOND STRENGTH OF THE REFERENCE CASE AND ALL SEAL REPAIR MATERIALS. ................ 40
FIGURE 3.21: DISPLACEMENT AT PEAK LOAD OF THE MICROFINE CEMENT AND ALL ANPS-EPOXY
NANOCOMPOSITES ................................................................................................................................ 42
FIGURE 3.22: TOUGHNESS FOR THE MICROFINE CEMENT AND ALL ANPS-EPOXY NANOCOMPOSITES ............. 42
FIGURE 3.23: ROTATIONAL VISCOMETER....................................................................................................... 43
FIGURE 3.24: COMPARISON OF THE VISCOSITY BETWEEN POLYMER NANOCOMPOSITES INCORPORATING 0%
(NEAT) 0.25%, 0.5%, AND 1.0% ANPS AND MICROFINE CEMENT. ....................................................... 44
FIGURE 3.25: MICROSCOPIC IMAGES OF SHALE-MICROFINE CEMENT INTERFACE WITH TWO DIFFERENT LEVELS
OF MAGNIFICATION SHOWING AREAS WITH GAP BETWEEN MICROFINE CEMENT AND SHALE. ................ 45
FIGURE 3.26: MICROSCOPIC IMAGES OF SHALE-NEAT EPOXY INTERFACE WITH TWO DIFFERENT LEVELS OF
MAGNIFICATION SHOWING THE ABILITY OF THE NEAT EPOXY SEAL REPAIR MATERIAL TO COMPLETELY
FILL THE GAP AT THE SHALE-CEMENT INTERFACE. ................................................................................ 46
FIGURE 3.27: MICROSCOPIC IMAGES OF SHALE-1.0% ANPS-EPOXY POLYMER NANOCOMPOSITE INTERFACE
WITH TWO DIFFERENT LEVELS OF MAGNIFICATION SHOWING THE ABILITY OF THE EPOXY SEAL REPAIR
MATERIAL TO COMPLETELY FILL THE GAP AT THE SHALE-CEMENT INTERFACE. .................................... 46
FIGURE 3.28: PERKINELMER FTIR MACHINE. ................................................................................................ 47
xiv
FIGURE 3.29: FTIR SPECTRA OF NEAT EPOXY AND EPOXY INCORPORATING 0.5 AND 1.0 % ANPS SHOWING
THE SIGNIFICANT CHANGES APPEARING IN THE SPECTRA USING ANPS COMPARED TO THE NEAT EPOXY.
............................................................................................................................................................. 48
FIGURE 3.30: DMA Q800 WITH 3-POINT BENDING CLAMP. ............................................................................ 51
FIGURE 3.31: XLINK: A MEASURE OF THE DEGREE OF CROSSLINKING FOR NEAT EPOXY, 0.25% ANPS-EPOXY
NANOCOMPOSITE, 0.5% ANPS-EPOXY NANOCOMPOSITE, AND 1.0% ANPS-EPOXY NANOCOMPOSITE. 52
FIGURE 3.32: THE RELATION BETWEEN THE BOND STRENGTH AND THE CONTENT OF ANPS IN POLYMER
NANOCOMPOSITES. ............................................................................................................................... 53
FIGURE 3.33: VISCOSITY MEASUREMENTS OF ALL SEAL REPAIR MATERIALS: LOG SCALE IS USED TO ENABLE
DISPLAY WITH ORDER OF MAGNITUDE CHANGE IN VISCOSITY. .............................................................. 55
FIGURE 3.34: KRUSS FORCE TENSIOMETER K100 MACHINE. ........................................................................ 56
FIGURE 3.35: SURFACE TENSION SEAL REPAIR MATERIALS: % ABOVE THE BARS REPRESENTS THE DIFFERENCE
OF PENETRABILITY INDEX OF SEAL REPAIR MATERIAL COMPARED WITH MICROFINE CEMENT. ............. 57
FIGURE 3.36: CONTACT ANGLE MEASUREMENTS FOR (A) MICROFINE CEMENT, (B) NOVOLAC EPOXY, (C)
MMA, AND (D) NM-MMA. ................................................................................................................. 58
FIGURE 3.37: CAPILLARY PRESSURE OF ALL SEAL REPAIR MATERIALS IN A 30 M MICROCRACK; % ABOVE
THE BARS REPRESENTS THE DIFFERENCE OF CAPILLARY PRESSURE OF SEAL REPAIR MATERIAL
COMPARED WITH MICROFINE CEMENT. ................................................................................................. 59
FIGURE 3.38: SCHEMATIC OF PUSH-OUT TEST SPECIMEN FOR 30 M MICROCRACKS. ..................................... 60
FIGURE 3.39: MEDIAN LOAD-DISPLACEMENT CURVES OF SPECIMENS SEALED WITH MICROFINE CEMENT,
NOVOLAC EPOXY, MMA, AND NM-MMA POLYMER NANOCOMPOSITE. .............................................. 61
FIGURE 3.40: THE APPARENT BOND STRENGTH OF ALL SEAL REPAIR MATERIALS; % ABOVE THE BARS
REPRESENTS THE DIFFERENCE OF BOND STRENGTH OF SEAL REPAIR MATERIAL COMPARED WITH
MICROFINE CEMENT CURRENTLY USED IN THE FIELD. ........................................................................... 62
FIGURE 3.41: DISPLACEMENT AT FAILURE OF ALL SEAL REPAIR MATERIALS; % ABOVE THE BARS REPRESENTS
THE DIFFERENCE OF BOND STRENGTH OF SEAL REPAIR MATERIAL COMPARED WITH MICROFINE CEMENT.
............................................................................................................................................................. 63

xv
FIGURE 3.42: TOUGHNESS OF ALL SEAL REPAIR MATERIALS; % ABOVE THE BARS REPRESENTS THE
DIFFERENCE OF BOND STRENGTH OF SEAL REPAIR MATERIAL COMPARED WITH MICROFINE CEMENT. .. 64
FIGURE 3.43: MICROSCOPIC IMAGES OF CEMENT-SHALE INTERFACE SEALED WITH MICROFINE CEMENT WITH
TWO DIFFERENT SIDES SHOWING DEPTH OF MICROFINE CEMENT PENETRATION OF CEMENT PASTE AND
SHALE SIDES. ........................................................................................................................................ 65
FIGURE 3.44: MICROSCOPIC IMAGES OF CEMENT-SHALE INTERFACE SEALED WITH NOVOLAC EPOXY WITH
TWO DIFFERENT LEVELS OF MAGNIFICATION SHOWING GABS IN SEALED INTERFACE. RIGHT PHOTO AT
HIGH MAGNIFICATION SHOWS THE INABILITY OF EPOXY TO PENETRATE 30 M MICROCRACKS. ........... 65
FIGURE 3.45: MICROSCOPIC IMAGES OF CEMENT-SHALE INTERFACE SEALED WITH NM-MMA WITH TWO
DIFFERENT LEVELS OF MAGNIFICATION SHOWING THE ABILITY OF THE NM-MMA SEAL REPAIR
MATERIAL TO COMPLETELY FILL THE GAP AT THE SHALE-CEMENT INTERFACE. RIGHT PHOTO PROVES
THE ABILITY OF NM-MMA TO FILL THE MICROCRACKS AND INFILTRATE BOTH SHALE AND CEMENT
PASTE SIDES. ......................................................................................................................................... 66
FIGURE 3.46: THE VISCOELASTIC BEHAVIOR OF MMA AND NM-MMA OBTAINED FROM CREEP TEST. ......... 67
FIGURE 3.47: CREEP COMPLIANCE OF MMA AND NM-MMA CALCULATED FROM EQUATION 3.7. ............... 68
FIGURE 3.48: THE ESTIMATED MODULUS OF ELASTICITY OF NM-MMA USING MODIFIED RULE OF MIXTURE
AND HALPIN–TSAI METHOD COMPARED TO THE MEASURED VALUE; % ABOVE THE BARS REPRESENTS
THE DIFFERENCE OF ESTIMATED MODULUS OF ELASTICITY COMPARED WITH MEASURED VALUE.. ....... 70
FIGURE 3.49: (A) RIGAKU SMARTLAB XRD MACHINE AND (B) MMA SAMPLE ON XRD SAMPLE HOLDER. ... 71
FIGURE 3.50: XRD SCANS FOR BOTH MMA AND NM-MMA SPECIMENS. ..................................................... 72
FIGURE 3.51: INTEGRATED SEAL TEST SPECIMEN. .......................................................................................... 76
FIGURE 3.52: DEBONDING STEEL CASING FROM THE CEMENT SHEATH USING DRY ICE. .................................. 77
FIGURE 3.53: SCHEMATIC OF SEAL REPAIR MATERIAL INJECTION SETUP. ....................................................... 77
FIGURE 3.54: SCHEMATIC OF INTEGRATED SEAL TEST SPECIMEN. .................................................................. 78
FIGURE 3.55: SCHEMATIC OF THE CEMENT-STEEL INTERFACE CHARACTERIZATION SETUP. ........................... 79
FIGURE 3.56: SEAL EFFICIENCY OF DIFFERENT SEAL REPAIR MATERIALS USED FOR RESTORING WELLBORE
SEAL INTEGRITY. .................................................................................................................................. 82
FIGURE 3.57: INTEGRATED SEAL TEST SETUP. ................................................................................................ 83

xvi
FIGURE 3.58: NUMBER OF CASING PRESSURE CYCLES APPLIED UNTIL FAILURE OF SEAL INTEGRITY OF SEALED
SPECIMENS. ........................................................................................................................................... 84
FIGURE 3.59: POST CYCLIC TEST INTEGRATED SEAL SPECIMEN SEALED WITH MMA SHOWING A SINGLE
LONGITUDINAL CRACK IN THE CEMENT SHEATH. .................................................................................. 85
FIGURE 3.60: POST CYCLIC TEST INTEGRATED SEAL SPECIMEN SEALED WITH NM-MMA SHOWING TWO
LONGITUDINAL CRACKS IN THE CEMENT SHEATH. ................................................................................ 85
FIGURE 3.61: CHANGE OF SEAL EFFICIENCY OF SEAL REPAIR MATERIALS WITH NUMBER OF CASING PRESSURE
CYCLES. ................................................................................................................................................ 87
FIGURE 3.62: EFFECT OF CASING PRESSURE CYCLES ON CEMENT-STEEL INTERFACE SEALED WITH NM-MMA:
(A) PRIOR TO APPLYING CASING PRESSURE, (B) MAXIMUM CASING PRESSURE APPLIED, AND (C) CASING
PRESSURE RELEASED. ........................................................................................................................... 88
FIGURE 3.63: WEIGHT LOSS TEST (A) SPECIMEN DIMENSIONS AND (B) SPECIMENS IN DIFFERENT CHEMICALS.
............................................................................................................................................................. 89
FIGURE 3.64: HIGH TEMPERATURE AND PRESSURE REACTOR SETUP. ............................................................. 90
FIGURE 3.65: MICROFINE CEMENT FRACTIONS FALLING APART DUE TO HARSH ENVIRONMENTAL CONDITIONS.
............................................................................................................................................................. 91
FIGURE 4.1: SCHEMATIC OF SEALING INTEGRATED SEAL SPECIMEN THROUGH PERFORATION IN THE STEEL
CASING. ................................................................................................................................................ 98
FIGURE 4.2: BILINEAR SHEAR STRESS-SLIP INTERFACE INTERACTION MODEL. ............................................... 99

xvii
List of Tables
TABLE 3.1: LIST OF PCNCS USED IN THIS STUDY. .......................................................................................... 24
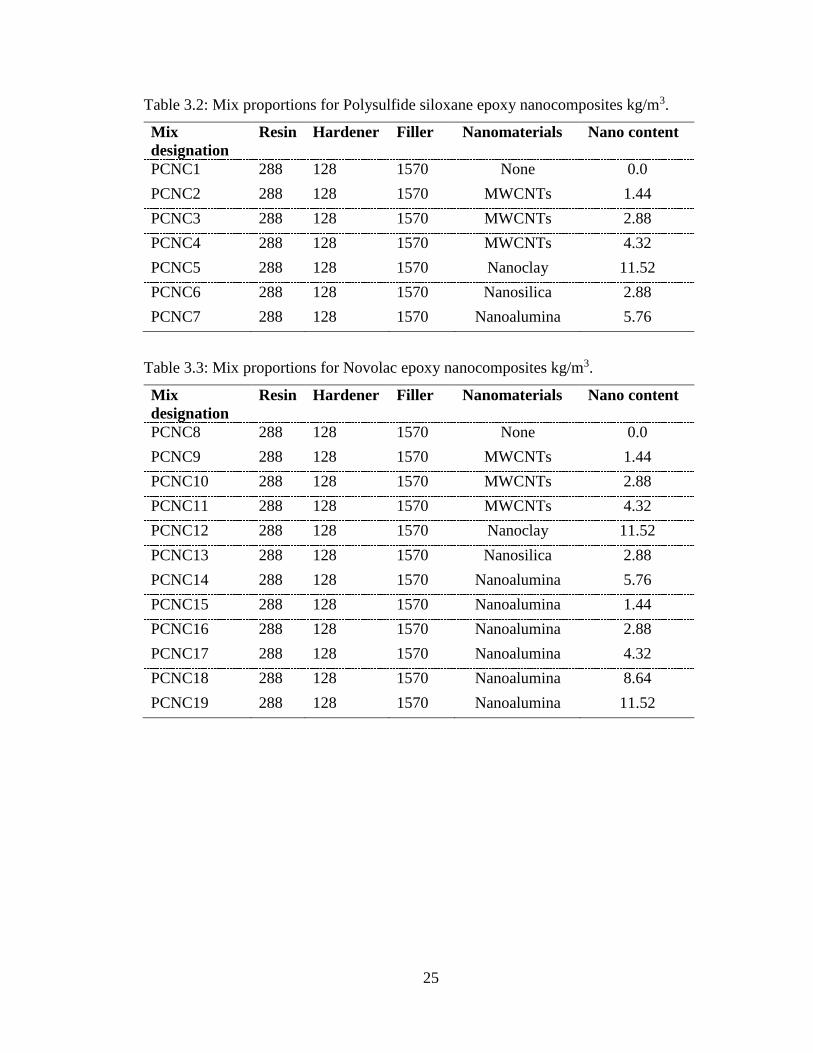
TABLE 3.2: MIX PROPORTIONS FOR POLYSULFIDE SILOXANE EPOXY NANOCOMPOSITES KG/M3. .................... 25
TABLE 3.3: MIX PROPORTIONS FOR NOVOLAC EPOXY NANOCOMPOSITES KG/M3. .......................................... 25
TABLE 3.4: THE BOND STRENGTH OF THE REFERENCE CASE AND ALL SEAL REPAIR MATERIALS. ................... 40
TABLE 3.5: SHEAR STIFFNESS, DISPLACEMENT AT PEAK LOAD, AND TOUGHNESS FOR ALL SEAL REPAIR
MATERIALS. .......................................................................................................................................... 41
TABLE 3.6: MIXING PROPORTIONS OF CEMENT SHEATH [KG/M3]. ................................................................... 76
TABLE 3.7: PERMEABILITY OF INTACT, DEBONDED, AND SEALED INTEGRATED SEAL SPECIMENS [M2]. .......... 81
TABLE 3.8: HYDRAULIC APERTURE OF INTACT, DEBONDED, AND SEALED INTEGRATED SEAL SPECIMENS [M].
............................................................................................................................................................. 81
TABLE 3.9: WEIGHT LOSS RESULTS FOR SELECTED SEAL REPAIR MATERIALS AND MICROFINE CEMENT [%]. . 90
TABLE 0.1: INTERFACE CHARACTERIZATION READINGS OF REFERENCE INTACT SPECIMEN. ......................... 113
TABLE 0.2: INTERFACE CHARACTERIZATION READINGS OF MICROFINE CEMENT SEALED SPECIMEN. ........... 113
TABLE 0.3: INTERFACE CHARACTERIZATION READINGS OF NOVOLAC EPOXY SEALED SPECIMEN. ............... 113
TABLE 0.4: INTERFACE CHARACTERIZATION READINGS OF NM-NOVOLAC EPOXY SEALED SPECIMEN. ........ 114
TABLE 0.5: INTERFACE CHARACTERIZATION READINGS OF MMA SEALED SPECIMEN. ................................. 114
TABLE 0.6: INTERFACE CHARACTERIZATION READINGS OF NM-MMA SEALED SPECIMEN. ......................... 114

1
Chapter 1. Introduction
1.1 Motivation and problem statement
There are millions of wellbores across the globe used for oil and gas production
and storage or abandoned wells used in CO2 sequestration process. Microscale defects
(microcracks) that develop at the cement-steel and cement-rock formation, often referred
to as microannuli, could jeopardize the seal integrity of wellbores. Loss in the seal integrity
of wellbores could result in major leakage or spill incidents. Such incidents would have
significant effects on both human health and the environment in addition to causing
significant economic burden. Previous studies show that a microannulus as small as 30 m
is sufficient to jeopardize wellbore seal integrity. To restore wellbore seal integrity, the
sealing technique usually used attempts to force seal repair material into the microcracks
at the cement-steel or cement-rock interfaces through perforation in the steel casing or at
the steel casing shoe.
It is well accepted in the oil and gas community that wellbore integrity is strongly
dependent on the quality of the cementing material in the annulus, and the quality of bond
between the cement sheath and the rock formation on one side and between the cement
sheath and the steel casing on the other side. Thus, seal repair material with good durability
and bond strength with both steel and rock formations is needed to ensure acceptable seal
integrity of cement-steel and cement-rock interfaces. In addition, the seal integrity of
cement-steel and cement-rock interfaces depends on the ability of the seal repair material
to completely fill microcracks at the interfaces, the impermeability of the seal repair
material, its chemical resistance, and its ability to survive harsh wellbore conditions.

2
1.2 Objective and contribution
Wellbore seal integrity was the focus of several research studies during the past two
decades. The vast majority of recent research discusses methods and techniques for
integrity monitoring and evaluation (Crow et al. 2010, De Simone, Pereira, and Roehl
2017, Haagsma et al. 2017, Li et al. 2017, Xue and Hashimoto 2017, Alberty and Yao
2018, Chen et al. 2018, Davis 2018, Fan, Li, and Liu 2018, Phillips et al. 2018). Other
studies investigated new cementitious materials for newly constructed wellbores to
improve the wellbore integrity or have the ability of self-healing (Benge 2009, Guthrie et
al. 2018, Guo et al. 2018). Very few research studies were initiated to study the ability of
restoring the seal integrity of existing wellbores (Phillips et al. 2018, Tavassoli et al. 2018).
However, no comprehensive study of restoring wellbore seal integrity has been conducted.
In this study, a comprehensive investigation of the fundamental science and
engineering methods to develop an engineered fit-for-purpose polymer nanocomposite seal
repair material to restore wellbore seal integrity is developed to answer three main
scientific questions:
1- What are the desired properties of wellbore seal repair material?
2- What is the current state-of-the-art (performance and limitations of common
seal repair material)?
3- What is the performance of engineered seal repair materials compared with
common seal repair material?
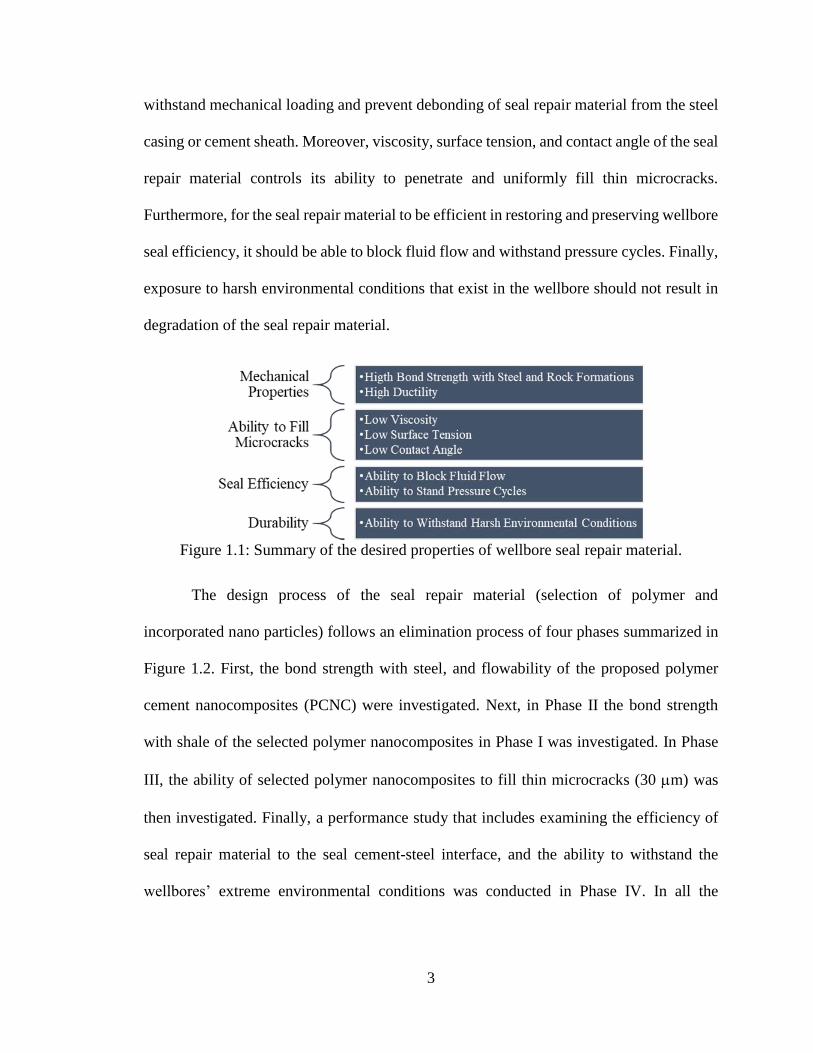
The desired properties of wellbore seal repair material are summarized in Figure
1.1. High bond strength and ductility are required to allow the seal repair material to
3
withstand mechanical loading and prevent debonding of seal repair material from the steel
casing or cement sheath. Moreover, viscosity, surface tension, and contact angle of the seal
repair material controls its ability to penetrate and uniformly fill thin microcracks.
Furthermore, for the seal repair material to be efficient in restoring and preserving wellbore
seal efficiency, it should be able to block fluid flow and withstand pressure cycles. Finally,
exposure to harsh environmental conditions that exist in the wellbore should not result in
degradation of the seal repair material.
Figure 1.1: Summary of the desired properties of wellbore seal repair material.
The design process of the seal repair material (selection of polymer and
incorporated nano particles) follows an elimination process of four phases summarized in
Figure 1.2. First, the bond strength with steel, and flowability of the proposed polymer
cement nanocomposites (PCNC) were investigated. Next, in Phase II the bond strength
with shale of the selected polymer nanocomposites in Phase I was investigated. In Phase
III, the ability of selected polymer nanocomposites to fill thin microcracks (30 m) was
then investigated. Finally, a performance study that includes examining the efficiency of
seal repair material to the seal cement-steel interface, and the ability to withstand the
wellbores’ extreme environmental conditions was conducted in Phase IV. In all the

4
investigation steps, the proposed seal repair material was compared to microfine cement as
it is the most common seal repair material used in wellbores (Harris et al. 1992).
Figure 1.2: Flowchart summarizes the elimination process adopted in the investigation.
Slant shear test shows that Novolac epoxy always has higher bond strength with
steel surfaces than Polysulfide siloxane epoxy. In addition, incorporating Aluminum

5
nanoparticles (ANPs) results in the highest improvement in bond strength of Novolac
epoxy with steel surfaces (Genedy et al. 2017, Douba et al. 2017). Flowability test shows
that incorporating nanoparticles results in loss in flowability of seal repair material
(Genedy et al. 2017). However, incorporating 2.0 wt.% ANPs reduces the flowability of
Novolac epoxy PCNC by only 8%. Moreover, push-out test shows that Novolac epoxy
incorporating ANPs has 350% higher bond strength with shale than microfine cement
(Genedy et al. 2014). Fourier Transform Infrared (FTIR) analysis and Dynamic Mechanical
Analyses (DMA) investigations show that incorporating ANPs in Novolac epoxy decreases
the degree of crosslinking, which improves the bond strength of the seal repair material
with shale. Microscopic investigation shows that Novolac epoxy polymer nanocomposites
were able to completely fill relatively large (800 m) microcracks.
Although Novolac epoxy showed superior performance in sealing relatively large
microcracks, it failed to fill thin microcracks (as small as 30 m). On the other hand,
viscosity, surface tension, and contact angle investigations show that methyl methacrylate
(MMA) and nanomodified MMA (NM-MMA) have higher potential to fill such small
microcracks, which was verified using microscopic investigation. Push-out test shows that
incorporating ANPs in MMA has no significant effect on the bond strength. However, it
shows more than 120% improvement in ductility. X-ray Diffraction (XRD) analysis shows
that incorporating ANPs increases the degree of polymer crystallization of MMA resulting
in more ductile polymer (Genedy et al. 2017).
Integrated testing shows that polymer nanocomposites are more efficient in sealing
microannuli at the cement-steel interface. Incorporating ANPs improves the performance
of polymer seal repair material. Polymer nanocomposite seal repair material was able to

6
withstand higher numbers of casing pressure cycles than microfine cement. In addition, the
durability study shows that polymer nanocomposites have more resistance to extreme
environmental conditions than microfine cement.
1.3 Dissertation layout
The dissertation has a total of 4 chapters. Literature review of wellbores and
wellbores seal integrity is presented in Chapter 2. Chapter 2 also includes a brief literature
review on the use of polymers and polymer nanocomposites in various applications.
Experimental methods and results are presented in Chapter 3. The dissertation has deviated
from the traditional layout that separates experimental methods from results due to the
sequential structure of the research that adopted an elimination process of investigated seal
repair materials. Chapter 3 begins with a detailed description of the materials used in the
research in addition to the preparation methods and techniques of polymer nanocomposites
and polymer-cement nanocomposites. This is followed by the four phases of the seal repair
material investigation. Phase I discusses the bond strength with steel surfaces and the
flowability of proposed seal repair materials. Bond strength of the proposed seal repair
material with shale in addition to microscopic and microstructures investigations are
discussed in Phase II. The ability of the seal repair material to fill thin (30 m) microcracks
using push-out test, and a microscopic investigation are presented in Phase III. Phase IV
presents a performance study of selected seal repair materials. This study includes an
integrated seal test to investigate the efficiency of seal repair materials to seal the cement-
steel interface in addition to a durability study to investigate the ability of seal repair
materials to withstand harsh environmental conditions. Research conclusions and
recommendations are presented in Chapter 4.

7
Chapter 2. Literature Review
2.1 Wellbore integrity
There are millions of wellbores across the globe (1.5 million wellbores are
estimated in the State of Texas alone (Condor and Asghari 2009)) with several purposes
from oil and gas production wells and storage caverns wells to abandoned wells that lie
within the aerial extent of a CO2 storage operation (Davies et al. 2014). These wellbores
contain several potential leakage pathways (Figure 2.1 (Celia et al. 2005)) that might exist
due to several factors including incomplete drilling mud removal prior to cementing,
cement shrinkage, cement degradation, casing corrosion, and changes in pressure and
temperature within the casing during operation (Goodwin and Crook 1992, Thiercelin et
al. 1998, Zhang and Bachu 2011, Carey and Gardner 2012, De Simone, Pereira, and Roehl
2017, Fan, Li, and Liu 2018, Roy et al. 2018). Among possible leakage pathways described
in Figure 2.1, cement-steel and cement-rock formations interfaces are known to be the most
critical ones (Carey et al. 2007). Microscale defects (microcracks) develop at the cement-
steel and cement-rock formation, often referred to as microannuli, could jeopardize the seal
integrity of wellbores.
Figure 2.1: Schematic representation of zonal isolation and potential leakage pathways
(Celia et al. 2005).

8
Loss in the seal integrity of wellbores could result in major leakages or spills
incidents like the Deepwater Horizon event that released about 6500 million liters of liquid
oil in the Gulf of Mexico (Reddy et al. 2012) and the Aliso Canyon event that released
about 100,000 metric tons of methane into the atmosphere near Los Angeles, California
(Michanowicz et al. 2017). Such incidents would have significant effect both human health
and the environment in addition to significant economic burden (Smith, Smith, and
Ashcroft 2011).
Stormont et al. showed that a 50 m microcrack at the cement-steel interface would
result in four orders of magnitude increase in effective permeability of a 0.23 diameter
wellbore (Stormont et al. 2018). In a study involved 238 wellbores, Checkai et al. showed
that 85% of the investigated wells that incorporating gas leakage or pressure buildup have
5 to 100 micron cracks (Checkai, Bryant, and Tao 2013). Moreover, Seidel and Greene
showed that microcracks as small as 25 microns can be problematic for gas flow (Seidel
and Greene 1985).
2.2 Evaluation of wellbores seal integrity
Due to the economic and environmental significance of wellbores seal integrity,
regulations in many cases require evaluation of wellbores seal integrity using Mechanical
Integrity Test (MIT) at least once every 5 years (Thornhill and Benefield 1990, Browning
and Smith 1993, Kansas 2003). Using temperature, pressure, and motion in the Brine-
Nitrogen interface measurements, loss of seal integrity can be detected. Although MIT is
very effective in detecting loss of seal integrity, it requires very extensive work and can
take weeks to have a complete test (Kansas 2011). Thus, several studies were conducted to

9
investigate alternative faster and more economic systems and techniques to evaluate and
monitor wellbore integrity.
Cooke developed an apparatus that uses temperature measurements along the steel
casing to detect leakage in wellbores (1994). Li et al. suggested the use of coaxial cable
with imaging system to monitor steel casing deformations and presented the ability to use
such deformations to evaluate wellbore integrity (Li et al. 2017, Li and Nygaard 2018).
Moreover, distributed fiber optic sensing technique was able to monitor casing
deformations with high resolution which was found to be sufficient to evaluate the seal
integrity (Xue and Hashimoto 2017). Moreover, acoustic systems can be used for
wellbores integrity diagnostics and assessment (Duguid and Tombari 2007, Chen et al.
2018, Davis 2018).
2.3 Restoring wellbore seal integrity
In several cases, once loss in wellbore seal integrity is detected, seal integrity should
be restored to prevent any potential leakage incident. One of the common traditional
method to restore the seal integrity of a wellbore is to install an additional casing inside the
original one as shown in Figure 2.2 (Metcalf, Purvis, and Stilwell 2009). In this technique,
the old wellbore is re-drilled then the new steel casing is inserted inside the old one. Once
the new casing is installed, a new cement sheath is cast between the new and the old
casings. Irregularity of original casing due to thermal stresses, operational stresses, or creep
of rock formations complicates the installation of the new casing and can result in failure
of the mitigation process (US DOE 2016).

10
Figure 2.2: Restoring wellbore integrity by installing an additional casing.
To avoid such expensive and complicated process, several studies that aim to
eliminate or delay the need to seal wellbores were carried out. Modifying Portland cement
to improve its resistance to CO2 attaches was suggested (Barlet-Gouedard et al. 2006,
Barlet-Gouédard et al. 2007, Griffin et al. 2013). Moreover, cement systems with self-
healing abilities that can seal microannuli without external actions were suggested to be
used for cement sheath construction (Childers et al. 2017, Fernandez et al. 2018, Guthrie
et al. 2018). In addition, it was found that incorporating polymers in cement sheath can
improve its ductility and bond strength which improves the seal integrity of wellbores
(Chatterji et al. 2001, Guo et al. 2018). Other studies suggest the use of swell packers that
can be designed expands when exposed to specific fluid and seal leakage pathways (Freyer,

11
Fejerskov, and Huse 2002, Kennedy et al. 2005, Antonio, Barrios, and Martinez Rodriguez
2007, Rogers, Allison, and Webb 2008). These techniques showed the ability to improve
the seal integrity of new constructed wellbores. However, they cannot be used to restore
the seal integrity of existing ones. Thus, an effective sealing to restore the seal integrity of
existing wellbores system is needed.
Another standard sealing technique attempts to force the seal repair material into
the microcracks at the cement-steel or cement-rock interfaces through perforation in the
steel casing or at the show of the steel casing is usually used to seal existing wellbores. An
example of the sealing process through perforation in the steel casing is shown in Figure
2.3. Typically, microfine cement slurry with water to cement ratio between 0.7 and 2.0 is
used as the seal repair material due to its higher flowability compared with Type G cement
(Harris et al. 1992). However, experimental investigation showed that microfine cement
was unable to completely fill relatively large (> 400 m) microcracks (Genedy, et al. 2017,
Tavassoli et al. 2018). Thus, the main challenge in this technique is whether the seal repair
material can fill small microannuli or not.
Despite that it is widely accepted in the integrity research community that microfine
cement is not an effective seal repair material (Bagal et al. 2016), limited number of studies
were conducted to investigate an alternative seal repair material. Jones et al. showed that
gels and epoxies can be effective seal repair material (Jones et al. 2014). In addition,
Tavassoli et al. proposed using pH-triggered polymer as seal repair material (Tavassoli et
al. 2018). Moreover, Phillips et al. proposed microbially induced calcite precipitation to
restore wellbores seal repair integrity (Phillips et al. 2018). Furthermore, Rusch et al.
presented pressure activated sealant that can be used to instead of conventional rig

12
workover (2004). These studies show that polymers and other seal repair material can be
more effective than traditional microfine cement.
Figure 2.3: Injection process of seal repair material: (a) fill bottom hole with high density
brine up to 2-3 m below the injection level, (b) fill 5-10 m of casing with seal repair
material, (c) apply pressure to push seal repair material into the microcracks, (d)
Microannulus at Cement-rock interface before injecting seal repair material, and (e)
Sealed Microannulus at Cement-rock interface.
2.4 Cement-steel interface
The shear bond between the steel casing and cement sheath is strongly influenced
by the physical interface properties of the casing (e.g. frictional characteristics). It has been
reported that shear bonds are stronger when the casing is wire brushed or sand blasted and
weaker when smooth finish or coatings are applied to the outside of the casing (Zhai et al.
2006). Casing expansion and contraction in response to pressure fluctuations within the
casing can cause microcracking and debonding at the cement sheath-casing interface
(Lacuve et al. 2015). Moreover, cement shrinkage during cement hydration has an

13
influence on the bond. Experiments on cement-steel interface bond showed that cement
shrinkage leading to shrinkage microcracks is one reason for bond reduction with time
(Nakayama and Beaudoin 1987). Bond quality may also be affected by the continuous
growth of the calcium hydroxide (CH) crystals at the interface with time, resulting in a
weak bond (Nakayama and Beaudoin 1987). While the bond strength decreases with time,
the stresses due to processes in the wellbore may increase with time leading to lateral
tension or shear applied to the cement-steel interface which can result in microcracking.
Moreover, Shi and Ming show that the existence of microcracks at the cement-steel
interface reduces the corrosion resistance of steel casing (Shi and Ming 2017). Corroded
steel casing would result in lower bond and increase the permeability at the interface.
Studies have shown that microsilica (silica fume) enhances the cement paste-steel
bond (Chung 2000). The increased bond strength of the interface was attributed to the
pozzolanic nature of microsilica which allows microsilica to convert the CH crystals that
govern the cement-steel interface to the mechanically stronger calcium-silicate-hydrate
(CSH) phase. Nanosilica has been shown capable of producing a similar enhancement of
bond strength between cement paste and aggregate with smaller quantities compared with
microsilica due to its higher surface area (Mondal, Shah, and Marks 2007). Surface
treatment of steel using ozone and silane has been shown to significantly improve the bond
between cement paste and steel (Xu and Chung 1999). The improvement in bond strength
from surface treatments may be attributed to the enhancement of surface wettability
(Chung 2000) or to the availability of other functional groups (e.g. nitrogen, oxygen) with
electron pairs that enhance the hydrophilic polymer-metallic bond (Berry and Namkanisorn
2005). Sand blasting under pressure has also been shown to improve cement-steel bond

14
due to an increase in the steel surface roughness. It was also found that early cement
hydration would results in improved bond strength at the cement-steel interface (Wilson,
Eustes, and Fleckenstein 2018).
2.5 Cement-rock formation interface
While considerable attention has been given to the cement-steel interface, little
effort has been focused on studying the cement-rock interface while it represents a potential
leakage pathway (Ravi, Bosma, and Gastebled 2002, Newell and Carey 2012). Chemical
investigations showed that the process of cement hydration in contact with different types
of soils and rock formations results in change in chemical compositions in the transition
zone that can extend up to 2.5 mm on both sides of the interface (Hodgkinson and Hughes
1999, Read et al. 2001, Tinseau et al. 2006, Devol-Brown et al. 2007). Such changes can
have significant effect on the integrity of the interface.
Prior investigations have shown that the cement-shale bond is affected by both
cement and shale. As in cement-steel interface, cement shrinkage and growth of the
calcium hydroxide crystals can weaken cement bond at cement-shale interface (Nakayama
and Beaudoin 1987, Mehta and Monteiro 1976, Torsæter, Todorovic, and Lavrov 2015).
Moreover, the swelling coefficient of the shale formation has a significant impact on
interfacial bond between the cement sheath and shale. The higher the swelling coefficient,
the weaker the bond-strength is between the cement sheath and shale (Ladva et al. 2005).
Moreover, Silva and Milestone show that adding silica affects the size and complexity of
interfacial transition zone (ITZ) at the cement-rock interface (Silva and Milestone 2018).
Furthermore, thermo-elastic properties of cement sheath and formations were found to
have significant effect on the sheath-formation interface. In addition, mechanical response

15
analysis showed that more ductile cement results in higher quality interface than brittle
cement even with higher compressive strength (Thiercelin et al. 1998).
2.6 Polymer nanocomposites
Hydrophilic polymers have been shown to be capable of providing an excellent
bond to existing metal surface (Baldan 2004). Polymer adhesion to ceramic and metallic
surfaces can be improved by surface treatment (Mansur, Santos, and Mansur 2007, Grujicic
et al. 2008) which shifts the failure mode from adhesion failure to cohesion failure of the
thin (10-50 m thick) layer at the interface and thus improves the interfacial bond strength.
Thermosetting polymers such as epoxy, unsaturated polyesters (UP), and vinyl ester (VE),
and Novolac-epoxy co-polymers have been widely used for providing good bond with
different surfaces. Moreover, considerable progress has been made in reinforcing the
polymer/metal joint with organofunctional groups to improve covalent bond throughout
the interface (Abel, Watts, and Digby 2004, Namkanisorn et al. 2001).
Nanomaterials have been suggested as potential reinforcements for polymers with
the ability to improve their bond strength to metallic and ceramic substrates (Zhai et al.
2006). It has been widely suggested that nanoparticles, specifically carbon nanotubes
(CNTs) and nanoclay, can be used to improve the mechanical characteristics of polymers
(Gojny et al. 2004). Of special interest is the use of CNTs to improve the shear and tensile
strength of epoxy (Ren et al. 2004) and failure strains of polymethyl-methacrylate (PMMA)
(Zeng et al. 2004). Moreover, mechanical properties of polymer nanocomposites
incorporating nanoclay were shown to depend on the clay loading and the degree of
exfoliation of clay platelets (Ngo et al. 2007, Aboubakr, Kandil, and Taha 2014) . The
presence of exfoliated clay substantially increases both the tensile strength and modulus of

16
elasticity (Park and Jana 2003), the shear strength and impact strength of polymers (Bakar
et al. 2010). Furthermore, it was found that incorporating ANPs can significantly improve
the mechanical properties of polymer nanocomposites such as ductility, fracture toughness,
and strength (Wetzel et al. 2006, Pocius 2012, Emiroglu et al. 2017).
17
Chapter 3. Experimental Methods and Results
3.1 Material
3.1.1 Polymers
The first polymer used is polysulfide epoxy including silane. This epoxy is usually
used as an overlay material for repair of bridge decks. The epoxy consists of two
components, epoxy resin and epoxy hardener. The resin is mixture of Bisphenol
A/Epichlorohydrin Epoxy Resin including silane. The hardener is Diethylenetriamine
(DETA), Phenol, 4,4’-(1-methylethylidene)bis-, and Tetraethyllenepentamine. The second
polymer used is Novolac epoxy. Novolac epoxy resins are specifically designed to provide
high thermal stability and chemical resistance. This is accomplished by switching from
Bisphenol A to Novolac backbones. The third polymer is Methyl Methacrylate (MMA) is
a low viscosity methyl ester of methacrylic acid provided by Transpo Industry, Inc.
Benzoyl peroxide powder was used as hardener for the MMA resin.
3.1.2 Cement
Type G (API Class G) oil well cement (OWC), provided by Grupo Cementos de
Chihuahua (GCC) USA, was used as the reference cement material. This material was
acquired from the manufacturer and is obtained by grinding clinker, consisting essentially
of hydraulic calcium silicates, usually containing one or more forms of calcium sulfate as
additive. Class G OWC is intended for use as a basic well cement and is available in
moderate sulfate-resistant (MSR) and high sulfate-resistant (HSR) grades. Type G OWC
is known for its flowability and high fineness. It is well known that type G cement is very
comparable to ASTM Class II and Class V cements. The water/cement ratio for mixing
Type G cement is 0.45. Microfine cement, generally used to seal cracks in oil wells,

18
provided by the manufacturer was used. The microfine cement has a composition that is
comparable to high sulfate-resistant cements and grain size (d95) of 9.5 m. The mix used
for the microfine cement has water to cement ratio (w/c) of 0.7 and 2.0% of the dry cement
weight super plasticizer (recommended by the manufacturer).
3.1.3 Shale
The shale used in this investigation is Mancos Shale, sourced from TerraTek shown
in Figure (3.1).
Figure 3.1: (a) Coring process of Mancos shale and (b) Mancos shale core.
3.1.4 Steel
The Steel used in this investigation is stainless steel obtained from a local provider.
Stainless was selected to eliminate the effect of steel corrosion on the results of the
investigation.

19
3.1.5 Filler
In all polymer-cement nanocomposites mixes, crystalline silica (quartz) and
ceramic microspheres powder was used as mixing filler to produce the slurry to be cast and
harden.
3.1.6 Nanomaterials
A group of four nanomaterials was used for this investigation. This includes
functionalized Multi-Walled Carbon Nanotubes (MWCNTs), Nanoclay, Nanosilica and
Alumina Nano Particles (ANPs).
3.1.6.1 Multi-walled Carbon Nanotubes (MWCNTs)
Functionalized Multi-Walled Carbon Nano-Tubes (MWCNTs) were added to
produce the nanocomposite. The MWCNTs have an outer diameter (OD) of 20–30 nm,
inner diameter (ID) of 5–10 nm and length of 10–30 µm. The bulk density of the MWCNTs
is 0.21 g/cm3 and the specific surface area is 110 m2/g. The functionalization of MWCNTs
was performed by the manufacturer. A typical functionalization process is carried out in
two steps as reported by Zhu et al. and Osorio et al. (Zhu et al. 2003, Osorio et al. 2008).
First, a mixture of nonorganic acids such as sulfuric, nitric, and/or hydrochloric acids is
added and stirred with the nanotubes under elevated temperature. The role of the aggressive
mixture of acids is to create a defect on the surface of the nanotubes. The acids addition is
followed by base such as ammonium hydroxide. The base is expected to neutralize the
acidity and impregnate the carboxylic functional group on the nanotubes. Figure 3.2 shows
Transmission electron microscope (TEM) images of MWCNTs.

20
Figure 3.2: Transmission electron microscope (TEM) images of MWCNTs.
3.1.6.2 Nanosilica
The nanosilica used is AEREOSIL® 380 from manufacturer Evonik Degussa
Products, which is hydrophilic fumed silica with an average BET surface area of 380 m²/g
and an average particle diameter of 7 nm. AEROSIL® 380 is a chemically prepared silicon
dioxide powder that is white in color and odorless, and has a melting point of 1700 ̊C and
a density of 2.2 g/cm3.
3.1.6.3 Nanoclay
The nanoclay used in this research is Cloisite®30B supplied by Southern Clay
Products, Inc. It is an off white material consists of natural montmorillonite modified with
a quaternary ammonium salt. The nanoclay consists of dry particle sizes with 10%, 50%,
and 90% by volume less than 2μ, 6μ, and 13 μ, respectively. Generally, clay minerals are
composed of various combinations of: tetrahedral silica SiO44- and octahedral alumina

21
Al(OH)63- sheets (McLaren and Cameron 1996) as shown in Figure 3.3. In montmorillonite
(2:1 type phyllosilicates), each layer is composed of one octahedral alumina sheet
sandwiched between two tetrahedral silica sheets (Uddin 2008).
Figure 3.3: Structure of a silica tetrahedral sheet (up), and an alumina octahedral sheet
(down) (McLaren and Cameron 1996).
3.1.6.4 Alumina Nano Particles (ANPs)
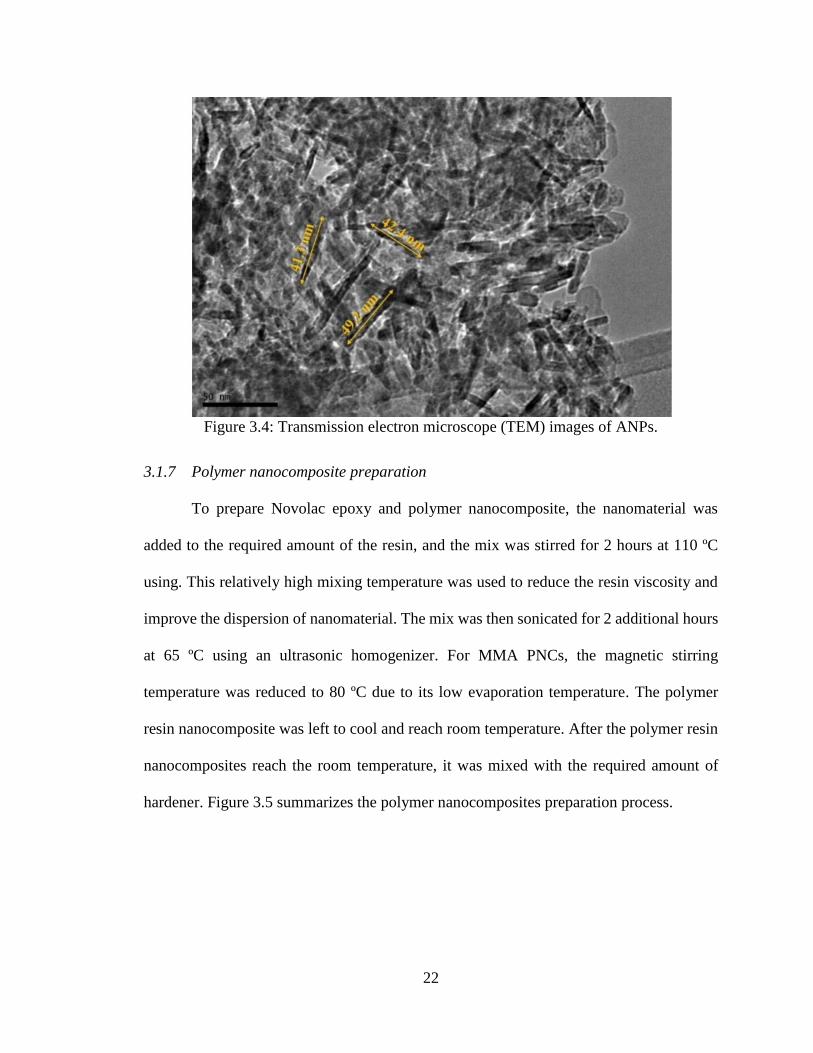
The nanoalumina used is aluminum oxide (Al2O3) nano- particles manufactured by
Sigma Aldrich, Inc. and has a maximum particle size of 50 nm. Figure 3.4 shows
Transmission electron microscope (TEM) images of ANPs.
22
Figure 3.4: Transmission electron microscope (TEM) images of ANPs.
3.1.7 Polymer nanocomposite preparation
To prepare Novolac epoxy and polymer nanocomposite, the nanomaterial was
added to the required amount of the resin, and the mix was stirred for 2 hours at 110 ºC
using. This relatively high mixing temperature was used to reduce the resin viscosity and
improve the dispersion of nanomaterial. The mix was then sonicated for 2 additional hours
at 65 ºC using an ultrasonic homogenizer. For MMA PNCs, the magnetic stirring
temperature was reduced to 80 ºC due to its low evaporation temperature. The polymer
resin nanocomposite was left to cool and reach room temperature. After the polymer resin
nanocomposites reach the room temperature, it was mixed with the required amount of
hardener. Figure 3.5 summarizes the polymer nanocomposites preparation process.

23
Figure 3.5: Schematic showing the steps to prepare polymer nanocomposites.
3.1.8 Polymer cement nanocomposite preparation (PCNC)
In order to prepare polymer cement nanocomposite (PCNC) of Novolac epoxy and
polysulfide siloxane epoxy, the polymer resin nanocomposites were mixed with the
required amount of hardener for 2-3 minutes using a low speed mixer, after which silica
filling powder were added. Mixing continued for 2-3 minutes until the mixture was
uniform. Schematic of mixing procedure is shown in Figure 3.6. Table (3.1) shows the list
of PCNCs used in this study. The mix proportions for all Polysulfide siloxane epoxy and
Novolac epoxy PCNC are presented in Tables 3.2 and 3.3 respectively.
24
Figure 3.6: Schematic of mixing procedure of polymer-cement nanocomposites.
Table 3.1: List of PCNCs used in this study.
Mixture Abbreviation Base Material Nano-particles Content%
Reference Microfine cement None ----
PCNC1 Polysulfide Siloxane epoxy None ----
PCNC2 Polysulfide Siloxane epoxy MWCNTs 0.5%
PCNC3 Polysulfide Siloxane epoxy MWCNTs 1.0%
PCNC4 Polysulfide Siloxane epoxy MWCNTs 1.5%
PCNC5 Polysulfide Siloxane epoxy Nanoclay 4.0%
PCNC6 Polysulfide Siloxane epoxy Nanosilica 1.0%
PCNC7 Polysulfide Siloxane epoxy Nanoalumina 2.0%
PCNC8 Novolac epoxy None ----
PCNC9 Novolac epoxy MWCNTs 0.5%
PCNC10 Novolac epoxy MWCNTs 1.0%
PCNC11 Novolac epoxy MWCNTs 1.5%
PCNC12 Novolac epoxy Nanoclay 4.0%
PCNC13 Novolac epoxy Nanosilica 1.0%
PCNC14 Novolac epoxy Nanoalumina 2.0%
PCNC15 Novolac epoxy Nanoalumina 0.5%
PCNC16 Novolac epoxy Nanoalumina 1.0%
PCNC17 Novolac epoxy Nanoalumina 1.5%
PCNC18 Novolac epoxy Nanoalumina 3.0%
PCNC19 Novolac epoxy Nanoalumina 4.0%
25
Table 3.2: Mix proportions for Polysulfide siloxane epoxy nanocomposites kg/m3.
Mix
designation
Resin Hardener Filler Nanomaterials Nano content
PCNC1 288 128 1570 None 0.0
PCNC2 288 128 1570 MWCNTs 1.44
PCNC3 288 128 1570 MWCNTs 2.88
PCNC4 288 128 1570 MWCNTs 4.32
PCNC5 288 128 1570 Nanoclay 11.52
PCNC6 288 128 1570 Nanosilica 2.88
PCNC7 288 128 1570 Nanoalumina 5.76
Table 3.3: Mix proportions for Novolac epoxy nanocomposites kg/m3.
Mix
designation
Resin Hardener Filler Nanomaterials Nano content
PCNC8 288 128 1570 None 0.0
PCNC9 288 128 1570 MWCNTs 1.44
PCNC10 288 128 1570 MWCNTs 2.88
PCNC11 288 128 1570 MWCNTs 4.32
PCNC12 288 128 1570 Nanoclay 11.52
PCNC13 288 128 1570 Nanosilica 2.88
PCNC14 288 128 1570 Nanoalumina 5.76
PCNC15 288 128 1570 Nanoalumina 1.44
PCNC16 288 128 1570 Nanoalumina 2.88
PCNC17 288 128 1570 Nanoalumina 4.32
PCNC18 288 128 1570 Nanoalumina 8.64
PCNC19 288 128 1570 Nanoalumina 11.52

26
3.2 Phase I: Steel-cement interface
3.2.1 Bond strength with steel surface
The effect of incorporating nano-particles on the bond strength between polymer
cement nanocomposite and steel was examined using a standard slant shear test following
ASTM C882 (ASTM 2005). Composite cylinders with 50 mm diameter and 100 mm height
were cast. The steel part with dimensions shown in Figure 3.7(a) was sandblasted to a
minimum 4 mil clean surface roughness profile and was placed in a cylindrical mold.
Polymer cement nanocomposite overlay was then cast on top of the steel in two layers.
Each layer was compacted to ensure uniform filling of the mold and the final surface was
leveled. In the case of reference mix, the overlay material was cement mortar. After 24
hours, the specimens were demolded and were allowed to cure for 7 days in air for the
polymer cement nanocomposites and in water for the cement mortar. Figure 3.7(b) shows
the slant shear specimen after it was demolded. After curing, the specimens were tested
under a uniaxial compressive as shown in Figure 3.8. The slant shear test was conducted
as a displacement control test with a loading rate of 0.036 mm/sec. The bond strength was
determined as the average shear strength was computed as shown in equation (3.1).
A
Pmaxmax ……….…………………………………………………………………....(3.1)
Where Pmax is the maximum load, A is the inclined contact area and max is the maximum
average shear strength.
27
Figure 3.7: (a) Steel part dimensions (b) composite cylinder for slant shear test
Figure 3.8: Slant shear test setup
Load-displacement data from the slant shear tests for the Polysulfide Siloxane
epoxy cement nanocomposites in Figure 3.9 and Novolac epoxy cement nanocomposites
in Figure 3.10. Load-displacement response of the reference microfine cement material is
also shown in Figure 3.9 and Figure 3.10.

28
Figure 3.9: Load-displacement curves of reference microfine cement material and
Polysulfide Siloxane epoxy cement nanocomposites
Figure 3.10: Load-displacement curves of reference microfine cement material and
Novolac epoxy cement nanocomposites.

29
The bond strength was calculated from equation 3.1 using the maximum force
during the slant shear test. The strength of five specimens for each material was used to
calculate the mean bond strength values shown in Figure 3.11. The neat Polysulfide
Siloxane epoxy has similar bond strength to that of the reference cement material.
However, incorporating 0.5% wt. MWCNTs and 2.0% wt. nanoalumina increased the bond
strength of Polysulfide Siloxane epoxy by 49%. On the other hand, dispersing nanoclay
and nanosilica in the epoxy resin of the polysulfide Siloxane epoxy system decreased the
bond strength between the polymer cement nanocomposite and the steel surface by 59%
and 52% respectively. Both nanosilica and nanoclay include silica tetrahedral, which seem
to have an adverse effect on the adhesion of Polysulfide Siloxane epoxy with steel
substrates.
The bond strength of all Novolac epoxy cement nanocomposites were significantly
higher than the reference cement mortar. The bond strength of the neat Novolac epoxy was
102% higher than the reference cement material. Adding MWCNTs did not make a
significant improvement of bond strength of the Novolac epoxy cement nanocomposites,
perhaps because the COOH functional group may not be suitable for Novolac epoxy. The
best improvement in the bond strength of Novolac cement nanocomposites was obtained
by dispersing 2.0% nanoalumina in the Novolac epoxy resin (PCNC14), increasing the
bond strength by more than 200% compared with the reference cement material. Using
nanoclay (PCNC12) and nanosilica (PCNC13) resulted in bond strength improvement of
134% and 138%, respectively. The improvement in bond strength using nanosilica particles
suggests that Novolac epoxy can interact with nanosilica without adversely affecting its
properties. The ability of alumina based particles to improve bond strength with steel by

30
forming chemical bond of alumina oxides that further bonds the steel surface to the epoxy
adhesive has been previously reported (Pocius 2012).
Figure 3.11: Mean bond strength for reference microfine cement material and all fourteen
polymer cement nanocomposites.
3.2.2 Flowability of Polymer Cement Nanocomposites
As all the investigated materials are suggested seal repair materials, these materials
need to be flowable in order to be easily injected in the cracks. Thus, the effect of
incorporating the nanoparticles in the epoxy on the flowability has to be investigated. The
flowability test was conducted according to ASTM C1437 (ASTM 2007) on the polymer
cement nanocomposites. The flowability cone used in the tests has a 70 mm smaller
diameter and 100 mm larger diameter. The height of the cone is 50 mm. The cone was
positioned in the center of the flow table and then it was filled with the mixture in two
layers. Each layer was tamped 20 times to ensure uniform filling of the cone. Afterwards,
the cone was lifted in 4 seconds. Using the flow table, 25 strikes were applied to the
specimen in 15 seconds. Four readings of the specimen in four direction separated by 45°
were taken after the 25 strikes using the test caliber. The sum of the four readings represents

31
the flowability of the slurry. Figure 3.12 shows filling of the flowability cone and reading
of flowability with the test caliber.
Figure 3.12: (a) Filling the flowability cone (b) taking readings using test caliber.
Flowability results for reference microfine cement material and all fourteen PCNCs
tested are shown in Figure 3.13. The flowability of all polysulfide siloxane cement
nanocomposites were less than the reference cement materials. In contrast, the flowability
of all Novolac epoxy cement nanocomposites were greater than the reference cement
material. The results indicate that mixtures that included nanoparticles had a reduced
flowability compared to the neat epoxy cement nanocomposites. Incorporating 0.5%
MWCNTs and 2.0% nanoalumina had the least effect on flowability of polymer cement
nanocomposites for both types of epoxies while 4.0% nanoclay and 1.0% nanosilica
decreased the flowability the most.

32
Figure 3.13: Flowability results for the reference microfine cement material and all
fourteen polymer nanocomposites.
Slant shear and flowability results presented above show that all Novolac epoxy
polymer-cement nanocomposites shows superior performance over polysulfide siloxane
epoxy. Furthermore, incorporating 2.0% ANPs in Novolac epoxy PCNC shows the highest
improvement in bond strength with steel surface. In addition, incorporating ANPs reduced
the flowability of Novolac epoxy PCNC by only 8%. Thus, extended investigation of
Novolac epoxy PCNC incorporating ANPs was conducted.
3.2.3 Extended investigation of Novolac epoxy PCNCs incorporating ANPs
Additional five Novolac epoxy PCNC incorporating 0.5%, 1.0%, 1.5%, 3.0%, and
4.0% ANPs were prepared. The bond strength with steel surface was examined using slant
shear test as illustrated in section 3.2.1. Figure 3.14 shows the mean bond strength of all
Novolac epoxy PCNC incorporating ANPs compared to neat Novolac epoxy PCNC
(PCNC8). Slant shear results shows that there is a direct relation between the amount of
ANPs incorporated and the improvement in bond strength of PCNC only up to 2.0% ANPs.

33
Additional content of ANPs (Higher than 2.0%) have an adverse effect and it decrease the
improvement in the bond strength. This results can be explained by the fact that with this
high content of ANPs (Higher than 2.0%), the effectiveness of dispersion process was
affected which results in agglomerated nanoparticles.
Figure 3.14: Mean bond strength for all Novolac epoxy PCNC.
Figure 3.15 shows the flowability results of all Novolac epoxy PCNC incorporating
ANPs compared to neat Novolac epoxy PCNC. Flowability results show that the higher
content of nanoparticles incorporated the lower the flowability of PCNCs. However, this
relationship is not linear for all ANPs content. As shown in Figure 3.15, incorporating low
content of ANPs in Novolac PCNC (from 0.5% to 2.0%) results in less than 9% reduction
in the flowability of PCNC. On the other hand, incorporating higher content on ANPs
(3.0% and 4.0%) results in 20% to 26% reduction in the flowability of PCNCs. This can
also be explained by the agglomerations of nanoparticles that results from dispersing such
a high content of ANPs.

34
Figure 3.15: Flowability results for all Novolac epoxy PCNC.
Based on the flowability and slant shear tests’ results, it was concluded that
Polysulfide Siloxane epoxy is not suitable seal repair material of wellbores microannulus
cracks due to its significantly low flowability and bond strength which are two main
characteristics of any seal repair material. Thus, the Polysulfide Siloxane was eliminated
as a potential seal repair material for wellbores microannulus cracks in this research. In
addition, the results of using Aluminum Nanoparticles (ANPs) showed a great potential in
improving the bond strength of polymers nanocomposites.
Although incorporating 2.0% ANPs in Novolac epoxy showed the highest
improvement in bond strength with steel surfaces, it also showed significantly high
variability in the bond strength results. This variability was observed also with 3.0% and
4.0% ANPs. This can be explained by a non-uniform dispersion and agglomerated
nanoparticles due to the high content. Moreover, it was observed that there was no

35
significant improvement in the bond strength with incorporating 1.5% ANPs when
compared to 1.0% ANPs. On the other hand, incorporating 0.5% and 1.0% ANPs in
Novolac epoxy showed 20% and 23% increase in the bond strength respectively in addition
to only 6.0% reduction in flowability. Thus, Novolac epoxy incorporating ANPs with
highest content limited to 1.0% of polymer weight was selected in the rest of this study.

36
3.3 Phase II: Cement-rock formation interface
3.3.1 Push-out test
The bond strength at the cement-shale interface was tested using push-out test. Two
sets of specimens were prepared for push-out tests as shown in Figure 3.16. The first set
was used to measure the bond strength between the shale and Type G cement paste. A shale
core of 25.4 mm diameter and a length greater than 30 mm was fixed in the center of a steel
cylinder with an outer diameter of 100 mm and thickness of 3.2 mm; cement paste was
then cast around the shale to produce cylindrical specimens with a diameter of 101.4 mm
and height of 50.8 mm. The second set of specimens was prepared to investigate the bond
strength of the seal repair materials injected in an artificial microannulus between cement
paste and shale. Hollow Type G cement cylindrical specimens confined with steel cylinders
with inner diameter of 27 mm, outer diameter of 101.4 mm, and height of 50.8 mm were
cast first. These specimens were cured at 100% humidity environment at room temperature
for 28 days. After the cement cylinder was cured, the shale core with a diameter of 25.4
mm was placed in the center of the hole, which produced a gap or microannulus between
the cement paste and shale of nominally 800 m. Seal repair material was then supplied
along the top shale-cement contact and allowed to flow under gravity into the microannulus
as shown in Figure 3.17. The seal repair material was added into the crack until the seal
repair material no longer flowed into the crack. Five seal repair materials were tested in
this test: standard microfine cement, Novolac epoxy, and Novolac epoxy with 3 different
contents of ANPs (0.25 wt.%, 0.5 wt.%, and 1.0 w.%). ANPs were added as a weight
percentage of the epoxy total weight. Novolac Epoxy and ANPs were selected to this test

37
based on the results of followability and slant shear tests of PCNCs as explained in section
3.2.3.
Figure 3.16: Schematic of the push-out test specimens for (a) first set of specimens and
(b) second set of specimens.
Figure 3.17: Placing seal repair material at the cement-shale microannulus.
All specimens were tested at age 7 days after sealing (or curing for reference
specimens). Cement specimens were cured in 100% humidity while polymer
nanocomposites specimens were air cured at room temperature.
The push-out test setup is shown in Figure 3.18. The push-out test was conducted
under two-stage displacement control protocol. The test started with a rate of 0. 1 mm/min
for the first 5 mm, after which the loading rate was increased to 1.0 mm/min. Test load and
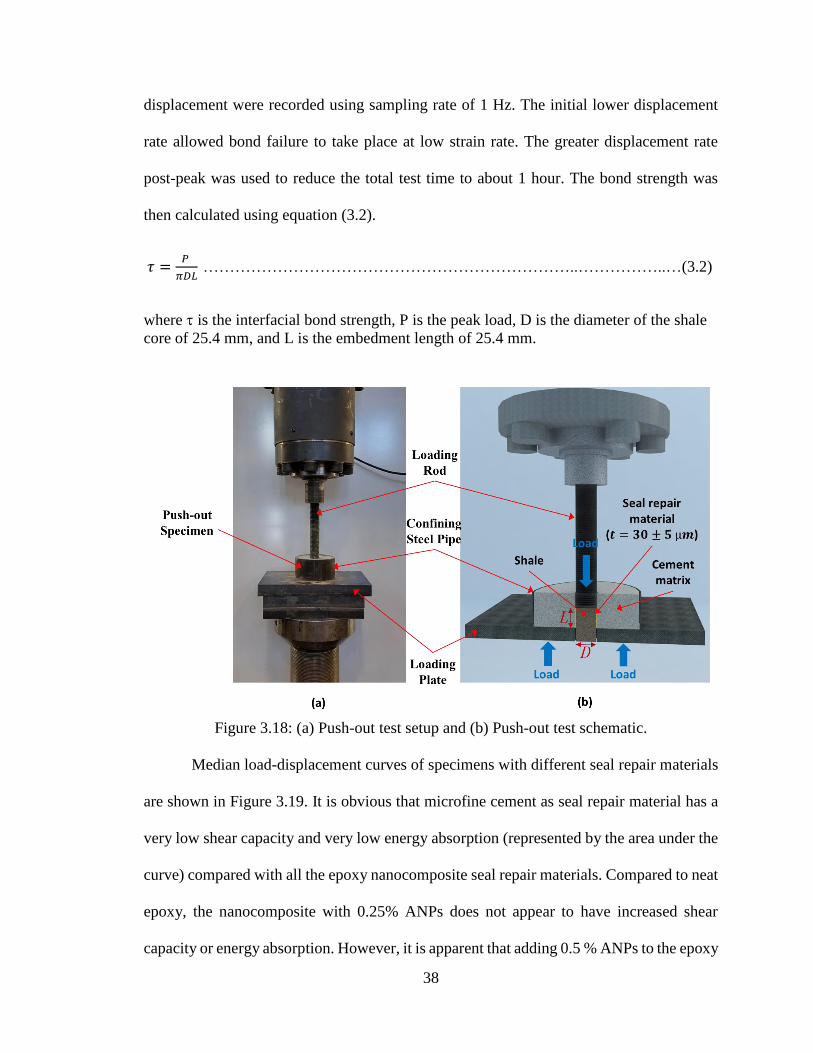
38
displacement were recorded using sampling rate of 1 Hz. The initial lower displacement
rate allowed bond failure to take place at low strain rate. The greater displacement rate
post-peak was used to reduce the total test time to about 1 hour. The bond strength was
then calculated using equation (3.2).
𝜏 =𝑃
𝜋𝐷𝐿 ……………………………………………………………..……………..…(3.2)
where is the interfacial bond strength, P is the peak load, D is the diameter of the shale
core of 25.4 mm, and L is the embedment length of 25.4 mm.
Figure 3.18: (a) Push-out test setup and (b) Push-out test schematic.
Median load-displacement curves of specimens with different seal repair materials
are shown in Figure 3.19. It is obvious that microfine cement as seal repair material has a
very low shear capacity and very low energy absorption (represented by the area under the
curve) compared with all the epoxy nanocomposite seal repair materials. Compared to neat
epoxy, the nanocomposite with 0.25% ANPs does not appear to have increased shear
capacity or energy absorption. However, it is apparent that adding 0.5 % ANPs to the epoxy

39
improved both the shear capacity and its energy absorption significantly; little additional
benefit appears to be gained by increasing the ANP to 1.0%.
Figure 3.19: Median load-displacement curves of specimens sealed with microfine
cement and epoxy-based materials.
Figure 3.20 shows the bond strength of the reference case (cement case around
shale) and all seal repair materials. Table 3.4 shows the bond strength results for all seal
repair materials compared to reference case. As visual observations show, the failure of all
specimens occur at the shale/ANPs-epoxy nanocomposites interface. Statistical analysis
using student t-test with 95% level of confidence shows that the reduction of bond strength
of microfine cement was statistically insignificant. However, the increase in the bond
strength of all ANPS-epoxy nanocomposites is statistically significant when compared
with the reference case or the microfine cement.

40
Figure 3.20: The bond strength of the reference case and all seal repair materials.
Table 3.4: The bond strength of the reference case and all seal repair materials.
Material Reference Microfine
cement
Neat
Epoxy
0.25%
ANPs
0.5%
ANPs 1.0% ANPs
Bond
Strength
[MPa]
4.49±0.1 3.53±0.82 12.34±0.9 12.6±0.1 15.4±0.3 15.89±0.9
Table 3.5 shows shear stiffness defined as the slope of the linear part of the load-
displacement curve, displacement at peak load, and toughness calculated as the area
under load-displacement curve.

41
Table 3.5: shear stiffness, displacement at peak load, and toughness for all seal repair
materials.
Material Microfine
cement
Neat
Epoxy
0.25%
ANPs
0.5%
ANPs
1.0%
ANPs
Shear stiffness
[kN/mm] 11.02±0.09 10.86±0.49 10.67±0.75 11.11±0.13 11.21±0.5
Displacement
at peak load
[mm]
0.75±0.01 4.84±0.2 4.09±0.13 3.54±0.06 3.39±0.04
Toughness
[N.ma] 21.69±0.44 145.7±0.46 141.4±12.2 180.7±1.87 186.7±2.38
The displacement at peak load for microfine cement and ANPs-epoxy
nanocomposites is shown in Figure 3.21. Although the results show that incorporating
ANPs in the epoxy resin significantly reduces the displacement at peak load, the
displacement at peak load of all ANPs-epoxy nanocomposites was significantly higher than
microfine cement. Figure 3.22 Shows The toughness of ANPs-epoxy nanocomposites
compared to microfine cement. Statistical analysis shows that the difference of stiffness
among all seal repair material was insignificant. It was also found that the difference in
toughness between all ANPs-epoxy nanocomposites and microfine cement was statistically
significant. However, there was no significant difference in toughness between neat epoxy
and 0.25% ANPs-epoxy nanocomposite.

42
Figure 3.21: Displacement at peak load of the microfine cement and all ANPs-epoxy
nanocomposites
Figure 3.22: Toughness for the microfine cement and all ANPs-epoxy nanocomposites

43
3.3.2 Viscosity of Polymer Nanocomposites
Viscosity test was conducted using rotational Viscometer (Figure 3.23) following
AASHTO T316 (AASHTO 2010). The viscosity was measured for all material at room
temperature (22 ºC). SC4-21 needle spindles, rotating at 20 rpm, were used for viscosity
measurements. The spindles were allowed to rotate for 1 minute, after which three readings
were taken at 15-second intervals. The test was performed as per the AASHTO standard.
Figure 3.23: Rotational Viscometer.
Figure 3.24 shows the viscosity measurements for ANPs-epoxy nanocomposites
compared with microfine cement. It was found that all ANPs-epoxy nanocomposites have
viscosity lower than microfine cement. It was also found that incorporating ANPs in epoxy
resin have a minor effect on epoxy viscosity. The maximum increase in viscosity of ANPs-
epoxy polymer nanocomposite was found to be 8.2% compared with that of neat epoxy.
Statistical analysis using student t-test with 95% level of confidence shows that the

44
difference in viscosity of ANPs-epoxy nanocomposites was significantly different than that
of microfine cement.
Figure 3.24: Comparison of the viscosity between polymer nanocomposites incorporating
0% (Neat) 0.25%, 0.5%, and 1.0% ANPs and microfine cement.
3.3.3 Microscopic investigation
Light microscopes with two different levels of magnification (100X and 500X)
were used to observe the shale-cement interface with the different seal repair materials.
Photomicrographs of the sealed shale interface with Type G cement paste using microfine
cement, neat epoxy, and 1.0% ANPs-epoxy polymer nanocomposite are presented in
Figure 3.25, Figure 3.26 and Figure 3.27 respectively. As shown in Figure 3.25, using
microfine cement as a seal repair material a gap at the shale-cement interface can be
observed. It is important to note that such gap was not uniform and the width of the gap
ranges from 3 m up to 40 m along the interface. These gaps might be formed due to
shrinkage of microfine cement during its hydration. These large gaps between microfine

45
cement and shale surface could explain the reduction in bond strength in case of microfine
cement compared to reference case.
Figure 3.25: Microscopic images of shale-microfine cement interface with two different
levels of magnification showing areas with gap between microfine cement and shale.
Photomicrographs of the shale-cement interface sealed with the neat epoxy and
1.0% ANPs-epoxy nanocomposite, shown in Figure 3.26 and Figure 3.27, respectively,
show no gaps and demonstrate the ability of epoxy with and without ANPs to flow and seal
the shale-cement interface. A close look at Figure 3.26 and Figure 3.27 shows the ability
of the ANPs-epoxy nanocomposite to penetrate into the porous shale interface and fill the
microcracks at the shale surface. This ability of epoxy and ANPs-epoxy nanocomposite to
penetrate the shale microcrack network at the interface enables creating mechanical
interlocks in addition to the adhesion between epoxy and shale. These interfacial
microcracks at the shale surface also provide potential leakage pathways and thus
compromise wellbore seal integrity. The penetration of the epoxy nanocomposite seal

46
repair material does not only improve the shale-cement bond strength, but it also seals
leakage pathways adjacent to the interface and thus improves wellbore seal integrity.
Figure 3.26: Microscopic images of shale-neat epoxy interface with two different levels
of magnification showing the ability of the neat epoxy seal repair material to completely
fill the gap at the shale-cement interface.
Figure 3.27: Microscopic images of shale-1.0% ANPs-epoxy polymer nanocomposite
interface with two different levels of magnification showing the ability of the epoxy seal
repair material to completely fill the gap at the shale-cement interface.

47
3.3.4 Fourier Transform Infrared (FTIR) Analysis
FTIR analysis was conducted on neat polymer specimen and specimen
incorporating 1.0% ANPs. A PerkinElmer FTIR with the Universal Attenuated Total
Reflectance (UATR) accessory was used for the analysis (Figure 3.28). The spectra were
recorded with a horizontal ATR accessory and a DiComp crystal (composed of a diamond
ATR with a zinc selenide focusing element). For each sample, 4000 scans were collected
at a resolution of 4 cm−1. The spectra were then converted to absorbance using the Kramers-
Kronig equation for FTIR analysis(Griffiths and De Haseth 2007).
Figure 3.28: PerkinElmer FTIR machine.

48
FTIR spectra of neat epoxy and epoxy incorporating nano-alumina (0.5 and 1.0%
ANPs) were obtained to compare chemical changes of the curing process of epoxy as
shown in Figure 3.29. The FTIR spectra show the traditional band of epoxy where
absorption bands corresponding to C-H appear at (2850–2930 cm−1), epoxide ring (∼825
cm−1), N-H band of primary amines (1585– 1610 cm−1), O-H groups (∼3350 cm−1), C-N
band (1030–1115 cm−1) and ether bands (∼1230 cm−1). The general illustrations of the
chemical structures of the Novolac epoxy resin and its curing process can be found
elsewhere (Golru et al. 2014). It can be clearly observed that addition of a small amount of
ANPs (0.5 or 1.0%) to the epoxy resin caused a significant increase in the epoxy ring, O-
H and primary N-H band intensity. This may be attributed to the effect of ANPs on the
curing behavior of the epoxy matrix. The curing reaction of the epoxy resin proceeds
through the amines presented in the polyamide curing agent(Van den Brand 2004).
Figure 3.29: FTIR spectra of neat epoxy and epoxy incorporating 0.5 and 1.0 % ANPs
showing the significant changes appearing in the spectra using ANPs compared to the
neat epoxy.

49
It is interesting to note that both ANPs contents give the same effect on the curing
process of epoxy. Based on the curing mechanism and the results obtained from FTIR
analysis, it can be concluded that the curing reaction was affected by the presence of a
relatively small amount of ANPs about 0.50%. This can be understood from the higher
peak intensities of the epoxy ring (∼830 cm−1) and O-H groups (∼3350 cm−1) for the
epoxy-ANPs nanocomposite compared with neat epoxy. This can be explained by the
ability of ANPs to hinder epoxy curing due to steric hindrance effect of ANPs reported by
Ramezanzadeh et. al.(Ramezanzadeh, Attar, and Farzam 2011). The steric hindrance effect
results in decreasing the reactivity between the epoxy functional groups and polyamide
hardener. Such effect is attributed to the amphoteric nature of alumina nanoparticles
(Kardar, Ebrahimi, and Bastani 2008, Golru, Attar, and Ramezanzadeh 2014). The ability
of ANPs to limit epoxy curing makes the unreacted epoxy groups available to react with
other interfaces that epoxy is adhered to. This explains the ability of ANPs-epoxy
nanocomposite to have much improved bond strength to both shale and cement paste
compared with neat epoxy. The above FTIR observations explain the increase in the sealed
shale-cement bond strength by 29% when ANPs were incorporated in the epoxy resin
compared with neat epoxy.
3.3.5 Dynamic Mechanical Analyses (DMA)
The effect of ANPs on crosslinking of epoxy was investigated using dynamic
mechanical analyses (DMA). The crosslinking density was determined by applying the
theory of rubbery elasticity using equation (3.3) (Hill 1997).
𝜐𝑒 =𝐸′
3𝑅𝑇……………………………………………………………………………….(3.3)
50
Where υe is the crosslinking density, E’ is storage modulus in the rubbery plateau,
T is the temperature in Kelvin corresponding to the storage modulus value, and R is Gas
Constant. The rubbery plateau was considered to be at temperature 50 ºC above glass
transition temperature Tg (Lee and Yee 2001). The storage modulus at rubbery plateau was
measured using DMA Q800 (Figure 3.30). The molecular weight between crosslinks can
be calculated using equation (3.4).
𝑀𝑐 =𝜌
𝜐𝑒 ………………………………………………………………………...……..(3.4)
Where Mc is molecular weight between crosslinks and 𝜌 is the density of the
polymer nanocomposite. As the crosslinking of a polymer resin increases when the
molecular weight between crosslinks decreases (Lee and Yee 2001, Liang and Pearson
2009), A measure for the degree of crosslinking Xlink is suggested here as an inverse for
the molecular weight between crosslinks in a unit volume as in equation (3.5).
𝑋𝑙𝑖𝑛𝑘 =1
𝑀𝑐=
𝜐𝑒
𝜌 ……………………………………………………………………….(3.5)
Where Xlink is a measure of the degree of crosslinking of the polymer
nanocomposite.

51
Figure 3.30: DMA Q800 with 3-point bending clamp.
To confirm the significance of ANPs on epoxy cross-linking, DMA testing was
conducted on neat epoxy and epoxy incorporating 0.25%, 0.5%, and 1.0% ANPs. The
suggested degree of crosslinking measure (XLink) was calculated using equations (3.3),
(3.4) and (3.5). Figure 3.31 shows the degree of crosslinking for neat epoxy, 0.25% ANPs-
epoxy nanocomposites, 0.5%-ANPs epoxy nanocomposite and 1.0% ANPs-epoxy
nanocomposite. The results show that incorporating 0.25% ANPs in the epoxy resin
reduces the cross linking by only 4.9% which can explain the insignificant change in bond
strength between ANPs-epoxy nanocomposites incorporating 0% (Neat) and 0.25% ANPs.
On the other side, incorporating 0.5% and 1.0% ANPs reduces epoxy crosslinking by
15.8% and 16.4% respectively. The above analysis confirms the FTIR observations and is
consistent with the bond strength results.

52
Figure 3.31: Xlink: A measure of the degree of crosslinking for neat epoxy, 0.25% ANPs-
epoxy nanocomposite, 0.5% ANPs-epoxy nanocomposite, and 1.0% ANPs-epoxy
nanocomposite.
The relation between the bond strength and the content of ANPs in polymer
nanocomposites is shown in Figure 3.32. It was observed that the relation between the
content of ANPs and bond strength is almost a step function and can be divided in to 3
regions. In region 1, with very low content (< 0.25%) on ANPs, the low content of ANPs
was not enough to achieve the full chemical reaction as it is shown in Xlink measurements
(Figure 3.31). This results in insignificant improvement (only 2%) in bond strength.
Increasing the content of ANPs to 0.5% (Region 2) resulted in a step increase in the bond
strength with 25% improvement in the bond strength. This can be explained by the
existence of enough ANPs to interrupt the epoxy crosslinking process and significantly
improve the bond strength. With higher content of ANPS (1.0%), only 3% increase in the
bond strength was achieved when compared to 0.5%. This limited increase can be
explained by that 0.5% ANPs was enough to complete the chemical reaction and interrupt

53
the crosslinking process which can be concluded from Xlink measurements (Figure 3.31)
and the rest of the ANPs content worked as reinforcement. Due to the small particles size
(50nm) and the relatively low content for reinforcement, only limited improvement was
observed. Thus, it can be concluded that the optimum ANPs content to achieve the highest
effective improvement to cost ratio is 0.5% of the polymer weight.
Figure 3.32: The relation between the bond strength and the content of ANPs in polymer
nanocomposites.

54
3.4 Phase III: Penetrability study
In this chapter, the ability of the proposed seal repair material to fill thin (30 m)
microcracks was investigated. Neat Novolac epoxy was selected from the previously
investigated seal repair materials for this study due to its physical properties. Based on the
followability and viscosity results showed in sections 3.2.2 and 3.3.2 respectively, Neat
Novolac epoxy showed the highest potential, among the seal repair materials investigated
in phase I and II, to be able to fill such thin microcracks. In addition to microfine cement
and neat Novolac epoxy, methyl methacrylate (MMA) and nanomodified MMA (NM-
MMA) were considered for this study. NM-MMA was prepared by dispersing 0.50 wt.%
aluminum nanoparticles (ANPs) in the MMA resin following the dispersing method
elaborated in section 3.1.7.
3.4.1 Physical properties of seal repair material
To assess the capability of seal repair material to fill 30 m microcracks, the
physical properties, including viscosity, surface tension, and contact angle with cement
paste surface, for all seal repair materials used in this investigation were measured.
3.4.1.1 Viscosity measurements
Viscosity tests were conducted using a rotational Viscometer as explained in
section 3.3.2. The viscosity of investigated seal repair materials is shown in Fig. 3.33. It
was found that Novolac epoxy has 18.4% lower viscosity than microfine cement while
MMA and NM-MMA both have 99.6% lower viscosity than microfine cement. These
extremely low viscosities of MMA and NM-MMA result in a higher rate of flow of the
seal repair materials through the microcracks. This high flow rate allows the seal repair

55
material to penetrate further in the microcrack before hardening and results in an efficient
seal of the microcrack.
Figure 3.33: Viscosity measurements of all seal repair materials: Log scale is used to
enable display with order of magnitude change in viscosity.
3.4.1.2 Surface tension
The surface tension of the seal repair materials was measured using KRUSS force
tensiometer K100 (Figure 3.34) standard plate surface tension test. The test was conducted
by submerging a standard platinum plate in the investigated liquid to achieve a wetted
depth of 6 mm. The plate was then pulled-out of the liquid with a speed of 10 mm/min.
The force required to pull-out the plate was measured and the surface tension of the liquid
was calculated using Wilhelmy plate method.

56
Figure 3.34: KRUSS force tensiometer K100 machine.
The surface tension measurements of investigated seal repair materials are shown
in Figure 3.35. Novolac epoxy has 17.7% lower surface tension than microfine cement.
This low surface tension allows epoxy to fill smaller microcracks than what microfine
cement can fill. On the other hand, it was found that MMA and NM-MMA seal repair
materials have 43.2% and 42.7% lower surface tension than microfine cement,
respectively, and 31% and 30.5%, respectively, lower than Novolac epoxy. This
significantly low surface tension allows MMA to flow through such small microcracks (30
m) and completely fill the gap and achieve seal integrity. It was also found that
incorporating ANPs has no noticeable effect on either viscosity or surface tension of MMA.

57
Figure 3.35: Surface tension seal repair materials: % above the bars represents the
difference of Penetrability Index of seal repair material compared with microfine cement.
3.4.1.3 Contact angle with cement paste surface
Contact angle of seal repair material with Type G cement paste surface was
measured by allowing a drop of seal repair material to fall on a hardened cement paste
surface from 1 cm height. A high resolution camera was used to take a photo of the seal
repair material drop before it was absorbed by the cement paste (Courard 1999).
DinoCapture 2.0 angle measurement tool was then used to measure the contact angle of
each seal repair material.
The contact angle measurements of investigated seal repair materials with Type G
cement paste surface are shown in Figure 3.36. The measurements show that the contact
angle of Novolac epoxy, MMA, and NM-MMA are 27%, 62%, and 59% lower than the
contact angle of microfine cement with Type G cement paste surface respectively. The
measurements also show that the contact angle of MMA and NM-MMA are 48% and 44%

58
lower than Novolac epoxy. On the other hand, incorporating ANPs in MMA resulted in a
very limited increase in the contact angle of MMA with cement paste by 7% only.
Figure 3.36: Contact angle measurements for (a) Microfine cement, (b) Novolac epoxy,
(c) MMA, and (d) NM-MMA.
3.4.1.4 Penetrability of seal repair materials
The ability of a seal repair material to replace other fluids (e.g. air or water) is
proportional to its surface tension and contact angle (Blunt 2017). To compare the
penetrability of seal repair materials in this study, we calculated the capillary pressure (Pc)
based on Young-Laplace equation shown in equation (3.6) (Tiab and Donaldson 2015).
𝑃𝑐 = 2𝛾𝑟 cos 𝜃𝑟
𝑟𝑐……………………..………………..………………………………….(3.6)

59
where Pc is the capillary pressure [Pa], r is the seal repair material surface tension
[N/m], r is the seal repair material contact angle, and rc is half of the crack width [m]. The
calculated capillary pressure for all seal repair materials is shown in Figure 3.37. The
results show that Novolac epoxy, MMA, and NM-MMA have 8.1%, 31.0%, and 30.8%
lower capillary pressure in a 30 m capillary crack than microfine cement respectively.
Moreover, MMA and NM-MMA were found to have 24.9% and 24.6% lower capillary
pressure than Novolac epoxy respectively. These results show that MMA and NM-MMA
seal repair material will be able to penetrate smaller microscale defects than both microfine
cement and Novolac epoxy under similar conditions. On the other hand, incorporating
ANPs in MMA seal repair material resulted in a very insignificant increase in the capillary
pressure of MMA by less than 1.0%.
Figure 3.37: Capillary Pressure of all seal repair materials in a 30 m microcrack; %
above the bars represents the difference of Capillary Pressure of seal repair material
compared with microfine cement.

60
3.4.2 Bond strength
Push-out test specimens were prepared as shown in Figure 3.38 to measure the bond
strength of seal repair materials. Push-out test was conducted as explained in section 3.3.1.
Figure 3.38: Schematic of push-out test specimen for 30 m microcracks.
All push-out specimens were loaded until failure. Failure was defined as the point
at which the load dropped below 50% of the maximum load. Median load-displacement
curves of specimens sealed with different seal repair materials are shown in Figure 3.39.
The load-displacement curves show that microfine cement has very low bond strength
compared with polymer seal repair material. It was also observed that MMA-based seal
repair materials have almost 100% higher bond strength than Novolac epoxy seal repair
material, and about 1000% higher than microfine cement. Incorporating ANPs has no
significant effect on the bond strength of the seal repair material. However, incorporating

61
ANPs significantly improved the displacement at failure of the seal repair material
indicating significant improvement in ductility.
Figure 3.39: Median load-displacement curves of specimens sealed with microfine
cement, Novolac epoxy, MMA, and NM-MMA polymer nanocomposite.
The apparent bond strength of seal repair materials was calculated using equation
3.2. Figure 3.40 shows the bond strength of investigated seal repair materials. The results
show an increase in the apparent bond strength of Novolac epoxy, MMA, and NM-MMA
by 554%, 1088%, and 1061% compared to microfine cement. Statistical analysis using
student t-test with 95% level of confidence shows that the increase of bond strength of
Novolac epoxy, MMA, and NM-MMA compared to microfine cement was statistically
significant. However, the reduction in the bond strength of NM-MMA is statistically
insignificant when compared with neat MMA seal repair material.

62
Figure 3.40: The apparent bond strength of all seal repair materials; % above the bars
represents the difference of bond strength of seal repair material compared with microfine
cement currently used in the field.
Figure 3.41 shows the displacement at failure for seal repair materials. Using
Novolac epoxy as seal repair material reduced the displacement at failure by 34.9%
compared with microfine cement. However, this reduction was found to be statistically
insignificant. On the other hand, the displacement at failure of specimens sealed with MMA
and NM-MMA was found to increase the displacement at failure by 156% and 468%,
respectively, compared to microfine cement.
The toughness of push-out specimens was calculated as the area under the load-
displacement curve until failure (Figure 3.42). It was found that the toughness was increase
by 223%, 2638%, and 8135% for Novolac epoxy, MMA, and NM-MMA, respectively,
compared to microfine cement. These results show that incorporating 0.5% ANPs in MMA
was able to increase the displacement at failure and toughness of push-out specimens by
122% and 201% respectively. It is important to note that such increase in ductility and

63
toughness of seal repair material will have a significant effect on seal efficiency. A seal
repair material with relatively high strength and very high failure displacement and ability
to absorb energy will show much improved efficiency compared to current sealing
technology.
Figure 3.41: Displacement at failure of all seal repair materials; % above the bars
represents the difference of bond strength of seal repair material compared with microfine
cement.

64
Figure 3.42: Toughness of all seal repair materials; % above the bars represents the
difference of bond strength of seal repair material compared with microfine cement.
3.4.3 Microscopic investigation
Microscopic investigation of the cement-shale interface was conducted to explain
the bond strength. Figure 3.43 and Figure 3.44 show photomicrographs of cement-shale
interfaces sealed with microfine cement and Novolac epoxy respectively. Figure 3.43
shows that microfine cement has a very limited penetration in the cement-shale interface.
Moreover, Novolac epoxy was found to discreetly fill the cement-shale interface as shown
in Figure 3.44. This shows that both microfine cement and Novolac epoxy were not able
to fill the 30 m microcracks. This explains the relatively low bond strength of both
materials. This also explains the reduction in the values of the bond strength measured
compared with those reported in section 3.3.1 for sealing of 800 m microcracks. On the
other hand, NM-MMA was able to completely fill 30 m microcracks as shown in Figure
3.45. In addition, NM-MMA was able to penetrate into the shale and cement surfaces which
can be explained by the capillary effect.

65
Figure 3.43: Microscopic images of cement-shale interface sealed with microfine cement
with two different sides showing depth of microfine cement penetration of cement paste
and shale sides.
Figure 3.44: Microscopic images of cement-shale interface sealed with Novolac epoxy
with two different levels of magnification showing gabs in sealed interface. Right photo
at high magnification shows the inability of epoxy to penetrate 30 m microcracks.

66
Figure 3.45: Microscopic images of cement-shale interface sealed with NM-MMA with
two different levels of magnification showing the ability of the NM-MMA seal repair
material to completely fill the gap at the shale-cement interface. Right photo proves the
ability of NM-MMA to fill the microcracks and infiltrate both shale and cement paste
sides.
3.4.4 Dynamical Mechanical Analysis (DMA)
The effect of incorporating ANPs in MMA on the viscoelastic behavior of MMA
polymer nanocomposites was investigated using DMA Q800. MMA and NM-MMA
specimens were subjected to constant tension stress of 3.5 MPa for 20 minutes. Afterward,
the strain was allowed to recover for 40 minutes. The change of strain with time was
recorded and the creep compliance was calculated using equation 3.7.
𝐽(𝑡) =𝜀(𝑡)
𝜎0....................................................................................................................(3.7)
where J(t) is the creep compliance [MPa-1], (t) is the time dependent strain, 0 is
the applied constant stress [MPa]. The viscoelastic behavior of MMA and NM-MMA
obtained from creep test is shown in Figure 3.46. The creep compliance calculated using
equation 3.7 is presented in Figure 3.47. For consistency, the initial creep compliance for

67
both MMA and NM-MMA was considered at time of 2 seconds for all specimens and it
was found to be 2394 ± 135.7 m2/N and 1988.2 ± 159.9 m2/N for MMA and NM-MMA
respectively. This represents a decrease of 17% in creep compliance due to incorporating
0.5 wt.% ANPs in MMA resin. Furthermore, the strain recovery was found to be 77.3 ±
2.4% and 83.0 ± 2.1% for MMA and NM-MMA respectively. Moreover, the elastic
modulus of MMA and NM-MMA was found to be 418.6 ± 23.4 MPa and 505.2 ± 41.9
MPa respectively.
Figure 3.46: The viscoelastic behavior of MMA and NM-MMA obtained from creep test.

68
Figure 3.47: Creep Compliance of MMA and NM-MMA calculated from equation 3.7.
To investigate the reinforcement effect of nanoparticles on the mechanical behavior
of polymer nanocomposites, several models were developed to estimate the mechanical
properties of the composite. The ability of two models to estimate the mechanical
properties of the MMA/ANPs polymer nanocomposite was investigated. The elastic
modulus of the NM-MMA was estimated using the modified rule of mixture presented by
equation 3.8 after Kuo et al. (2005).
𝐸𝑐 = 𝜂𝐸𝑝𝑉𝑝 + 𝐸𝑚𝑉𝑚.....................................................................................................(3.8)
where Ec is the composite modulus of elasticity [MPa], Ep is the particles modulus
of elasticity [MPa], Em is the matrix modulus of elasticity [MPa], Vp is the particles volume
fraction, Vm is the matrix volume fraction, and is strengthening coefficient. The modulus
of elasticity of ANPs was assumed to be 393 GPa after Naous et al. (2006). The matrix

69
modulus of elasticity was measured using DMA and the strengthening coefficient for ANPs
was assumed to be ≈ 0.1 for particles with aspect ratio ≈ 1 (Kuo et al. 2005). Moreover, the
Halpin–Tsai equation presented in equation 3.9 and equation 3.10 was also examined to
estimate the modulus of elasticity of NM-MMA polymer nanocomposite (Naous et al.
2006)
𝐸𝑐 = 𝐸𝑚 (1+𝜉𝜂𝑉𝑝
1−𝜂𝑉𝑝)..........................................................................................................(3.9)
𝜂 =
𝐸𝑝
𝐸𝑚−1
𝐸𝑝
𝐸𝑚+𝜉
......................................................................................................................(3.10)
The constant was assumed to be 2 for spherical particles like ANPs (Naous et al.
2006). The estimated modulus of elasticity of NM-MMA using the modified rule of
mixture and the Halpin–Tsai method compared with the measured value are shown in
Figure 3.48. The calculations show that the modified rule of mixture overestimated the
polymer nanocomposite modulus of elasticity by more than 29% while he Halpin–Tsai
underestimated the modulus by more than 15%. Failure of both models to estimate the
modulus of MMA-ANPs polymer nanocomposite can be explained by the fact that these
models are micromechanics models that do not take into account the potential chemical
reaction between the nanoparticles and the polymer matrix. Such chemical reaction can
alter the microstructure and the mechanical properties of the matrix and thus would result
in change in the polymer nanocomposite properties.

70
Figure 3.48: The estimated modulus of elasticity of NM-MMA using modified rule of
mixture and Halpin–Tsai method compared to the measured value; % above the bars
represents the difference of estimated modulus of elasticity compared with measured
value..
3.4.5 X-ray Diffraction (XRD)
Microstructural investigation using X-ray Diffraction (XRD) was conducted to
achieve further understanding of the effect of incorporating ANPs in MMA resin. XRD
was conducted using Rigaku, SmartLab XRD machine (Figure 3.49). The machine is
equipped with copper k alpha tube and 1 dimensional silicon strip detectors D/teX. The
scan was conducted from 0 to 90 degrees with 0.02 degrees’ step and scan rate of 6
degrees/min.

71
Figure 3.49: (a) Rigaku SmartLab XRD machine and (b) MMA sample on XRD sample
holder.
Polymers with semi-crystalline microstructure are well known to have higher
plastic deformation than aligned cross-linked polymers (Parks and Ahzi 1989, Bartczak,
Cohen, and Argon 1992, G'sell and Dahoun 1994). In addition, it was also reported that the
increase in degree of crystallinity in polymeric matrix would result in increase in the elastic
modulus (Ferry 1980). XRD scans for both MMA and NM-MMA specimens were
conducted to investigate the effect of incorporating ANPs on the degree of crystallization
of MMA (Figure 3.50). It can be observed from the XRD scans that two peaks (at 2 of
24° and 68°) were detected in the NM-MMA spectroscopy that are not observable in the
neat MMA profile. These peaks can be associated to 3-Methyl-1,5-diphenyl-4,5,9, 13b-
tetrahydro, which is considered a crystallized organic structure. The new peaks can be
associated with the increase in the degree of polymer crystallization (Bai et al. 1998). This
explains the significant increase in the failure displacement/ductility and the decrease in
creep compliance in the case of NM-MMA seal repair material compared with standard
MMA.

72
Figure 3.50: XRD scans for both MMA and NM-MMA specimens.

73
3.5 Phase IV: Seal performance investigation
The performance of seal repair material was defined in this research by the
efficiency of seal repair material in sealing microannuli and its ability to withstand harsh
environmental conditions. The efficiency of seal repair material was investigated using
integrated seal testing specifically developed to test seal performance. On the other hand,
durability test was used to investigate seal repair material’s ability to withstand harsh
environmental condition. Based on the results from Phase I, II, and II, MMA and Novolac
epoxy PNCs incorporating 0% and 0.5% ANPs were selected for the final phase of this
research.
3.5.1 Integrated seal testing
The efficiency of seal repair material to seal microannuli was defined by the
percentage reduction in gas permeability at the cement-steel interface. The gas
permeability was calculated using equation 3.11 based on Darcy’s law following Gatlin
(1960) and based on the assumption of linear (viscous) flow.
𝑘 =2𝑄𝜇𝐿𝑃𝑠𝑐
𝐴(𝑃12−𝑃2
2)..............................................................................................................(3.11)
Where, k is the gas permeability [m2], Q is the volumetric gas flow rate [m3/s],
is the viscosity of the gas [kg/m.s], L is the length of the gas flow path [m]. Psc is the
midpoint pressure value between upstream and downstream pressures [Pa], A is the cross-
sectional area of the flow [m2], P1 is the upstream pressure [Pa], and P2 is the downstream
pressure [Pa]. In case of non-linear flow, Forchheimer equation expressed by equation 3.12
which accounts for the flow non-linearity can be used (Forchheimer 1901).

74
−∇𝑃 =𝜇
𝑘𝐴𝑄 +
𝛽𝜌
𝐴2𝑄2 .............................................................................................(3.12)
Where, ∇P is the pressure gradient [Pa/m], is the inertial coefficient [m-1] and
is the gas density [kg/m3]. Equation 3.8 can be re-written as presented in equation 3.13
(Zeng and Grigg 2006).
MA(𝑃12−𝑃2
2)
2𝑧𝑅𝑇𝜇𝐿𝜌𝑄=
1
𝑘+ 𝛽
𝑄𝜌
𝜇𝐴.............................................................................................(3.13)
Where M is the gas molecular weight [kg/mol], z is the gas compressibility factor
(the value can be approximated to 1 (Davis 1992)), R the universal gas constant [8.314
kg.m2/s2.K.mol], and T is the gas temperature [K]. This equation is written in the form of
strain line where 1/k is the intercept with y axis and is the slope. Previous studies showed
that Forchheimer equation can be used to calculate the permeability through fractures
(Nowamooz, Radilla, and Fourar 2009, Zhang and Nemcik 2013, Javadi et al. 2014,
Stormont et al. 2018)
As it is shown in equations 3.11, 3.12, and 3.13, calculating the permeability
requires measuring the volumetric gas flow rate at the cement-steel interface. In the case
of relatively large flow rate, flowmeters with reading ranges from 5 to 150 standard
cm3/min. For smaller ranges, soap bubble flow meter or pressure drop-off method was used
to calculate the volumetric gas flow rate as presented in equation 3.14 (Jannot and Lasseux
2012).
𝑄 =𝑑𝑃
𝑑𝑡
𝑉
𝑃𝑎𝑣𝑟.................................................................................................................(3.14)
75
Where Q is the gas volumetric flow rate [m3/s], 𝑑𝑃
𝑑𝑡 is rate of change in pressure
with time [Pa/s], V is the volume of the upstream gas reservoir [m3], and Pavr is average
upstream gas pressure in the considered segment [Pa]. Once the gas permeability is
measured, the hydraulic aperture can be estimated using the cubic law (equation 3.15)
assuming that the gas flows only through the microannulus at cement-steel interface
(Stormont et al. 2018).
ℎ3 =12𝑘𝐴
𝑤...................................................................................................................(3.15)
Where h is the hydraulic aperture [m] and w is the length of the microannulus [m].
To investigate the efficiency of seal repair materials to seal microannulus cracks, sealed &
unsealed test specimens were prepared and tested in two stages. Stage 1, where cement-
steel interface was characterized and stage 2, where the sealed interface was tested under
casing pressure cycles.
3.5.1.1 Sample preparation
The specimen was made of 2.35 mm thick steel casing with an outer diameter of 60
mm confined with 20 mm thick cement sheath to simulate the cement-steel interface of the
wellbores. Integrated seal test specimen in shown in Figure 3.51. The cement was mixed
following the mixing method in ASTM C305 (ASTM 2014a) with mixing proportions as
presented in Table 3.6. While a typical water/binder ratio in wellbore cementing is 0.45
(API 2009), a water/binder ratio of 0.3 was selected for this research to achieve higher
cement strength than typical. The high strength was needed so that any flaws/cracks
generated would be at the cement-steel interface and not in the cement sheath itself. This
would allow the microannulus to govern gas permeability of the system rather cement

76
sheath cracks/porosity. The specimens were then cured for 7 days at 50 °C and 100%
humidity.
Table 3.6: Mixing proportions of cement sheath [kg/m3].
Cement (Type G) 1290
Silica Fume 129
Water 430
Superplasticizer 8.6
Water/binder ratio 0.3
Figure 3.51: Integrated seal test specimen.
To create microannulus cracks, the steel casing was debonded from the cement
sheath using dry ice as shown in Figure 3.52. Afterwards, the seal repair material was
injected into the microannulus at the cement-steel interface. This process was conducted
by introducing the seal repair material at one end of the integrated test specimen. Vacuum
pressure was then applied at the other end of specimen until the seal repair material was
observed at the other end of the specimen. The setup used for the injection of seal repair

77
material and schematic of sealed specimen are shown in Figure 3.53 and Figure 3.54
respectively.
Figure 3.52: Debonding steel casing from the cement sheath using dry ice.
Figure 3.53: Schematic of seal repair material injection setup.
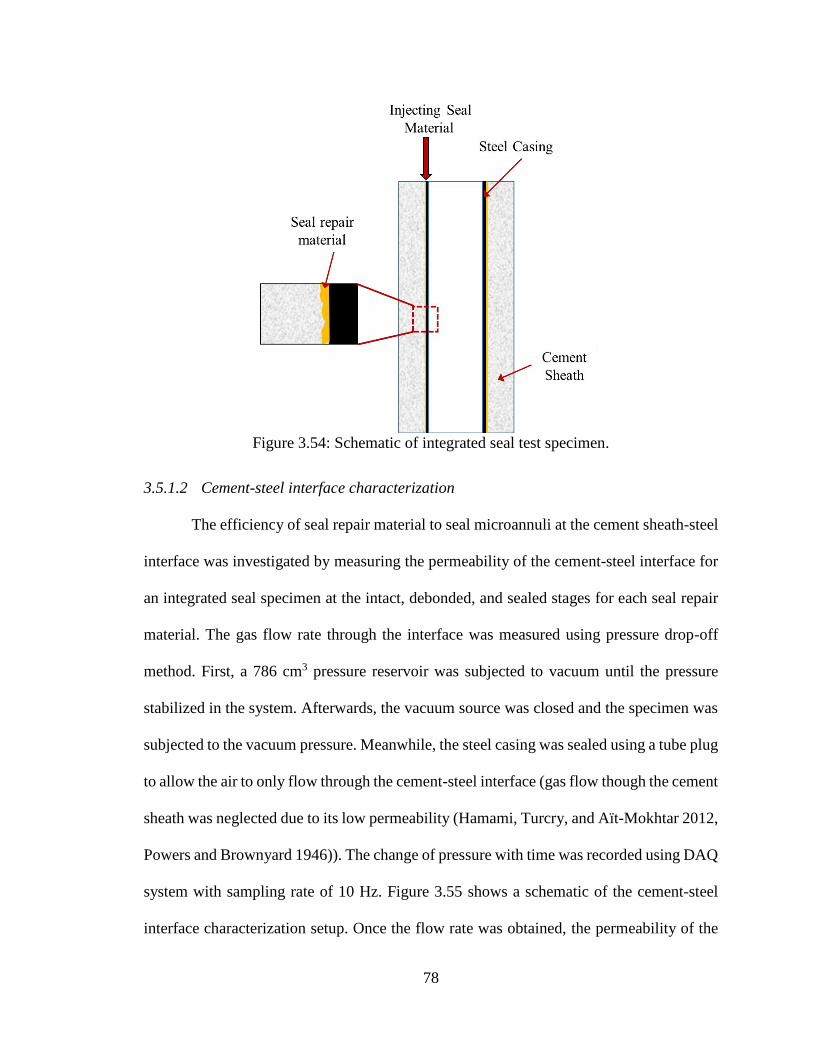
78
Figure 3.54: Schematic of integrated seal test specimen.
3.5.1.2 Cement-steel interface characterization
The efficiency of seal repair material to seal microannuli at the cement sheath-steel
interface was investigated by measuring the permeability of the cement-steel interface for
an integrated seal specimen at the intact, debonded, and sealed stages for each seal repair
material. The gas flow rate through the interface was measured using pressure drop-off
method. First, a 786 cm3 pressure reservoir was subjected to vacuum until the pressure
stabilized in the system. Afterwards, the vacuum source was closed and the specimen was
subjected to the vacuum pressure. Meanwhile, the steel casing was sealed using a tube plug
to allow the air to only flow through the cement-steel interface (gas flow though the cement
sheath was neglected due to its low permeability (Hamami, Turcry, and Aït-Mokhtar 2012,
Powers and Brownyard 1946)). The change of pressure with time was recorded using DAQ
system with sampling rate of 10 Hz. Figure 3.55 shows a schematic of the cement-steel
interface characterization setup. Once the flow rate was obtained, the permeability of the

79
cement-steel interface was calculated using Forchheimer equation. Finally, the efficiency
of seal repair material was calculated using Equation 3.16.
Figure 3.55: Schematic of the cement-steel interface characterization setup.
𝐸 =log 𝐾𝑑−log 𝐾𝑟
log 𝐾𝑑−log 𝐾𝑖%..................................................................................................(3.16)
Where, E is efficiency of seal repair material [%], r is the permeability of
specimen (sealed) [m2], d is the permeability of specimen (debonded) [m2], and i is the
permeability of intact reference specimen [m2].
The permeability and the hydraulic aperture of debonded and sealed integrated seal
specimens for each seal repair material in addition to the permeability and the hydraulic
aperture of the reference intact specimen are presented in Table 3.7 and Table 3.8
respectively. The relatively high values of permeability of reference intact specimen and
seal samples can be due to leaks in the characterization setup. However, the setup was used

80
for the characterization measurements of all samples. Thus, the efficiency calculations and
comparisons would be valid.
The seal efficiency of investigated seal repair materials is shown in Figure 3.56.
The results show that the efficiency of microfine cement efficiency was limited to 24%.
Despite the fact that Novolac epoxy PNCs partially penetrated the microannulus at the
cement-steel interface, PNCs seal efficiency of 91% and 79% were observed for neat
Novolac epoxy and Nano modified Novolac epoxy with 0.5% ANPs (NM-Novolac)
respectively. This relatively high efficiency can be explained by the fact that even with
partial penetration, Novolac epoxy PNCs were able to seal the microannuli and reduce the
gas permeability. The reduction in seal efficiency of Novolac epoxy to that with ANPs
attributed to the fact that incorporating ANPs increases epoxy viscosity which reduces the
ability of PNCs to penetrate microannuli. On the other hand, MMA and NM-MMA were
able to demonstrate seal efficiency of 97% and 103% respectively. These results show that
MMA and NM-MMA were able to completely penetrate and fill the microannuli at the
cement sheath-steel interface and block gas permeation. This resulted in measured
permeability values even lower than the permeability of the reference intact specimen.
Moreover, it was observed that incorporating ANPs resulted in reduction in the seal
efficiency of Novolac epoxy while it did not have the same effect on MMA. This can be
explained by the fact that incorporating ANPs in MMA had a negligible effect on the
viscosity and surface tension of MMA.

81
Table 3.7: Permeability of intact, debonded, and sealed integrated seal specimens [m2].
Seal Repair
Material
Reference Intact
Specimen
Debonded
Specimen Sealed Specimen
Microfine Cement
1.84×10⁻¹⁶
2.33×10⁻¹⁴ 72×10-16
Novolac 2.29×10⁻¹⁴ 2.86×10⁻¹⁶
NM-Novolac 1.13×10⁻¹⁴ 4.29×10⁻¹⁶
MMA 0.48×10⁻¹⁴ 2.14×10⁻¹⁶
NM-MMA 1.48×10⁻¹⁴ 1.62×10⁻¹⁶
Table 3.8: Hydraulic aperture of intact, debonded, and sealed integrated seal specimens
[m].
Seal Repair
Material
Reference Intact
Specimen
Debonded
Specimen Sealed Specimen
Microfine Cement
3.7
18.7 12.6
Novolac 18.6 4.3
NM-Novolac 14.7 4.9
MMA 11.1 3.9
NM-MMA 16.1 3.6

82
Figure 3.56: Seal efficiency of different seal repair materials used for restoring wellbore
seal integrity.
3.5.1.3 Casing pressure cycles
To investigate the performance of seal repair material under cyclic pressure,
pressure vessel setup which is capable of applying up to 35 MPa and 25 MPa confining
and casing pressure respectively was used. Constant confining pressure and cycles of
casing pressure were applied. Meanwhile, inert gas (Nitrogen) was allowed to flow at the
cement-steel interface. The flow rate was measured and gas permeability was calculated.
In this investigation, confining pressure of 0.34 MPa (50 psi) was applied to ensure that
there is no flow bypass between the specimens and the pressure vessel’s bladder. Cycles
of casing pressure ranging from 0.7 to 10.3 MPa (100 to 1500 psi) were then applied. The
change of microannulus permeability versus the number of pressure cycles was recorded
until loss of integrity was observed. Figure 3.57 shows the pressure vessel setup.

83
Figure 3.57: Integrated seal test setup.
The number of casing pressure cycles applied until loss of seal integrity of sealed
specimens is presented in Figure 3.58. Seal integrity was considered to fail when the seal
efficiency of integrated seal specimens dropped to 50% of its initial value. Experimental
observations show that the number of cycles to seal integrity loss of specimens sealed with
NM-MMA was two order of magnitude higher than the specimens sealed with microfine
cement respectively. The very poor efficiency of microfine cement in sealing microannulus
and its inability to withstand any cycles of stress surprising given the fact it is the standard
seal repair material used by the industry. It was also found that the failure of the seal
integrity of specimen sealed MMA and NM-MMA were due to crack of cement sheath and
not due to failure of the seal repair material as shown in Figure 3.59 and Figure 3.60.
Although in both MMA and NM-MMA sealed specimens’ loss of seal integrity was due to
cracks in the cement sheath, it was found that there is 45% increase of number of cycles
associated with incorporating ANPs in MMA. This significant improvement can be
explained by the ability of MMA based materials to impregnate the cement sheath-steel

84
interface as well as the cement sheath in the vicinity of the interface. The higher ductility
of NM-MMA compared to MMA improved the energy dissipation of cement sheath. This
conclusion is supported by an observation that post cyclic tests, one single crack in the
specimen sealed with MMA was observed compared with the two cracks in the specimen
sealed with NM-MMA as shown in Figure 3.59 and Figure 3.60.
Figure 3.58: Number of casing pressure cycles applied until failure of seal integrity of
sealed specimens.

85
Figure 3.59: Post cyclic test integrated seal specimen sealed with MMA showing a single
longitudinal crack in the cement sheath.
Figure 3.60: Post cyclic test integrated seal specimen sealed with NM-MMA showing
two longitudinal cracks in the cement sheath.
The change of seal efficiency of seal repair materials with the number of casing
pressure cycles is presented in Figure 3.61. It was found that microfine cement was able to
only hold one casing pressure cycle after which its efficiency dropped from 24% to 12%
in only 2 cycles. Novolac epoxy and NM-Novolac epoxy were able to withstand 10 cycles

86
before any significant loss of efficiency was observed. After the first 10 cycles, Novolac
epoxy’s efficiency rapidly drop from 90% to 80%. Afterwards, the efficiency was found to
be stable for 30 cycles. Novolac seal efficiency then dropped rapidly. On the other hand,
NM-Novolac epoxy did not follow the same 3-staged cycles-efficiency curves as observed
in neat Novolac epoxy. NM-Novolac epoxy showed gradual reduction in efficiency with
increased number of casing pressure cycles. The behavior of integrated seal test specimen
sealed with NM-Novolac epoxy did not have the steady state stage where the seal
efficiency was constant with increased number of casing pressure cycles that was observed
with neat Novolac epoxy. The gradual loss of seal efficiency of NM-Novolac epoxy
compared with neat Novolac can be explained by the relatively higher bond strength of
NM-Novolac epoxy to steel compared with neat Novolac epoxy (Genedy et al. 2014). The
absence of the steady state stage of the cycles-efficiency curve was due to the increase in
the viscosity associated with incorporating ANPs in Novolac epoxy. This increase in
viscosity limited the penetration depth of NM-Novolac epoxy. This hypothesis can also be
supported by the increase of efficiency observed at 90 cycles. This increase did not hold
and the drop of efficiency immediately continued afterwards.

87
Figure 3.61: Change of seal efficiency of seal repair materials with number of casing
pressure cycles.
For MMA, no significant loss of seal efficiency was observed until cracking of the
cement sheath occurred at 208 cycles. Moreover, NM-MMA showed significant increase
in seal efficiency with cycles of casing pressure reaching 301 cycles. This increase of
efficiency was due to the improved ductility resulted from incorporating ANPs in MMA
PNCs. With increasing the casing pressure, the steel casing applied pressure on the seal
repair material at the cement-steel interface forcing it to fill open microannuli and reduce
the permeability of the interface. When the pressure is released, ductile seal repair material
such as MMA would return to its original state with almost no change of permeability while
brittle materials such as microfine cement would fail under such extreme deformations. On
the other hand, Improvement in seal efficiency of specimen sealed with NM-MMA due to
applying casing pressure can be explained in Figure 3.62. Prior to applying casing pressure,
some gaps at the cement sheath surface could remain unfilled after injecting NM-MMA

88
seal repair materials as shown in Figure 3.62(a). Applying casing pressure would allow
steel casing to expand forcing NM-MMA seal repair material against the surface of the
cement sheath and close unfilled gaps as shown in Figure 3.62(b). Once the casing pressure
is released, NM-MMA seal repair material would expand and retain its the new shape
(Figure 3.62(c)) due to its significant high ductility resulting in improved in seal efficiency
despite the increase in casing pressure cycles. It can be concluded from performance
investigation that NM-MMA is the most suitable seal repair material to restore wellbore
seal integrity.
Figure 3.62: Effect of casing pressure cycles on cement-steel interface sealed with NM-
MMA: (a) Prior to applying casing pressure, (b) Maximum casing pressure applied, and
(c) Casing pressure released.
3.5.2 Durability study
The wellbore environment is very aggressive due to the existence of carbonated
water, saline, and other chemicals in addition to the high pressure and elevated temperature
(Kutchko et al. 2007, Duguid and Scherer 2010, Huet, Prevost, and Scherer 2010, Zhang
and Bachu 2011, Matteo et al. 2018). The resistance of polymer nanocomposites to
wellbore environmental condition was investigated. The durability of seal repair material

89
was investigated using weight loss test. For durability study tests, samples of the seal repair
materials were exposed to the following environmental conditions:
1- Air
2- Deionized Water
3- Carbonated Brine
4- Crude Oil
5- High temperature and pressure
The exposure to water, carbonated brine, and crude oil was conducted by
immersion test following ASTM D543-14 (ASTM 2014c). Polymer nanocomposites and
microfine cement specimens as shown in Figure 3.63 was immersed in the chemicals listed
above. Carbonated brine used in the investigation was designed after the flow back brine
from Marcellus gas wells in Pennsylvania, USA (Haluszczak, Rose, and Kump 2013).
Exposure to high temperature and pressure was conducted using reactor setup shown in
Figure 3.64. The temperature in the reactor was maintained at 80° C and Nitrogen gas was
injected into the reactor and pressure was maintained at 10.3 MPa (1500 psi) for 7 days.
Figure 3.63: Weight loss test (a) Specimen dimensions and (b) specimens in different
chemicals.
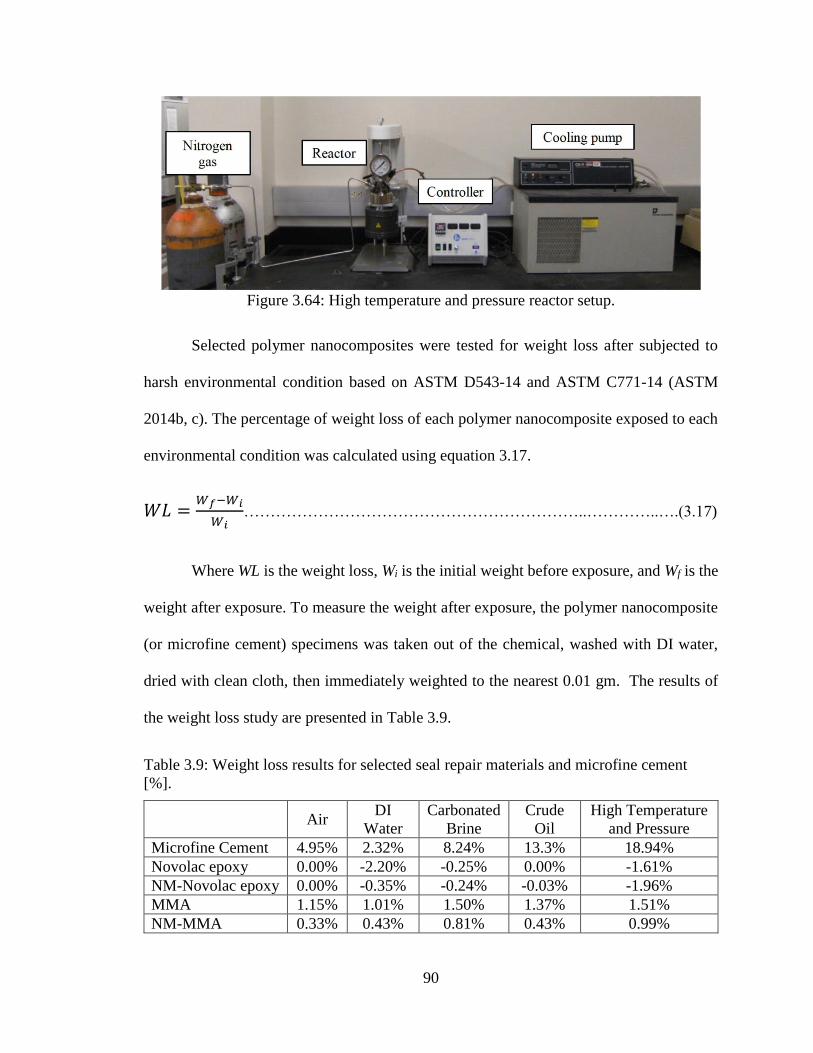
90
Figure 3.64: High temperature and pressure reactor setup.
Selected polymer nanocomposites were tested for weight loss after subjected to
harsh environmental condition based on ASTM D543-14 and ASTM C771-14 (ASTM
2014b, c). The percentage of weight loss of each polymer nanocomposite exposed to each
environmental condition was calculated using equation 3.17.
𝑊𝐿 =𝑊𝑓−𝑊𝑖
𝑊𝑖………………………………………………………..…………..….(3.17)
Where WL is the weight loss, Wi is the initial weight before exposure, and Wf is the
weight after exposure. To measure the weight after exposure, the polymer nanocomposite
(or microfine cement) specimens was taken out of the chemical, washed with DI water,
dried with clean cloth, then immediately weighted to the nearest 0.01 gm. The results of
the weight loss study are presented in Table 3.9.
Table 3.9: Weight loss results for selected seal repair materials and microfine cement
[%].
Air DI
Water
Carbonated
Brine
Crude
Oil
High Temperature
and Pressure
Microfine Cement 4.95% 2.32% 8.24% 13.3% 18.94%
Novolac epoxy 0.00% -2.20% -0.25% 0.00% -1.61%
NM-Novolac epoxy 0.00% -0.35% -0.24% -0.03% -1.96%
MMA 1.15% 1.01% 1.50% 1.37% 1.51%
NM-MMA 0.33% 0.43% 0.81% 0.43% 0.99%

91
The durability study showed that chemical exposure has no weight loss effect on
Novolac epoxy PNCs. Moreover, microfine cement showed weight losses ranges between
5% up to 19%. This very high weight loss percentages were due to the fact that exposure
to harsh environmental conditions resulted in significant cracking of microfine cement
specimens that allowed small fractions to fall apart as shown in figure 3.65. On other hand,
the weight loss of neat MMA PNCs was found to be in the range between 1% and 1.5%.
However, incorporating ANPs in MMA was able to significantly improve the durability of
MMA PNCs. Although the results showed that harsh wellbore’s environmental conditions
have higher effect on MMA based PNCs than on Novolac epoxy based PNCs, that effect
of wellbore environment on MMA based PNCs was still significantly lower than the effect
on microfine cement.
Figure 3.65: Microfine cement fractions falling apart due to harsh environmental
conditions.

92
Chapter 4. Conclusions
In this dissertation, a new seal repair material to restore wellbore seal integrity was
developed. An efficient seal repair material should have good bond strength with both steel
and rock formations. In addition, seal repair material should be able to fill thin microcracks
at both the interfaces (microannuli) and withstand harsh wellbore environmental
conditions. This investigation was conducted in four consecutive phases: Phase (I) Cement-
steel interface, Phase (II) Cement-rock formation interface, Phase (III) Penetrability of seal
repair material, and Phase (IV) Investigating performance of sealed interfaces in realistic
wellbore conditions. In this chapter, the conclusions of this investigation are presented then
followed by the recommendations and suggestions for future work.
4.1 Conclusions
The flowability and bond strength of 19 polymer cement nanocomposites (PCNCs)
with steel surfaces were investigated. First, 7 Polysulfide Siloxane epoxy based PCNCs
and 7 Novolac epoxy based the PCNCs were examined. While incorporating nanoparticles
resulted in reduction of flowability of PCNCs, it was observed that the nanoparticles effect
on Polysulfide Siloxane epoxy PCNCs was much higher than their effect on Novolac epoxy
PCNCs flowability. It was also observed that all Novolac epoxy PCNCs have higher
flowability than microfine cement while all Polysulfide Siloxane epoxy PCNCs have lower
flowability than microfine cement. It became apparent that Polysulfide Siloxane epoxy
might not be a suitable seal repair material for wellbores.
Moreover, COOH functionalized MWCNTs were able to improve the bond
strength of Polysulfide Siloxane epoxy with 49% over standard microfine cement. Other

93
nanoparticles such as silica and alumina based nanoparticles showed an adverse effect on
bond of Polysulfide Siloxane epoxy. On the other hand, COOH functionalized MWCNTs
showed an insignificant improvement of Novolac epoxy bond strength to steel surfaces.
However, incorporating silica and alumina based nanomaterials made significant
improvement in bond strength in Novolac epoxy. Incorporating 2.0 wt.% aluminum
nanoparticles (ANPs) in Novolac epoxy PCNC showed the highest bond strength with steel
surfaces (200% compared with microfine cement) and it had a very low effect on PCNC
flowability (only 8% lower than neat Novolac epoxy PCNC). Thus, an extended
investigation of Novolac epoxy PCNCs incorporating 0.5% to 4.0% ANPs was conducted.
The extended investigation on incorporating ANPs in Novolac epoxy showed that
2.0 wt.% resulted in the highest improvement in bond strength with steel surfaces. The
extended investigation also showed relatively high variability in the bond strength. This
variability was observed also with 3.0% and 4.0% ANPs. Moreover, it was observed that
there was no significant improvement in the bond strength with incorporating 1.5% ANPs
when compared to 1.0% ANPs. On the other hand, incorporating 0.5% and 1.0% ANPs in
Novolac epoxy showed 20% and 23% increase in the bond strength, respectively, in
addition to only 6.0% reduction in flowability. It can be concluded that Novolac epoxy
incorporating up to 1.0 wt.% ANPs results in the best seal performance considering both
flowability and bond strength. It was decided to only consider Novolac epoxy in Phase II
of the investigation.
In Phase II, viscosity measurements were obtained to investigate the feasibility of
using Novolac epoxy PNCs as seal repair material. Moreover, push-out tests were
conducted to examine the bond strength of the cement paste-shale interface sealed with

94
microfine cement and Novolac epoxy PNCs incorporation 0% (Neat), 0.25%, 0.5%,
and1.0% ANPs. The bond strengths were compared with a reference case where Type G
cement paste was cast directly around the shale core. Microstructural investigations were
also conducted to understand the behavior at the interface using microscopic images, FTIR
and DMA.
Viscosity tests showed that all Novolac epoxy PNCs incorporating ANPs have
viscosities that are comparable to that of microfine cement, which might enable using
PNCs incorporating ANPs as seal repair material for microannulus cracks. Push-out test
showed that microfine cement has a bond strength that is 21% lower than the reference
case. In contrast, Novolac epoxy PNCs incorporating ANPs showed bond strength up to
250% higher than the reference case. Microscopic investigation of the shale-cement
interface showed that microfine cement was unable to completely fill the 800 m gap, and
microcracks along the interface with widths up to 40 m remained open and unsealed.
However, no gap was observed with ANPs-epoxy nanocomposites. In addition, the
displacement at peak load and the toughness of PNCs were up to 545% and 761% higher
than the displacement at peak load and toughness of microfine cement respectively.
Furthermore, FTIR and DMA measurements showed that incorporating ANPs in
Novolac epoxy PNCs were able to interrupt the epoxy crosslinking process of PNCs and
reduce the crosslinking density. This process allows free epoxy groups and improves the
bond strength with shale surfaces. Moreover, DMA crosslinking measurements showed
that 0.5% ANPs was enough to complete the chemical reaction and interrupt the
crosslinking process, the rest of the alumina nanoparticles worked as particular
reinforcement in the epoxy matrix. Due to the small particle size (50 nm) and the relatively

95
low content for reinforcement, only limited improvement of ANPs as reinforcement was
observed. Thus, it can be concluded that the optimum ANPs content to achieve the highest
effective improvement to cost ratio is 0.5% of the polymer weight.
In Phase III, the ability of MMA and NM-MMA incorporating ANPs in addition to
Neat Novolac epoxy PNCs to penetrate thin microannuli (below 30 m) was investigated.
MMA and NM-MMA were included in this investigation due to their superior flowability
and potential to fill very thin microcracks compared with Novolac epoxy and microfine
cement. A penetrability study based on surface tension and contact angle measurement of
seal repair materials with cement paste surface was performed. The investigation indicated
that MMA and NM-MMA have the ability to penetrate smaller microannuli than Novolac
epoxy and microfine cement under similar conditions. Microscopic investigation of the
shale-cement interface was used to scrutinize the hypothesis. Microscopic investigation
showed that microfine cement did not flow through 30 m microcracks and it has a very
limited penetration depth. Moreover, Novolac epoxy was also unable to completely fill the
microcrack between the shale and the cement sheath. In contrast, MMA-based seal repair
materials were able to completely fill the wellbore microcracks.
Moreover, MMA based PNCs showed improved bond strength (1061% higher
than microfine cement), excellent ductility (468% higher displacement at failure than
microfine cement), and superior toughness (8135% higher than microfine cement). The
improved mechanical properties of NM-MMA showed that it would have superior
performance as a seal repair material compared with microfine cement currently used as
the standard material for microannuli seal. It was found that incorporating 0.5% ANPs by
weight in MMA was able to increase the displacement at failure (ductility) and toughness

96
by 122% and 201% respectively. Viscoelastic investigation using DMA showed that
incorporating ANPs in MMA matrix reduced creep compliance of NM-MMA by 17% and
improved creep recovery by 7.3%. XRD analysis showed that incorporating ANPs in
MMA increased the degree of polymer crystallization of MMA enabling significant
increase in polymer ductility and toughness and a reduction of polymer creep compliance.
In Phase IV, we examined the integrated performance of selected seal repair
materials. The performance of seal repair materials was evaluated based on their efficiency
to seal cement-steel interface, the ability to withstand cyclic casing pressure, and the ability
to withstand harsh environmental conditions. A seal efficiency parameter was defined and
the results showed that microfine cement efficiency was limited to 24%. On the other hand,
NM-MMA achieved seal efficiency as high as 103%. Moreover, NM-MMA withstood
casing pressure cycles two orders of magnitude higher than microfine cement.
The durability investigation showed that microfine cement exposed to wellbore
harsh environmental conditions showed weight loss ranges between 5% up to 19%. On the
other hand, exposure had no weight loss effect on Novolac epoxy PNCs. Moreover, the
weight loss of neat MMA PNCs was found to be in the range between 1% and 1.5%.
However, incorporating ANPs in MMA significantly improved the durability of MMA
PNCs. Although the results showed that harsh environmental conditions could have a
higher effect on MMA based PNCs than on Novolac epoxy based PNCs, that effect on
MMA based PNCs was still significantly lower than the effect on microfine cement.
In conclusion, investigations in this dissertation showed that Novolac epoxy and
MMA based polymer nanocomposites have a higher bond strength and excellent
performance in sealing microannuli at cement-steel and cement-shale interfaces than

97
microfine cement. Moreover, microstructural investigations proved that incorporating
ANPs significantly improved the bond strength and ductility of Novolac epoxy and MMA
polymer nanocomposites. In addition, it was found that 0.50 wt.% is the optimal content
of ANPs for seal using MMA and Novolac epoxy.
4.2 Limitations and future work
4.2.1 Bond strength
Bond strength of the seal repair materials in this investigation was evaluated based
on its bond with stainless steel and shale. Bond strength with other types of rock such as
limestone, granite, and consolidated salt needs to be investigated. In addition, a study on
the effect of a rock formation’s degree of saturation on the bond strength is recommended.
Moreover, the bond strength of seal repair materials with corroded steel casing is also
recommended.
4.2.2 Chemical exposure and environmental conditions
All experimental work in this investigation was conducted at ambient conditions.
Curing seal repair materials and testing under high temperature and pressure conditions
would allow better understanding of the behavior of seal repair materials in realistic
wellbore conditions. Furthermore, bond strength and sealing efficiency exposed to harsh
environmental conditions would be beneficial for further understanding of the efficiency
of proposed seal repair materials.
4.2.3 Integrated seal testing
For the integrated seal test, the seal repair materials were injected from one end of
the test specimens. Sealing the specimens through perforations in the steel casing as shown

98
in Figure 4.1 would cover other seal situations. In addition, investigating the seal efficiency
of seal repair materials to seal microannuli with different crack size is needed. Furthermore,
evaluating the cement-steel interface using CT scan techniques is recommended. CT
investigation would give in-depth understanding of the continuity of microannuli and its
effect on the permeability of the interface in addition to the ability of seal repair materials
to seal such very thin microannuli. In this study, the seal repair materials were injected into
microannuli filled only with air. The ability of seal repair materials to replace other fluids
such as water, brine, crude oil, or drilling mud (Bentonite slurry) requires further
investigation.
Figure 4.1: Schematic of sealing integrated seal specimen through perforation in the steel
casing.
4.2.4 Finite Element (FE) modeling
Finite Element (FE) analysis using ABAQUS/CAE simulation environment in
order to simulate push-out test with both shale and steel core is recommended for further

99
understanding of the bond mechanics. Such FE model can then be used to investigate the
bond mechanics of the seal repair material with a shale/steel surface. Contact element can
be used to define the interface between the shale/steel and cement sheath. In this element,
the cohesive behavior of polymer nanocomposites following the bilinear shear stress-slip
model shown in Figure 4.2 and equation (4.1) can be defined. The interface interaction
parameters including mode II fracture energy (GII), shear contact stiffness (Kt), and
maximum displacement at failure (max) can be back solved to match the load-displacement
curve generated from the FE model with the load-displacement curve obtained from the
experiment. Such model would be very beneficial to simulate the effect of seal repair
materials on limiting leakage in wellbores and caverns.
𝐺𝐼𝐼 =1
2𝜏𝑚𝑎𝑥𝛿𝑚𝑎𝑥 ……………………..…………..……………………………….(4.1)
Figure 4.2: Bilinear shear stress-slip interface interaction model.

100
References
AASHTO. 2010. AASHTO T316: Standard method of test for viscosity determination of
asphalt binder using rotational viscometer.
Abel, M., J. F. Watts, and R. P. Digby. 2004. "The influence of process parameters on the
interfacial chemistry of γ-GPS on aluminium: A review." The Journal of Adhesion
80 (4):291-312.
Aboubakr, S. H., U. F. Kandil, and M. Reda Taha. 2014. "Creep of epoxy–clay
nanocomposite adhesive at the FRP interface: A multi-scale investigation."
International Journal of Adhesion and Adhesives 54:1-12.
Alberty, M., and Z. Yao. 2018. "A Practical Method to Monitor Wellbore Strengthening
Particle Concentration." IADC/SPE Drilling Conference and Exhibition.
Antonio, L., O. D. Barrios, and G. A. M. Rodriguez. 2007. "Swelling packer technology
eliminates problems in difficult zonal isolation in tight-gas reservoir completion."
Latin American & Caribbean Petroleum Engineering Conference.
API. 2009. 10A, Specification for cements and materials for well cementing. Washington
DC: American Petroleum Institute Publishing Services. .
ASTM. 2005. ASTM C882/C882M: Standard test method for bond strength of epoxy-resin
systems used with concrete by slant shear.
ASTM. 2007. ASTM C1437: Standard test method for flow of hydraulic cement mortar.
Philadelphia, PA: ASTM International.
ASTM. 2014a. C305: Standard Practice for Mechanical Mixing of Hydraulic Cement
Pastes and Mortars of Plastic Consistency. Philadelphia, PA: ASTM International.
ASTM. 2014b. C771: Standard Test Method for Weight Loss After Heat Aging of
Preformed Tape Sealants. Philadelphia, PA: ASTM International
ASTM. 2014c. D543: Standard practices for evaluating the resistance of plastics to
chemical reagents. Philadelphia, PA: ASTM International.
Bagal, J.h, G. Onadeko, P. Hazel, and V. Dagestad. 2016. "Annular Barrier as an
Alternative to Squeezes in Challenging Wells: Technology Review and Case
Histories."

101
Bai, S., J. Z. Hu, R. J. Pugmire, D. M. Grant, C. M. V. Taylor, J. B. Rubin, and E. J.
Peterson. 1998. "Solid state NMR and wide angle X-ray diffraction studies of
supercritical fluid CO2-treated poly (ethylene terephthalate)." Macromolecules 31
(26):9238-9246.
Bakar, M., M. Kostrzewa, B. Hausnerova, and K. Sar. 2010. "Preparation and property
evaluation of nanocomposites based on polyurethane‐modified
epoxy/montmorillonite systems." Advances in Polymer Technology 29 (4):237-
248.
Baldan, A. 2004. "Adhesively-bonded joints and repairs in metallic alloys, polymers and
composite materials: adhesives, adhesion theories and surface pretreatment."
Journal of materials science 39 (1):1-49.
Barlet-Gouédard, V., G. Rimmelé, B. Goffé, and O. Porcherie. 2007. "Well technologies
for CO2 geological storage: CO2-resistant cement." Oil & Gas Science and
Technology-Revue de l'IFP 62 (3):325-334.
Barlet-Gouedard, V., G. Rimmele, B. Goffe, and O. Porcherie. 2006. "Mitigation strategies
for the risk of CO2 migration through wellbores." IADC/SPE drilling conference.
Bartczak, Z., R.E. Cohen, and A.S. Argon. 1992. "Evolution of the crystalline texture of
high-density polyethylene during uniaxial compression." Macromolecules 25
(18):4692-4704.
Bellabarba, M., H. Bulte-Loyer, B.t Froelich, S. Le Roy-Delage, R. van Kuijk, S. Zeroug,
D. Guillot, N. Moroni, S. Pastor, and A. Zanchi. 2008. "Ensuring zonal isolation
beyond the life of the well." Oilfield Review 20 (1):18-31.
Benge, G. 2009. "Improving wellbore seal integrity in CO2 injection wells." SPE/IADC
Drilling Conference and Exhibition.
Berry, D. H., and A. Namkanisorn. 2005. "Fracture toughness of a silane coupled polymer-
metal interface: Silane concentration effects." The Journal of Adhesion 81 (3-
4):347-370.
Blunt, M. J. 2017. Multiphase flow in permeable media: A pore-scale perspective:
Cambridge University Press.
102
Browning, L. A., and J. D. Smith. 1993. "Analysis of the rate of and reasons for injection
well mechanical integrity test failure." SPE/EPA Exploration and Production
Environmental Conference.
Carey, B. and C. Gardner. 2012. Wellbore Integrity Network(No. LA-UR-12-22410). Los
Alamos National Laboratory (LANL).
Carey, J. W., M. Wigand, S. J. Chipera, G. WoldeGabriel, R. Pawar, P. C. Lichtner, S. C.
Wehner, M. A. Raines, and G. D. Guthrie. 2007. "Analysis and performance of oil
well cement with 30 years of CO 2 exposure from the SACROC Unit, West Texas,
USA." International Journal of Greenhouse Gas Control 1 (1):75-85.
Celia, M. A., S. Bachu, J. M. Nordbotten, S. E. Gasda, and H. K. Dahle. 2005. "-
Quantitative estimation of CO 2 leakage from geological storage: Analytical
models, numerical models, and data needs." In Greenhouse Gas Control
Technologies 7, 663-671. Elsevier.
Chatterji, J., R. S. Cromwell, B. R. Reddy, and B. J. King. 2001. Resilient well cement
compositions and methods. Google Patents.
Checkai, D., S. Bryant, and Q. Tao. 2013. "Towards a frequency distribution of effective
permeabilities of leaky wellbores." Energy Procedia 37:5653-5660.
Chen, Y., K. Gao, E. S. Davis, D. N. Sinha, C. P., and L. Huang. 2018. "Full-waveform
inversion and least-squares reverse-time migration imaging of collimated
ultrasonic-beam data for high-resolution wellbore integrity monitoring." Applied
Physics Letters 113 (7):071903.
Childers, M. I., M. Nguyen, K. A. Rod, P. K. Koech, W. Um, J. Chun, V.Glezakou, D.
Linn, T. J. Roosendaal, and T. W. Wietsma. 2017. "Polymer-Cement Composites
with Self-Healing Ability for Geothermal and Fossil Energy Applications."
Chemistry of Materials 29 (11):4708-4718.
Chung, D. D. L. 2000. "Interface engineering for cement-matrix composites." Composite
Interfaces 8 (1):67-81.
Condor, J., and K. Asghari. 2009. "Experimental study of stability and integrity of cement
in wellbores used for CO2 storage."
Cooke Jr, C. E. 1994. Apparatus for determining mechanical integrity of wells. Google
Patents.

103
Courard, L. 1999. "How to analyse thermodynamic properties of solids and liquids in
relation with adhesion?" Proceedings of the 2nd International RILEM Symposium
ISAP 99.
Crow, W., J. W. Carey, S. Gasda, D. B. Williams, and M. Celia. 2010. "Wellbore integrity
analysis of a natural CO2 producer." International Journal of Greenhouse Gas
Control 4 (2):186-197.
Davies, R. J., S. Almond, R. S. Ward, R. B. Jackson, C. Adams, F. Worrall, L. G.
Herringshaw, J. G. Gluyas, and M. A. Whitehead. 2014. "Oil and gas wells and
their integrity: Implications for shale and unconventional resource exploitation."
Marine and Petroleum Geology 56:239-254.
Davis, E. S. 2018. Development of a Novel 3D Acoustic Borehole Integrity Monitoring
System. Los Alamos National Lab.(LANL), Los Alamos, NM (United States).
Davis, R. S. 1992. "Equation for the determination of the density of moist air (1981/91)."
Metrologia 29 (1):67.
De Simone, M., F. L. G. Pereira, and D. M. Roehl. 2017. "Analytical methodology for
wellbore integrity assessment considering casing-cement-formation interaction."
International Journal of Rock Mechanics and Mining Sciences 94:112-122.
Devol-Brown, I., E. Tinseau, D. Bartier, A. Mifsud, and D. Stammose. 2007. "Interaction
of Tournemire argillite (Aveyron, France) with hyperalkaline fluids: Batch
experiments performed with powdered and/or compact materials." Physics and
Chemistry of the Earth, Parts A/B/C 32 (1-7):320-333.
Douba, A., M. Genedy, E. N. Matteo, U. F. Kandil, J. Stormont, and M. M. Reda Taha.
2017. "The significance of nanoparticles on bond strength of polymer concrete to
steel." International Journal of Adhesion and Adhesives 74:77-85.
Duguid, A., and J. Tombari. 2007. "Technologies for measuring well integrity in a CO2
field." Sixth Annual Conference on Carbon Capture and Sequestration—
DOE/NETL, May.
Duguid, A., and G. W. Scherer. 2010. "Degradation of oilwell cement due to exposure to
carbonated brine." International Journal of Greenhouse Gas Control 4 (3):546-
560.

104
Emiroglu, M., A. Douba, R. A. Tarefder, U. F. Kandil, and M. Reda Taha. 2017. "New
Polymer Concrete with Superior Ductility and Fracture Toughness Using Alumina
Nanoparticles." Journal of Materials in Civil Engineering 29 (8):04017069.
Fan, M., J. Li, and G. Liu. 2018. "New Method to Analyse the Cement Sheath Integrity
During the Volume Fracturing of Shale Gas." Energies 11 (4):750.
Fernandez, C. A., P. K. Koech, W. Um, V. Glezakou, J. Chun, M. I. Childers, M. T.
Nguyen, and K. A. Rod. 2018. Self-repairing cement polymer composites and
processes of making and using same. Google Patents.
Ferry, J. D.1980. Viscoelastic properties of polymers. John Wiley & Sons.
Forchheimer, P. 1901. "Wasserbewegung durch boden." Z. Ver. Deutsch, Ing. 45:1782-
1788.
Freyer, R., M. Fejerskov, and A. Huse. 2002. "An Oil Selective Inflow Control System."
European Petroleum Conference.
G'sell, C., and A. Dahoun. 1994. "Evolution of microstructure in semi-crystalline polymers
under large plastic deformation." Materials Science and Engineering: A 175 (1-
2):183-199.
Gatlin, C. 1960. Petroleum engineering: drilling and well completions: Prentice-Hall
Englewood Cliffs, NJ, USA.
Genedy, M., Usama .F K., E. N. Matteo, J.n Stormont, and M. M. Reda Taha. 2017. "A
new polymer nanocomposite repair material for restoring wellbore seal integrity."
International Journal of Greenhouse Gas Control 58:290-298.
Genedy, M., M. Stenko, J. Stormont, E. Matteo, T. Dewers, and M. Reda Taha. 2017.
Methyl Methacrylate Nanocomposite (MMNC) for Sealing Ultra-Thin Wellbore
Microcracks and Methods for Making. USA, Provisional Patent.
Genedy, M., J. Stormont, E. Matteo, and M. Reda Taha. 2014. "Examining epoxy-based
nanocomposites in wellbore seal repair for effective CO2 sequestration." Energy
Procedia 63:5798-5807.
Gojny, F. H., M. H. G. Wichmann, U. Köpke, B. Fiedler, and K. Schulte. 2004. "Carbon
nanotube-reinforced epoxy-composites: enhanced stiffness and fracture toughness
at low nanotube content." Composites science and technology 64 (15):2363-2371.

105
Golru, S. S., M. M. Attar, and B. Ramezanzadeh. 2014. "Studying the influence of nano-
Al 2 O 3 particles on the corrosion performance and hydrolytic degradation
resistance of an epoxy/polyamide coating on AA-1050." Progress in Organic
Coatings 77 (9):1391-1399.
Goodwin, K. J., and R. J. Crook. 1992. "Cement sheath stress failure." SPE Drilling
Engineering 7 (04):291-296.
Griffin, A. S., M. K. Rahman, J. J. Kim, and M. Reda Taha. 2013. "The Significance of
Nanosilica on Degradation of Oil Well Cement in Carbonated Brine
Environments." In Mechanics and Physics of Creep, Shrinkage, and Durability of
Concrete: A Tribute to Zdeňk P. Bažant, 372-379.
Griffiths, P. R., and J. A. De Haseth. 2007. Fourier transform infrared spectrometry. Vol.
171: John Wiley & Sons.
Grujicic, M., V. Sellappan, M. A. Omar, N. Seyr, A. Obieglo, M. Erdmann, and J.
Holzleitner. 2008. "An overview of the polymer-to-metal direct-adhesion hybrid
technologies for load-bearing automotive components." Journal of Materials
Processing Technology 197 (1):363-373.
Guo, J., W. Pan, J. Fan, and Y. Yu. 2018. "Improving the Performance of Oilwell Cement
by Graft-modified PB Latex." Transactions of Tianjin University:1-8.
Guthrie, G. D., R. J. Pawar, J. W. Carey, S. Karra, D. R. Harp, and H. S. Viswanathan.
2018. "The mechanisms, dynamics, and implications of self-sealing and CO 2
resistance in wellbore cements." International Journal of Greenhouse Gas Control
75:162-179.
Haagsma, A., S. Weber, M. Moody, J. Sminchak, J. Gerst, and N. Gupta. 2017.
"Comparative wellbore integrity evaluation across a complex of oil and gas fields
within the Michigan Basin and implications for CO2 storage." Greenhouse Gases:
Science and Technology 7 (5):828-842.
Haluszczak, L. O., A. W. Rose, and L. R. Kump. 2013. "Geochemical evaluation of
flowback brine from Marcellus gas wells in Pennsylvania, USA." Applied
Geochemistry 28:55-61.

106
Hamami, A. A., P. Turcry, and A. Aït-Mokhtar. 2012. "Influence of mix proportions on
microstructure and gas permeability of cement pastes and mortars." Cement and
Concrete Research 42 (2):490-498.
Harris, K. L., E. F. Vinson, D. L. Bour, D. P. Ewert, and R. R. Gerke. 1992. Repair of
microannuli and cement sheath. USA.
Hill, L. W. 1997. "Calculation of crosslink density in short chain networks." Progress in
organic coatings 31 (3):235-243.
Hodgkinson, E. S., and C. R. Hughes. 1999. "The mineralogy and geochemistry of
cement/rock reactions: high-resolution studies of experimental and analogue
materials." Geological Society, London, Special Publications 157 (1):195-211.
Huet, B. M., J. H. Prevost, and G. W. Scherer. 2010. "Quantitative reactive transport
modeling of Portland cement in CO2-saturated water." International Journal of
Greenhouse Gas Control 4 (3):561-574.
Jannot, Y., and D. Lasseux. 2012. "A new quasi-steady method to measure gas
permeability of weakly permeable porous media." Review of Scientific Instruments
83 (1):015113.
Javadi, M., M. Sharifzadeh, K. Shahriar, and Y. Mitani. 2014. "Critical Reynolds number
for nonlinear flow through rough‐walled fractures: The role of shear processes."
Water Resources Research 50 (2):1789-1804.
Jones, P. J., J. D. Karcher, A. Ruch, A. Beamer, P. Smit, S. Hines, M. R. Olson, and D.
Day. 2014. "Rigless Operation to Restore Wellbore Integrity using Synthetic-based
Resin Sealants." SPE/EAGE European Unconventional Resources Conference and
Exhibition.
Kansas, State of. 2003. Permanent Administrative Regulations, Article 45.—Underground
Hydrocarbon Storage Wells And Associated Brine Ponds. edited by Department of
Health and Environment. Kansas, USA: State of Kansas, Department of Health and
Environment.
Kansas, State of. 2011. Nitrogen/Brine Interface Mechanical Integrity Test (MIT). edited
by Department of Health and Environment. Kansas, USA: State of Kansas,
Department of Health and Environment.

107
Kardar, P., M. Ebrahimi, and S. Bastani. 2008. "Study the effect of nano-alumina particles
on physical–mechanical properties of UV cured epoxy acrylate via nano-
indentation." Progress in Organic Coatings 62 (3):321-325.
Kennedy, G. P., A. R. Lawless, A. K. Shaikh, and I. B. Alabi. 2005. "The use of swell
Packer's as a replacement and alternative to cementing." SPE Annual Technical
Conference and Exhibition.
Kuo, M.C., C.M. Tsai, J.C. Huang, and M. Chen. 2005. “PEEK composites reinforced by
nano-sized SiO2 and Al2O3 particulates.” Materials Chemistry and
Physics, 90(1):185-195.
Kutchko, B. G., B. R. Strazisar, D. A. Dzombak, G. V. Lowry, and N. Thaulow. 2007.
"Degradation of well cement by CO2 under geologic sequestration conditions."
Environmental science & technology 41 (13):4787-4792.
Lacuve, M., A. Chougnet, M. Allouche, and C. Mazard. 2015. "A Method to Improve
Adhesion Strength at the Cement/Steel-Casing Interface and its Effect on Cement
Evaluation Log Response." Offshore Mediterranean Conference and Exhibition.
Ladva, H. K. J., B. Craster, T. G. J. Jones, G. Goldsmith, and D. Scott. 2005. "The cement-
to-formation interface in zonal isolation." SPE Drilling & Completion 20 (03):186-
197.
Lee, J., and A. F. Yee. 2001. "Inorganic particle toughening I: micro-mechanical
deformations in the fracture of glass bead filled epoxies." Polymer 42 (2):577-588.
Li, Y., B. Cheng, W. Zhu, H. Xiao, and R. Nygaard. 2017. "Development and evaluation
of the coaxial cable casing imager: a cost‐effective solution to real‐time downhole
monitoring for CO2 sequestration wellbore integrity." Greenhouse Gases: Science
and Technology 7 (5):927-941.
Li, Y., and R. Nygaard. 2018. "A numerical study on the feasibility of evaluating CO2
injection wellbore integrity through casing deformation monitoring." Greenhouse
Gases: Science and Technology 8 (1):51-62.
Liang, Y. L., and R. A. Pearson. 2009. "Toughening mechanisms in epoxy–silica
nanocomposites (ESNs)." Polymer 50 (20):4895-4905.

108
Mansur, A. A. P., D. B. Santos, and H. S. Mansur. 2007. "A microstructural approach to
adherence mechanism of poly (vinyl alcohol) modified cement systems to ceramic
tiles." Cement and concrete research 37 (2):270-282.
Matteo, E. N., B. Huet, C. F. Jové-Colón, and G. W. Scherer. 2018. "Experimental and
modeling study of calcium carbonate precipitation and its effects on the degradation
of oil well cement during carbonated brine exposure." Cement and Concrete
Research.
McLaren, R. G., and K. C. Cameron. 1996. Soil Science, sustainable production and
environmental protection.
Mehta, P. K., and P. J. M. Monteiro. 1976. "Concrete-Microstructure, Properties and
Materials. 2006." Utilization of palm oil fuel ash in concrete: a review.
Metcalf, A. S., D. L. Purvis, and S. Stilwell. 2009. "Wellbore re-entries and repairs:
practical guidelines for cementing new casing inside existing casing." Drilling
contractor 65 (6).
Michanowicz, D. R., J. J. Buonocore, S. T. Rowland, K. E. Konschnik, S. A. Goho, and A.
S. Bernstein. 2017. "A national assessment of underground natural gas storage:
identifying wells with designs likely vulnerable to a single-point-of-failure."
Environmental Research Letters 12 (6):064004.
Mondal, P., S. P. Shah, and L. Marks. 2007. "A reliable technique to determine the local
mechanical properties at the nanoscale for cementitious materials." Cement and
Concrete Research 37 (10):1440-1444.
Nakayama, M., and J. J. Beaudoin. 1987. "A novel technique for determining bond strength
development between cement paste and steel." Cement and Concrete Research 17
(3):478-488.
Namkanisorn, A., A. Ghatak, M. K. Chaudhury, and D. H. Berry. 2001. "A kinetic
approach to study the hydrolytic stability of polymer–metal adhesion." Journal of
adhesion science and technology 15 (14):1725-1745.
Naous, W., X.Y. Yu, Q.X. Zhang, K. Naito, and Y. Kagawa. 2006. “Morphology, tensile
properties, and fracture toughness of epoxy/Al2O3 nanocomposites.” Journal of
Polymer Science Part B: Polymer Physics, 44(10):1466-1473.

109
Newell, D. L., and J. W. Carey. 2012. "Experimental evaluation of wellbore integrity along
the cement-rock boundary." Environmental science & technology 47 (1):276-282.
Ngo, T. D., M. T. Ton-That, S. V. Hoa, and K. C. Cole. 2007. "Preparation and Properties
of Epoxy Nanocomposites-Part 1: The Effect of Pre-Mixing on Dispersion of
Organoclay." Simha Symposium on Polymer Physics: to celebrate the 95th birthday
of Prof. Robert Simha, October 17-18, 2007 and Polymer Nanocomposites 2007:
Fourth International Symposium on Polymer Nanocomposites Science and
Technology, October 18-19, 2007.
Nowamooz, A., G. Radilla, and M. Fourar. 2009. "Non‐Darcian two‐phase flow in a
transparent replica of a rough‐walled rock fracture." Water resources research 45
(7).
Osorio, A. G., I. C. L. Silveira, V. L. Bueno, and C. P. Bergmann. 2008. "H 2 SO 4/HNO
3/HCl—functionalization and its effect on dispersion of carbon nanotubes in
aqueous media." Applied Surface Science 255 (5):2485-2489.
Park, J. H., and S. C. Jana. 2003. "Mechanism of exfoliation of nanoclay particles in epoxy-
clay nanocomposites." Macromolecules 36 (8):2758-2768.
Parks, D. M., and S. Ahzi. 1989. Polycrystalline plastic deformation and texture evolution
for crystals lacking five independent slip systems. MASSACHUSETTS INST OF
TECH CAMBRIDGE.
Phillips, A. J., E. Troyer, R. Hiebert, C. Kirkland, R. Gerlach, A. B. Cunningham, L.
Spangler, J. Kirksey, W. Rowe, and R. Esposito. 2018. "Enhancing wellbore
cement integrity with microbially induced calcite precipitation (MICP): A field
scale demonstration." Journal of Petroleum Science and Engineering.
Pocius, A. V. 2012. Adhesion and adhesives technology: an introduction: Carl Hanser
Verlag GmbH Co KG.
Powers, T. C., and T. L. Brownyard. 1946. "Studies of the physical properties of hardened
Portland cement paste." Journal Proceedings.
Ramezanzadeh, B., M. M. Attar, and M. Farzam. 2011. "Effect of ZnO nanoparticles on
the thermal and mechanical properties of epoxy-based nanocomposite." Journal of
thermal analysis and calorimetry 103 (2):731-739.

110
Ravi, K., M. Bosma, and O. Gastebled. 2002. "Improve the economics of oil and gas wells
by reducing the risk of cement failure." IADC/SPE Drilling Conference.
Read, D., F. P. Glasser, C. Ayora, M. T. Guardiola, and A. Sneyers. 2001. "Mineralogical
and microstructural changes accompanying the interaction of Boom Clay with
ordinary Portland cement." Advances in cement research 13 (4):175-183.
Reddy, C. M., J. S. Arey, J. S. Seewald, S. P. Sylva, K. L. Lemkau, R. K. Nelson, C. A.
Carmichael, C. P. McIntyre, J. Fenwick, and G. Todd Ventura. 2012. "Composition
and fate of gas and oil released to the water column during the Deepwater Horizon
oil spill." Proceedings of the National Academy of Sciences 109 (50):20229-20234.
Ren, Y., Y. Q. Fu, K. Liao, F. Li, and H. M. Cheng. 2004. "Fatigue failure mechanisms of
single-walled carbon nanotube ropes embedded in epoxy." Applied Physics Letters
84 (15):2811-2813.
Rogers, H. E., D. Allison, and E. D. Webb. 2008. "New equipment designs enable
swellable technology in cementless completions." IADC/SPE Drilling Conference.
Roy, P., J. P. Morris, S. D. C. Walsh, J. Iyer, and S. Carroll. 2018. "Effect of thermal stress
on wellbore integrity during CO2 injection." International Journal of Greenhouse
Gas Control 77:14-26.
Rusch, D. W., F. Sabins, and J. Aslakson. 2004. "Microannulus leaks repaired with
pressure-activated sealant." In SPE Eastern Regional Meeting. Society of
Petroleum Engineers.
Seidel, F. A., and T. G. Greene. 1985. "Use of expanding cement improves bonding and
aids in eliminating annular gas migration in Hobbs Grayburg-San Andres wells."
SPE Annual Technical Conference and Exhibition.
Shi, J., and J. Ming. 2017. "Influence of defects at the steel-mortar interface on the
corrosion behavior of steel." Construction and Building Materials 136:118-125.
Silva, J. C., and N. B. Milestone. 2018. "Cement/rock interaction in geothermal wells. The
effect of silica addition to the cement and the impact of CO 2 enriched brine."
Geothermics 73:16-31.
Smith, L., M. Smith, and P. Ashcroft. 2011. "Analysis of environmental and economic
damages from British Petroleum’s Deepwater Horizon oil spill."

111
Stormont, J. C., S. Garcia Fernandez, M. Reda Taha, and E. N. Matteo. 2018. "Gas flow
through cement-casing microannuli under varying stress conditions."
Geomechanics for Energy and the Environment 13:1-13.
Tavassoli, S., J. F. Ho, M. Shafiei, C. Huh, P. Bommer, S. Bryant, and M. T. Balhoff. 2018.
"An experimental and numerical study of wellbore leakage mitigation using pH-
triggered polymer gelant." Fuel 217:444-457.
Thiercelin, M. J., B. Dargaud, J. F. Baret, and W. J. Rodriquez. 1998. "Cement design
based on cement mechanical response." SPE drilling & completion 13 (04):266-
273.
Thornhill, J., and B. G. Benefield. 1990. Injection well mechanical integrity: Office of
Research and Development, US Environmental Protection Agency.
Tiab, D., and E. C. Donaldson. 2015. Petrophysics: theory and practice of measuring
reservoir rock and fluid transport properties. Gulf professional publishing.
Tinseau, E., D. Bartier, L. Hassouta, I. Devol-Brown, and D. Stammose. 2006.
"Mineralogical characterization of the Tournemire argillite after in situ interaction
with concretes." Waste Management 26 (7):789-800.
Torsæter, M., J. Todorovic, and A. Lavrov. 2015. "Structure and debonding at cement–
steel and cement–rock interfaces: Effect of geometry and materials." Construction
and Building Materials 96:164-171.
US DOE. 2016. Strategic Petroleum Reserve Annual Report for Calendar Year 2014.
edited by United States Department of Energy. Washington, D.C. : United States
Department of Energy.
Uddin, F. 2008. "Clays, nanoclays, and montmorillonite minerals." Metallurgical and
Materials Transactions A 39 (12):2804-2814.
Van den Brand, J. 2004. On the adhesion between aluminium and polymers: TU Delft,
Delft University of Technology.
Wetzel, B., P. Rosso, F. Haupert, and K. Friedrich. 2006. "Epoxy nanocomposites–fracture
and toughening mechanisms." Engineering fracture mechanics 73 (16):2375-2398.
Wilson, DC, AW Eustes, and WW Fleckenstein. 2018. "Lab Testing Cement-Steel
Bonding at Shallow Temperature and Pressure Conditions." SPE Western Regional
Meeting.

112
Xu, Y., and D. D. L Chung. 1999. "Carbon fiber reinforced cement improved by using
silane-treated carbon fibers." Cement and concrete research 29 (5):773-776.
Xue, Z., and T. Hashimoto. 2017. "Geomechanical monitoring of caprock and wellbore
integrity using fiber optic cable: Strain measurement from the fluid injection and
extraction field tests." Energy Procedia 114:3305-3311.
Zeng, J., B. Saltysiak, W. S. Johnson, D. A. Schiraldi, and S. Kumar. 2004. "Processing
and properties of poly (methyl methacrylate)/carbon nano fiber composites."
Composites Part B: Engineering 35 (2):173-178.
Zeng, Z., and R. Grigg. 2006. "A criterion for non-Darcy flow in porous media." Transport
in porous media 63(1): 57-69.
Zhai, L., G. Ling, J. Li, and Y. Wang. 2006. "The effect of nanoparticles on the adhesion
of epoxy adhesive." Materials Letters 60 (25-26):3031-3033.
Zhang, M., and S. Bachu. 2011. "Review of integrity of existing wells in relation to CO2
geological storage: What do we know?" International Journal of Greenhouse Gas
Control 5 (4):826-840.
Zhang, Z., and J. Nemcik. 2013. "Fluid flow regimes and nonlinear flow characteristics in
deformable rock fractures." Journal of hydrology 477:139-151.
Zhu, J., J. Kim, H. Peng, J. L. Margrave, V. N. Khabashesku, and E. V. Barrera. 2003.
"Improving the dispersion and integration of single-walled carbon nanotubes in
epoxy composites through functionalization." Nano letters 3 (8):1107-1113.

113
Appendix A: Interface Characterization Readings
Table 0.1: Interface characterization readings of reference intact specimen.
Time
[sec]
Vacuum Pressure
[psig]
0 -11.0
188.6 -10.9
381.6 -10.8
575.7 -10.7
770.3 -10.6
961.6 -10.5
1175.7 -10.4
1383.8 -10.3
Table 0.2: Interface characterization readings of microfine cement sealed specimen.
Debonded Sealed
Time
[sec]
Vacuum Pressure
[psig]
Time
[sec]
Vacuum Pressure
[psig]
0 -7.0 0 -7.0
8.9 -6.0 16.8 -6.0
18.0 -5.0 36.3 -5.0
27.8 -4.0 57.0 -4.0
37.4 -3.0 81.6 -3.0
47.8 -2.0 112.2 -2.0
60.7 -1.0 155.7 -1.0
Table 0.3: Interface characterization readings of Novolac epoxy sealed specimen.
Debonded Sealed
Time
[sec]
Vacuum Pressure
[psig]
Time
[sec]
Vacuum Pressure
[psig]
0 -11.0 0 -11.2
7.6 -10.0 145.3 -11.1
16.0 -9.0 294.0 -11
23.5 -8.0 432.8 -10.9
32.3 -7.0 583.8 -10.8
40.3 -6.0 730.8 -10.7
48.4 -5.0 872.1 -10.6
57.2 -4.0 1025.6 -10.5

114
Table 0.4: Interface characterization readings of NM-Novolac epoxy sealed specimen.
Debonded Sealed
Time
[sec]
Vacuum Pressure
[psig]
Time
[sec]
Vacuum Pressure
[psig]
0 -9.0 0 -11.5
10.3 -8.0 124.2 -11.4
22.0 -7.0 252.0 -11.3
35.4 -6.0 371.0 -11.2
51.5 -5.0 500.3 -11.1
68.0 -4.0 626.3 -11.0
86.1 -3.0 747.5 -10.9
103.8 -2.0 879.1 -10.8
Table 0.5: Interface characterization readings of MMA sealed specimen.
Debonded Sealed
Time
[sec]
Vacuum Pressure
[psig]
Time
[sec]
Vacuum Pressure
[psig]
0 -9.0 0 -11.3
22.1 -8.0 204.3 -11.2
46.5 -7.0 412.2 -11.1
72.4 -6.0 621.1 -11.0
101.8 -5.0 833.6 -10.9
135.0 -4.0 1049.7 -10.8
178.2 -3.0 1269.4 -10.7
229.1 -2.0 1492.7 -10.6
Table 0.6: Interface characterization readings of NM-MMA sealed specimen.
Debonded Sealed
Time
[sec]
Vacuum Pressure
[psig]
Time
[sec]
Vacuum Pressure
[psig]
0 -11.0 0 -11.4
14.2 -10.0 334.7 -11.3
27.4 -9.0 565.8 -11.2
40.2 -8.0 847.6 -11.1
52.7 -7.0 1299.0 -11.0
64.8 -6.0 1541.9 -10.9
77.0 -5.0 1815.0 -10.8
89.3 -4.0 2076.1 -10.7


![Nanocomposite [5]](https://static.fdocuments.net/doc/165x107/577c7ecf1a28abe054a26499/nanocomposite-5.jpg)