EMPRICIAL ANALYSIS FOR THE BUS SYSTEM OF … · graphed here in Figure 1. . 4 ... the best solution...
19
COST, PRODUCTION AND EFFICIENCY IN LOCAL BUS INDUSTRY: AN EMPRICIAL ANALYSIS FOR THE BUS SYSTEM OF SANTIAGO Louis de Grange School of Industrial Engineering, Universidad Diego Portales, Santiago, Chile. Tel.: (56-2) 2213 0469; e-mail: [email protected] Rodrigo Troncoso School of Government, Universidad del Desarrollo, Santiago, Chile Tel.: (56-2) 2327 9859; e-mail: [email protected] Ignacio Briones School of Government, Universidad Adolfo Ibáñez, Santiago, Chile Tel.: (56-2) 2331 1361; e-mail: [email protected] ABSTRACT The aggregate cost structure of the Santiago (Chile) urban bus transport industry is studied for the presence of economies of scale, return to scale and technical efficiency. Econometric models using both operator cost and revenue (fares plus subsidy) data show that larger operators under Transantiago had higher average operating costs than the smaller ones; we obtain a similar conclusion when analysing production and the efficiency of firms: we estimate decreasing returns to scale in production, and that larger operators would be more inefficient than smaller operators. The model results also indicate that cost per passenger carried for longer, articulated buses is greater than for shorter, conventional vehicles. These findings are important considerations for the design of the industry and its regulatory framework. Keywords: bus industry; diseconomies of scale; returns to scale; technical efficiency; Transantiago.
Transcript of EMPRICIAL ANALYSIS FOR THE BUS SYSTEM OF … · graphed here in Figure 1. . 4 ... the best solution...

COST, PRODUCTION AND EFFICIENCY IN LOCAL BUS INDUSTRY: AN EMPRICIAL ANALYSIS FOR THE BUS SYSTEM OF SANTIAGO
Louis de Grange School of Industrial Engineering, Universidad Diego Portales, Santiago, Chile.
Tel.: (56-2) 2213 0469; e-mail: [email protected]
Rodrigo Troncoso School of Government, Universidad del Desarrollo, Santiago, Chile
Tel.: (56-2) 2327 9859; e-mail: [email protected]
Ignacio Briones School of Government, Universidad Adolfo Ibáñez, Santiago, Chile
Tel.: (56-2) 2331 1361; e-mail: [email protected]
ABSTRACT The aggregate cost structure of the Santiago (Chile) urban bus transport industry is studied for the presence of economies of scale, return to scale and technical efficiency. Econometric models using both operator cost and revenue (fares plus subsidy) data show that larger operators under Transantiago had higher average operating costs than the smaller ones; we obtain a similar conclusion when analysing production and the efficiency of firms: we estimate decreasing returns to scale in production, and that larger operators would be more inefficient than smaller operators. The model results also indicate that cost per passenger carried for longer, articulated buses is greater than for shorter, conventional vehicles. These findings are important considerations for the design of the industry and its regulatory framework. Keywords: bus industry; diseconomies of scale; returns to scale; technical efficiency; Transantiago.

.
2
1. INTRODUCTION In regulated markets such as public transport, the presence or absence of economies of scale (e.g. cost function), and return to scale (e.g. production function) is a fundamental consideration in achieving efficiency both in the transport system design and the regulatory framework. After reviewing the literature on returns to scale in public transport systems, the present study reports on an empirical study of the cost and production structure of the local bus service industry in Santiago, Chile for the period after its radical restructuring in early 2007. Whereas the international evidence on bus industry economies of scale is mixed, our results for the Chilean capital’s service suggest the presence of diseconomies of scale from a cost perspective, and decreasing returns to scale from a production perspective. In addition, using a stochastic frontier analysis (SFA) approach, we estimate that smaller firms are more efficient than larger firms. The formalization of the industry with the advent of Transantiago, the new public transportation system introduced in 2009, has also made available much detailed official information on such phenomena as the supply and demand levels for each bus company. It is these data that have enabled us to contrast our hypothesis regarding the presence or absence of economies of scale, and they have also been used to design the contracts for the public tenders of the different bus lines, the next series of which will be held in February 2018. A secondary but not unimportant result of this study, derived from an analysis of costs by type of bus after correcting for the number of passengers carried, is that articulated buses 18 metres in length are significantly more costly to operate than conventional 12-metre buses. This implies that future Transantiago contract designs should prioritize the latter type of vehicle. The rest of this paper is organized into five sections. Section 2 surveys the literature on economies of scale in urban bus transport systems around the world; Section 3 discusses cost characteristics and company size for the Transantiago system and sets out some suggestive graphical evidence as the basis for the study’s hypothesis on Transantiago’s economies of scale; Section 4 specifies and estimates two alternative sets of econometric models based on annual operating costs and monthly payments to the companies to test the hypothesis; Section 5 estimates a production function for the industry, and develops a Stochastic Frontier Analysis to estimate relative technical efficiency among different firms. Finally, Section 6 presents our conclusions. 2. LITERATURE SURVEY The issue of returns to scale in local public bus transport continues to be debated in the literature. From the standpoint of public policy, returns to scale play a role in determining fare regulation mechanisms, cost assignment, productivity and the structure of the industry. Views on the industry’s returns to scale have also figured in arguments for subsidizing bus services.
.
3
As noted in the Introduction, empirical research on bus systems over the last few decades in various countries has produced mixed results in which all three possibilities (constant, decreasing and increasing returns) have been reported. Nevertheless, the studies do tend to suggest that in the majority of cases the conditions for economies of scale in urban bus service provision, where strict regulation is typical, do not exist. That the evidence on scale returns is indeed mixed is evident from the review of previous studies in Lai et al. (2012), who also imply that the findings depend on the data available, the estimation methodology and the definition of the output metric variables. Earlier works by Berechman and Giuliano (1984) and Hensher (1987) had already cautioned that methodology and type of data would effect the outcome. Williams and Dalal (1981) discovered decreasing returns for small firms and increasing returns for large ones, suggesting that the cost curve has an inverted “U” shape. By contrast, Button and O’Donnell (1985) reported increasing returns for small operators and decreasing returns for large ones. But Caves and Christensen (1988), using a multi-product function, found constant returns. Studies by De Rus and Nombela (1997) for Spain, and Lee and Stedman (1970) for Britain, both concluded that returns to scale in the bus industry were constant while a second British study by Wabe and Coles (1975) as well as an investigation for the U.S. by Koenker (1977) pointed to diseconomies of scale. The latter conclusion was also arrived at for the U.S. by Obeng (1985) and for local services in Switzerland by Filippini and Prioni (2003). Contrasting with the above are American studies by Williams (1979) and Viton (1981), an Israeli study by Berechman (1983) and a Swiss study by Farsi et al. (2007), all of which found that there were economies of scale both for buses and trams. The same result was reported for Taiwan by Shaw et al. (2005), who concluded that returns to scale were increasing. Williams and Hall (1981), meanwhile, showed that there were potential economies of scale in U.S. intercity bus service. For the UK bus industry, Cowie and Asenova (1999) estimated that small companies operating less than 200 vehicles experienced some economies of scale but also showed that the extent of these economies varied with the type of ownership (private limited company, public limited company, or municipal). Sakano and Obeng (1995) demonstrated that there were increasing returns to scale for the public urban bus industry in the U.S. In general terms, there are a number of major empirical studies whose results are consistent with a U-shaped average cost function with increasing returns to scale for smaller operators that turn into constant and then increasing returns as the size of the operator grows. Fernandez et al. (2005) consider congestion as a source of diseconomies to scale in large bus industries. A study by Iseki (2008) concluded for the U.S. that there were diseconomies of scale for all bus agency sizes and levels of contracting. The author also noted that few studies report economies of scale whereas many have found that there are diseconomies. The rise in hourly unit operating cost as the size of a bus fleet increases is clearly observable in Iseki’s data, graphed here in Figure 1.

.
4
Figure 1 Average Operating Cost per Bus-Hour by Size of Fleet (Iseki, 2008)
A recent review of the literature by Abrate et al. (2016) concluded that economies of scale exist only for companies that provide multiple bus services (urban, intercity, charter/for hire). This implies that relatively small companies specializing in one or other of these services would experience a reduction in costs by evolving towards a multi-service (urban and interurban) operation. For interurban operators, the best solution appears to be integration with urban operators. In another recent publication, Ayadi and Hammami (2015) evaluated the cost structure of public transport in Tunisia. They used a translog variable cost function to identify the providers’ technological characteristics, with data from a sample of 12 regional operators collected over the years 2000 to 2010. The authors found diseconomies of scale in both the short and the long term. Avenali et al. (2016) used a regression model for estimating unit costs and their variability for local public transport in Italy. They showed that economies of scale are limited and only present for small-scale services. Their results revealed a positive correlation between investment in bus fleets and cost of service provision. Finally, an analysis published by Fiorio et al. (2013), though containing no analysis of cost structure variations by company size, nevertheless demonstrated by means of probit models applied to data from 33 European cities that the highest levels of satisfaction are correlated with the existence of a single local public transport provider, as opposed to an industry structure in which multiple providers operate in the same market area.

.
5
The principal findings of the 41 empirical studies from the specialized literature reported in the preceding paragraphs are summarized in Table 1. They confirm that the evidence on economies of scale in bus service is mixed and varies with the specifics of the situation in question. Particularly influential are such phenomena are the size of the bus system, the regulatory framework, the specification of the variables in the model and the types of data analyzed.
Table 1 Summary of Main Findings in the Literature on Returns to Scale in the Bus Industry
Author(s) Principal finding Lee and Steedman (1970) Constant
Koshal (1972) Constant
Wabe and Coles (1975) Diseconomies
Koenker (1977) Diseconomies
Williams (1979) Economies
McGillivray et al. (1980) Diseconomies
Viton (1981) Economies
Williams and Hall (1981) Economies
Williams and Dalal (1981) Mixed
Berechman (1983) Economies
Pucher et al. (1983) Diseconomies
Tauchen et al. (1983) Mixed
Morlok (1984) Diseconomies
Obeng (1985) Diseconomies
Berechman and Giuliano (1985) Mixed
Button and O'Donnell (1985) Mixed
Perry and Babitsky (1986) Diseconomies
Hensher (1987) Economies
Caves and Christensen (1988) Constant
Cervero (1988) Diseconomies
Shughart and Kimenyi (1991) Diseconomies
Savage (1993) Diseconomies
Berechman (1993) Mixed
Filippini and Prioni (1994) Economies
Xu et al. (1994) Diseconomies
Jørgensen et al. (1997) Diseconomies
de Rus and Nombela (1997) Constant
Matas and Raymond (1998) Diseconomies
McCullough et al. (1998) Diseconomies
Cowie and Asenova (1999) Mixed
Sclar (2000) Diseconomies
Karlaftis and McCarthy (2002) Economies
Singh (2002) Mixed
Filippini and Prioni (2003) Mixed
Dalen and Gomez-Lobo (2003) Constant
Farsi et al. (2007) Economies
Iseki (2008) Diseconomies
Walter (2011) Economies
Lai et al. (2012) Mixed
Ayadi and Hammami (2015) Diseconomies
Abrate et al. (2016) Mixed
Avenali et al. (2016) Mixed

.
6
3. COST ANALYSIS OF THE SANTIAGO BUS INDUSTRY (TRANSANTIAGO) 3.1 General The old bus system that operated in Santiago was replaced in 2007. The pre-2007 system generated high levels of pollution and traffic accidents, and in its later years increasingly appeared headed for collapse. This latter perception was what finally convinced the authorities to intervene. An entirely new system called Transantiago, characterized by a larger, more formal enterprises incorporating many technological innovations and a renewed infrastructure, was inaugurated on February 10, 2007. A comprehensive review of Transantiago’s initial design and implementation may be found in Muñoz and De Grange (2010) and Briones (2009). The routes and service contracts under Transantiago were originally drawn up under a central planning approach that did not take sufficient account of the incentives facing either operators or users. The fundamental assumption was that the behaviour of the actors involved would simply adapt to the plan laid out by the “experts.” Provision of the bus services under the new system was tendered out to 14 companies, 5 of which would serve major trunk routes while the other 9 would operate the local routes feeding the trunk lines as well as the stations in the Santiago Metro system. In addition to a completely redesigned route network, Transantiago began life with 2,000 new vehicles and a new fare payment system based on pre-paid electronic cards that gave access to the Metro as well as the buses. Fare collection was, and continues to be, centrally managed, and the revenues collected, with the later addition of government subsidies, are used to pay the companies providing the services (Tamblay et al., 2016). This radical redesign of the Santiago bus system, which had a highly traumatic debut, drastically changed the system’s industry structure. The number of companies dropped from a total of 3,868 in the older bus system to just 14 under Transantiago and the number of buses felt from 8,000 to 4,500 (6,500 nowadays). 3.2 Company types and cost characteristics In June 2012, a little more than five years after Transantiago was launched, the trunk-and-feeder design was abandoned. The number of companies in the system fell from 14 to 7 and each of the surviving operators was assigned a new concession that included some of what were formally classed as trunk and local feeder lines. The distribution of their respective fleets by type of bus as of the end of 2012 is given in Table 2. These 7 operators continue operating Transantiago to this day. The next tender of bus lines and services will be held in 2018 and may well witness changes to the current industry structure. The creation of Transantiago brought about a greater formalization of the operators and of the drivers’ working conditions, but also resulted in a significant increase in the costs of service provision. Indeed, the rise was such that the government found it necessary to implement a system of subsidies, something that had never existed during the older bus era. The system-wide annual costs of the older buses were approximately US$400 million (SECTRA, 2003) while under Transantiago they climbed to about US$1.1 billion, and in the last few years have continued to grow.
.
7
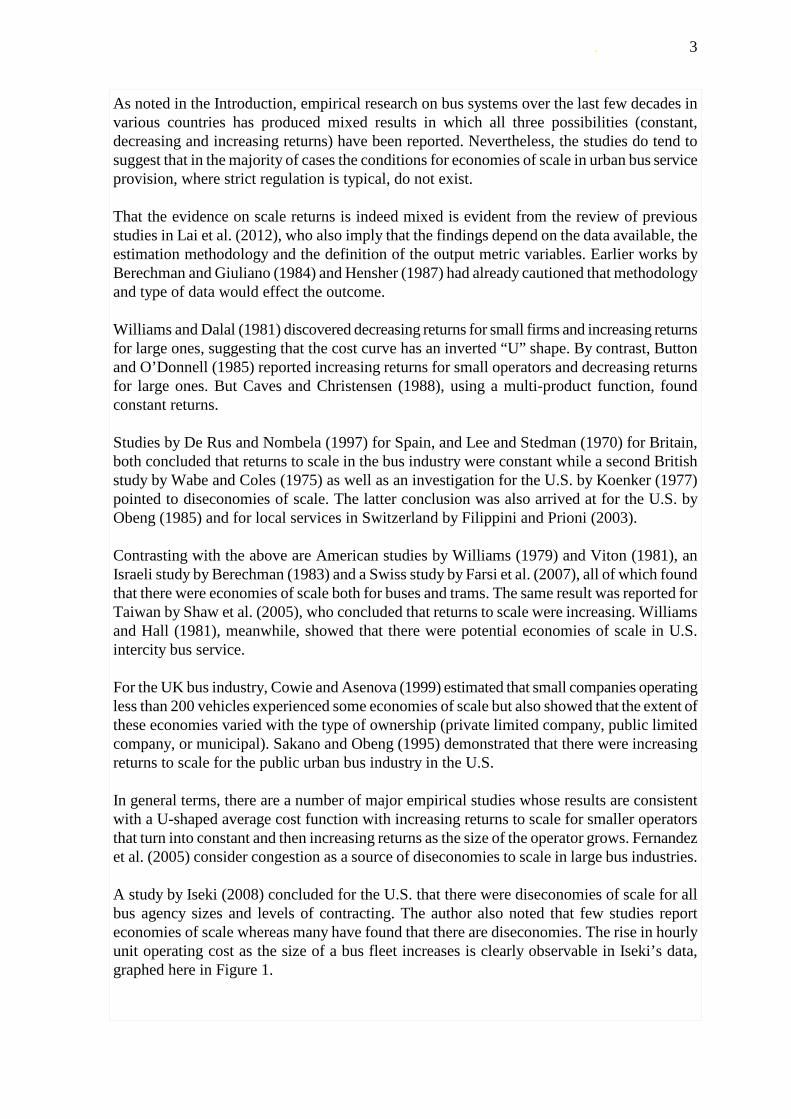
Table 2 Bus Companies Operating Transantiago (as of yearend 2012)
Company Fleet of 9 m buses Fleet of 12 m buses Fleet of 18 m buses Total fleet Alsacia 29 492 238 759 SuBus 175 540 560 1,275 Vule 159 1,076 0 1,235
Express 168 641 420 1,229 Metbus 37 656 217 910 RedBus 311 335 0 646
STP 135 304 0 439 TOTAL 1,014 4,044 1,435 6,493
The implementation of the subsidy coupled with the installation of sophisticated fare payment technologies and the structure of the Transantiago contracts in effect since 2012 have had a positive external effect on research into the system in that a range of detailed data is now available on each provider company’s supply of bus services (frequencies, kilometres travelled, regularity) as well as on user demand (number of passenger validations [i.e., fare-paying passengers] for each company). Every year the Ministry of Transport publishes a report on the operating results of the individual Transantiago companies containing such supply and demand indicators. Also reported are the payments made to each company under their individual contracts, which are financed by user fares (approximately 60%) and the government subsidy (approximately 40%) based on a formula negotiated by the government and each company that incorporates certain cost variables. In this sense, and assuming the contracts are reasonable and do not allow excessive profits, the amount paid to an operator per passenger carried may be seen as a proxy for the true cost and used to analyze a hypothesis regarding economies of scale. Official monthly supply and demand data were available on each of the 7 Transantiago provider companies in the system since it was restructured in June 2012 for the period between January 2013 and December 2015, or 36 consecutive months. Given that payments to the companies are only a proxy for the real cost, we supplemented this information with official data on annual costs supplied by Chile’s Internal Taxation Service. The dispersion of the companies’ average annual operating cost per passenger for each year as a function of the number of passengers carried in the corresponding years over the period 2013 through 2015 is shown in Figure 2, while the dispersion of average monthly payments to the companies per passenger in each month as a function of the average number of passengers carried in the corresponding months over the same three-year period is depicted in Figure 3. These two graphs suggest that the current Transantiago system is characterized by diseconomies of scale. This hypothesis will be tested in the next section.

.
8
Figure 2 Annual Cost per Passenger vs. Number of Annual Passengers Carried (PAT)
Figure 3 Monthly Payments to Companies per Passenger vs. Number of Monthly Passengers
Carried (PMT)
.
9
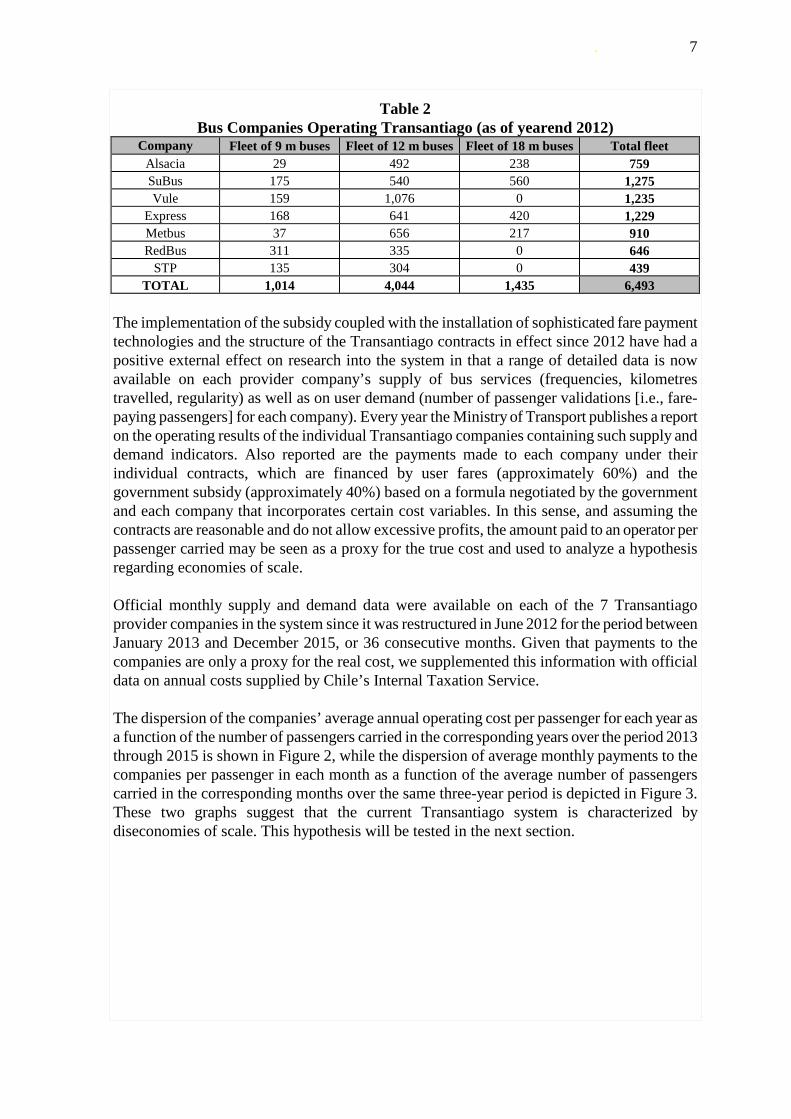
4 ECONOMETRIC ANALYSIS OF DISECONOMIES OF SCALE HYPOTHESIS To analyze our hypothesis suggested by Figures 3 and 4 above of diseconomies of scale in the Transantiago bus system, we obtained annual operating cost data on the seven companies in the system from their financial statements on the website of the Chilean Internal Revenue Service (SII by its Spanish initials) plus information on the monthly payments to the companies from the Chilean Ministry of Transport (MT). Each set of data were used to represent cost in one of the two general econometric models we built to carry out the analysis. In both models, cost is the explained variable. 4.1 Annual data analysis (company operating costs) The annual operating cost data covered the period 2013 through 2015. For each year and company, the cost (the explained variable) was contrasted with the following explanatory variables: the number of passengers carried, and the proportion of articulated vehicles in the fleet. More formally, the variables in the annual analysis were as follows: i. Annual Company Cost (CAE): The cost reported by each company in its official
financial statements submitted to the SII (in thousands of Chilean pesos)
ii. Annual Passengers Carried (PAT): The total number of passengers carried by each company’s services in each year. Includes validated passengers and company estimates of fare evaders.
iii. P18: The proportion of each company’s fleet made up of articulated 18-metre buses.
The proportion of 18-metre articulated buses variable (P18) was included to act as a control given that this type of vehicle has a considerably higher operating cost than the shorter types. The descriptive data gathered from the financial documentation for all five variables are summarized in Table 3.
Table 3 Summary of Descriptive Data for Operating Cost Analysis Variables
(N = 21 Observations) Variable Mean Std Dev Min Max
CAE 8.29E+07 3.36E+07 2.95E+07 1.32E+08 PAT 1.82E+08 5.76E+07 8.75E+07 2.40E+08 P18 0.1901182 0.1727252 0 0.4392157
The general version of the model to be estimated with these data is specified as follows:
0 18ln ln 18it PAT it P it itCAE PAT Pβ β β ε= + + + (1)
where subindex i denotes the company and subindex t the year. Two different variations on general model (1) were tested, each containing one or two of the explanatory variables (see Table 4). Models 1, 2 and 3 in particular check for robustness in the relationship between scale of operation and costs.
.
10
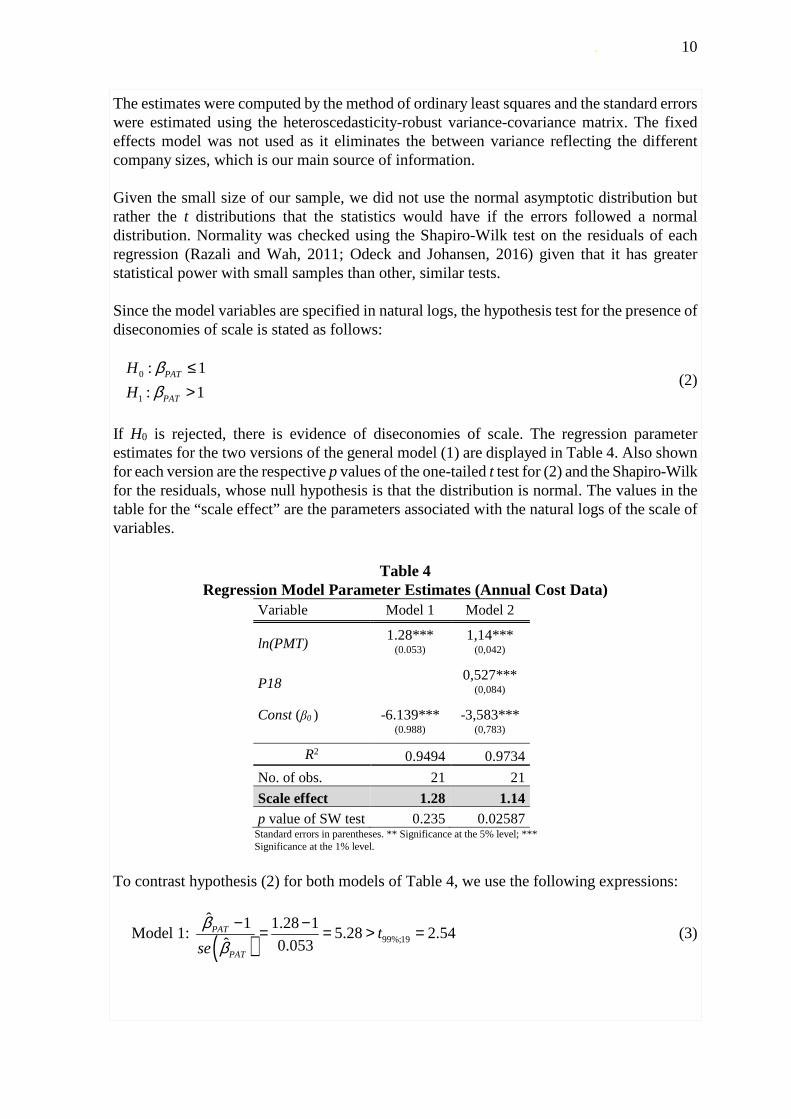
The estimates were computed by the method of ordinary least squares and the standard errors were estimated using the heteroscedasticity-robust variance-covariance matrix. The fixed effects model was not used as it eliminates the between variance reflecting the different company sizes, which is our main source of information. Given the small size of our sample, we did not use the normal asymptotic distribution but rather the t distributions that the statistics would have if the errors followed a normal distribution. Normality was checked using the Shapiro-Wilk test on the residuals of each regression (Razali and Wah, 2011; Odeck and Johansen, 2016) given that it has greater statistical power with small samples than other, similar tests. Since the model variables are specified in natural logs, the hypothesis test for the presence of diseconomies of scale is stated as follows:
0
1
: 1
: 1PAT
PAT
H
H
ββ
≤>
(2)
If H0 is rejected, there is evidence of diseconomies of scale. The regression parameter estimates for the two versions of the general model (1) are displayed in Table 4. Also shown for each version are the respective p values of the one-tailed t test for (2) and the Shapiro-Wilk for the residuals, whose null hypothesis is that the distribution is normal. The values in the table for the “scale effect” are the parameters associated with the natural logs of the scale of variables.
Table 4 Regression Model Parameter Estimates (Annual Cost Data)
Variable Model 1 Model 2
ln(PMT) 1.28*** 1,14***
(0.053) (0,042)
P18 0,527*** (0,084)
Const (β0 )
-6.139*** -3,583*** (0.988) (0,783)
R2 0.9494 0.9734
No. of obs. 21 21
Scale effect 1.28 1.14 p value of SW test 0.235 0.02587
Standard errors in parentheses. ** Significance at the 5% level; *** Significance at the 1% level.
To contrast hypothesis (2) for both models of Table 4, we use the following expressions:
Model 1: ( ) 99%;19
ˆ 1 1.28 15.28 2.54
ˆ 0.053PAT
PAT
tse
ββ
− −= = > = (3)

.
11
Model 2: ( ) 99%;18
ˆ 1 1.14 13.33 2.55
ˆ 0.042PAT
PAT
tse
ββ
− −= = > = (4)
Based on these results, we may state the following: a) The hypothesis that there are diseconomies of scale in the Santiago bus industry is
corroborated. This empirical outcome is consistent with the graph in Figure 2. b) Correcting for each company’s number of passengers carried and kilometres travelled,
the cost for articulated (18 metre) buses is about 50% higher than the cost for conventional (12 metre) models. This suggests that substituting 18-metre vehicles by 12-metre ones could help in reducing costs. The intuition behind this result is that an 18-metre vehicle is equivalent of being forced to cover a route with a 12-meter vehicle and with a 6-meter vehicle at the same time even if there is no enough demand. On the contrary, a 12-meter vehicle provide more flexibility to adapt to this demand.
4.2 Monthly data analysis (payments to companies) The monthly company payment data covered the period January 2013 through December 2015. For each month and company, the payment (the explained variable representing cost) was contrasted with the same explanatory variables: the proportion of articulated vehicles in the fleet and the passengers carried. More precisely, the variables in the monthly analysis are as follows: i. Monthly Company Payment (PME): The amount of money paid to each company for
the provision of bus services during each month. Although not exactly equal to the cost of providing the services, it is a reasonable proxy for it given that the tender contracts base the payments on cost factors. The payments are stipulated in Unidades de Fomento, a Chilean peso monetary unit determined by the Central Bank of Chile that is adjusted for inflation.
ii. Monthly Passengers Carried (PMT): The total number of passengers carried by each
company’s services during each month. Includes validated passengers and company estimates of fare evaders.
iii. P18: The proportion of each company’s fleet made up of articulated (18-metre) buses.
Table 5 Summary of Descriptive Data for Company Payment Analysis Variables
(N = 244 Observations) Variable Mean Std Dev Min Max
PME 323034,7 128636,8 86290,5 683431 PMT 1,53E+07 4981210 5199705 2,27E+07 P18 0,1911353 0,1691104 0 0,4392157
KMC 5529418 1877082 1920306 8267814
Last row of Table 5 corresponds to the monthly commercial kilometers (KMC) traveled by the buses of each firm. We use this variable in section 5.
.
12
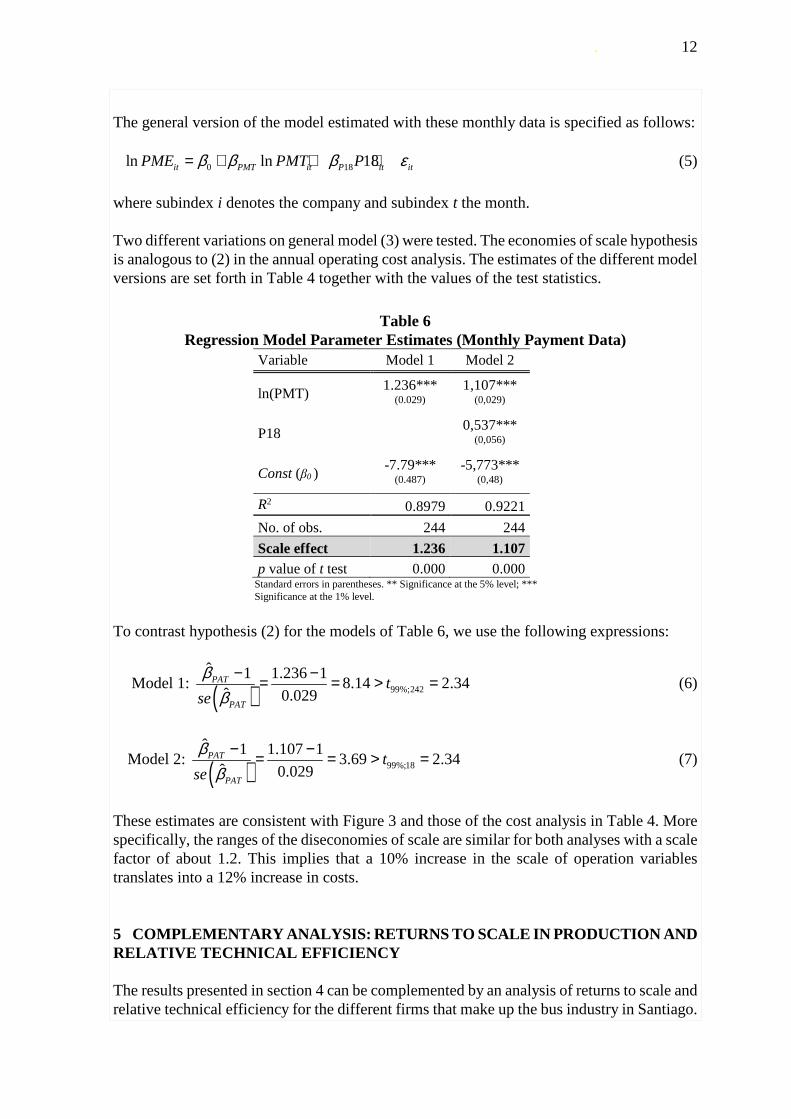
The general version of the model estimated with these monthly data is specified as follows:
0 18ln ln 18it PMT it P it itPME PMT Pβ β β ε= + + + (5)
where subindex i denotes the company and subindex t the month. Two different variations on general model (3) were tested. The economies of scale hypothesis is analogous to (2) in the annual operating cost analysis. The estimates of the different model versions are set forth in Table 4 together with the values of the test statistics.
Table 6 Regression Model Parameter Estimates (Monthly Payment Data)
Variable Model 1 Model 2
ln(PMT) 1.236*** 1,107***
(0.029) (0,029)
P18 0,537*** (0,056)
Const (β0 ) -7.79*** -5,773***
(0.487) (0,48)
R2 0.8979 0.9221
No. of obs. 244 244
Scale effect 1.236 1.107 p value of t test 0.000 0.000
Standard errors in parentheses. ** Significance at the 5% level; *** Significance at the 1% level.
To contrast hypothesis (2) for the models of Table 6, we use the following expressions:
Model 1: ( ) 99%;242
ˆ 1 1.236 18.14 2.34
ˆ 0.029PAT
PAT
tse
ββ
− −= = > = (6)
Model 2: ( ) 99%;18
ˆ 1 1.107 13.69 2.34
ˆ 0.029PAT
PAT
tse
ββ
− −= = > = (7)
These estimates are consistent with Figure 3 and those of the cost analysis in Table 4. More specifically, the ranges of the diseconomies of scale are similar for both analyses with a scale factor of about 1.2. This implies that a 10% increase in the scale of operation variables translates into a 12% increase in costs. 5 COMPLEMENTARY ANALYSIS: RETURNS TO SCALE IN PRODUCTION AND RELATIVE TECHNICAL EFFICIENCY The results presented in section 4 can be complemented by an analysis of returns to scale and relative technical efficiency for the different firms that make up the bus industry in Santiago.

.
13
Returns to scale have to do with the relationship between output increases relative to increases in inputs. Returns to scale and economies of scale are related, but one condition does not necessarily imply the other. For this reason we perform this complementary empirical analysis. Technical efficiency, on the other hand, estimates how close firms are to the production possibilities frontier. The firms closest to the frontier will be more efficient, while those farther away will be less efficient. 5.1 Analysis of Returns to Scale For the production function we depart from the work of Fernández et al. (2005). They consider that three of the main production inputs for bus firms (i.e. fleet, drivers and terminals) are perfect complements. Thus, for the empirical work it is not necessary to have detailed information for all of them. Another relevant input is fuel (diesel in our case), for which consumption depends mainly on the kilometers traveled by the buses. Therefore, we use the monthly commercial kilometers traveled by the buses (see KMC in Table 5) as a proxy variable for inputs, and the monthly number of passengers carried (PMT) as the output variable. Then, for the firm i during month t, the econometric model is:
0ln lnit KMC it itPMT KMCθ θ ε= + + (8)
The estimates of equation (4) are reported in Table 7:
Table 7 Regression Model Parameter Estimates (production)
Variable Model
ln(KMC) 0,928***
(0,014)
Const (θ0 ) 2.141***
(0.213)
R2 0.8979 0.9221
No. of obs. 252
Scale effect 1.236
p value of t test 0.000 Standard errors in parentheses. ** Significance at the 5% level; *** Significance at the 1% level.
To contrast the null hypothesis of increasing returns to scale ( )0 : 1KMCH θ > we use the
following expression:
Model 1: ( ) 99%;250
ˆ 1 0.928 15.14 2.34
ˆ 0.014KMC
KMC
tse
θθ
− −= = > = (9)
.
14
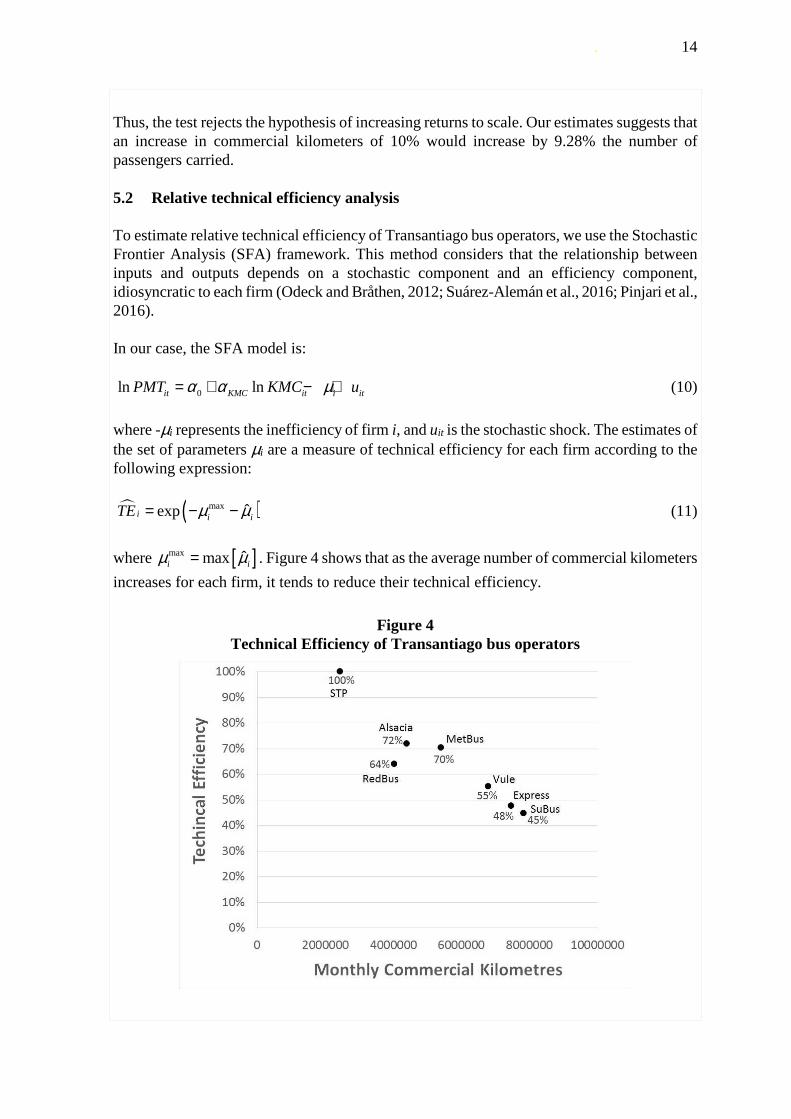
Thus, the test rejects the hypothesis of increasing returns to scale. Our estimates suggests that an increase in commercial kilometers of 10% would increase by 9.28% the number of passengers carried. 5.2 Relative technical efficiency analysis To estimate relative technical efficiency of Transantiago bus operators, we use the Stochastic Frontier Analysis (SFA) framework. This method considers that the relationship between inputs and outputs depends on a stochastic component and an efficiency component, idiosyncratic to each firm (Odeck and Bråthen, 2012; Suárez-Alemán et al., 2016; Pinjari et al., 2016). In our case, the SFA model is:
0ln lnit KMC it i itPMT KMC uα α µ= + − + (10)
where -µi represents the inefficiency of firm i, and uit is the stochastic shock. The estimates of the set of parameters µi are a measure of technical efficiency for each firm according to the following expression: � ( )max ˆexpi i iTE µ µ= − − (11)
where [ ]max ˆmaxi iµ µ= . Figure 4 shows that as the average number of commercial kilometers
increases for each firm, it tends to reduce their technical efficiency.
Figure 4 Technical Efficiency of Transantiago bus operators

.
15
6. CONCLUSIONS AND RECOMMENDATIONS The aggregate cost structure of the Santiago (Chile) urban bus transport industry was analyzed to determine the nature of its economies of scale, returns to scale and technical efficiency, since 2007, when the industry was restructured and formalized by the creation of the Transantiago system, which consists of a relatively few large companies using formal management methods within a much stricter regulatory framework. Econometric models were developed and used with data on both company costs and total company income payments (fares plus subsidies) as direct and indirect measures of the industry’s cost structure. The models found that under Transantiago, there were diseconomies of scale, the companies’ operating costs rising faster than the increase in their supply of bus services. In a complementary way, we find diminishing returns to scale in the production of trips, considering as a productive factor the commercial kilometres required to bus operators. Also, using the Sthocastic Frontier Analysis framework, we found that smaller firms are more efficient than larger firms. In light of these results, a number of recommendations are in order. First, in future tenders of Santiago bus route concessions, the regulatory framework should allow bids from smaller companies in order to reduce industry operating costs. Second, a larger number of smaller companies should be encouraged to participate as a way of promoting competition and facilitating the award of existing route concessions to new bidders where current service quality levels have fallen significantly below the established standards or industry averages. The study also found that, after correcting for passengers carried and distance travelled, articulated (18 metre) buses have significantly higher operating costs than conventional 12-metre vehicles. This implies that future tenders should not stipulate the use of these longer models. Finally, the continued publication by the Chilean authorities of the monthly and yearly data used in this study will allow the results presented here to be updated on a regular basis. REFERENCES Abrate, G.; Erbetta, F.; Fraquelli, G. and Vannoni, D. (2016). Bet big on doubles, bet smaller on triples. Exploring scope economies in multi-service passenger transport companies. Transport Policy, 52, 81-88. Avenali, A.; Boitani, A.; Catalano, G.; Tizana D’Alfonso, T. and Matteucci, G. (2016). Assessing standard costs in local public bus transport: Evidence from Italy. Transport Policy, 52, 164-174. Ayadi, A. and Hammami, S. (2015). Analysis of the technological features of regional public transport companies: the Tunisian case. Public Transport, 10.1007/s12469-015-0109-4
.
16
Berechman, J. (1983), Costs, Economies of Scale and Factor Demand in Bus Transport: An Analysis. Journal of Transport Economics and Policy, 17(1), 7-24. Berechman, J. and Giuliano, G. (1985). Economies of scale in bus transit: A review of concepts and evidence. Transportation, 12 (4), 313-332. Berechman, J. (1993). Public Transit Economics and Deregulation Policy. Vol. 23 Studies in regional science and urban economics, ISSN 0886-0416. Amsterdam, NorthHolland. Briones, I. (2009). Transantiago: Un problema de información. CEP, Revista Estudios Públicos, 116, 37-91. Button, K.J. and O'Donnell, K.J. (1985). An Examination of the Cost Structure Associated with Providing Urban Bus Service in Britain. Scottish Journal of Political Economy, 32, 67-81. Caves, D. W. and Christensen, L. R. (1988): The importance of Economies of Scale, Capacity Utilization, and Density in Explaining Interindustry differences in Productivity Growth. The Logistic and Transportation Review, 24, 3-32. Cervero, R. (1988). Transit Service Contracting: Cream-Skimming or Deficit Skimming? Urban Mass Transportation Administration, US Department of Transportation Technical Sharing Program, Washington, DC. Cowie, J. and Asenova, D. (1999). Organization Form, Scale Effects and Efficiency in the British Bus Industry. Transportation, 26, 231-248. Dalen, D. M. and Gomez-Lobo, A. (2003). Yardsticks on the road: regulatory contracts and cost efficiency in the Norwegian bus industry. Transportation, 30, 371–386. de Rus, G. and Nombela, G. (1997). Privatisation of urban bus services in Spain. Journal of Transport Economics and Policy, 31 (1), 115–129 Farsi, M.; Fetz, A. and Filippini. M. (2007). Economies of scale and scope in local public transportation. Journal of Transport Economic and Policy, 41(3):345–361. Fernández, J.E.; De Cea, J. and De Grange, L. (2005). Production Costs, Congestion, Scope and Scale Economies in Urban Bus Transportation Corridors. Transportation Research Part A, 39, 383–403. Filippini, M. and Prioni, P. (1994). Is scale and cost inefficiency in the Swiss bus industry a regulatory problem? Evidence from a frontier cost approach. Journal of the Economics of Business, 1, 219-231. Filippini, M. and Prioni, P. (2003). The Influence of Ownership on the Cost of Bus Service Provision in Switzerland - An Empirical Illustration. Applied Economics, 35(6), 683-90. Fiorio, C.V.; Florio, M. and Perucca, G. (2013). User satisfaction and the organization of local public transport: Evidence from European cities. Transport Policy, 29, 209-218.

.
17
Hensher, D. (1987). Productive Efficiency and Ownership of Urban Bus Services. Transportation, 14, 209-225. Iseki, H. (2008). Economies of scale in bus transit service in the USA: How does cost efficiency vary by agency size and level of contracting? Transportation Research Part A, 42, 1086–1097. Jørgensen, F., Pedersen, P. A., and Volden, R. (1997). Estimating the inefficiency in the Norwegian bus industry from stochastic cost frontier models. Transportation, 24(4), 421-433. Karlaftis, M.G. and McCarthy, P. (2002). Cost structures of public transit systems: a panel data analysis. Transportation Research Part E, 38, 1-18. Koenker, R. (1977). Optimal Scale and the Size Distribution of American Trucking Firms, Journal of Transport Economics and Policy, 11(1): 54-67. Koshal, R. (1972), Economies of Scale in Bus Transport: Some US Experience. Journal of Transport Economics and Policy, 6(2), pp. 151-153. Lai, L. W., Chau, K. W., and Cheung, P. A. C. (2012). Scale economies of the franchised buses and ferries of Hong Kong, 1948–1998. Review of Urban & Regional Development Studies, 24(3), 121-140. Lee, N. and Steedman, I. (1970). Economies of Scale in Bus Transport: I. Some British Municipal Results, Journal of Transport Economics and Policy, 4(1), 15-28. Matas, A. and Raymond, J.L. (1998). Technical characteristics and efficiency of urban bus companies: The case of Spain. Transportation, 25, 243-263. McCullough, W.S., Taylor, B. D., Wachs, M. (1998). Transit service contracting and cost-efficiency. Transportation Research Record, 1618, 69–77. McGillivray, R. G.; Kemp, M. A. and Beesley, M. E. (1980). Urban Bus Transit Costing. Working Paper, The Urban Institute, Washington, DC. Muñoz, J. C. and De Grange, L. (2010). On the development of public transit in large cities. Research in Transportation Economics, 29, 379-386. Morlok, Edward K., 1984. Economics of private operator services. Transportation Research Record, 980, 553–570. Obeng, K. (1985), Bus Transit Cost, Productivity and Factor Substitution. Journal of Transport Economics and Policy, 19(2), 183-203. Odeck, J. and Bråthen, S. (2012). A meta-analysis of DEA and SFA studies of the technical efficiency of seaports: A comparison of fixed and random-effects regression models. Transportation Research Part A, 46, 1574-1585.

.
18
Odeck, J. and Johansen, K. (2016). Elasticities of fuel and traffic demand and the direct rebound effects: An econometric estimation in the case of Norway. Transportation Research Part A, 83, 1-13. Perry, J. L. and Babitsky, T. T. (1986). Comparative performance in urban bus transit: assessing privatization strategies. Public Administration Review, 46 (1), 57–66. Pinjari, A.R.; Augustin, B.; Sivaraman, V.; Imani, F.; Eluru, N.; Pendyala, R.M. (2016). Stochastic frontier estimation of budgets for Kuhn–Tucker demand systems: Application to activity time-use analysis. Transportation Research Part A, 88, 117-133. Pucher, J. R.; Markstedt, A. and Hirschman, I. (1983). Impacts of subsidies on the costs of urban public transport. Journal of Transport Economics and Policy 17 (2), 155–176. Razali, N. M., and Wah, Y. B. (2011). Power Comparisons of Shapiro-Wilk, Kolmogorov-Smirnov, Lilliefors and Anderson-Darling Tests. Journal of Statistical Modeling and Analytics, 2(1), 21-33. Sakano, R. and Obeng, K. (1995). Re-examination of inefficiencies in urban transit systems: A stochastic frontier approach. Logistics and Transportation Review, 31,377–392. Savage, I. (1993). Deregulation and Privatization of Britain’s Local Bus Industry. Journal of Regulatory Economics, 5, 143-57. Sclar, E.D. (2000). You Don’t Always Get What you Pay For. Cornell University Press, Ithaca, NY. SECTRA (2003). Análisis Modernización de Transporte Público, VI Etapa. http://www.sectra.gob.cl/biblioteca/detalle1.asp?mfn=937&f_ip=&f_browser=&f_sistema_operativo=&f_resolucion_pantalla Shaw-Er, J.; Chiang, C. and Chen, Y.W. (2005) Cost Structure and Technological Change of Local Public Transport: The Kaohsiung City Bus Case. Applied Economics, 37(12): 1399-1410. Shughart, W. F. and Kimenyi, M.S., (1991). Public Choice, Public subsidies, and Public Transit. Urban Mass Transportation Administration Office of Private Sector Initiatives, Washington, DC. Singh S. K. (2002). A Note on Economies of Scale in Selected STUs. Indian Journal of Transport Management, 26(2): 207-224. Suárez-Alemán, A.; Morales J.; Serebrisky, T. and, Trujillo, L. (2016). When it comes to container port efficiency, are all developing regions equal? Transportation Research Part A, 86, 56-77. Tamblay, S.; Galilea, P.; Iglesias, P.; Raveau, S. and Muñoz, J.C. (2016). A zonal inference model based on observed smart-card transactions for Santiago de Chile. Transportation Research Part A, 84, 44-54.
.
19
Tauchen, H.; Fravel, F. and Gorman G. (1983). Cost structure of the intercity bus industry. Journal of Transportation Economic and Policy, 17, 25-48. Viton, P. (1981). A Translog Cost Function for Urban Bus Transit. The Journal of Industrial Economics, 29(3): 287-304. Wabe, J.S. and Coles, O. B. (1975). The Short and Long Run Cost of Bus Transport in Urban Areas. Journal of Transport Economics and Policy, 9(1): 127-140. Walter, M. (2011). Some determinants of cost efficiency in German public transport. Journal of Transport Economics and Policy, 45(1), 1-20. Williams, M. (1979). Firm Size and Operating Costs in Urban Bus Transportation. The Journal of Industrial Economics, 28(2), 209-218. Williams, M. and Dalal, A. (1981). Estimation of the Elasticities of Factor Substitution in Urban Bus Transportation: A Cost Function Approach. Journal of Regional Science, 21, 263-275. Williams, M. and Hall, C. (1981). Return to Scale in the United States Intercity Bus Industry. Regional Science and Urban Economics, 21, 573-584. Xu, K.; Windle R.; Grim, C. and Corsi, T. (1994). Re-evaluating returns to scale in transport. Journal of Transportation Economic and Policy, 28, 275-286.