Empowering Employees - Cornerstone · 2017-07-11 · rates are dropping. However, institutions with...
18
Empowering Employees The state of employee engagement and retention in higher education
Transcript of Empowering Employees - Cornerstone · 2017-07-11 · rates are dropping. However, institutions with...
Empowering EmployeesThe state of employee engagement and retention in higher education

2
HR and talent management professionals in higher education face challenges similar to those in the private sector. Keeping all employees engaged is just as important to colleges and universities as it is to businesses. However, academic talent leaders face an uphill battle. A recent survey found 52 percent of faculty members were not engaged in their work, and an additional 14 percent were actively disengaged. Only 34 percent reported feeling engaged at their jobs.1
How do institutions reverse this trend, transforming disengagement into engagement, supporting student success and improving faculty and staff retention? How is employee engagement measured in higher education and what programs or incentives do organizations use for engagement and retention? Do institutions take different approaches to engagement programs for faculty versus staff? What are the roadblocks to increasing faculty and staff engagement and retention?
To answer these questions and others, Cornerstone OnDemand and Ellucian, strategic partners since 2009, collaborated with the Human Capital Media Research and Advisory Group — the research arm of Workforce magazine —for the 2016 Employee Engagement and Retention in Higher Education Survey. The study surveyed professionals at academic institutions for their input on how their institutions are engaging their workforce. Additionally, the survey examined institutions that reported below-average turnover among faculty and staff and determined if they were doing anything differently to establish a set of best practices for engaging and retaining academic employees.

3
Key Findings • Student success depends on both faculty and staff engagement.
• Measurement is key to successful employee engagement.
• Employee engagement and retention are financially beneficial to institutions.
MethodologyFor more, see page Appendix.
The 2016 Employee Engagement and Retention in Higher Education Survey received participation from 469 respondents at a variety of higher education institutions.

Figure 1: The turnover rate at our institution is...
Very high/above average Average Very low/below average
27.2%
41.1% 42.3%
36.6%
30.5%
22.3%
Faculty turnover Staff turnover
4
Terms used This report places employees at higher education institutions into two categories: faculty and staff. For the purposes of the survey and this report, faculty includes professors, assistants and researchers. Staff includes administrators, support and grounds personnel.
Attrition and turnoverMost reported survey statistics represent the entire set of respondents. Where noted, the differences between institutions that reported high or low faculty and staff turnover are shown. These institutions are self-identified; respondents were asked to characterize the turnover rate for their faculty and staff. Nearly one-third of respondents said the turnover rate for their faculty was low or below average, while nearly a quarter of respondents reported lower-than-average turnover for their staff employees (Figure 1).2

I know several who have left that had a passion for the university, but the attraction for better benefits and compensation and a better workplace outweighed their commitment to the University. We are currently in a difficult financial situation and a lot of institutional knowledge has left for greener pastures or retirements.
— survey respondent at institution with below average faculty turnover, open comments
5
When asked what affects attrition at their institutions, survey respondents mentioned compensation, workload and culture as top drivers. Some challenges affect faculty more than staff or vice versa. For example, work culture is more of an attrition driver for staff than faculty, while faculty members were more likely than staff to leave a job for another at a different university (Figure 2).2
Figure 2: Top drivers of attrition
58.2%48.5%
29.6%43.5%
47.1%36.1%
34.4%33.9%
46.6%29.5%
38.9%14.1%
Compensation/benefits
Compensation from other universities
Work load
Governance/administration
Work culture
Competition from the private sector
Top driver of staff attrition Top driver of faculty attrition

Student success depends on both faculty and staff engagement Whether or not students will be successful in higher education depends on a multitude of factors, including how prepared they are for college, how much they study for classes and their overall stress levels. However, student success is not all on the students alone; engaged faculty and staff influence student outcomes. Survey respondents report that student success depends, in part, on the efforts of both faculty and staff. Student success is also crucial to the reputation and continuation of the institution as a whole. Many respondents also noted the major correlation between professional improvement and student success (Figure 3).
Engaged employees are happy employees and happy employees are more customer focused and willing to help. That has a huge impact on student success.
— survey respondent at institution with below average faculty turnover, open comments
6
Figure 3: Impact employee personal developmentprograms have on student success
No effect
Minor effect
Moderate effect
Major effect
2.6%
15.9%
41.6%
39.8%
Figure 4: Employees who are extremelyimpactful to student success
80.5%Faculty
Student affairs staff
Deans
Support staff (registrar, bursar)
Administrative staff
47.7%
35.9%
33.6%
20.3%
7
The interconnectedness of employee engagement and success with student and institutional success should be considered in the decision-making processes for governance in higher education — and development shouldn’t be limited to one employee segment. While survey respondents overwhelmingly agree that faculty members are the most likely to impact student success, they also say that all employees contribute (Figure 4).
The need to assist students comes at a time when student graduation rates are declining. By engaging academic employees, institutions can indirectly address falling graduation rates. As one survey respondent wrote, “Engaged employees are more committed to student success.” Engaging the workforce starts by tracking engagement and offering programs that shore up deficiencies.

Measurement is key to successful employee engagement The first step to engaging the workforce is having the tools in place to measure and track engagement. The ability to compare previous engagement with current attitudes and make adjustments, if necessary, allows an institution to create a baseline and identify areas of opportunity. Leading indicators such as net promoter scores help schools keep a pulse on how their employees are feeling, while other methods of continuous feedback such as ongoing performance reviews can help institutions be more in touch with their employees overall. From there, institutions can make informed decisions toward implementing programs that will lead to positive outcomes for everyone from faculty and staff to students. Among survey respondents, the majority have some type of tracking in place at their institutions. Such programs usually apply to both faculty and staff. Few organizations only have programs for one group or the other (Figure 5).
What could your institution do to improve student outcomes through employee engagement?
“Have supervisors ask about employees’ professional goals and provide professional development opportunities aligned with those goals.”
— survey respondent at institution with below average faculty turnover, open comments
8

9
There are a number of ways institutions of higher learning track and measure employee engagement. Employee engagement tools can incorporate a variety of high and low-tech tools to assist institutions at any budget. Often, questions surrounding employee engagement can be incorporated into ongoing processes, such as annual employee reviews or student satisfaction surveys. Institutions can also leverage technology to promote employee engagement. Although relatively few institutions use technology to leverage engagement, some are exploring the possibilities. Nearly half (47.2 percent) of respondents report the use of a Learning Management System (LMS) at their institutions. Almost 35 percent of institutions incorporate technology into regular performance feedback tools (such as appraisals), while 33.3 percent of institutions use performance management tools. Other popular measurement tools (that may or may not be technology based) include surveys, reviews and attrition data (Figure 6).
Figure 5: Does your institution track and/or measure employee engagement?
47.1%No
Yes, for both faculty and staff
Yes, for staff only
Yes, for faculty only
38.9%
9.3%
4.8%

Once baseline engagement levels are identified, institutions interested in improving their engagement levels should take the next step: designing and implementing programs to improve engagement. Programs that recognize employees for their hard work, build goodwill among peers, or encourage leadership development are all popular programs already in place at many organizations. Survey respondents whose organizations report lower-than-average faculty and staff turnover are also more likely to report using a wide variety of employee engagement programs in greater numbers than institutions with higher-than-average turnover (Figure 7).
The results of our most recent survey found communication, wellness, recognition and professional development opportunities to be the areas we needed to improve.
— survey respondent at institution with below average faculty turnover, open comments
10
Figure 6: How institutions measure employee engagement
29.0%Standardized questions on
engagement surveys
Annual employee review process
Student survey
Employee attrition/retention data
27.0%
16.0%
15.3%

11
Recognition programs are especially popular among these institutions, as almost half report having such programs in place. With metrics tracked and programs in place, organizations now need to take the collected data and make a successful business case for their employee engagement programs.
Figure 7: Programs used to improve employee engagement
Recognitionprograms
Institutions with low staff turnover
Institutions with high staff turnover
Institutions with low faculty turnover
Institutions with high faculty turnover
49.4%49.1%
32.5%24.7%
48.2%42.6%
23.4%21.7%
33.3%32.4%
15.6%16.5%
30.9%30.6%
13.6%10.3%
19.8%24.1%
8.4%8.3%
Leadershipdevelopmentopportunities
Team buildingexercise/events
Mentoring/coaching
Extracurricularactivities (clubs,
interest-basedgroups)

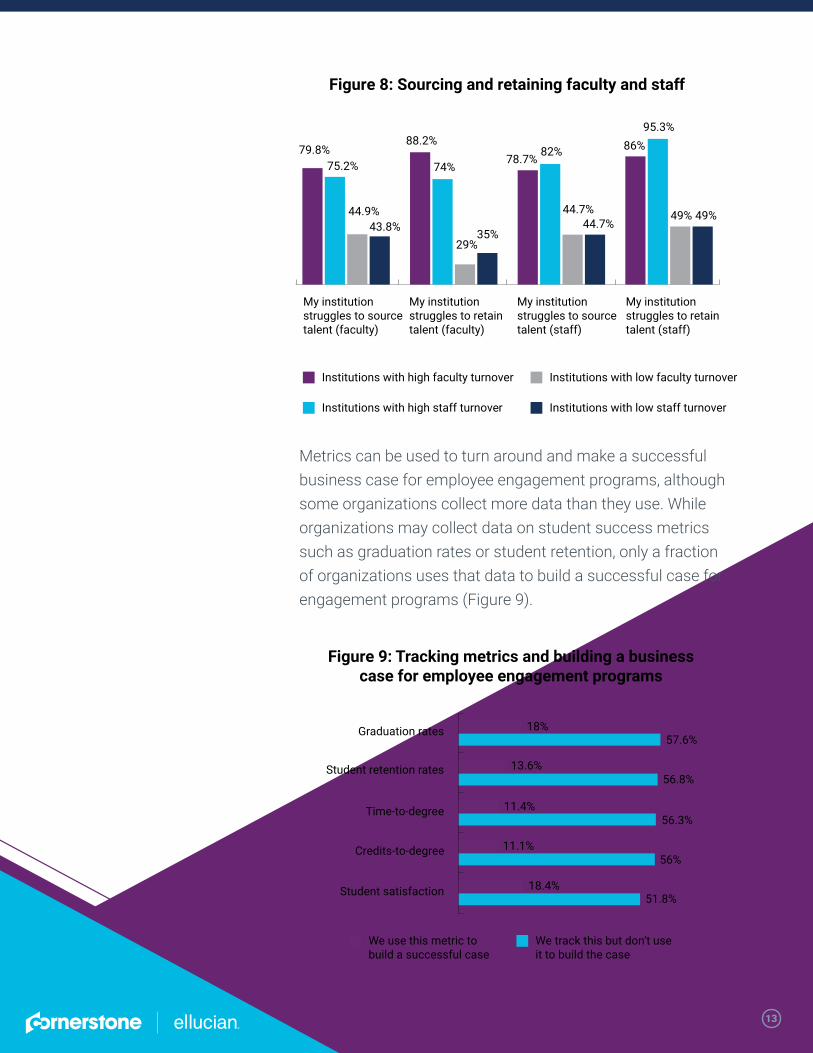
Employee engagement and retention are financially beneficial to institutions Why should institutions care about whether or not their employees are engaged? We’ve already seen how employees can have a major impact on student success. If employees aren’t engaged, there’s little reason for them to remain at their institutions — especially for faculty members when tenure rates are dropping. However, institutions with lower turnover levels (both faculty and staff) report an easier time sourcing and retaining talent (Figure 8).
What could your institution do to improve student outcomes through employee engagement?
“Help people directly see how their work impacts student learning, retention, persistence and graduation.”
— survey respondent at institution with below average faculty turnover, open comments
12
13
Metrics can be used to turn around and make a successful business case for employee engagement programs, although some organizations collect more data than they use. While organizations may collect data on student success metrics such as graduation rates or student retention, only a fraction of organizations uses that data to build a successful case for engagement programs (Figure 9).
Figure 9: Tracking metrics and building a businesscase for employee engagement programs
We use this metric tobuild a successful case
We track this but don’t useit to build the case
18%57.6%
13.6%56.8%
11.4%56.3%
11.1%56%
18.4%51.8%
Graduation rates
Student retention rates
Time-to-degree
Credits-to-degree
Student satisfaction
Figure 8: Sourcing and retaining faculty and staff
Institutions with high faculty turnover
Institutions with high staff turnover
Institutions with low faculty turnover
Institutions with low staff turnover
My institutionstruggles to sourcetalent (faculty)
My institutionstruggles to retaintalent (faculty)
My institutionstruggles to sourcetalent (staff)
My institutionstruggles to retaintalent (staff)
79.8%75.2%
44.9%43.8%
88.2%
74%
29%35%
78.7% 82%
44.7%44.7%
86%95.3%
49% 49%

14
Besides not using collected data, there are other challenges to improving employee engagement. Roadblocks such as workload, culture and compensation are all top reported challenges at many institutions (Figure 10). As we saw in Figure 2, many of these roadblocks are also the top drivers of faculty and staff attrition.
It is important that institutions keep trying to motivate their workforce, as having engaged employees comes with other benefits for the organization as well, including greater retention rates for loyal, happy employees. The more employees choose to stay with the institution, the less colleges and universities will have to spend on costly hiring and onboarding programs for new hires. The cost savings associated with retaining top faculty members cannot be overstated; Iowa State University recently estimated an average savings of more than $83,000 per faculty member retained when engagement practices (in their case, flexible work options) were applied.
Figure 10: Top roadblocks to increasingemployee engagement
Work load
Work culture
Compensation/benefits
Governance/administration
Review/promotion process
60.5%
53.7%
46.1%
40.7%
31.6%

15
ConclusionFaculty and staff have the potential to make or break the student experience. If they are engaged and passionate about their work, these workforce members will go the extra mile to mentor students and provide a nurturing environment so those students can thrive. It’s up to institutions to support their workforce through programs and initiatives designed to bolster employee engagement. By adding programs, tracking engagement levels and using metrics to make the business case for engagement programs, institutions will be better positioned to retain essential faculty and staff members, who will then go on to support students, contributing to success for all.

16
Appendix
Demographics
SURVEY DATES: JUNE-JULY 2016 PARTICIPANTS: 469
INSTITUTION SIZE Including faculty, staff, full-time, part-time, student workers and contract workers.
Less than 500 23.9 percent
500 - 999 19.8 percent
1,000 - 2,999 26.5 percent
3,000 - 9,999 20.4 percent
More than 10,000 9.3 percent
INSTITUTION TYPETwo year 23.4 percent
Four year 71.6 percent
Vocational/trade 5 percent
INSTITUTION STATUSPublic 61.2 percent
Private 33.2 percent
For-profit 5.5 percent

17
About Cornerstone OnDemand Cornerstone OnDemand (NASDAQ: CSOD) is the global leader in cloud-based learning and talent management software. The company’s solutions help organizations realize the potential of the modern workforce. From recruitment, onboarding, training and collaboration, to performance management, compensation, succession planning and analytics, Cornerstone is designed to enable a lifetime of learning and development that is fundamental to the growth of employees and organizations.
Based in Santa Monica, California, the company’s solutions are used by more than 2,700 clients worldwide, spanning 26.3 million users across 191 countries and 42 languages. To learn more about Cornerstone, visit www.cornerstoneondemand.com.
Ellucian Ellucian is the world’s leading provider of software and
services higher education institutions need to help students succeed. More than 2,400 institutions in 40 countries rely on Ellucian to help enable the mission of higher education for over 18 million students. Ellucian provides student information systems (SIS), finance and HR, recruiting, retention, analytics and advancement software solutions. With more than 1,400 institutions subscribing to Ellucian’s cloud services and SaaS offerings, the company is one of the largest providers of cloud-based solutions. Ellucian also supports the higher education community with a range of professional services such as application software implementation, training, education, and management consulting. Visit Ellucian at www.ellucian.com.

© 2016 Cornerstone OnDemand | [email protected] | 888-365-CSOD Stay connected:
Cornerstone OnDemand is the global talent management software provider that is pioneering solutions to help organizations realize the potential of a modern workforce. csod.com
Ellucian is the world’s leading provider of software and services higher education institutions need to help students succeed. Visit Ellucian at www.ellucian.com
1 Jaschik, S. and Lederman, D. (2015). College and University Faculty Workplace Engagement. Gallup.
2 A recent survey placed “average” academic turnover at 12.8 percent. Source: Compensation Data Colleges & Universities 2015.
3 The Chronicle of Higher Education (2015).
Student Success: Building a culture for retention and completion on college campuses.
4 American Council on Education (2016).
Making the Business Case: the imperative for supporting and promoting workplace flexibility in higher education.
Workforce Workforce is a multimedia publication that covers the intersection of people management and business strategy. Our community of senior-level human resources executives and C-level officers are the key decision-makers on talent management matters in the 2,500 largest corporations in America. They read us for our editorial focus and relevance to help them improve their business — and their bottom line — through effective management of the workforce. Our content helps HR professionals approach their jobs from a more strategic, big-picture, business-results perspective.
Human Capital Media The Human Capital Media (HCM) Research and Advisory Group is the research division of Human Capital Media, publisher of Talent Economy, Chief Learning Officer and Workforce magazines. The Research and Advisory Group specializes in partnered custom content solutions — customizable and proprietary deliverables that integrate seamlessly with existing marketing programs. Our proprietary Talent Tracker data tool gives practitioners point-of-need data analytics access to inform strategic HR decisions. By leveraging access to senior-level decision-makers and identifying industry trends, the HCM Research and Advisory Group can deliver keen insight into all areas of L&D, talent, and HR. For inquiries, contact Sarah Kimmel, vice president: [email protected].