Elway Poll 14Nov17elwayresearch.com/Current_Polls/Politics of Resentment NOV2017.pdfdistrict versus...
3
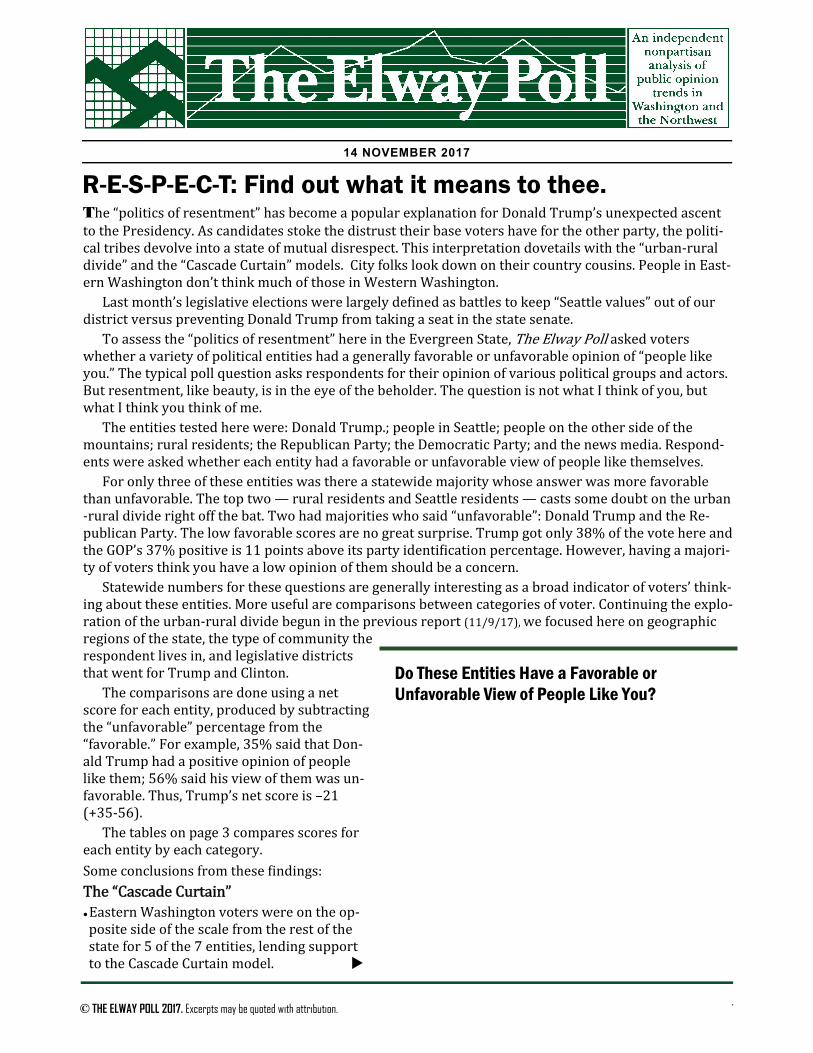
©THE ELWAY POLL 14 NOV 17 14 NOVEMBER 2017 R-E-S-P-E-C-T: Find out what it means to thee. The “politics of resentment” has become a popular explanation for Donald Trump’s unexpected ascent to the Presidency. As candidates stoke the distrust their base voters have for the other party, the politi- cal tribes devolve into a state of mutual disrespect. This interpretation dovetails with the “urban-rural divide” and the “Cascade Curtain” models. City folks look down on their country cousins. People in East- ern Washington don’t think much of those in Western Washington. Last month’s legislative elections were largely deϐined as battles to keep “Seattle values” out of our district versus preventing Donald Trump from taking a seat in the state senate. To assess the “politics of resentment” here in the Evergreen State, The Elway Poll asked voters whether a variety of political entities had a generally favorable or unfavorable opinion of “people like you.” The typical poll question asks respondents for their opinion of various political groups and actors. But resentment, like beauty, is in the eye of the beholder. The question is not what I think of you, but what I think you think of me. The entities tested here were: Donald Trump.; people in Seattle; people on the other side of the mountains; rural residents; the Republican Party; the Democratic Party; and the news media. Respond- ents were asked whether each entity had a favorable or unfavorable view of people like themselves. For only three of these entities was there a statewide majority whose answer was more favorable than unfavorable. The top two — rural residents and Seattle residents — casts some doubt on the urban -rural divide right off the bat. Two had majorities who said “unfavorable”: Donald Trump and the Re- publican Party. The low favorable scores are no great surprise. Trump got only 38% of the vote here and the GOP’s 37% positive is 11 points above its party identiϐication percentage. However, having a majori- ty of voters think you have a low opinion of them should be a concern. Statewide numbers for these questions are generally interesting as a broad indicator of voters’ think- ing about these entities. More useful are comparisons between categories of voter. Continuing the explo- ration of the urban-rural divide begun in the previous report (11/9/17), we focused here on geographic regions of the state, the type of community the respondent lives in, and legislative districts that went for Trump and Clinton. The comparisons are done using a net score for each entity, produced by subtracting the “unfavorable” percentage from the “favorable.” For example, 35% said that Don- ald Trump had a positive opinion of people like them; 56% said his view of them was un- favorable. Thus, Trump’s net score is –21 (+35-56). The tables on page 3 compares scores for each entity by each category. Some conclusions from these ϐindings: The “Cascade Curtain” ● Eastern Washington voters were on the op- posite side of the scale from the rest of the state for 5 of the 7 entities, lending support to the Cascade Curtain model. © THE ELWAY POLL 2017. Excerpts may be quoted with attribution. Do These Entities Have a Favorable or Unfavorable View of People Like You?
Transcript of Elway Poll 14Nov17elwayresearch.com/Current_Polls/Politics of Resentment NOV2017.pdfdistrict versus...
©THE ELWAY POLL 14 NOV 17
14 NOVEMBER 2017
R-E-S-P-E-C-T: Find out what it means to thee. The“politicsofresentment”hasbecomeapopularexplanationforDonaldTrump’sunexpectedascenttothePresidency.Ascandidatesstokethedistrusttheirbasevotershavefortheotherparty,thepoliti-caltribesdevolveintoastateofmutualdisrespect.Thisinterpretationdovetailswiththe“urban-ruraldivide”andthe“CascadeCurtain”models.Cityfolkslookdownontheircountrycousins.PeopleinEast-ernWashingtondon’tthinkmuchofthoseinWesternWashington.Lastmonth’slegislativeelectionswerelargelyde inedasbattlestokeep“Seattlevalues”outofourdistrictversuspreventingDonaldTrumpfromtakingaseatinthestatesenate.Toassessthe“politicsofresentment”hereintheEvergreenState,TheElwayPollaskedvoterswhetheravarietyofpoliticalentitieshadagenerallyfavorableorunfavorableopinionof“peoplelikeyou.”Thetypicalpollquestionasksrespondentsfortheiropinionofvariouspoliticalgroupsandactors.Butresentment,likebeauty,isintheeyeofthebeholder.ThequestionisnotwhatIthinkofyou,butwhatIthinkyouthinkofme.Theentitiestestedherewere:DonaldTrump.;peopleinSeattle;peopleontheothersideofthemountains;ruralresidents;theRepublicanParty;theDemocraticParty;andthenewsmedia.Respond-entswereaskedwhethereachentityhadafavorableorunfavorableviewofpeoplelikethemselves.Foronlythreeoftheseentitieswasthereastatewidemajoritywhoseanswerwasmorefavorablethanunfavorable.Thetoptwo—ruralresidentsandSeattleresidents—castssomedoubtontheurban-ruraldividerightoffthebat.Twohadmajoritieswhosaid“unfavorable”:DonaldTrumpandtheRe-publicanParty.Thelowfavorablescoresarenogreatsurprise.Trumpgotonly38%ofthevotehereandtheGOP’s37%positiveis11pointsaboveitspartyidenti icationpercentage.However,havingamajori-tyofvotersthinkyouhavealowopinionofthemshouldbeaconcern.Statewidenumbersforthesequestionsaregenerallyinterestingasabroadindicatorofvoters’think-ingabouttheseentities.Moreusefularecomparisonsbetweencategoriesofvoter.Continuingtheexplo-rationoftheurban-ruraldividebeguninthepreviousreport(11/9/17),wefocusedhereongeographicregionsofthestate,thetypeofcommunitytherespondentlivesin,andlegislativedistrictsthatwentforTrumpandClinton.Thecomparisonsaredoneusinganetscoreforeachentity,producedbysubtractingthe“unfavorable”percentagefromthe“favorable.”Forexample,35%saidthatDon-aldTrumphadapositiveopinionofpeoplelikethem;56%saidhisviewofthemwasun-favorable.Thus,Trump’snetscoreis–21(+35-56).Thetablesonpage3comparesscoresforeachentitybyeachcategory.Someconclusionsfromthese indings:The “Cascade Curtain” ● Eastern Washington voters were on the op-posite side of the scale from the rest of the state for 5 of the 7 entities, lending support to the Cascade Curtain model. © THE ELWAY POLL 2017. Excerpts may be quoted with attribution.
Do These Entities Have a Favorable or Unfavorable View of People Like You?

©THE ELWAY POLL 14 NOV 17
2
from p.1● Eastern Washington was the only region with a positive score for either Trump (+13) or the Republi-can Party (+28). ● The Cascade Curtain seems to be more about Seattle than the mountains: Seattle was the only region in the state where a plurality thought Eastern Washington residents have a negative view of them, but not by much (-6). Conversely, Eastern Washington was the only region in the state where a plurality thought Seattle residents had a negative view of them, but the balance was virtually even (-1). The score in Eastern Washington for people “on the other side of the Cascades” was +2. Urban-Rural Divide
● Rural voters were most likely to feel disrespected. Pluralities thought that every entity had an unfavor-able view of them, except for other rural residents (+62) and Trump (+11). ● In contrast, pluralities in every category thought that rural residents had a positive view of them. ● Both parties had negative scores among rural voters: Republicans (-3); Democrats (-4). ● People in small towns were most likely to think they were held in generally positive regard: They had positive scores for 6 of the 7 entities. The exception was Trump (-7). ● People in big cites and suburbs thought they were favorably regarded every entity except Donald Trump and the Republican Party. ● Small city residents were mixed. They had strong positive scores for Seattle, people on the other side of the mountains and rural residents; a small positive for the Democratic party; and negative scores for Trump, the Republican party and the news media. ● In King County outside Seattle: The Democratic Party was +34; The Republican Party was –38. The Partisan Landscape Big news last year was Republican wins in several long-time Democratic counties along the coast. These survey indings suggest that it won’t be easy for the Republican Party to move off those beachheads. ● The Republican party was seen by a plurality of voters as viewing them favorably in only three areas: +11 in Trump districts; +15 in small towns; +28 in Eastern Washington. ● The Democratic party, in contrast, had positive scores in all 10 of the other geographic categories. ● Democrats had a large advantage in the suburbs—considered a primary partisan battle ield. The Democratic Party was +34 when suburban voters were asked if the party respected them; The Republican Party was –38 and Trump was –53. ● In the western counties, which caused all the commotion last year: The Democratic Party was +20; The Republican Party was –21. ● There was a sizeable “enthusiasm gap” in the Trump and Clinton legislative districts: In districts carried by Trump, the Republican Party was +11, while the Democratic Party was only –7, for an 18-point differential. In districts Clinton carried, the Democratic Party was +29; the Republican party was –30, for a 59-point differential. Allofthisaddsuptoadif icultpoliticalclimateforWashingtonRepublicans.What’snew?Asisthecasenationally,theRepublicanbaseinWashingtonstateappearstoberetreatingtolessdenselypopulatedareas.Evenlastyear’sbrightspotsfortheGOPappeartobedimming.Itisafullyearuntilthenextelec-tion,ofcourse.WithDemocratsnowintotalcontrolofstategovernment,wehavetheexactoppositeofthenationalgovernment.Lotsofcrosswindsblowingacrossthepoliticalterrain.

©THE ELWAY POLL 14 NOV 17
3
The Elway Poll is an independent, non-partisan analysis of public opinion in Washington and the Northwest.
PROPRIETARY QUESTIONS: Each quarter, space is reserved in the questionnaire to allow for proprietary questions. The fee for proprietary questions is $1000 per question. You will receive the results of your question(s) with full crosstabulations within three days after the interviews are completed.
REGION King County ........................................ 30% Pierce + Kitsap .................................... 15% North Sound (Snohomish to Whatcom) ........ 17% Western Washington (Clallam to Clark) .... 17% Eastern Washington ........................... 20%
GENDER Male .................................................... 48% Female ................................................ 52%
AGE 18-35 ................................................... 11% 36-50 ................................................... 22% 51-64 ................................................... 34% 65+ ...................................................... 30%
PARTY IDENTIFICATION Democrat ............................................ 35% Republican ......................................... 26% Independent ........................................ 39%
OCCUPATION Retired ................................................ 34% Self Employed / Owner ....................... 12% Professional ........................................ 20% White Collar ........................................ 14% Blue Collar .......................................... 11% Not Employed ....................................... 7%
EDUCATION High School......................................... 12% Some College ..................................... 29% College Graduate ................................ 34% Post Graduate ..................................... 24%
HOUSEHOLD INCOME <$50,000 ............................................. 19% $50 - 74,000 ........................................ 20% $75 - 99,000 ........................................ 13% $100,000+ ........................................... 27% No Answer .......................................... 22%
The Elway Poll
Sample Profile
T h e E l w a y P o l l S e a t t l e , W A
2 0 6 / 2 6 4 - 1 5 0 0 F A X : 2 6 4 - 0 3 0 1 [email protected]
500 registered voters, selected at random from registered voter lists in Washington state, were interviewed October 26-29 by live, professional interviewers. 33% of the in-terviews were conducted on cell phones. The margin of sampling error is ±4.5% at the 95% level of confidence. This means, in theory, had this same survey been conducted 100 times, the results would be within ±4.5% of the results reported here at least 95 times.
TABLE 1: Legislative Districts won by Clinton,
The scores in the tables below are computed by subtracting the percentage who said the entity had an unfavorable view from the percentage who said it had a favorable view of “people like me.”
Table 1 compares voters in legislative district s carried by Clinton vs. voters in districts carried by Trump. The unit of analysis is the districts, not the individual voters. In this sample, 61% of the re-spondents lived in districts won by Clinton; 39% lived in districts won by Trump.
Table 2 compares scores by type of community. Respondents were asked how they described their community: large city (24%); smaller city (20%); suburban area (21%); small town (18%); rural area (17%).
Table 3 compares scores by the regions of the state, described in the Sample profile on this page.
Comparative Favorability Scores
SEA KING P/K N SND WEST EAST
TRUMP -64 -44 -18 -18 -19 +13 SEATTLE +60 +48 0 +19 +11 -1 OVER MTNS -5 +21 +15 +24 +29 +2 RURAL +9 +47 +33 +61 +51 +66 REPUBLICANS -56 -28 -20 -13 -21 +28 DEMOCRATS +47 +32 +6 +18 +20 -16 MEDIA +35 +17 -20 +3 +11 -16
BIG CITY SMALL CITY SUBURB TOWN RURAL TRUMP -41 -4 -53 -7 +11 SEATTLE +51 +10 +34 +6 -13 OVER MTNS 0 +34 +21 +26 -2 RURAL +27 +57 +44 +62 +62 REPUBLICANS -32 -5 -38 +15 -3 DEMOCRATS +32 +3 +34 +3 -4 MEDIA +19 -12 +19 +2 -22
DISTRICTS WON BY> CLINTON TRUMP TRUMP -37 +3 SEATTLE +35 -2 OVER MTNS +16 +15 RURAL +42 +58 REPUBLICANS -30 +11 DEMOCRATS +29 -7 MEDIA +16 -17
TABLE 2: By Type of Community
NET FAVORABILITY SCORES Favorable—Unfavorable View of People Like You
TABLE 3: By Region of the State