
Effects of imported intermediate inputs on productivity
13
Monthly Labor Review • June 2010 3 Imported Inputs and Productivity Effects of imported intermediate inputs on productivity Lucy P. Eldridge and Michael J. Harper Lucy P. Eldridge is a senior econo- mist in the Office of Productivity and Technology, Bureau of Labor Statistics. Michael J. Harper is Associate Commissioner of the Office. Email: eldridge.lucy@bls. gov or [email protected] A framework for estimating the effects of imported intermediate inputs on U.S. major-sector labor productivity is used together with the Solow multifactor productivity equation to show that private business sector multifactor productivity may have grown about 0.1 percent more slowly than what the BLS published series indicates O ffshoring, or offshore outsourc- ing—the substitution of imported intermediate inputs for domestic labor or domestically produced intermediate inputs—affects U.S. economic performance. e existing framework for measuring pro- ductivity does not permit an analysis of offshoring; thus, the framework needs to be adjusted in order to assess the effects of imported intermediate inputs on the U.S. economy. e BLS Major Sector Productiv- ity program develops measures of labor pro- ductivity for broad sectors of the economy: business, nonfarm business, manufacturing, and nonfinancial corporations. In addi- tion, the program develops annual indexes of multifactor productivity for the private business sector, the manufacturing sector, and most manufacturing groups. is article focuses on BLS productivity measures for the private business sector and the manu- facturing sector. Productivity measures for these two sectors are constructed under dif- ferent methodologies: the private business sector productivity measures use a value- added output concept, while the manufac- turing sector measures use a sectoral output approach. is difference in methodology influences the effects of imported interme- diates on BLS measures of productivity. In the sections that follow, the private busi- ness sector and the manufacturing sector are analyzed separately with an eye toward devel- oping a framework for estimating the effects of imported intermediate inputs on U.S. major- sector labor productivity. First, the production model used to calculate the BLS private business sector multifactor productivity measures is ex- panded to treat imported intermediate inputs as an input, rather than as a subtraction from out- put. en, the BLS framework for constructing manufacturing multifactor productivity is de- composed in order to isolate imported interme- diate inputs. For both sectors, the Solow multi- factor productivity equation is used to estimate the effects on labor productivity of substitution between imported intermediate inputs and U.S. hours worked. 1 e data reveal that growth in imported intermediate inputs contributed 14 percent to the average annual growth in labor productivity for the private business sector, and 23 percent to the average annual growth in la- bor productivity in the manufacturing sector, from 1997 to 2006. 2 Data sources Output. Real output measures used by the BLS to construct major-sector productivity statistics are produced by the Bureau of Eco-
Transcript of Effects of imported intermediate inputs on productivity

Monthly Labor Review • June 2010 3
Imported Inputs and Productivity
Effects of imported intermediateinputs on productivity
Lucy P. EldridgeandMichael J. Harper
Lucy P. Eldridge is a senior econo-mist in the Office of Productivity and Technology, Bureau of Labor Statistics. Michael J. Harper is Associate Commissioner of the Office. Email: [email protected] or [email protected]
A framework for estimating the effects of importedintermediate inputs on U.S. major-sector labor productivityis used together with the Solow multifactor productivityequation to show that private business sector multifactorproductivity may have grown about 0.1 percentmore slowly than what the BLS published series indicates
Offshoring, or offshore outsourc-ing—the substitution of imported intermediate inputs for domestic
labor or domestically produced intermediate inputs—affects U.S. economic performance. The existing framework for measuring pro-ductivity does not permit an analysis of offshoring; thus, the framework needs to be adjusted in order to assess the effects of imported intermediate inputs on the U.S. economy. The BLS Major Sector Productiv-ity program develops measures of labor pro-ductivity for broad sectors of the economy: business, nonfarm business, manufacturing, and nonfinancial corporations. In addi-tion, the program develops annual indexes of multifactor productivity for the private business sector, the manufacturing sector, and most manufacturing groups. This article focuses on BLS productivity measures for the private business sector and the manu-facturing sector. Productivity measures for these two sectors are constructed under dif-ferent methodologies: the private business sector productivity measures use a value-added output concept, while the manufac-turing sector measures use a sectoral output approach. This difference in methodology influences the effects of imported interme-diates on BLS measures of productivity.
In the sections that follow, the private busi-ness sector and the manufacturing sector are analyzed separately with an eye toward devel-oping a framework for estimating the effects of imported intermediate inputs on U.S. major-sector labor productivity. First, the production model used to calculate the BLS private business sector multifactor productivity measures is ex-panded to treat imported intermediate inputs as an input, rather than as a subtraction from out-put. Then, the BLS framework for constructing manufacturing multifactor productivity is de-composed in order to isolate imported interme-diate inputs. For both sectors, the Solow multi-factor productivity equation is used to estimate the effects on labor productivity of substitution between imported intermediate inputs and U.S. hours worked.1 The data reveal that growth in imported intermediate inputs contributed 14 percent to the average annual growth in labor productivity for the private business sector, and 23 percent to the average annual growth in la-bor productivity in the manufacturing sector, from 1997 to 2006.2
Data sources
Output. Real output measures used by the BLS to construct major-sector productivity statistics are produced by the Bureau of Eco-

Imported Inputs and Productivity
4 Monthly Labor Review • June 2010
nomic Analysis (BEA) of the U.S. Department of Com-merce. The most widely known measure of aggregate out-put for the U.S. economy is the gross domestic product (GDP): the sum of personal consumption expenditures, gross private domestic investment, government consump-tion expenditures and gross investment, and exports of goods and services less imports of goods and services. The BEA constructs nominal outputs for detailed components of GDP from various data sources, converts the outputs to real measures, and then aggregates them to calculate real GDP.
As a fundamental part of the national accounts, the BEA also distinguishes three primary sectors of GDP: busi-ness, household, and government.3 The business sector ac-counts for the bulk of national output. The BEA calculates business sector output by removing from GDP the gross products of general government, private households, and nonprofit institutions.4
Ideally, productivity statistics measure the productiv-ity of the U.S. economy at the most aggregate level of domestic output—that is, GDP. However, the BLS must exclude several activities from aggregate output in order to remove potential sources of bias that are specific to the measurement of productivity. The real gross products of general government, of private households, and of non-profit institutions are estimated primarily from data on labor compensation. Trends in such output measures will, by definition, move with measures of input data and will tend to imply little or no labor productivity growth. Al-though these measures are the best available estimates of nonmarket components of GDP, including them in meas-ures of the aggregate productivity of the economy would bias labor productivity trends toward zero.
The BLS business sector also excludes the gross product of owner-occupied housing and the rental value of build-ings and equipment owned and used by nonprofit institu-tions serving individuals.5 These components are excluded because no adequate corresponding labor input measures have been developed. To measure multifactor productivity, the BLS must further restrict output to the U.S. private busi-ness sector, excluding the output of government enterprises. Appropriate weights for labor and capital in government enterprises are not estimated because subsidies account for a substantial portion of capital income; therefore, there is no adequate measure of government enterprise capital in-come in GDP. In 2006, the BLS measure of the U.S. private business sector output accounted for approximately 76 per-cent of the value of GDP.6
In the manufacturing sector, the BLS measures output for productivity statistics differently. Output in the manu-
facturing sector is defined as the deflated value of produc-tion shipped to purchasers outside of the sector, including shipments to final users and establishments elsewhere within the private business sector. This is a sectoral output concept: output is gross output, excluding intrasectoral transactions (sales or transfers between establishments within the sector); sectoral output represents sales to final demand plus intermediate goods sent to other industries. The manufacturing multifactor productivity indexes are based on sectoral output in an effort to avoid the problem of double-counting that occurs when one establishment provides materials used by other establishments in the same sector.
Labor input. Labor input for the U.S. private business sector is measured as total hours actually worked by all persons, multiplied by a labor composition index. The measure of hours actually worked is based on the sources and methods used to measure the quarterly labor produc-tivity of the business sector. The BLS labor composition index estimates the effects that shifts in age, education, and gender have on labor input growth and multifactor productivity growth.
Labor input is based on a jobs concept. The Current Employment Statistics (CES) survey is the primary source of data used to construct hours for the BLS productivity measures.7 Data from the CES survey on average weekly hours paid are adjusted to an hours-at-work concept with the use of a ratio of hours worked to hours paid.8 Current Population Survey (CPS) data on average weekly hours of nonproduction and supervisory workers are incorporated into the methodology to expand coverage to all employ-ees.9 To expand sectoral coverage, hours actually worked for employees of farms, proprietors, and unpaid family workers reported in the CPS are incorporated into the labor input measure; remaining data are obtained from various sources.10
Construction of the multifactor productivity labor com-position measure begins with estimates of the number of hours worked by each type of worker, based on CPS data. The BLS assembles data on workers’ hours, classified by their educational attainment, age, and gender, using actual wage averages for weights. The sum, over all groups, of the growth rates of hours, multiplied by the labor cost shares, gives the growth in adjusted labor input. Subtracting from this the growth in total (unweighted) hours yields the growth in labor composition.11
The same methods are used to construct the labor input measure for the U.S. manufacturing sector, except that no adjustment is made for labor composition (age, education,

Monthly Labor Review • June 2010 5
and gender of the workforce) because the CPS sample size is too small for that purpose.12
Capital inputs. Capital inputs for private business and manufacturing multifactor productivity measures are simi-lar. The BLS capital input measures include assets that are owned and operated by a business within the sector; rented capital services are included in intermediate inputs. Capital input measures the services derived from the stock of phys-ical assets and software. Among the capital input measures are fixed business equipment, structures, inventories, and land. Financial assets, owner-occupied residential struc-tures, and nonprofit capital are excluded from the capital input measures. The aggregate capital input measures are obtained by Tőrnqvist aggregation of the capital stocks for each type of asset within each of 60 NAICS industry groupings; estimated rental prices are used for each type of asset. Rental prices reflect the nominal rates of return and nominal rates of economic depreciation and revaluation for the specific types of assets. Rental prices are adjusted for the effects of taxes; rental prices of capital are computed for 18 three-digit NAICS industries within manufacturing. Data on investments in physical assets are obtained from the BEA.13
Energy, materials, and purchased business services. In the manufacturing sector, inputs include intermediate inputs, as well as capital and labor inputs. Data on intermediate inputs (energy, materials, and purchased business servic-es) are obtained from BEA's annual input-output tables. Tőrnqvist indexes of each of these three input classes are derived at the three-digit NAICS level and then aggre-gated to total manufacturing. For manufacturing, mate-rials inputs are adjusted to exclude transactions between manufacturing establishments, to maintain consistency with the sectoral output concept.14
Nominal values of materials, fuels, and electricity and nominal quantities of electricity consumed are obtained from economic censuses and annual surveys conducted by the U.S. Bureau of the Census. Purchased business services are estimated with the use of benchmark input-output tables and other annual industry data from BEA. Prices for many service inputs are based on the BLS price programs and ob-tained from the National Income and Product Accounts.
Imported intermediate inputs. The BEA produces import matrices as supplementary tables to the annual input-output accounts. For each commodity, the import-matrix table shows the value of imports of that commodity used by each industry. Because such information is not avail-
able from most businesses, the estimates must be imputed from data available in the annual input-output accounts. The imputed import values are based on the assumption that each industry uses imports of a commodity in the same proportion as the ratio of imports to domestic supply of the same commodity. (Domestic supply represents the total amount of a commodity available for consumption within the United States; it equals domestic output, plus imports, less exports.) Using this assumption to calculate the estimates implies that whatever variability of import usage there is across industries is not based on industry-specific information.15
The BEA provided the BLS with detailed statistics on imported intermediates for this article. These data are not included in BEA published tables because their quality is significantly lower than that of the higher level aggregates in which they are included. Compared with these aggre-gates, the detailed statistics are more likely to be based on judgmental trends, on trends in the higher level aggregate, or on less reliable source data.16
The BEA data reveal trends in the shares of imported intermediate inputs. For all private industries, the share of intermediate inputs that is accounted for by imports grew from 8 percent in 1998 to more than 10 percent in 2006. Chart 1 shows that there was a decline in the share of im-ports used by private industries around the 2001 recession; however, beginning in 2002, the share increased steadily. Purchased materials account for the majority of imported intermediates, and their share grew steadily, again with a slight dip around the 2001 recession. Imported material inputs, which accounted for 15 percent of total materials used by private industries in 1998, saw their share grow to 21 percent by 2006.17
Although it was once thought that services were not subject to offshoring, there is evidence that service inputs are now being imported. Imported service inputs ac-counted for 1.4 percent of total intermediates used by pri-vate industries in 1998 and 1.7 percent in 2006. However, imported service inputs accounted for roughly 3 percent of all service inputs used by private industries, a percent-age that stayed relatively steady from 1998 to 2006. In-terestingly, the share of energy inputs that are imported appears to be growing: three percent of all energy inputs used by private industries were imported in 1998, and 8 percent were imported by 2006.18 However, imported en-ergy inputs are less than 0.4 percent of total intermediates used by private industries.
Looking at the imported intermediate data by indus-try reveals that the manufacturing sector consumed more than 60 percent of all imported intermediates used by

Imported Inputs and Productivity
6 Monthly Labor Review • June 2010
private industries. For the manufacturing sector, the share of intermediate inputs that is accounted for by imports is significantly larger than it is for all private industries, and it grew at a faster rate. The BLS uses the term sectoral interme-diate inputs to denote total intermediates less domestically manufactured inputs. Chart 2 shows imported intermedi-ates’ share of sectoral intermediate inputs, as well as the import share of total intermediates. The sectoral intermedi-ate inputs for the BLS manufacturing sector are less than the total intermediates in the BEA annual input-output accounts because intermediates that are purchased from other firms within the U.S. manufacturing sector have been removed. Therefore, imports’ share of sectoral intermediates is greater than imports’ share of total intermediate inputs. The sectoral intermediate inputs for the manufacturing sec-tor are 55 percent of the BEA total intermediates.
The data show that 24 percent of sectoral intermediates in manufacturing were imported in 1998; the percentage grew to almost 34 percent in 2006. Notice in chart 2 that, beginning in 2002, there has been a steady increase in the share of imported intermediates used by U.S. manufactur-ing firms relative to sectoral and total intermediates.19 As observed for the private business sector, imported materi-als accounted for the majority of imported intermediate inputs. However, service inputs also were imported by the
manufacturing sector. Imported services’ share of sectoral intermediates in the manufacturing sector grew from 1.4 percent in 1998 to 2.1 percent in 2006, while imported en-ergy’s share grew slightly, from 0.1 percent to 0.3 percent, over the same period.
BLS multifactor productivity
Solow model of productivity. It is generally acknowledged that technical progress can best be captured with a total-factor productivity concept. The most common model of total-factor productivity is credited to Robert M. Solow. First proposed in 1957, the Solow residual model evalu-ates technical progress as the difference between the growth rate of output and the weighted aggregate of the growth rates of each factor of production. This measure of disembodied technological change evaluates the expan-sion of the production possibilities frontier without the addition of resources. Mathematically, given a production function , the growth rate of total-factor pro-ductivity A can be written as
(1)
where Δ represents a time derivative, Y denotes real aggre-
Chart 1. Imported intermediate inputs’ share of total intermediates, by type of input, private industries, 1998–2006
Percent12.0
11.0
10.0
9.0
8.0
7.0
6.0
5.0
4.0
3.0
2.0
1.0
0.0
Percent
1998 1999 2000 2001 2002 2003 2004 2005 2006
SOURCE: Bureau of Economic Analysis.
12.0
11.0
10.0
9.0
8.0
7.0
6.0
5.0
4.0
3.0
2.0
1.0
0.0
Imported materials Imported servicesImported energy
Y = f(X,t)
∑∆∆∆
−=
i i
ii
xx
YY
AA β ,

Monthly Labor Review • June 2010 7
as well as all imported intermediate inputs and other do-mestic intermediate inputs produced outside the sector. Consequently, BLS multifactor productivity, ABLS, contains only two factor inputs—labor (L) and capital services (K)—and can be written as (2)
or
(3)
where YBLS is BLS real private business sector output, dlnABLS denotes the difference in logarithms of ABLS for successive years (lnA(BLS,t) – lnA(BLS,t-1)), and the weights for labor and capital, wi, are the averages of each factor’s nominal cost Ci relative to nominal output YN
BLS in two successive years, so that
(4)
Because of this design, it is impossible to observe the im-pact of offshoring intermediate inputs on production. To incorporate intermediate inputs into the model, a sectoral
gate output, Xi denotes the ith factor of production, and βi
represents the corresponding elasticity of output. This productivity growth model requires well-defined concepts of output and inputs that correspond to a specified pro-duction process. To construct measures of productivity, a discrete approximation for the time derivatives20 must be made and cost-minimizing behavior is assumed in order to measure the i with cost shares.
BLS multifactor productivity for the private business sector. The BLS labor productivity measures for the private busi-ness sector compare output, measured as the real gross do-mestic product of all U.S. businesses, with hours worked by all U.S. workers who contribute to the production of that output. Real gross domestic product is measured by adding all exports and subtracting all imports from do-mestic final demand. Thus, imported intermediate inputs are excluded from the scope of the output measures, and as a result, the contribution of the labor hours worked overseas that produce the imported intermediate inputs also are absent from the analysis of U.S. productivity. The output measure used to construct the productivity meas-ure for the private business sector removes the output of intermediate inputs produced and used within a sector,
1998 1999 2000 2001 2002 2003 2004 2005 2006
Chart 2. Imports’ share of sectoral intermediate inputs and of total intermediates, by type of input, U.S. manufacturing, 1998–2006
55.0
50.0
45.0
40.0
35.0
30.0
25.0
20.0
15.0
10.0
5.0
0.01998 1999 2000 2001 2002 2003 2004 2005 2006
Percent Percent
SOURCE: Bureau of Labor Statistics, Bureau of Economic Analysis.
55.0
50.0
45.0
40.0
35.0
30.0
25.0
20.0
15.0
10.0
5.0
0.0
Imported energy Imported materials Imports’ share of total intermediates
Imported services
β,
BLS
BLS
BLS
BLS
KKw
LLw
YY
AA
KL∆∆∆∆
−−=
d lnABLS = d lnYBLS – wL d lnL – wK d lnK,
.
•
+=
−
−
= YC
YCw N
t,BLS
t,iN
t,BLS
t,iK,Li
1
121
,

Imported Inputs and Productivity
8 Monthly Labor Review • June 2010
+=
−
−= Y
CYCw N
t,S
t,jN
t,S
t,j)SIIM,IE,j(
1
1
21
output concept must be used.
Private business sector multifactor productivity adjusted to include imports. Sectoral output removes from the value of output only intermediate inputs that are produced else-where within the sector, to eliminate double counting. In-termediate inputs that are produced outside of the sector (that is, imported intermediates) remain in output.21 To bring imported intermediate inputs inside the major-sector model framework requires not excluding them as a com-ponent of output and including them as a factor input to production. With imported intermediate inputs denoted as II, the production function becomes YS = f(L, K, II, t) and multifactor productivity can be written as
(5)
where the factor weights for imported intermediate in-puts of energy (IE), materials (IM), and services (IS) are defined as
(6)
and an output adjustment ratio , used to correct the weights on labor and capital, is written as a two-period average:
(7)
Algebraically working through the model yields an ad-justed multifactor productivity measure that encompasses imported intermediate inputs in both the output and in-put indexes. Assuming that growth in sectoral output is a weighted average of growth in the BLS output measure and intermediate imports gives the multifactor productiv-ity growth rate as a scalar of the existing BLS multifactor productivity growth rate:
(8)
Table 1 presents growth rates for the components of the multifactor productivity model for the private busi-ness sector.22 Notice that imported intermediates grew faster than labor and capital in most years, except around the 2001 recession. The growth of imported intermedi-ate inputs has an impact on the growth of sectoral output trends as well. Sectoral output grew somewhat faster than the published value-added output measure for all years
except 2001 and 2002. The year-to-year growth rates of imported intermediates fluctuate quite a bit. Over the 1997–2006 period, energy and service imports grew faster than imported materials. However, because of the small share of all imports held by energy and service imports in comparison with imported materials, the growth in imported materials drove the growth in total imported intermediate inputs.
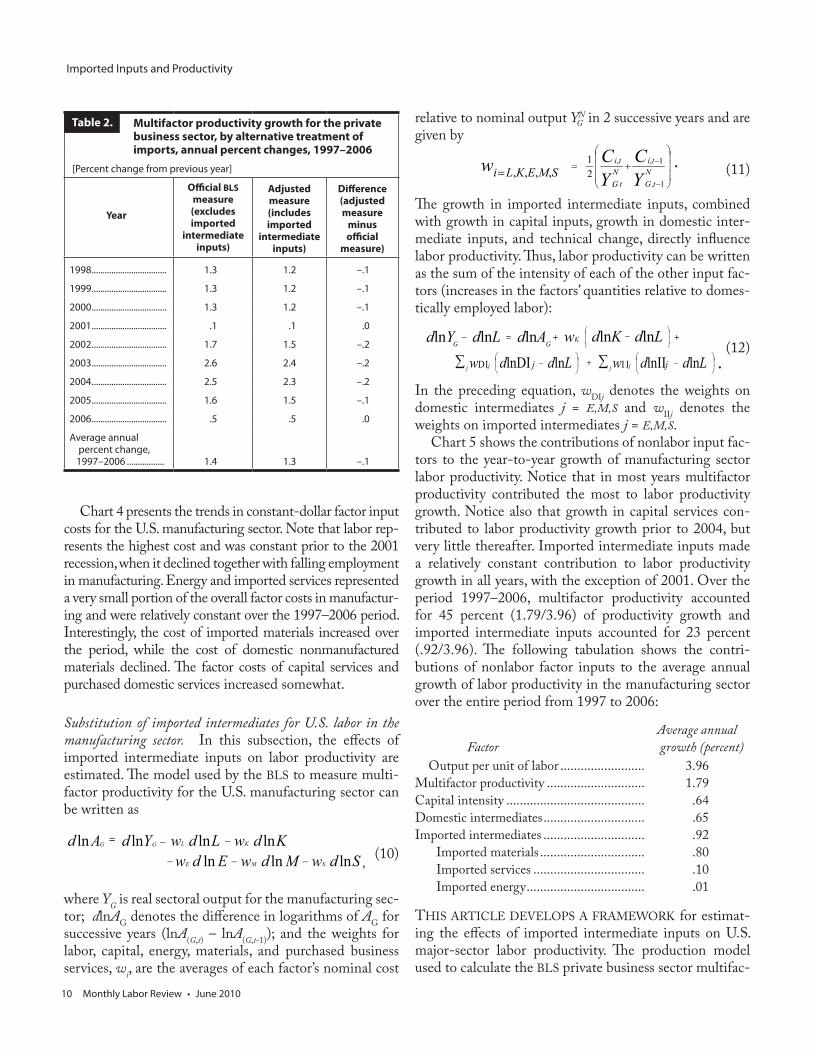
Using BEA estimates of imported intermediate inputs yields the adjustment scalar for the private business sec-tor multifactor productivity measures. Table 2 shows the results of adjusting the published BLS multifactor pro-ductivity data. Notice that, by incorporating the imported intermediate inputs into the multifactor productivity framework, the annual growth in private business sector multifactor productivity is reduced by 0.1 to 0.2 percent-age point in all but two of the years shown.
Substitution of imported intermediates for U.S. labor in the private business sector. The effects on labor productivity of substitution between imported intermediate inputs and U.S. hours worked are estimated with the Solow multi-factor productivity equation. The growth in imported intermediate inputs, combined with both growth in capi-tal inputs and technical change, directly influences labor productivity. Thus, labor productivity can be written as the sum of the intensity of each of the other input factors (increases in the factor’s quantities relative to domestically employed labor):
(9)
Chart 3 shows the contributions to private business sector labor productivity of the remaining nonlabor factor inputs. From 1998 through 2002, year-to-year growth in capital services accounted for the majority of labor productivity growth. Beginning in 2003, capital’s contribution to labor productivity declined and was outpaced by multifactor productivity growth. Also, beginning in 2004, imported intermediate inputs contributed more to labor productiv-ity growth than did capital growth. Again, the influence of imported material inputs dominated the contribution of all imported intermediate inputs.
The sectoral output approach reveals that, for the 1997–2006 period, approximately 14 percent (0.37/2.56) of labor productivity growth was attributable to growth in imported intermediate inputs, 11 percent (0.27/2.56) to materials, 3 percent (0.08/2.56) to services, and less than 0.5 percent (0.01/2.56) to energy. The following tabula-
∑
−−−=
jKLSS jj IIdwKdwLdwYdAd lnlnlnlnln θθ
θ
=− LdYd S lnln
−++ ∑
LdIIdwLdKdwAd jjjKS lnlnlnlnln −θ
dlnAs = θ dlnABLS •
,
+=
−
−
Y 1
1BLSBLS21
Nt,S
Nt,
Nt,S
Nt, Y
YYθ •
,
•

Monthly Labor Review • June 2010 9
tion shows the contribution (average annual growth rates) of nonlabor inputs and multifactor productivity to labor productivity growth in the private business sector over that period:23
Contribution to labor productivity Factor growth (percent) Output per unit of labor (including imports) ............................................... 2.56Multifactor productivity (including imports) ............................................... 1.31Capital intensity ...................................... .88 Imported intermediates ........................ .37 Imported materials ............................... .27 Imported services .................................. .08 Imported energy ................................... .01
BLS multifactor productivity for the U.S. manufacturing sec-tor. As mentioned earlier, BLS productivity measures for the manufacturing sector are constructed with the use of a sectoral output concept. Therefore, imported inter-mediates are within the productivity model framework. For the multifactor productivity measures, imported intermediate inputs are a component of measured out-put and intermediate inputs. To identify the impact of imported intermediates on manufacturing productivity, it is not necessary to adjust the measures to include im-ports; instead, the intermediates must be separated into
domestic and imported components. This demarcation is achieved by using the BEA estimates of imported inter-mediates, which were provided to the BLS at the industry level of detail.
Table 3 presents the year-to-year growth rates and the average annual growth for the components of the manufacturing multifactor productivity model over the 1997–2006 period. Notice that in most years labor inputs declined and imported intermediates grew faster than capital and domestic nonmanufactured intermediate in-puts. Prior to the 2001 recession, there was strong growth in capital services, imported intermediates, and domestic nonmanufactured intermediates. However, as the table shows, domestic nonmanufactured intermediates were affected by the recession sooner than imported interme-diates were. Also, imported intermediates were able to rebound after the recession, whereas domestic nonmanu-factured inputs shrank through 2004. Over the entire 1997–2006 period, labor and domestic nonmanufactured intermediates inputs declined, while capital services and imported intermediates grew.24
Table 4 compares the growth of domestic nonmanu-factured intermediate inputs and imported intermedi-ates by type of input. In general, imported intermediates showed stronger growth than domestic nonmanufactured inputs. It is interesting to note that domestic material in-puts (excluding materials purchased from other manufac-turing industries) declined in most years, while imported materials grew.
Growth of components of private business sector multifactor productivity, alternative output concepts, annual percent changes, 1997–2006
[Percent change from previous year]
Year Original output
Sectoral output
Labor Capital Imported intermediates
Imported energy
Imported materials
Imported services
1998 .......................... 4.9 5.3 2.3 6.3 10.7 3.8 10.9 10.3
1999 .......................... 5.2 5.4 2.7 6.5 8.5 9.2 8.3 9.3
2000 .......................... 3.9 4.4 1.0 6.3 9.6 11.2 9.5 9.7
2001 .......................... .5 .1 –1.4 4.6 –3.8 –1.9 –5.4 3.8
2002 .......................... 1.5 1.4 –1.4 2.9 –.1 –6.5 –1.3 5.5
2003 .......................... 3.1 3.1 –.3 2.3 3.1 3.4 4.4 –2.4
2004 .......................... 4.3 4.9 1.5 2.3 11.8 27.3 10.3 16.4
2005 .......................... 3.7 3.9 1.8 2.5 5.7 13.9 5.6 4.7
2006 .......................... 3.2 3.4 2.6 2.7 4.9 2.8 4.7 6.8
Average annual percent change, 1997–2006 ......... 3.4 3.5 1.0 4.0 5.5 6.6 5.1 7.0
Table 1.
Imported Inputs and Productivity
10 Monthly Labor Review • June 2010
relative to nominal output YN in 2 successive years and are given by
(11)
The growth in imported intermediate inputs, combined with growth in capital inputs, growth in domestic inter-mediate inputs, and technical change, directly influence labor productivity. Thus, labor productivity can be written as the sum of the intensity of each of the other input fac-tors (increases in the factors’ quantities relative to domes-tically employed labor):
(12)
In the preceding equation, wDIj denotes the weights on domestic intermediates j = E,M,S and wIIj denotes the weights on imported intermediates j = E,M,S.
Chart 5 shows the contributions of nonlabor input fac-tors to the year-to-year growth of manufacturing sector labor productivity. Notice that in most years multifactor productivity contributed the most to labor productivity growth. Notice also that growth in capital services con-tributed to labor productivity growth prior to 2004, but very little thereafter. Imported intermediate inputs made a relatively constant contribution to labor productivity growth in all years, with the exception of 2001. Over the period 1997–2006, multifactor productivity accounted for 45 percent (1.79/3.96) of productivity growth and imported intermediate inputs accounted for 23 percent (.92/3.96). The following tabulation shows the contri-butions of nonlabor factor inputs to the average annual growth of labor productivity in the manufacturing sector over the entire period from 1997 to 2006:
Average annual Factor growth (percent) Output per unit of labor ......................... 3.96Multifactor productivity ............................. 1.79Capital intensity ......................................... .64Domestic intermediates .............................. .65Imported intermediates .............................. .92 Imported materials ............................... .80 Imported services ................................. .10 Imported energy ................................... .01
THIS ARTICLE DEVELOPS A FRAMEWORK for estimat-ing the effects of imported intermediate inputs on U.S. major-sector labor productivity. The production model used to calculate the BLS private business sector multifac-
Chart 4 presents the trends in constant-dollar factor input costs for the U.S. manufacturing sector. Note that labor rep-resents the highest cost and was constant prior to the 2001 recession, when it declined together with falling employment in manufacturing. Energy and imported services represented a very small portion of the overall factor costs in manufactur-ing and were relatively constant over the 1997–2006 period. Interestingly, the cost of imported materials increased over the period, while the cost of domestic nonmanufactured materials declined. The factor costs of capital services and purchased domestic services increased somewhat.
Substitution of imported intermediates for U.S. labor in the manufacturing sector. In this subsection, the effects of imported intermediate inputs on labor productivity are estimated. The model used by the BLS to measure multi-factor productivity for the U.S. manufacturing sector can be written as
(10)
where YG is real sectoral output for the manufacturing sec-tor; dlnAG denotes the difference in logarithms of AG for successive years (lnA(G,t) – lnA(G,t-1)); and the weights for labor, capital, energy, materials, and purchased business services, wi, are the averages of each factor’s nominal cost
KdwLdwYdAd KLGG lnlnlnln −−=
SdwMdwEdw SME lnlnln −−−
Multifactor productivity growth for the private business sector, by alternative treatment of imports, annual percent changes, 1997–2006
[Percent change from previous year]
Year
Official BLSmeasure(excludes imported
intermediate inputs)
Adjustedmeasure(includes imported
intermediate inputs)
Difference (adjusted measure
minusofficial
measure)
1998 .................................. 1.3 1.2 –.1
1999 .................................. 1.3 1.2 –.1
2000 .................................. 1.3 1.2 –.1
2001 .................................. .1 .1 .0
2002 .................................. 1.7 1.5 –.2
2003 .................................. 2.6 2.4 –.2
2004 .................................. 2.5 2.3 –.2
2005 .................................. 1.6 1.5 –.1
2006 .................................. .5 .5 .0
Average annual percent change, 1997–2006 ................. 1.4 1.3 –.1
Table 2. G
+=
−
−
= YC
YCw N
t,G
tiN
tG,
tiSMEKLi
1
1,,
21
,,,, •
,
•∑∑
−+
− j jj j LddwLddw jIIjID nlnIIlnlnDIl
++=−
LdKdwAdLdYd KG
nlnlnlnlnl G−

Monthly Labor Review • June 2010 11
tor productivity measures is expanded to treat imported intermediate inputs as an input, rather than as a subtrac-tion from output. Once the imported intermediate inputs are placed inside the framework, the Solow multifactor productivity equation is used to estimate the effects on labor productivity of substitution between imported in-termediate inputs and U.S. hours worked. Separate effects are estimated for imported energy, materials, and services. The data show that imports increased as a share of total intermediates used by private industries, from 8 percent in 1998 to 10 percent in 2006. By including imported intermediates in the multifactor productivity model, the adjusted private business sector multifactor productivity is seen to have grown 0.1 percent to 0.2 percent per year more slowly than is indicated by the BLS published series. Also, the growth in imported intermediate inputs is esti-mated to have contributed 14 percent to the average an-nual growth of labor productivity for the private business sector from 1997 to 2006.
On the basis of the analysis presented here, it likely is not a good idea to alter the labor productivity model to in-corporate imported intermediates, because then the trend could be considered biased to the extent that output would reflect the growth in imported intermediates while labor
input would not include the corresponding hours worked overseas. However, as is attested to by the aforementioned 0.1-percent to 0.2-percent less growth than the BLS pub-lished series, the role of imported intermediates can be meaningfully assessed in the multifactor productivity model.
Because more than 60 percent of imported intermedi-ate inputs purchased by private industries are used by the manufacturing sector, the role of imported intermediates in the U.S. manufacturing sector is also evaluated. The BLS methods for constructing manufacturing multifactor pro-ductivity include intermediates in the model framework. Therefore, the imported components are isolated to assess their impact on labor productivity. The data reveal that, over the 1998–2006 period, imported intermediate inputs grew as a share of total intermediate inputs. In addition, labor inputs and domestic nonmanufactured inputs de-clined over the entire period while capital services and imported intermediates grew. Finally, the analysis shows that growth in imported intermediate inputs contributed 23 percent to the average annual growth in labor produc-tivity in the manufacturing sector.
Questions have been raised concerning whether the quantity of imported materials is measured accurately. The issue is that foreign imports may provide input of the
Chart 3. Labor productivity growth, by contributing input factors, private business sector, annual percent changes, 1997–2006
4.5
4.0
3.5
3.0
2.5
2.0
1.5
1.0
0.5
0.0
–0.51998 1999 2000 2001 2002 2003 2004 2005 2006
Percent changefrom previous year
Percent changefrom previous year
SOURCE: Bureau of Labor Statistics, Bureau of Economic Analysis (unpublished import data).
Imported services Imported materialsAdjusted multifactor productivity
Imported energyCapital
4.5
4.0
3.5
3.0
2.5
2.0
1.5
1.0
0.5
0.0
–0.5

Imported Inputs and Productivity
12 Monthly Labor Review • June 2010
same quality at a lower price than domestic products and the advantage of substituting foreign for domestic inputs may not be reflected in the productivity statistics. Prices of imports enter the BLS business sector productivity meas-ures when they are removed from real GDP by the BEA. Therefore, the impact of any possible inaccuracy in the measurement of import prices on the BLS business sector productivity measures would be weighted by the relative importance of imported intermediate inputs in measured business sector output, which has grown from 8 percent in 1998 to almost 11 percent in 2006. Prices of imports en-
ter the BLS manufacturing sector multifactor productivity model when imports are included in the construction of purchased intermediate inputs. Thus, in the manufactur-ing sector, the impact of any possible inaccuracy in the measurement of import prices on the BLS multifactor productivity measures would be weighted by the relative importance of imports in measured intermediate inputs in that sector: 12 percent to 18 percent. Research is being carried out on this topic25 both within and outside the statistical agencies, but economic analysis has not reached a definitive conclusion concerning its importance.
Multifactor productivity and components in the U.S. manufacturing sector, annual percent changes, 1997–2006
[Percent change from previous year]
YearSectoral output Labor Capital
Domestic intermediates
Imported intermediates
Multifactor productivity
1998 ..................................... 5.2 –0.2 5.0 2.3 9.6 2.3
1999 ..................................... 3.8 –.7 4.1 4.2 7.1 .8
2000 ..................................... 2.7 –1.3 3.1 –4.1 5.5 3.5
2001 ..................................... –5.1 –6.5 1.5 –3.0 –4.9 –1.3
2002 ..................................... –.7 –7.1 .6 –4.4 –2.1 3.7
2003 ..................................... 1.0 –4.9 .0 –1.3 2.6 2.8
2004 ..................................... 1.7 –.5 –.6 –5.2 8.7 2.6
2005 ..................................... 3.7 –1.1 .0 7.7 4.9 .4
2006 ..................................... 1.8 .6 .5 –2.0 4.3 1.6
Average annual percent change, 1997–2006 ...... 1.5 –2.4 1.6 –.7 3.9 1.8
NOTE: Combined intermediates are constructed as a weighted aggregate of energy, materials, and purchased services.
Table 3.
Comparison of imported and domestic intermediate inputs, by type of input, U.S. manufacturing sector, annual percent changes, 1997–2006
[Percent change from previous year]
YearTotal
intermediatesEnergy Materials Services
Domestic Imported Domestic Imported Domestic Imported Domestic Imported
1998 .................................... 2.3 9.6 –2.5 –7.8 1.9 9.7 3.0 8.5
1999 .................................... 4.2 7.1 .1 .4 3.8 6.6 4.9 15.8
2000 .................................... –4.1 5.5 –5.0 –11.1 –10.1 5.9 –.1 1.5
2001 .................................... –3.0 –4.9 –9.5 –7.0 –6.1 –7.3 –.5 28.5
2002 .................................... –4.4 –2.1 –1.5 –1.2 –8.4 –2.1 –2.5 –1.8
2003 .................................... –1.3 2.6 –6.1 13.0 –4.9 3.2 1.1 –4.2
2004 .................................... –5.2 8.7 –2.2 35.1 –10.0 8.1 –2.9 13.9
2005 .................................... 7.7 4.9 8.1 25.1 7.4 4.6 7.9 6.4
2006 .................................... –2.0 4.3 –6.8 10.7 –7.4 3.9 1.7 8.2
Average annual percent change,
1997–2006 ..................... –.7 3.9 –2.9 5.3 –3.9 3.5 1.4 8.1
NOTE: Combined intermediates are constructed as a weighted aggregate of energy, materials, and purchased services.
Table 4.

Monthly Labor Review • June 2010 13
Chart 4. Input costs for the manufacturing sector, by type, 1998–2006
Billions of constant
2000 dollars1,200
1,000
800
600
400
200
0 1998 1999 2000 2001 2002 2003 2004 2005 2006
Billionsof constant2000 dollars
SOURCE: Bureau of Labor Statistics, Bureau of Economic Analysis (unpublished import data).
Chart 5. Labor productivity growth, by contributing nonlabor input factors, manufacturing sector, annual percent changes, 1997–2006
Percent changefrom previous year
9.0
8.0
7.0
6.0
5.0
4.0
3.0
2.0
1.0
0.0
–1.0
–2.0
Percent changefrom previous year
1998 1999 2000 2001 2002 2003 2004 2005 2006
SOURCE: Bureau of Labor Statistics, Bureau of Economic Analysis (unpublished import data).
Multifactorproductivity
Domestic intermediate intensity
Imported intermediate intensity
Capital intensity
9.0
8.0
7.0
6.0
5.0
4.0
3.0
2.0
1.0
0.0
–1.0
–2.0
1,200
1,000
800
600
400
200
0
Imported energyLabor
Domestic energyImported materialsCapital services
Domestic materialsImported servicesDomestic services

Imported Inputs and Productivity
14 Monthly Labor Review • June 2010
Notes
ACKNOWLEDGMENT: The authors thank Erich Strassner and Rob-ert Yuskavage of the Bureau of Economic Analysis for providing the import data necessary for this study. We also thank Steve Rosenthal and Randy Kinoshita for helpful comments and assistance. All views expressed in this article are those of the authors and do not necessarily reflect the views or policies of the Bureau of Labor Statistics.
1 Robert M. Solow, “Technical Change and the Aggregate Produc-tion Function,” Review of Economics and Statistics, August 1957, pp. 312–20.
2 Annual input-output tables, as well as data on imported interme-diate inputs, from the Bureau of Economic Analysis (BEA) are used in the analysis presented. (See Robert E. Yuskavage, Erich Strassner, and Gabriel W. Medeiros, “Domestic Outsourcing and Imported Inputs in the U.S. Economy: Insights from Integrated Economic Accounts,” paper prepared for the World Congress on National Accounts and Economic Performance (Arlington, VA, Bureau of Economic Analysis, May 15, 2008).
3 Allan H. Young and Helen Stone Tice, “An Introduction to Na-tional Economic Accounting,” Survey of Current Business, March 1985, pp. 59–76.
4 The gross product of general government is the sum of govern-ment expenditures on compensation of general government employ-ees and the general government consumption of fixed capital, which measures the services of general government fixed assets. Government expenditures on goods and services purchased from the private sector are not excluded from private business sector output. The gross prod-uct of private households is the compensation of paid employees of private households; the gross product of nonprofit institutions serving individuals is the compensation paid to employees of those institutions.
5 This value is measured as the sum of the consumption of fixed capital, indirect business taxes, and interest paid.
6 BLS data in this article originate in the multifactor productivity program and cover the private business sector, which differs from the business sector covered by the BLS quarterly labor productivity pro-gram in that the former excludes government enterprises. In addition, the multifactor productivity measures are available only on an annual basis.
7 The Current Employment Statistics (CES) survey is an establish-ment survey whose sample is benchmarked annually to levels based on administrative records of employees covered by State unemployment insurance tax records. Data on employee hours from establishments provide consistency with output data from industries and thus are well suited to producing industry-level measures. CES data on employment and average weekly hours paid for production workers in goods-pro-ducing industries and for nonsupervisory workers in service-providing industries are the building blocks of labor input.
8 Information from the BLS National Compensation Survey pro-gram is used to construct the ratio of hours worked to hours paid. Prior to 2000, the annual Hours at Work Survey was used.
9 In August 2004, the BLS introduced this new method of con-structing estimates of hours for nonproduction and supervisory work-ers; see Lucy P. Eldridge, Marilyn E. Manser, and Phyllis F. Otto, “Alternative measures of supervisory employee hours and productivity growth,” Monthly Labor Review, April 2004, pp. 9–28.
10 Employment counts for employees in agricultural services, for-estry, and fishing are reported from the BLS QCEW program and are
based on administrative records from the unemployment insurance system.
11 Additional information concerning data sources and methods of measuring labor composition can be found at www.bls.gov/mfp/mprlabor.pdf and in Labor Composition and U.S. Productivity Growth, 1948–90, Bulletin 2426 (Bureau of Labor Statistics, December 1993).
12 The BLS is investigating the possibility of constructing labor composition estimates for the manufacturing sector productivity measures.
13 See “Multifactor Productivity Trends, 2007,” news release 09–0302 (Bureau of Labor Statistics, March 25, 2009).
14 A nonprofit adjustment is made to intermediate inputs, but not to imported intermediates, because it is doubtful that nonprofits use a significant amount of imported intermediates. Note, however, that, ab-sent a nonprofit adjustment to imported intermediates, the importance of imports may be slightly overstated.
15 Erich H. Strassner, Robert E. Yuskavage, and Jennifer Lee, “Imported Inputs and Industry Contributions to Economic Growth: An Assessment of Alternative Approaches,” paper presented at the Conference on Measurement Issues Arising from the Growth of Globalization, Washington, DC, Nov. 6–7, 2009. This study uses In-ternational Transaction Account data from the BEA to assess the im-port comparability assumption. The authors find that real imported materials may be understated in the annual input-output accounts. However, they indicate that the assumption provides reasonable re-sults at the aggregate level. In another paper presented at the same conference (“Evaluating Estimates of Materials Offshoring from U.S. Manufacturing”), Robert C. Feenstra and J. Bradford Jensen use an alternative method for allocating imported input across industries to derive imported intermediates. Comparing the results with the BEA import matrix that uses the comparability assumption, Feenstra and Jensen find differences between the two approaches and identify cells in the input-output table in which the differences are greatest. Unfortunately, data limitations prevent them from resolving those differences.
16 Notes about the imported intermediate input data are from BEA documentation that accompanied the data.
17 Imported materials inputs include crude petroleum as a raw ma-terial for the refining and coal products industry. The increase in crude petroleum prices over the 1998–2006 period could be responsible for the increase in imported materials’ share of intermediate inputs used by private industries and for the increase in imported materials’ share of intermediate inputs in the manufacturing sector.
18 Crude oil is classified as a nonenergy material input to U.S. refin-eries, rather than an energy input.
19 In 2006, total materials imported by the petroleum industry ac-counted for 34 percent of material imports by the manufacturing sec-tor. Over the 1997–2006 period, the price of imported intermediates for the petroleum industry grew 14 percent, compared with the 4-per-cent average growth of prices in the manufacturing sector as a whole.
20 W. Erwin Diewert, “Exact and Superlative Index Numbers,” Journal of Econometrics, vol. 4, 1976, pp. 15–145.
21 Evsey Domar, “On the Measurement of Technological Change,” Economic Journal, vol. 71, 1961, pp. 709–29.
22 The time series does not cover the business cycles sufficiently to divide the data into subperiods that would allow a meaningful analy-

Monthly Labor Review • June 2010 15
sis. A categorization of the data into subperiods of 1997–2000 and 2001–2006, as well as 1997–2002 and 2003–2006, and a comparison of results revealed a high sensitivity to the years into which the data were divided. Accordingly, no subperiod analysis is presented in this article.
23 Note that because output has been expanded to include imports, labor productivity growth is 2.6 percent per year, rather than 2.4 per-cent per year.
24 Christopher Kurz and Paul Lengermann, “Outsourcing and U.S.
Economic Growth: The Role of Imported Intermediates,” paper pre-sented at the 2008 World Congress on National Accounts, May 12–17, 2008, Washington, DC, construct a gross output productivity measure in order to keep U.S. manufactured intermediates in the model. The Kurz-Lengermann model allows an analysis of the shift from domestic to imported intermediate inputs.
25 See, for example, papers presented at the Conference on Meas-urement Issues Arising from the Growth of Globalization, sponsored by the Upjohn Institute, Washington, DC, November 6–7, 2009.