EFFECT OF FISCAL POLICY ON ECONOMIC GROWTH IN UGANDA …
64
i EFFECT OF FISCAL POLICY ON ECONOMIC GROWTH IN UGANDA (1985-2016) MOHAMED AHMED ELMI MEP/54401/151/DF A THESES REPORT SUBMITTED TO THE COLLEGE OF ECONOMICS AND MANAGEMENT AS A PARTIAL FULLFILMENT OF THEREQUIREMENTS FOR AWARD OF MASTER’S IN ECONOMIC PLANNING AND POLICY OF KAMPALAINTERNATIONAL UNIVERSITY AUGUST, 2018
Transcript of EFFECT OF FISCAL POLICY ON ECONOMIC GROWTH IN UGANDA …
i
EFFECT OF FISCAL POLICY ON ECONOMIC GROWTH IN UGANDA (1985-2016)
MOHAMED AHMED ELMI
MEP/54401/151/DF
A THESES REPORT SUBMITTED TO THE COLLEGE OF ECONOMICS AND
MANAGEMENT AS A PARTIAL FULLFILMENT OF THEREQUIREMENTS
FOR AWARD OF MASTER’S IN ECONOMIC PLANNING
AND POLICY OF KAMPALAINTERNATIONAL
UNIVERSITY
AUGUST, 2018
i
DECLARATION
"This thesis report is my original work and has not been presented for a degree or any other
academic award in any university or institution of learning".
................................................. …………………………………….
Date Signature

ii
APPROVAL
"I confirm that the work in this thesis is carried out by the candidate under our supervision
Name and Signature of Supervisor
Date

iii
DEDICATION
I do dedicate this report work to my mother and father who have stood with me in everything I
have gone through during my academic pursuits may God, bless you abundantly
iv
ACKNOWLEGMENT
I wish to acknowledge the valuable contribution of all those persons who assisted me in the
completion of this research.
First I would like to thank the almighty God for having given me the grace to go through the ups
and downs in order to come to the end of the course.
This list is too long to be individually appreciated for the support each one accorded me.
However, I cannot totally refrain from mentioning a few individuals without whose support and
input, this research would never have been accomplished.
My special thanks go to my loving mother who has contributed tirelessly in sponsoring my
education, and very constructive pieces of advice that have paved way for me to develop my
career.
A special note of thanks goes to my sisters and brother plus cousins that your contribution in
terms of encouragement real is a cornerstone in my success.
I would like to send my gratitude to my supervisor Dr. Eminike O Kalu for his parental
guidelines in this research and academically transforming me
Further gratitude is accorded to my friends with whom a shared academically, physically and
spiritually, may the almighty God bless you.
v
LIST OF ACRONYMS
ADB African Development Bank
ADF Augmented Dickey-Fuller
ANOVA Analysis of Variance
BOP Balance of Payment
BOU Bank of Uganda
EAC East African Community
FDI Foreign Direct Investment
FY Financial Year
GDP Gross Domestic Product
GNP Gross National Product
IFS International Finance Statistics
IMF International Monetary Fund
LCU Local Currency Unit
MS Micro soft
MW Mega watts
OECD Organization for economic cooperation and Development
PPT Philips Perron test
SPSS Statistical Package for Scientists
SSA Sub Saharan Africa
TFP Total Factor Productivity
UBOS Uganda Bureau of Statistics
URA Uganda Revenue Authority
USD United States Dollars
VAT Value Added Tax
WEO World Economic Outlook
vi
TABLE OF CONTENTS
DECLARATION................................................................................................................................ i
APPROVAL ..................................................................................................................................... ii
DEDICATION ................................................................................................................................. iii
ACKNOWLEGMENT.......................................................................................................................iv
LIST OF ACRONYMS.......................................................................................................................v
ABSTRACT .....................................................................................................................................ix
CHAPTER ONE ................................................................................................................................1
INTRODUCTION ..............................................................................................................................1
1.1 Background to the study ........................................................................................................... 1
1.1.1 Historical Perspective ............................................................................................................ 1
1.1.2 Theoretical Perspective .......................................................................................................... 2
1.1.3 Conceptual Perspective .......................................................................................................... 4
1.1.4 Contextual Perspective........................................................................................................... 6
1.2 Problem Statement .................................................................................................................... 7
1.3 Purpose of the study .................................................................................................................. 8
1.4 Objectives of the study.............................................................................................................. 8
1.5 Hypotheses ........................................................................................................................... 8
1.6 Scope of the study ..................................................................................................................... 8
1.6.1 Content Scope ........................................................................................................................ 8
1.6.2 Geographical scope ................................................................................................................ 8
1.6.3 Time Scope ............................................................................................................................ 9
1.7.4 Theoretical Scope................................................................................................................... 9
1.7 Significance of the study........................................................................................................... 9
1.8 Operational definitions............................................................................................................ 10
CHAPTERTWO............................................................................................................................... 11
LITREATURE REVIEW .................................................................................................................. 11
2.0 Introduction ............................................................................................................................. 11
2.1.1 Theoretical Review .............................................................................................................. 11
2.2 Conceptual Review ................................................................................................................. 14
2.2.1 Fiscal policy ......................................................................................................................... 14
vii
2.2.2 Economic growth ................................................................................................................. 15
2.3 Empirical Review.................................................................................................................... 18
2.3.1Effect of Public expenditure and economic growth.............................................................. 18
2.3.2 Effect of government tax revenue earnings on economic growth ....................................... 21
2.3.3 Effect of non tax government revenue on economic growth ............................................... 26
2.4Effect of fiscal policy on economic growth ............................................................................. 30
2.5 Gap Identification ................................................................................................................... 34
CHAPTER THREE .......................................................................................................................... 34
METHODOLGY.............................................................................................................................. 34
3.0 Introduction ............................................................................................................................. 34
3.1 Research Design...................................................................................................................... 35
3.2 The Model Specification ......................................................................................................... 35
3.3 Variable definition and Measurements ................................................................................... 36
3.4 Nature and Sources of data ..................................................................................................... 36
3.5 Data Analysis .......................................................................................................................... 36
3.5.1 Descriptive Analysis ............................................................................................................ 36
3.5.2Trend Analysis ...................................................................................................................... 36
3.6 Time series property of data.................................................................................................... 37
3.6.1 Unit Root Tests .................................................................................................................... 37
3.6.2 Co-integration Analysis ....................................................................................................... 37
3.7 Regression Analysis ................................................................................................................ 38
3.8 Diagnostic Tests ...................................................................................................................... 38
3.8.1 Serial Correlation Test ......................................................................................................... 38
3.8.2 Normality Test ..................................................................................................................... 38
3.8.3 Heteroscedasticity Test ........................................................................................................ 38
CHAPTER FOUR ............................................................................................................................ 39
PRESENTATION, INTERPRETATION AND ANALYSIS OF THE DATA...................................... 39
4.0 Introduction ............................................................................................................................. 39
4.1 Descriptive Statistics............................................................................................................... 40
4.2 Trend Analysis ........................................................................................................................ 41
4.3 Time Series Property of Data.................................................................................................. 42
viii
4.3.1 Test for structural breaks...................................................................................................... 42
4.3.1 Co-integration Analysis. ...................................................................................................... 42
4.4 Regression Analysis of the variables under study .................................................................. 42
CHAPTER FIVE .............................................................................................................................. 43
DISCUSSION OF FINDINGS, CONCLUSIONS AND RECOMMENDATIONS ................................ 43
5.0 Introduction ................................................................................................................................ 43
5.1 Discussion of Findings ................................................................................................................ 44
5.4 Areas of further research......................................................................................................... 47
5.5 Contribution to Knowledge..................................................................................................... 48
REFERENCES................................................................................................................................. 48
Appendix i: Data for Analysis ........................................................................................................... 54
World bank, World Economic Indicators, OECD Statistics, 2016. ....................................... 54
ix
ABSTRACT
The purpose of the study was to investigate the effect of fiscal policy on economic growth in
Uganda (1985-2016). The study objectives were (i) To determine the effect of government
expenditure on economic growth of Uganda (ii) To examine the effect of government tax
revenue on the economic growth of Uganda and (iii) To assess the effect of government non tax
earning on the economic growth of Uganda. The study was entirely secondary data which was
collected from World Bank and OECD and world economic indicators on government
expenditure, tax revenue, nontax revenue and economic growth in Uganda shillings (LCU)
period of 32 years. The study used time series analysis Ex-post facto design based on
quantitative techniques to analyze secondary data scientifically to critically conclude the research
objectives. The study conducted a series of tests ranging from unit root test, normality tests,
regression analysis and serial tests to establish the status of the variables and also establish the
effect of the variables using regression. The study findings indicate that all the coefficient of the
Tax revenue significantly correlated to economic growth at 0.001 while public expenditure and
non tax revenue was statistically not significant at 5% level of significance in explaining
variations in economic growth in Uganda because their p-values 8.17 for public expenditure
0.001 for Tax revenue and 0.802 for Non tax revenue are all less than 0.05. The study concludes
that public expenditure was increasing over the period of the study; the results reveal that the
public expenditure had a significant effect on economic growth in Uganda. The study concludes
that public expenditure needs to be improved for attaining economic growth of Uganda. The
study findings on the second objective conclude that tax revenue was increasing over the time
and the effect was significant, the study concludes that the tax revue increase lead to generation
of values for the economy and need more comprehension for attaining economic growth of
Uganda. The study finally established that the non tax revenue earnings had a low effect on the
growth in Uganda. The study on overall concludes that fiscal policy had high effect on economic
growth Uganda’s economic growth for Uganda from 1985 to 2016. The studies recommend that
there is need for government increase in expenditure on social services and rejuvenation of
infrastructure. There is need for government policy ensuring quality and sustained growth that
can potentially improve the pace of Uganda’s economic advancement. On the second objective
tax revenue contributes to improved economic growth. There is need for increasing revenue
generation preferably through encouraging investments and supporting the creation of small
business that can yield capital in order to generate more tax revenue for economic growth. The
third objective recommends that there is need for generation of non tax revenue through
improving accessibility to the tourism sector and growth of the tourism sector including gazeting
the economic activity that generate the tax. The study contribute to prominent findings from this
study is the fact that it has provided evidence to support the Keynesian theory. Indeed, economic
growth or GDP can significantly be increased with public expenditure increase and tax revenue.
It is now clear that an effective tax regime generates economic growth of a country. This is
contrary to common belief that taxes alone cannot generate growth.
1
CHAPTER ONE
INTRODUCTION
1.1 Background to the study
This section is concerned with background to the study, statement of the problem, purpose of the
study, objectives of the study, hypotheses, and scope of the study, significance of the study and
operational definitions of key terms.
1.1.1 Historical Perspective
Before the great depression, which lasted from Sept. 4, 1929, to the late 1930s or early 1940s, the
government's approach to the economy was laissez-faire. Following World War II, it was
determined that the government had to take a proactive role in the economy to regulate
unemployment, business cycles, inflation and the cost of money (Sakar, 2007). By using a mix of
monetary and fiscal policies (depending on the political orientations and the philosophies of
those in power at a particular time, one policy may dominate over another), governments can
control economic phenomena.
On the global scale in the latest IMF World Economic Outlook 2010 (WEO), growth projections
for the world economies in 2009 were revised down to 1½ percent. This projection is almost 5
percentage points lower than both the forecast a year ago and trend growth in 2004-08. Although
declining fuel and food prices have eased inflationary pressures in many countries, the global
external current account deficit excluding grants is projected to widen to 8½ percent of GDP in
2009, significantly higher than the forecast a year ago. The macroeconomic fiscal policies
according to IMF in the world economies need to be revised to ensure a steady macro-economic
stability necessary for growth (Galor, 2005).
Bidani and Ravallion (1997) contend that during 2004–08, Sub Saharan African countries
enjoyed high growth rates (averaging about 6½ percent), and a number of these countries
achieved macroeconomic stability, as reflected in low inflation and sustainable debt. Improved
2
economic policies, market-oriented reforms, and the reduction in the number of armed conflicts
have contributed to strong performance.
Rapid growth has been facilitated by improvements in terms of trade, growth of exports, debt
relief under different initiatives, and increasing aid flows and private inflows. Macroeconomic
conditions in Sub Saharan African countries are now being adversely affected by the global
financial crisis. The negative effects in Africa were felt first in emerging and frontier markets,
where financial sector linkages are better established, but have now reached most countries in
Africa.
The Ugandan Economy despite establishing successful implementation of sound economic
policies. The success is never strong due to inflation, reducing increasing per capita incomes, and
marked decline in the incidence of poverty. Real GDP growth remained is low 2001/02 at 5.6 per
cent that reduced from the annual average rate of 6 per cent achieved since 1994/95. The outlook
on growth is stabilization in 2002/03 with real GDP growth estimated at 5.7 per cent. Prudent
fiscal management enables a country to maintain an increased expenditure program for poverty
alleviation, which is beginning to make a positive impression on the poverty situation of the
country. However, the recent budget outcome has been characterized by a widening deficit
financed by large inflows of external budgetary support that has increased the dependence of the
economy on foreign donors. The deficit widened in 2001/02 though the outlook on the public
finances is a gradual contraction in the budget deficit in 2002/03. Though Sound monetary
management result in a slowdown in monetary expansion, the status of the fiscal policy does not
provide a contributing situation to inflationary pressures, declining interest rates, and relative
stability in the exchange rate of the shilling (IMF, 2010).
1.1.2 Theoretical Perspective
The study is premised on Keynesian theory (1936) the Keynesian model indicates that during the
economic decline a policy of budgetary extensive should be undertaken to increase the aggregate
demand in the economy thus boosting the Gross Domestic Product (GDP). Keynes regards
public expenditures as an exogenous factor which can be utilized as a policy instruments to
promote economic growth. From the Keynesian thought, public expenditure can contribute
positively to economic growth. Hence, an increase in the government consumption is likely to
lead to an increase in employment, profitability and investment through multiplier effects on
3
aggregate demand. As a result, government expenditure augments the aggregate demand, which
provokes an increased output depending on expenditure multipliers. In economic theory, it
appears as HarrodDomarkeynesian theory of growth or simply, Harrod Domar growth model.
A mathematical equation of this model: y = f(k,s) shows the existence of a direct relationship
between savings and the rate of economic growth.
Institutional Fitness theory
Developed by Wilhems and Witter (1998), the term FDI fitness focuses on a country’s ability to
attract, absorb and retain FDI. It is this country ability to adapt, or to fit to the internal and
external expectations of its investors, which gives countries the upper-hand in harnessing FDI
inflows. The theory itself attempts to explain the uneven distribution of FDI flows between
countries. Wilhem’s institutional FDI fitness theory rests on four fundamental pillars-
Government, market, educational and socio-cultural fitness. At the base of the pyramid are socio-
culturalfactors which according to Wilhelms and Witter (1998) are the oldest and most complex
of all institutions. The theory also account that that of markets, accounts for theeconomic and
financial aspects of institutional FDIfitness, in the form of machinery (physical capital)and credit
(financial capital). Developed and wellfunctioningfinancial markets are hence a prominentfeature
in the MNC’s investment decision-makingprocess. The fourth and final pillar as put forth
byWilhelms is the Government. The role of a country’spolitical strength plays the biggest role in
the FDIgame. Government fitness requires the adoption ofprotective regulation to manage
market fitness.
Endogenous growth theory
The study was premised on the endogenous growth theory by Romer (1994). Endogenous growth
theory holds that investment in human capital, innovation, and knowledge are significant
contributors to economic growth. The theory also focuses on positive externalities and spillover
effects of a knowledge-based economy which will lead to economic development.
Endogenous growth theory tries to overcome this shortcoming by building macroeconomic
models out of microeconomic foundations. Crucial importance is usually given to the production
of new technologies and human capital. The engine for growth can be as simple as a constant
return to scale production function (the AK model) or more complicated set ups with spillover
4
effects (spillovers are positive externalities, benefits that are attributed to costs from other firms),
increasing numbers of goods, increasing qualities, etc.
Endogenous growth models have found in Total Factor Productivity (TFP) and the accumulation
of knowledge channels to relate trade (in the form of openness) and growth. Basically,
participation in world markets and importation of technology can lead to faster growth in the
long run. Grossman and Helpman (1990, 1991), on the one hand, highlight that in a theoretical
framework the relationship between opening up to trade and long run growth is in fact
ambiguous. Therefore, for them, trade does not necessarily lead to faster growing.
1.1.3 Conceptual Perspective
Betcherman and Carmen (2007) assert that fiscal policy refers to the means by which a
government adjusts its spending levels and tax rates to monitor and influence a nation's
economy. It is the sister strategy to monetary policy through which a central bank influences a
nation's money supply. These two policies are used in various combinations to direct a country's
economic goals. Here we look at how fiscal policy in this study is conceptualized under
government expenditure, government tax revenue and government non tax revenue.
According to Keynes (1936) are government expenditure and government revenue through taxes
and government revenue through non tax sources.
Components of Fiscal Policy
According to (Akrani, 2012)Public expenditure is spending made by the government of a country
on collective needs and wants such as pension, provision, infrastructure, etc. Until the 19th
century, public expenditure was limited as laissez faire philosophies believed that money left in
private hands could bring better returns. Government expenditures in this study will be based on
establishing and evaluating the data on government expenditures in general over the period of 31
years under the study. The expenditure will be general expenditures by the government
expressed per year in percentages.
Yang (2011) contends that taxable revenue included the data on the sources of revenue that are
form taxes. The description includes both direct and indirect sources of revenue that are available
to the people in the country by the different parties or people of a country.
5
Economic growth is an increase in the capacity of an economy to produce goods and services,
compared from one period of time to another. Economic growth can be measured in nominal
terms, which include inflation, or in real terms, which are adjusted for inflation (Galor,
2005).According to Bergsten (1997) Gross domestic product (GDP) is defined as the monetary
value of all the finished goods and services produced within the country borders in a specific
time period. This includes value of production of monetary and non-monetary goods and services
within a country (UBOS, 2006).
Components of Economic Growth
Over decades and generations, seemingly small differences of a few percentage points in the
annual rate of economic growth make an enormous difference in GDP per capita. This therefore
discusses some of the components of economic growth, including physical capital, human
capital, and technology.
The category of physical capital includes the plant and equipment used by firms and also things
like roads (also called infrastructure). Again, greater physical capital implies more output.
Physical capital can affect productivity in two ways: (1) an increase in the quantity of physical
capital (for example, more computers of the same quality); and (2) an increase in the quality of
physical capital (same number of computers but the computers are faster, and so on). Human
capital and physical capital accumulation are similar: In both cases, investment now pays off in
longer-term productivity in the future (Sakar, 2007).
To obtain a per capita production function, divide each input in by the population. This creates a
second aggregate production function where the output is GDP per capita (that is, GDP divided
by population). The inputs are the average level of human capital per person, the average level of
physical capital per person, and the level of technology per person. The result of having
population in the denominator is mathematically appealing. Increases in population lower per
capita income. However, increasing population is important for the average person only if the
rate of income growth exceeds population growth. A more important reason for constructing a
per capita production function is to understand the contribution of human and physical capital
(Sakar, 2007).
6
1.1.4 Contextual Perspective
Mugambe (2004) stressed that historically, twenty years ago Uganda faced daunting economic
challenges. The country had only just started to recover from a long period of civil strife and
economic mismanagement which had caused rampant inflation, the contraction of the productive
base of the economy and of tax revenue and brought large parts of the public administration to
the verge of collapse. In the first half of the 1990s Uganda implemented bold economic reforms
to tackle these problems; reforms which restored macroeconomic stability, laid the foundation
for a recovery of exports and tax revenues and led to 20 years of sustained growth, averaging
around 7 percent per annum.
Mukwaya (2004) argued that the focus of fiscal policy of the Ugandan government in 2001/02
was on three key objectives: stimulating the economy; strengthening tax administration; and
raising tax revenues. This policy stance was aimed at adjusting the underlying feature of a
widening fiscal deficit in relation to GDP, financed by large foreign inflows of budget support.
The ever-widening fiscal deficit is seen as the major challenge to Uganda’s fiscal performance as
it exposes the government’s budget position to policy changes with respect to foreign aid and
foreign policy. It also strains private sector activity in the country, as the government competes
for the same domestic financial capital, leading to appreciated real exchange rates and interest
rates. During the 2001/02 fiscal year although the government’s tax revenue as a percentage of
GDP improved, the improvement was not substantial enough to prevent the fiscal deficit from
worsening. The overall budget deficit rose to 5.1 per cent of GDP from 2.2 per cent of GDP in
the previous year. Consequently, the primary balance also worsened to a deficit of 3.7 per cent of
GDP in 2001/02 from the deficit of 1 per cent of GDP the previous year. The outlook on the
budget situation is a contraction in the overall deficit to an estimated 1 per cent of GDP in
2002/03, with the primary balance also improving to an estimated small surplus of 0.3 per cent of
GDP.
In recent times, the underlying feature of the government’s fiscal performance, on the revenue
side, has been the rather low revenue base, which continued in 2001/02. During 2001/02, tax
revenue increased to 10.8 per cent of GDP from 10.4 per cent of GDP the previous year. The
increase was, however, largely due to the inclusion of non-tax revenue collected by government
departments in the revenue of 2001/02, which was not the case in 2000/01 prior to the abolition
7
of the appropriation in aid provision, which had allowed government departments to retain their
nontax revenue to finance expenditure. The domestic tax effort in 2001/02 remained generally
lower. In those taxes where the yield was higher, such as in income tax, this was mainly to the
result of significant increases in wage rates of civil servants and the elastic nature of the tax,
rather than any expansion in the tax base. Tax revenues from other sources such as import duty
were poorer in 2001/02 owing to the failure of the government to realize efficiency gains in
collection as well as from the appreciation of the Ugandan shilling (World bank, 2008).
1.2 Problem Statement
Uganda is among the countries that have been credited for establishment of sound policy
intended to stabilize the economy, this although is not the case as since the country still register
low degrees of economic growth.
The policies to expenditure and earnings are properly stipulated though this has not resulted in
the generation of growth since the country growth is low. The road to attaining economic growth
is normally through implementing the pragmatic policies in the economy intended to ensure the
attainment of economic growth, these in most cases is monetary control both at the receipts and
expenditure (fiscal policy).
The fiscal policy has not generated economic growth in Uganda despite the existence of the
policy on tax revenue, Non tax revenue and expenditure (IMF report, 2010). Even the empirical
studies conducted provide a similar revelation for instance, Nijkamp and Poot (2016) conducted
a meta-analysis of past empirical studies of fiscal policy and growth and found that in a sample
of 41 studies, 29% indicate a negative relationship between fiscal policy and growth, 17% a
positive one, and 54% an inconclusive relationship. Kamin and Rogers (2017) assert that
governments use fiscal policy to influence the level of aggregate demand in the economy, in an
effort to achieve economic objectives of price stability, full employment, and economic growth.
Amanja and Morrissey (2005) used time series techniques to investigate the relationship between
various measures of fiscal policy on growth on annual data for the period 1964 – 2002 all the
empirical studies are outside the Ugandan context. It is based on this analogy that the researcher
intend to conduct an empirical study by analyzing time series observations of fiscal policy and
economic growth of Uganda in the period of 31 ears (1985 to 2016) to establish the relationship
8
between fiscal policy and economic growth that would provide a basis for policy intervention to
enhance economic growth of Uganda’s future.
1.3 Purpose of the study
The purpose of the study was to investigate the effect of fiscal policy on economic growth in
Uganda (1985-2016).
1.4 Objectives of the study
1) To examine the effect of government tax revenue (taxation) on the economic growth in
Uganda.
2) To determine the effect of Public expenditure (Expenses) on economic growth in
Uganda.
3) To assess the effect of government non tax earning on the economic growth in Uganda.
1.5 Hypotheses
H01: There is no significant effect of Public expenditure on economic growth in Uganda.
H02: There is no significant effect of government tax government earning on economic growth in
Uganda.
H03: There is no significant effect of government non tax government earning on economic
growth in Uganda.
1.6 Scope of the study
This shows the parameters of the study in terms of its content, time, geography and theory. It is
aimed at ensuring that the study remains focused on variables it set out to investigate as seen
under.
1.6.1 Content Scope
The study was limited to analyzing the variables as stated in the specific objectives: hence
empirically describing the effect of fiscal policy that is government spending and public earnings
on economic growth.
1.6.2 Geographical scope
The study covered Uganda’s economy from 1985 to 2016. Republic of Uganda is a landlocked
country in East Africa. It is bordered on the east by Kenya, on the North by South Sudan, on the
West by the Democratic Republic of the Congo, on the Southwest by Rwanda, and on the South
by Tanzania. Uganda is the second most populous landlocked country. The southern part of the
9
country includes a substantial portion of Lake Victoria, shared with Kenya and Tanzania,
situating the country in the African Great Lakes region. Uganda also lies within the Nile basin,
and has a varied but generally equatorial climate.
1.6.3 Time Scope
The study covered a range from 1985-2016 using the data of statistical data for the period of 31
years.
1.7.4 Theoretical Scope
The study was based on Keynesian theory of 1936 and Endogenous growth theory (1936) who
argued that the solution to the Great Depression was to stimulate the economy through some
combination of two approaches: A reduction in interest rates (monetary policy) and Government
investment in infrastructure (fiscal policy). By reducing the interest rate at which the central
bank lends money to commercial banks, the government sends a signal to commercial banks that
they should do the same for their customers.
Endogenous growth theory:The study was premised on the endogenous growth theory by Romer
(1994). The endogenous growth theory holds that economic growth is primarily the result of
endogenous and not external forces. Endogenous growth theory holds that investment in human
capital, innovation, and knowledge are significant contributors to economic growth. The theory
also focuses on positive externalities and spillover effects of a knowledge-based economy which
will lead to economic development.
1.7 Significance of the study
The integrated study on fiscal policy and economic growth of Uganda is intended to provide data
significant to several stakeholders.
1) Basing on the content and literature review, the stakeholders such as government through
the Uganda revenue authority (URA) Uganda bureau of statistics, among other policy
makers will benefit from the findings through providing empirical evidence on the
relationship between taxation and economic growth.
2) It would have a direct effect in the efficiency and the effectiveness of the use of policy
instrument in the stabilities of macroeconomic variable to stimulate production.
3) It would also provide an explanation for Uganda’s stunted growth a ground that can be
explored to arrive at development of Uganda.
10
4) The study will explore the means through which tax revenue can enhance and generate
the economic growth of a country through assessing the state contributions made through
the period of the study.
5) The study explore the state of fiscal policy implementation in Uganda by exploring the
means through which the organizations can enhance the performance mechanism through
government expenditure explaining the situation in Uganda contrary to the existing
environment for the study.
1.8 Operational definitions
Fiscal policy
Fiscal policy is the use of government revenue collection that includes tax revenue and non tax
revenue and expenditure to influence the economy. The two main instruments of fiscal policy are
changes in the level and composition of taxation and government spending in various sectors.
These changes can affect the following macroeconomic variables in an economy.
Public expenditure is total expenditure consists of total expense and the net acquisition of
nonfinancial assets. The expenditure in this study is expressed in Uganda shillings (LCU).
Tax revenue is the collections through taxations carried out within the boundaries of the country.
The tax revenue in this study is measured through Uganda shillings over the period of 32 years
(LCU).
Non tax revenue is the collections of the country that contribute to revenue of the country. The
non tax revenue in this study is composed of revenue from government rents, commissions but
excludes grants, loans and any other financial aid to the country. The non tax revenue is
measured in Uganda shillings over the period of 32 years (LCU).
Economic growth
Economic growth is the increase in the level on goods and services of a country within a fixed
period of time; in this case economic growth is measured in term of Gross Domestic Product the
economic growth measured in Uganda shillings over the period of 32 years (LCU).
11
CHAPTERTWO
LITREATURE REVIEW
2.0 Introduction
This chapter is concerned with review of information that different authors have advanced on the
topic in regard to study objectives, it therefore looks at the theoretical review, conceptual
framework, related literature and related studies.
2.1.1 Theoretical Review
The Keynesian theory of 1936 indicates that during recession a policy of budgetary expansion
should be undertaken to increase the aggregate demand in the economy thus boosting the Gross
Domestic Product (GDP). Keynes regards public expenditures as an exogenous factor which
can be utilized as a policy instruments to promote economic growth. From the Keynesian
thought, public expenditure can contribute positively to economic growth. Hence, an increase in
the government consumption is likely to lead to an increase in employment, profitability and
investment through multiplier effects on aggregate demand. As a result, government
expenditure augments the aggregate demand, which provokes an increased output depending on
expenditure multipliers. In economic theory, it appears as HarrodDomarkeynesian theory of
growth or simply, HarrodDomar growth model. A mathematical equation of this model: y =
f(k,s) shows the existence of a direct relationship between savings and the rate of economic
growth (Thirlwall, 2013).
Keynes argued that reducing the interest rate at which the central bank lends money to
commercial banks, the government sends a signal to commercial banks that they should do the
same for their customers. Investment by government in infrastructure injects income into the
economy by creating business opportunity, employment and demand and reversing the effects of
the aforementioned imbalance. Okafor (2012) argued that governments source the funding for
this expenditure by borrowing funds from the economy through the issue of government bonds,
and because government spending exceeds the amount of tax income that the government
receives, this creates a fiscal deficit.
12
Endogenous growth theory
The study will be premised on the endogenous growth theory by Romer (1994). The endogenous
growth theory holds that economic growth is primarily the result of endogenous and not external
forces. Endogenous growth theory holds that investment in human capital, innovation, and
knowledge are significant contributors to economic growth. The theory also focuses on positive
externalities and spillover effects of a knowledge-based economy which will lead to economic
development.
The long-run rate of growth is exogenously determined by either the savings rate (the Harrod–
Domar model) or the rate of technical progress (Solow model). However, the savings rate and
rate of technological progress remain unexplained. Endogenous growth theory tries to overcome
this shortcoming by building macroeconomic models out of microeconomic foundations.
Households are assumed to maximize utility subject to budget constraints while firms maximize
profits. Crucial importance is usually given to the production of new technologies and human
capital.
Keynesian models in Kaldorian lines, such as Thirlwall’s Balance-of-Payments constrained
growth (BOP) model, find the channel between trade and growth by means of demand-pull
characteristic of exports. Valadkhani (2008) argued that trade represents an important constraint
to economic growth by means of balance of payments problems. Static trade models suggest that
movements toward openness can temporarily increase the rate of growth due to short-run gains
from the reallocation of resources, which would imply a positive relationship between changes in
openness and GDP growth. The new growth literature also identifies a number of avenues
through which openness might affect long run growth. Some of these channels are technological
change and technological gaps. The idea behind this statement is that countries, which are more
backward and provide more opportunities to absorb new ideas, will converge faster to
international norms, allowing them to benefit from technological change Yang, 2011).
Endogenous growth models have found in Total Factor Productivity (TFP) and the accumulation
of knowledge channels to relate trade (in the form of openness) and growth. Theoretical
framework the relationship between opening up to trade and long run growth is in fact
ambiguous. Therefore, for them, trade does not necessarily lead to faster growing. Empirically,
13
on the other hand, these connections are far from conclusive. In contrast, some cross-section and
time series/cross-section econometric studies presented different result and, in some cases,
divergent results regarding these connections.
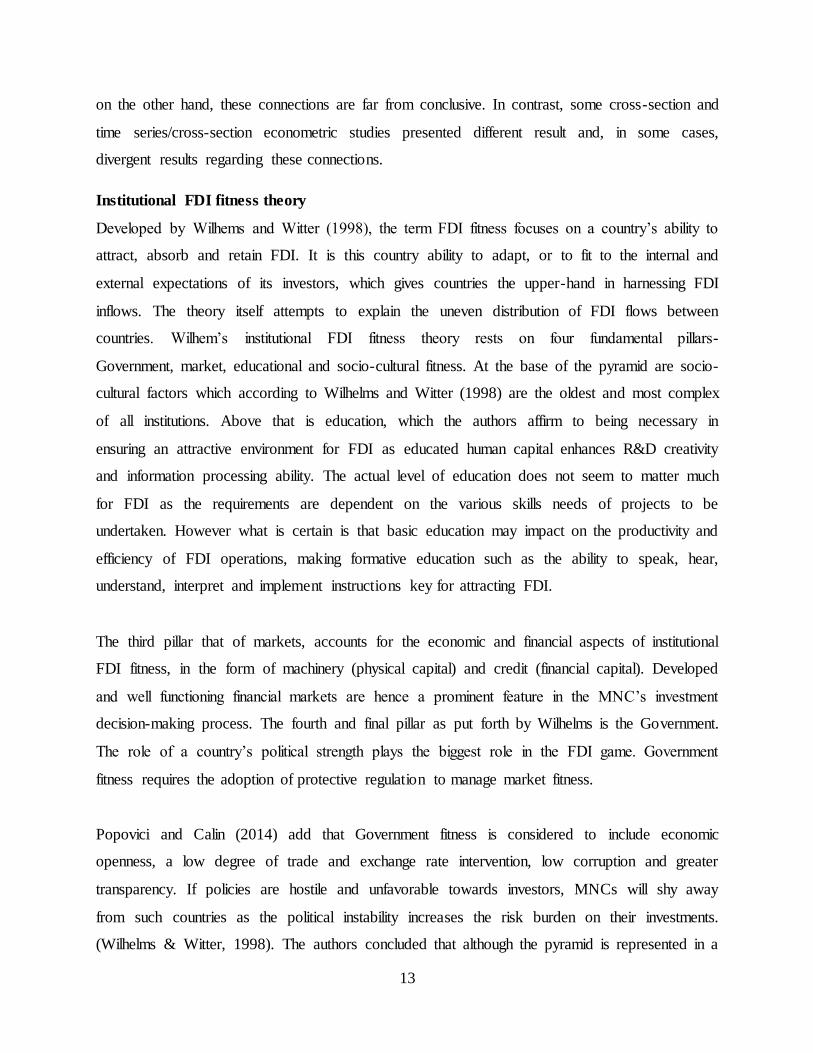
Institutional FDI fitness theory
Developed by Wilhems and Witter (1998), the term FDI fitness focuses on a country’s ability to
attract, absorb and retain FDI. It is this country ability to adapt, or to fit to the internal and
external expectations of its investors, which gives countries the upper-hand in harnessing FDI
inflows. The theory itself attempts to explain the uneven distribution of FDI flows between
countries. Wilhem’s institutional FDI fitness theory rests on four fundamental pillars-
Government, market, educational and socio-cultural fitness. At the base of the pyramid are socio-
cultural factors which according to Wilhelms and Witter (1998) are the oldest and most complex
of all institutions. Above that is education, which the authors affirm to being necessary in
ensuring an attractive environment for FDI as educated human capital enhances R&D creativity
and information processing ability. The actual level of education does not seem to matter much
for FDI as the requirements are dependent on the various skills needs of projects to be
undertaken. However what is certain is that basic education may impact on the productivity and
efficiency of FDI operations, making formative education such as the ability to speak, hear,
understand, interpret and implement instructions key for attracting FDI.
The third pillar that of markets, accounts for the economic and financial aspects of institutional
FDI fitness, in the form of machinery (physical capital) and credit (financial capital). Developed
and well functioning financial markets are hence a prominent feature in the MNC’s investment
decision-making process. The fourth and final pillar as put forth by Wilhelms is the Government.
The role of a country’s political strength plays the biggest role in the FDI game. Government
fitness requires the adoption of protective regulation to manage market fitness.
Popovici and Calin (2014) add that Government fitness is considered to include economic
openness, a low degree of trade and exchange rate intervention, low corruption and greater
transparency. If policies are hostile and unfavorable towards investors, MNCs will shy away
from such countries as the political instability increases the risk burden on their investments.
(Wilhelms & Witter, 1998). The authors concluded that although the pyramid is represented in a
14
specific order, the four institutional pillars in fact are inter-related and interact in unison in
different forms. For example, Government policies shape markets, education and socio-cultural
activities; market forces impact on the Government, education and socio-culture; education
affects human capital and hence Government, markets and socio-cultural norms and practices;
and finally, socio-cultural systems are the origin of Government, markets and education,
respectively.
2.2 Conceptual Review
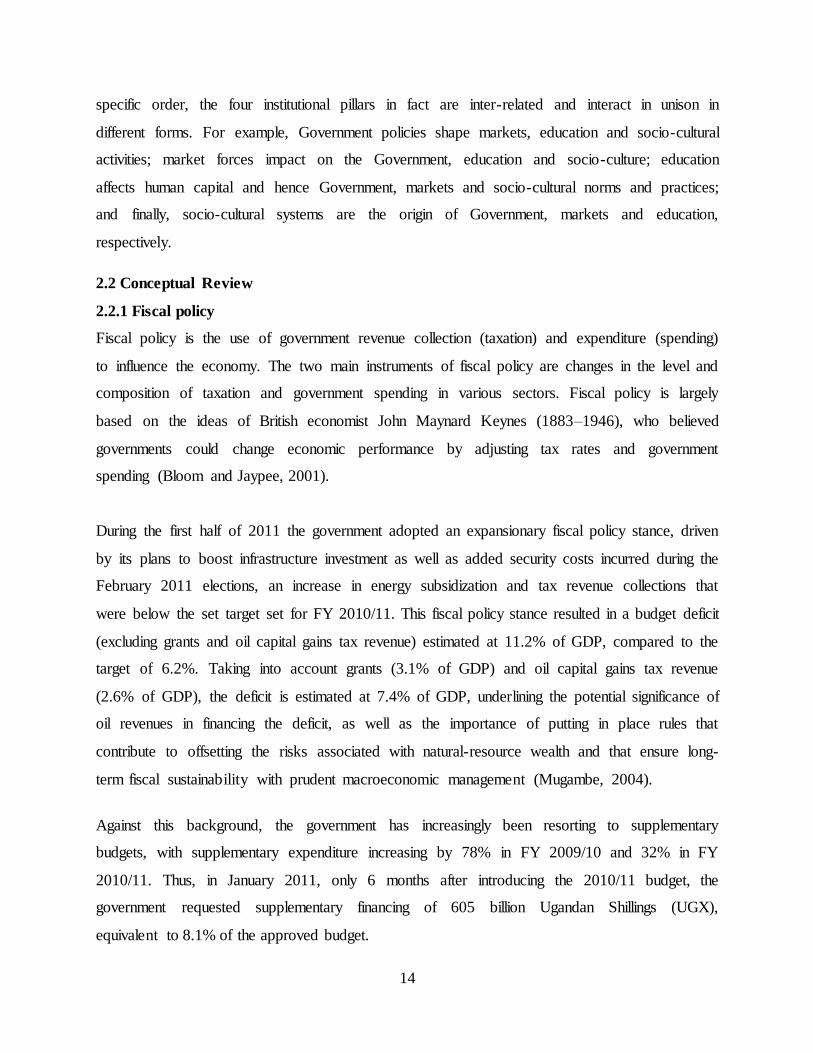
2.2.1 Fiscal policy
Fiscal policy is the use of government revenue collection (taxation) and expenditure (spending)
to influence the economy. The two main instruments of fiscal policy are changes in the level and
composition of taxation and government spending in various sectors. Fiscal policy is largely
based on the ideas of British economist John Maynard Keynes (1883–1946), who believed
governments could change economic performance by adjusting tax rates and government
spending (Bloom and Jaypee, 2001).
During the first half of 2011 the government adopted an expansionary fiscal policy stance, driven
by its plans to boost infrastructure investment as well as added security costs incurred during the
February 2011 elections, an increase in energy subsidization and tax revenue collections that
were below the set target set for FY 2010/11. This fiscal policy stance resulted in a budget deficit
(excluding grants and oil capital gains tax revenue) estimated at 11.2% of GDP, compared to the
target of 6.2%. Taking into account grants (3.1% of GDP) and oil capital gains tax revenue
(2.6% of GDP), the deficit is estimated at 7.4% of GDP, underlining the potential significance of
oil revenues in financing the deficit, as well as the importance of putting in place rules that
contribute to offsetting the risks associated with natural-resource wealth and that ensure long-
term fiscal sustainability with prudent macroeconomic management (Mugambe, 2004).
Against this background, the government has increasingly been resorting to supplementary
budgets, with supplementary expenditure increasing by 78% in FY 2009/10 and 32% in FY
2010/11. Thus, in January 2011, only 6 months after introducing the 2010/11 budget, the
government requested supplementary financing of 605 billion Ugandan Shillings (UGX),
equivalent to 8.1% of the approved budget.
15
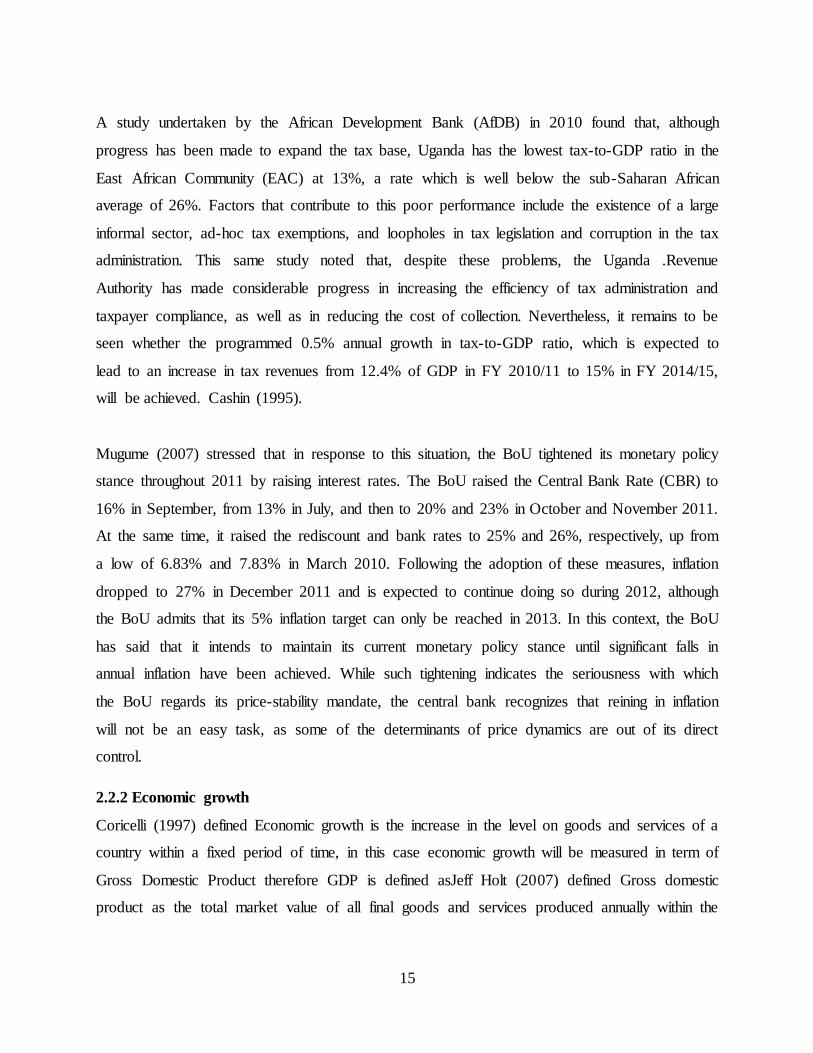
A study undertaken by the African Development Bank (AfDB) in 2010 found that, although
progress has been made to expand the tax base, Uganda has the lowest tax-to-GDP ratio in the
East African Community (EAC) at 13%, a rate which is well below the sub-Saharan African
average of 26%. Factors that contribute to this poor performance include the existence of a large
informal sector, ad-hoc tax exemptions, and loopholes in tax legislation and corruption in the tax
administration. This same study noted that, despite these problems, the Uganda .Revenue
Authority has made considerable progress in increasing the efficiency of tax administration and
taxpayer compliance, as well as in reducing the cost of collection. Nevertheless, it remains to be
seen whether the programmed 0.5% annual growth in tax-to-GDP ratio, which is expected to
lead to an increase in tax revenues from 12.4% of GDP in FY 2010/11 to 15% in FY 2014/15,
will be achieved. Cashin (1995).
Mugume (2007) stressed that in response to this situation, the BoU tightened its monetary policy
stance throughout 2011 by raising interest rates. The BoU raised the Central Bank Rate (CBR) to
16% in September, from 13% in July, and then to 20% and 23% in October and November 2011.
At the same time, it raised the rediscount and bank rates to 25% and 26%, respectively, up from
a low of 6.83% and 7.83% in March 2010. Following the adoption of these measures, inflation
dropped to 27% in December 2011 and is expected to continue doing so during 2012, although
the BoU admits that its 5% inflation target can only be reached in 2013. In this context, the BoU
has said that it intends to maintain its current monetary policy stance until significant falls in
annual inflation have been achieved. While such tightening indicates the seriousness with which
the BoU regards its price-stability mandate, the central bank recognizes that reining in inflation
will not be an easy task, as some of the determinants of price dynamics are out of its direct
control.
2.2.2 Economic growth
Coricelli (1997) defined Economic growth is the increase in the level on goods and services of a
country within a fixed period of time, in this case economic growth will be measured in term of
Gross Domestic Product therefore GDP is defined asJeff Holt (2007) defined Gross domestic
product as the total market value of all final goods and services produced annually within the
16
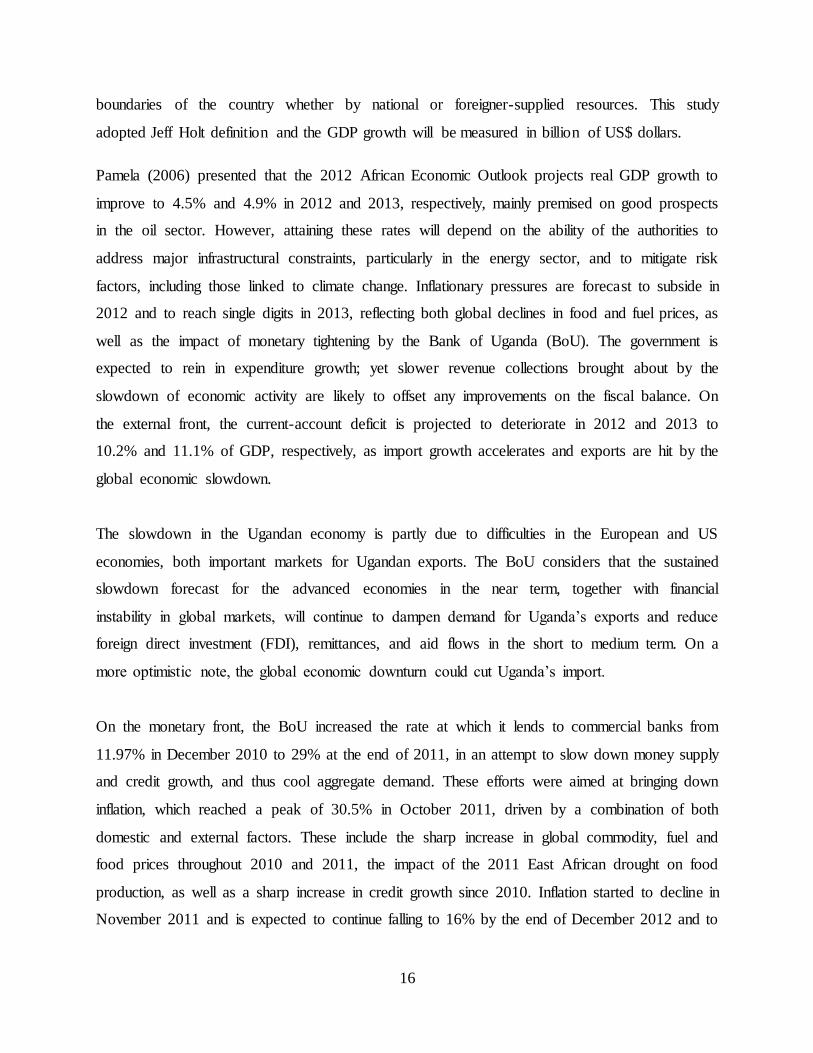
boundaries of the country whether by national or foreigner-supplied resources. This study
adopted Jeff Holt definition and the GDP growth will be measured in billion of US$ dollars.
Pamela (2006) presented that the 2012 African Economic Outlook projects real GDP growth to
improve to 4.5% and 4.9% in 2012 and 2013, respectively, mainly premised on good prospects
in the oil sector. However, attaining these rates will depend on the ability of the authorities to
address major infrastructural constraints, particularly in the energy sector, and to mitigate risk
factors, including those linked to climate change. Inflationary pressures are forecast to subside in
2012 and to reach single digits in 2013, reflecting both global declines in food and fuel prices, as
well as the impact of monetary tightening by the Bank of Uganda (BoU). The government is
expected to rein in expenditure growth; yet slower revenue collections brought about by the
slowdown of economic activity are likely to offset any improvements on the fiscal balance. On
the external front, the current-account deficit is projected to deteriorate in 2012 and 2013 to
10.2% and 11.1% of GDP, respectively, as import growth accelerates and exports are hit by the
global economic slowdown.
The slowdown in the Ugandan economy is partly due to difficulties in the European and US
economies, both important markets for Ugandan exports. The BoU considers that the sustained
slowdown forecast for the advanced economies in the near term, together with financial
instability in global markets, will continue to dampen demand for Uganda’s exports and reduce
foreign direct investment (FDI), remittances, and aid flows in the short to medium term. On a
more optimistic note, the global economic downturn could cut Uganda’s import.
On the monetary front, the BoU increased the rate at which it lends to commercial banks from
11.97% in December 2010 to 29% at the end of 2011, in an attempt to slow down money supply
and credit growth, and thus cool aggregate demand. These efforts were aimed at bringing down
inflation, which reached a peak of 30.5% in October 2011, driven by a combination of both
domestic and external factors. These include the sharp increase in global commodity, fuel and
food prices throughout 2010 and 2011, the impact of the 2011 East African drought on food
production, as well as a sharp increase in credit growth since 2010. Inflation started to decline in
November 2011 and is expected to continue falling to 16% by the end of December 2012 and to
17
14.1% by 2013. Despite this improved inflationary outlook, the BoU intends to maintain high
interest rates for the foreseeable future until inflation is fully under control. Granger C, (2005)
Fölster and Henrekson (2001) pointed out productive-sector activities in 2011 have continued to
be dominated by developments in the power and oil industries, both of which are critical to
Uganda’s development prospects. With current national hydro generation levels at around 200-
250 megawatts (MW) and electricity demand at 440MW in peak hours, energy poses one of the
most important challenges to sustained economic development in Uganda. In 2011 the main
power distribution company, Umeme, implemented a load-shedding (rationing) program that has
led to nationwide power cuts of up to 12 hours per day, disrupting production activities and
causing considerable social unrest. The commissioning of the Bujagali hydropower dam, which
is planned to start operating in 2012 and which will increase generation capacity by 170 250MW,
is expected to ease power shortages in the short term.
Uganda is planning to start large-scale oil production and expects to reach a peak of 200 000
barrels per day in 2015/16. It could yield revenue of up to USD 2 billion annually to the
government. Whilst this revenue windfall presents a unique opportunity to address the various
investment bottlenecks in areas such as infrastructure, agriculture and social development, the
materialization of these benefits will require important investments in oil production, refinery
and distribution, and will ultimately rest on having a strong legal and regulatory framework that
ensures the transparent and prudent use of oil resources.
On the other hand, according to the 2011 Index of Economic Freedom prepared by the Heritage
Foundation, Uganda’s labour regulations are flexible, with a score of 87.8 out of a possible
maximum value of 100, although this represented a decline of 0.3 from 2010. According to this
study, the non-salary cost of employing a worker in Uganda is low, whilst dismissal costs and
associated procedures are reasonable. Moreover, regulations on working hours remain relatively
flexible. However, this same study finds that the enforcement of labour standards and regulations
In Uganda is often compromised by a chronic lack of supervisory resources, Garcia, Jose
Ramon, and Hector Sala (2006).
18
2.3 Empirical Review
2.3.1Effect of Public expenditure and economic growth
Mohanty (2014) argued that public expenditure and economic growth have adopted either the
aggregated or disaggregated approach. With respect to studies that adopt the disaggregated
approach, the general view is that public expenditure, notably on physical infrastructure or
human capital is growth enhancing, while government consumption is expected to be growth
retarding thus, the concept of productive and unproductive government expenditure.
Mitchell (2015) argued that the American government expenditure has grown too much in the
last couple of years and has contributed to the negative growth. The author suggested that
government should cut its spending, particularly on projects/programs that generate least benefits
or impose highest costs. Sáez and García (2016) studied the relationship between government
expenditure and economic growth in the EU-15 countries. The results obtained based on
regressions and panel techniques suggest that government spending is positively related with
economic growth in the EU countries. Gregoriou and Ghosh (2017) used the heterogeneous
panel to investigate the impact of government expenditure on economic growth. The authors
employed the GMM technique, and discovered that countries with large government expenditure
tend to experience higher growth, but the effect varies from one country to another.
Kitov (2016) argued that an obvious deficiency of economic theory is that it does not provide a
well developed methodology to incorporate government expenditures in standard growth models.
To assuage this, empirical studies have been carried out to establish a relationship between size
of government and economic growth. While some studies have found a negative relationship
between government expenditure and economic growth others have found a positive relationship.
Showed that government capital expenditure has a significant positive effect on real output, but
that real government recurrent expenditure has insignificant effect on growth.
Olugbenga and Owoeye (2007) investigated the relationships between public expenditure and
economic growth in a group of 30 OECD countries for the period 1970-2005 using regression
analysis. Their analysis showed that a long-run relationship exists between government
expenditure and economic growth. The study also indicated a unidirectional causality from
government expenditure to growth for 16 of the countries, thus supporting the Keynesian
19
hypothesis government intervention. But, causality runs from economic growth to government
expenditure in 10 of the countries, thereby confirming the Wagner’s law. For the remaining four
countries, findings indicated existence of feedback relationship between government expenditure
and economic growth.
Coricelli, Fabrizio (2007) investigated the differential effects of various categories of
expenditures on economic growth for a sample of 58 countries. Their findings suggested that
while government expenditures on education and defense have positive effect, expenditure on
warfare has insignificant negative effect, on economic growth.
Other researchers have examined the effect of public expenditure on economic growth. Galor,
Oded (2005) examined the effect of government expenditure on economic growth for a sample
of 96 countries. He found that public expenditure exerts a negative effect on real output.
Similarly Gilpin, 2001), employing the Granger causality test, examined the relationship between
government expenditures and economic growth in Thailand and found that government
expenditures and economic growth are not co-integrated. The result also suggested that a
unidirectional relationship, as causality runs from government expenditures to growth. However,
the result indicated a significant positive effect of government spending on economic growth.
Ketema (2006) however, noted that in empirical work it is difficult to determine which particular
item of expenditure should be categorised as investment and which as consumption. Most
empirical studies have supported either of the two views stated above. Few, however, have found
no relationship. It is important to note that these results differ by country / region, analytical
method employed, and categorization of public expenditure. Initial studies on this topic focused
on the aggregate size of government spending, while recent studies emphasize the composition
of public expenditure.
Thirlwall (2013) the relation between the share of total public expenditure in GDP and the
growth in per capita real GDP and found negative and significant relationship between the two.
Using an endogenous growth model of the U.S. economy in which government purchases
directly affect both the utility of consumers and the productivity of firms, Kentor (2003)
examined the relationship between government expenditure and economic growth in Saudi
Arabia using the series of the growth rate in per capita real GDP and the share of government
20
spending in GDP. He found no consistent evidence that government spending can increase Saudi
Arabia‘s per capita output growth.
Erkin (2007) examined the relationship between public expenditure and economic growth, by
proposing a new framework for New Zealand. The empirical results showed that higher
government expenditure does not hurt consumption, but instead raises private investment that in
turn accelerates economic growth.
Foster and Mijumbi (2012) found a robust negative relationship between public expenditure and
growth. The study was based on advanced countries between 1970 and 1995. Their estimated
coefficient suggested that a 10 percentage increase in government expenditure is associated with
a decrease of 0.7 percentage point in growth rate. Ramayandi (2003) investigated the impact of
government size on economic growth using a sample of time series data on Indonesia (1969-
1999). He found consistent evidence that the share of government consumption spending
decreases economic growth.
Komain and Brahmasrene (2007) study the relationship between government expenditures and
economic growth in Thailand, by employing the Granger causality test. The results showed that
government expenditures and economic growth are not co-integrated. However, the results
indicated a unidirectional relationship, as causality runs from government expenditures to
growth. Furthermore, the results illustrated a significant positive effect of government spending
on economic growth.
Olugbenga and Owoye (2007) investigated the relationships between public expenditure and
economic growth for a group of 30 OECD countries during the period 1970-2005. The
regression results showed the existence of a long-run relationship between government
expenditure and economic growth. In addition, the authors observed a unidirectional causality
from government expenditure to growth for 16 out of the countries, thus supporting the
Keynesian hypothesis. However, causality runs from economic growth to government
expenditure in 10 out of the countries, confirming the Wagner‘s law. Finally, the authors found
the existence of feedback relationship between government expenditure and economic growth
for a group of four countries. In India, Ranjan and Sharma (2008) examined the effect of
21
government development expenditure on economic growth in India from 1950-2007. The authors
found a significant positive impact of government expenditure on economic growth.
Kamin and Rogers (2000) assert that governments spending influence the level of aggregate
demand in the economy, in an effort to achieve economic objectives of price stability, full
employment, and economic growth. Keynesian economics suggests that increasing government
spending and decreasing tax rates are the best ways to stimulate aggregate demand, and
decreasing spending & increasing taxes after the economic boom begins. Keynesians argue this
method be used in times of recession or low economic activity as an essential tool for building
the framework for strong economic growth and working towards full employment.
2.3.2 Effect of government tax revenue earnings on economic growth
Taxation is a way of raising revenue for the day to day running of government activities.
Government activities involve generating funds and using same to provide security, social
amenities, infrastructural facilities, etc, for the inhabitant of the country. Base on this, it is
worthy of note that the objective of taxation is in tandem with the functions of government
(Akhor, 2014).
Owolabi and Okwu (2011) examined the contribution of only Value Added Tax (VAT) to
Development of Lagos State Economy from 2001 to 2005. The study regressed each
development indicator (infrastructural, environmental management, education sector, youth and
social welfare, agricultural, healthcare, and transportation) on VAT revenue proceeds generated
by Lagos State during the study period. Their finding was that revenue generated from VAT
positively contributed to the development of the respective sectors of Lagos State economy
during the period studied. Adereti, Adesina and Sanni, 2011.Extended the study by examining
the impact of VAT revenue on economic growth of states during the period 1994 to 2008 using
time series data on the GDP, VAT Revenue, Total Tax Revenue and the total revenue of the
federal government. The result of the study was in line with that of Owolabi and Okwu (2011)
showing an existence of a positive and significant correlation between VAT Revenue and Gross
Domestic Product of different countries. Success, Success and Ifurueze, 2012 investigated the
impact of Petroleum Profit Tax on the economic development of states between the period 2000
to 2010. Their findings reveal that petroleum profit tax positively impacts on gross domestic
product (GDP) of Nigeria, and the impact is statistically significant. They failed to report on the
22
economic development that was the topic of consideration. They argue that the increase in the
economic growth rate does not reflect in Nigeria's general economic development. Okafor (2012)
examined the relationship between federally generated revenue and economic development in a
country using Gross Domestic Product (GDP) for the period 1981 to 2007. The result of the
study showed a positive and significant relationship between Income Tax Revenue and
Economic Development.
Akhor (2014) stated that the economic effects of tax include micro effects on the distribution of
income and efficiency of resource use as well as macro effect on the level of capacity output,
employment, prices, and growth. Therefore, the use of tax as an instrument to achieve economic
growth in most less develops countries cannot be reliable because of dwindling level of revenue
generation.
Consequently, changing or fine-tuning tax rates has been used to influence or achieve
macroeconomic stability. Critical examples of governments that have influenced their economic
development through revenue from tax are: Canada, United States, Netherland and United
Kingdom. They derive substantial revenue from Value Added Tax, Import Duties and have used
same to create prosperity (Oluba, 2008). A significant share of the tax revenue increase in Africa
stems from natural resource taxes. This included income from production sharing, royalties, and
corporate income tax on oil and mining companies.
Muriithi and Moyi (2013) observe that a good tax system should be able to generate the needed
revenue for government; redistribute income; and investment infrastructure that will provide the
guarantee for business to strive and economic growth. The enabling environment created by
government encourages the establishment of new business; survival of existing business and the
infrastructures provided is a key determinant of political, economic and social well structured tax
system provides government the needed fund for capital (infrastructure) and recurrent
(administrative) expenditure that would greatly lead to economic growth and development.
Therefore, tax can be seen as a fiscal policy, macroeconomic and internal revenue mobilization
tool for the attainment of economic growth.
Ogbonna and Ebimobowei (2012) examine the Impact of Tax Reforms and Economic Growth in
Nigeria using relevant descriptive statistics and econometric analysis. They found that various
23
tax reforms are positively and significantly related to economic growth and that tax reforms
granger cause economic growth. This means that tax reforms improves the revenue generating
machinery of government to undertake socially desirable expenditure that will translate to
economic growth in real output and per capita basis.
Kusi (2013) states that many countries of the world depend mainly on taxation for generating
required income to meet their financial needs. The tax provides a predictable and stable flow of
revenue to finance development objectives (Pfister, 2009). Bird and Zolt (2003) opine that,
effective and efficient tax system can assist the government generate enough revenue to take care
of its estimated expenditure, meet the needs of the people, and effectively participate in the
world economy. The quality of life of people of a state is the focus of any development
objectives. Access to education, improved healthcare delivery, employment opportunities, clean
air, safe drinking water and security of life and property determine the people's quality of life or
standard of living (The World Bank Group, 2004).
The main purpose of a tax is to enable public sector finance its activities so as to achieve some
nation’s economic and social goals. It can also be for the purpose of redistribution of wealth to
ensure social justice (Ola, 2001). Therefore, taxes can be used as an instrument for achieving
both micro and macroeconomic objectives especially in developing countries. However,
Musgrave and Musgrave (2004) comment that the dwindling level of tax revenue generation in
the developing countries makes it difficult to use tax as an instrument of fiscal policy for the
achievement of economic development. Some governments like Canada, United States,
Netherland, and The United Kingdom have substantially influenced their economic development
through tax revenue generated from Company Income Tax, Value Added Tax, and Personal
Income Tax, and have prospered through tax revenue (Oluba, 2008). In Africa, natural resources
such as income from production sharing, royalties, and corporate income tax on oil and mining
companies yield the significant portion of tax revenue (Pfister, 2009). The tax sources are the
basic and most reliable sources of government revenue because of their certainty and flexibility
characteristics. Certainty characteristic implies that collection of taxes from taxpayers is assured,
all other things being equal. Tax collection is not affected by the state of the economy; whether
the economy is declining, stagnant or growing. Its flexibility makes it possible for the
government to adjust the tax system to suit her desired purpose.
24
Kalecki (2016) explored what he termed as "the Problem of Financing Economic Development"
where governments may use taxation as a tool of managing inflation in a situation where public
investments are either partially or fully financed through taxes. The author argued that taxation
on lower income groups reduced real wages leading to less savings and. hence, investments.
While for the higher income groups, increased taxes decreased the level of consumption; with
the overall effect of reducing economic growth. Since demand for goods and services is reduced
by a higher tax burden across the board, inflationary pressures are minimized.
Gruber (2016) found that taxes cause growth. According to their findings, corporate taxes are
found to be most harmful for growth, followed by personal income taxes and then consumption
taxes. Recurrent taxes on immovable property appear to have the least impact. They concluded
that a revenue neutral growth-oriented tax reform would, therefore, be to shift part of the revenue
base from income taxes to less distortive taxes. Furthermore Kaldor (2011) posed that a
country’s tax potential depended on per capita real income, distribution of income, structure of
the national economy, political and administrative governance. According to the author, the
developing country tax performance would best be measured not by static indices such as tax
ratios but by dynamic means such as tax effort and income-elasticity of the tax regime.
Lewis (2015) was of the view that governments tend to avoid raising taxes because of the
adverse political consequences and instead resort to printing money or creating (easy) credit a
monetary policy that leads to or fuels inflation. While taxation may raise prices, depending on
income and price elasticities, the development economic scholar concluded that taxation was
superior to inflation for a country’s capital formation.Bilas (2001) analyzed taxation from a
microeconomic perspective and stated that it was one fiscal instrument that a government may
use to control monopoly power. I he imposition ol a fixed tax per unit, the Kenyan example
being an excise tax, is the equivalent of a variable cost to the monopolist. Both the average and
marginal cost curves shift upwards resulting in a fall in both output and price of the taxed
commodity/service. In this regard, the tax burden is shifted to consumers, an inflationary
outcome that may not be politically palatable. The government has the option of ensuring that a
monopolist bears the full tax burden in the form of a fixed cost by charging and/or raising the
license fee of the monopolist.

25
Blanchard and Perotti (2012), claim that both increases in taxes and increases in government
expenditures affect investment spending negatively. Accordingly, tax reforms through raising
individual and corporate taxes do not necessarily spell out economic growth through increased
government revenue but they could also derail economic growth through reduced social welfare
and poor investment incentives. Taxes levied to the public and business entities must be
reasonable and an effective tax reform strategy should not aim at increasing the citizens' tax
burden. Instead, reforms should focus on streamlining the system and ensuring that tax proceeds
are used effectively to achieve economic growth.
Teixeira and Fortuna (2003)Lin (2001) confirms that a positive dependency can exist between
economic growth andtaxation if revenues from taxes are used only for human capital
accumulation. Individualcompanies invest into their employees’ training and development only
once, usuallyin the first period of employment. However, when companies invest intohuman
capital, they must differentiate between the general and specific capital. Generalcapital can be
utilized by employees also at other employer, but they do not bear anyinvestment costs and the
employer can therefore afford to pay the employee a highersalary (corresponding to higher
labour productivity). Due to this, companies require thatspending connected with investments
into general human capital is taken up by theemployees themselves (Kotlán, Machová and
Janíčková, 2011). The situation is differentin the case of specific capital since employee
productivity is increasing only with thegiven employer who is then logically willing to take up a
part of the investment costsand pay the employee a higher salary than is his/her productivity.
A good approach for literature analysis of the empirical studies on the relationship between
taxation and economy growth. He uses the review but focuses on the most important analyses.
The literature sources are differentiated in evidence on the tax level and growth and evidence on
tax structure and growth. Arnold notes that the findings of the studies, analyzing the link
between growth and tax structures provide somewhat more conclusive answers than the studies
focused on the level of taxation. The results from the empirical analyses of Widmalm (2001),
Schwellnus and Arnold (2008)), Lee and Gordon (2005) are considered as sufficiently reliable
evidence for the nature of the studied relationship. The collective contribution to empirical
analysis on this topic by identifying a depressing effect of ‘distortionary taxes’, which include
26
taxes on income and property. They also find that productive government expenditure stimulate
economy growth.
Widmalm (2001) estimates a negative relationship between budget revenue accumulated by
income taxes and economic activity growth. According to her conclusions, the predictions of
conventional wisdom for negative effect of indirect taxes on economy are not confirmed. The
empirical results from analyses of Schwellnus and Arnold (2008) and Vartia (2008) indicate a
negative effect of corporate taxes on the productivity of firms and industries, based on large data
sets of firms and industries across OECD countries. The significant negative correlation between
statutory corporate tax rates and growth for 70 countries during 1970-1997.
Romer and Romer (2007) review other papers presenting evidence for various aspects of the
relationship between taxation and economy growth. There are different kinds of econometric
approaches applied. Some of studies link the GDP growth rate and public spending and receipts.
The studies of Blanchard and Perotti (2002) are considered as more sophisticated, because these
researches assume that once one corrects for the impact of economic activity on revenues and
controls for the behavior of government spending, changes in revenues are uncorrelated with
other determinants of output growth. A different approach is applied in studies, which are
reviewed and investigate the impact of tax changes on consumption. The estimated impact of tax
increases on consumption in these studies ranges from roughly no effect to a substantial negative
effect.
2.3.3 Effect of non tax government revenue on economic growth
The importance of non-tax revenue is now being realized by the sub-national governments in
India in the context of revenue deficits and, the heavy financial requirements for upgrading and
modernizing basic infrastructure (Mohanty, 2014). Therefore, non-tax revenue is essential to
finance the repair, maintenance and operations (MRO) of existing capital assets that creates
positive externalities as well revenue for the governments. The expenses on account of MRO of
capital assets are booked as revenue expenditure. The revenue expenditure may be non-plan and
plan expenditure. The Non Plan revenue expenditure essentially includes all committed
expenditures such as salary, pension and interest payments. These non-plan expenditures have
first charge on the untied own revenue resources of the sub- national governments.
27
According to Purohit(2006), the marginal cost theory requires that there the external effects
should be minimal in consumption and production, and there should be participation of
competitive forces in providing the same goods and services. In this study, economic services
sector is specifically chosen to link with its non-tax revenue ad it has minimal externalities and
private sector participation happens through public private sector mode, management contract,
build own operate and transfer models. Purohit has further argued that at present, the
user‘charges for the services provided by the Government are negligible or non-existent. Hence,
it is generally believed that the user charges must be augmented to reduce the burgeoning
Government subsidies and reducing revenue deficits. The Government provides a variety of
heterogeneous services. In his opinion, in the economic services sector, all of the subsectors or
minor sectors are not amenable to cost recovery. While some services could have a price
recovering the cost incurred, others may be priced just to cover a part of the expenditure incurred
in their provision. Also, there are few services for which consumers are not charged at all. The
policy to recover expenses should depend upon the type of services provided as there cannot be
any universal policy prescription for all the services provided by the Government. However, the
marginal cost pricing should be benchmark while pricing these services as it would indicate the
financial loss and gain in terms of tax revenue.
Dholakia (2006) had considered the fiscal instrument of the non-tax revenue (NTR) of the sub-
national governments in relation to only those aspects and instruments over which the sub-
national governments has sufficient control and it can, if it so desires, try to achieve the
constrained maxima in terms of reduction of revenue deficit as well as fiscal deficit through
them. Das-Gupta(1990) had argued for leasing contract to provide public good and services in
order to maximize non tax revenue in the economic sector. Das (2011) has emphasized the tax
collection efficiency from the revenue expenditure in the economic sector as demand‖ for - on
revenues and efficiency in collecting revenue – which, in the literature, has been called collection
efficiency.‖ have cause-effect relationship. It implies that reducing efficiency loss in other sub
and minor sectors in economic services. Therefore, tax efficiency is an important parameter to
optimise non tax revenue in economic services sector of sub-national governments. Dutta (2015)
based on secondary data, an attempted to analyze revenue mobilization efforts of the
28
Government of Assam during 1991–2010. By examining the issues of arrears of uncollected both
tax and non-tax revenue, high cost of collection of different taxes and non-taxes and collection
efficiency cost low-revenue efforts on the part of the state government.
Governments often report revenue, and keep their official accounting records, in terms of a
modified accrual form of accounting. Where this happens, Census Bureau statistics reflect this
accounting approach, even though it does not correspond exactly to the concept of cash received
during the fiscal year. In aggregation and tabulation, aggregate statistics for an individual
government reflect the revenue of the parent government and all of its dependent agencies
(Chaudhry &Munir, 2010). However, flows of funds between these entities are considered
internal transfers and are excluded, by definition, from non revenue totals. These are treated as
intra-governmental revenue and are excluded in much the same way as most intra-governmental
service or revolving funds. Tabulated statistics on revenue for multiple governments reflect the
fiscal years of the governments being summed.
Government non revenue impacts economic growth through meeting the various governmental
needs (Illyas &Siddiqi, 2010). Perhaps the most important mechanism through which
government expenditure impacts on economic performance are the costs of raising taxes to
finance that expenditure because taxes affect the decisions of households to save, supply labour
and invest in human capital and of firms to produce, create jobs, invest and innovate, as well as
the choice of savings channels and assets by investors (Johansson, 2008).
Mahdavi (2008) used the advanced estimation techniques with an unbalanced panel data for 43
developing countries over the period 1973-2002. His results showed that aid had a negative
effect, non-tax revenue had also negative effect while agriculture sector share had positive but
insignificant coefficient. Trade sector share had a positive effect and economically active female
variable had a net adverse but insignificant effect while the old-age portion of population showed
negative association for both income and sales tax. Extent of urbanization and literacy rate both
showed positive effect. Population density, monetization and inflation rate remained negatively
correlated. Inverse of GDP per capita was strongly and negatively correlated with the level of
taxation. Net effect of political rights and civil liberties was significant.
29
Auerbach (2006) contends that it is important to develop a modest design into the tax system
because countries that are able to mobilize tax resources through broad-based tax structures with
efficient administration and enforcement will be likely to enjoy faster growth rates countries with
lower efficiency. Generally, efficient non tax revenue is one that reduces the disincentive effects
of taxation to work, save and invest by using broad-based income tax structures. Therefore, a
broad base of corporate income tax in conjunction with lower administrative costs is often seen
as fairer than a narrow-based system because of horizontal and vertical equity considerations.
Hence, tax reform in Asia and Europe should thereby focus on enhancing tax enforcement and
broadening their tax base by minimizing tax incentives, exemptions and allowances, which
would reduce the administrative costs of taxation and lead to an increase in tax revenue.
Increases in tax revenue would allow greater government benefits to achieve more equal
distributions of wealth and income.
Poulson and Kaplan (2008) describe marginal tax rates as the best measure for determining the
impact of taxes on economic growth because increases or decreases in a marginal income tax
rate create incentives economic units, like workers or businesses, to increase or decrease their
output depending on what is best for them individually (Poulson & Kaplan, 2008). Other
researchers like, Mofidi and Stone (1990) chose to use total state revenue per capita, because it
more holistically addresses the question of how taxes affect economic growth.
Mofidi and Stone (1990) decided that business location and capital spending reflect the state of
an economy, and are therefore suitable measures for economic growth. The reasoning being that
an increase in non tax revenue, or decrease in the number of businesses, or an increase in the
amount of money a state spends to build infrastructure is representative of the growing needs of a
population, which by extension, tells us that economic growth is positive. All of which is
probably true to an extent, but probably varies quite a bit by circumstance. A fast growing state
like California will, by necessity of size as well as population growth, need to spend more on
capital projects than say Rhode Island.
30
2.4Effect of fiscal policy on economic growth
Nijkamp and Poot (2016) conducted a meta-analysis of past empirical studies of fiscal policy and
growth and found that in a sample of 41 studies, 29% indicate a negative relationship between
fiscal policy and growth, 17% a positive one, and 54% an inconclusive relationship. One of the
contributory factors to these varied empirical results is the measure used to proxy for fiscal
policy. Different investigators have used different measures of government spending as proxies
for government size, e.g. total government spending, government consumption, total government
revenue, or functional categories of government expenditure among others. Most of these
measures are expressed as shares in GDP (GNP) either as levels or as growth rates. Admittedly,
the choice of a given measure depends on which data series are available to the researcher, and
given that some measures are better than others, results are bound to differ.
Islam and Kamrul (2016) as in other parts of the world, the appropriate fiscal policy response to
a negative demand shock in SSA depends on the size and nature of the shock, as well as country-
specific characteristics. Fiscal policy may be able to help smooth the impact of the crisis,
maintaining critical government services and investment programs and providing countercyclical
support to domestic demand. Countries that have macroeconomic stability and fiscal space (i.e.,
sufficiently strong fiscal accounts that allow them access to financing at sustainable rates) can
run expansionary fiscal policy by allowing automatic stabilizers to work and through additional
discretionary fiscal stimulus, when appropriate, to contain the impact of a sharp decline in
private sector demand in the short run. However, when countries are constrained by a lack of
financing or high levels of debt distress, then the scope for an expansionary fiscal policy is
limited and there may be no alternative to tightening fiscal policies in the near term. The
appropriate speed of adjustment will again depend on debt levels and the availability of financing
on sustainable terms.
Kamin and Rogers (2017) assert that governments use fiscal policy to influence the level of
aggregate demand in the economy, in an effort to achieve economic objectives of price stability,
full employment, and economic growth. Keynesian economics suggests that increasing
government spending and decreasing tax rates are the best ways to stimulate aggregate demand,
and decreasing spending & increasing taxes after the economic boom begins. Keynesians argue
31
this method be used in times of recession or low economic activity as an essential tool for
building the framework for strong economic growth and working towards full employment. In
theory, the resulting deficits would be paid for by an expanded economy during the boom that
would follow; this was the reasoning behind the New Deal.
But economists still debate the effectiveness of fiscal stimulus. The argument mostly centers on
crowding out: whether government borrowing leads to higher interest rates that may offset the
simulative impact of spending. When the government runs a budget deficit, funds will need to
come from public borrowing (the issue of government bonds), overseas borrowing, or
monetizing the debt. When governments fund a deficit with the issuing of government bonds,
interest rates can increase across the market, because government borrowing creates higher
demand for credit in the financial markets. This causes a lower aggregate demand for goods and
services, contrary to the objective of a fiscal stimulus. Neoclassical economists generally
emphasize crowding out while Keynesians argue that fiscal policy can still be effective
especially in a liquidity trap where, they argue, crowding out is minimal.
In the classical view, the expansionary fiscal policy also decreases net exports, which has a
mitigating effect on national output and income. When government borrowing increases interest
rates it attracts foreign capital from foreign investors. This is because, all other things being
equal, the bonds issued from a country executing expansionary fiscal policy now offer a higher
rate of return. In other words, companies wanting to finance projects must compete with their
government for capital so they offer higher rates of return. To purchase bonds originating from a
certain country, foreign investors must obtain that country's currency. Therefore, when foreign
capital flows into the country undergoing fiscal expansion, demand for that country's currency
increases. The increased demand causes that country's currency to appreciate. Once the currency
appreciates, goods originating from that country now cost more to foreigners than they did
before and foreign goods now cost less than they did before. Consequently, exports decrease and
imports increase (Kitov, 2006).
Charnley (1986) discusses the implications of fiscal policy being chosen optimally in the context
of a specific model. In his model there is an inverted U-shape relation between the share of
government expenditures in GDP and the rate of growth whenever the rate of income tax is
32
chosen randomly. In contrast, if governments choose the optimal income tax rate, the relation
between the share of government and the rate of growth can be significantly weakened. The
second branch of research that makes policy endogenous treats it as the outcome of a political
process Rodrick (1991). This ‘political economy’ approach points to very few exogenous factors
that can be used in the empirical analysis but has an implication that we examine below:
democracies and non democracies should, in general, implement different policies. We also
discuss the relation between policy variables and inequality, since this relation is at the core of
many political economy models.
Amanja and Morrissey (2005) used time series techniques to investigate the relationship between
various measures of fiscal policy on growth on annual data for the period 1964 – 2002.
Categorizing government expenditure into productive and unproductive and tax revenue into
distortionary and non-distortionary, we found unproductive expenditure and non distortionary
tax revenue to be neutral to growth as predicted by economic theory. However, contrary to
expectations, productive expenditure has strong adverse effect on growth whilst there was no
evidence of distortionary effects on growth of distortionary taxes. On the other hand, government
investment was found to be beneficial to growth in the long run. These results should prove
useful to policy makers in Kenya in formulating expenditure and tax policies to ensure
unproductive expenditures are curtailed while at the same time boosting public investment.
Benos (2009) researched on the composition of both sides of the government budget, spending
and revenues, matters for balanced growth according to endogenous growth models. This paper
takes into account explicitly both sides of the government budget, since the policy variables in
our growth regressions include both revenues and expenditures. We also extend past work by
disaggregating government expenditures in a more detailed way. We find that some types of
public spending and taxation affect growth. Specifically, government outlays on infrastructure
(economic affairs and general public services) and property rights protection (defense, public
order-safety) exert a positive impact on per capita growth.
Kefela (2009) established that Fiscal governance is strong only when governments can deliver
their fiscal policy in a sustainable way, and are efficiently applied to the provision of public
33
goods and services.Fiscal policy and its potential effects on economic activity.The economic
roles and potential methods of domestic and foreign debt financing. It focuses on the
methodology of fiscal policy for calling and assessing the impacts of alternative tax policies, and
debt management requirements. Policy and practice of public finance including decentralization
and intergovernmental fiscal relations in developing and transitional economies of Africa.
Bbaale (2005) found out that the major fiscal policy challenge facing Uganda’s economy
revolves around the possibility of increasing fiscal space and the trade-off between
macroeconomic stability on the one hand and the need to solve some pertinent development
challenges on the other. In practice, whether it is possible to increase fiscal space or not will
largely depend on the implications of these actions on macroeconomic stability and other
objectives of economic policy. This study examines both short term as well as long term
interactions between selected macroeconomic aggregates with.
Salami and Kelikume (2010) used annual data for the period 1970 to 2008 and 1980 to 2008 to
estimate inflation (fiscal policy model for Nigeria. For the period 1970 to 2008, an inflation
threshold of 8 per cent was detected, while for 1980 to 2008 an insignificant threshold of 7 per
cent is established. In a similar study for Nigeria using annual data from 1970 to 2006, Bassey
and Onwioduokit (2011) used the framework of Li (2005) to investigate the relationship between
inflation and economic growth as well detected an appropriate model. Having established the
presence of a negative relationship, they identified a statistically insignificant threshold level of
18 per cent and established that inflation rates below the threshold are growth propelling.
In Fiji’s case, studies by Dewan & Hussei (2015) revealed some insights into the inflation
growth relationship. The changes in the difference between actual GDP and potential GDP
(output gap) had a bearing on Fiji’s fiscal policy outcome. In another study, Dewan & Hussein
(2001) found in a sample of 41 middle-income developing countries including Fiji, that inflation
was negatively correlated to growth.
Mundell (2015) was one of the first to articulate a mechanism relating inflation and output
growth separate from the excess demand for commodities. According to Mundell’s model, an
increase in inflation or inflation expectations immediately reduces people’s wealth. This works
34
on the premise that the rate of return on individual’s real money balances falls. To accumulate
the desired wealth, people save more by switching to assets, increasing their price, thus driving
down the real interest rate. Greater savings means greater capital accumulation and thus faster
output growth.
2.5 Gap Identification
The related studies presented give implicitly the researcher conducted on fiscal policy and
economic growth. Salami and Kelikume (2010) used annual data for the period 1970 to 2008 and
1980 to 2008 to estimate inflation (fiscal policy model for Nigeria. Bassey and Onwioduokit
(2011) used the framework of Li (2005) to investigate the relationship between inflation and
economic growth as well detected an appropriate model. Having established the presence of a
negative relationship, they identified a statistically insignificant threshold level of 18 per cent
and established that inflation rates below the threshold are growth propelling. Islam and Kamrul
(2016) As in other parts of the world, the appropriate fiscal policy response to a negative demand
shock in SSA depends on the size and nature of the shock, as well as country-specific
characteristics.vMost of these studies were conducted from other countries other than Uganda;
besides the studies which were conducted in Uganda were for periods before 2002 .therefore the
researcher intend to conduct a study in Uganda concentrating on fiscal policies and economic
growth in Uganda from 1985 to 2016.
CHAPTER THREE
METHODOLGY
3.0 Introduction
This is based on the research design, mode specification, variable measurement, data sources,
data analysis and ethical considerations in the research.
35
3.1 Research Design
A time series analysis was adopted an Ex-post facto design based on quantitative techniques to
analyze secondary data scientifically to critically conclude the research objectives, secondary
data was collected from different ministries. Ex post facto design is a quasi-experimental study
examining how an independent variable, present prior to the study, affects a dependent variable.
A true experiment and ex post facto both are attempting to say: this independent variable is
causing changes in a dependent variable. This is the basis of any experiment one variable is
hypothesized to be influencing another. This is done by having an experimental group and a
control group. The design is Ex post facto designs are used because the designs do not use
random assignment. Because the study used the already available published random data. The
design is intended to provide an elaborative assessment of the trend and the association of the
variables (Onwuegbuzie and Turner, 2007).
3.2 The Model Specification
In order to determine the effect of fiscal policy on economic growth in Uganda. This study
adopted a model based on neo-classical model and founded by Jorgenson (1983) that provide a
study on factors that affect the economic growth. The model is aimed at examining the channels
through which fiscal policy affect economic growth. The mode provides for tests for the effect
between fiscal policy and economic growth.
Consider an aggregate production function of the form,
In its most standard form for production of a single good with two factors, the function is
The regression equation is based on the economic growth that is determined by government
spending, government tax revenue and government non tax revenue. The economic growth in the
model driven is therefore guided by the assessment of the factors; therefore the regression
equation is guided by the factors mentioned above. The method that will be adopted by this study
is the multiple regressions with OLS technique of estimation. Themodel has been specified
which are excluded in the model. The assumption of the error term is absence of serial
correlation and heteroscedasticity.
36
3.3 Variable definition and Measurements
In our estimation equation, the dependent variable stands for growth rate of the economy; its data
is obtained from World development indicators published by World Bank on line. It is intended
to capture the role of the “catch up” effect of a country.
Fiscal policy is the means by which a government adjusts its spending levels and tax rates to
monitor and influence a nation's economy. It is the sister strategy to monetary policy through
which a central bank influences a nation's money supply
Economic growth is the increase in the level on goods and services of a country within a fixed
period of time; in this case economic growth was measured in term of Gross Domestic Product
expressed in the percentage change.
The economic growth is determined upon the factors such as balance of trade, imports and
exports that affect the growth of the economy. The variables measurements are determined based
on the definitions of economic growth by Coricelli, 1997 who provided for the measurements
based on the production function.
3.4 Nature and Sources of data
Secondary data was used in this study. The data used in this study was annual bulletin of World
Bank, OECD statistics, IMF. The data was transformed into log-level and first difference using
the following formula.
3.5 Data Analysis
3.5.1 Descriptive Analysis
Description of the variables during the data analysis involves a discussion of the descriptive
statistics of all these different data variables in the study. Different measures of central tendency
and spread of the dataset was used to present a view of the data so that preliminary analysis of its
nature was presented before an inference about the general populations for further results were
made using the results of the sample data at hand.
3.5.2Trend Analysis
The study employed line graphs to examine the trends of public expenditure, tax revenue, non
tax revenue and economic growth in Uganda. Trend analysis was used because it helps visualize
the movements and fluctuations of the data series from season to season.
37
3.6 Time series property of data
3.6.1 Unit Root Tests
In time series analysis, a great deal of attention was given to stationarity of the variables in order
to get rid of the problem of spurious regression. It is often said that most macroeconomic
variables follow a random walk model, i.e., exhibiting a unit root behavior. According to
Studenmund (2011), a random walk process can be identified as stationary when its mean and
variance are found to be constant across time, and the value of the covariance between the two
time periods is dependent on the lag between them and not the actual time of computing the
covariance. This study therefore, employed the stationarity analysis to test whether the mean and
variance of the stochastic term was a constant over time. The Augmented Dickey- Fuller (ADF)
test is appropriate.The ADF tests the null hypothesis that there exists a unit root in the time series
(non-stationary time series), which is H0: α=0 against the alternative hypothesis, H1: α <0, that
the time series is stationary (no unit root). A rejection of the null hypothesis under these tests
means the series does not have a unit root. Assumptions of the Classical regression model
necessitate that both the dependent and independent variables are stationary and the errors have a
zero mean and finite variance. Decisions are made basing on the t-statistic, that is to say, if the
absolute value of t-statistic is more than the critical values, then we reject the null hypothesis and
conclude that the series is stationary. On the other hand, if the absolute value of the t-statistic is
less e than the critical values, we fail to reject the null hypothesis and conclude that the series is
non-stationary. The critical values for this t-statistic are given in Mackinnon (1991).
3.6.2 Co-integration Analysis
The notion that there is a long-run tendency for fiscal policy to grow relative to GDP growth or
vice-versa has been an issue in economics that is rarely questioned. Thus, if the study variables
are considered as stochastic trends and if they follow a common long-run equilibrium
relationship, then these variables should be co-integrated. According to Engle and Granger
(1987), co-integrated variables must have a long run relationship. The main reason for the
popularity of Co-integration analysis is that it provides a formal background for testing and
estimating both short-run and long run relationships among economic variables
38
3.7 Regression Analysis
Regression analysis is a statistical process for estimating the relationships among variables. It
includes many techniques for modeling and analyzing several variables, when the focus is on the
relationship between a dependent variable and one or more independent variables while the other
independent variables are held fixed. In this case the regression analysis was based on assessing
the effect that real exchange rate and nominal exchange rate has on economic growth. The
analysis used simple regressions analysis to determine the effect of public expenditure, Tax
revenue and Non tax revenue rate on economic growth. The regression model is based on the
provision of
3.8 Diagnostic Tests
3.8.1 Serial Correlation Test
Serial Correlation is a correlation among members of the series of error terms ordered in time. It
is mainly caused by incorrect functional forms, auto regressions, manipulation of data, data
transformation and non-stationarity of the data (Wooldridge 2009: 274). Under this Durbin -
Watson d test and Breusch–Godfrey (BG) test.
3.8.2 Normality Test
In the literature, there are several tests for normality, this employed Jarque–Bera tests. The
Jarque–Bera test for normality was employed in this research. The Jarque -Bera test based on
OLS residuals mainly used in a large sample test. First, it requires calculating the Skewness and
Kurtosis and then measures the OLS residuals as.
3.8.3 Heteroscedasticity Test
One of the ordinary least squares and Regression Model assumptions is that the variance of
disturbance terms should be constant. As pointed out by Engle (1982). When the data is not
homoscedastic, although coefficients obtained from the regression analysis would hold, the
confidence intervals obtained from them would be extraordinarily large and as a result, would
affect further inference to be made about the data. In this study, Breusch Pagan Cook-Weisberg
test for Heteroscedasticity was used to test if the residuals from the regression model are
homoscedastic or no.
39
CHAPTER FOUR
PRESENTATION, INTERPRETATION AND ANALYSIS OF THE DATA
4.0 Introduction
This section presents a review of the data with an empirical analysis concentrating on the major
variables that were stated in methodology. The study used a combination of graphical and
empirical tools for carrying out the analysis in order to answer all the objectives that were
inherently stated in the previous sections of the study. The first section of the analysis involves
carrying out a comprehensive univariate analysis of each of the variables. This is intended to
40
discover any forms and nature of trends in the data prior to carrying out and in-depth analysis. It
involved the use of both the descriptive statistics. Further presentations involve the analysis of
association and the relationship between the variables. This is intended to discover any forms
and nature of trends in the data prior to carrying out and in-depth analysis. It involved the use of
both the descriptive statistics and graphics for summarizing the data.
4.1 Descriptive Statistics
The Table 4.1 presents the summary of descriptive statistic for the variables considered for
analysis namely GDP growth government spending, government tax revenue as well as
government non-tax revenue. It described the distribution of each variable with respect to
standard deviation, mean, minimum and maximum values for the 32 observations.
Source: Researcher, 2018
The findings from table 4.1 above show the descriptive analysis of public expenditure, Tax
revenue, Non tax revenue and economic growth of Uganda from 1985-2016. The results attained
on the mean, variance is, standard deviation, Skewness and Kurtosis are presented as shown
below.
As can be seen from the Table, the mean value for the public expenditure, tax revenue, non-tax
revenue, and GDP are23,27, 23, and 29 respectively. The standard deviation value for the public
expenditure, tax revenue, non-tax revenue, and GDP are1.54909, 1.42366,1.54909, and 2.10994
respectively. The skewness coefficients for the public expenditure, tax revenue, non-tax revenue,
and GDP are .71,(.009) 0.34,(.019) .71,(.008) and .26(.008) respectively. These suggest the series
are not skewed, given that the coefficients are all close to zero. The kurtosis coefficients for the
public expenditure, tax revenue, non-tax revenue, and GDP are 3.08(0.009), 2.96(019),
2.88(.008), 3.10(.008). The skewness and kurtosis coefficients indicate that the series are
approximately normally distributed. This is so given that the skewness of a normal distribution is
zero and the kurtosis of a normal distribution is three (Emenike, 2017).
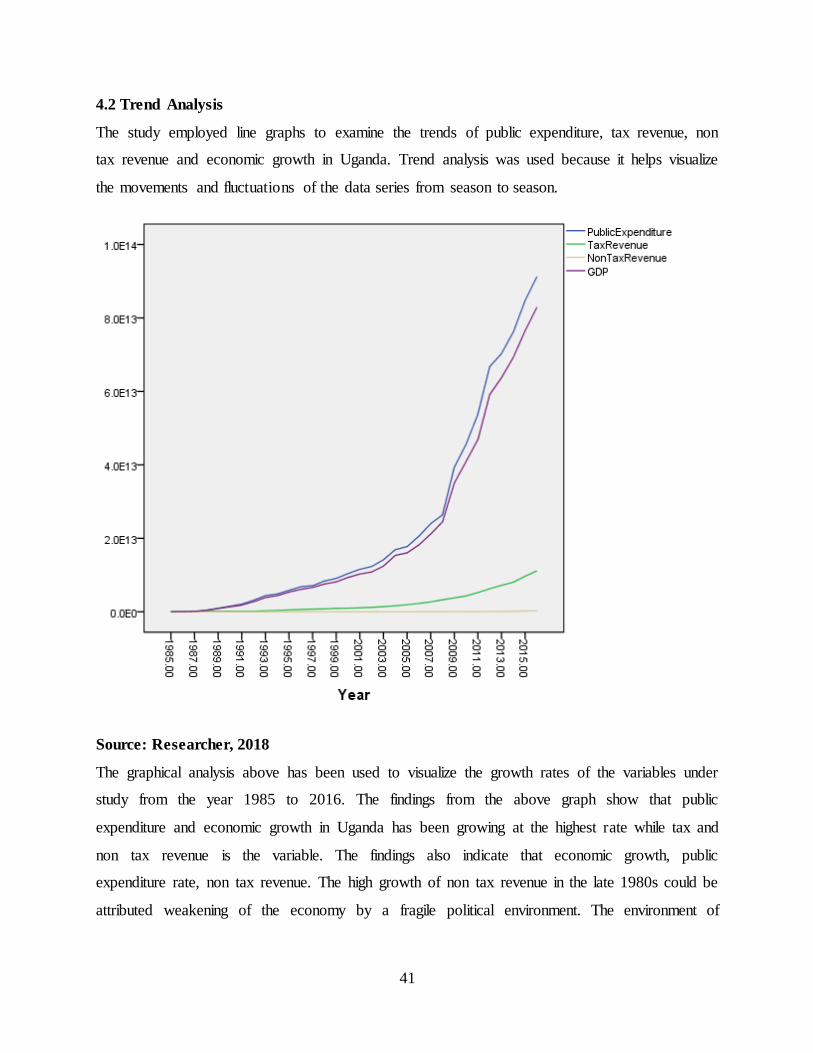
41
4.2 Trend Analysis
The study employed line graphs to examine the trends of public expenditure, tax revenue, non
tax revenue and economic growth in Uganda. Trend analysis was used because it helps visualize
the movements and fluctuations of the data series from season to season.
Source: Researcher, 2018
The graphical analysis above has been used to visualize the growth rates of the variables under
study from the year 1985 to 2016. The findings from the above graph show that public
expenditure and economic growth in Uganda has been growing at the highest rate while tax and
non tax revenue is the variable. The findings also indicate that economic growth, public
expenditure rate, non tax revenue. The high growth of non tax revenue in the late 1980s could be
attributed weakening of the economy by a fragile political environment. The environment of
42
public expenditure has been increasing over the past years, even the GDP in Uganda has been
increasing especially over the period from 2008 to 2015.
4.3 Time Series Property of Data
The study set to examine time series property of the data in order to establish if it is auto
correlated or its autoregressive. This was done in order to change the variables to stationary as a
key assumption in multiple linear regression analysis and other inferential statistics. Besides,
working with highly collinear variables would yield spurious result from which further inference
is insignificant. Unit root tests were conducted on all the variables using both the Augmented
Dickey-Fuller and Philips Perron test. In each case and accepting it would imply the data is non-
stationary. The alternative hypothesis is that the data has no unit root (stationary). The result of
ADF and Phillips-Perron unit root test are summarized in table provided below. Both tests are
tested at the 5% level of significance. The rejection criteria are that we reject the null hypothesis
if the computed ADF and PP tests statistic value are greater, in absolute value, than their 5%
critical tau values.
4.3.1 Test for structural breaks
The second objective of the study was to establish if there is a long run relationship among the
study variables for structural breaks. Co-integration method of analysis was used to establish if
there were structural breaks.
4.3.1 Co-integration Analysis.
In our study we check for co-integration using Johansen test. This test is based on maximum
likelihood estimation and two statistics: maximum eigenvalues and a trace statistic. The Null
hypothesis is that there is no Cointegration. A co-integration test is purposely done to check if
the variables have structural breaks given the many years of focus for the study. The results of
the co-integration analysis have been presented in the table below.
4.4 Regression Analysis of the variables under study
The variables were used for the regression analysis so as to minimize the chances of a model
suffering from the problems of autocorrelation, non-normal residuals as well as
heteroscedasticity. The findings are presented in the table below.
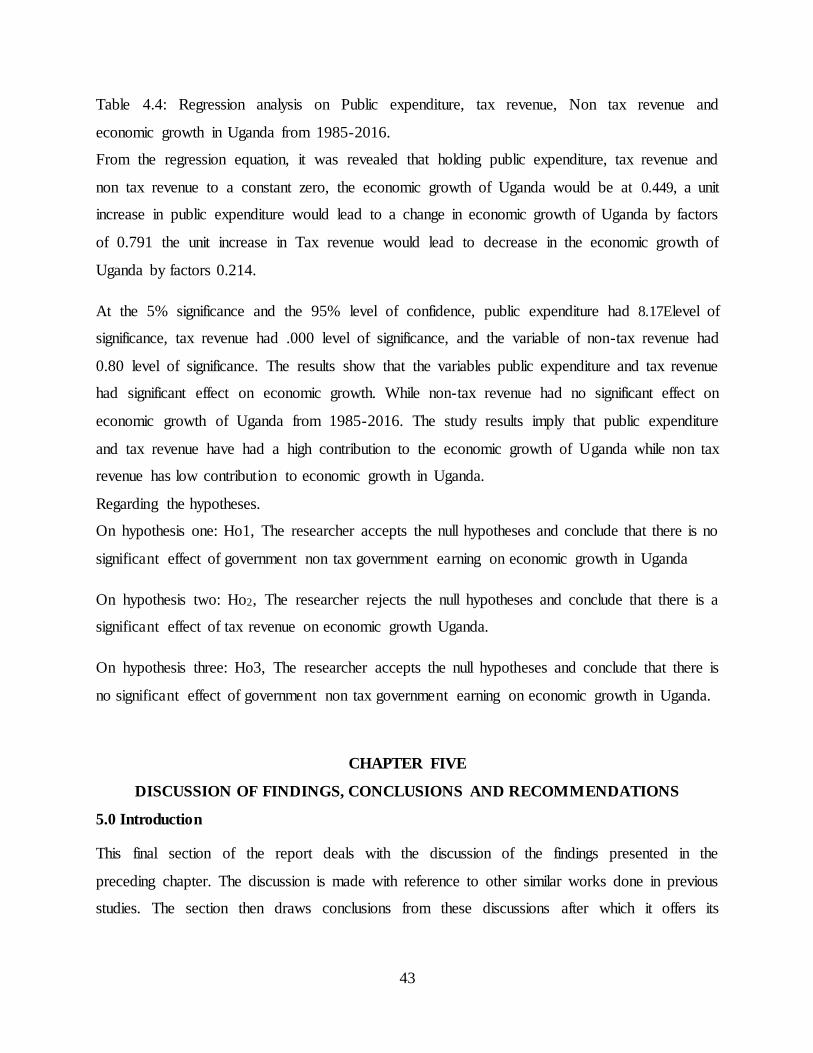
43
Table 4.4: Regression analysis on Public expenditure, tax revenue, Non tax revenue and
economic growth in Uganda from 1985-2016.
From the regression equation, it was revealed that holding public expenditure, tax revenue and
non tax revenue to a constant zero, the economic growth of Uganda would be at 0.449, a unit
increase in public expenditure would lead to a change in economic growth of Uganda by factors
of 0.791 the unit increase in Tax revenue would lead to decrease in the economic growth of
Uganda by factors 0.214.
At the 5% significance and the 95% level of confidence, public expenditure had 8.17Elevel of
significance, tax revenue had .000 level of significance, and the variable of non-tax revenue had
0.80 level of significance. The results show that the variables public expenditure and tax revenue
had significant effect on economic growth. While non-tax revenue had no significant effect on
economic growth of Uganda from 1985-2016. The study results imply that public expenditure
and tax revenue have had a high contribution to the economic growth of Uganda while non tax
revenue has low contribution to economic growth in Uganda.
Regarding the hypotheses.
On hypothesis one: Ho1, The researcher accepts the null hypotheses and conclude that there is no
significant effect of government non tax government earning on economic growth in Uganda
On hypothesis two: Ho2, The researcher rejects the null hypotheses and conclude that there is a
significant effect of tax revenue on economic growth Uganda.
On hypothesis three: Ho3, The researcher accepts the null hypotheses and conclude that there is
no significant effect of government non tax government earning on economic growth in Uganda.
CHAPTER FIVE
DISCUSSION OF FINDINGS, CONCLUSIONS AND RECOMMENDATIONS
5.0 Introduction
This final section of the report deals with the discussion of the findings presented in the
preceding chapter. The discussion is made with reference to other similar works done in previous
studies. The section then draws conclusions from these discussions after which it offers its
44
recommendations. Finally, it suggests areas that are potential grounds for research that could not
be completed in the body of this report.
5.1 Discussion of Findings
This section was further organized into three subsections with respect to the research objectives
that guided the study.
5.1.1 Effect of public expenditure on economic growth of Uganda
Through regression analysis, the study results reveal that government spending had a non
significant effect on economic growth in Uganda. The study results presented are never the less
in agreement with previous studies such as Foster and Mijumbi (2012) on the same ground found
a robust negative relationship between public expenditure and growth. The study was based on
advanced countries between 1970 and 1995. Their estimated coefficient suggested that a 10
percentage increase in government expenditure is associated with a decrease of 0.7 percentage
point in growth rate.
Mitchell (2015) argued that the American government expenditure has grown too much in the
last couple of years and has contributed to the negative growth. The author suggested that
government should cut its spending, particularly on projects/programs that generate least benefits
or impose highest costs. Mohanty (2014) argued that public expenditure and economic growth
have adopted either the aggregated or disaggregated approach. With respect to studies that adopt
the disaggregated approach, the general view is that public expenditure, notably on physical
infrastructure or human capital is growth enhancing, while government consumption is expected
to be growth retarding thus, the concept of productive and unproductive government expenditure
The study findings from this study in Uganda are in disagreement with those examined the effect
of government expenditure on economic growth for a sample of 96 countries. He found that
public expenditure exerts a negative effect on real output. Similarly Gilpin, 2001), employing the
Granger causality test, examined the relationship between government expenditures and
economic growth in Thailand and found that government expenditures and economic growth are
not co-integrated. The result also suggested that a unidirectional relationship, as causality runs
from government expenditures to growth. However, the result indicated a significant positive
effect of government spending on economic growth. The study results are in agreement Thirlwall
(2013) assessed the relationship between public expenditure in GDP and the growth in per capita
45
real GDP and found negative and significant relationship between the two. Using an endogenous
growth model of the U.S. economy in which government purchases directly affect both the utility
of consumers and the productivity of firms.
5.1.2 Effect of government tax revenue on the economic growth of Uganda
The study results on the effect of tax revenue on economic growth in Uganda reveal that
government tax had no significant effect on the economic growth of Uganda from 1985 to 2016.
The variation in tax revenue only accounted to economic growth by 0.001;the results indicate a
significant relationship between tax revenue and economic growth of Uganda. The results are in
congruence with Ogbonna and Ebimobowei (2012) examine the impact of Tax Reforms and
Economic Growth in Nigeria using relevant descriptive statistics and econometric analysis. They
found that various tax reforms are positively and significantly related to economic growth and
that tax reforms granger cause economic growth. On the same note Owolabi and Okwu (2011)
examined the contribution of only Value Added Tax (VAT) to development of Lagos State
Economy from 2001 to 2005. The study regressed each development indicator (infrastructural,
environmental management, education sector, youth and social welfare, agricultural, healthcare,
and transportation) on VAT revenue proceeds generated by Lagos State during the study period.
Their finding was that revenue generated from VAT positively contributed to the development of
the respective sectors of Lagos State economy during the period studied.
On the contrary however Kaldor (2011) argued that the country’s tax potential depended on per
capita real income, distribution of income, structure of the national economy, political and
administrative governance. According to the author, the developing country tax performance
would best be measured not by static indices such as tax ratios but by dynamic means such as tax
effort and income-elasticity of the tax regime. Even Lewis (2000) argued that governments tend
to avoid raising taxes because of the adverse political consequences and instead resort to printing
money or creating (easy) credit a monetary policy that leads to or fuels inflation. While taxation
may raise prices, depending on income and price elasticities, the development economic scholar
concluded that taxation was superior to inflation for a country’s capital formation. Akhor (2014)
stated that the economic effects of tax include micro effects on the distribution of income and
efficiency of resource use as well as macro effect on the level of capacity output, employment,
46
prices, and growth. Therefore, the use of tax as an instrument to achieve economic growth in
most less develops countries cannot be reliable because of dwindling level of revenue generation.
5.1.3 Effect of government non tax revenue on the economic growth of Uganda
The study results on the effect of Non tax revenue on the economic growth, the study results
reveal that non tax revenue earnings had an insignificant effect on economic growth of Uganda
for the period under the study, the study reveal that a unit change in non tax revenue earnings
only accounted for .355change to economic growth. The study results are in line with the
previous authors such as Mohanty (2014) assessed the importance of non-tax revenue is now
being realized by the sub-national governments in India in the context of revenue deficits and,
the heavy financial requirements for upgrading and modernizing basic infrastructure Therefore,
non-tax revenue is essential to finance the repair, maintenance and operations (MRO) of existing
capital assets that creates positive externalities as well revenue for the government
Even Kamin and Rogers (2017) assert that governments use fiscal policy to influence the level of
aggregate demand in the economy, in an effort to achieve economic objectives of price stability,
full employment, and economic growth. Keynesian economics suggests that increasing
government spending and decreasing tax rates are the best ways to stimulate aggregate demand,
and decreasing spending & increasing taxes after the economic boom begin
5.2 Conclusion
The study was set to examine the effect of fiscal policy on economic growth of Uganda from
1985 to 2016. The study focus was to examine the effect of public expenditure, tax revenue and
non tax revenue on economic growth of Uganda. The study conclude that public expenditure was
increasing over the period of the study, the results reveal that the public expenditure had a
significant effect on economic growth in Uganda the study conclude that public expenditure need
to be improved for attaining economic growth in Uganda.
The study findings on the second objective conclude that tax revenue was increasing over the
time and the effect was significant, the study concludes that the tax revue increase lead to
generation of values for the economy and need more comprehension for attaining economic
growth in Uganda.
47
The study finally established that the non tax revenue earnings had a low effect on the growth of
Uganda. The study results reveal that the non tax revenue did not much account for economic
growth of Uganda a probable issue could be that improvement of the non tax revenue or possibly
more reallocations can improve the economic growth. The study on overall concludes that fiscal
policy had high effect on economic growth in Uganda’s economic growth for Uganda from
1985-2016.
5.3 Recommendations
The study reveals that public expenditure had a significant effect on economic growth in
Uganda. There is need for government to improve tax administration as means for improving the
working environment. Expenditure on productive activity can trigger economic growth therefore
much emphasis need to focus on generating performance. There is need for government policy
ensuring quality and sustained growth that can potentially improve the pace of Uganda’s
economic advancement. There is need for enhancing the government expenditure on improving
the informal sector for generating economic growth in Uganda.
On the second objective tax revenue contributes to improved economic growth. Therefore
enterprising of the informal sector is needed for increasing the tax bases. There is need for
increasing revenue generation preferably through encouraging investments and supporting the
creation of small business that can yield capital in order to generate more tax revenue for
economic growth. There is need for enhancing the proper revenue usage of the taxes in the
country for infrastructure growth in order to generate the revenue for the country.
The third objective recommends that there is need for generation of non-tax revenue through
improving accessibility to the tourism sector and growth of the tourism sector including gazeting
the economic activity that generate the taxes. There is need for enhancing the diversity of an
environment that provides the need for revenue generation.
5.4 Areas of further research
The results presented in this thesis may not be conclusive and should be treated as being
preliminary. Further analysis of the survey data on fiscal policy and economic growth canbe
done to comprehend the findings and provide wider justification on explaining the fiscal policy
and economic growth. Other research need to be done in this field specifically on the following.
48
1. Government expenditure and economic growth in Uganda
2. Government earnings and economic growth for Uganda
3. Investments and economic growth in Uganda
4. Relationship between fiscal policy and investment growth
5.5 Contribution to Knowledge
One of the most prominent findings from this study is the fact that it has provided evidence to
support the Keynesian theory. Indeed, economic growth or GDP can significantly be increased
with public expenditure increase and tax revenue. This is one of the premises that are held by the
theory in question. Another important revelation that can be attributed to this study is that it is
now clear that an effective tax regime generates economic growth of a country. This is contrary
to common belief that taxes alone cannot generate growth. Finally, it has been established that
though non tax revenue didn’t contribute to GDP growth, it was because it was also low
otherwise increasing the non tax revenue is fundamental generator to economic growth.
To society, the study contributes a high level of focus for the many community members
especially exploring the mechanisms through which the community can benefit through
investments in the country.
The study can contribute to a high degree of policy implementation that can enhance the
management attributes to the management of the revenues and government expenditures in the
country’s mana gement stakes.
REFERENCES
Bloom, D., D. Canning, and Jaypee Sevilla. (2001). Canning, Mary, Martin Godfrey, and Dorota
Holzer-Zelazewska. (2006). “Financing Higher Education.” In Current Issues in Fiscal
Reform in CentralEurope and the Baltic States 2005, ed. Thomas Laursen. Washington,
DC: World Bank. “The Effects of Health on Economic Growth: Theory and Evidence.”
49
NBER Working Paper No. 8587, National Bureau of Economic Research, Cambridge,
MA.
Cashin, P. (1995) Taxes, Government Spending and Economic Growth.” IMF Staff Papers 42
(2): 237–69.
Chu, K. (1995). Unproductive Public Expenditures: A Pragmatic Approach to Policy Analysis.
IMF pamphlet series no. 48. Washington, DC: IMF.
Chu, Ke-young, and Gerd Schwartz. (1994). “Output Decline and Government Expenditures in
European Transition Economies.” IMF Working Paper No. 94/68, IMF, Washington, DC
Cooper, Donald R. & Schindler, Pamela S. (2006) Business Research Methods. New Delhi.
Coricelli, Fabrizio (2007). “Fiscal Policy: A Long-Term View.” In Fiscal Policy in Transition:
Forum Report of the Economic Policy Initiative No. 3. 39–52. London:Center for
Economic Policy Research Developing World.
Coricelli, Fabrizio. (1997) Fiscal Policy: A Long-Term View.” In Fiscal Policy in Transition:
Forum Report of the Economic Policy Initiative No. 3. 39–52. London:Center for
Economic Policy Research.
Das-Gupta, A (1990) Taxation, Non-Tax Policy and Capital Equipment Leasing , Economic
and Political Weekly 25 (May 1990): M88-M90.
Davoodi, H., and D. Grigorian. (2006). Tax Potential and Tax Effort: Factors Behind the
Stubbornly Low Tax Collection in Armenia.” Paper presented at “Armenia: Public Sector
Governance and Economic Efficiency” conference, World Bank, Washington, DC
Dholakia, Archana (2006).'Growth and Structure of Tax and Non-Tax Revenue of Gujarat',
Indian Journal of Regional Science, Vol 30, No 1.
Dillinger, William. (2006). Intergovernmental Fiscal Relations.” In Current Issues in Fiscal
Reform in Central Europe and the Baltic States 2005, ed. ThomasLaursen. Washington,
DC: World Bank.
Easterly, W., C. A. Rodriguez, and K. Schmidt-Hebbel (1994). Public Sector Deficits and
Macroeconomic Performance. Oxford and New York: Oxford UniversityPress for the
World Bank Economic Review 90 (5):1160–83.
Fölster, S., and M. Henrekson (2001). Growth Effects of Government Expenditure and Taxation
Gilpin, (2001) “On the causal directions between national income and government expenditure
of Canada.
50
Gregoriou and Ghosh (2007) The Effects of Health on Economic Growth: Theory and
Evidence.” NBER Working Paper No. 8587, National Bureau of Economic Research,
Cambridge, MA.
Gruber, Jonathan. (2016). The Incidence of Payroll Taxation: Evidence from Chile.” NBER
Working Paper No. 5053, National Bureau of Economic Research, Cambridge, MA.
Gujarati, D. N. (1995).Basic Econometrics”, United States Military Academy, McGraw-Hill
Illyas, M. and Siddiqi, M. W (2010). The Impact of Revenue Gap on Economic Growth: A Case
Study of Pakistan. International Journal of Human and Social Sciences, 5:11
International Finance Section.Reprinted in Peter B. Kenen, ed., (1993). The International
publishing company limited, New Delhi, Fourth Edition.
Islam M. R. and Kamrul H. A.F.M. (2006) “Does Government Expenditure Reduce GDP
Johansson, Å. (2008). Taxation and Economic Growth, OECD Economics Department Working
Papers, No. 620, OECD Publishing, doi: 10.1787/241216205486.
Johansson.A. et.al.(2008).Tax and Economic Growth.Economic Department Working Papers.
620
Kaldor, Nicholars (2011). Taxation for Economic Development”, Journal of Modern African
Studies. Vol. 1 1963.
Kalecki.Michal (2016).Essays on Developing Economies.Sussex: The Harvester Press Ltd.
Kamin, S. B. and J. H. Rogers (2017). Output and the real exchange rate in developing
Monetary System, Boulder, CO: West view Press.
Kamin, S. B. and J. H. Rogers 2000, “Output and the real exchange rate in developing Monetary
System, Boulder, CO: West view Press.
Kentor 1998, (2003). An autoregressive distributed lag modeling approach to co integration
analysis, in Econometrics and Economic Theory in the 20th Century: The Ragnar Frisch
Centennial Symposium, (Ed.) S. Storm, Cambridge University Press, Cambridge, pp. 1–
Ketema (2006) The Mystery of Capital: Why Capitalism Triumphs in the West and Fails
Everywhere Else. Basic Books
51
Keynes J. M. (1936).The General Theory of Employment, Interest and Money.London
Macmillan.
Kitov I.O, 2006, “GDP Growth Rate and Population” Institute for the Geospheres Dynamics,
Kitov I.O (2016) GDP Growth Rate and Population” Institute for the Geospheres Dynamics, the
state of the GDP growth for the country
Komain and Brahmasrene (2017) Determinants of Economic Growth: A Cross-Country
Empirical Study. MIT Press: Cambridge, MA.
Komain and Brahmasrene (2017) Determinants of Economic Growth: A Cross-Country
Empirical Study. MIT Press: Cambridge, MA.
Lee Y. & Gordon, R. (2005).Tax Structure and Economic Growth.Journal of Public Economics,
89, 1027–1043.
Lewis. W. Arthur (2015). Developing Planning.London: George Allen & Unwin Ltd.
Mahdavi, S. (2008). The Level and Composition of Tax Revenue in Developing Countries:
Evidence from unbalanced panel data. International review of Economics and Finance,
17,607-617
Mitchell (2005) Output Decline and Government Expenditures in European Transition
Economies.” IMF Working Paper No. 94/68, IMF, Washington, DC.
Mofidi, A. & Stone, J. (2005). Do State and Local Taxes Affect Economic Growth? Retrieved
from: p://www.jstor.org.proxy.lib.csus.edu/stable/pdfplus/2109611.pdf?acceptTC=tru e
Mohanty, A. (2014). Effectiveness in Management of Sub- national government Finance: An
Empirical Analysis for Odisha. Odisha Review. pp: 31-40.
Mugambe G. (2004) Economic overview -Uganda”
Mugume A. (2007). The Government Sector: Government Spending, Fiscal Deficits Makerere
Mugume A. (2007).The Government Sector: Government Spending, Fiscal Deficits”,
Makerere
Musgrave, R.A. and P.B. Musgrave (2004).Public finance in theory and practice. 5th Edn., New
Delhi: Tata McGraw.
Musgrave, R.A. and P.B. Musgrave (2004).Public finance in theory and practice. 5th Edn., New
Delhi: Tata McGraw.
52
Mussa, Michael, et.al. (2000) Exchange Rate Regimes in an Increasingly Integrated World
Ogbonna, G., & Ebimobower, A. (2012). Impact of tax (taxation) reforms on economic growth
in Nigeria: A time series analysis. Current Research Journal of Social Science, 4 (1), 62-68.
Okafor, R.G. (2012). Tax revenue generation and Nigerian economic development. European
Olugbenga and Owoye (2007) investigated the relationships between public expenditure and
economic growth for a group of 30 OECD countries during the period 1970-2005
Omole, A.And Falokun, G. (2009).The impact of interest rate liberalization on the
corporate financing strategies of quoted companies in Nigeria. AERC
Princeton University Press.
Owolabi, S.A. and A.T. Okwu, (2011). contribution to empirical evaluation of value added tax
to development of Lagos State economy. Middle Eastern Finance and Economics, 1(9): 24 –
34.
Popovici, O.C. & Călin, A.C (2014) FDI theories. A location-based approach", Romanian
Economic Journal, vol. 17, no. 53, pp. 3-24.
Poulson, B. & Kaplan, J. (2008).State Income Taxes and Economic Growth. Retrieved from:
http://www.cato.org/sites/cato.org/files/serials/files/catojournal/ 2008/1/cj28n1-4.pdf
Purohit, C.P and Purohit, V.K (2009): ‗Mobilising Non-Tax Revenue: An Empirical Analysis of
Trends in States‘, Economic and Political Weekly 44 (January 31): 54-62.
Romer, P. M. (1994).The Origins of Endogenous Growth: The Journal of Economic
Perspectives, 8 (1), 3–22.
.
Sáez and García (2006) Government Spending, Taxes, and Economic Growth.” IMF Staff
Papers 42 (2): 237–69.
Sakar (2007). Bounds Testing Approaches To The Analysis Of Level Relationships”. Journal of
Applied Econometrics.Econ. 16: 289–326 (2001). DOI: 10.1002/ jae.616
Samba, M., and Yan, Y., (2010). “Interest Rate Pass-through in the Central African
Economic Sill Keith.Managing the Public Debt. Federal reserve Bank of Philadelphia.
Schwellnus, C. & Arnold, J. (2008). Do Corporate Taxes Reduce Productivity and Investment at
the Firm Level? Cross-country Evidence from the Amadeus Dataset.OECD Economics
Department Working Papers.
53
Success, M.J., E.B. Success and M.S.K. Ifurueze (2012). The impact of petroleum profit taxation
on economic development in Nigeria. British Journal of Economics and Management
Sciences, 5(2): 60–70.
Thapa B. N. (2002) Econometric analysis of the Impact of Real Effective Exchange Rate on
economic growth in countries.
The World Bank Group (2004). Beyond economic growth an introduction to sustainable
development. Second edition. Available from http://www.worldbank.org [Accessed 28th
September 2015].
Thirlwall, A. P. (2013). Economic Growth in an Open Developing Economy: The Role of
Structure and Demand, Cheltenham: Edward Elgar
UNECA and AUC (2009) IMF, (2009).Working with Microfi t 4.0: Interactive Econometric
Analysis, Oxford University Press.
Emenike, K.O. (2017). Weak form efficiency after the global financial crisis; Emergingstock
Market evidence.Journal of emerging market finance, 16(1), 99-133.
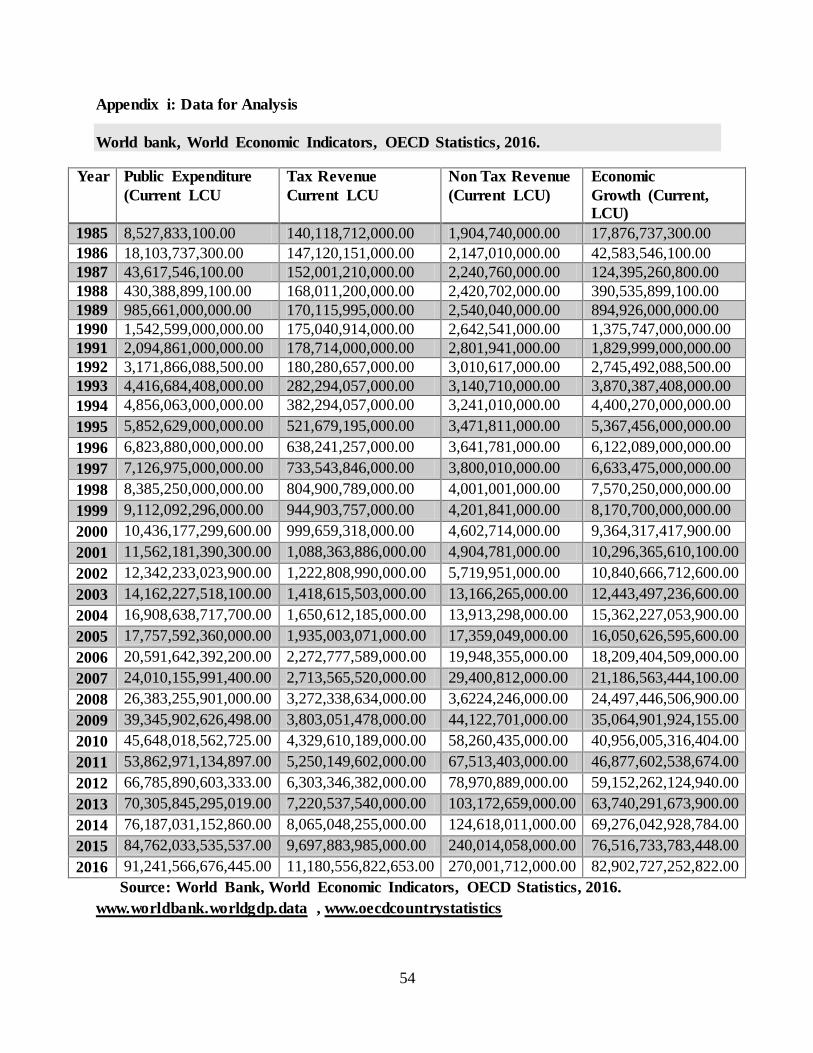
54
Appendix i: Data for Analysis
World bank, World Economic Indicators, OECD Statistics, 2016.
Year Public Expenditure
(Current LCU
Tax Revenue
Current LCU
Non Tax Revenue
(Current LCU)
Economic
Growth (Current,
LCU)
1985 8,527,833,100.00 140,118,712,000.00 1,904,740,000.00 17,876,737,300.00
1986 18,103,737,300.00 147,120,151,000.00 2,147,010,000.00 42,583,546,100.00
1987 43,617,546,100.00 152,001,210,000.00 2,240,760,000.00 124,395,260,800.00
1988 430,388,899,100.00 168,011,200,000.00 2,420,702,000.00 390,535,899,100.00
1989 985,661,000,000.00 170,115,995,000.00 2,540,040,000.00 894,926,000,000.00
1990 1,542,599,000,000.00 175,040,914,000.00 2,642,541,000.00 1,375,747,000,000.00
1991 2,094,861,000,000.00 178,714,000,000.00 2,801,941,000.00 1,829,999,000,000.00
1992 3,171,866,088,500.00 180,280,657,000.00 3,010,617,000.00 2,745,492,088,500.00
1993 4,416,684,408,000.00 282,294,057,000.00 3,140,710,000.00 3,870,387,408,000.00
1994 4,856,063,000,000.00 382,294,057,000.00 3,241,010,000.00 4,400,270,000,000.00
1995 5,852,629,000,000.00 521,679,195,000.00 3,471,811,000.00 5,367,456,000,000.00
1996 6,823,880,000,000.00 638,241,257,000.00 3,641,781,000.00 6,122,089,000,000.00
1997 7,126,975,000,000.00 733,543,846,000.00 3,800,010,000.00 6,633,475,000,000.00
1998 8,385,250,000,000.00 804,900,789,000.00 4,001,001,000.00 7,570,250,000,000.00
1999 9,112,092,296,000.00 944,903,757,000.00 4,201,841,000.00 8,170,700,000,000.00
2000 10,436,177,299,600.00 999,659,318,000.00 4,602,714,000.00 9,364,317,417,900.00
2001 11,562,181,390,300.00 1,088,363,886,000.00 4,904,781,000.00 10,296,365,610,100.00
2002 12,342,233,023,900.00 1,222,808,990,000.00 5,719,951,000.00 10,840,666,712,600.00
2003 14,162,227,518,100.00 1,418,615,503,000.00 13,166,265,000.00 12,443,497,236,600.00
2004 16,908,638,717,700.00 1,650,612,185,000.00 13,913,298,000.00 15,362,227,053,900.00
2005 17,757,592,360,000.00 1,935,003,071,000.00 17,359,049,000.00 16,050,626,595,600.00
2006 20,591,642,392,200.00 2,272,777,589,000.00 19,948,355,000.00 18,209,404,509,000.00
2007 24,010,155,991,400.00 2,713,565,520,000.00 29,400,812,000.00 21,186,563,444,100.00
2008 26,383,255,901,000.00 3,272,338,634,000.00 3,6224,246,000.00 24,497,446,506,900.00
2009 39,345,902,626,498.00 3,803,051,478,000.00 44,122,701,000.00 35,064,901,924,155.00
2010 45,648,018,562,725.00 4,329,610,189,000.00 58,260,435,000.00 40,956,005,316,404.00
2011 53,862,971,134,897.00 5,250,149,602,000.00 67,513,403,000.00 46,877,602,538,674.00
2012 66,785,890,603,333.00 6,303,346,382,000.00 78,970,889,000.00 59,152,262,124,940.00
2013 70,305,845,295,019.00 7,220,537,540,000.00 103,172,659,000.00 63,740,291,673,900.00
2014 76,187,031,152,860.00 8,065,048,255,000.00 124,618,011,000.00 69,276,042,928,784.00
2015 84,762,033,535,537.00 9,697,883,985,000.00 240,014,058,000.00 76,516,733,783,448.00
2016 91,241,566,676,445.00 11,180,556,822,653.00 270,001,712,000.00 82,902,727,252,822.00
Source: World Bank, World Economic Indicators, OECD Statistics, 2016.
www.worldbank.worldgdp.data , www.oecdcountrystatistics