ECONOMICS 8819/01 - Sg Test Paper
31
©ACJC2017 Preliminary Exam 8819/01 ANGLO-CHINESE JUNIOR COLLEGE 2017 JC2 PRELIMINARY EXAMINATIONS ECONOMICS 8819/01 Higher 1 Paper 1 14 August 2017 3 hours Additional materials: Writing Paper READ THESE INSTRUCTIONS FIRST Write your index number and name on all the work you hand in. Write in dark blue or black pen on both sides of the paper. You may use a soft pencil for any diagrams, graphs or rough working. Do not use staples, paper clips, highlighters, glue or correction fluid / tape. Section A Answer both questions. Begin each case study question on a fresh sheet of paper. Section B Answer one question. Begin the essay question on a fresh sheet of paper. At the end of the examination, fasten your answers for each question separately to the cover sheets provided. The number of marks is given in brackets [ ] at the end of each question or part question. This document consists of 7 printed pages. Please check that your question paper is complete.
Transcript of ECONOMICS 8819/01 - Sg Test Paper

1
©ACJC2017 Preliminary Exam 8819/01 [Turn over
ANGLO-CHINESE JUNIOR COLLEGE
2017 JC2 PRELIMINARY EXAMINATIONS
ECONOMICS 8819/01
Higher 1
Paper 1
14 August 2017
3 hours
Additional materials: Writing Paper
READ THESE INSTRUCTIONS FIRST
Write your index number and name on all the work you hand in.
Write in dark blue or black pen on both sides of the paper.
You may use a soft pencil for any diagrams, graphs or rough working.
Do not use staples, paper clips, highlighters, glue or correction fluid / tape.
Section A
Answer both questions.
Begin each case study question on a fresh sheet of paper.
Section B
Answer one question.
Begin the essay question on a fresh sheet of paper.
At the end of the examination, fasten your answers for each question separately to the
cover sheets provided.
The number of marks is given in brackets [ ] at the end of each question or part question.
This document consists of 7 printed pages. Please check that your question paper is complete.

2
©ACJC2017 Preliminary Exam 8819/01
Section A
Answer all questions in this section. Question 1
The Market for Higher Education
Table 1: Singapore government’s expenditure per student (Singapore Dollars)
2012 2013 2014 2015
Primary 7396 8549 9123 10,160
University 20,777 21,870 22,181 22,058
Source: Education Statistics Digest 2016, Ministry of Education
Extract 1: Singapore government’s spending on higher education There are compelling reasons to heavily subsidise higher education. Firstly, there are private returns such as higher employability and wages as well as positive social returns to higher education, in terms of lowering poverty and crime rates. Societies that have better educated populations tend to have lower crime rates, enjoy greater social cohesion and a well-educated labour force that is needed for long-term economic development. Secondly, there is a case for the government to intervene to ensure that there are equal opportunities. While it is generally feasible for individuals to fund their own tertiary education through loan schemes, the lower-income group may face credit constraints. Others may have heavy financial responsibilities that compel them to enter the labour market as soon as possible, rather than contemplate further education. Evidence also suggests that the lower-income group tend to underestimate the returns to education, due to lack of information and poor community role models. To encourage this group to take up higher education, the government provides financial assistance for higher education. There are also student and tuition fee loan schemes provided for the middle-income group at low interest rates. The Singapore government has always invested heavily in education and will continue to do so in future, with greater emphasis on developing higher education. This requires a careful balancing between strategic considerations, equity, and efficiency.
Source: Singapore Budget, 2010 Extract 2: Reduction in subsidies for university education in the UK A generation ago, students paid nothing for university education. In 2006, the fee cap for university education was £3,000. In 2012, the fee cap was raised further to £9,000. However, the vice-chancellor of Oxford University had recently expressed that the fee cap of £9,000 is insufficient to reflect the true cost of an Oxford degree at £16,000. Even with the raised fee cap, Oxford still faced an annual funding gap of £70 million. Moreover, Sir Christopher Snowden, president of Universities UK, says a £9,000 fee cap is still "not sustainable" for universities.

3
©ACJC2017 Preliminary Exam 8819/01 [Turn over
Universities UK will publish a report on the future of university financing. It will examine how universities will respond to rising birth rates, which means that the number of university places required will grow from 368,000 to 460,000. The cut in the level of government subsidies for universities will lead to students paying higher tuition fees but also eases the large government debt. However, the government said these changes would put the higher education sector on a more sustainable footing. They believe the £9,000 fee allows universities to deliver high-quality teaching, with many institutions now planning to invest more in improved teaching facilities for students.
Adapted from BBC, 1 Nov 2013 Extract 3: Higher education benefits the UK economy The higher education sector has significantly benefited the UK economy in many ways. Firstly, international students studying in London bring in far more money than they use in public services. Students coming to study in UK universities from outside the EU pay an average of £12,000 a year for an undergraduate degree. A 2015 report from London First, an organisation representing London businesses, showed that international students in the capital used £540 million of public services such as the NHS (National Health Services), but brought in over £2.8 billion to the economy through tuition fees, spending and hosting family and friends coming to visit – a net contribution of £2.3 billion. Secondly, four in ten young adults have a degree – and they can earn £9,000 more than those without a degree. The government’s latest statistics show the employment rate for working-age graduates, aged 25-34, is 87.5% – the highest level since the end of 2007. Thirdly, research collaborations between UK universities and business are worth more than £3.5 billion. There are currently 12,240 collaborative research projects between universities and businesses, including 368 in the arts and humanities, and 6,260 in engineering. The UK ranks fourth in the world for university-industry collaboration in research and development.
Source: The Guardian, 9 July 2015 Extract 4: Huge increase in number of graduates 'bad for UK economy' The huge increase in number of graduates is bad for students and employers, suggests Chartered Institute of Personnel and Development (CIPD). The government is being urged to end the political drive to get more people into university after research showed that the huge increase in the supply of graduates over the last 35 years has resulted in more occupations and professions being dominated by graduates. These include the banking, education, police and estate agency sectors in which jobs were mainly occupied by non-graduates in the past. The CIPD said the notion of a tertiary education premium is being called into question by graduates’ average debt of £44,000 and estimates that 45% of student loans would never be paid off. Noting that its research had shown more than half of the graduates take non-graduate jobs, the CIPD said the current system was not just bad for many of those who had been to university but also for non-graduates who were overlooked for jobs that did not require a degree.

4
©ACJC2017 Preliminary Exam 8819/01
Governments have been encouraging more and more students to pursue graduate qualifications. However, the research showed that for many graduates, the costs of university education outweigh its personal economic benefits. This is also undesirable for employers and the economy as mismatches, where graduates take up non-graduates’ jobs, can be associated with lower levels of employee engagement and loyalty. Firms may then incur greater hiring and training costs. Lower levels of engagement will also undermine the government’s attempts to boost productivity. There is the need for a much stronger focus on creating more high-quality alternative pathways into the workplace, such as higher level apprenticeships. CIPD called on ministers to improve the quality of careers advice to ensure young people are better informed about their future careers; a shift in emphasis on apprenticeships to make quality of courses a higher priority.
Source: The Guardian, 11 October 2016 Questions (a) With reference to Table 1, compare the government expenditure per student for
primary and university education from 2012 to 2015. [2] (b) With the aid of a diagram and using demand and supply analysis, explain two reasons
for the expected increase in UK’s university tuition fees. [4] (c) (i) With the aid of a diagram and with reference to Extract 1, explain how social
outcomes associated with higher levels of educational attainment can lead to market failure. [6]
(ii) Comment on whether Singapore should follow the UK’s cut in subsidies for
university education. [6] (d) (i) With reference to Extract 4, explain how the increasing number of graduates is
“bad for (graduate) students and employers”. [4] (ii) Discuss the view that the huge increase in number of graduates is undesirable
for the UK economy. [8]
[Total: 30]
5
©ACJC2017 Preliminary Exam 8819/01 [Turn over
Question 2:
Imbalances in the United Kingdom and China economies
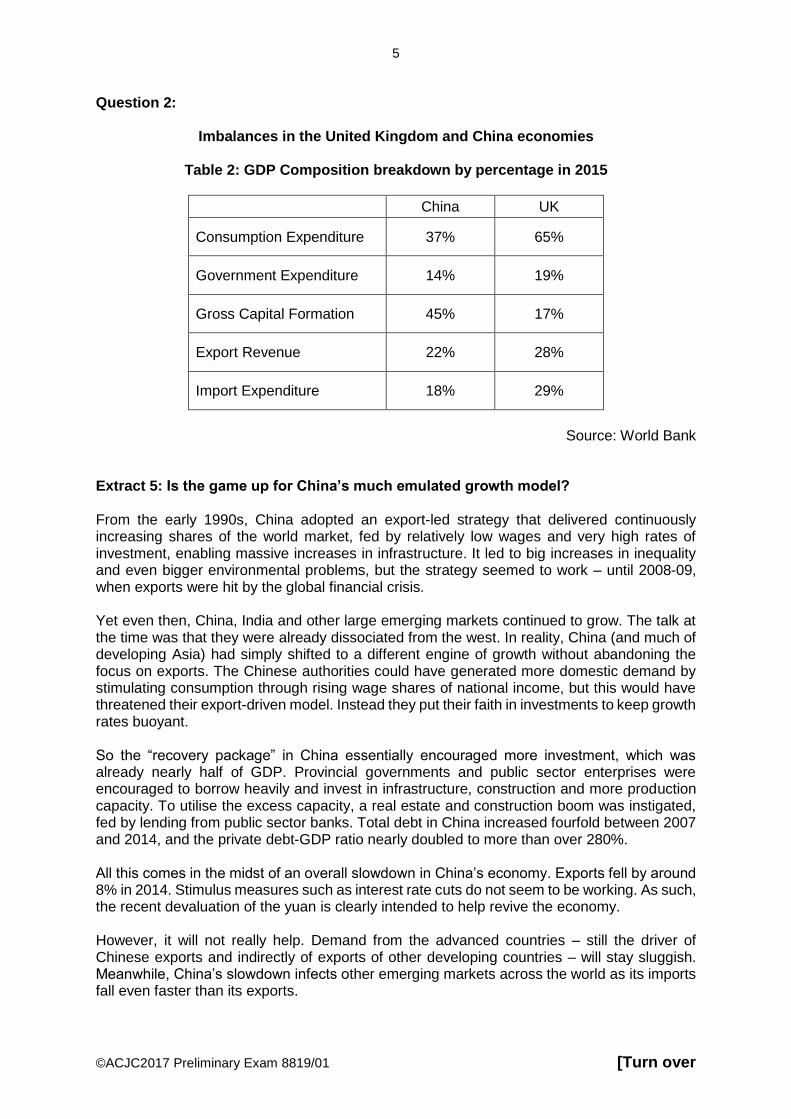
Table 2: GDP Composition breakdown by percentage in 2015
China UK
Consumption Expenditure 37% 65%
Government Expenditure 14% 19%
Gross Capital Formation 45% 17%
Export Revenue 22% 28%
Import Expenditure 18% 29%
Source: World Bank
Extract 5: Is the game up for China’s much emulated growth model? From the early 1990s, China adopted an export-led strategy that delivered continuously increasing shares of the world market, fed by relatively low wages and very high rates of investment, enabling massive increases in infrastructure. It led to big increases in inequality and even bigger environmental problems, but the strategy seemed to work – until 2008-09, when exports were hit by the global financial crisis. Yet even then, China, India and other large emerging markets continued to grow. The talk at the time was that they were already dissociated from the west. In reality, China (and much of developing Asia) had simply shifted to a different engine of growth without abandoning the focus on exports. The Chinese authorities could have generated more domestic demand by stimulating consumption through rising wage shares of national income, but this would have threatened their export-driven model. Instead they put their faith in investments to keep growth rates buoyant. So the “recovery package” in China essentially encouraged more investment, which was already nearly half of GDP. Provincial governments and public sector enterprises were encouraged to borrow heavily and invest in infrastructure, construction and more production capacity. To utilise the excess capacity, a real estate and construction boom was instigated, fed by lending from public sector banks. Total debt in China increased fourfold between 2007 and 2014, and the private debt-GDP ratio nearly doubled to more than over 280%. All this comes in the midst of an overall slowdown in China’s economy. Exports fell by around 8% in 2014. Stimulus measures such as interest rate cuts do not seem to be working. As such, the recent devaluation of the yuan is clearly intended to help revive the economy. However, it will not really help. Demand from the advanced countries – still the driver of Chinese exports and indirectly of exports of other developing countries – will stay sluggish. Meanwhile, China’s slowdown infects other emerging markets across the world as its imports fall even faster than its exports.

6
©ACJC2017 Preliminary Exam 8819/01
A weaker yuan is bad news for export-oriented economies like Singapore, Hong Kong, South Korea and Taiwan as their exports will be more expensive to Chinese buyers. Their exports to other countries will also have to compete against Chinese rivals who have the advantage of a weaker currency. This is not the end of the emerging markets, but is – or should be – the end of this growth model. Relying only on exports or debt-driven bubbles to deliver rapid growth cannot work for long. For developing countries to truly “emerge”, a more inclusive strategy is essential.
Sources: The Guardian, 23 August 2015 and The Straits Times, 7 January 2016 Extract 6: New economic crash fears as British families run £40 billion deficit. British families are on course to spend £40 billion more than they earn this year, fuelling fears that the country’s economic growth is based on soaring levels of debt and could easily collapse. The forecast by the independent Office for Budget Responsibility (OBR) led to warnings that the UK could be heading towards a credit crunch similar to that of 2008 because of unsustainable levels of borrowing and household spending. Five years ago, UK households were comfortably not in debt, running a surplus of £70 billion as Britons tightened their belts in the wake of the financial crash and put money aside to save. But the new OBR figures show households are now deeply in debt, as growing economic confidence has led to a national spending spree. There is a real risk that millions of families will face serious hardship if interest rates start to rise. A Bank of England study found that the average mortgage debt in Britain rose from £83,000 in 2014 to £85,000 this year. Unsecured debt, which includes credit card charges, personal loans, student loans and utility bills, stands at around £8,000 per household.
Source: The Independent, 21 December 2015 Extract 7: UK trade deficit widens to four-year high. UK’s trade deficit last year was the widest since the alliance of political parties came to power, dealing a blow to the government’s drive to rebalance the economy away from consumer spending. Forecasting the outlook for this year, economists said exports would come under pressure from a stronger pound and a slowdown in important markets, especially the UK’s main trading partner, the Eurozone. The Eurozone remains unlikely to see much of an acceleration in growth in 2015, particularly given the uncertainty being generated by the prospect of a Greek exit from the single currency area. In addition, economic expansion is expected to continue cooling in China over the medium term, weighing down on export prospects there. Chris Leslie, the shadow chancellor, said: “Britain needs a serious strategy to help exporters – this means redoubling efforts to boost productivity, tackling infrastructure obstacles, addressing the skills deficit and ensuring innovators can access the funds they need.”
Source: The Guardian, 6 February 2015

7
©ACJC2017 Preliminary Exam 8819/01 [Turn over
Table 3: UK Government debt (percentage of GDP)
Year 2010 2011 2012 2013 2014 2015
Government debt (% GDP)
76.0 81.6 85.1 86.2 88.1 89.0
Source: IMF
Questions
(a) (i) With reference to Table 2, which component of GDP contributed the most for UK
and for China in 2015? [2] (ii) With reference to Extract 5 and 6, account for your answer in a(i). [4] (b) Explain what determines the impact of a devaluation in Yuan on a Chinese exporting
firm’s revenue. [4] (c) With reference to Extract 5, explain how an interest rate cut could have helped to
revive China’s economy and suggest one possible reason why it did not work. [4] (d) With the help of an AD/AS diagram, explain why attempting to increase consumption
in China would “threaten their export-driven model”. [6] (e) With reference to Extract 6, explain how households’ standard of living in the UK may
be affected if interest rates were to rise. [2] (f) Assess the effectiveness of the UK government’s proposed strategy of boosting
exports to reduce the trade deficit. [8]
[Total: 30]
Section B
Answer one question from this section.
Begin this section on a fresh sheet of paper. 3 (a) Explain the demand and supply factors that affects the price of alcohol. [10]
(b) Discuss the view that governments should ban the consumption of alcohol. [15] 4 (a) Explain the main causes of high inflation rates in Singapore. [10] (b) Discuss whether fiscal policy is the best policy for the Singapore government to
achieve low and stable inflation rates. [15]

1
©ACJC2017 Preliminary Exam 8819/01 [Turn over
H1 Economics 8819 Paper 1 Question 1: Suggested Markscheme
Question 1: The Market for Higher Education
(a) With reference to Table 1, compare the government expenditure per student for primary and university education from 2012 to 2015. [2]
Both government expenditure per student for primary level and university havegenerally increased from 2012 to 2015. [1]
Government expenditure per primary school student is always lower thanuniversity expenditure per student. [1]
OR
Both government expenditure per student for primary level and university havegenerally increased from 2012 to 2014 but for 2015, university expenditure perstudent has fallen while expenditure per primary school student continued toincrease. [1]
(b) With the aid of a diagram and using demand and supply analysis, explain two reasons for the expected increase in UK’s university tuition fees. [4]
With references to Extract 2,
The increase in birth rates in UK leads to the rise in demand for universityeducation increase in DD (shift right from DDo to DD1) [1]
Cut in government subsidies for universities leading to higher COP foruniversities. Decrease in SS (shift left from SSo to SS1) [1]
A shortage (of (QssQdd amount at initial price level of Po) will occur in themarket [1] lead to an increase in price of university education (from Po to P1)
Diagram [1]
1m – DD factor 1m – SS factor 1m – price mechanism linking to shortage 1m – diagram
(c) (i) With the aid of a diagram and with reference to Extract 1, explain how social outcomes associated with higher levels of educational attainment can lead to market failure. [6]
[6]
Diagram to show how positive externalities associated with higher

2
©ACJC2017 Preliminary Exam 8819/01
educational attainment can lead to under consumption and market failure (assume: no negative externality, thus MPC = MSC)
With reference to the extract, explain the positive external benefits
that arise from higher educational attainment and relate it to the third parties.
o According to Extract 1, higher level of educational attainment can lower poverty and crime rates, creating a society that is more cohesive and safer for households. It also improves the quality of the labour force that is beneficial for economy long-term economic development, improving the standard of living of the future generations as well. These are some of the external benefits to the third parties.
Explanation of the market equilibrium o Individuals who seek to attain higher level of education only take into
account their private benefits (such as the higher employability and wages earned) and private costs (such as the tuition fee for higher level education, time needed to graduate from higher educational etc.)
o Thus the market equilibrium is at MPC = MPB, where level of university places taken up/ number of university students is at Qm
Explanation of the socially optimal equilibrium o However, these individuals do not account the external benefits
related to higher level of education attained o Due to the external benefit incurred, MSB > MPB o The socially optimal equilibrium is at MSC = MSB, where level of
university places taken up/ number of university students is Qs
Under-consumption and welfare loss o However, at QM, MSB>MSC. This implies that the society’s welfare
is not maximised at QM. Hence, there will be a deadweight loss of the shaded areaABC. The increase in the number of students beyond Qm up to Qs will increase the net society’s welfare.
o Thus if left to the market, the number of university students will remain at 0Qm. There will be an under-consumption of higher education of QmQs and the market fails.

3
©ACJC2017 Preliminary Exam 8819/01 [Turn over
Level Descriptors Marks
L3 A well-developed answer with good reasoning.
Clear and accurate economic analysis
Good use of relevant examples from the case study to support the explanation.
5 – 6
L2 Under-developed answer. Points are stated but lack coherent reasoning
Economic analysis contains some conceptual errors
Some attempt to use examples from case study and relate to the context.
3 – 4
L1 Descriptive answer with no economic analysis
Many conceptual errors.
1 – 2
(ii) Comment on whether Singapore should follow the UK’s cut in subsidies
for university education. [6]
Approach: Students should consider the reasons for the subsidies made by the Singapore govt. Based on extract 1, subsidies on higher education sector require a careful balancing between strategic considerations, equity, and efficiency. These considerations could differ from what the UK govt based their decision to cut their subsidies on, however. Thus, on evaluation, cutting the subsidies would also entail a review of these considerations in the Singapore context. Argument for: Singapore should cut subsidies 1 Extent of private returns to higher education, as compared to external
benefits: Considering that there are private returns of higher employability and wages (Extract 3) to higher education, it may be possible that current subsidy levels are too high. If students are to gain from higher education, then they should be willing to pay a larger proportion of the fees. The govt may have overestimated the size of external benefits of higher education. A cut in subsidies would lower the quantity of places available in universities, and possibly lead to a better allocation of resources. [Students to insert diagram to illustrate possible over-subsidy of higher education]
2 High subsidies may lead to an overconsumption of higher education
places, which would then lead to an over-supply of graduates. This could mean that the Singapore economy would have to be able to absorb the increase in graduate workers with sufficient capacity and opportunities for graduate-level jobs. If not, it could result in under-employment or, in an economic crisis, high unemployment. Thus to prevent this, a cut in subsidies would reduce the number of university places and reduce the rate of increase in graduates.
3 Improved range of courses by universities: Reducing subsidies would
mean that universities would have to increase their fees for some consumers, or be more strategic in their offering of courses.
a. Higher fees are viable as higher income consumers now have better ability to pay and thus do not need to be subsidised at the same level as those with lower income

4
©ACJC2017 Preliminary Exam 8819/01
b. Consumers are more knowledgeable about higher education courses, and are more discerning about their choice of university courses to attain their dream career.
Thus, universities can be allocatively more efficient with the reduced subsidies if they offer courses that consumers are willing and able to pay for.
4 Similar to the UK economy, the opportunity cost of subsidizing higher
education could be high, considering that there are other priorities in the economy, for example caring for the aging population, improving public infrastructure on healthcare and transportation, and budgeting for industry transformation programmes.
Counter- Argument: Singapore should not cut subsidies 1 Consideration of efficiency and equity: Extent of market failure
caused by positive externalities and the income gap As expressed in extract 3, market failure exists in the market for higher education. Thus, there is a case for government to subsidize.
The extent of subsidies so far has generated a large pool of skilled and educated workforce, which has contributed immensely towards the economic progress of the country. This shows that the external benefit are large and continues to be enjoyed by the economy
The govt has to also consider the need to support the aspirations of the lower income group through subsidizing their participation in higher education.
2 Strategic consideration of economic progress and competitiveness:
Expenditure figures in Table 1 show that the amount spent by the govt per university student is more than double that of expenditure on primary school students.
Considering that universities have to deliver high quality education to prepare the people for the future economy, a cut in subsidies could place them in danger of having to cut corners, employ low quality teaching staff and reduce intake of students.
There could also be a reduction in the range of courses that students can choose from. As an education hub, this would make the sector less attractive to investors and potential private institutions.
Considering the need for labor to continue to be highly skilled for the future economy, subsidizing higher education should continue
3 Strategic consideration of fiscal capacity:
From Extract 1, UK govt decided to cut subsidies in order to ease their debt. This might not be the case for the Singapore govt. Unlike the UK govt, the govt of Singapore does not have a large debt and historically have a healthy budget balance through the govt prudent spending. This provides them with a strong ability to continue subsidizing higher education, even at its present level to achieve its social and macroeconomic goals.
Evaluative judgement Overall, the level of subsidies that the government gives to universities should be high enough to sustain their quality of education. While it can be argued that the private benefits gained by consumers are high and thus should be

5
©ACJC2017 Preliminary Exam 8819/01 [Turn over
privately financed, the economic benefits to the economy of a highly educated and skilled workforce far outweigh the economic costs of the subsidies given. The Singapore government does have that fiscal ability to continue subsidizing higher education.
Level Descriptors Marks
L3 Reasons for the subsidies are well analyzed, and placed within the context of the Singapore economy.
Answers draw from the data as well as from their knowledge of the Singapore economy.
Answers have a balanced view regarding whether the Singapore govt should reduce subsidies or continue with the current level.
Answer provides judgement that is based on analysis.
5-6
L2 There is a lack of depth of analysis regarding the reasons to implement subsidies in education.
Use of data is sporadic and inconsistent.
Answer has some inaccurate concepts.
Answer provides some judgement but is sporadic and brief, at times with no justification and economic analysis.
3-4
L1 Descriptive answer with no economic analysis
Many conceptual errors
1-2
(d) (i) With reference to Extract 4, explain how the increasing number of
graduates is “bad for (graduate) students and employers”. [4]
Students:
Rise in SS of graduates entering the non-graduates labour market leads to fall in wages for the graduates and non-graduates this can adversely affect their standard of living. [1]
Evidence: Extract 4 mentioned that the graduates have to take up jobs that do not require a degree. [1]
OR
Students might not be able to pay off their education loans due to these students taking on non-graduate jobs which offer lower wages lead to reduction in ability to consume and may also be under financial stress fall in standard of living. [1]
Evidence: Extract 4 mentioned that more than half of the graduates actually took on non-graduate jobs, the graduates’ average debt is around £44,000 and it is estimated that 45% of the student loans would never be paid off. [1]
Employers:
Graduates taking on mismatching jobs relative to their qualification may be less committed at work and may not remain loyal to the company more likely to leave company/ job-hop firms may incur higher cost of training worker, which may lower its profit margin [1]
Evidence: Extract 4 mentioned that firms may incur greater hiring and training costs. [1]
2m each for students and employers – for identification of the reason – for explanation of the reason

6
©ACJC2017 Preliminary Exam 8819/01
(ii) Discuss the view that the huge increase in number of graduates is undesirable for the UK economy. [8]
Approach: Answer should explain the two views of how the increase in graduates can be both undesirable and desirable to UK economy before providing an explained judgement of the likely outcome for UK economy. Argument: Increase in graduates can be undesirable to UK economy 1. Rise in number of graduates may worsen UK’s unemployment (unN)
rate
There are insufficient jobs to absorb the huge increase in SS of graduates into the labour market resulting in some graduates taking on jobs that do not require a degree (under-utilisation of labour resources) and putting some non-graduates out of jobs creating the issue of under-employment as graduates are over-qualified for the non-graduate jobs as well as structural unemployment given that there are insufficient matching jobs (both higher-skilled and lower-skilled jobs to absorb all labour) in the economy.
The rise in unemployment can also result in greater strain on UK’s government budget as more welfare spending such as unemployment benefits would be needed. Thus, less government spending can be allocated for other projects such as spending on healthcare, education or infrastructure-based development that could improve UK’s future EG.
Evidence: Extract 4- Research showed that the huge increase in the supply of graduates over the last 35 years has resulted in more occupations and professions being dominated by graduates. These include the banking, education, police and estate agency sectors in which jobs were mainly occupied by non-graduates in the past.
2. Rise in number of graduates may worsen UK’s inequity issue
Increase in SS of labour in non-graduate job market due to graduates seeking for non-graduate jobs result in falling wages in the lower-skilled job markets lead to widening of income gap between the labours in the high-skilled and lower-skilled job markets.
In addition, the fall in household disposable income for labours in non-graduate jobs fall in purchasing power fall in C fall in AD fall in real national income resulting in material SOL of unemployed graduates and non-graduates worsening and compromising macroeconomic goals; causing negative EG and increase in demand-deficient unemployment.
3. Rise in number of graduates may slowdown future EG
Increase in graduates taking non-graduate jobs lead to these graduates being discouraged as there is lack in opportunities to develop and master higher level skills that will enable them to become expertise in their fields slowdown in productivity growth slowdown increase in LRAS hinder UK’s potential EG.
In addition, the issue of brain drain may occur as the unemployed graduates may move out of UK in search of better jobs fall in labour force size fall in production capacity fall in LRAS hinder UK’s

7
©ACJC2017 Preliminary Exam 8819/01 [Turn over
potential EG.
Evidence: Extract 4- Lower levels of engagement will also undermine the government’s attempts to boost productivity
Counter- Argument: Increase in graduates can be desirable to UK economy 1. Rise in number of graduates can increase X- revenue
Number of international students in higher education may increase too increase spending by foreigners in many UK’s sectors, including tourism, healthcare and education sectors rise in X rise in AD increase in real national income actual EG and lower demand-deficient unemployment due to more labour hired for increase in production of goods and services.
Evidence: Extract 3- Tuition fees, spending and hosting family and friends coming to visit – a net contribution of £2.3bn.
2. Rise in number of graduates can increase in I
Higher education sector provides greater opportunities for firms to carry out research projects with universities create more job opportunities for graduates not only prevent the issue of under-employment (where graduates take on non-graduate jobs) and thus alleviate inequity issue, it also encourages the growth in productivity and innovation higher I rise in AD and LRAS increase in real national income and economy maximum production capacity respectively actual EG and potential EG sustained EG as well as lower demand-deficient unemployment due to more labour hired for increase in production of goods and services.
Evidence: Extract 3 - research collaborations between UK universities and business are worth more than £3.5 billion
3. Rise in number of graduates can increase in C
Graduate jobs provide higher income higher disposable income higher purchasing power hence increase C rise in AD increase in real national income improve SOL and achieve macroeconomic goals, such as actual EG and lower demand-deficient unemployment due to more labour hired for increase in production of goods and services.
Evidence: Extract 3 - Young adults with degree can earn £9,000 more than those without a degree.
Evaluative judgement:
In general, having increase in graduates can be beneficial to UK economy. However, if the increase in graduates is not matched with sufficient graduate jobs created, it would be undesirable for UK economy.
Thus, in order for the higher education sector to stimulate UK economy in the long run, UK would need to ensure that the job market offers sufficient matching jobs for the graduates while also ensuring that the graduates are equipped with the relevant skills required by firms.
o This means, more communication need to be established between the schools and the firms. Perhaps, universities need to encourage greater partnership between universities and firms enabling graduates to develop soft skills and possess higher level of apprenticeships (extract 4).
Looking into the future, UK universities should also start to explore ways to balance its rise in COP while continuously aim to provide high-quality

8
©ACJC2017 Preliminary Exam 8819/01
teaching. The increase in fee cap excessively may eventually lead to UK being a less popular location for some international students in the future. If so, it may dampen X- earnings contributed by the international students slowdown future actual EG.
Level Descriptors Marks
L3 A well-developed answer with good AD/AS reasoning linking to macroeconomic aims.
Clear and accurate economic analysis
Good use of relevant examples from the case study to support the explanation.
5 – 6
L2 Under-developed answer. Points are stated but lack coherent AD/AS reasoning linking to macroeconomic aims.
Economic analysis contains some conceptual errors
Some attempt to use examples from case study and relate to the context.
3 – 4
L1 Descriptive answer with no economic analysis
Many conceptual errors.
1 – 2
E2 Judgement provided is supported with reasoning. For instance, answer may explain the circumstances that the rise in graduates from higher education institutions can be desirable to UK economy.
2
E1 Judgement provided is unsupported. 1
[Total: 30]
1
©ACJC2017PreliminaryExam8819/01
H1 Economics 8819 Paper 1 Question 2: Suggested Mark Scheme
(a) (i) With reference to Table 2, which component of GDP contributed the most for UK and for China in 2015? [2]
Consumer expenditure contributed the most to GDP for UK. [1]
Investment expenditure contributed the most to GDP for China. [1]
(ii) With reference to Extract 5 and 6, account for your answer in a(i). [4]
Extract 6: Growing economic confidence in the UK economy [1]
Causes a “national spending spree” because consumers have higher expectations offuture income [1]
OR higher household income leading to greater purchasing power OR low interestrates leading to lower cost of borrowing to purchase consumer goods
Extract 5: Chinese government decided to encourage more investments to sustaineconomic growth rates [1]
Increase accessibility to loans Increase in lending large increase in investmentexpenditure [1]
OR low interest rate / ease of credit for firms
2 marks each for identifying and explaining for each country
(b) Explain what determines the impact of a devaluation in Yuan on a Chinese exporting firm’s revenue. [4]
Impact is determined by the price elasticity of demand for the goods [1]
Devaluation of Yuan causes Chinese goods to be cheaper in terms of other currencies[1]
If PED>1 such as for goods with many substitutes, a fall in price causes a greater thanproportionate increase in quantity demanded, thus total revenue increases. Oppositeis true for goods with PED<1 such as necessities [2]
1 mark for identifying the determinant 1 mark to explain change in price of goods 2 marks to explain how changes in price and quantity affect revenue
(c) With reference to Extract 5, explain how an interest rate cut could have helped to revive China’s economy and suggest one possible reason why it did not work. [4]
Explain interest rate cut
Decrease in i/r lower cost of borrowing and increase returns to savings [1]
Increase C and I [1]
Increase AD economic growth [1]
Possible reasons why it did not work [1 mark for any one reason well explained]
Poor confidence in the economy increase in I will not encourage C and I asconsumers and firms are more cautious in their spending
Saving culture in China consumers unwilling to spend even with lower interest rate.
Private firms already have a high level of debt from past investments may not wantto borrow and further increase debt even if interest rates are low.

2
©ACJC2017PreliminaryExam8819/01
(d) With the help of an AD/AS diagram, explain why attempting to increase
consumption in China would “threaten their export-driven model”. [6]
To encourage increase in C, government would have to raise wage shares of national income, so that consumers would have greater ability to consumer goods.
However, rising wages would result in increase in cost of production for firms. There would be a fall in SRAS resulting in cost push inflation and increase in price of exports.
As price of exports increases, there is a loss in export competitiveness. China may experience a fall in export revenue.
As exports fall, AD will fall. Overall, there would be slower economic growth. (Note: students need not shift AD to the left. With same AD curve, students can still show rise in GPL and fall in real GDP.
Level Marks
L3 Well-developed explanation of how increase in wages will increase cost of production and decrease AD and AS
5-6
L2 Some analysis on how rising wages may affect export revenue
May have missing links or incomplete explanations
3-4
L1 Wrong analysis
No application to Extract 5: o Students who explain that increase C will cause demand pull
inflation and reduce X competitiveness
1-2
(e) With reference to Extract 6, explain how households’ standard of living in the
UK may be affected if interest rates were to rise. [2]
Rise in interest rate debt burden rise or need to repay a greater debt [1]
Increase in amount needed to service debt purchasing power fall, less ability to consume goods SOL fall [1]
(f) Assess the effectiveness of the UK government’s proposed strategy of boosting exports to reduce the trade deficit. [8]
Students can introduce answer by briefly explaining meaning of trade deficit. Analysis of UK’s proposed strategy boost exports: Students must identify the various strategies from the Extract
(Evidence: boosting productivity, addressing skills deficit, tackling infrastructure obstacles) reduce unit labour cost lowers price of exports improve price competitiveness of UK exports UK export revenue rise (assuming price elastic demand) reduce UK trade deficit
(Evidence: innovators access to capital) government’s financial support for innovation product or process innovation reduction in unit production costs or new products could lead to lower price or quality products reduce PED (non-pricing, branding strategy, niche-marketing) increase demand of UK exports rise in export revenue reduce UK trade deficit
Counterargument: Possible constraints that could cause UK proposed strategy to be ineffective

3
©ACJC2017PreliminaryExam8819/01
(Extract 7) Stronger pound (appreciation) will make UK exports more expensive in foreign currency price competitiveness due to the lower unit labour production cost may be eroded (assuming demand is price elastic)
(Extract 7) Slowdown in economic growth in UK’s major trading partners (Eurozone, China) falling household income, lower consumption (including imports) UK exports to these countries may fall.
Skills training to raise labour productivity may encounter resistance from both employees and employers. Impact on labour productivity can also be seen only in the LT
Financial support for Innovation requires long incubation period unpredictable outcome even in LT
(Table 3) Given UK’s debt increasing to almost 90% of GDP, UK govt may not be able to provide adequate financial support for innovation (sustainability of this strategy is questionable)
Possible Judgement
Proposed strategy seems to be ineffective in the ST as intended outcomes can only be seen in the LT
Unintended consequences likely to arise rendering it ineffective o High UK import expenditure (% of GDP)
Unless the high UK Consumption and import expenditure (% of GDP) can be reduced, any rise in export revenue may not lead to fall in trade deficit. Rise in export revenue may lead to rise in AD, ec growth, spurring rise in import demand. Hence UK govt needs to consider reducing import expenditure as well.
o Lack of public support Public support for Skills training to upgrade labour productivity would only be politically acceptable provided govt provides subsidy for such training to both workers (cost of training + loss of income during training) and employers (loss of labour service) requires heavy govt funding.
o Increased Govt debt High UK govt debt made it difficult for govt to sustain support for innovation and skills training
o Trade policies of trading partners UK trading partners likely to undertake trade policies (protectionism) or exchange rate policies (depreciation) erode competitiveness of UK exports.
Possible complementary measures to increase effectiveness of proposed measures: Expenditure reducing measures or depreciation of currency. (Note: these other measures are only relevant after students have analysed UK proposed strategies identified in the extract).
Level Marks
L2 Well-developed explanation of how UK’s proposed strategy could correct the trade deficit AND the constraints that will limit its effectiveness. A balanced answer with supporting evidence.
5 - 6
L2 Balanced answer but superficial explanation of how strategy works to correct the trade deficit and constraints.
No / Inadequate evidences cited incidentally.
One-sided answer.
3 - 4
L1 Brief statements of effectiveness / ineffectiveness of UK proposed strategies
Many conceptual errors
1 - 2

4
©ACJC2017PreliminaryExam8819/01
No reference to extracts / context
E Make a reasoned judgment on whether UK strategy is likely to be effective
1 - 2

3 (a) Explain the demand and supply factors that affect the price of alcohol. [10]
(b) Discuss the view that governments should ban the consumption of alcohol. [15]
a) Explain the demand and supply factors that affect the price of alcohol. [10]
Suggested Approach
Introduction
Acknowledge that prices are determined by forces of demand and supply
Identify the possible demand and supply factors that could affect the price of alcohol
Different types of alcohol i.e wine, beer, hard liquor
Body
(STUDENTS SHOULD SELECT THE MORE APPROPRIATE FACTORS WHICH ARE
APPLICABLE TO ALCOHOL)
Demand factors
a) Taste & preferences
Due to strong marketing efforts and innovative marketing campaigns to promote theconsumption of various alcoholic drinks, this has resulted in an increase in demand foralcohol.
For e.g in 2016, leading players such as Asia Pacific Breweries Ltd launched innovativemarketing campaigns to create excitement amongst consumers, tapping into the use ofculture and food pairing. For instance, Tiger beer conducted a marketing campaignentitled uncagestreetfood to celebrate the local street food culture. Through a series ofhawker dining events, consumers were able to pair their local food with the brand. Thishas resulted in an increase in demand for alcohol.
b) Household income
Due to growing affluence, more people are willing and able to spend more on luxuryitems such as wine, thus resulting in an increase in demand for alcohol. However, foralcoholic drinks such as beer could be seen as an inferior good. Hence when there is anincrease in income, there will be a fall in demand for beer.
Likewise, when there is poor economic outlook, consumers show more discretion in theirspending and cut down on their demand for alcohol such as wine.
For e.g there is a slowdown in growth in total volume of alcoholic drinks sold inSingapore 2016 due to pessimistic consumer sentiments.
Supply factors
a) Government policy
Due to government policy such as taxes on alcohol producers, this has increased theircost of production thus causing supply to decrease. This is seen in Singapore where it raised excise duties on alcohol by 25%.

b) Increase in number of producers
Due to lower barriers to entry into the market for alcohol due to new distribution channels such as online shopping, this has led to an increase in supply of alcohol as these products are becoming more readily accessible to consumers. For instance, the number of internet wine retailers such as Vinomofo is increasing due to the lower set-up and operating cost. Moreover, internet retailers are importing a wider range of wine brands, thus increasing supply of alcohol.
Putting supply and demand factors together
In terms of supply, the implementation of a large amount of taxes is likely to outweigh the entry of new producers, causing supply for alcohol to decrease.
Hence the increase in demand and decrease in supply is likely to lead to an increase in prices. This will lead to a shortage of alcohol. This shortage will put an upward pressure on the price of alcohol, causing price of alcohol to increase.
Level Descriptors for Essay Question 3(a) Marks
L3 Well-developed explanation of both demand and supply factors affecting price of alcohol
Use of adjustment process to explain the change in price.
Answer supported by examples and well-contextulised to market for alcohol
8-10
L2 Undeveloped explanation of demand and supply factors that affected price of
alcohol
OR
Developed explanation of demand or supply factors affecting price of alcohol
Limited use of examples.
5-7
L1 Mostly irrelevant
Theoretical answer without contextualising to market for alcohol
Conceptual inaccuracies.
Mere listing of factors
1-4
b) Discuss the view that governments should ban the consumption of alcohol. [15]
Suggested Approach
Candidates are required to explain why there is a need for governments to intervene through
the imposition of a ban by explaining the market failure due to presence of negative
externalities in the market for alcohol. Candidates are then required to explain how the ban
of consumption of alcohol can help to reduce the market failure and evaluate its
effectiveness and if the government should implement other measures instead.
Development of ideas
Thesis: Governments should consider banning consumption of alcohol.
Explain reasons for government intervention in the market for alcohol

Consumers of alcohol will only consider their marginal private cost (MPC) and marginal
private benefit (MPB) in consuming alcohol. The private cost of alcohol consumption
includes the price of alcohol while the private benefit includes the satisfaction from
consuming alcohol, such as being able to de- stress. If left to the free market, consumers
would be consuming up to the quantity where their MPB equates MPC at Qe, as shown in
Fig 1 below.
In addition, there are also negative externalities associated with alcohol consumption.
Examples of the external cost are the harm/violence towards the surrounding members of
the public as the drinkers become easily aggravated and lost control of themselves. The
surrounding members of the public may need to bear treatment cost as a result of the
assault. In addition, when those who drink drive, their negligence may result in accidents;
even fatal ones, as stated in the preamble. The cost inflicted on other road users or
pedestrians are the treatment cost or even cost associated with loss of lives.
Due to the presence of external costs, there is a divergence between marginal social cost
(MSC) and marginal private cost (MPC). At the level of consumption in the free market, the
marginal social cost is greater than MSB. Society values an additional unit of alcohol less
than what it costs society to consume it. The socially optimum level of consumption is at Qs,
where MSB=MSC. There’s therefore a situation of over-consumption, resulting in a
deadweight loss as shown by the shaded area. Society’s welfare is not maximised at Qe.
There’s a need to allocate less resource to the consumption of alcohol until the socially
optimum level of consumption could be attained at Qs. There’s a need for the government to
intervene to ensure this outcome.
Transition: One form of regulation is to ban alcohol consumption. This, however, should be considered for implementation only if it improves societal welfare.
Explain how a ban on consumption of alcohol will lead to an efficient allocation of resources
A complete ban on consumption of alcohol will reduce consumption of alcohol to zero. This will lead to an efficient allocation of resources if the socially optimal quantity of consumption
Fig 1
MSC
MPC
MPB = MSB
Quantity of alcohol
Cost/Benefit
Qe Qs
A
B
C
D
F

is at zero as well. This will directly restrict the access of alcohol to consumers and reduces the external cost on members of the public. An example is seen in a prohibition law in Bihar, one of India’s poorest, most agrarian states. The law imposes a maximum sentences of seven years for drinking alcohol and life in prison for making it. This has resulted in crime rates to have fallen sharply, reducing the negative externalities. In addition, if the extent of external cost is large, it is administratively easier to just ban the activity to reduce market failure. Anti-thesis: Government should not completely ban the consumption of alcohol.
Argument 1: Explain why a complete ban on consumption of alcohol may not lead to an efficient allocation of resources
(i) Underconsumption in the market for alcohol
With reference to Fig 1, the welfare loss as a result of the decision of consumer is given by area ABC. Banning alcohol consumption will reduce the level of consumption to zero. However, for units up to Qs, the marginal social benefit is higher than the marginal social cost. Not allowing the consumption of these units implies a welfare loss given by the area FDA. Hence, banning alcohol consumption totally can lead to a bigger welfare loss.
In fact, when the extent of the costs is not yet known like the case of production of toxic chemicals, banning the production or consumption is usually not rational from the perspective of the society and hence is usually not implemented.
EV: Having said that, it may still be recommended to ban alcohol consumption to some degree up to socially optimal quantity of consumption, Qs. For instance, a ban can be implemented for those below a certain age. For example, in Singapore, the legal minimum age is 18. Another form of banning alcohol consumption could be in the form of restricting the hours for which alcohol can be purchased. For example, with effect from 1st April 2016, between 10.30pm to 7am, drinking is prohibited in public places and retailers are prohibited to sell alcohol in Singapore, since most of the external cost to third parties are inflicted during the stated hours, the external cost such as disturbances on members of the public is directly curbed with certainty; given proper enforcement of the law. Other form of banning alcohol consumption can be in terms of designated areas in a country. In Singapore, Liquor Control Zones, places associated with excessive drinking and hence higher risk of having public disorder, have been drawn to ban alcohol consumption. (ii) Other reasons Besides the consideration of welfare loss, there are other reasons for regulator not to ban the product. Banning a product that is habitually consumed good may cause public outcry. It can also further tarnish the country’s reputation to be a country with little rights. But more importantly, it can result in an important source of government revenue as high taxes tend to be associated with demerit goods. In addition, banning the consumption requires strict enforcement for it to be successful, which may require a lot of resources to be channeled into it.
Transition: A ban on alcohol consumption should only be considered for implementation only if it improves societal welfare. Otherwise, less drastic measures such as taxes and other forms of legislation should be recommended.

Argument 2: Explain alternative measures which governments can adopt in the market for alcohol and discuss why there might be no need for such a drastic measure such as a ban of consumption of alcohol.
(i) Taxes: The government can also impose on producers a tax equal to level of MEC at the
socially optimal level. Because of the imposition of this tax, producers will reduce supply and
pass on part of this increase in costs to consumers, which will result in a higher price of
alcohol. This will shift the MPC upwards, causing the external cost to be internalized as price
of alcohol will increase from Pm to Ps. This would reduce the consumption of alcohol to the
socially efficient level and remove the deadweight loss indicated in the figure below. If the
taxes is able to correct the market failure, the government should not impose a total ban on
alcohol consumption.
The revenue collected from taxes could also be used to fund public projects to create more
awareness of the harm from excessive consumption of alcohol. This would be necessary to
continue to curb the issue in the long run. On the other hand, legislations like a ban is costly
in its enforcement. There’s a need to mobilise resource such as police patrols to monitor and
ensure that the legislation is adhered to. This would put a strain on the government budget
instead, and perhaps the resource could have been better channelled elsewhere.
(ii) Moral Suasion: Government can take on the role of an information provider to persuade people to change their drinking habits. For example, posters and advertisements seek to inform and heighten consumers’ awareness on the costs of drink-driving in Singapore and to advise the population to stay away from alcohol if they are driving. Hence if current measures such as taxes and moral suasion are working, there is no need for government to implement such a drastic measure such as a ban on consumption of alcohol.
Conclusion
In conclusion, some degree of banning can be helpful in reducing external costs and removing consumers who would grossly underestimate their private costs from the market. These measures, however, should be supplemented with both moral suasion and indirect tax to better deal with market failure problem especially given that there is no one measure that is most superior.
EV: Taxation and legislation could be ‘blunt’ tools as they do not discriminate between
Qty
MPC,
MSC MSC
MPC
MPB = MSB
Ps
Pm
Qs Qm O
A
B
C D
MPCt

responsible and irresponsible drinkers (social & binge drinking). The ban or higher prices of
alcohol applies to all drinkers whether they generate external costs or not.
EV: In the long run, the government may need to reduce its extent of regulation and taxation
and rely on provision of information to change drinking habits of the population. Improvement
in provision of information to the public through campaigns, enables drinkers to factor in the
true costs of consumption to themselves, their family members and society and would hence
be a more sustainable way to curb this problem in the long run, instead of continuing to drain
the government resource on enforcement of legislation such as a ban.
Level Descriptors for Essay Question 3(b) Marks
L3 Well-developed and balanced analysis which covers the following:
o Reason for government intervention: correct identification of source of market failure in the consumption of alcohol
o Intervention in consumption of alcohol is necessary but may not be necessary to ban it completely
o Evaluation of alternative methods of intervention
Well-supported with relevant examples which are contextualised to the market for alcohol
9-11
L2 Undeveloped OR one-sided analysis on:
o Source of market failure in the consumption of alcohol
o How a ban in consumption of alcohol may lead to an efficient allocation
of resources
Lack application to the context of market for alcohol
5-8
L1 Answer is mostly irrelevant and contains only a few valid points made incidentally to the ban of alcohol consumption
Answer not supported by economic reasoning
Conceptual inaccuracies
1-4
Evaluation
E2 For an answer that arrives at an analytically well- reasoned summative conclusion assessing the effectiveness of a ban on consumption of alcohol Relevant criteria/conditions identified for evaluation. Students can consider: Feasibility and practicality of banning consumption of alcohol Sustainability of a ban on alcohol consumption
Benefits and costs of imposing a ban on alcohol consumption
3-4
E1 Some attempt at evaluation or making a summative conclusion but not consistently using economic analysis.
1-2

4 (a) Explain the main causes of high inflation rates in Singapore. [10]
(b) Discuss whether fiscal policy is the best policy for the Singapore government to achieve low and stable inflation rates. [15]
a) Explain the main causes of high inflation rates in Singapore. [10]
Suggested Approach
Introduction
Define Inflation and identify the types of inflation – cost-push and demand-pull
Explain causes of cost-push and demand-pull inflation in Singapore which could be
due to both domestic and external factors.
Context of Singapore:
o Prone to demand-pull inflation as the economy is operating close to full
employment.
o As Singapore is a small open economy, external demand is likely to be larger
than domestic demand, so demand-pull inflation is more likely to be externally
driven rather than domestically driven.
o With no natural resources and a limited land area, Singapore is highly reliant
on imports of food and fuel, so cost push pressures are more likely to come
with higher prices of such goods.
o In general, given Singapore's high dependence on imports of food and fuel,
Singapore is arguably more susceptible to cost-push inflation rather than
demand-pull inflation
Body (1) Demand-pull inflation
Causes of demand-pull inflation
Rising exports due to growing affluence of trading partners
In an export-oriented economy like Singapore, demand pull inflation is very likely due tostrong external demand.This could be due to rising global growth or high global expectations and consumerconfidence in the global market. High global growth higher income and hencestronger purchasing power. Also boost business confidence boost export revenue andforeign investments into the country drive up AD and hence GPL.
AS
P1
P2
P3
AD1
AD2
AD3
Q1 Q2 Real Output
General
price level

Government budget deficit (implies expansionary fiscal policy) i.e. the government’s increasing its spending and imposing tax cuts and subsidies, perhaps to stimulate the economy during economic slowdown or to achieve higher economic growth
Expansionary DD-management policies to increase growth will lead to inflation in the face of structural rigidities in the country. When direct taxes are reduced, consumers have more disposable income, causing consumer expenditure to increase. Lower corporate taxes will attract more investments, thus the increase in consumer expenditure and investment AD rises, hence this will lead to higher general price levels.
Thus, there is a rise in aggregate demand shown by a rightward shift of AD curve from AD1 to AD2. Assuming Singapore is operating near full employment, there will be a shortage of final goods and services which exerts upward pressure on GPL. GPL continues to rise until shortage is eliminated. The persistent increase in the general price level services from P0 to P1 depicts demand-pull inflation. (2) Cost-push inflation
Causes of cost-push inflation Tight domestic labour market
Singapore is facing ageing population and falling fertility rates which has led to falling
labour force participation. To supplement labour shortages, Singapore has been relying
on foreign workers especially for the low-end industries. However, the government has
raised foreign worker levies and reduced foreign worker quotas in recent years as one of
its productivity-raising strategies.
Since productivity-raising measures take several years to bring about an overall
reduction in production cost, competition for scarce workers in the tight labour market
has caused wages and labour costs to rise. Rising unit labour cost in recent years has
been caused by wage levels rising more than productivity. Productivity level in Singapore
in general has been stagnant.
Diagram below illustrates the fall in SRAS (leftward shift) due to the rise in wages. As a
result, GPL has increased from P1 to P2 due to businesses passing on cost pressures to
consumers in order to protect profit margins.
General Price Level
Real National Output
AS0
AD
P0
Y0 0
AS1
P1
Y1Y2

Domestic government policies
Singapore’s rising labour costs are mainly due to government policies – higher levy on foreign workers and higher employers’ contribution to workers’ CPF accounts
E.g., Singapore tightened foreign worker policies in recent years
Increase in foreign worker levies + reduction in Dependency Ratio Ceiling (DRC) higher cost of labour higher COP Singapore’s falling birth rate and increasing reliance on foreign workers significant impact expected for increase in COP passed on in the form of higher prices of g/s increase GPL significantly
Heightened restrictions in entry requirement for foreigners fall in SS of workers in Singapore drive up wages higher COP passed on in the form of higher prices of g/s increase GPL significantly
(3) Imported inflation For countries with an open economy like Singapore, inflation is most likely due to external reasons, for example a sudden rise in the cost of crude oil or other imported commodities, foodstuffs and beverages.
The high inflation in Singapore in 2008 was mainly due to rising oil and food prices, which are mainly imported. The oil and food prices caused global inflation imported inflation in Singapore as most of the imported goods prices rises due to the rising inflation in the countries they were produced.
Depreciation of currency rising import prices in domestic currency in an open economy heavily dependent on imports, leads to an increase in the prices of imported products such as essential raw materials, components and finished products rising inflation
Conclusion
The causes of inflation in a country may come from both the demand and the supply-side of an economy and may even arise from internal and external events. The main causes of inflation in different countries may differ from one another depending on factors such as the openness of the economy, the size of its domestic market, the level of dependence on external market and domestic market and even the objectives of the government.
Level Descriptors for Essay Question 4 (a) Marks
L3 Conceptually accurate and well-developed explanation on at least 2 causes, how demand and supply-side factors lead to rising inflation in Singapore.
Causes encompasses both domestic and external causes and should consider both demand-pull and cost-push inflation.
Good use and explanation of AD/AS diagrams as conceptual framework
Well-contextualised to Singapore
8-10
L2 Well-developed analysis of factors contributing to either demand-pull or
cost-push inflation OR
Undeveloped analysis of factors contributing to both demand-pull and
cost-push inflation
Very limited reference to Singapore context
5-7
L1 Major conceptual errors in analysis
Absence of conceptual analysis
1-4

b) Discuss whether fiscal policy is the best policy for the Singapore government to achieve low and stable inflation rates. [15] Suggested Approach Candidates are required to explain how fiscal policy can help Singapore to achieve low and stable inflation rates in Singapore. Even though it can help to mitigate demand-pull inflation. It does not address various source of inflation in Singapore such as imported inflation and persistent labour shortages. Candidates are required to compare the policies in evaluating which is the best policy in achieving low and stable inflation rates in Singapore. Introduction
Objective of government: achieve low and stable inflation rates –inflation rates about 1-3%
Price stability is important to Singapore’s economy as it is the basis for maintaining export
competitiveness and providing a positive business environment to achieve healthy and
sustained economic growth.
Identify key characteristics of Singapore’s economy – highly reliant on exports, capital
inflow and foreign talents to sustain economic growth.
“best policy” –Most effective/Most appropriate for Singapore? Body Thesis: Fiscal Policy is an important policy that Singapore can adopt to achieve low and stable inflation rates.
Contractionary fiscal policy involves dampening AD directly by cutting government spending or indirectly by raising direct taxes to reduce investment and consumption o Higher corporate taxes reduce post-tax profit, which lowers investments. o Higher personal income taxes reduce disposable income, which lowers consumption. o Fall in AD Fall in domestically-led DD-pull inflation
For e.g In order to prevent further price escalation in public housing in 2009, a series of
measures such as higher property taxes have been introduced to dampen speculative
housing demand which would then help to curb rising prices in public housing market.
However, Contractionary fiscal policy is not useful for Singapore because of a very small multiplier. This is due to a high marginal propensity to save caused by high compulsory social security savings. (i.e. CPF) Singapore also has a high marginal propensity to import resulting from a lack of natural resources. Thus large tax hikes and/or large cuts in public spending are required to achieve a significant impact. Hence such measures are probably too politically unpopular to implement in reality.
Also, a budget surplus (G<T) causes a net withdrawal from the circular flow of income,
AD falls hence depressing economic growth.
Transition: While contractionary fiscal policy is able to curb domestic sources of DD-pull inflation, it does not address external sources of inflation.
Anti-thesis: Fiscal policy may not be the best policy but there are other policies which are effective in helping Singapore to achieve low and stable rate of inflation.
Alternative policy 1: Exchange rate policy
For many years, exchange-rate centred monetary policy has been the standing policy used by the Singapore government to alleviate inflationary pressures. it has been highly effective in curbing imported inflation and externally-led demand-pull inflation.

o With appreciation of Sing dollar, export prices in foreign currency would have
increased (since PED for the sum of imports and exports > 1), causing net
exports (X-M) to fall. As a result of Singapore relying heavily on external
demand due to her small domestic market size, her composition of AD shows
that X is one of the key AD components contributing to inflation. Therefore by
reducing X and hence AD, externally-led demand-pull inflation can be curbed.
o An appreciation of the exchange rate causes the prices of imported consumer
goods to fall, thus households benefit directly from being able to buy such
goods at lower prices
o Appreciating the Sing dollar will help to lower firms’ cost of importing global
commodities and hence reduce their cost of production stabilizes domestic
prices maintains Singapore’s attractiveness to FDI and foreign talents.
o For example, there was a global rise in rice prices in 2011 due to flooding of
rice crops in Thailand, one of the world’s largest rice producing country. The
MAS responded by maintaining a strong Sing dollar and this was effective in
keeping rice prices stable in Singapore.
Nevertheless, as Singapore’s export competitiveness will be lowered, appreciation of
Sing dollar cannot be overly relied on, especially when there is a need to adopt
substantial appreciation of the Sing dollar to address strong externally-led demand-pull
inflation.
Transition: However, exchange rate appreciation does not address supply-side
constraints. In addition, with Singapore moving toward a service-driven economy,
exchange rate appreciation becomes less useful. Therefore, supply-side measures
should be adopted to increase LRAS at a faster rate so as to accommodate rising AD.
Alternative policy 2: SS-side policies
The government can increase the productive capacity of the country through encouraging investment, privatization, education and R&D by improving the skills and knowledge of the workers, rising wage costs due to a tight labour market become less of a concern since there will be an expected increase in productivity in the long term.
o In addition, the government can consider encouraging more women to continue to
stay in the workforce or re-enter the workforce even after marriage and child birth
by preventing a further reduction in the size of the labour force, rising wage costs can
be restrained e.g. of such policies: companies providing part-time or flexible
working arrangements.
o Productive capacity can be increased through encouraging private investment, skills
upgrading, education and R&D. By doing so, rising wages due to a tight labour
market becomes less of a concern since there will be an expected increase in
productivity in the long run which will help ease rising unit labour cost experienced
currently.
EV: However, productivity growth has remained negative despite the implementation of
these measures.
Therefore, perhaps a modification of current supply-side measures is needed rather than
constant rolling out of new measures. E.g. The government can increase the Skills
Future Credit given to each Singaporean since training cost is often more than the $500

subsidy provided. Measures can also be better targeted at SMEs which need help in
raising productivity.
Synthesis
Fiscal policy is still necessary to put in place to ensure that domestic factors contributing
to inflation are kept in check but it cannot be the sole policy instrument used (much less
the best policy instrument).
The tightness of domestic labour market and greater competition call for a greater
emphasis on a range of supply-side measures to improve productive capacity and
quality of domestic production.
Ultimately, the choice of policy tool for addressing inflation in Singapore is dependent on
o The dominant root cause of inflation at that point in time if the bulk of inflation
stems from domestic factors, greater focus should be placed on other measures
apart from appreciating the Sing dollar.
o Given that labour shortages and negative productivity growth have persisted for
some time, the government should give greater emphasis on supply-side policies
and less on the appreciation exchange rate policy.
Level Descriptors for Essay Question 4(b) Marks
L3 Balanced and developed analysis in examining whether fiscal policy
should be the most important policy in comparison with two other
policies, such as exchange rate and supply-side policies so as to
address inflation caused by both domestic and external factors
Appropriate use of relevant examples and application to context of
Singapore
9-11
L2 Balanced but undeveloped analysis on alternative policies working alongside fiscal policy OR
One-sided but developed explanation on the use of fiscal policy in
addressing domestically-led demand-pull inflation
Not fully addressing “best” policy
Limited or no use of examples and application to the context
5-8
L1 Answer is mostly irrelevant
Answer not supported by economic reasoning
Conceptual inaccuracies
1 – 4
Evaluation
E2 A well-substantiated judgment on the need to combine fiscal policy
with alternative policies, although the importance placed on each type
of policy may differ, depending on the dominant root cause of inflation
in Singapore at that point in time.
E.g. If the bulk of inflation stems from external factors, greater focus must be placed on other measures apart from fiscal policy.
3-4
E1 Some attempt at evaluation or making a summative conclusion but not consistently using economic analysis.
1-2


![Economics - IB Documents PAST PAPERS - SUBJECT...2019/11/07 · N 19/3/ECONO/ H P3/ ENG /TZ 0/XX 8819 – 5107 Answer two questions. Each question is worth [25 marks]. Answers must](https://static.fdocuments.net/doc/165x107/60eaea048d84733d277fecc4/economics-ib-documents-past-papers-subject-20191107-n-193econo-h.jpg)