Economic, Efficient, Green District Low Temperature Hot Water
33
Stanford University: Economic, Efficient, Green District Low Temperature Hot Water Big Ten & Friends Mechanical & Energy Conference| October 2016 Joe Brillhart Johnson Controls Nathan Cesarz AFFILIATED ENGINEERS
Transcript of Economic, Efficient, Green District Low Temperature Hot Water

Stanford University: Economic, Efficient, Green District Low Temperature Hot Water Big Ten & Friends Mechanical & Energy Conference| October 2016
Joe Brillhart Johnson Controls
Nathan Cesarz AFFILIATED ENGINEERS

Innovation: District Level Heat Recovery
Heating Cooling Heat
Recovery 93%
57%
Large scale deployment of heat recovery
Combining best heating and cooling technologies in Europe and North America
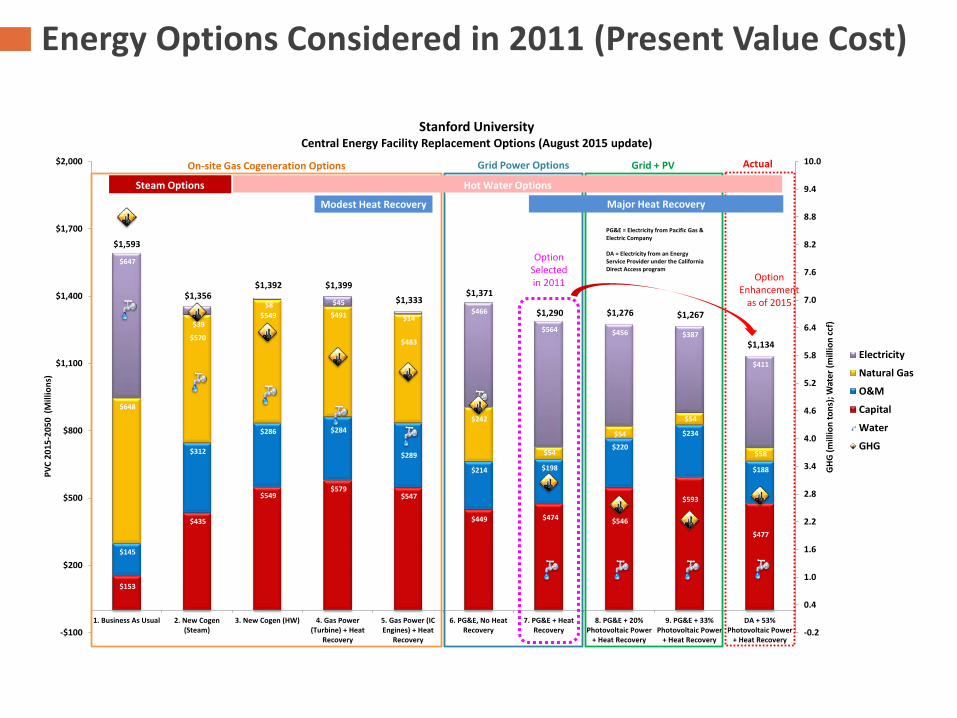
Energy Options Considered in 2011 (Present Value Cost)
$153
$435
$549 $579
$547
$449 $474 $546
$593
$477
$145
$312
$286 $284
$289
$214 $198
$220
$234
$188
$648
$570
$549 $491
$483
$242
$54
$54
$54
$58
$647
$39
$8 $45
$14 $466
$564 $456 $387
$411
$1,593
$1,356 $1,392 $1,399
$1,333 $1,371
$1,290 $1,276 $1,267
$1,134
-0.2
0.4
1.0
1.6
2.2
2.8
3.4
4.0
4.6
5.2
5.8
6.4
7.0
7.6
8.2
8.8
9.4
10.0
-$100
$200
$500
$800
$1,100
$1,400
$1,700
$2,000
1. Business As Usual 2. New Cogen(Steam)
3. New Cogen (HW) 4. Gas Power(Turbine) + Heat
Recovery
5. Gas Power (ICEngines) + Heat
Recovery
6. PG&E, No HeatRecovery
7. PG&E + HeatRecovery
8. PG&E + 20%Photovoltaic Power
+ Heat Recovery
9. PG&E + 33%Photovoltaic Power
+ Heat Recovery
DA + 53%Photovoltaic Power
+ Heat Recovery
GHG
(mill
ion
tons
); W
ater
(mill
ion
ccf)
PVC
2015
-205
0 (M
illio
ns)
Stanford UniversityCentral Energy Facility Replacement Options (August 2015 update)
Electricity
Natural Gas
O&M
Capital
Water
GHG
Steam Options Hot Water Options
Major Heat Recovery
On-site Gas Cogeneration Options Grid Power Options Grid + PV
Modest Heat Recovery
Actual
PG&E = Electricity from Pacific Gas & Electric Company
DA = Electricity from an Energy Service Provider under the California Direct Access program
Option Selected in 2011 Option
Enhancement as of 2015

Primary Benefits Reduce campus greenhouse gas
emissions by 68% (and growing)
Reduce campus drinking water use by an additional 15%
Save $420 million over business as usual case over next 35 years
Stanford Energy System Innovations (SESI) is a new sustainable energy program designed to meet the energy needs of Stanford campus through at least 2050. After four years of planning and three years of construction and implementation, SESI came online in late March 2015 via a new Central Energy Facility.
Stanford Energy System Innovations (SESI)

68% Greenhouse Gas Emissions Reduction (and Growing)

Stanford’s Renewable Energy Content in Purchased Electricity
Sources of Greenhouse Gas Emissions Reduction
50%: Reduction from efficiencies gained via Central Energy Facility 18%: Reduction from renewable energy content in purchased electricity
Greener than California Mix Stanford is initially supplying 65% of its electricity from renewable sources instead of the
minimum 33% renewables required by California Renewable Portfolio Standard (RPS) Additional direct renewable electricity purchases and increases in general grid renewables
through the state RPS will further increase the renewable content of Stanford’s energy
50%
12% 3%
35%
New 68MW solar PV plant (CA)
General California grid power -green
Onsite rooftop PVs (StanfordUniversity)
General California grid power

Greenhouse Gas Emissions
Carbon Impact • Standard Boiler • Combustion Turbine CHP • Heat Recovery
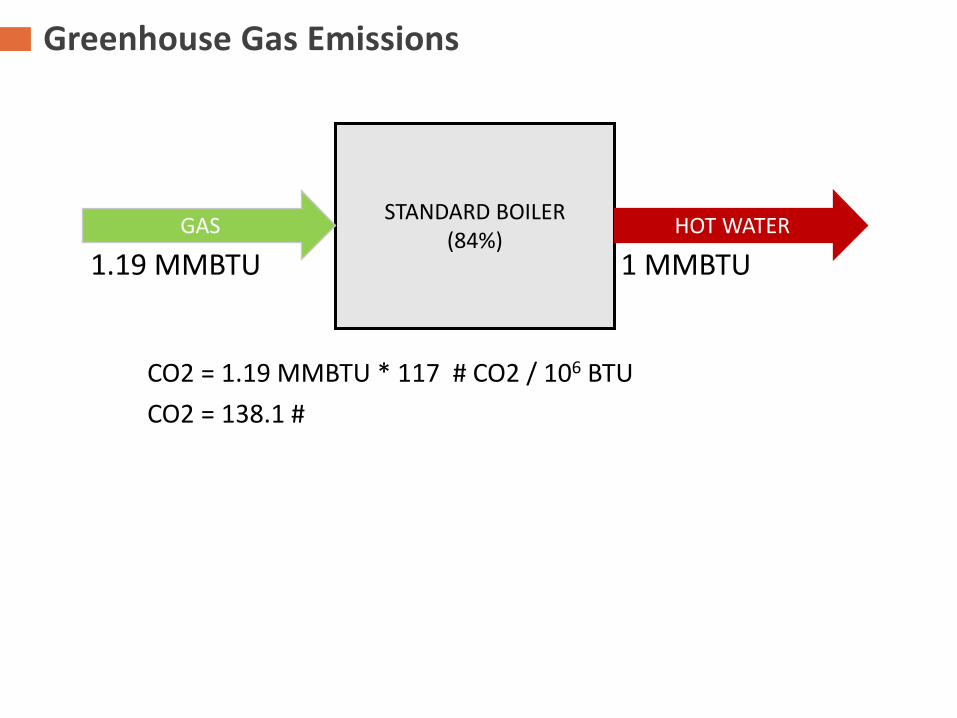
Greenhouse Gas Emissions
CO2 = 1.19 MMBTU * 117 # CO2 / 106 BTU CO2 = 138.1 # CONDENSING BOILER 90% EFF.
STANDARD BOILER (84%) GAS HOT WATER
1.19 MMBTU 1 MMBTU

Greenhouse Gas Emissions

Greenhouse Gas Emissions
CO2 = 1 MMBTU / HEAT * INPUT * # CO2 OF NG CO2 = 265.6 #
POWER PRODUCTION OFFSET (PPO) PPO = GRID CO2 * 1 MMBTU * ELEC. / THER. CO2 = REDUCTION OF 62.7 # CO2 VS BOILER
COMBUSTION TURBINE CHP
11,969 BTU/HR 5,228 BTU/HR
1 KWH GAS HOT WATER
ELECTRICITY

Greenhouse Gas Emissions

Greenhouse Gas Emissions
Subtract Chiller Input of 0.6 KW/T Net Input to Heat = 0.75 KW/T CO2 = 1 MMBTU / 16,600 BTU/HR * 0.75 KWH/T CO2 = REDUCTION OF 94.1 # CO2 VS BOILER
HEAT RECOVERY CHILLER
1.35 KWH/T OR 4,600 BTU/HR
16,600 BTU/HR
12,000 BTU/HR ELECTRICITY HOT WATER
CHILLED WATER

Greenhouse Gas Emissions

Greenhouse Gas Emissions

Waste Heat Discarded from Cardinal Cogeneration Plant
Energy can neither be created nor destroyed, but only changed from one form to another.
- First Law of Thermodynamics

0102030405060708090
100110120130140150160170180190200210
MM
btu
Hour of Day
Stanford UniversityHeat Recovery Potential at Central Energy Facility
Sample Date 7/23/2008
Heating
Cooling
Thermal Overlap
SUMMER
Heat Recovery
Stanford recovers 45% of the heat now discharged from the cooling system to meet 92% of campus heating demands on an annual basis.
Source: Stanford University, Draft Energy & Climate Plan (April 2009)
0102030405060708090
100110120130140150160170180190200210
MM
btu
Hour of Day
Stanford UniversityHeat Recovery Potential at Central Energy Facility
Sample Date 4/16/2008
Heating
Cooling
Thermal Overlap
SPRING & FALL
Heat Recovery
Why Heat Recovery is Possible We heat and cool buildings at the same time
Cooling is just the collection of unwanted heat
0102030405060708090
100110120130140150160170180190200210
MM
btu
Hour of Day
Stanford UniversityHeat Recovery Potential at Central Energy Facility
Sample Date 1/23/2008
Heating
Cooling
Thermal OverlapHeat Recovery
WINTER

Planning Aspects of the SESI Project
CENTRAL PLANT PIPING DISTRIBUTION
BUILDING CONVERSIONS SUBSTATION

SESI’s New Central Energy Facility
Gas Heating
Cooling Heat
Recovery 93% 57%
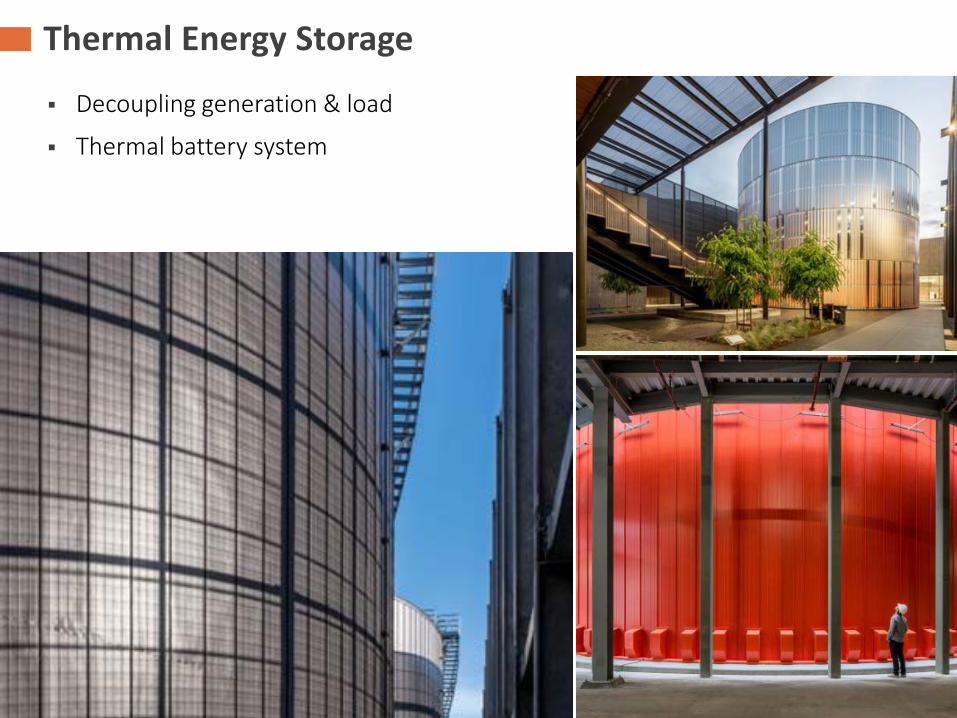
Thermal Energy Storage
Decoupling generation & load
Thermal battery system

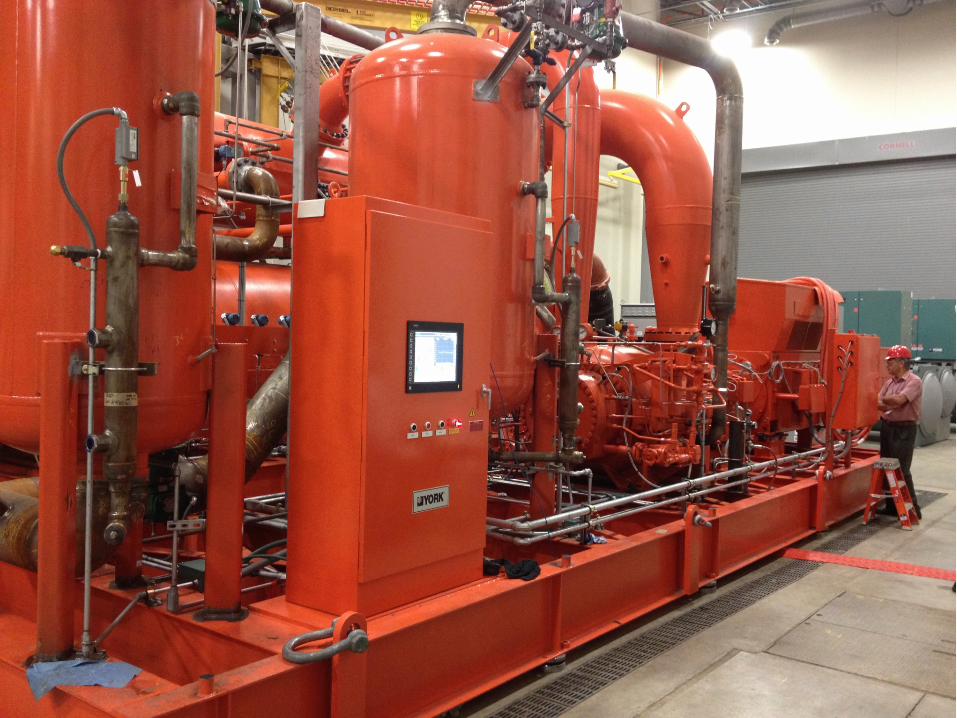
Production Equipment

Final Solution: Schematic
HEAT RECOVERY PLANT
OSHPD PLANT

22

Basic Flow Diagram – Three Stage
Evaporator Condenser
Economizer
Compressor
Motor
Gear

Compressor for the Titan

27

28

Four temporary regional steam to hot water HX skids
Building Conversion & Thermal Distribution

Logstor Piping & Regional HXs
Shallow Bury
Self-Restrained
Direct Bury Valves
Eliminated Vaults
Chemical Free WT

Building Distribution

After Building Conversion

System Performance System Start-Up Challenges Hot Water Return Temperature & HRC
Large Bore Pipe Mixing Issues
Active Commissioning…
Operator Training for Heat Recovery System