EFFECT OF HOT PRESSING TEMPERATURE ON THE ELECTROCHEMICAL ... · effect of hot pressing temperature...
67
EFFECT OF HOT PRESSING TEMPERATURE ON THE ELECTROCHEMICAL STABILITY OF LI2S-P2S5 (75 – 25 % MOLE) AS A SOLID ELECTROLYTE By Maria Regina Garcia Mendez A THESIS Submitted to Michigan State University in partial fulfillment of the requirements for the degree of Materials Science and Engineering-Master of Science 2015
Transcript of EFFECT OF HOT PRESSING TEMPERATURE ON THE ELECTROCHEMICAL ... · effect of hot pressing temperature...

EFFECT OF HOT PRESSING TEMPERATURE ON THE ELECTROCHEMICAL STABILITY
OF LI2S-P2S5 (75 – 25 % MOLE) AS A SOLID ELECTROLYTE
By
Maria Regina Garcia Mendez
A THESIS
Submitted to
Michigan State University
in partial fulfillment of the requirements
for the degree of
Materials Science and Engineering-Master of Science
2015

ABSTRACT
EFFECT OF HOT PRESSING TEMPERATURE ON THE ELECTROCHEMICAL STABILITY
OF LI2S-P2S5 (75 – 25 % MOLE) AS A SOLID ELECTROLYTE
By
Maria Regina Garcia Mendez
Solid state batteries can contribute to a more sustainable energy future providing the energy
required when needed. It can facilitate the integration of renewable energy into the electrical grid
and can provide the energy density redequir to make electric vehicles a massive technology without
greenhouse emissions in operating conditions. To concretize the latter, high-performance
electrolytes are necessary. Li2S-P2S5 (75-25% mole) is a promising solid-electrolyte that could
potentially be used for this purpose. Its most appealing features include: high ionic conductivity at
room temperature (~10-3 S/cm), low-temperature processing conditions, and low cost. Most likely,
Li2S-P2S5 (75-25% mole) would be integrated in a battery system using Li metal as an anode.
Therefore, its stability against metallic lithium must be understood. The purpose of this work is to
characterize the effect of Li2S-P2S5 (75-25% mole) processing conditions, most specifically hot
pressing, and their effect on Li stability. It was found that improvements on electrochemical
performance can be attained by promoting particle chemistry during hot pressing.

iii
ACKNOWLEDGEMENTS
I would like to express my sincere gratitude and appreciation to my advisor Dr. Jeff Sakamoto
for transcending in his role. His passion for science, immense curiosity, patience and kindness
makes him an outstanding professor. I would like to thank him for encouraging me to challenge
myself and always do better.
I would like to thank Fulbright for giving me the opportunity to gain knowledge in the field I
wanted to be part of; Materials Science and Engineering, and the countless benefits this experience
has brought to me.
I would like to thank my committee members Dr. Donald Morelli and Dr. Carl Boehlert for
agreeing to be part of my committee and for their great disposition to help me throughout my
studies at Michigan State University. I would also like to thank Dr. Morelli for granting me access
to his laboratory when needed. Additionally, I would like to acknowledge the collaboration and
excellent teamwork of Dr. Fuminori Mizuno, Dr. Tim Arthur, Dr. Ruigang Zhang and Dr. Paul
Fanson of Toyota Motor Engineering & Manufacturing North America, Inc. for Scanning Electron
Microscopy (SEM), Differential Scanning Calorimetry (DSC) and X-Ray Diffraction (XRD)
Analyses.
I want to thank each of the members of the laboratory that have made this experience more
meaningful and enjoyable: Dena Shahriari, Yunsung Kim, Asma Sharafi, Travis Thompson, Dan
Lynam, Isabel David and Young-Sam Park. Finally, I would like to thank my family and closest
friends that have unconditionally supported me and encouraged me throughout my life.

iv
TABLE OF CONTENTS
LIST OF TABLES………………………………………………………………………………...vi
LIST OF FIGURES………………………………………………………………………………vii
1. Introduction ............................................................................................................................... 1 1.1 Energy demand and storage need ...................................................................................... 1 1.2 Electrochemical energy storage devices ............................................................................ 2 1.3 Need for solid state electrolytes ......................................................................................... 6 1.4 Inorganic solid state Li-ion conductors ............................................................................. 8
1.4.1 Crystalline ceramic electrolytes ................................................................................. 9 1.4.1.1 Perovskite ................................................................................................................... 9 1.4.1.2 NASICON-Type ......................................................................................................... 9 1.4.1.3 LISICON and thio-LISICON Type .......................................................................... 10 1.4.1.4 Garnet ....................................................................................................................... 10 1.4.2 Inorganic non-crystalline solid electrolytes ............................................................. 11 1.4.2.1 LIPON ...................................................................................................................... 11 1.4.2.2 Sulfide glasses .......................................................................................................... 11 1.4.2.3 Li2S-P2S5 .................................................................................................................. 12
1.5 Ceramic electrolyte processing and characterization techniques .................................... 14 1.5.1 Planetary ball milling ............................................................................................... 14 1.5.2 Densification of sulfide electrolytes ......................................................................... 16 1.5.3 Electrochemical characterization ............................................................................. 21 1.5.3.1 Electrochemical Impedance Spectroscopy (EIS) ..................................................... 21 1.5.3.2 Preconditioning ........................................................................................................ 25 1.5.3.3 DC asymmetric polarization method ........................................................................ 25
1.6 Materials characterization techniques .............................................................................. 26 1.6.1 X-Ray Diffraction (XRD) ........................................................................................ 26 1.6.2 Differential Scanning Calorimetry (DSC) ................................................................ 26 1.6.3 Scanning Electron Microscopy (SEM) ..................................................................... 27
2. The effect of hot pressing temperature on the electrochemical stability of Li2S-P2S5 (75 – 25
% mole) .......................................................................................................................................... 28 2.1. Introduction ...................................................................................................................... 28 2.2. Results and Discussion .................................................................................................... 29
2.2.1. Evaluating the effect of hot pressing temperature on LPS bulk properties .............. 29 2.2.1.1. Densification conditions ....................................................................................... 29 2.2.1.2. Chemical transformations ..................................................................................... 34 2.2.2. Evaluating the chemical and electrochemical stability of LPS ................................ 36 2.2.2.1. AC Impedance measurements and DC cycling .................................................... 36

v
2.2.2.2. Cross-sectional analysis ........................................................................................ 46 2.2.3. Materials characterization ........................................................................................ 48 2.2.3.1. X-Ray Diffraction Analysis .................................................................................. 48 2.2.3.2. Differential Scanning Calorimetry ....................................................................... 50 2.2.3.3. Scanning Electron Microscopy (SEM) and Energy Dispersive Spectrometry
(EDS)…..... ............................................................................................................................. 52 2.3. Conclusion ....................................................................................................................... 53 2.4. Future directions .............................................................................................................. 54
REFERENCES ............................................................................................................................... 55

vi
LIST OF TABLES
Table 1. Capacitance values and their possible interpretation (Irvine et al. 1990) ........................ 23
Table 2. 75Li2S-25P2S5 hot pressed pellets (12.7mm in diameter) between 130°C and 190°C for
electrochemical performance analysis– Data set no.1 .................................................................... 31
Table 3. 75Li2S-25P2S5 hot pressed pellets (12.7mm in daiameter) between 130°C and 190°C for
materials characterization– Data set no.2 ....................................................................................... 32
Table 4. Li/LPS/Li cell preconditioning at room temperature ....................................................... 37
Table 5. Cross-sectional analysis on cold-pressed and hot-pressed pellets between 130°C and
150°C .............................................................................................................................................. 46
Table 6. Cross-sectional analysis on cold-pressed and hot-pressed pellets between 160°C and
190°C .............................................................................................................................................. 47

vii
LIST OF FIGURES
Figure 1. Shares of world primary energy (Chu 2012) ................................................................... 1
Figure 2. Ragone plot for various energy devices (Wachsman et al. 2011) ..................................... 3
Figure 3. Schematic of a lithium ion battery (LIB) (Dunn et al. 2011) ............................................ 6
Figure 4. Amount of H2S generated from pelletized Li2S-P2S5 (LPS) glasses with different Li2S
contents (Muramatsu et al. 2011) ................................................................................................... 13
Figure 5. Schematic of specific volume changes observed as a glass is heated through Tg
(Callister 2007) ............................................................................................................................... 16
Figure 6. a) Densification pressure dependence of 75Li2S-25P2S5 (mol%) glass solid electrolyte,
b) SEM image of 75Li2S-25P2S5 glass powder. SEM images of fracture cross-sections of 75Li2S-
25P2S5 glass powders pressed at c) 74 and d) 360MPa (Sakuda et al. 2013) ................................ 18
Figure 7. Photographs of the pellets of the 80Li2S-20P2S5 sample pressed at a) room temperature,
b) 180°C, c) 210°C and d) 240°C for 2h, and e) 210°C for 4h (Kitaura et al. 2011) ..................... 19
Figure 8. Young’s modulus of xLi2S*(100-x)P2S5 (mol%) glass pellets prepared by hot press and
cold press at 360 MPa (Sakuda et al. 2013) ................................................................................... 20
Figure 9. Schematic of a double acting die configuration .............................................................. 21
Figure 10. Experimental arrangement generally used for variable frequency AC measurements to
evaluate ionic transport in a solid electrolyte ................................................................................. 22
Figure 11. Schematic complex plane plot of the Debye equivalent circuit (Huggins, 2009) ........ 23
Figure 12. Schematic of the pressure and temperature profiles followed during hot pressing tests
........................................................................................................................................................ 30
Figure 13. Fractured surfaces of hot-pressed samples between 130°C and 170°C ........................ 33
Figure 14. DSC spectra of Li2S-P2S5 (75 – 25 % mole) powder as prepared ............................... 34
Figure 15. Effect of hot pressing at 130 and 140oC on DSC spectra of 75Li2S-25P2S5 ................ 35
Figure 16. Li/75Li2S-25P2S5/Li cell preconditioning at room temperature, 0.01 mA/cm2 ............ 36

viii
Figure 17. Nyquist plot of Li/LPS/Li cell before preconditioning at room temperature - Cold-
pressed pellet .................................................................................................................................. 38
Figure 18. Nyquist plot of Li/LPS/Li cell before preconditioning at room temperature -Hot-
pressed samples .............................................................................................................................. 39
Figure 19. Nyquist plot of Li/LPS/Li cell after preconditioning at room temperature - Cold-
pressed pellet .................................................................................................................................. 40
Figure 20. Nyquist plot of Li/LPS/Li cell after preconditioning at room temperature -Hot-pressed
samples ........................................................................................................................................... 41
Figure 21. 75Li2S-25P2S5 resistance (normalized by its aspect ratio) after preconditioning ......... 42
Figure 22. DC asymmetric polarization test at room temperature ................................................. 43
Figure 23. Total charge passed through Li/75Li2S-25P2S5/Li cell before significant drop in
potential is observed in DC asymmetric polarization test .............................................................. 44
Figure 24. Nyquist plot of Li/LPS/Li cell after DC asymmetric polarization at room temperature –
Hot-pressed pellets at 180°C and 190°C ........................................................................................ 45
Figure 25. Cross-sectional analysis on cold-pressed and hot-pressed pellets between 130°C and
150°C .............................................................................................................................................. 46
Figure 26. Cross-sectional analysis on cold-pressed and hot-pressed pellets between 160°C and
190°C .............................................................................................................................................. 47
Figure 27. Effect of hot pressing temperature on 75Li2S-25P2S5 structure ................................... 49
Figure 28. Effect of DC cycling on 75Li2S-25P2S5 structure (hot pressed at 190°C) .................... 50
Figure 29. Effect of hot pressing and Li cycling on DSC spectra of 75Li2S-25P2S5 hot-pressed at
130°C .............................................................................................................................................. 51
Figure 30. Effect of hot pressing and Li cycling on DSC spectra of 75Li2S-25P2S5 hot-pressed at
140°C .............................................................................................................................................. 51
Figure 31. Fractured surfaces of hot pressed and DC cycled 75Li2S-25P2S5 pellets ..................... 53

1
1. Introduction
1.1 Energy demand and storage need
The world’s energy demand will increase from approximately 12 billion metric tons of oil
equivalents (t.o.e) in 2009 to 18 billion t.o.e by 2035. The International Energy Agency (IEA)
projects that the carbon dioxide emissions are expected to increase from 29 metric gigatons per
year (Gt/yr) to between 36 and 43 Gt/yr. (Lee, 2011). The world’s dependence on fossil fuels to
produce energy is unprecedented taking into account it comprises roughly 86% of the world’s main
energy consumption (Figure 1, Chu, 2012). Furthermore, according to the Intergovernmental Panel
on Climate Change (IPCC) 2014 report, carbon dioxide emissions from fossil fuel combustion and
industrial processes contributed about 78% of the total greenhouse gases emission increase for the
past 40 years. Thus, the need of renewable sources of energy is of great relevance to obtain a
sustainable and secure energy future. Developed countries have started to employ diverse strategies
to decrease the fossil fuel dependence as the development of electric vehicles, increased
deployment of renewable energy sources, and also an integration of electrical energy transmission,
distribution, and storage for the electrical grid. (Dunn 2011; Chu 2012).
Figure 1. Shares of world primary energy (Chu 2012)

2
Underlying these strategies is the recognition that inexpensive and reliable energy is vital for
economic development. Electrical Energy Storage (EES) cannot possibly address all of these
challenges. However, EES does offer a well-established approach for improving grid reliability
and utilization. Whereas transmission and distribution systems are responsible for moving
electrical power to end users, the EES systems provide uninterrupted service (Dunn et al. 2011).
The energy storage technologies available for large-scale applications can be divided into four
types: mechanical, electrical, chemical and electrochemical. This work will focus on
electrochemical energy storage, due to its desirable features including pollution-free operation,
flexible power and energy characteristics to meet small, medium or large-scale applications as well
as reliability (Dunn et al. 2011). The application of interest in this work will be electric vehicles
(EV).
The important metrics to evaluate EES to enable vehicle electrification include: specific power that
refers to the amount of power per unit mass of the rate at which energy is extracted from a battery
and specific energy that refers to the amount of energy per unit mass of the battery. This translates
in vehicles as follows: higher specific energy will enable a vehicle to travel farthest distances
without being recharged; meanwhile the specific power refers to vehicle acceleration and charge
rate. Thus, the most important characteristics for an EV EES device are: specific power, energy
density, lifetime, cost and maintenance. (Chu, 2007)
1.2 Electrochemical energy storage devices
Current EES devices will not meet future energy storage requirements. (Chu, 2007). Therefore,
the performance of state-of-the-art electrochemical devices has to be addressed considering the
challenges that each needs to overcome for electric vehicles (EVs) or plug-in hybrid vehicles
(PHEVs).

3
Supercapacitors, solid oxide fuel cells (SOFCs) and batteries are going to be discussed since all
three can be charged under a few hours as seen from the diagonal dotted lines in the Ragone plot
(Figure 2).
Figure 2. Ragone plot for various energy devices (Wachsman et al. 2011)
Supercapacitors store energy by physically separating positive and negative charges, which are
stored on two parallel plates divided by an insulator. These devices have a number of potentially
high-impact characteristics, such as fast charging (within seconds), reliability and wide operating
temperatures (Chu, 2007). Since there are no chemical variations on the electrodes these devices
have a long cycle life (hundreds of thousands charge-discharge cycles), but low energy density
compared to batteries (figure 2) (Khaligh, 2010; Wachsman et al. 2011). Supercapacitors fulfill the
power density required for the HEV, PHEV and EV applications, but not the energy density of
either. In hybrid electric vehicles (HEV) applications, both batteries and supercapacitors could be
combined to maximize the benefits of both components. (Khaligh, 2010)
A SOFC consists of two electrodes (cathode and anode) separated by a solid oxygen ion-

4
conducting electrolyte. At the cathode, oxygen that comes from air is reduced and the oxygen ions
are transported through the electrolyte lattice to the anode where they react with gaseous fuel,
yielding heat, water, and carbon dioxide when using hydrocarbon fuels and releasing electrons to
the external circuit. (Wachsman, 2011) Multiple cells are combined in series that provide both
electrical contacts and gas channels between individual cells. The resulting “stacks” are then
arranged in series and parallel configurations to provide the desired voltage and power outputs
from portable power and transportation applications to distributed generation and large-scale power
generation. This energy storage technology has a high power density, higher than supercapacitors
and batteries (figure 2), high conversion efficiency of fuel to electrical energy and waste heat
recoverability. However, its main drawback is high operating temperature (about 800°C) limiting
the types of materials that can be selected for their fabrication and also leading to a costly
technology. (Wachsman, 2011; Khaligh, 2010) Even though SOFCs possess a high power density
they have a significant lag due to gas flow rates and require several seconds to respond to a demand
that sweeps from 10 to 90% of the total power, affecting vehicles when accelerating (Chu, 2007).
A battery is composed of several electrochemical cells that are connected in series and/or in
parallel in order to provide the required voltage and capacity, respectively. Each cell is composed
of a positive and a negative electrode, which are where the redox reactions take place. The
electrodes are separated by an electrolyte that is a good ionic conductor but a poor electronic
conductor (<10-12 S/cm) to prevent self-discharge of the battery (Nazri et al. 2003). When an
external circuit connects the electrodes, the electrons from the anode flow spontaneously to the
cathode. The driving force for this reaction is the difference in the chemical potential between
electrodes. Simultaneously, a flow of ions goes through the electrolyte in order to decrease the

5
potential difference caused by the flow of electrons and maintain charge neutrality within the
system. (Dunn et al. 2011)
There are several battery chemistries, most of which have been based on aqueous electrolytes.
Regardless of their chemistry, batteries store energy within the electrode structure through charge
transfer reactions. (Dunn et al. 2011) The lead-acid battery, standard for automobile starting
systems, has relatively low energy density, moderate power rate, but low cost, which is the reason
why it is still used despite of its drawbacks: lead toxicity and relatively low specific energy. Nickel-
Cadmium batteries are more expensive than the lead-acid batteries, have higher energy density and
significantly higher power density than lead-acid technology. However, its most significant
drawback is Cadmium toxicity, and its potential environmental damage related to cadmium uptake
into the soil (Kurzweil 2009). To address the environmental issues with the Ni-Cd battery, gaseous
hydrogen in titanium-based alloys have been used in place of cadmium as the negative electrode.
This battery technology is known as the Nickel-metal hydride (NMH) battery. (Kurzweil 2009)
The NMH battery has a relatively low voltage, moderate energy density, high power density, but
nickel is difficult to extract, thus unsustainable and toxic.
Lithium-ion batteries employ non-aqueous electrolytes and use Li-intercalation compounds as
electrodes. It offers a high energy density, power rate, cycle life, but it is costly and also uses
relatively expensive elements (cobalt) in most Li-ion cathodes. Manganese and iron have been
suggested as alternatives to replace cobalt, which are abundant and sustainable (Armand, 2008)
Li-ion battery (LIB) technology (Figure 3) is the current leading candidate to meet the near and
medium-term needs for hybrid electric vehicles (HEVs) as well as plug-in hybrids (PHEVs),
provided that improvements can be achieved in terms of performance, cost, and safety. (Sakamoto,
2012, Armand, 2008).

6
Figure 3. Schematic of a lithium ion battery (LIB) (Dunn et al. 2011)
The production cost, over-temperature sensitivity, and internal pressure buildup are related to
minimizing the hazards associated with liquid electrolytes inside LIBs. Thus, the development of
alternative electrolytes that can enable beyond Li-ion advanced battery technologies are necessary
to keep up with the demands for vehicle electrification. (Bruce et al. 2011) Optimizing beyond Li-
ion battery systems will provide EVs with the specific energy required for longer travel distances
between recharging. (Bruce et al. 2011) The following section will discuss how solid-state
electrolytes can enable solid-state batteries for electrical vehicles.
1.3 Need for solid state electrolytes
State-of-the-art lithium-ion batteries, with a specific energy of ~150 Wh kg-1 do not yet have
sufficient energy or life for use in electrified vehicles that would match the performance of internal
combustion vehicles. Energy densities two and five times greater are required to meet the

7
performance goals of a future generation of plug-in hybrid-electric vehicles (PHEVs) with a 40-80
mile all-electric range, and all-electric vehicles (EVs) with a 300 to 400 mile range, respectively.
Further improvements in energy density of factors of two to three may yet be achievable for SOA
Li-ion systems; factors of five or more may be possible for lithium-oxygen systems (Thackeray et
al. 2012).
The specific energy necessary to obtain a 300 to 400 mile range EV is between 350 and 400 Wh
kg-1 (Song et al. 2013). The battery chemistries that can enable a specific energy greater than this
would be a Li-S or a Li-air (Bruce et al. 2011). A Li-S system possesses a theoretical specific
energy of ~1168 Wh kg-1, and a Li-air system of ~1752 – 2691 Wh kg-1 (Thackeray et al. 2012).
Neither are yet commercialized, however, due to several technical challenges. For both
chemistries, metallic lithium would be used as the anode. The overwhelming appeal of Li-
electrochemistry lies in its low molecular weight; small ionic radius, which is beneficial for
diffusion; and low redox potential (Eo(Li+/Li)=-3.04V vs. standard hydrogen electrode (SHE)).
The latter enables high-output voltages and therefore high-energy densities. (Etacheri, 2011 and
Dunn, 2011)
The nature of the highly active lithium battery chemistry places severe electrochemical
requirements on the electrolyte. The organic electrolytes invariable rely on the formation of a
protective Solid Electrolyte Interphase (SEI) layer to limit the reaction or decomposition rate.
Conductive electron paths may be formed along lithium dendrites for liquid or polymer
electrolytes, while grain boundaries, pores, or cracks may become electronic paths for glass and
ceramic electrolytes (Nazri et al. 2003). Therefore, an electrochemically and chemically stable
solid electrolyte is required.

8
1.4 Inorganic solid state Li-ion conductors
When cycling a lithium battery, several electrochemical reactions may take place at the
electrodes as a function of the voltage range. The decomposition of organic electrolytes at the
negative electrode has been a major concern, as there is no organic electrolyte that can tolerate the
reducing power of metallic lithium or lithium doped graphite (commonly used in Li-ion batteries).
(Nazri et al. 2003) In fact, the reason that current anodes work so well is mainly because of the
formation of a protective layer on the surface of the anode. This protective layer is formed by
decomposition of organic solvents (SEI layer). The nature of SEI depends on the organic solvents
used in the battery. The SEI is electronically insulating, but has significant lithium ion conductivity
and serves as a protective layer to prevent further reaction between the liquid electrolyte and
graphite. . (Nazri et al. 2003)
The average voltage of a Li-ion battery (LiC6//LiCoO2) is 3.75 V and its operating voltage range
is between 3 to 4.5 V (Nazri et al. 2003). It has been found that different carbonate-based electrolyte
solvents show stability above 5 V, providing the opportunity to use high voltage cathode materials
(layered LiCoO2 and 3-D spinel LiMn2O4 cathodes) (Nazri et al. 2003). However, SOA Li-ion
batteries use liquid electrolytes with low flash point solvents, and may present safety concerns,
leakage and corrosion (Knauth, 2009).
If the organic solvent in the lithium battery can be replaced by inorganic Li-conducting solid
materials, the following advantages are expected: no leakage of the electrolyte, broader operating
temperature range (since inorganic solid electrolytes do not freeze, boil, or ignite), and only one
type of carrier ion (Li-ion) migrates. Additionally, long life-time is expected because of little self-
discharge (Adachi et al. 1996).

9
1.4.1 Crystalline ceramic electrolytes
Among the inorganic solid state ion conductors, the Superionic conducting oxide (SCO)
electrolytes show diverse features that make them attractive for solid-state batteries: typically
synthesized in air and are reasonably stable in ambient air, high hardness, increasing conductivity
with increasing temperature, along with the benefits associated of being a solid material. Hence, a
review of the best understood and more promising ceramic electrolytes will be presented below.
1.4.1.1 Perovskite
The perovskite structure, with the general formula ABO3, has can accommodate myriad ions,
both aliovalent and isovalent, on both on the A and B lattice sites. This results in the introduction
of vacancies in the lithium lattice (Huggins, 2009). The perovskite type Li3xLa2/3-xTiO3 (LLTO)
shows excellent bulk Li-ion conductivity (>10-3 S/cm) when x~0.3 (Inaguma, et al. 1994).
Nevertheless, high temperature sintering is required for sample preparation and high Li2O losses
are observed leading to difficulty in controlling Li-ion content and consequently, ion conductivity
(Ban and Choi, 2001). Furthermore, instability at low potentials limits the utility of LLTO owing
to its reduction at potentials below the Ti3+/4+ redox reaction (1.5 V vs Li/Li+) (Klinger et al. 1997).
1.4.1.2 NASICON-Type
The NASICON (Na SuperIonic conductor) crystallographic structure NaA2IV(PO4)3 (A
IV = Ge,
Ti and Zr) was identified in 1968 (Hagman and Kierkegaard, 1968). Among the Al-doped ceramics,
the nominal composition Li1.3Al0.3Ti1.7(PO4)3 (LATP) was reported to have the optimum Li ionic
bulk conductivity of 3 x 10⁻³ S/cm at 298K. The substitution of Ti4+ by smaller Al3+ cations reduces
unit cell dimensions of the NASICON framework and enhances ionic conductivity by about three

10
orders of magnitude. However, as for LLTO, these NASICON-Type materials are unstable with Li
metal due to facile Ti4+ reduction (Aono et al. 1990).
1.4.1.3 LISICON and thio-LISICON Type
LISICON or Li SuperIonic conductor structure was named by Hong, H. Y-P (1978). The
LISICON framework is related to the γ-Li3PO4 crystal structure. Even in doped compounds the
ionic conductivity is relatively low (about 10-6 S/cm at room temperature). Furthermore, LISICON
Li14ZnGe4O16 is highly reactive with lithium metal and CO2. The thio-LISICON family possesses
a higher Li ion conductivity than LISICON by the replacement of oxide ions by larger and more
polarizable sulfide in the framework improving ionic mobility. Thio-LISICON compounds based
on Li silicon sulfides have an even higher ionic conductivity of 6.4 x 10⁻⁴ S/cm at room temperature
for Li3.4Si0.4P0.6S4. (Kanno and Murayama, 2001).
1.4.1.4 Garnet
Hyooma first proposed Li-ion conducting oxides with the garnet crystal structure (Hyooma and
Hayashi, 1988). Garnets offer flexibility in multiple primary and sublattice cation sites. Weppner
et al. (2007) discovered a high ionic conductivity formulation: Li7La3Zr2O12 (LLZO). This material
crystallizes in the tetragonal crystal structure without being doped. The addition of approximately
0.24 mole of Al3+ is necessary to stabilize the preferred cubic crystal structure that exhibits isotropic
lattice conductivities in the 0.4 mS/cm range at room temperature. It was shown that the cubic-
tetragonal phase transition is also affected by the Li concentration (Thompson et al. 2014).
Additionally, the grain boundary resistance is relatively low resulting in total conductivities that
are comparable to the lattice conductivity and also exhibit an electrochemical window from 0 to 9
V vs. Li/Li+. (Ohta, 2011) Unlike LATP and LLTO, LLZO exhibits the combination of high total
11
ionic conductivity and stability against Li. The latter is achieved by using skeleton framework of
cations (La, Zr, Ta, Al) that are not believed to be redox active at low potentials vs Li+/Li.
(Sakamoto, 2014) However, Li-LLZO interfacial impedance is in the hundreds of ohms/cm range
at room temperature, which is relatively high (Ohta, 2011). Additionally, a high processing
temperature is required to bond or sinter components together which complicates cell fabrication
(Sakamoto, 2014).
1.4.2 Inorganic non-crystalline solid electrolytes
1.4.2.1 LIPON
The thin-film lithium phosphorous oxynitride electrolyte (Lipon, Li2.9PO3.3N0.46), synthesized by
sputtering Li3PO4 in pure nitrogen, was found to have a conductivity of 2 x 10⁻⁶ S/cm at room
temperature and excellent long-term stability in contact with lithium. One of the Li/Lipon/TiS2
cells, which had an open circuit voltage of about 2.5 V at full charge, underwent over 4,000
charge/discharge cycles (Bates et al. 1993). However, oxide-based glassy electrolytes such as
Lipon have to be utilized as thin films to compensate for their low ionic conductivities, and their
limited cell capacity is one of the disadvantages of thin-film batteries. Therefore, the development
of highly conductive solid electrolytes is imperative to create large-sized, all-solid-state batteries
with high capacity. (Mizuno and Hayashi, 2005)
1.4.2.2 Sulfide glasses
The high conductivities and low activation energies of sulfide glasses compared to the oxide
glasses is attributed to the weaker bonding of Li with the non-bridging sulfur anions, due to the
higher polarizability and softer basicity of the sulfide ion (Nazri et al. 2009).

12
1.4.2.3 Li2S-P2S5
Glassy solid electrolytes in the system Li2S-P2S5 are selected as typical sulfide solid electrolytes
and have shown high lithium ion conductivities of 10-4 to 10-3 S/cm at room temperature (Mizuno
et al. 2006). However, most of them show low chemical stability to moisture, as they tend to
hydrolyze and generate H2S gas (Ohtomo et al. 2013).
Glassy Li2S-P2S5 (LPS) solid electrolytes are composed of lithium (Li+) and ortho-thiophosphate
ions (PS43-) and its ionic conductivity is enhanced as the Li2S content is increased as the lithium
source. The 70Li2S-30P2S5 (mol%) glass-ceramic exhibits the highest conductivity of 3.2 x 10⁻³
S/cm at room temperature and the lowest activation energy of 12 kJ/mol for conduction (Mizuno
et al. 2006). Nevertheless, this composition is not the most chemically stable against air.
Muramatsu et al. (2011) showed that the composition of 75Li2S-25P2S5 (glass and glass-ceramic)
generated the least amount of H2S (Figure 4) after exposure to air for one minute without a
significant change after longer storage. Additionally, the sulfide electrolyte at this composition
undergoes little structural change in air, which was confirmed by Raman spectroscopy before and
after one day of exposure to the atmosphere (Muramatsu et al. 2011). 75Li2S-25P2S5 possesses an
adequate ionic conductivity, on the 10-4 to 10-3 S/cm range (Mizuno et al. 2006). Thus, 75Li2S-
25P2S5 glass and glass-ceramic are promising solid electrolytes for all-solid-state lithium batteries
in terms of chemical stability and conductivity. (Muramatsu et al. 2011)

13
Figure 4. Amount of H2S generated from pelletized Li2S-P2S5 (LPS) glasses with different Li2S
contents (Muramatsu et al. 2011)
Highly conductive crystalline thio-LISICON analogues are formed by the crystallization of the
mechanically milled Li2S-P2S5 glasses. The names were coined due to the similarity between
crystal structures. However, the glass-ceramics obtained by heating the Li2S-P2S5 glasses have no
germanium as the thio-LISICONs. The XRD patterns in regions I and III for the thio-LISICONS
were indexed by a monoclinic superlattice cell of a x 3b x 2c, while the patterns in region II were
indexed by that of a x 3b x 3c (Mizuno et al. 2006). A presumable explanation for the similarities
on XRD patterns between the thio-LISICONs and the glass-ceramics is to assume that the Li-richer
Li3+5yP1-yS4 phases with a lack of phosphorus are formed in the glass ceramics. Murayama et al.
(2004) found that the Li3+5yP1-yS4 crystals in the Li2S-P2S5 system were formed in the composition
range of 0 < y ≤ 0.27. Thus, the crystal structures of Li3.25P0.95S4 and Li3.2P0.96S4 would be similar
to those of thio-LISICON II (Li3.25Ge0.25P0.75S4) and thio-LISICON III (Li3.2Ge0.2P0.8S4),
respectively. (Hayashi et al. 2003).

14
In the case of the 75Li2S-25P2S5 glass, the thio-LISICON III analogue is formed as the first
precipitated crystal and remains up to 300ºC. The crystals of Li3PS4 and Li4P2S6 are finally present
at 550 ºC (Hayashi et al. 2003).
Hayashi et al. (2003) found that the thio-LISICON II analogue with higher lithium content than
the thio-LISICON III analogue was not formed in the 75Li2S-25P2S5 glass but formed in the Li-
richer 80Li2S-20P2S5 glass. The thio-LISICON II and III analogues have not been reported as
thermodynamically stable crystals in the Li2S-P2S5 system, which agreed with Hayashi et al. (2003)
results in which these phases were not obtained by solid-phase reaction. Hence, these phases
probably precipitated as a metastable phase from the mechanically milled Li2S-P2S5 glasses, and
they are changed to a stable crystal such as Li3PS4 with an increase in temperature (Hayashi et al.
2003). Crystals such as Li3PS4 and Li4P2S6 has been reported to show a low conductivity below of
10-7 S cm-1 at room temperature (Tachez et al. 1984).
The emphasis of this work is to develop a better understanding of the effect of hot pressing
temperature on the microstructure and electrochemical performance of 75Li2S-25P2S5 as a
potential solid electrolyte for electric vehicle batteries.
The following section will focus on the techniques conducted to prepare and characterize the
microstructure and electrochemical stability of the 75Li2S-25P2S5 samples.
1.5 Ceramic electrolyte processing and characterization techniques
1.5.1 Planetary ball milling
The mechanical milling technique, which uses a high-energy ball mill, has attracted much
attention as a new procedure for preparing inorganic amorphous/metastable materials instead of a

15
conventional melt-quenching method. (Hayashi et al. 2001) It was first demonstrated for Li2S-SiS2
compositions and then expanded to the Li2S-P2S5. (Nazri et al. 2003) The use of mechanochemical
milling offers several advantages over the melt quenching method: i) basically a room temperature
process, and 2) total energy consumed is still less than that used in a melt-quench process even
though achieving complete amorphization requires about 20 hours of milling time. Additionally,
the resulting fine-grained powder is ready to fabricate directly as a pressed pellet or as the
electrolyte layer in a compacted solid-state battery. In comparison, the lithium ion conductivities
achieved by ball milling were as high or nearly as high as that of glasses prepared by rapid quench
of the same composition. (Hayashi et al. 2001; Nazri et al. 2003)
Hayashi et al. (2002) obtained sulfide glassy electrolytes that exhibited high Li-ion
conductivities over 10-4 S/cm at room temperature, a wide electrochemical potential window of
10V, and also reported that the crystallization of the Li2S-P2S5 glasses prepared by mechanical
milling improves their conductivities.
For this work, Li2S-P2S5 amorphous material was prepared from Li2S and P2S5 (reagent-grade
Aldrich, 99%) crystalline powders. The mixture was mechanically milled at room temperature by
a planetary ball-mill apparatus (Fritsch Pulverisette 7) using an alumina jar (volume of 45 mL)
with twenty alumina balls, 10 balls of 10 mm in diameter and ten balls of 5 mm in diameter. The
milling time was 20 h and the rotation speed was 370 rpm. All the processes were performed in a
dry, Ar-filled glove box. In this work, Dr. Mizuno from Toyota (Ann Arbor, MI), prepared LPS
powders for hot pressing and DC cycling experiments at MSU.

16
1.5.2 Densification of sulfide electrolytes
The temperature at which the sulfide experiences the transition from a rigid glass to a rubbery
state is termed the glass transition temperature (Tg). Tg is a function of the heating/cooling rate;
the transition temperature shifts to higher temperatures with increasing heating rates. The
viscosity of a glass at Tg is quite large and on the order of 1015 Pa*s, which in turn implies that
atomic mobility is quite low (Barsoum 2003). The transition temperature can be determined by
measuring the specific volume as a function of the heating/cooling rate (Figure 5). The
temperature at which the property changes slope continuously is defined as the glass transition
temperature (Barsoum 2003).
Figure 5. Schematic of specific volume changes observed as a glass is heated through Tg
(Callister 2007)
The sulfide glass crystallizes between Tg and the melting point. For the crystalline material, there
is a discontinuous change in specific volume at the melting temperature Tm. The profile for the
totally amorphous material is continuous bus experiences a decrease in slope at the glass transition
temperature. The behavior is intermediate between these extremes for a semicrystalline material in

17
that both melting and glass transition phenomena are observed; Tm and Tg are properties of the
respective crystalline and amorphous phases in this semicrystalline material. The behaviors
represented in this figure will depend on the rate of cooling or heating (Callister 2007)
A material microstructure can be altered by heating it to a temperature T below its melting
temperature through sintering. Typically 2/3 Tm < T < Tm. The macroscopic driving force operative
during sintering is the reduction of the excess energy associated with surfaces. This can happen by
1) reduction of the total surface area by an increase in the average size of the particles, which leads
to coarsening, and/or 2) the elimination of solid/vapor interfaces and the creation of grain boundary
area, followed by grain growth, which leads to densification. These two mechanisms are usually in
competition. If densification dominates, the pores get smaller and disappear with time and the
compact shrinks, but if the atomic processes that lead to coarsening are faster, both the pores and
grains get larger with time (Barsoum 2003).
Dense pellets of sulfide electrolytes can be obtained by pressing at room temperature. In the case
of Li2S-P2S5 glasses, densification results from cold pressing. The relative density increases with
increasing applied pressure:
18
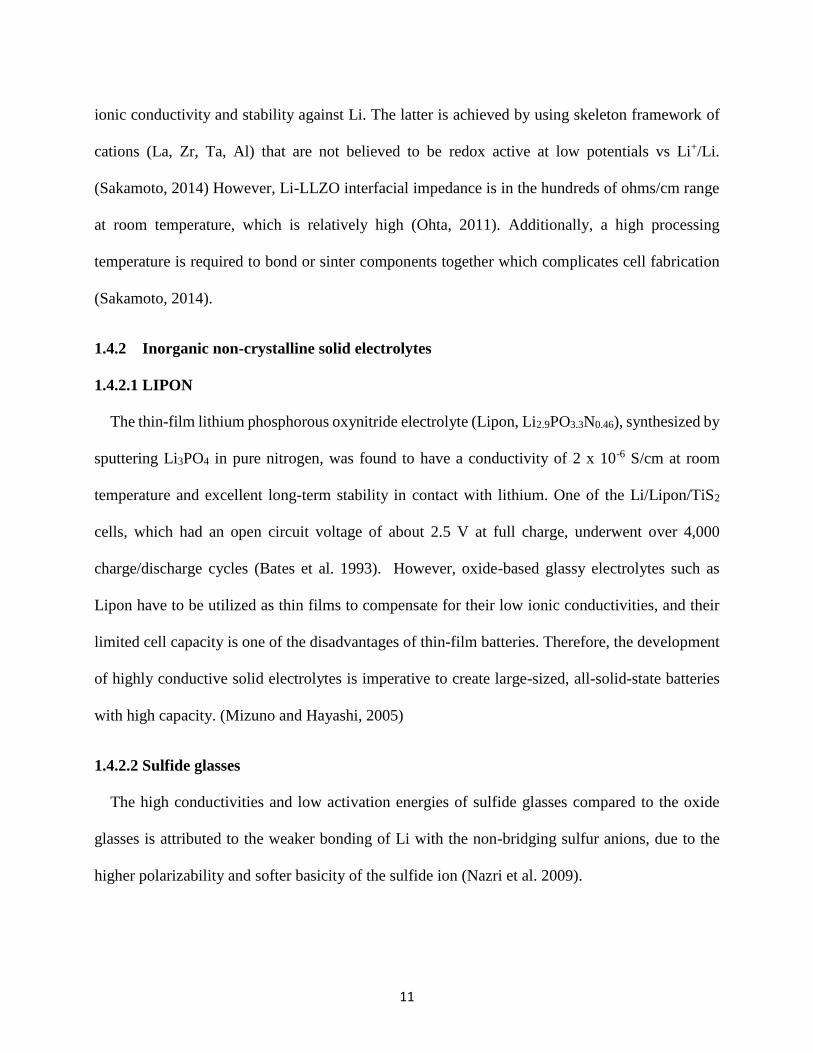
Figure 6. a) Densification pressure dependence of 75Li2S-25P2S5 (mol%) glass solid electrolyte,
b) SEM image of 75Li2S-25P2S5 glass powder. SEM images of fracture cross-sections of 75Li2S-
25P2S5 glass powders pressed at c) 74 and d) 360MPa (Sakuda et al. 2013)
The relative density exceeds 90% when the 75Li2S-25P2S5 glass powder is compressed by a
pressure of over 350MPa. Thus, 75Li2S-25P2S5 glass with a remarkably high relative density can
be obtained by pressing without heat treatment as it was confirmed by Scanning Electron
Microscopy images (Figure 5.b-d) by the quantity of pores observed per unit area/volume. This
behavior is seen in the Li2S-P2S5 system due to the relatively low Young’s modulus making room
temperature densification effective (Sakuda et al. 2013). By hot-pressing the solid electrolyte near
the glass transition temperature (~170 °C), higher density pellets were attained (Kitaura 2011).
Kitaura et al. (2011) optimized the hot pressing temperature and time of 80Li2S-20P2S5 powders
to obtain an entirely translucent pellet. The degree of densification was evaluated qualitatively:

19
Figure 7. Photographs of the pellets of the 80Li2S-20P2S5 sample pressed at a) room temperature,
b) 180°C, c) 210°C and d) 240°C for 2h, and e) 210°C for 4h (Kitaura et al. 2011)
From the pictures shown above, the translucent pellet was obtained by pressing at 210°C for 4h
under 360MPa. The translucence of the pellet pressed at 200°C was ascribed to an increase in
transmittance by the disappearance of voids between particles or an increase in density. The
transition from amorphous to glass occurred by pressing around the glass transition temperature.
In contrast, crystallization and light scattering off grain boundaries leads to an opaque pellet (d)
after pressing around the crystallization temperature of 240°C. Moreover, the pellet pressed at
210°C showed the higher conductivity of 8.8 x 10⁻⁴ S/cm compared to the conductivity of 3.7 x 10-
4 S/cm in the pellet pressed at room temperature. The decrease in grain boundary and voids
increased the conductivity of the different samples (Kitaura et al. 2011).
Measuring a solid electrolyte shear modulus is important to predict lithium dendrite
penetration across a solid electrolyte (Monroe and Newman 2005). According to Newman et al,
dendrite propagation is prevented when the shear modulus is three or more orders of magnitude
higher than that of metallic Li (≥20 GPa). The latter also implies a high relative density and almost
negligible interconnected porosity. Sakuda et al. (2013) measured the Young modulus of Li2S-
P2S5 glassy solid electrolytes for four different Li2S contents (figure 7) High-density pellets were
prepared by hot pressing at their respective glass transition temperatures. The Young’s modulus of
xLi2S*(100-x)P2S5 (mol%) glasses (x = 50 – 80) increased with increasing Li2S content. The
10mm

20
Young moduli are in the range of 18 – 25 GPa. 75Li2S*25P2S5 showed a Young’s modulus of 24
GPa. (Sakuda et al. 2013)
Figure 8. Young’s modulus of xLi2S*(100-x)P2S5 (mol%) glass pellets prepared by hot press and
cold press at 360 MPa (Sakuda et al. 2013)
In the present work, the amount of sample (~0.5g), time at target temperature (4h), cold-press
(360MPa) and hot-press pressure (47MPa) were held constant while the target temperature was
varied from 130 to 190°C with increments of 10°C between temperatures. The sample was
compressed in a half-inch stainless steel (SS) die with two SS half-inch plungers in a double acting
configuration and heated up by resistance heating.

21
Figure 9. Schematic of a double acting die configuration
1.5.3 Electrochemical characterization
1.5.3.1 Electrochemical Impedance Spectroscopy (EIS)
EIS is a technique for characterizing the conductivity of electrolytes. AC (alternating current)
impedance measurements are made over a range of frequencies to separate transport phenomena
based on their relaxation times or time constants (Irvine et al. 1990). In a typical EIS experiment
(Figure 9), the solid electrolyte is located between two ionically-blocking interfaces (also known
as blocking electrodes) that are adjacent to the electronic conductors employed as electrodes.
Generally, it is assumed that the electrical current within the solid phase between the electrodes is
carried by ionic species, but they are blocked at the electrolyte/electrode interface, whereas the
transport of electrons is not. The experimental results, impedance data, are represented in the form
of imaginary (capacitive) against real (resistive) impedances. (Huggins, 2009; Irvine et al. 1990)
Thermocouple – top of the die
Thermocouple – side of the die
0.5 in graphite spacer 75Li2S-25P2S5
Molybdenum foil
0.5 in SS plunger

22
Figure 10. Experimental arrangement generally used for variable frequency AC measurements to
evaluate ionic transport in a solid electrolyte
An equivalent circuit can model the frequency dependent data described. The interface of a solid
electrolyte, considered a purely ionic conductor, and a purely electronic conductor can be
represented as a parallel plate capacitor. The electrolyte acts as a resistance that the charge must
pass and the capacitive properties of the two electrolyte/electrode interfaces are combined into a
single capacitance (Cint). An electrical equivalent circuit that consists of the resistance arranged in
series with the capacitance represents the low-frequency behavior of an electrochemical cell.
At higher frequencies, an additional capacitance that corresponds to the presence of the
electrolyte with a finite dielectric constant must be included (Cgeom). This new configuration, or
Debye circuit, in which the extra parallel capacitance acts across the whole configuration, can be
represented as following:
Solid
electrolyte Electronic
Conductor
Electronic
Conductor
Ionically-blocking
interfaces
23
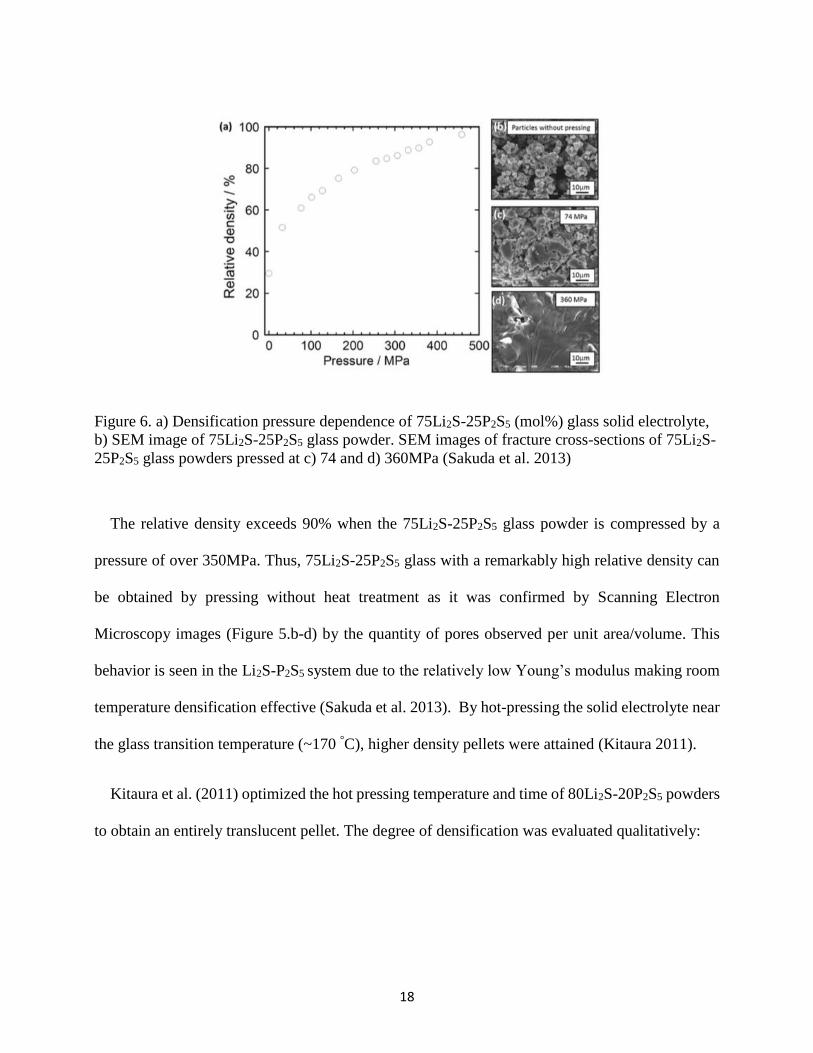
Figure 11. Schematic complex plane plot of the Debye equivalent circuit (Huggins, 2009)
Each parallel resistive-capacitive element gives rise to a semicircle from which the resistance
and capacitance values may be extracted (Irvine et al. 1990). Through the evaluation of the relative
values of the intercepts upon the real impedance axis provides information about the ionic or total
resistance. Based on the frequency response of each transport phenomenon, a semi-circle arises
over a range of capacitance values as shown in the table below
Capacitance (F) Phenomenon Responsible
10-12 Bulk
10-11 Minor, second phase
10-11 – 10-8 Grain boundary
10-10 – 10-9 Bulk ferroelectric
10-9 - 10-7 Surface layer
10-7 - 10-5 Sample-electrode interface
10-4 Electrochemical reactions
Table 1. Capacitance values and their possible interpretation (Irvine et al. 1990)

24
The interface between electrolyte and electrode can give information on the nature of the
conducting species within the electrolyte by the impedance response measured. A common
experimental observation is that the low-frequency tail in complex impedance plots is not truly
vertical, as it would be expected for a completely blocking electrode interface that acts like a
frequency-independent electrical double-layer capacitance. A straight line inclined at a finite angle
from the vertical is observed when the electroactive species is not blocked at the interface, but
diffuses into or out of one or both the electrodes due to solubility between the mobile ion and the
electrode. According to Fick’s second law, the low-frequency data are represented by a straight
line with a slope of 45°. This involves the introduction of “admittance”, or “Warburg impedance”,
into the equivalent circuit. (Huggins, 2009)
Surface layers are another type of phenomenon that can be analyzed through impedance
spectroscopy, which are often found on ceramics or glasses. The presence of this “film” appears in
the spectrum as a semicircle at lower frequencies. Without this layer the low-frequency behavior
expected would be a nearly vertical line representing charge build-up at the blocking metal
electrodes. It is then possible to study the conditions for formation/removal of the surface layer and
the associated kinetics. (Irvine et al. 1990)
In the present study, Li-ion conductivity of 75Li2S-25P2S5 and total cell resistance was
determined using AC Electrochemical Impedance Spectroscopy (EIS) through Nyquist plots
(Figures 17 – 20). A VersaSTAT4 potentiostat covered the frequency range of 50 mHz to 800 kHz,
with an applied voltage of 20mV, nickel pins as current collectors and Li metal as non-blocking
electrodes. The cells were tested after the sample powders were densified into pellets with 12.7
mm in diameter and ~ 2 mm in thickness (see table 2 and 3 for accurate measurements) in a custom

25
designed load frame that applied a constant pressure of 316 kPa during electrochemical
measurements.
1.5.3.2 Preconditioning
A DC technique used to pass Li-ions through the LPS pellets moving between Li metal anodes.
A low current density of 0.01mA/cm2 was applied in both directions to acquire a stable interphase
between the electrodes and electrolyte. Room temperature preconditioning of 10 cycles was
conducted on the eight pellets that were tested through AC impedance measurements and DC
asymmetric polarization tests. Seven hot-pressed pellets were pressed between 130°C and 190°C.
To serve as a baseline, one pellet was pressed at room temperature.
1.5.3.3 DC asymmetric polarization method
Attempting to demonstrate the maximum current density that LPS can withstand was above
1mA/cm2 (relevant for EVs), a range of current densities was applied to the solid electrolyte.
This test begins by applying a low current density of 0.01 mA/cm2 for an hour in one orientation,
follow by a 0 V hold to re-equilibrate the cell to open circuit equilibrium conditions. The DC
polarization and 0V hold was followed by an AC impedance measurement to determine the
impedance of the cell. After the AC measurement another 0 V hold for thirty minutes was used to
re-equilibrate the cell. After the 0.01 mA/cm2 hold, higher current densities were applied using the
same sequence of 0V holds and EIS. The range of current densities was: 0.01, 0.05, 0.1, 0.5 and
1.0 mA/cm2. If the Li/LPS/Li cell is stable, ohmic behavior is expected. If lithium metal penetrates,
deviation from ohmic behavior should be observed and manifested as a drop in polarization voltage
since Li metal propagating reduces cell resistance. Asymmetric, as opposed to symmetric, cycling

26
was used to allow the tracking of the trajectory of lithium metal propagating from one Li anode to
the opposite anode.
1.6 Materials characterization techniques
1.6.1 X-Ray Diffraction (XRD)
X-Ray Diffraction is a technique used to identify crystalline phases present in materials and to
measure the structural properties (strain state, grain size, phase composition, preferred orientation
and defect structure) of these phases. The intensities measured as a function of diffraction angle
can provide quantitative, accurate information about long range atomic order. It is more sensitive
to high Z-elements, since X-ray diffraction occurs off the electron shell. Thus, the diffraction peak
intensity is higher for large Z-elements than low Z-elements (Brundle et al. 1992)
For this work, the crystallinity as a function of hot pressing temperature was characterized by
X-Ray diffraction measurements on a Rigaku Smartlab diffractometer using Cu Kα 1.54 radiation
within the 2θ range of 10-70°. Before the measurements, the samples were grinded into powder
and then sealed with Kapton film in an argon-filled glove box to avoid any moisture contamination
from the atmosphere. Measurements were obtained at Toyota Motor Engineering & Manufacturing
North America, Inc, Ann Arbor, MI.
1.6.2 Differential Scanning Calorimetry (DSC)
Many of the physical or chemical transformations are associated with heat absorption or
exothermic processes. DSC measures the differential heat flow between an inert reference and the
sample upon heating or cooling at a particular rate or under isothermal conditions. Only in the case
of a thermal event characteristic of a particular material, the differential heat flow will exist. Unlike
differential thermal analysis (DTA), DSC can quantify the thermal events. (Sibilia, 1988)

27
For this work, Differential Scanning Calorimetry was conducted in a TA instrument, Q-100
under nitrogen gas flow. The samples were loaded in a hermetic pan and then closed with the
corresponding lid in an Argon-filled glove box to keep the inert environment. The weight of the
sample was measured in advance and the generated heat was monitored as a function of
temperature. The scan rate was changed in the range between 0.7 and 5°C/min. Measurements were
obtained at Toyota Motor Engineering & Manufacturing North America, Inc, Ann Arbor, MI.
1.6.3 Scanning Electron Microscopy (SEM)
SEM provides high depth of field, high magnification topographic analysis. The resolution of
these instruments is approximately two orders of magnitude better than optical microscopes and
one order of magnitude less than transmission electron microscopes (TEM), thereby bridging the
gap between these related techniques. SEM imaging is often preferred in place of optical imaging
because of the enhanced depth of field. (Sibilia, 1988)
For this work, the morphology of the samples was studied using a Field Emission JEOL JSM-
7800F Scanning Electron Microscope. The samples were sealed in an air-free vessel under argon
inside of a glove box and transferred to the SEM chamber without air contamination.
Measurements were obtained at Toyota Motor Engineering & Manufacturing North America, Inc,
Ann Arbor, MI.

28
2. The effect of hot pressing temperature on the electrochemical stability of Li2S-P2S5 (75 –
25 % mole)
2.1.Introduction
LPS is an attractive solid electrolyte to enable solid-state batteries employing metallic Li anodes,
owing to its high ionic conductivity (~1mS/cm) at 25 oC and low cost (Takamasa, 2013; Takeuchi,
et al. 2014). Therefore, its stability against metallic lithium must be understood. The purpose of
this work was to characterize the effect of LPS processing conditions and their effect on Li stability.
Typically, LPS-based electrolytes are densified at room temperature through the application of
several hundreds of MPa (Sakuda). While relative densities in the 90 % range may be acceptable
to study ionic transport measurement using EIS, higher densities may be necessary to prevent Li
metal penetration during DC cycling of batteries. It follows that, hot pressing LPS was investigated
to increase relative density. Moreover, by hot pressing, we tried to gain a better understanding how
the densification conditions may affect LPS microstructure, chemical stability and electrochemical
performance.
A series of experiments was conducted to characterize the effect of the hot pressing
temperature on the bulk and electrochemical properties of 75Li2S-25P2S5. Two groups of 7 pellets
were hot-pressed from 130°C to 190°C plus two cold-pressed pellets were left as base-line for
comparison to the hot-pressed pellets (Table 2 and 3). To characterize the effect of hot pressing
temperature and DC cycling, the changes in the atomic ordering and microstructure were
characterized using differential scanning calorimetry (DSC), X-ray diffraction (XRD), optical
microscopy, and scanning electron microscopy (SEM). Further, the electrical (ionic and electronic)
properties were characterized using AC impedance measurements.

29
2.2. Results and Discussion
2.2.1. Evaluating the effect of hot pressing temperature on LPS bulk properties
Since hot-pressing is known to promote chemical bonding between particles (Barsoum
2003), it is expected that hot-pressed pellets should be less prone to Li dendrite penetration
compared to cold-pressed LPS. Furthermore, hot-pressing can reduce the porosity of the sample
and presumably increase the Shear Modulus of the material. Monroe et al (2005) showed that if a
solid-electrolyte has a shear modulus of > 20 GPa, Li dendrites should not propagate. The purpose
of this work was to attain the highest density pellet by hot pressing LPS amorphous material near
the glass transition temperature.
2.2.1.1. Densification conditions
Kingery (1963) stated that to achieve the highest densities, the principal considerations are
extremely small particle size starting material and the temperature at which the powder transforms
to a strong, dense body upon heating. Typically, 2/3 of the homologous temperature is the
minimum hot-press temperature required to establish chemical bonding. However, in this work,
hot-pressing was conducted below the LPS homologous temperature (~ 673 K) (Minami, K), to
prevent crystallization, which occurs at approximately 220 oC based on DSC profiles (Figure 13).
Additionally, Sakuda et al. 2013 showed that hot-pressing was effective in densifying comparable
LPS formulations below 2/3 the homologous temperature.
The temperature regime selected covered the glass transition temperature (Tg) region obtained
from a DSC analysis with a heating rate of 5°C/min, identified between 140°C and 180°C.
Nevertheless, a broader temperature range was used with the supposition that the crystallization

30
temperature along with the glass transition temperature may change with an applied pressure to the
system. The temperature range selected was between 130°C and 190°C.
The hot pressed samples had a relative density between 72±1% and 86±1%, being the
lowest at 180°C and the highest at 140°C (Table 2 and 3). The relative densities obtained for the
samples pressed at room temperature were 77±1% and 80±1%. No clear correlation between hot
pressing temperature and relative density can be concluded from this data set even though previous
work from Sakuda et al. (2013) and Kitaura et al. (2011) showed that translucent pellets can be
attained at pressures above 350MPa during four hours of hot-pressing time. Although it may be
taken into account that for this work, crack-free pellets could not be obtained by cold-pressing and
hot-pressing at 360MPa due to residual stress presumably. Therefore, cold-press pressure and hot-
press pressure were fixed at 360MPa and 47MPa, respectively (Figure 11). 47 MPa was selected
as the hot pressure because previous experiments (not shown) demonstrated this pressure can
produce crack-free, hot-pressed LPS pellets. After hot-pressing, the relative density was
determined using a theoretical 1.88 g cm-3 corresponding to a 75Li2S-25P2S5 transparent pellet
obtained by Sakuda, et al. (2013), hot-pressed at 190°C at 360 MPa. Following are the samples
prepared for this study. The pressing conditions and pellet properties are listed in Table 2.
Figure 12. Schematic of the pressure and temperature profiles followed during hot
pressing tests

31
Temperature
Room
temperature-
CP - B
130°C
(HP-21)
140°C
(HP-22)
150°C
(HP-23)
160°C
(HP-24)
170°C
(HP-25)
180°C
(HP-26)
190°C
(HP-27)
Appearance
Batch 59 44 45 46 47 48 49 50
Thickness
(mm) 2.02 2.30 2.40 1.90 2.29 2.36 2.08 2.26
Average
temperature,
top of the die
(°C)
N/A 112.1±1.9 130.0±0.7 104.0±0.6 148.4±1.0 161.4±1.4 178.8±4.4 178.1±5.3
Average
temperature,
side of the die
(°C)
N/A 130.4±0.6 140.4±0.9 150.2±0.8 160.4±0.8 170.4±2.2 180.5±0.9 190.1±1.3
ΔT (°C) N/A 18.3±2.0 10.4±1.2 46.1±1.0 12.0±1.3 9.0±2.6 1.7±4.5 12.0±5.4
Time at target
temperature
(h)
N/A 4.0 4.0 4.0 4.0 4.0 4.0 4.0
Cold-pressed
pressure
(MPa)
360 360 360 360 360 360 360 360
Hot-pressed
pressure
(MPa)
N/A 47 47 47 47 47 47 47
Average trace
of oxygen
(ppm)
1.10 0.67 0.80 1.15 1.23 0.94 0.71 1.05
Density,
g/cm3
(relative
density, %)
1.50 (80) 1.51 (80) 1.62 (86) 1.51 (80) 1.53 (81) 1.46 (78) 1.54 (82) 1.45 (77)
Table 2. 75Li2S-25P2S5 hot pressed pellets (12.7mm in diameter) between 130°C and 190°C for electrochemical performance
analysis– Data set no.1

32
Temperature
Room
temperature
CP - A
130°C
(HP-28)
140°C
(HP-29)
150°C
(HP-30)
160°C
(HP-31)
170°C
(HP-32)
180°C
(HP-33)
190°C
(HP-34)
Appearance
Batch 58 51 52 53 54 55 56 57
Thickness
(mm) 2.22 2.28 2.32 2.42 2.28 2.29 2.22 2.08
Average
temperature,
top of the die
(°C)
N/A 121.6±3.9 121.8±1.0 152.1±3.7 151.8±3.7 155.2±1.3 160.2±1.0 176.8±2.4
Average
temperature,
side of the die
(°C)
N/A 130.0±1.2 140.7±1.2 150.2±1.3 160.8±0.5 170.3±1.6 180.4±0.9 190.6±0.9
ΔT (°C) N/A 8.5±4.1 18.9±1.6 1.9±4.0 9.0±3.8 15.1±2.0 20.1±1.4 13.8±2.6
Time at target
temperature (h) N/A 4.0 4.0 4.0 4.0 4.0 4.0 4.0
Cold-pressed
pressure (MPa) 360 360 360 360 360 360 360 360
Hot-pressed
pressure (MPa) N/A 47 47 47 47 47 47 47
Average trace
of oxygen
(ppm)
1.22 1.25 1.78 1.77 1.74 1.63 1.23 1.27
Density, g/cm3
(relative
density, %)
1.45 (77) 1.36 (72) 1.41 (75) 1.40 (75) 1.48 (79) 1.39 (74) 1.35 (72) 1.39 (74)
Table 3. 75Li2S-25P2S5 hot pressed pellets (12.7mm in diameter) between 130°C and 190°C for materials characterization–
Data set no.2
33
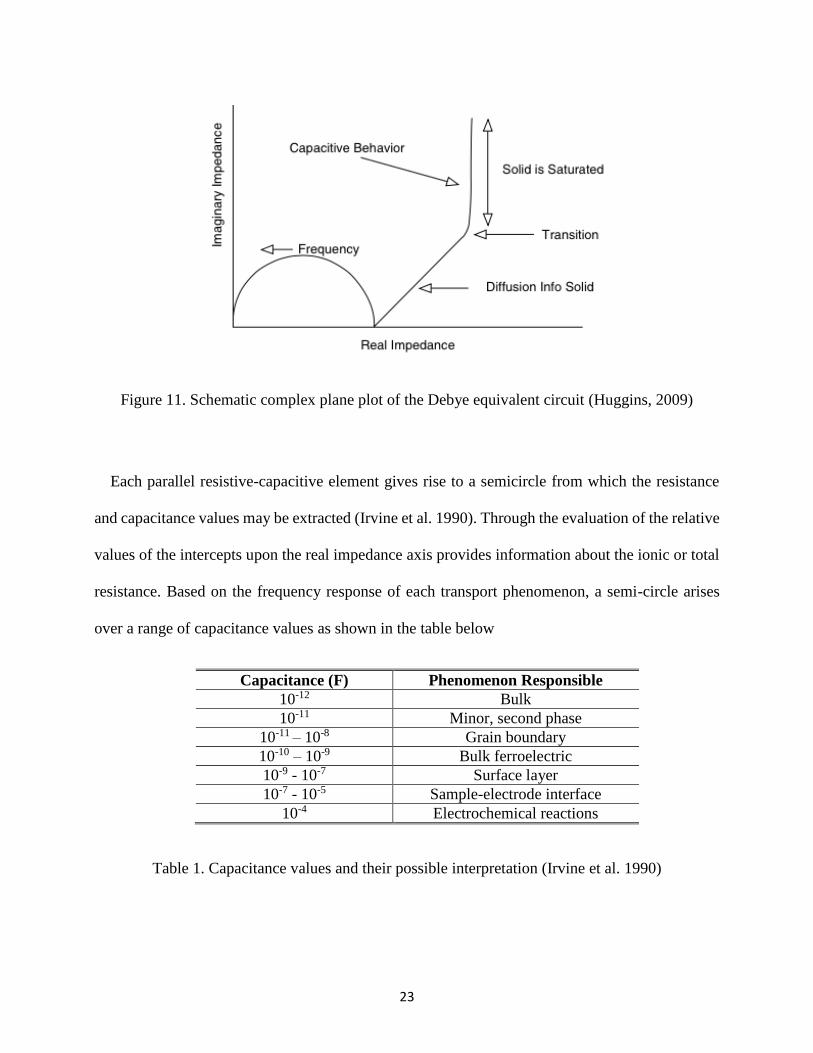
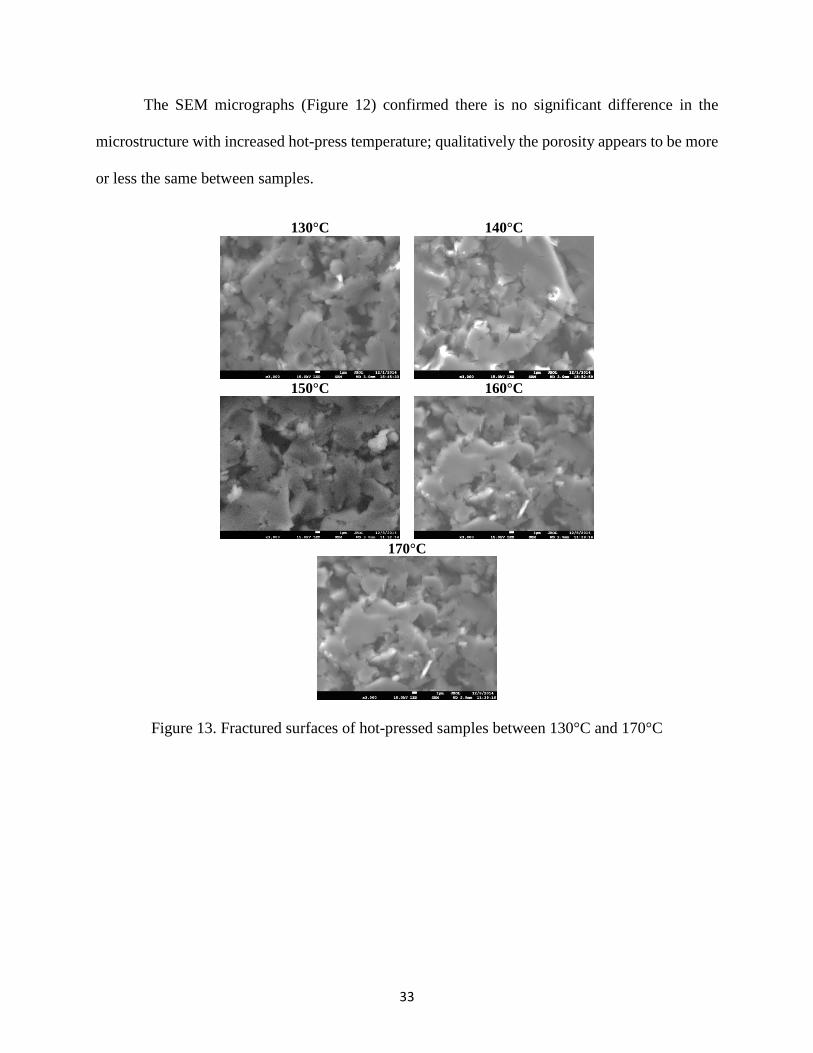
The SEM micrographs (Figure 12) confirmed there is no significant difference in the
microstructure with increased hot-press temperature; qualitatively the porosity appears to be more
or less the same between samples.
130°C 140°C
150°C 160°C
170°C
Figure 13. Fractured surfaces of hot-pressed samples between 130°C and 170°C

34
2.2.1.2. Chemical transformations
Differential Scanning Calorimetry (DSC) was performed to detect a physical or chemical
transformation on the bulk properties of LPS. DSC analysis revealed that all LPS powder prepared
by planetary ball milling used in DC cycling tests is sufficiently comparable between batches,
having a crystallization peak within the range of 220-230°C (Figure 13, heating rate of 5°C/min)
except for batch 49 (hot pressed at 180°C) that showed an extra peak in the range of 190 – 200 °C.
Therefore, the results obtained from this batch are not going to be considered in further discussions.
Figure 14. DSC spectra of Li2S-P2S5 (75 – 25 % mole) powder as prepared
-0.3
-0.2
-0.1
0
0.1
0.2
0.3
0.4
0.5
0.6
0.7
50 100 150 200 250 300
He
at f
low
[W
/g]
Temperature ( °C)
LPS-Batch44 LPS-Batch45 LPS-Batch46 LPS-Batch47
LPS-Batch48 LPS-Batch49 LPS-Batch50

35
Figure 15. Effect of hot pressing at 130 and 140oC on DSC spectra of 75Li2S-25P2S5
From figure 14, it is shown that the DSC spectra changed after hot pressing it (HP-28-130C
and HP-29-140C). Hot pressing not only broadens the temperature range in which the exothermic
process takes place, but also the rate at which the energy is released is slower in comparison to the
sharp peak (fast release of energy) seen in powders that were only thermally treated (no pressure
during heating in the DSC). Both hot pressed pellets showed relatively the same profile even
though the hot-pressed temperatures were 10°C apart. As discussed in more detail below, the
additional exothermic peaks after hot pressing are likely consistent with partially crystallized LPS.
-0.3
-0.2
-0.1
0
0.1
0.2
0.3
0.4
0.5
0.6
0.7
50 100 150 200 250 300
He
at f
low
[W
/g]
Temperature ( °C)
LPS-HP28-130C LPS-HP29-140C
LPS-Batch51-HT130C LPS-Batch51-HT140C

36
2.2.2. Evaluating the chemical and electrochemical stability of LPS
2.2.2.1. AC Impedance measurements and DC cycling
Different electrochemical tests were combined to characterize the stability of LPS during
lithium cycling. Preconditioning was conducted (Fig. 15) on each of the pellets (data set no.1) to
decrease the interfacial impedance between Li electrodes and LPS electrolyte. Moreover, AC
impedance measurements are performed before and after every test to monitor the impedance of
the electrolyte throughout the entire test.
Figure 16. Li/75Li2S-25P2S5/Li cell preconditioning at room temperature, 0.01 mA/cm2
For this data set, the polarizations in DC (Figure 15) agreed adequately with the cell impedances
observed in AC (Figures 16 and 17), slightly above for the cold pressed pellet, and the hot-pressed
samples at 180°C and 190°C. From Figure 15, it is clear that the cell with the pellet pressed at
room temperature has the highest resistance, reflected as the highest polarization among samples.

37
Pressing temperature (°C) Room
temperature
130°C
(HP-21)
140°C
(HP-22)
150°C
(HP-23)
160°C
(HP-24)
170°C
(HP-25)
180°C
(HP-26)
190°C
(HP-27)
Pellet area (cm2) 1.273 1.251 1.259 1.261 1.267 1.265 1.271 1.259
Pellet thickness (cm) 0.202 0.230 0.240 0.190 0.229 0.236 0.208 0.226
Area/thickness, A/l (cm) 6.32 5.44 5.26 6.62 5.53 5.37 6.12 5.58
75Li2S-25P2S5 resistance
(Ohm) – AC measurement before
preconditioning
1091 897.88 876.34 484.76 557.98 498.36 589.46 661.58
Current (A) 1.27E-05 1.25E-05 1.26E-05 1.26E-05 1.27E-05 1.26E-05 1.27E-05 1.26E-05
V predicted (V) 0.014 0.011 0.011 0.006 0.007 0.006 0.007 0.008
V observed (V) 0.017 0.012 0.010 0.006 0.008 0.007 0.009 0.011
Table 4. Li/LPS/Li cell preconditioning at room temperature
The Nyquist plots before preconditioning (Figure 16 and 17) confirms through AC
measurements that the cold-pressed pellet possess the highest resistivity to lithium transport in
comparison to all the hot-pressed pellets, equal to 6900 Ohms*cm. This might be an indicator
that hot-pressing may change Li ionic transport. Moreover, the cell impedance decreased with
increasing hot pressing temperature from 130°C to 170°C.

38
Figure 17. Nyquist plot of Li/LPS/Li cell before preconditioning at room temperature - Cold-
pressed pellet
0
500
1000
1500
2000
2500
3000
5000 5500 6000 6500 7000 7500 8000
Re
sist
ivit
y -
Im (
Oh
m*c
m)
Resistivity -Real (Ohm*cm)
Room T
Z CHARGE TRANSFER
Zbulk
ZBULK + ZCHARGE TRANSFERZIONIC-LPS

39
Figure 18. Nyquist plot of Li/LPS/Li cell before preconditioning at room temperature -Hot-
pressed samples
After the preconditioning step (Figure 18 and 19), all samples showed a decrease in impedance
as expected excluding the hot-pressed pellets at 180°C and 190°C and the cold-pressed pellet. This
increase in resistance might be due to the formation of a resistive surface layer between the
electrode and electrolyte. This would indicate chemical instability of the solid electrolyte against
metallic lithium.
0
500
1000
1500
2000
2500
3000
3500
2000 2500 3000 3500 4000 4500 5000 5500
Re
sist
ivit
y -
Im (
Oh
m*c
m)
Resistivity -Real (Ohm*cm)
130C
140C
150C
160C
170C
180C
190C

40
Figure 19. Nyquist plot of Li/LPS/Li cell after preconditioning at room temperature - Cold-
pressed pellet
0
500
1000
1500
2000
2500
3000
3500
4000
4500
5000
4000 5000 6000 7000 8000 9000
Re
sist
ivit
y Im
(O
hm
*cm
)
Resistivity - Re (Ohm*cm)
Room T

41
Figure 20. Nyquist plot of Li/LPS/Li cell after preconditioning at room temperature -Hot-pressed
samples
The following figure is another representation of figures 18 and 19, but it points out more clearly
that the pellets hot pressed at 150°C and 170°C had the lowest ionic impedances, especially 170°C
equal to 2,344 Ohm*cm, corresponding to an ionic conductivity of 0.4 mS/cm.
0
500
1000
1500
2000
2500
3000
2000 2500 3000 3500 4000 4500 5000
Re
sist
ivit
y Im
(O
hm
*cm
)
Resistivity - Re (Ohm*cm)
130C
140C
150C
160C
170C
180C
190C
ZLPS -170°C

42
Figure 21. 75Li2S-25P2S5 resistance (normalized by its aspect ratio) after preconditioning
After the preconditioning step was finished, a DC asymmetric polarization was conducted where
lithium is passed through the Li/LPS/Li cell over a range of current densities. The idea of moving
lithium in only one direction is to accurately identify (if any) the starting point where lithium
penetrates and propagates through the electrolyte.
0
1000
2000
3000
4000
5000
6000
7000
8000
0 20 40 60 80 100 120 140 160 180 200
Re
sist
ivit
y -
Re
al (
Oh
m*c
m)
Hot pressing temperature (°C)

43
Figure 22. DC asymmetric polarization test at room temperature
For the first two current densities, 0.01 mA cm-2 and 0.05 mA cm-2 ohmic behavior was observed
for all samples. At 0.1 mA cm-2 a significant increase in polarization, thus an increase in resistance
for the cold-pressed pellet is evident. At 0.5 mA cm-2 all samples except for the one hot pressed at
170°C, the potential decreased significantly at some point within this current density. The decrease
in potential is believed to be related to the formation of an electronically conducting phase that
propagates between Li electrodes through the LPS; also referred to as a short circuit. Figure 22
markedly shows that the LPS powder hot-pressed at 170°C was the most electrochemically stable
among this dataset. It was determined that 0.76 mA*h cm-2 of charged passed in order to decrease
its potential from 8.63 V down to 0.99 V, i.e. cause the short circuit.
0
2
4
6
8
10
12
0
0.5
1
1.5
2
2.5
0 5000 10000 15000 20000
Po
lari
zati
on
(V
)
Po
lari
zati
on
(V
)
Time (s)
0.01mA/cm2
0.05mA/cm2
0.1mA/cm2
0.5mA/cm2
1.0mA/cm2
HP - 130°C
HP - 140°C
HP- 150°C
HP- 160°C
HP-170°C
HP-180°C
HP-190°C
Room T
≥ 0.5 mA/cm2 on right axis

44
Figure 23. Total charge passed through Li/75Li2S-25P2S5/Li cell before significant drop in
potential is observed in DC asymmetric polarization test
Additional evidence of short circuiting was observed in the AC measurements for the pellets
hot pressed at 180°C and 190°C (HP-26 and HP-27). The lack of any capacitance (imaginary axis
data) suggests that electronic conduction is the dominant transport mechanism as indicated in
Figure 23. Additionally, negative imaginary data indicated inductance, which is also consistent
with only electronic conduction.
0.00
0.10
0.20
0.30
0.40
0.50
0.60
0.70
0.80
0.90
0 20 40 60 80 100 120 140 160 180 200
Tota
l ch
arge
pas
sed
be
fore
ΔV
(m
A*h
/cm
2)
Hot pressing temperature (°C)

45
Figure 24. Nyquist plot of Li/LPS/Li cell after DC asymmetric polarization at room temperature
– Hot-pressed pellets at 180°C and 190°C
-200
-150
-100
-50
0
50
100
150
200
0 100 200 300 400
Re
sist
ivit
y -
Im (
Oh
m*c
m)
Resistivity - Re (Ohm*cm)
180C 190C

46
2.2.2.2. Cross-sectional analysis
After the AC impedance measurements and DC cycling tests were completed, cross-sectional
analysis was performed at MSU to identify the starting point where the electronically conductive
phase initiates and propagates.
Pressing temperature Plating side Cross-section Stripping side
Room temperature
12.7mm
130°C
140°C
150°C
Figure 25. Cross-sectional analysis on cold-pressed and hot-pressed pellets between 130°C and
150°C

47
Pressing temperature Plating side Cross-section Stripping side
160°C
170°C
180°C
190°C
Figure 26. Cross-sectional analysis on cold-pressed and hot-pressed pellets between 160°C and
190°C
All samples, except for the pellets hot-pressed at 140°C and 160°C, showed dendrite or
decomposition phase penetration. Only the cold-pressed pellet and the pellets hot-pressed at 180°C
and 190°C showed that the Lithium/decomposition phase started to propagate from the plating side
going through the pellet until it reached the opposing electrode. Additionally, it was observed that
the geometry of the penetration changed as the hot-press temperature increased. For example, the
high-temperature pressed pellets (180°C and 190°C) shown a needle-shape penetration. Based on
the DC asymmetric profiles, two different penetration mechanisms could be occurring. The first

48
mode of propagation can be represented by a sharp peak that decreases the voltage down to almost
zero volts vs Li+/Li. The second mode of propagation can be represented by a voltage profile that
decreases more gradually and with substantially more instability. The cold-pressed pellet and the
high-temperature pressed pellets (180°C and 190°C) could be categorized into one group, all three
showed a needle-shape penetration, a sharp peak was observed during the DC asymmetric test,
and were the samples that showed the least discoloration. From this, it is suggested that in the
absence of discoloration, the needle-shape penetration can be an indicator that an electronically
conductive phase was the only phase that went through the pellet. However, in the other five
samples, both the electronically conductive phase (believed to be lithium) and the decomposition
phase (electronic insulator, ionic conductor) penetrated the pellet. The first phase was responsible
of the voltage drop and the second phase what caused the instability in the voltage profile.
Unfortunately, there are still many questions to be answered: why the decomposition phase is
preferably formed in some pellets but not in others? Is it a contact issue related between the lithium
electrode and the LPS electrolyte? Why the penetration occurs at certain locations but not in
others? What makes one region of the pellet more likely to initiate the propagation of the
decomposition reaction, i.e. what isn’t the decomposition uniform across the pellet face? Further
studies have to be performed to elucidate these phenomena. One approach is through materials
characterization. Following XRD, DSC, SEM and EDS analyses before and after hot-pressing and
DC cycling.
2.2.3. Materials characterization
2.2.3.1. X-Ray Diffraction Analysis
The XRD data showed that hot-pressing at and above 170°C, results in the formation of a
crystalline phase (Figure 24). This suggests that the sample prepared was a glass-ceramic (Kingery,

49
1963). For the LPS system, glass-ceramics can show a higher ionic conductivity than their glass
homologous, depending on which crystalline phase is precipitated from the mother glass. A highly
conductive crystalline conductor like the thio-LISICON II analog would explain the decrease in
resistance with increasing hot-pressing temperature trend observed in the AC measurements.
However, due to the low peak intensity, the crystalline phase cannot be accurately identified. In
contrast, the hot pressed pellet at 190°C with identifiable peaks at 17.5, 26, 27.5, 29 and 30, 2 theta
correspond to the thio-LISICON III analog, which is not as conductive as thio-LISICON II analog.
(Mizuno et al. 2006) Nevertheless, the increased conductivity with increasing hot pressing
temperature suggests the formation of the relatively high conductivity crystalline thio-LISICON
analogs compare to the LPS glass. (Mizuno et al. 2006)
The intensity of the XRD peaks decreased after the DC cycling was completed. This suggests
that the long range atomic order obtained during hot pressing was disrupted by DC cycling
reverting back to an amorphous phase.
Figure 27. Effect of hot pressing temperature on 75Li2S-25P2S5 structure
0
500
1000
1500
2000
2500
3000
10 15 20 25 30 35 40 45 50
Re
lati
ve in
ten
sity
(a.
u)
2θ/ ° (CuKα)
LPS powder as prepared 130C 150C 170C 190C
thio-LISICON II analog

50
Figure 28. Effect of DC cycling on 75Li2S-25P2S5 structure (hot pressed at 190°C)
2.2.3.2. Differential Scanning Calorimetry
DSC analysis showed that the exotherms present before DC asymmetric polarization (at
approximately 190 and 220oC) , disappeared after cycling suggesting that Li-ion transport through
the LPS affects the bulk properties of the semi-crystallized LPS solid electrolyte. This may be an
additional evidence of the transition from the crystalline phase precipitated during hot pressing
back to an amorphous phase, which was detected by XRD.
0
500
1000
1500
2000
2500
3000
10 15 20 25 30 35 40 45 50
Re
lati
ve in
ten
sity
(a.
u)
2θ / °(CuKα)
HP34-Hot pressed 190C
HP27-Hot pressed and cycled190C
thio-LISICON III analog

51
Figure 29. Effect of hot pressing and Li cycling on DSC spectra of 75Li2S-25P2S5 hot-pressed at
130°C
Figure 30. Effect of hot pressing and Li cycling on DSC spectra of 75Li2S-25P2S5 hot-pressed at
140°C
-0.2
-0.1
0
0.1
0.2
0.3
0.4
0.5
0 50 100 150 200 250 300 350
He
at f
low
[W
/g]
Temperature [oC]
LPS hot pressed and cycled LPS Hot pressed LPS - Heat treated
-0.2
-0.1
0
0.1
0.2
0.3
0.4
0.5
0.6
0.7
0 50 100 150 200 250 300 350
He
at f
low
[W
/g]
Temperature [oC]
LPS hot pressed and cycled LPS Hot pressed LPS - Heat treated

52
2.2.3.3. Scanning Electron Microscopy (SEM) and Energy Dispersive
Spectrometry (EDS)
The morphology of the LPS after DC cycling did not change significantly as seen in the
micrographs in Figure 28. The most noticeable feature was the increasing concentration of bright
spots in the cycled pellets in comparison to the hot-pressed samples. Therefore, Energy Dispersive
Spectrometry (EDS) was conducted to identify the composition of these areas. EDS showed that
the bright particles detected in the hot-pressed and cycled pellets samples possess a higher
concentration of sulfur than its surroundings. Moreover, these sulfur-rich particles could be the
dark spots observed in the optical cross-sectional analysis, but this would not explain the drop in
potential observed in the DC asymmetric tests. A surface analysis like X-ray photoelectron
spectroscopy (XPS), sensitive to lithium is necessary to prove if lithium is propagating through
the electrolyte.

53
130°C 140°C Hot-pressed Hot-pressed and cycled Hot-pressed Hot-pressed and cycled
150°C 160°C Hot-pressed Hot-pressed and cycled Hot-pressed Hot-pressed and cycled
170°C
Hot-pressed Hot-pressed and cycled
Figure 31. Fractured surfaces of hot pressed and DC cycled 75Li2S-25P2S5 pellets
2.3.Conclusion
75Li2S-25P2S5 is a promising solid electrolyte owing to its attributes such as: high lithium ion
conductivity (10-4 – 10-3 S/cm) at room temperature and low cost constituents. Improving its utility
for use in advanced, solid-state batteries, however, can be attained by improving its stability
against metallic Li anodes. This work investigated hot-pressing as an approach to promote
particle-particle chemistry thereby increasing stability. Increased conductivity was observed due
to possible crystallization of a highly conductive phase during hot-pressing. However, the

54
crystallinity decreased as a result of the DC cycling. A clear correlation between processing
conditions and density has not been elucidated, but it will be mandatory to increase its shear
modulus, and ultimately avoid lithium dendrite penetration. The LPS system is versatile and
demonstrates several of the key attributes necessary to enable solid-state batteries for electric
vehicles or other applications.
2.4.Future directions
- Conduct density measurements via Archimedes method to verify densities calculated by
geometrical methods.
- Perform conductivity measurements with ion-blocking electrodes for hot-press pellets at
150°C to 170°C (samples that showed least impedance among temperatures) to measure
the ionic conductivity of LPS without no interaction with the electrodes.
- Identify the critical processing conditions necessary to control LPS porosity/density.
- Conduct EIS versus time measurements to characterize Li/LPS interface stability of the
hot-press pellets at 150°C to 170°C.
- Perform Raman and XPS mapping analyses at cross-section and surfaces of cycled and
only hot-pressed samples to accurately identify the phase migrating through the solid
electrolyte.

55
REFERENCES

56
REFERENCES
1 Adachi, G.-Y., Imanaka, N., & Aono, H. (1996). Fast Li-Conducting Ceramic Electrolytes.
Advanced Materials, 127–135.
2 H. Aono, E. Sugimoto, Y. Sadaoka, N. Imanaka, and G.-y. Adachi, Chem. Lett., (1990) 331.
3 Bates, J. B., Dudney, N. J., Gruzalski, G. R., Zuhr, R. A., Choudhury, A., & Luck, C. F. (1993).
Fabrication and characterization of amorphous lithium electrolyte thin films and rechargeable
thin-film batteries. Journal of Power Sources, 43-44, 103–110.
4 Bruce, P.G., West, A.W. (1983). J. Electrochem Soc. 130(3), 662.
5 Brundle, C.R., Evans, C. A. Wilson, S. (1992). Encyclopedia of Materials Characterization.
Gulf Professional Publishing. 751pp.
6 Burke, A. & Miller, M. (2011). Journal of Power Sources. Journal of Power Sources, 196(1),
514–522.
7 Callister, W. D. (2007). Materials Science and Engineering, an Introduction. John Wiley &
Sons, Inc. 7th edition. 975pp.
8 Chu, Y. S. (2007). Basic Research Needs for Electrical Energy Storage: Report of the Basic
Energy Sciences Workshop on Electrical Energy Storage. pp.1–186.
9 Chu, S. and Majumdar, A. (2012). Nature. Vol 488, 294-303.
10 C.W. Ban and G.M. Choi, Solid State Ionics, 140 (2001) 285.
11 Dunn, B., Kamath, H., & Tarascon, J. M. (2011). Electrical Energy Storage for the Grid: A
Battery of Choices. Science, 334(6058), 928–935. doi:10.1126/science.1212741
12 Etacheri, V. et al. Energy Environ. Sci. 4, 3243 (2011).
13 Hayashi, A., Hama, S., Morimoto, H., Tatsumisago, M., & Minami, T. (2001). Preparation of
Li2S-P2S5 Amorphous Solid Electrolytes by Mechanical milling. Journal of the American
Ceramic Society, 84(2), 477–479.
14 Hayashi, A., Hama, S., Minami, T., Tatsumisago, M. (2003). Formation of superionic crystals
from mechanically milled Li2S-P2S5 glasses. Electrochemistry Communications, 5, 111-114.
15 Ho, C., Raistrick, I.D. and Huggins, R.A. J. Electrochem. Soc. 127, 343 (1980).

57
16 Hong, H. Y-P. (1978). Crystal structure and Ionic Conductivity of Li14Zn(GeO4)4 and other
new Li+ superionic conductors.
17 Huggins, R. A. (2002). Simple Method to Determine Electronic and Ionic Components of the
Conductivity in Mixed Conductors, A Review. Ionics, 8, 300–313.
18 Huggins, R. (2009). Advanced Batteries: Materials Science Aspects. United States of America.
Springer.
19 H. Hyooma and K. Hayashi, Mater.Res. Bull., 23 (1988) 1399.
20 Inaguma, Y., Chen, L., Itoh, M., Nakamura, T. (1994). Solid State Ionics. 70/71, 196.
21 Intergovernmental Panel on Climate Change. Climate Change, Synthesis Report. Edited by
The Core Writing Team, Pachauri, R. K. and Meyer, L. http://www.ipcc.ch/pdf/assessment-
report/ar5/syr/SYR_AR5_LONGERREPORT.pdf
22 International Energy Agency in World Energy Outlook (2011), 546-547
http://www.worldenergyoutlook.org (International Energy Agency, 2011).
23 Irvine, J. T. S., Sinclair, D. C., & West, A. R. (1990). Electroceramics: Characterization by
Impedance Spectroscopy. Advanced Materials, 2, 132–138.
24 Kanno, R and Murayama, M. (2001). J. Electrochem. Soc., 148, A742.
25 Kitaura, H., Hayashi, A., Ohtomo, T., Hama, S., & Tatsumisago, M. (2010). Fabrication of
electrode–electrolyte interfaces in all-solid-state rechargeable lithium batteries by using a
supercooled liquid state of the glassy electrolytes. Journal of Materials Chemistry, 21(1), 118.
doi:10.1039/c0jm01090a
26 Knauth, P. (2009). Inorganic solid Li ion conductors: An overview. Solid State Ionics, 180(14-
16), 911–916. doi:10.1016/j.ssi.2009.03.022
27 Kingery, W.D., 1963. Effects of Applied Pressure on Densification during Sintering in the
Presence of a Liquid. Journal of the American Ceramic Society, 46(8), pp.391–395.
28 Lee, R. (2011). Science. 333, 569-573
29 L.O. Hagman and P. Kierkegaard, Acta Chem.Scand., 22 (1968) 1822.
30 M. Klingler, W.F. Chu, and W. Weppner, Ionics, 3 (1997) 289.
31 Minami, K. Mizuno, F. Hayashi, A., Tatsumisago, M. Solid State Ionics. 178 (2007), 837 –
841.
32 Mizuno, F. and Hayashi, A. (2005). New, Highly Ion-Conductive Crystals Precipitated from
Li2S-P2S5 glasses. Advanced Materials. 17(7), 918 – 921.
33 Mizuno, F.; Hayashi, A.; Tadanaga, K.; Tatsumisago, M. (2006). Solid State Ionics, 177, 2721.

58
34 Monroe, C., & Newman, J. (2005). The Impact of Elastic Deformation on Deposition Kinetics
at Lithium/Polymer Interfaces. Journal of the Electrochemical Society, 152(2), A396–A404.
doi:10.1149/1.1850854
35 Morimoto, H., Yamashita, H., Tatsumisago, M. and Minami, T. (1999). Mechanochemical
Synthesis of New Amorphous Materials of 60Li2S-40SiS2 with high lithium ion conductivity.
J. Am. Ceram. Soc. 82(5), 1352-1354.
36 Muramatsu, H., Hayashi, A., Ohtomo, T., Hama, S., Tatsumisago, M. (2011). Structural
change of Li2S-P2S5 sulfide solid electrolytes in the atmosphere. Solid State Ionics, 182, 116-
119.
37 Murayama, M., Sonoyama, N., Yamada, A., Kanno, R. (2004). Solid State Ionics, 170, 173.
38 Murugan, R., Thangadurai, V. and Weppner, W. (2007). Angew. Chemie Inter. Ed.46, 7778.
39 Nazri, G.; Pistoia, G. Lithium Batteries: Science and Technology. United States of America.
Springer.
40 Ohta, S. Kobayashi, T., Asaoka, T. (2011). High lithium ionic conductivity in the garnet-tupe
oxide Li7-xLa3(Za2-x, Nbx)O12 (X = 0 -2). Journal of Power Sources. 196, 3342.
41 Ohtomo, T., Hayashi, A., Tatsumisago, M., Tsuchida, Y., Hama, S., & Kawamoto, K. (2013).
Journal of Power Sources. Journal of Power Sources, 233(C), 231–235.
doi:10.1016/j.jpowsour.2013.01.090
42 P.G Bruce, A.R. West. (1983). J. Electrochem. Soc. 30 662.
43 Sakamoto, J. (2014). Handbook of Solid-State Batteries and Capacitors. Chapter, Superionic
conducting oxide electrolytes. Edited by N.J. Dudney, J. Nanda, and W. West. World Scientific
Publishers.
44 Sakuda, A., Hayashi, A., & Tatsumisago, M. (2013). Sulfide Solid Electrolyte with Favorable
Mechanical Property for All-Solid-State Lithium Battery. Scientific Reports, 3.
doi:10.1038/srep02261
45 Sardela, M. (2014). Practical Materials Characterization. Springer. 237pp.
46 Sibilia, J. (1988). A Guide to Materials Characterization and Chemical Analysis. John Wiley
& Sons. 408pp.
47 Song, M.-K., Zhang, Y. & Cairns, E.J., 2013. A Long-Life, High-Rate Lithium/Sulfur Cell: A
Multifaceted Approach to Enhancing Cell Performance. 4.30.2014 Thesis
Introduction_Sections 1.5 - 1.7, 13(12), pp.5891–5899.
48 Stramare, S., Thangadurai, V., Weppner, W. (2003). Chem. Mater. 15, 3974.
49 Tachez, M., Malugani, J.P., Mercier, R., Robert, G. (1984). Solid State Ionics, 14, 181.

59
50 Takamasa, O., Hayashi, A., Tatsumisago, M. Tsuchida, Y., Hama, S., Kawamoto, K. (2013).
All-solid-state lithium secondary batteries using the 75Li2S-25P2S5 glass and the 70Li2S-
30P2S5 glass-ceramic as solid electrolytes. Journal of Power Sources, 233, 231-235.
51 Takeuchi, T., Kageyama, H., Nakanishi, K., Ohta, T., Sakuda, A., Sakaebe, H., Kobayashi, H.,
Tatsumi, K. and Ogumi, Z. Rapid preparation of Li2S-P2S5 Solid Electrolyte and its application
for Graphite/Li2S All-Solid-State Lithium Secondary Battery. Electrochemistry Letters, ECS.
3 (5), A31-A35. (2014).
52 Thackeray, M. M., Wolverton, C. and Isaacs, E. D. (2012). Energy Environ. Sci. 5, 7854.
53 Thompson, T., Wolfenstine, J., Allen, J. L., Johannes, M., Huq, A., David, I. N. and Sakamoto,
J. (2014). Tetragonal vs. Cubic phase stability in Al-free Ta doped Li7La3Zr2O12 (LLZO).
Journal of Materials Chemistry A., 2014, 2, 13431.
54 Virkar, A. V., Ketcham, T. D., & Gordon, R. S. (1979). Hot Pressing of Lithia-Stabilized
IWAlumina. Ceramurgia International, 5(2), 66–69.
55 Wachsman, E. D., & Lee, K. T. (2011). Lowering the Temperature of Solid Oxide Fuel Cells.
Science, 334, 935–939. doi:10.1126/science.1212741
56 Wachtman, J., Cannon, W. R., Matthewson, M. J. (2009). Mechanical properties of Ceramics.
John Wiley & Sons.