ECE 510 Quality and Reliability Engineering Lecture 1...
40
ECE 510 Quality and Reliability Engineering Lecture 1. Introduction, Monte Carlo Scott Johnson Glenn Shirley
Transcript of ECE 510 Quality and Reliability Engineering Lecture 1...
ECE 510 Quality and Reliability Engineering Lecture 1. Introduction, Monte Carlo
Scott Johnson
Glenn Shirley

Today • Introduction to the ECE 510 course
• Introduction to quality and reliability concepts
• A sample exercise showing the sort of exercise we will do most days in this class
7 Jan 2013 ECE 510 S.C.Johnson, C.G.Shirley 2

Course Introduction
7 Jan 2013 ECE 510 S.C.Johnson, C.G.Shirley 3

Instructor Biographies • C. Glenn Shirley
– PhD in Physics (ASU). 7 years at Motorola, 23 at Intel mostly in TD Q&R. Retired in 2007. Joined PSU ECE in the IC Design and Test Lab in 2008 as an Adjunct Prof.
• Scott C. Johnson
– PhD in Physics (U of CA Davis). 11 years at Intel as a reliability engineer and statistician. Before that, BS in Electrical Engineering (U of IL) and 5 years at Lockheed.
• Course will be co-taught by Glenn and Scott.
7 Jan 2013 ECE 510 S.C.Johnson, C.G.Shirley 4

Course Goals • Provide knowledge and skills required of a QRE for integrated circuit
– Product design
– Product development
– Technology development
– Manufacturing
• Understand the essential trade-offs among
– Cost
– Performance
– Quality and Reliability
– Producer and Customer risks
• Learn how to assess risks and write qualification plans.
• Develop skills to use statistical methods and tools such as SQL and Excel to analyze data, develop models and make decisions.
7 Jan 2013 ECE 510 S.C.Johnson, C.G.Shirley 5

Skills • Calculate failure rates, MTTF, etc. including confidence limits.
• Design a reliability experiment and fit data to a model.
• Use the reliability model to calculate figures of merit for various design “what-ifs” and hypothetical manufacturing and use specifications.
• Use Monte-Carlo simulation to model complicated real-world scenarios which are intractable by classical statistical methods.
• Design a reliability validation plan.
• Be able to build system-level quality and reliability models from component-level models.
• Design a statistical manufacturing monitor or control chart with specified producer and customer risk levels.
• Handle large datasets using SQL and Excel, and so..
• Compute test statistics such coverage, yield, test time, customer defect level from test data.
7 Jan 2013 ECE 510 S.C.Johnson, C.G.Shirley 6

Logistics • 4 credits, Monday and Wednesday, 5:00pm–6:50pm, 10 weeks
• Format is lecture and in-class exercises intermingled.
• Lecture will be recorded and accessible online. But in-class activities will not be recorded.
• Presentation materials will be posted to internet right after the class in which they are presented.
• In-class exercises usually will require a computer running Microsoft Excel.
– Other spreadsheet programs (e.g., Open Office, Google Docs) might work.
– Later in the course we may use SQLite Expert.
• Recommended textbook is Tobias & Trindade, Applied Reliability, 3rd ed.
• Watch the web site for
– Schedule changes.
– Reading assignments, including links to extra materials.
– Presentation materials, and lecture recording.
7 Jan 2013 ECE 510 S.C.Johnson, C.G.Shirley 7
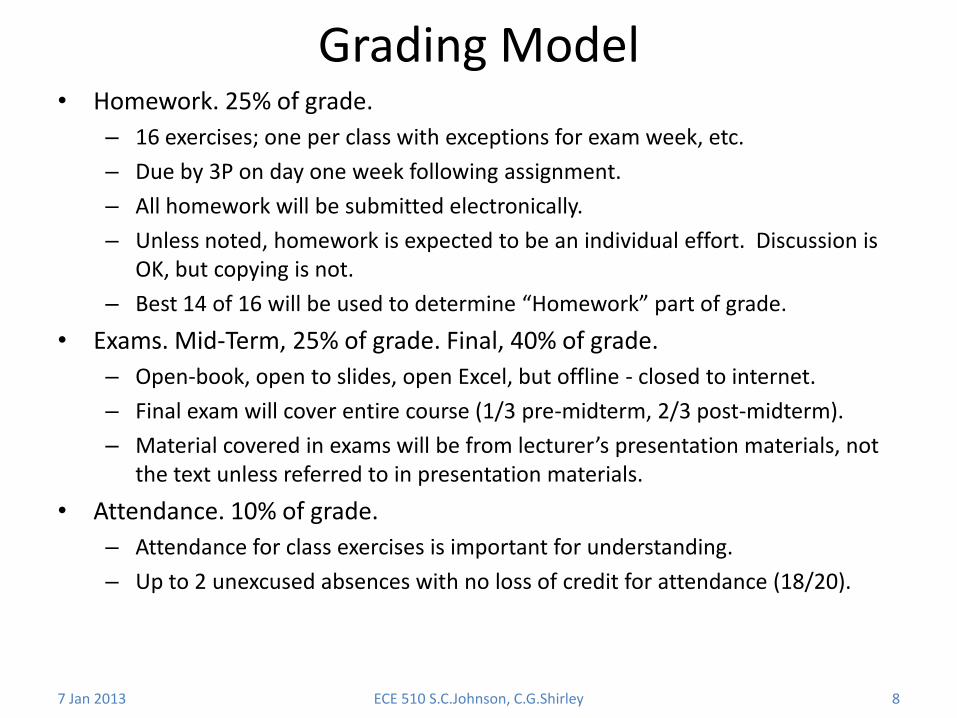
Grading Model • Homework. 25% of grade.
– 16 exercises; one per class with exceptions for exam week, etc.
– Due by 3P on day one week following assignment.
– All homework will be submitted electronically.
– Unless noted, homework is expected to be an individual effort. Discussion is OK, but copying is not.
– Best 14 of 16 will be used to determine “Homework” part of grade.
• Exams. Mid-Term, 25% of grade. Final, 40% of grade.
– Open-book, open to slides, open Excel, but offline - closed to internet.
– Final exam will cover entire course (1/3 pre-midterm, 2/3 post-midterm).
– Material covered in exams will be from lecturer’s presentation materials, not the text unless referred to in presentation materials.
• Attendance. 10% of grade.
– Attendance for class exercises is important for understanding.
– Up to 2 unexcused absences with no loss of credit for attendance (18/20).
7 Jan 2013 ECE 510 S.C.Johnson, C.G.Shirley 8
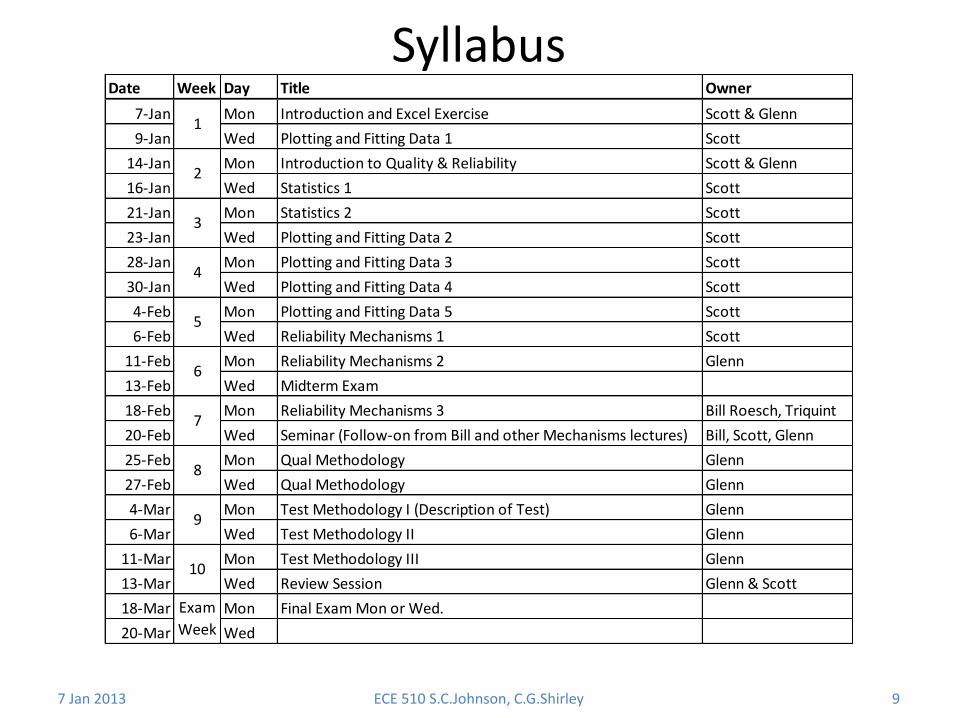
Syllabus
7 Jan 2013 ECE 510 S.C.Johnson, C.G.Shirley 9
Date Week Day Title Owner
7-Jan Mon Introduction and Excel Exercise Scott & Glenn
9-Jan Wed Plotting and Fitting Data 1 Scott
14-Jan Mon Introduction to Quality & Reliability Scott & Glenn
16-Jan Wed Statistics 1 Scott
21-Jan Mon Statistics 2 Scott
23-Jan Wed Plotting and Fitting Data 2 Scott
28-Jan Mon Plotting and Fitting Data 3 Scott
30-Jan Wed Plotting and Fitting Data 4 Scott
4-Feb Mon Plotting and Fitting Data 5 Scott
6-Feb Wed Reliability Mechanisms 1 Scott
11-Feb Mon Reliability Mechanisms 2 Glenn
13-Feb Wed Midterm Exam
18-Feb Mon Reliability Mechanisms 3 Bill Roesch, Triquint
20-Feb Wed Seminar (Follow-on from Bill and other Mechanisms lectures) Bill, Scott, Glenn
25-Feb Mon Qual Methodology Glenn
27-Feb Wed Qual Methodology Glenn
4-Mar Mon Test Methodology I (Description of Test) Glenn
6-Mar Wed Test Methodology II Glenn
11-Mar Mon Test Methodology III Glenn
13-Mar Wed Review Session Glenn & Scott
18-Mar Mon Final Exam Mon or Wed.
20-Mar Wed
Exam
Week
7
8
9
10
1
2
3
4
5
6

Introduction to Quality and Reliability Engineering
7 Jan 2013 ECE 510 S.C.Johnson, C.G.Shirley 10
Semiconductor Manufacturing
7 Jan 2013 ECE 510 S.C.Johnson, C.G.Shirley 11

• Transistor density doubles every 18 months (Moore’s Law).
• New products take 1.5 to 2 years from conception to manufacture.
• Technology development and product design must occur in parallel.
• QRE is involved at all stages of the Technology and Product Lifecycles.
• QRE role is control of customer quality and reliability risks.
Technology Certification
How Moore’s Law Works
7 Jan 2013 ECE 510 S.C.Johnson, C.G.Shirley 12
Technology Development
Product Development Manufacturing
Lead Product Qualification
Pre-silicon Development Post-silicon Development
Product Development Manufacturing
Follow-on Product Qualification
Next Technology Development
Synch point Synch point
Product Development Mfg
Synch point
18 months 18 months

ECE 510 S.C.Johnson, C.G.Shirley
Product Lifecycle
• Manuf’g Optimization o Test setpoints, limits. o Product tuning, fusing.
• Quality Systems o Process control o Containment o Feedback to design and
manufacturing. o Quality and reliability
monitors.
• Market/Feature Reqts o End User Features o OEM DFM Features o Performance, Power
Goals o Quality, Reliability Goals
• Technology Selection
• Design Goals o Area/power budgets.
• OEM Datasheet Definition
• Manufacturing Reqts o DFM Features o Producer Mfg Goals o Capacity Planning
• Design o Logical description (RTL) o Gate-level o Circuit/layout level.
• Refined projections o Power o Performance o Reliability.
Decisions
Req
uir
emen
ts
Info
rmat
ion
Data Test Vehicle Data
Product Data
Device/Ckt Simulation
Technology Projections/Scaling
Market Research
Post-Silicon Pre-Silicon
Definition Planning Production
Ramp High Volume
Design
Validation Early Design Late Design
~ 1 year ~ 0.5 y ~ 0.25 y
~ 1.5 years
Traditional Product
Qualification
Product Requirements
Go/NoGo
Feasibility Go/NoGo
Pre- silicon
Qualification
Design Milestones
13 7 Jan 2013
Synch point
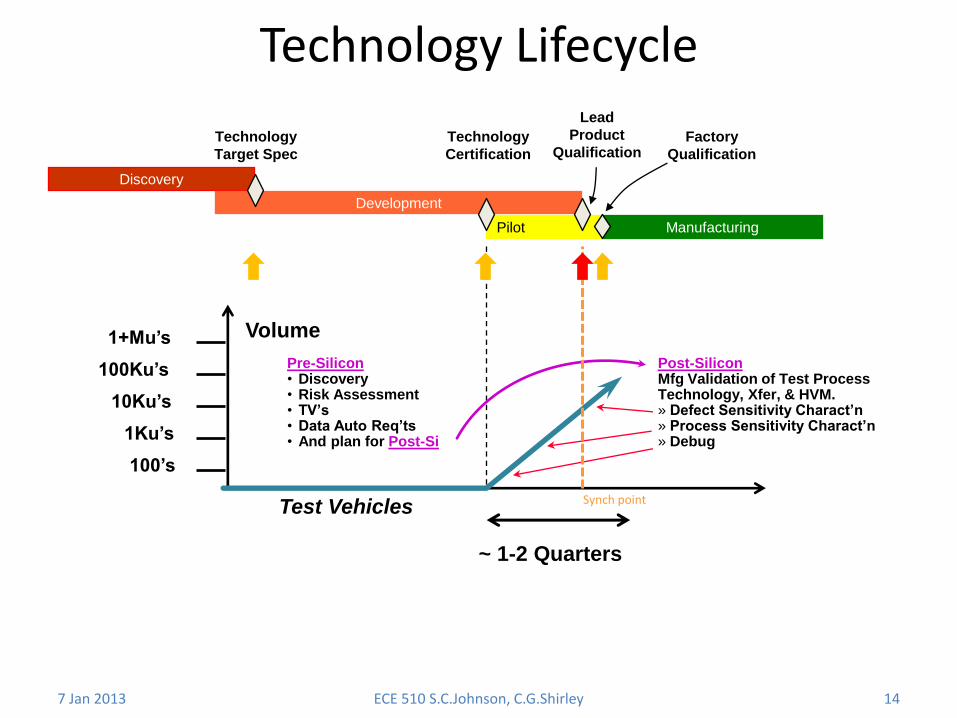
Technology Lifecycle
ECE 510 S.C.Johnson, C.G.Shirley 14
Volume
100’s
1Ku’s
10Ku’s
100Ku’s
1+Mu’s
Pre-Silicon • Discovery • Risk Assessment • TV’s • Data Auto Req’ts • And plan for Post-Si
Post-Silicon Mfg Validation of Test Process Technology, Xfer, & HVM. » Defect Sensitivity Charact’n » Process Sensitivity Charact’n » Debug
~ 1-2 Quarters
Test Vehicles
Pilot
Discovery Discovery
Development
Technology
Target Spec
Manufacturing
Lead
Product
Qualification Technology
Certification
Factory
Qualification
7 Jan 2013
Synch point
Quality
7 Jan 2013 ECE 510 S.C.Johnson, C.G.Shirley 15

Role of the Q&R Engineer (QRE) • The QRE is a proxy for the customer, at all stages of the Product and
Technology lifecycles, and
– Gives Q&R Requirements. Provide quality and reliability requirements for products, technologies, and manufacturing.
– Assesses Risk. Assess product, technology, and manufacturing risks.
– Writes Validation Plans. Technology Certification, Product Qualification.
– Designs Experiments. Provides requirements to acquire needed data.
– Builds Q&R Models. What-if models providing estimates of Q&R figures of merit to enable decision-making involving Q&R attributes of the product.
• Kinds of QRE
– Technology Development QRE. Silicon and Package reliability models, burn-in development. Process Certification.
– Test QRE. Fault coverage analysis and modeling. Test program requirements.
– Product QRE. Responsible for specific product. Product Qualification.
– Materials QRE. Quality control of incoming materials and vendors.
– Manufacturing/Factory QRE. Monitors. MRB, DRB. Containment.
– Customer QRE. Find customer Q&R req’ts, deal with Q&R “escapes”.
7 Jan 2013 ECE 510 S.C.Johnson, C.G.Shirley 16

8/2-4/2011 Plastic Package Reliability 17
Life of an Integrated Circuit
End-user Environment Assembly Shipping Storage OEM/ODM
Assembly
Source: Eric Monroe, 2003
Mobile PC
DT
User Drop
& Vibe
Shipping Shock Temp, RH Power Cycle Bend Reflow Handling
Te
mp
BAM!
Bent Pins, Singulation
Temperature
Cycle
Desktop
DT
Shipping Shock Temp, RH Bend Power Cycle Reflow Handling
Tem
p
Bent Pins, Singulation
Temperature
Cycle
User Drop
& Vibe
Keypad
press
DT
Shipping Shock Temp, RH Bend Reflow Handling Temperature
Cycle
BAM!
Handheld
Slide by Scott C. Johnson.

End User Assembly
Component Manufacturer System Manufacturer
Debug/ Repair
Analysis
Analysis
Analysis Analysis
Burn-In/ Test
System Assembly
System Test
Fab/Sort
Physical Manufacturing/Use Flow • The QRE must keep in mind the entire physical life of the component.
• Component Mfr and System Mfr generates failures, as does End Use.
• The failure rates are key Q&R figures of merit.
• Failures are analyzed. Feedback improves processes.
7 Jan 2013 ECE 510 S.C.Johnson, C.G.Shirley
Physical units
Information
Failed units
10-20%
1-2%
~ 0.5 %
500 PPM
18

Quality vs Reliability • Quality.
– Conformance to specification at the customer, usually the System Mfr.
– Impact: Rework at System Manufacturer. Brand image.
– Measures of Quality (Figures of Merit)
• How (which attributes) unit fails to meet specification.
– Eg. Out of box experience.
• Fraction of the population failing to meet specification.
– Eg. 2%, 500 PPM, 300 DPPM, 300 DPM.
• Reliability
– Conformance to specification usually at the End User, through time.
– Impact: Warranty cost to system Mfr. Brand image of System Mfr. to End User. Brand image of Component Mfr to System Mfr.
– Measures of Reliability (Figures of Merit)
• How (which attributes) and when unit fails to meet specification.
• Fraction of the population failing to meet specification in a specified time interval.
– Eg. 1% in 7 years, 500 DPM in 30 days, 0.1% in warranty period, 10 %/kh, 100 Fits.
7 Jan 2013 ECE 510 S.C.Johnson, C.G.Shirley 19
For discussion: What “population” do we mean?
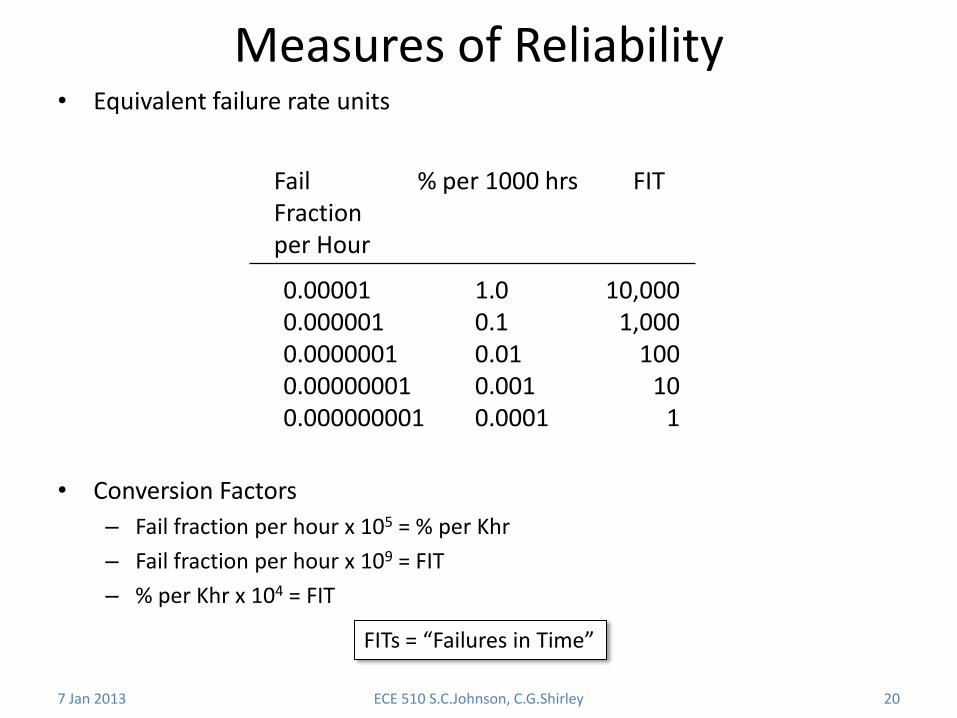
Measures of Reliability • Equivalent failure rate units
• Conversion Factors
– Fail fraction per hour x 105 = % per Khr
– Fail fraction per hour x 109 = FIT
– % per Khr x 104 = FIT
7 Jan 2013 ECE 510 S.C.Johnson, C.G.Shirley 20
0.00001 1.0 10,000 0.000001 0.1 1,000 0.0000001 0.01 100 0.00000001 0.001 10 0.000000001 0.0001 1
Fail % per 1000 hrs FIT Fraction per Hour
FITs = “Failures in Time”

Quality Assurance
7 Jan 2013 ECE 510 S.C.Johnson, C.G.Shirley 21
• Quality assurance is achieved by thorough test.
• Test occurs throughout the manufacturing process, not just at the end.
• Purpose of Test
– Screen grossly defective and out-of-spec parts.
– Classify parts into various speed, power, etc. bins.
Wafer Fabric’n
Sort Assembly Burn In Post-Burn
In Test aka “Class”
“Use”
Pre-Burn In Test
“Use”-Like Monitor
Wafer-level Cold
Unit-level Hot
Unit-level Hot
Unit-level Stress Very Hot, High Voltage
1M Good Die
300K Bad Die
Manufacture 1.3M Die
Screen out the Bad Die (defects 300K)
Speed Bin the Good Die
Tests
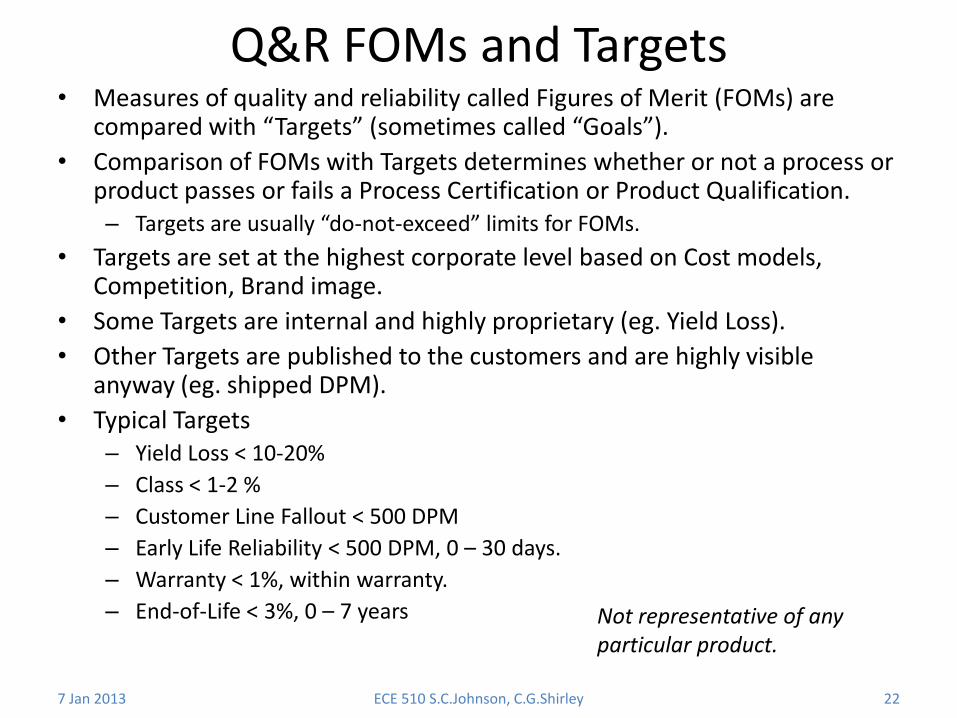
Q&R FOMs and Targets • Measures of quality and reliability called Figures of Merit (FOMs) are
compared with “Targets” (sometimes called “Goals”).
• Comparison of FOMs with Targets determines whether or not a process or product passes or fails a Process Certification or Product Qualification. – Targets are usually “do-not-exceed” limits for FOMs.
• Targets are set at the highest corporate level based on Cost models, Competition, Brand image.
• Some Targets are internal and highly proprietary (eg. Yield Loss).
• Other Targets are published to the customers and are highly visible anyway (eg. shipped DPM).
• Typical Targets – Yield Loss < 10-20%
– Class < 1-2 %
– Customer Line Fallout < 500 DPM
– Early Life Reliability < 500 DPM, 0 – 30 days.
– Warranty < 1%, within warranty.
– End-of-Life < 3%, 0 – 7 years
7 Jan 2013 ECE 510 S.C.Johnson, C.G.Shirley 22
Not representative of any particular product.

Reliability Goals from ITRS 2009
8/2-4/2011 Plastic Package Reliability 23
Infant Mortality
Wear-out
Constant fail rate
http://www.itrs.net/reports.html

Reliability
7 Jan 2013 ECE 510 S.C.Johnson, C.G.Shirley 24

The Reliability Problem
7 Jan 2013 ECE 510 S.C.Johnson, C.G.Shirley 25
• Quality fails can be handled by thorough testing
• Reliability is harder because the fails come long after we’ve sold the product – How can we tell which parts are going to fail in the future?

The Reliability Solution • The answer is that we must do research and determine
– How the parts fail (the fail mechanisms)
– What stresses made the part fail
• Then we must
– Design our product so that none of the fail mechanisms are activated by the stresses encountered during normal use
– Specify those use conditions clearly
– Test our product under accelerated stress conditions
7 Jan 2013 ECE 510 S.C.Johnson, C.G.Shirley 26

Understanding Reliability: A Keyboard
7 Jan 2013 ECE 510 S.C.Johnson, C.G.Shirley 27
• How might a keyboard key fail? (mechanisms)
– Material that gives tactile “click” might fatigue and break
– Electric contacts might corrode or become blocked with dirt
• What might cause these fails? (stresses)
– Being pressed too many times (wearout)
– Heat, humidity, dust, dirt, spills, being pressed too hard
• How can we test a key’s entire life? (stress test)
– Use a machine to press it 1,000,000 times
– Before that, heat it and shake it with dirt and water
• How can we make it more reliable? (design for rel.)
– Find what breaks and make that (and only that) stronger

Reliability Example: Aircraft Reliability • De Havilland Comet was an early commercial jet
• A few crashes were initially unexplained
• Thorough research led to understanding of metal fatigue (fail mechanism) from cabin pressurization (stress)
• Great 1-hour video (TV show) about it:
– http://www.youtube.com/watch?v=_3JZ3wHlgvI
7 Jan 2013 ECE 510 S.C.Johnson, C.G.Shirley 28

Reliability Assurance
7 Jan 2013 ECE 510 S.C.Johnson, C.G.Shirley 29
The stresses and fail mechanisms for integrated circuits are different, but the concepts are the same:
• Stresses: voltage, temperature, current, humidity, radiation, temperature cycling, mechanical stress
• Mechanisms: transistors (degradation), interconnects (cracking), package (corrosion, fatigue)
Reliability is assured by a qualification process, where statistical samples of products are stressed to simulate a lifetime.
A burn-in system and HAST system perform stress tests on chips
Monte Carlo Methods
7 Jan 2013 ECE 510 S.C.Johnson, C.G.Shirley 30
We will now give an example of the sort of exercise we will do most days in this class:

7 Jan 2013 ECE 510 S.C.Johnson, C.G.Shirley 31
What is Monte Carlo?
• Answer: A famous casino.
• Monte Carlo (MC) methods are numerical calculations using random numbers
Monte Carlo, Monaco, Europe

7 Jan 2013 ECE 510 S.C.Johnson, C.G.Shirley 32
What Can Monte Carlo Do?
• Answer: Give approximate numerical solutions to problems we can’t solve exactly
• Best suited for:
– Distributions
– Integrals (areas under a curve)
when we have
– Many parameters (= many dimensions)
– Complicated or non-analytic functional forms
• Many simulations of the manufacturing process are ideal for MC
7 Jan 2013 ECE 510 S.C.Johnson, C.G.Shirley 33
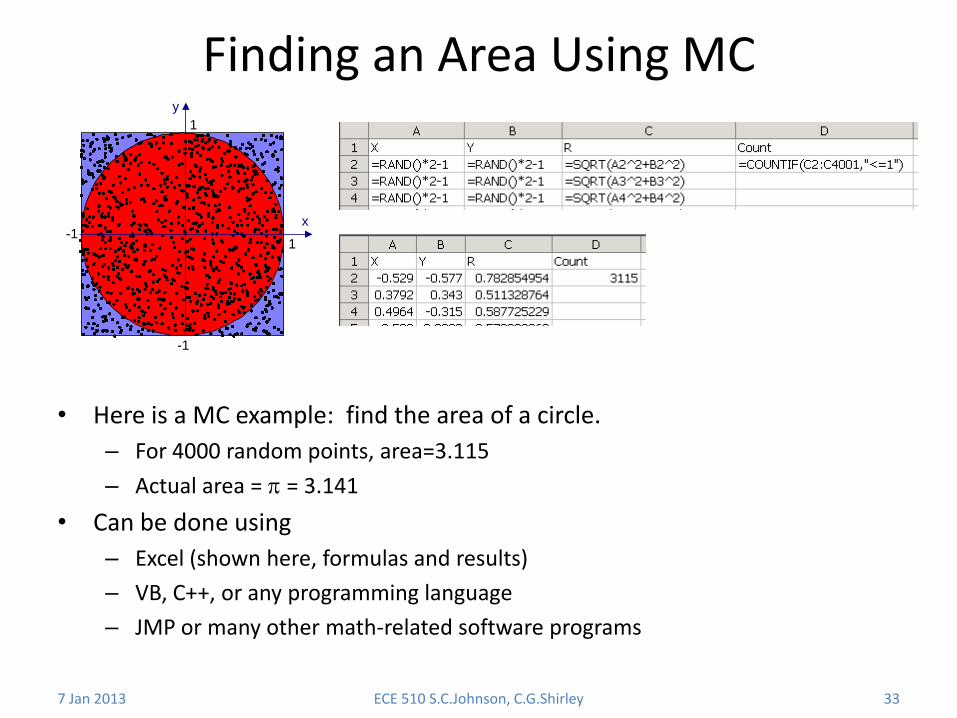
Finding an Area Using MC
• Here is a MC example: find the area of a circle.
– For 4000 random points, area=3.115
– Actual area = = 3.141
• Can be done using
– Excel (shown here, formulas and results)
– VB, C++, or any programming language
– JMP or many other math-related software programs
x
y
-1
-1
1
1

7 Jan 2013 ECE 510 S.C.Johnson, C.G.Shirley 34
Thinking Like an Integral
• Many of our simulations can be interpreted as integrals (area under a curve)
• The area under this function is
Angle brackets are an average,
x
y
-1
-1
1
1
f (x,y) ={ 1 inside circle 0 outside
V = blue square = 4
fVdVf
N
iixf
Nf
1
1

7 Jan 2013 ECE 510 S.C.Johnson, C.G.Shirley 35
Exercise 1.1
• Do a Monte Carlo calculation of Pi as shown in the previous slide. Use 4000 samples.
• Be prepared to give your numerical answer (x points out of 4000 are in the circle) in class.
• Turn in your spreadsheet by email before beginning of class 1 week from today.

7 Jan 2013 ECE 510 S.C.Johnson, C.G.Shirley 36
Exercise 1.1 Solution
• Already shown two slides back.
Distribution of Answers • Collect and plot answers from everyone in class
7 Jan 2013 ECE 510 S.C.Johnson, C.G.Shirley 37

7 Jan 2013 ECE 510 S.C.Johnson, C.G.Shirley 38
Accuracy of MC
σ/μ=0.22%
3 3.1 3.2 3.3 3.4
σ/μ=0.88%
σ/μ=2.7%
N=40,000
N=4000
N=400
σ=standard dev μ=mean 40 trials per N
100 1000 104 105
N
Perc
ent
0 2.5
5
7.
5
7 Jan 2013 ECE 510 S.C.Johnson, C.G.Shirley 39
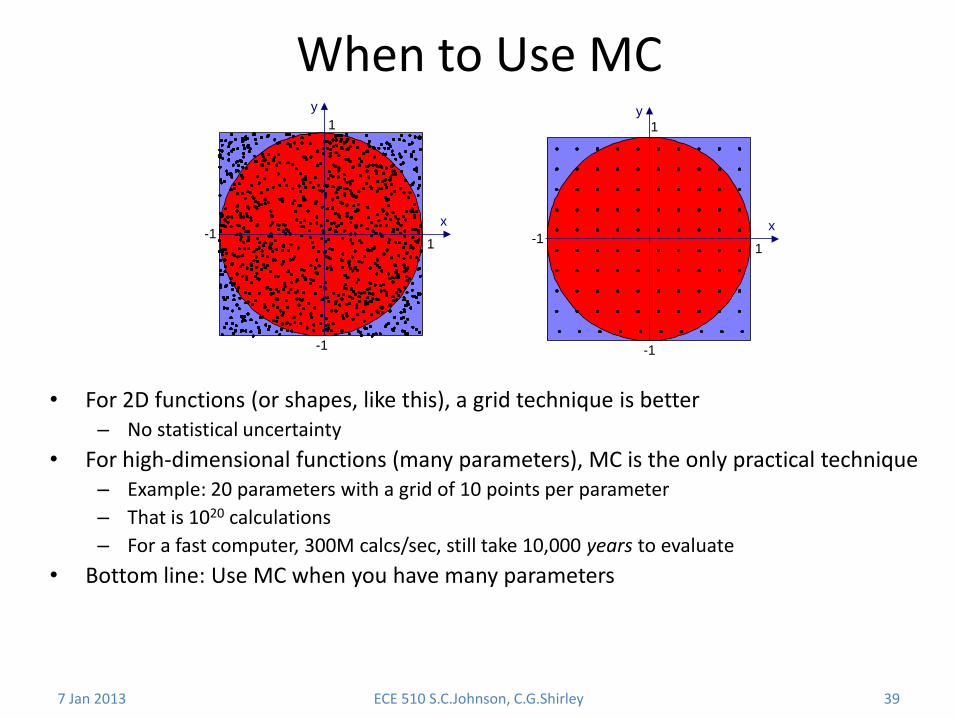
When to Use MC
• For 2D functions (or shapes, like this), a grid technique is better – No statistical uncertainty
• For high-dimensional functions (many parameters), MC is the only practical technique – Example: 20 parameters with a grid of 10 points per parameter
– That is 1020 calculations
– For a fast computer, 300M calcs/sec, still take 10,000 years to evaluate
• Bottom line: Use MC when you have many parameters
x
y
-1
-1
1
1
x
y
-1
-1
1
1

The End
7 Jan 2013 ECE 510 S.C.Johnson, C.G.Shirley 40