


Languages
Pages
Legal

ECE 510 Quality and Reliability Engineering Lecture 1. Introduction, Monte Carlo
Scott Johnson
Glenn Shirley

Today • Introduction to the ECE 510 course
• Introduction to quality and reliability concepts
• A sample exercise showing the sort of exercise we will do most days in this class
7 Jan 2013 ECE 510 S.C.Johnson, C.G.Shirley 2

Course Introduction
7 Jan 2013 ECE 510 S.C.Johnson, C.G.Shirley 3

Instructor Biographies • C. Glenn Shirley
– PhD in Physics (ASU). 7 years at Motorola, 23 at Intel mostly in TD Q&R. Retired in 2007. Joined PSU ECE in the IC Design and Test Lab in 2008 as an Adjunct Prof.
• Scott C. Johnson
– PhD in Physics (U of CA Davis). 11 years at Intel as a reliability engineer and statistician. Before that, BS in Electrical Engineering (U of IL) and 5 years at Lockheed.
• Course will be co-taught by Glenn and Scott.
7 Jan 2013 ECE 510 S.C.Johnson, C.G.Shirley 4

Course Goals • Provide knowledge and skills required of a QRE for integrated circuit
– Product design
– Product development
– Technology development
– Manufacturing
• Understand the essential trade-offs among
– Cost
– Performance
– Quality and Reliability
– Producer and Customer risks
• Learn how to assess risks and write qualification plans.
• Develop skills to use statistical methods and tools such as SQL and Excel to analyze data, develop models and make decisions.
7 Jan 2013 ECE 510 S.C.Johnson, C.G.Shirley 5

Skills • Calculate failure rates, MTTF, etc. including confidence limits.
• Design a reliability experiment and fit data to a model.
• Use the reliability model to calculate figures of merit for various design “what-ifs” and hypothetical manufacturing and use specifications.
• Use Monte-Carlo simulation to model complicated real-world scenarios which are intractable by classical statistical methods.
• Design a reliability validation plan.
• Be able to build system-level quality and reliability models from component-level models.
• Design a statistical manufacturing monitor or control chart with specified producer and customer risk levels.
• Handle large datasets using SQL and Excel, and so..
• Compute test statistics such coverage, yield, test time, customer defect level from test data.
7 Jan 2013 ECE 510 S.C.Johnson, C.G.Shirley 6

Logistics • 4 credits, Monday and Wednesday, 5:00pm–6:50pm, 10 weeks
• Format is lecture and in-class exercises intermingled.
• Lecture will be recorded and accessible online. But in-class activities will not be recorded.
• Presentation materials will be posted to internet right after the class in which they are presented.
• In-class exercises usually will require a computer running Microsoft Excel.
– Other spreadsheet programs (e.g., Open Office, Google Docs) might work.
– Later in the course we may use SQLite Expert.
• Recommended textbook is Tobias & Trindade, Applied Reliability, 3rd ed.
• Watch the web site for
– Schedule changes.
– Reading assignments, including links to extra materials.
– Presentation materials, and lecture recording.
7 Jan 2013 ECE 510 S.C.Johnson, C.G.Shirley 7
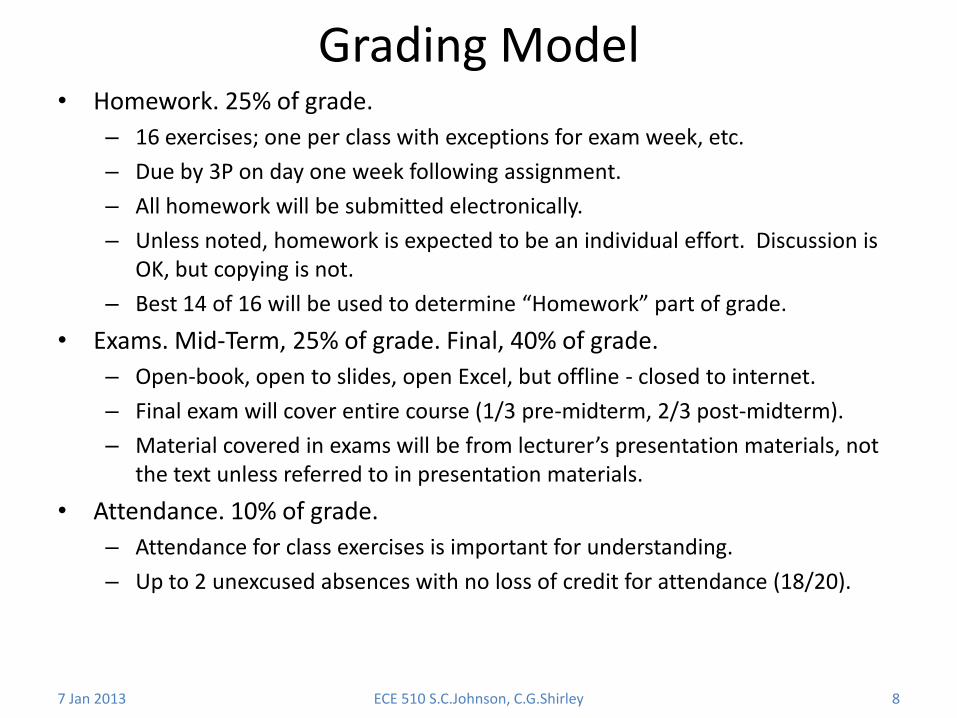
Grading Model • Homework. 25% of grade.
– 16 exercises; one per class with exceptions for exam week, etc.
– Due by 3P on day one week following assignment.
– All homework will be submitted electronically.
– Unless noted, homework is expected to be an individual effort. Discussion is OK, but copying is not.
– Best 14 of 16 will be used to determine “Homework” part of grade.
• Exams. Mid-Term, 25% of grade. Final, 40% of grade.
– Open-book, open to slides, open Excel, but offline - closed to internet.
– Final exam will cover entire course (1/3 pre-midterm, 2/3 post-midterm).
– Material covered in exams will be from lecturer’s presentation materials, not the text unless referred to in presentation materials.
• Attendance. 10% of grade.
– Attendance for class exercises is important for understanding.
– Up to 2 unexcused absences with no loss of credit for attendance (18/20).
7 Jan 2013 ECE 510 S.C.Johnson, C.G.Shirley 8
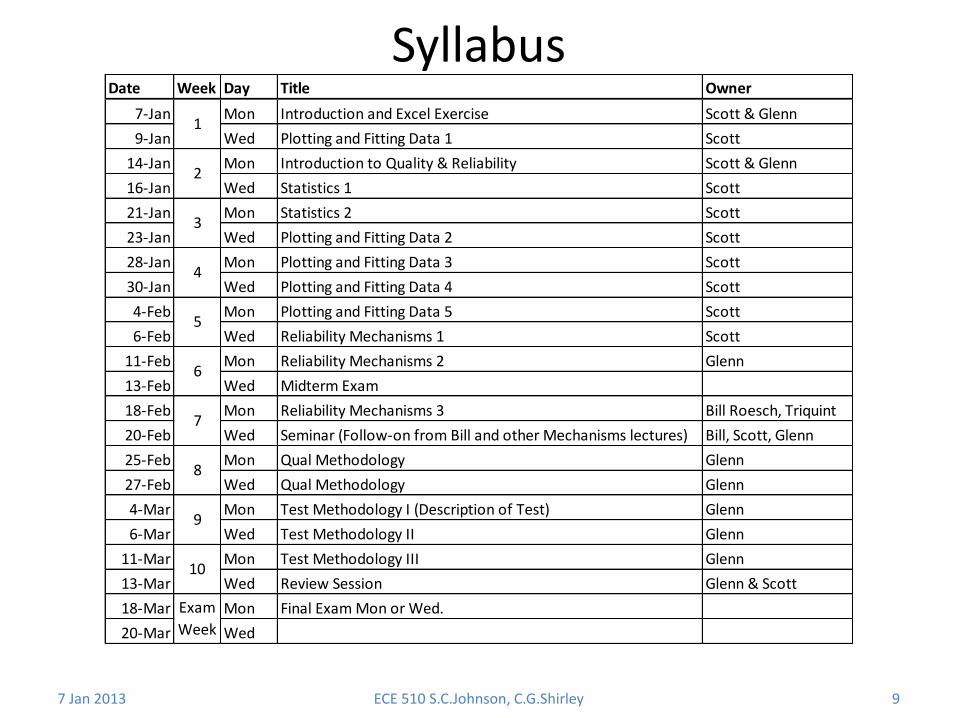
Syllabus
7 Jan 2013 ECE 510 S.C.Johnson, C.G.Shirley 9
Date Week Day Title Owner
7-Jan Mon Introduction and Excel Exercise Scott & Glenn
9-Jan Wed Plotting and Fitting Data 1 Scott
14-Jan Mon Introduction to Quality & Reliability Scott & Glenn
16-Jan Wed Statistics 1 Scott
21-Jan Mon Statistics 2 Scott
23-Jan Wed Plotting and Fitting Data 2 Scott
28-Jan Mon Plotting and Fitting Data 3 Scott
30-Jan Wed Plotting and Fitting Data 4 Scott
4-Feb Mon Plotting and Fitting Data 5 Scott
6-Feb Wed Reliability Mechanisms 1 Scott
11-Feb Mon Reliability Mechanisms 2 Glenn
13-Feb Wed Midterm Exam
18-Feb Mon Reliability Mechanisms 3 Bill Roesch, Triquint
20-Feb Wed Seminar (Follow-on from Bill and other Mechanisms lectures) Bill, Scott, Glenn
25-Feb Mon Qual Methodology Glenn
27-Feb Wed Qual Methodology Glenn
4-Mar Mon Test Methodology I (Description of Test) Glenn
6-Mar Wed Test Methodology II Glenn
11-Mar Mon Test Methodology III Glenn
13-Mar Wed Review Session Glenn & Scott
18-Mar Mon Final Exam Mon or Wed.
20-Mar Wed
Exam
Week
7
8
9
10
1
2
3
4
5
6

Introduction to Quality and Reliability Engineering
7 Jan 2013 ECE 510 S.C.Johnson, C.G.Shirley 10
Semiconductor Manufacturing
7 Jan 2013 ECE 510 S.C.Johnson, C.G.Shirley 11

• Transistor density doubles every 18 months (Moore’s Law).
• New products take 1.5 to 2 years from conception to manufacture.
• Technology development and product design must occur in parallel.
• QRE is involved at all stages of the Technology and Product Lifecycles.
• QRE role is control of customer quality and reliability risks.
Technology Certification
How Moore’s Law Works
7 Jan 2013 ECE 510 S.C.Johnson, C.G.Shirley 12
Technology Development
Product Development Manufacturing
Lead Product Qualification
Pre-silicon Development Post-silicon Development
Product Development Manufacturing
Follow-on Product Qualification
Next Technology Development
Synch point Synch point
Product Development Mfg
Synch point
18 months 18 months

ECE 510 S.C.Johnson, C.G.Shirley
Product Lifecycle
• Manuf’g Optimization o Test setpoints, limits. o Product tuning, fusing.
• Quality Systems o Process control o Containment o Feedback to design and
manufacturing. o Quality and reliability
monitors.
• Market/Feature Reqts o End User Features o OEM DFM Features o Performance, Power
Goals o Quality, Reliability Goals
• Technology Selection
• Design Goals o Area/power budgets.
• OEM Datasheet Definition
• Manufacturing Reqts o DFM Features o Producer Mfg Goals o Capacity Planning
• Design o Logical description (RTL) o Gate-level o Circuit/layout level.
• Refined projections o Power o Performance o Reliability.
Decisions
Req
uir
emen
ts
Info
rmat
ion
Data Test Vehicle Data
Product Data
Device/Ckt Simulation
Technology Projections/Scaling
Market Research
Post-Silicon Pre-Silicon
Definition Planning Production
Ramp High Volume
Design
Validation Early Design Late Design
~ 1 year ~ 0.5 y ~ 0.25 y
~ 1.5 years
Traditional Product
Qualification
Product Requirements
Go/NoGo
Feasibility Go/NoGo
Pre- silicon
Qualification
Design Milestones
13 7 Jan 2013
Synch point
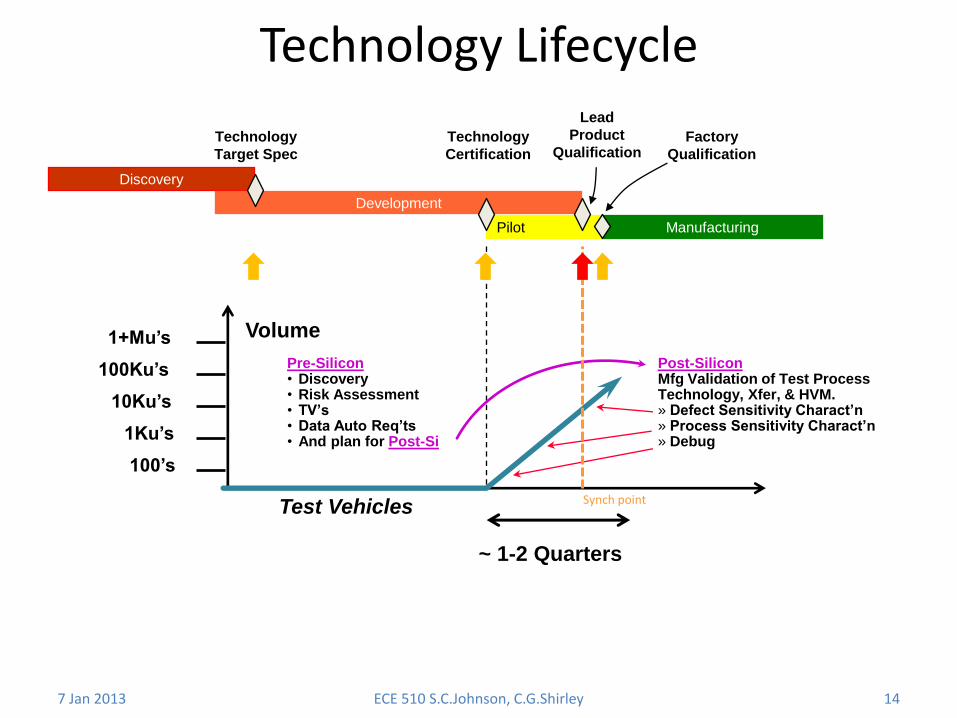
Technology Lifecycle
ECE 510 S.C.Johnson, C.G.Shirley 14
Volume
100’s
1Ku’s
10Ku’s
100Ku’s
1+Mu’s
Pre-Silicon • Discovery • Risk Assessment • TV’s • Data Auto Req’ts • And plan for Post-Si
Post-Silicon Mfg Validation of Test Process Technology, Xfer, & HVM. » Defect Sensitivity Charact’n » Process Sensitivity Charact’n » Debug
~ 1-2 Quarters
Test Vehicles
Pilot
Discovery Discovery
Development
Technology
Target Spec
Manufacturing
Lead
Product
Qualification Technology
Certification
Factory
Qualification
7 Jan 2013
Synch point
Quality
7 Jan 2013 ECE 510 S.C.Johnson, C.G.Shirley 15

Role of the Q&R Engineer (QRE) • The QRE is a proxy for the customer, at all stages of the Product and
Technology lifecycles, and
– Gives Q&R Requirements. Provide quality and reliability requirements for products, technologies, and manufacturing.
– Assesses Risk. Assess product, technology, and manufacturing risks.
– Writes Validation Plans. Technology Certification, Product Qualification.
– Designs Experiments. Provides requirements to acquire needed data.
– Builds Q&R Models. What-if models providing estimates of Q&R figures of merit to enable decision-making involving Q&R attributes of the product.
• Kinds of QRE
– Technology Development QRE. Silicon and Package reliability models, burn-in development. Process Certification.
– Test QRE. Fault coverage analysis and modeling. Test program requirements.
– Product QRE. Responsible for specific product. Product Qualification.
– Materials QRE. Quality control of incoming materials and vendors.
– Manufacturing/Factory QRE. Monitors. MRB, DRB. Containment.
– Customer QRE. Find customer Q&R req’ts, deal with Q&R “escapes”.
7 Jan 2013 ECE 510 S.C.Johnson, C.G.Shirley 16

8/2-4/2011 Plastic Package Reliability 17
Life of an Integrated Circuit
End-user Environment Assembly Shipping Storage OEM/ODM
Assembly
Source: Eric Monroe, 2003
Mobile PC
DT
User Drop
& Vibe
Shipping Shock Temp, RH Power Cycle Bend Reflow Handling
Te
mp
BAM!
Bent Pins, Singulation
Temperature
Cycle
Desktop
DT
Shipping Shock Temp, RH Bend Power Cycle Reflow Handling
Tem
p
Bent Pins, Singulation
Temperature
Cycle
User Drop
& Vibe
Keypad
press
DT
Shipping Shock Temp, RH Bend Reflow Handling Temperature
Cycle
BAM!
Handheld
Slide by Scott C. Johnson.

End User Assembly
Component Manufacturer System Manufacturer
Debug/ Repair
Analysis
Analysis
Analysis Analysis
Burn-In/ Test
System Assembly
System Test
Fab/Sort
Physical Manufacturing/Use Flow • The QRE must keep in mind the entire physical life of the component.
• Component Mfr and System Mfr generates failures, as does End Use.
• The failure rates are key Q&R figures of merit.
• Failures are analyzed. Feedback improves processes.
7 Jan 2013 ECE 510 S.C.Johnson, C.G.Shirley
Physical units
Information
Failed units
10-20%
1-2%
~ 0.5 %
500 PPM
18

Quality vs Reliability • Quality.
– Conformance to specification at the customer, usually the System Mfr.
– Impact: Rework at System Manufacturer. Brand image.
– Measures of Quality (Figures of Merit)
• How (which attributes) unit fails to meet specification.
– Eg. Out of box experience.
• Fraction of the population failing to meet specification.
– Eg. 2%, 500 PPM, 300 DPPM, 300 DPM.
• Reliability
– Conformance to specification usually at the End User, through time.
– Impact: Warranty cost to system Mfr. Brand image of System Mfr. to End User. Brand image of Component Mfr to System Mfr.
– Measures of Reliability (Figures of Merit)
• How (which attributes) and when unit fails to meet specification.
• Fraction of the population failing to meet specification in a specified time interval.
– Eg. 1% in 7 years, 500 DPM in 30 days, 0.1% in warranty period, 10 %/kh, 100 Fits.
7 Jan 2013 ECE 510 S.C.Johnson, C.G.Shirley 19
For discussion: What “population” do we mean?
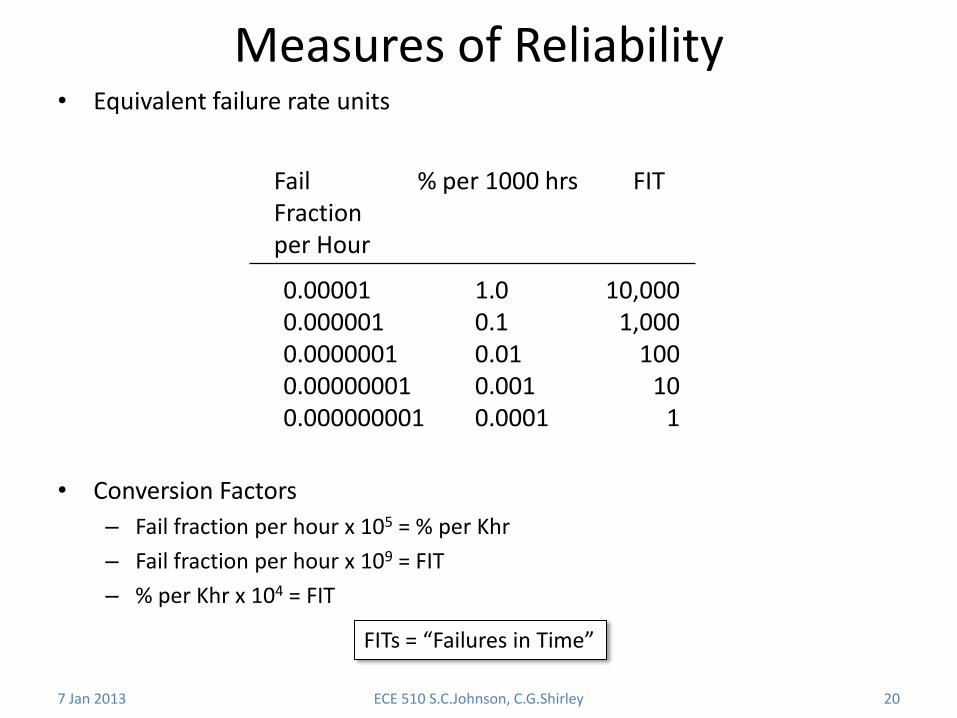
Measures of Reliability • Equivalent failure rate units
• Conversion Factors
– Fail fraction per hour x 105 = % per Khr
– Fail fraction per hour x 109 = FIT
– % per Khr x 104 = FIT
7 Jan 2013 ECE 510 S.C.Johnson, C.G.Shirley 20
0.00001 1.0 10,000 0.000001 0.1 1,000 0.0000001 0.01 100 0.00000001 0.001 10 0.000000001 0.0001 1
Fail % per 1000 hrs FIT Fraction per Hour
FITs = “Failures in Time”

Quality Assurance
7 Jan 2013 ECE 510 S.C.Johnson, C.G.Shirley 21
• Quality assurance is achieved by thorough test.
• Test occurs throughout the manufacturing process, not just at the end.
• Purpose of Test
– Screen grossly defective and out-of-spec parts.
– Classify parts into various speed, power, etc. bins.
Wafer Fabric’n
Sort Assembly Burn In Post-Burn
In Test aka “Class”
“Use”
Pre-Burn In Test
“Use”-Like Monitor
Wafer-level Cold
Unit-level Hot
Unit-level Hot
Unit-level Stress Very Hot, High Voltage
1M Good Die
300K Bad Die
Manufacture 1.3M Die
Screen out the Bad Die (defects 300K)
Speed Bin the Good Die
Tests
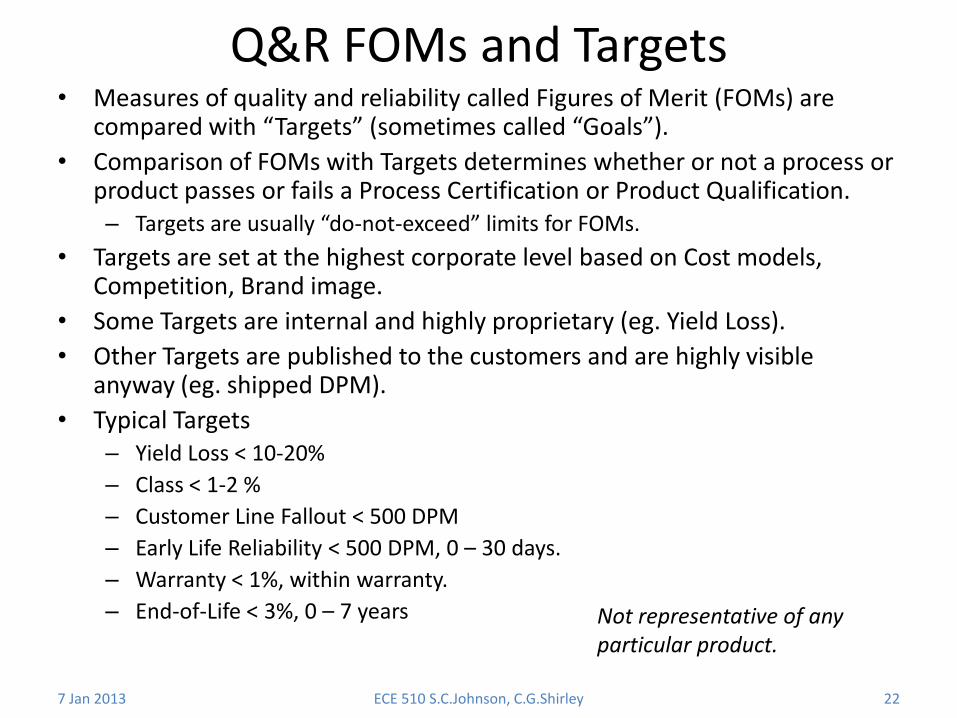
Q&R FOMs and Targets • Measures of quality and reliability called Figures of Merit (FOMs) are
compared with “Targets” (sometimes called “Goals”).
• Comparison of FOMs with Targets determines whether or not a process or product passes or fails a Process Certification or Product Qualification. – Targets are usually “do-not-exceed” limits for FOMs.
• Targets are set at the highest corporate level based on Cost models, Competition, Brand image.
• Some Targets are internal and highly proprietary (eg. Yield Loss).
• Other Targets are published to the customers and are highly visible anyway (eg. shipped DPM).
• Typical Targets – Yield Loss < 10-20%
– Class < 1-2 %
– Customer Line Fallout < 500 DPM
– Early Life Reliability < 500 DPM, 0 – 30 days.
– Warranty < 1%, within warranty.
– End-of-Life < 3%, 0 – 7 years
7 Jan 2013 ECE 510 S.C.Johnson, C.G.Shirley 22
Not representative of any particular product.

Reliability Goals from ITRS 2009
8/2-4/2011 Plastic Package Reliability 23
Infant Mortality
Wear-out
Constant fail rate
http://www.itrs.net/reports.html

Reliability
7 Jan 2013 ECE 510 S.C.Johnson, C.G.Shirley 24

The Reliability Problem
7 Jan 2013 ECE 510 S.C.Johnson, C.G.Shirley 25
• Quality fails can be handled by thorough testing
• Reliability is harder because the fails come long after we’ve sold the product – How can we tell which parts are going to fail in the future?

The Reliability Solution • The answer is that we must do research and determine
– How the parts fail (the fail mechanisms)
– What stresses made the part fail
• Then we must
– Design our product so that none of the fail mechanisms are activated by the stresses encountered during normal use
– Specify those use conditions clearly
– Test our product under accelerated stress conditions
7 Jan 2013 ECE 510 S.C.Johnson, C.G.Shirley 26

Understanding Reliability: A Keyboard
7 Jan 2013 ECE 510 S.C.Johnson, C.G.Shirley 27
• How might a keyboard key fail? (mechanisms)
– Material that gives tactile “click” might fatigue and break
– Electric contacts might corrode or become blocked with dirt
• What might cause these fails? (stresses)
– Being pressed too many times (wearout)
– Heat, humidity, dust, dirt, spills, being pressed too hard
• How can we test a key’s entire life? (stress test)
– Use a machine to press it 1,000,000 times
– Before that, heat it and shake it with dirt and water
• How can we make it more reliable? (design for rel.)
– Find what breaks and make that (and only that) stronger

Reliability Example: Aircraft Reliability • De Havilland Comet was an early commercial jet
• A few crashes were initially unexplained
• Thorough research led to understanding of metal fatigue (fail mechanism) from cabin pressurization (stress)
• Great 1-hour video (TV show) about it:
– http://www.youtube.com/watch?v=_3JZ3wHlgvI
7 Jan 2013 ECE 510 S.C.Johnson, C.G.Shirley 28

Reliability Assurance
7 Jan 2013 ECE 510 S.C.Johnson, C.G.Shirley 29
The stresses and fail mechanisms for integrated circuits are different, but the concepts are the same:
• Stresses: voltage, temperature, current, humidity, radiation, temperature cycling, mechanical stress
• Mechanisms: transistors (degradation), interconnects (cracking), package (corrosion, fatigue)
Reliability is assured by a qualification process, where statistical samples of products are stressed to simulate a lifetime.
A burn-in system and HAST system perform stress tests on chips
Monte Carlo Methods
7 Jan 2013 ECE 510 S.C.Johnson, C.G.Shirley 30
We will now give an example of the sort of exercise we will do most days in this class:

7 Jan 2013 ECE 510 S.C.Johnson, C.G.Shirley 31
What is Monte Carlo?
• Answer: A famous casino.
• Monte Carlo (MC) methods are numerical calculations using random numbers
Monte Carlo, Monaco, Europe

7 Jan 2013 ECE 510 S.C.Johnson, C.G.Shirley 32
What Can Monte Carlo Do?
• Answer: Give approximate numerical solutions to problems we can’t solve exactly
• Best suited for:
– Distributions
– Integrals (areas under a curve)
when we have
– Many parameters (= many dimensions)
– Complicated or non-analytic functional forms
• Many simulations of the manufacturing process are ideal for MC
7 Jan 2013 ECE 510 S.C.Johnson, C.G.Shirley 33
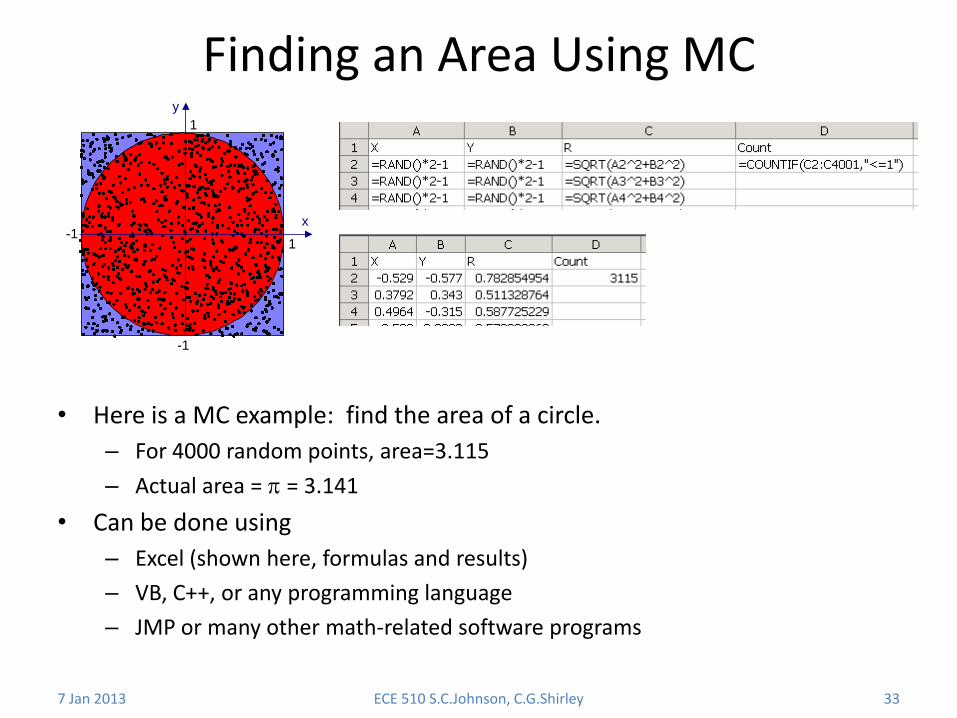
Finding an Area Using MC
• Here is a MC example: find the area of a circle.
– For 4000 random points, area=3.115
– Actual area = = 3.141
• Can be done using
– Excel (shown here, formulas and results)
– VB, C++, or any programming language
– JMP or many other math-related software programs
x
y
-1
-1
1
1

7 Jan 2013 ECE 510 S.C.Johnson, C.G.Shirley 34
Thinking Like an Integral
• Many of our simulations can be interpreted as integrals (area under a curve)
• The area under this function is
Angle brackets are an average,
x
y
-1
-1
1
1
f (x,y) ={ 1 inside circle 0 outside
V = blue square = 4
fVdVf
N
iixf
Nf
1
1

7 Jan 2013 ECE 510 S.C.Johnson, C.G.Shirley 35
Exercise 1.1
• Do a Monte Carlo calculation of Pi as shown in the previous slide. Use 4000 samples.
• Be prepared to give your numerical answer (x points out of 4000 are in the circle) in class.
• Turn in your spreadsheet by email before beginning of class 1 week from today.

7 Jan 2013 ECE 510 S.C.Johnson, C.G.Shirley 36
Exercise 1.1 Solution
• Already shown two slides back.
Distribution of Answers • Collect and plot answers from everyone in class
7 Jan 2013 ECE 510 S.C.Johnson, C.G.Shirley 37

7 Jan 2013 ECE 510 S.C.Johnson, C.G.Shirley 38
Accuracy of MC
σ/μ=0.22%
3 3.1 3.2 3.3 3.4
σ/μ=0.88%
σ/μ=2.7%
N=40,000
N=4000
N=400
σ=standard dev μ=mean 40 trials per N
100 1000 104 105
N
Perc
ent
0 2.5
5
7.
5
7 Jan 2013 ECE 510 S.C.Johnson, C.G.Shirley 39
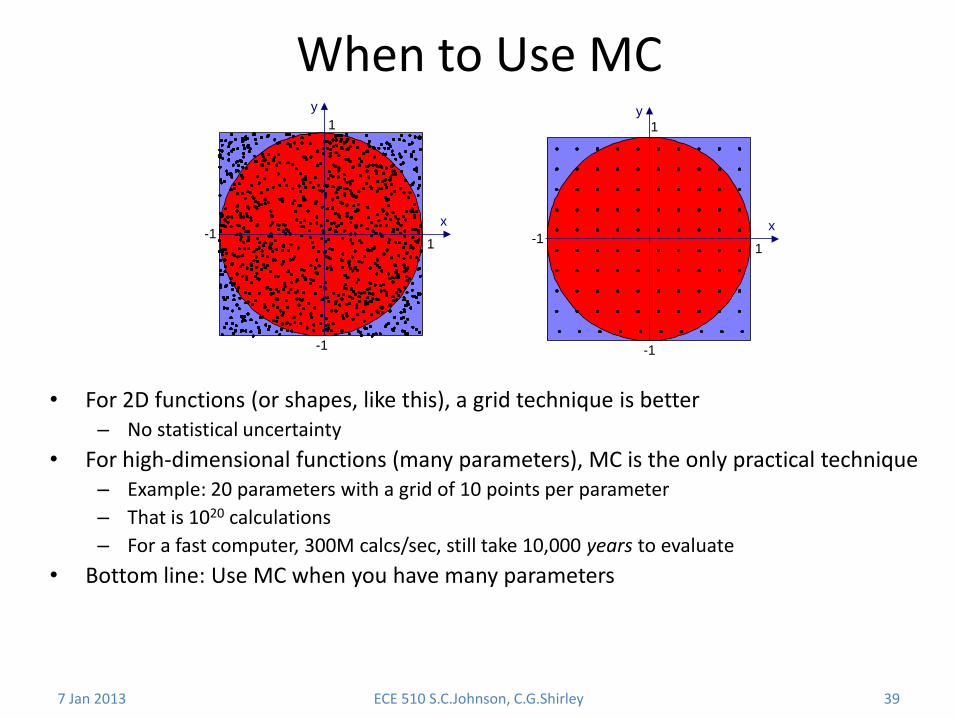
When to Use MC
• For 2D functions (or shapes, like this), a grid technique is better – No statistical uncertainty
• For high-dimensional functions (many parameters), MC is the only practical technique – Example: 20 parameters with a grid of 10 points per parameter
– That is 1020 calculations
– For a fast computer, 300M calcs/sec, still take 10,000 years to evaluate
• Bottom line: Use MC when you have many parameters
x
y
-1
-1
1
1
x
y
-1
-1
1
1

The End
7 Jan 2013 ECE 510 S.C.Johnson, C.G.Shirley 40
Top Related