Earned Value Management For Shipbuilding - Welcome …sparusa.com/Presentations/PERCEPTION Earned...
72
PERCEPTION® Earned Value Management For Shipbuilding
Transcript of Earned Value Management For Shipbuilding - Welcome …sparusa.com/Presentations/PERCEPTION Earned...
PERCEPTION®
Earned Value Management
For
Shipbuilding
Earned Value Management is a project
management technique designed to:
Ensure work is properly & adequately planned,
budgeted & scheduled
Isolate problems for corrective action
Measure cost & schedule performance of work
accomplished in accordance with ANSI 748
Measure true cost condition
Forecast completion date & final cost
PERCEPTION
Ties Together All Areas of
Earned Value Management
• Cost Estimating
• Planning, Budgeting & Scheduling
• Labor Work Order & Manpower Management
• Purchasing & Inventory Control
• Change Order Management
• Earned Value Performance Measurement Reporting
• Cost & Schedule Forecasting
• Cost Analysis For Future Work Estimating
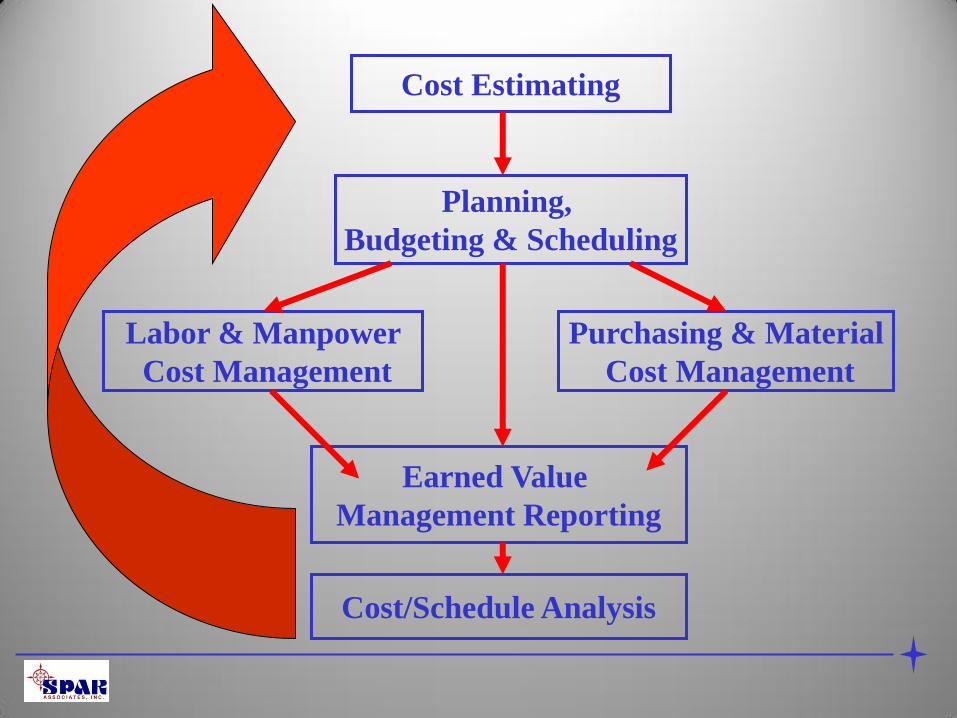
Cost Estimating
Planning,
Budgeting & Scheduling
Labor & Manpower
Cost Management
Purchasing & Material
Cost Management
Earned Value
Management Reporting
Cost/Schedule Analysis
Cost Estimating
• PERCEPTION was developed to permit cost estimating that can reflect modern ship design and production methods. Using product- and process-based information, cost estimates can be generated quickly and accurately at any level of detail:
• Parametric cost estimates based upon modifiable ship design and mission characteristics
• Shipbuilding standard interim products
• Detail cost estimates based upon engineered bills of material and equipment specifications.
Cost Tracking & Forecasting
• PERCEPTION tracks cost and schedule performance.
• Forecasts are made by the system based upon earned value methods
• Trends are developed by the system to provide management with improved visibility of changes to contract performance.
Tracking & Managing Costs and
Schedules
• By SWBS (Ship System)
• By PWBS (Product & Process)
• By COA (Shipyard Organization Structure)
• By CLIN (Contract Line Item)
Planning
Activity
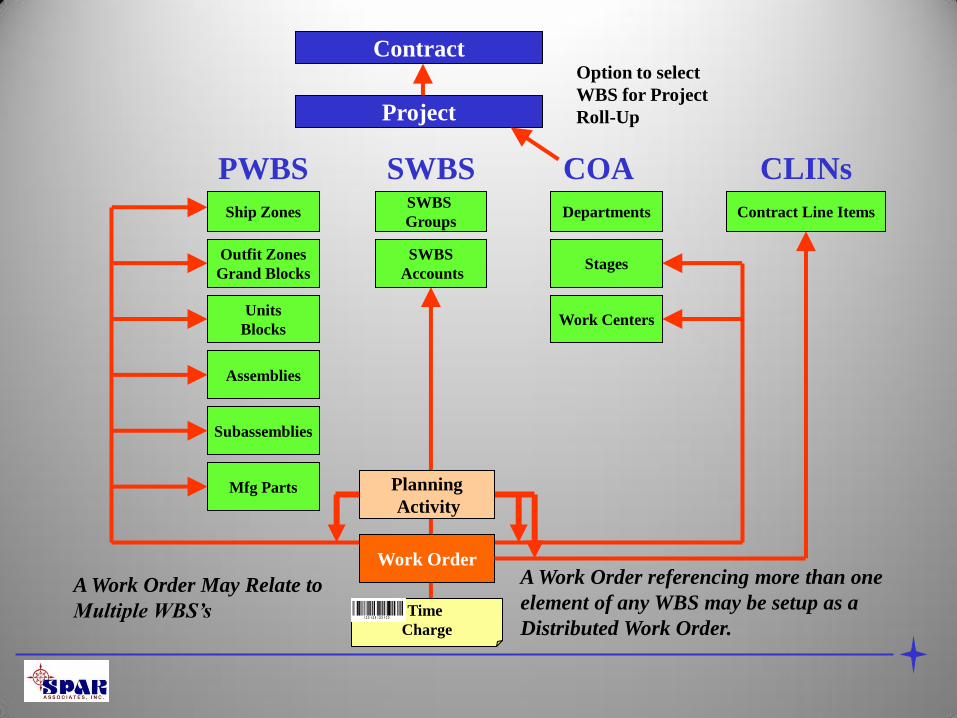
Contract
Project
Contract Line Items Ship Zones
Outfit Zones
Grand Blocks
Units
Blocks
Assemblies
Subassemblies
Mfg Parts
PWBS SWBS COA SWBS
Groups
SWBS
Accounts
Departments
Stages
Work Centers
Time
Charge
CLINs
A Work Order May Relate to
Multiple WBS’s
A Work Order referencing more than one
element of any WBS may be setup as a
Distributed Work Order.
Option to select
WBS for Project
Roll-Up
Work Order
Planning
Activity
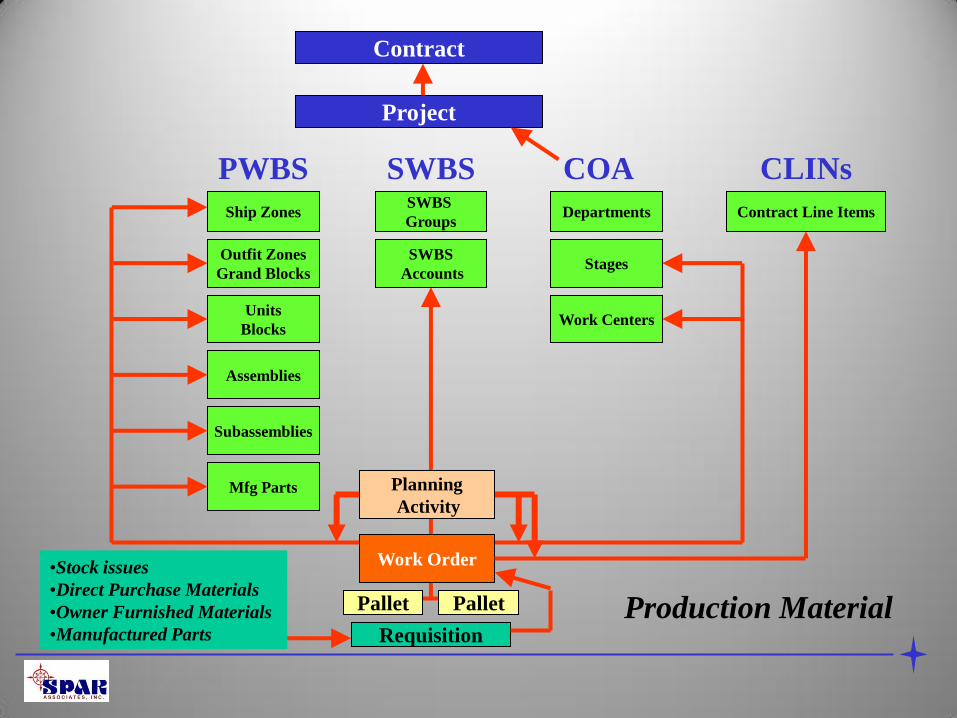
Contract
Project
Contract Line Items Ship Zones
Outfit Zones
Grand Blocks
Units
Blocks
Assemblies
Subassemblies
Mfg Parts
PWBS SWBS COA SWBS
Groups
SWBS
Accounts
Departments
Stages
Work Centers
CLINs
•Stock issues
•Direct Purchase Materials
•Owner Furnished Materials
•Manufactured Parts
Work Order
Requisition
Pallet Pallet Production Material
Tracking & Managing Costs and
Schedules:
Original Estimated Costs & Schedules
Baseline Costs & Schedules
Current Plan Costs & Schedules
Tracking & Managing Costs and
Schedules:
Labor Hours
Labor Dollars
Overhead Dollars
Material Dollars
Purchased Services
Total Dollars
Weeks
Ahead/Behind
Schedule
Forecast Finish
Date
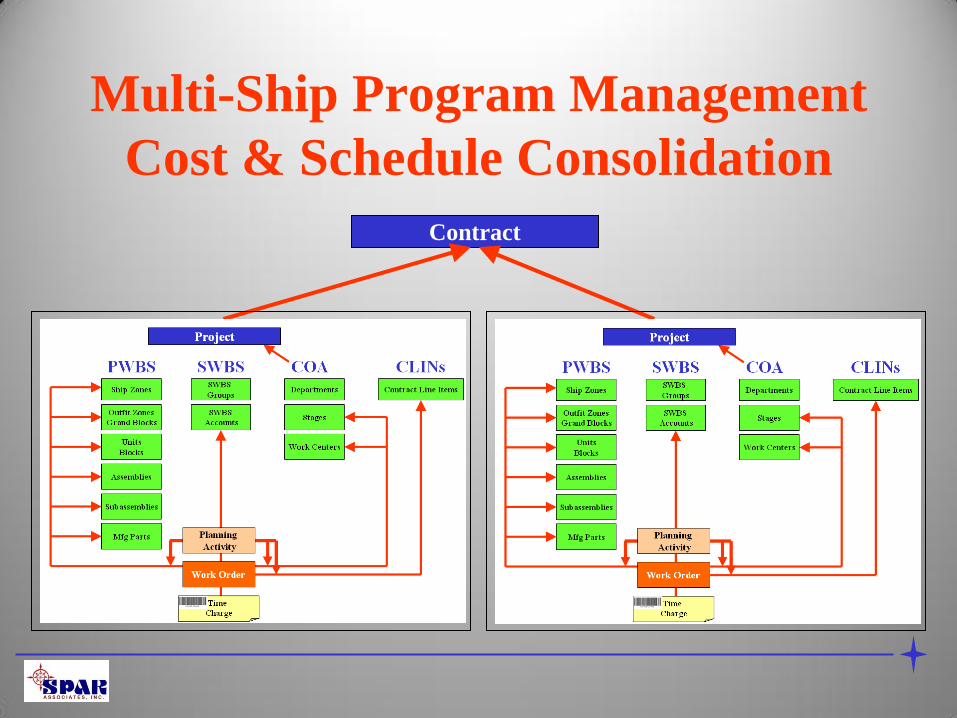
Multi-Ship Program Management
Cost & Schedule Consolidation
Contract
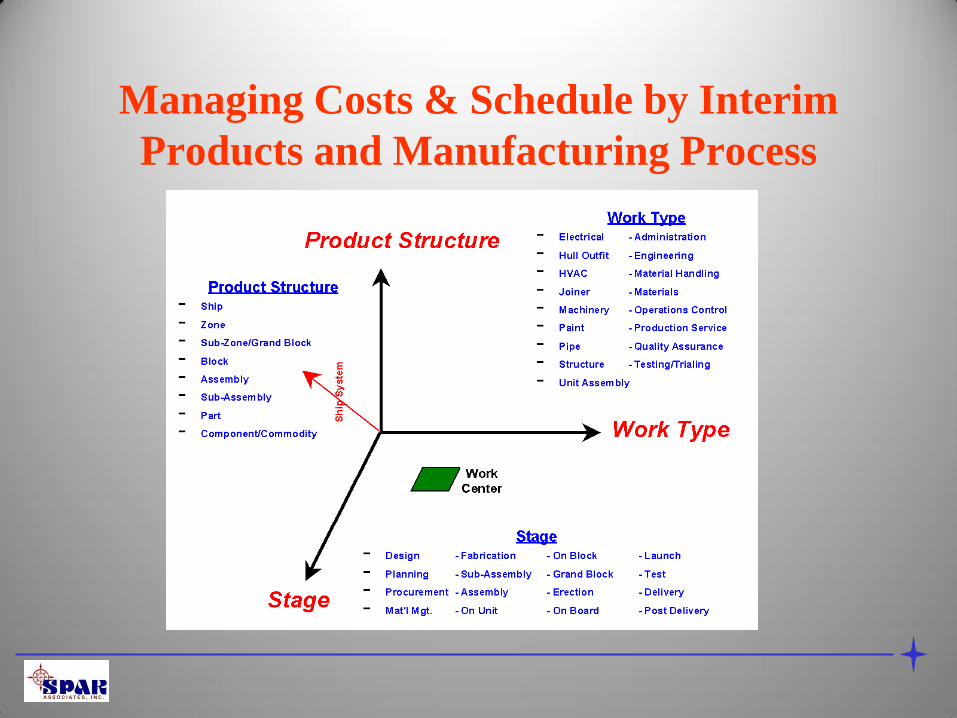
Managing Costs & Schedule by Interim
Products and Manufacturing Process
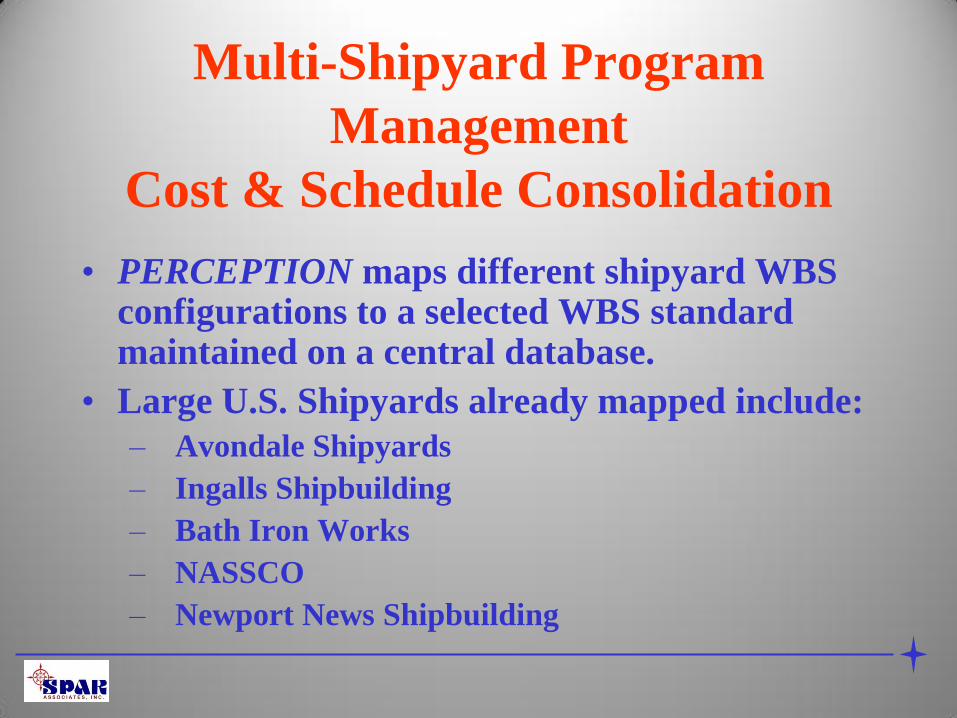
Multi-Shipyard Program
Management
Cost & Schedule Consolidation
• PERCEPTION maps different shipyard WBS configurations to a selected WBS standard maintained on a central database.
• Large U.S. Shipyards already mapped include:
– Avondale Shipyards
– Ingalls Shipbuilding
– Bath Iron Works
– NASSCO
– Newport News Shipbuilding
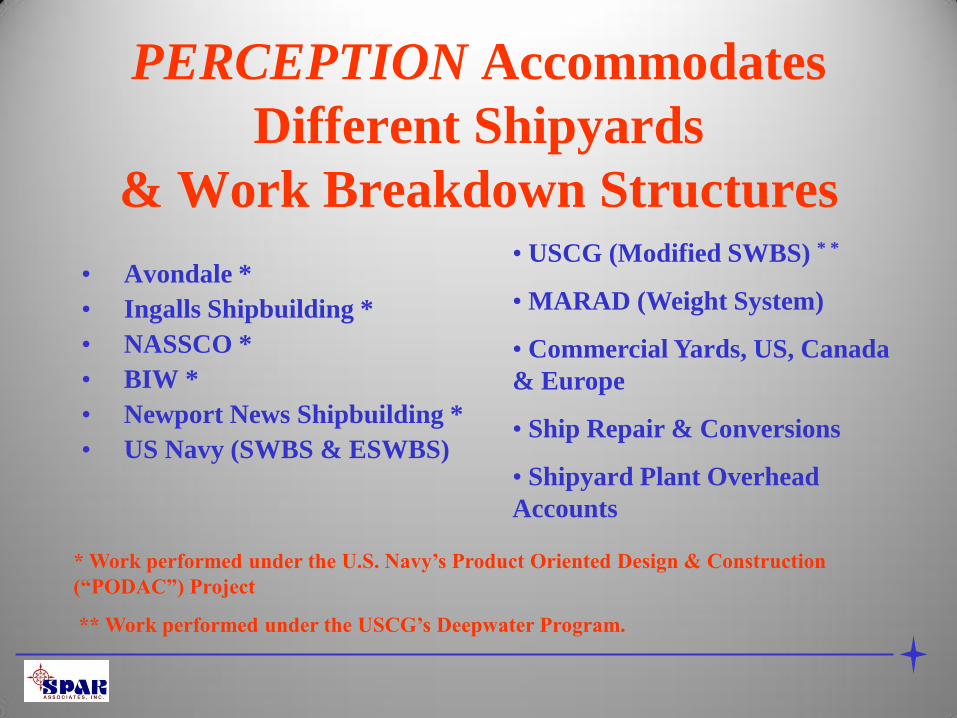
PERCEPTION Accommodates
Different Shipyards
& Work Breakdown Structures
• Avondale *
• Ingalls Shipbuilding *
• NASSCO *
• BIW *
• Newport News Shipbuilding *
• US Navy (SWBS & ESWBS)
• USCG (Modified SWBS) * *
• MARAD (Weight System)
• Commercial Yards, US, Canada
& Europe
• Ship Repair & Conversions
• Shipyard Plant Overhead
Accounts
* Work performed under the U.S. Navy’s Product Oriented Design & Construction
(“PODAC”) Project
** Work performed under the USCG’s Deepwater Program.
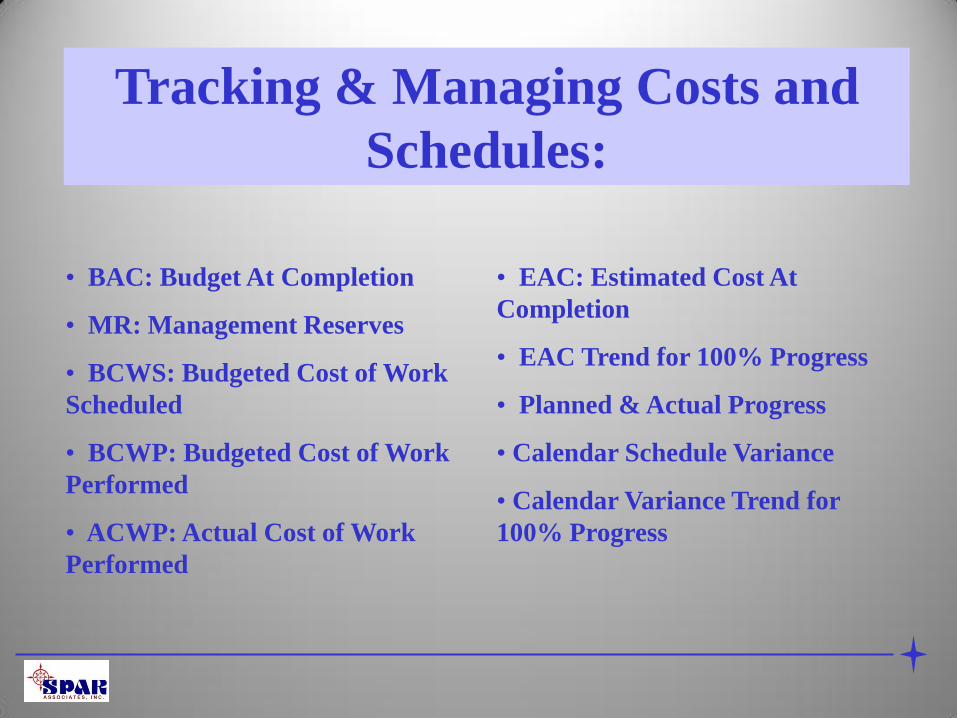
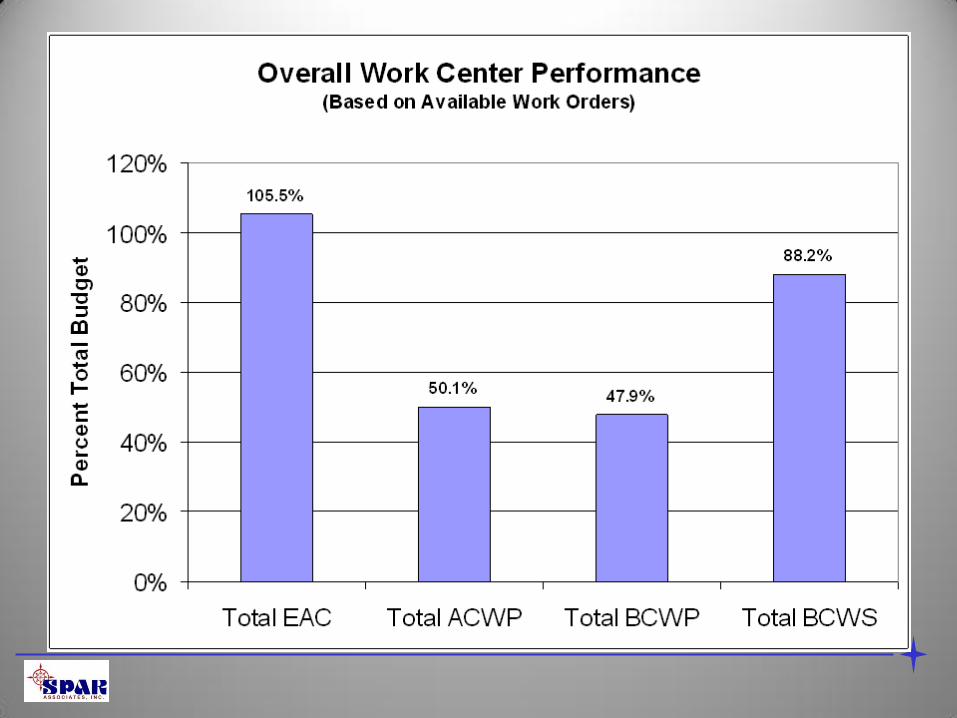
Tracking & Managing Costs and
Schedules:
• BAC: Budget At Completion
• MR: Management Reserves
• BCWS: Budgeted Cost of Work
Scheduled
• BCWP: Budgeted Cost of Work
Performed
• ACWP: Actual Cost of Work
Performed
• EAC: Estimated Cost At
Completion
• EAC Trend for 100% Progress
• Planned & Actual Progress
• Calendar Schedule Variance
• Calendar Variance Trend for
100% Progress
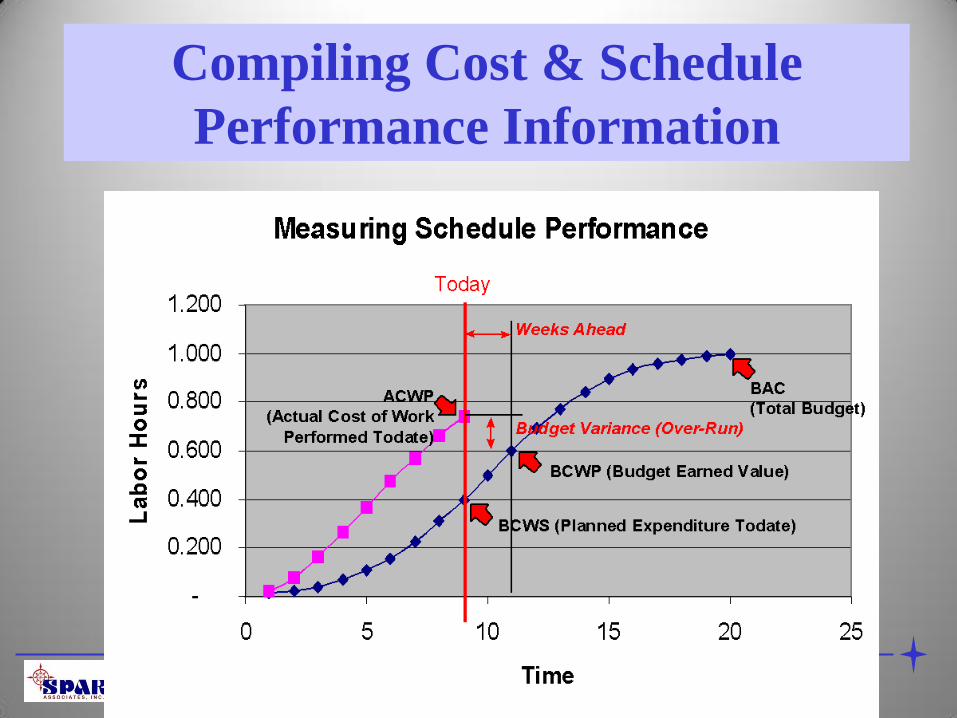
Compiling Cost & Schedule
Performance Information
Tracking & Managing
Costs and Schedules
• Rework
• Change Orders
• Labor Hours per 1% Progress
• Production Process Rates by Stage of
Construction
• Weeks Ahead/Behind Planned Schedules
• Trend Weeks Ahead/Behind for 100% Progress
• Forecast & Trend Over-Run/Under-Run
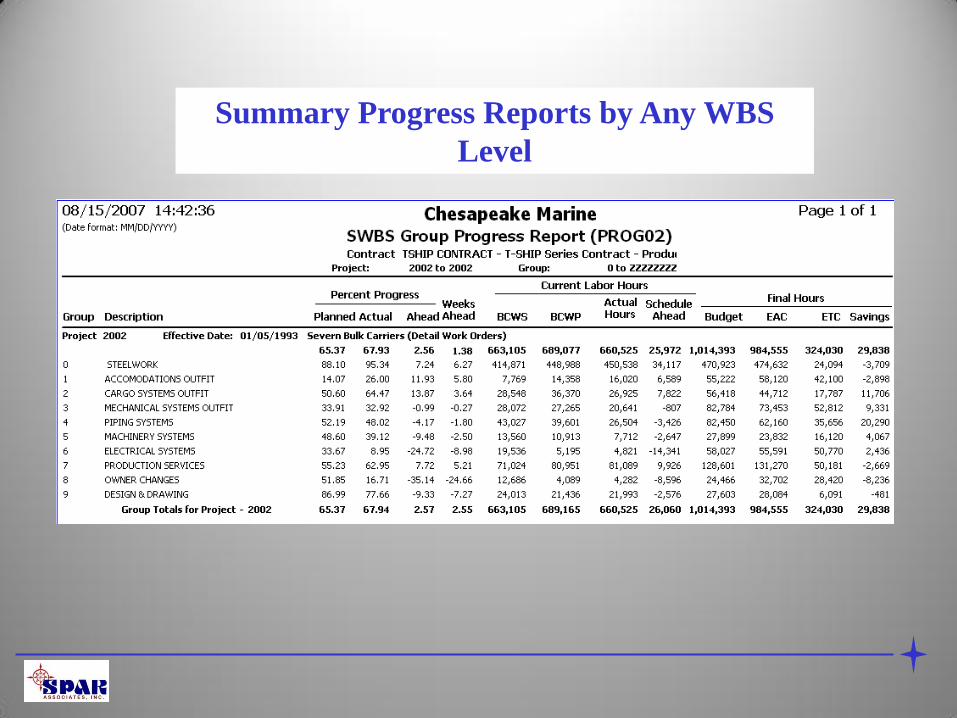
Summary Progress Reports by Any WBS
Level
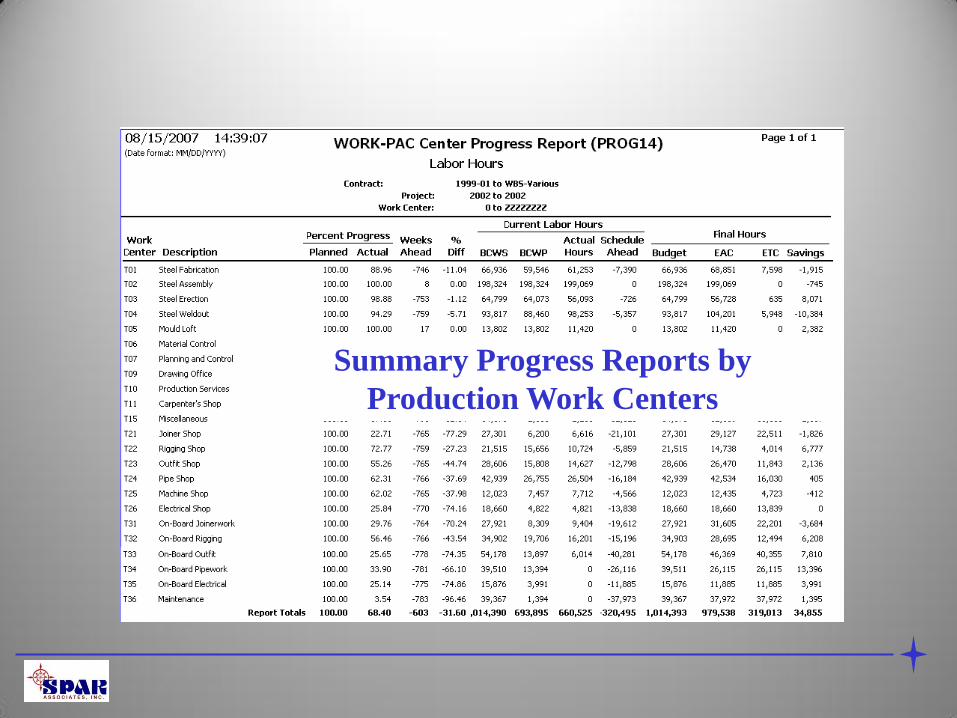
Summary Progress Reports by
Production Work Centers
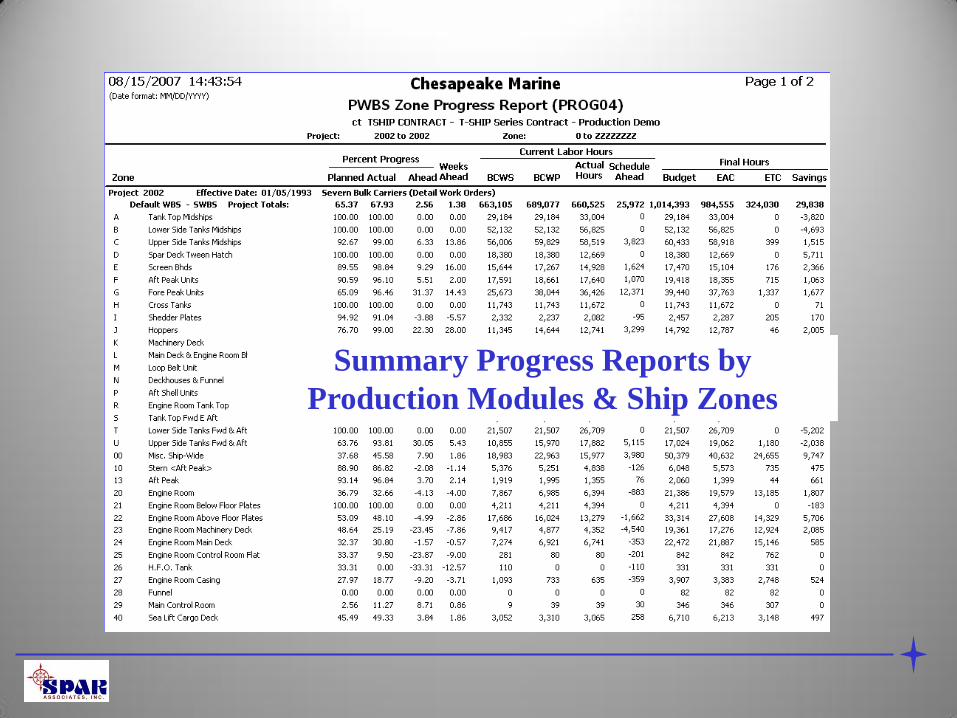
Summary Progress Reports by
Production Modules & Ship Zones
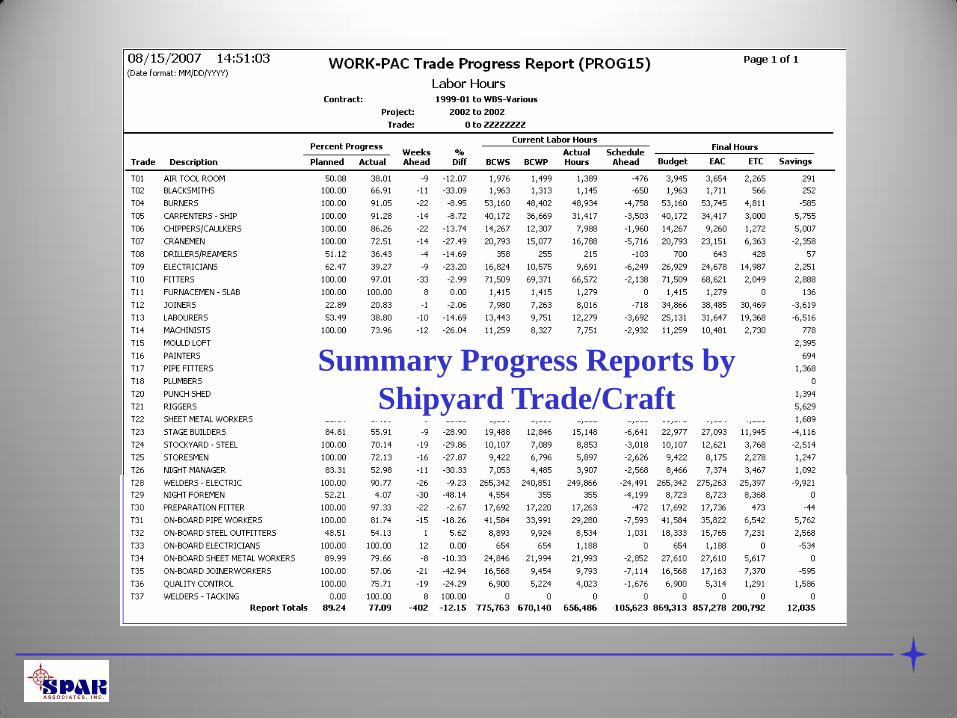
Summary Progress Reports by
Shipyard Trade/Craft
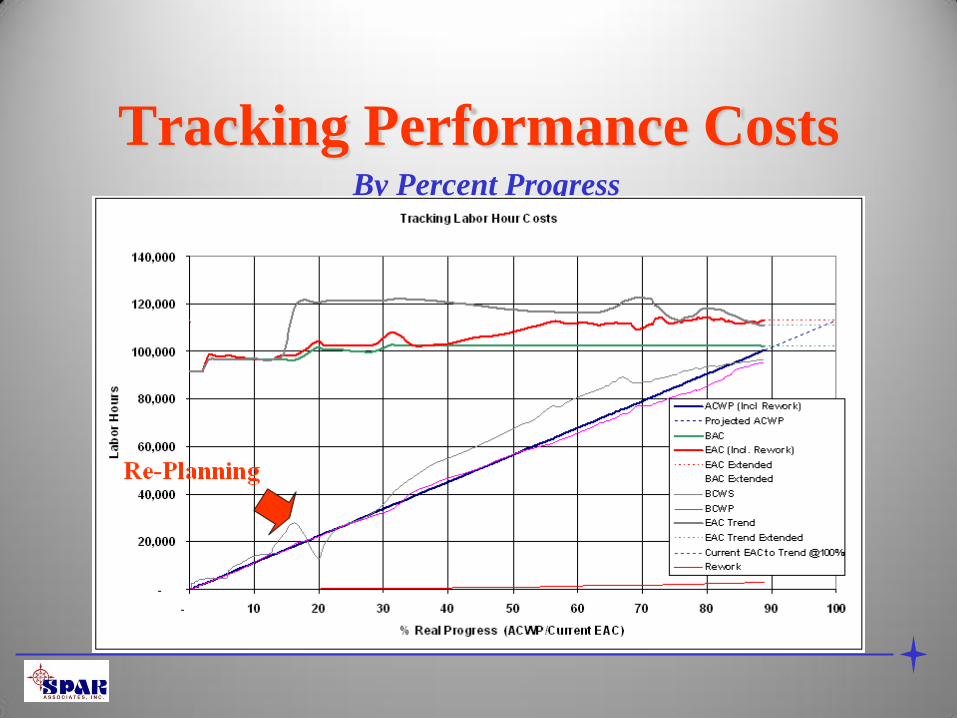
Tracking Performance Costs By Percent Progress
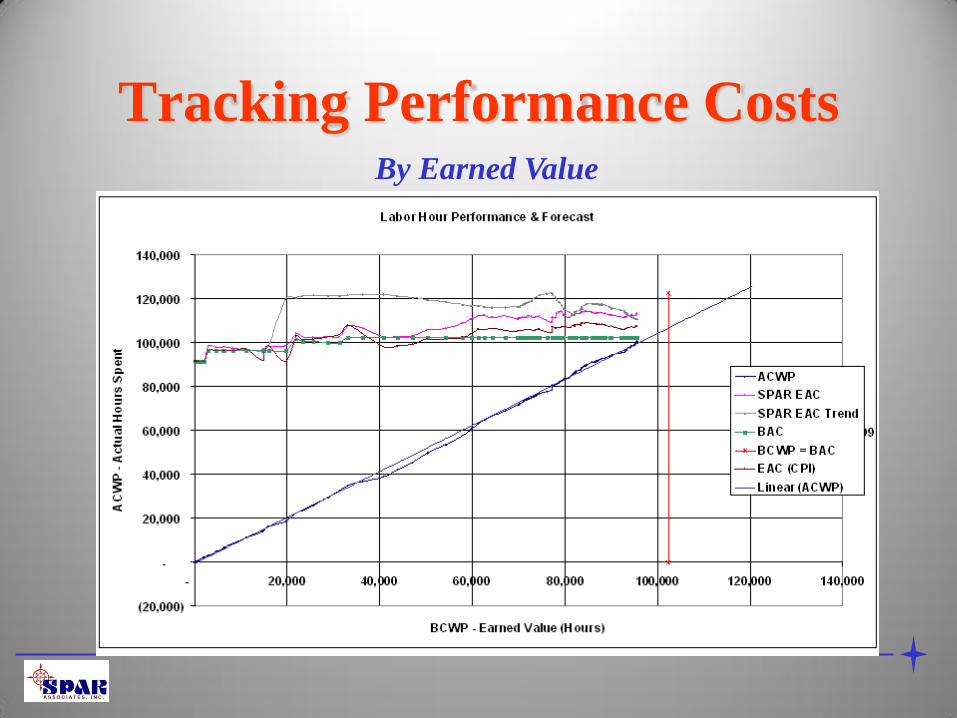
Tracking Performance Costs By Earned Value
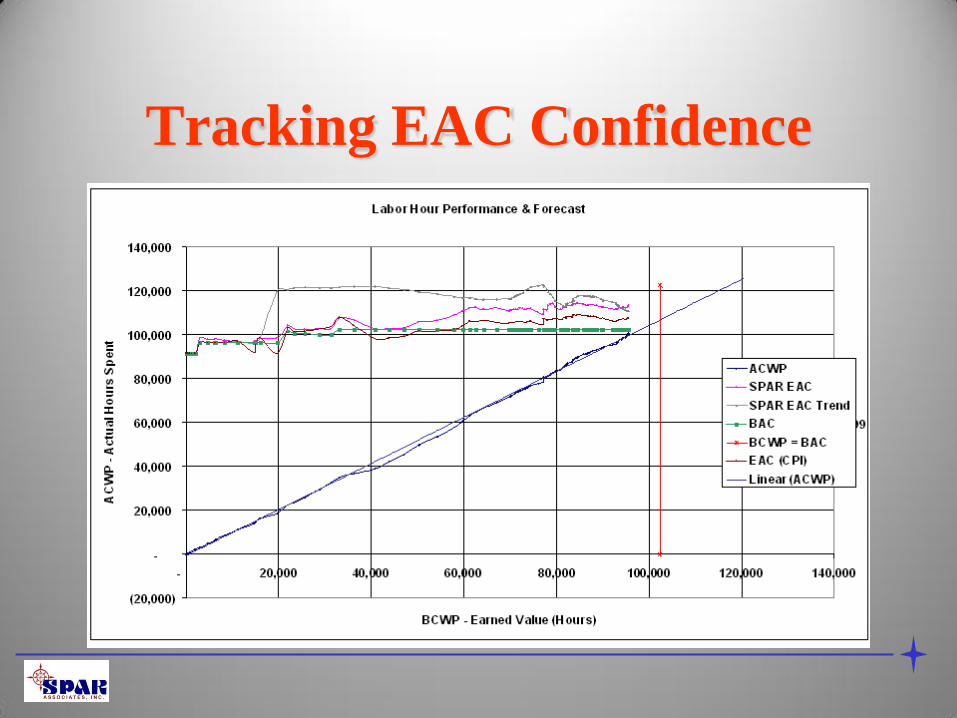
Tracking EAC Confidence
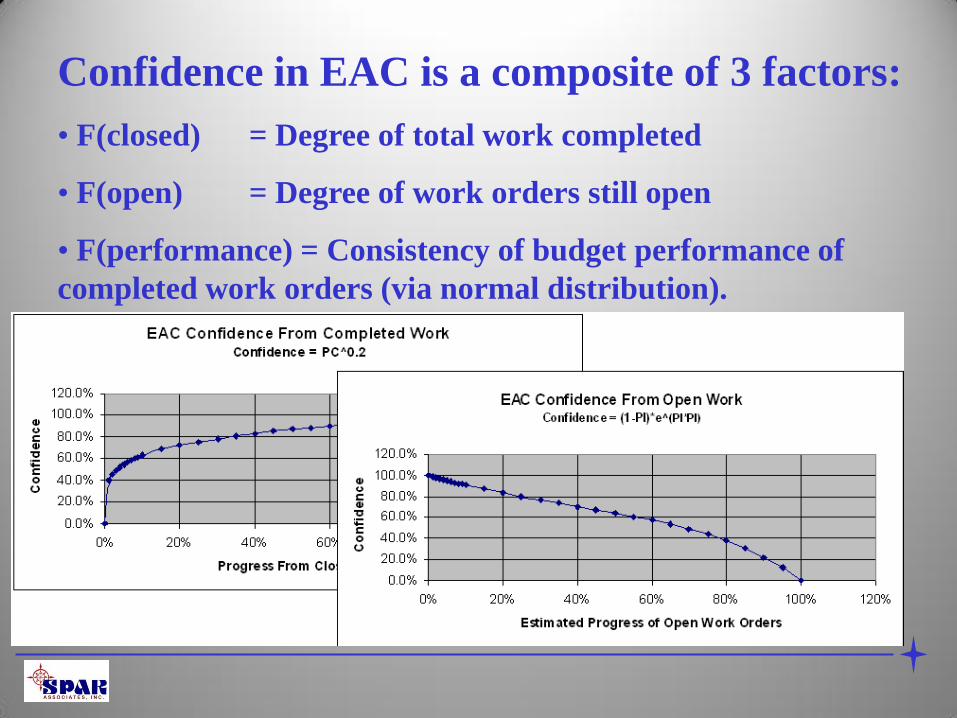
Confidence in EAC is a composite of 3 factors:
• F(closed) = Degree of total work completed
• F(open) = Degree of work orders still open
• F(performance) = Consistency of budget performance of
completed work orders (via normal distribution).
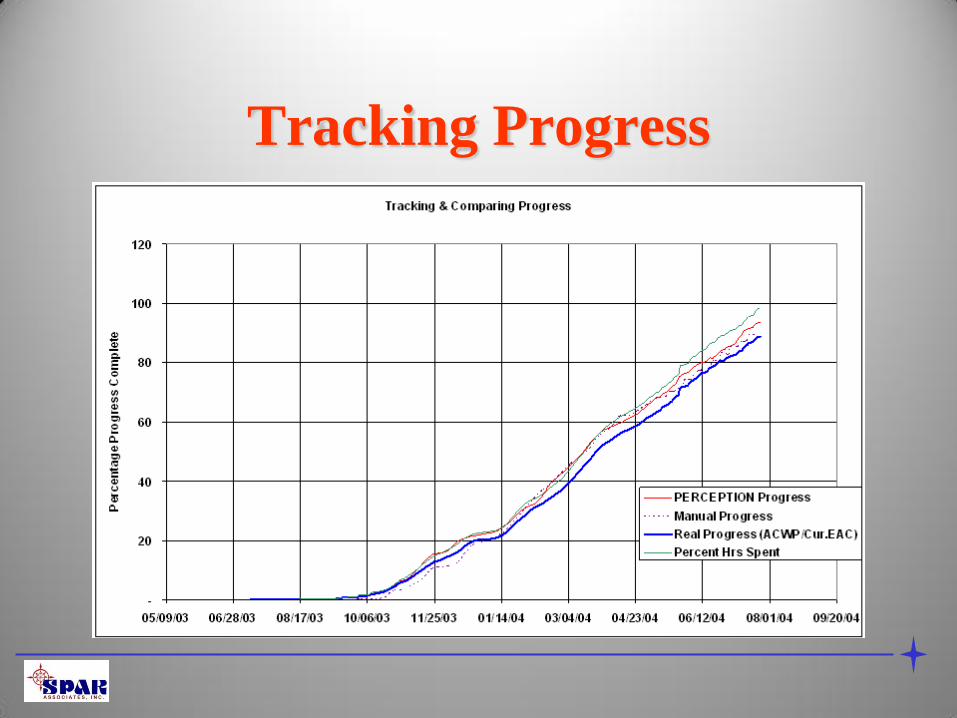
Tracking Progress
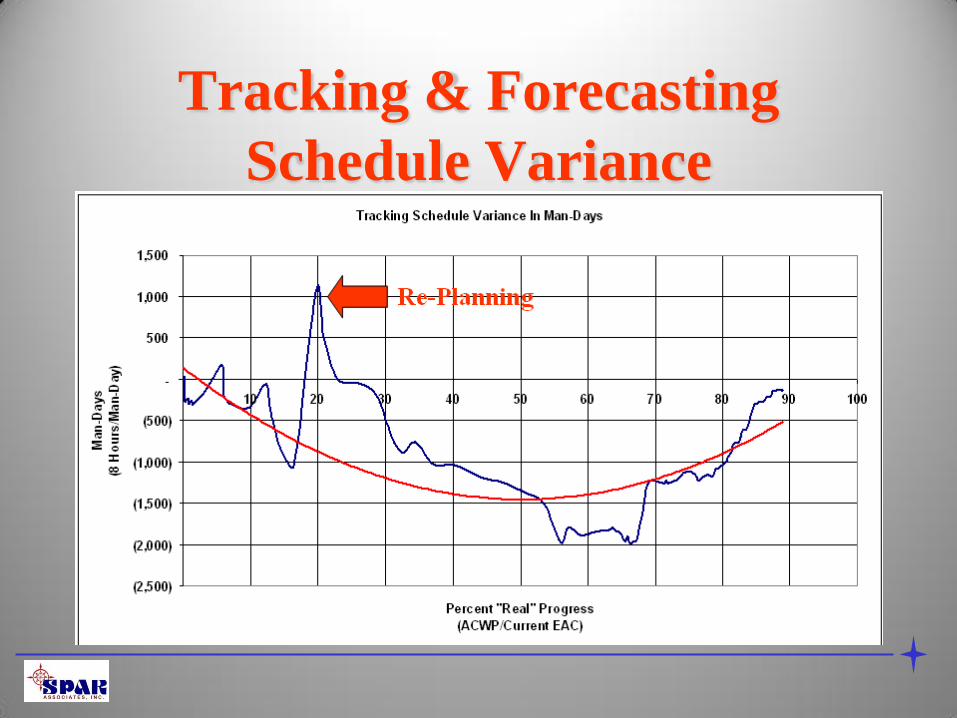
Tracking & Forecasting
Schedule Variance
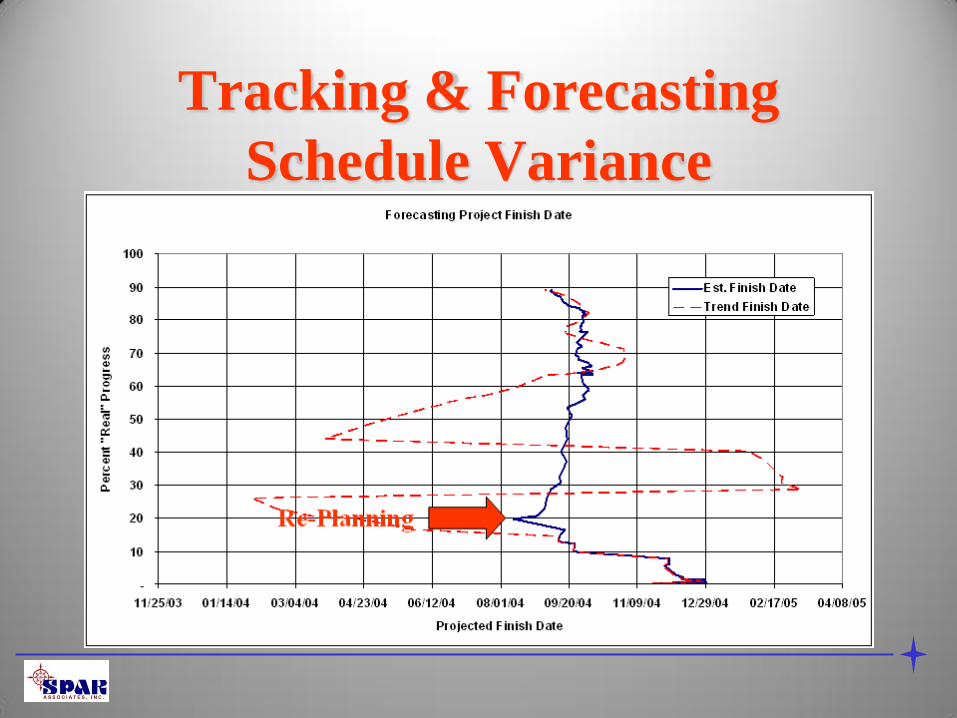
Tracking & Forecasting
Schedule Variance
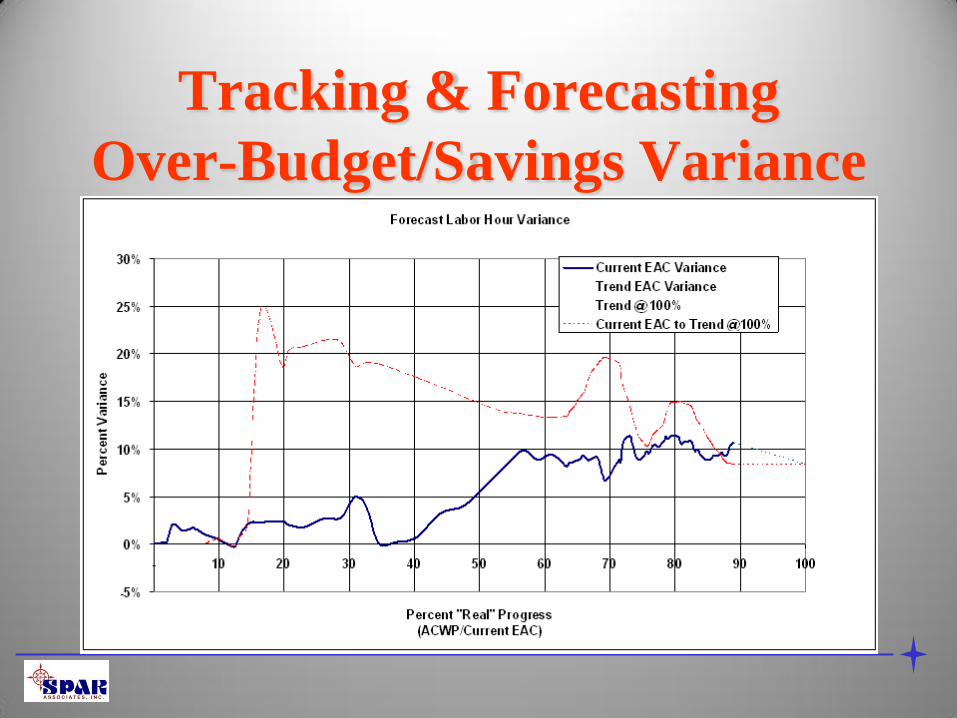
Tracking & Forecasting
Over-Budget/Savings Variance
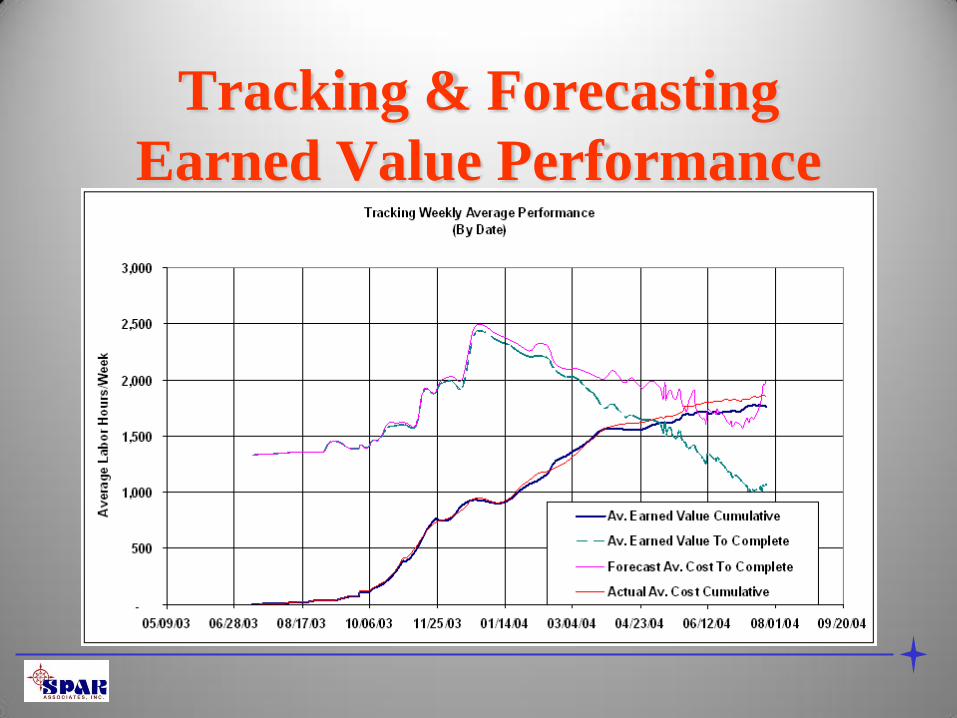
Tracking & Forecasting
Earned Value Performance
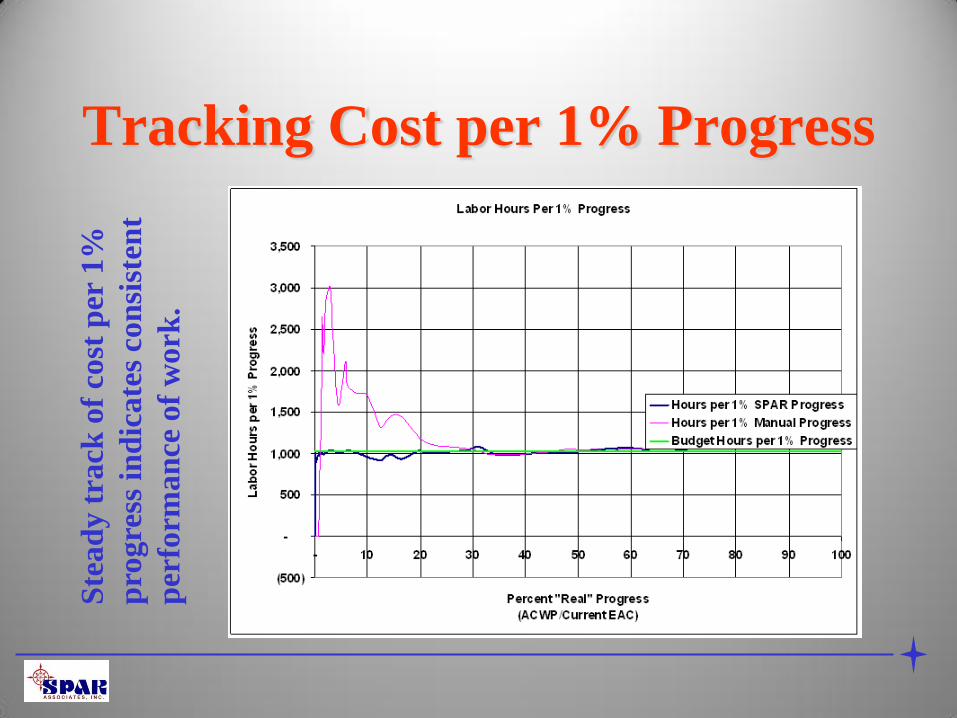
Tracking Cost per 1% Progress S
tea
dy t
rack
of
cost
per
1%
pro
gre
ss i
nd
icate
s co
nsi
sten
t
per
form
an
ce o
f w
ork
.
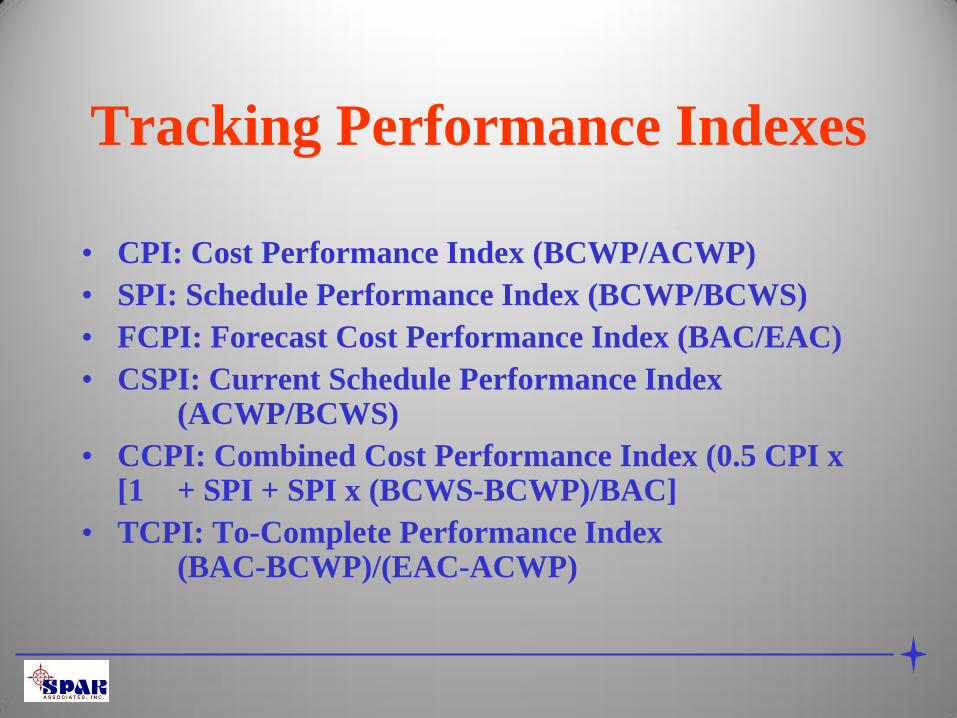
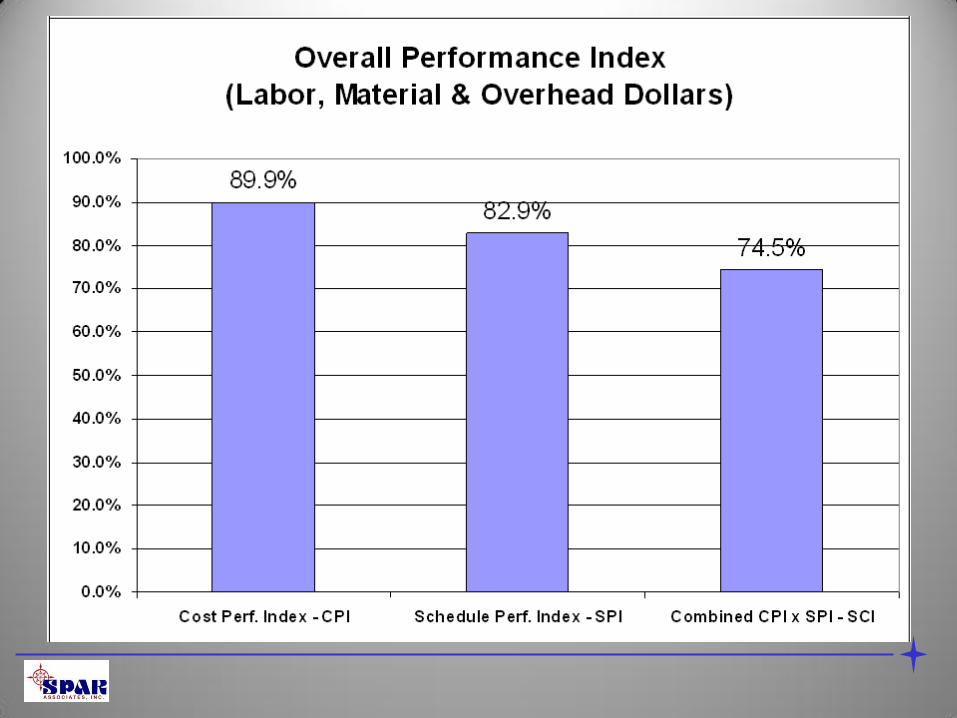
Tracking Performance Indexes
• CPI: Cost Performance Index (BCWP/ACWP)
• SPI: Schedule Performance Index (BCWP/BCWS)
• FCPI: Forecast Cost Performance Index (BAC/EAC)
• CSPI: Current Schedule Performance Index (ACWP/BCWS)
• CCPI: Combined Cost Performance Index (0.5 CPI x [1 + SPI + SPI x (BCWS-BCWP)/BAC]
• TCPI: To-Complete Performance Index (BAC-BCWP)/(EAC-ACWP)
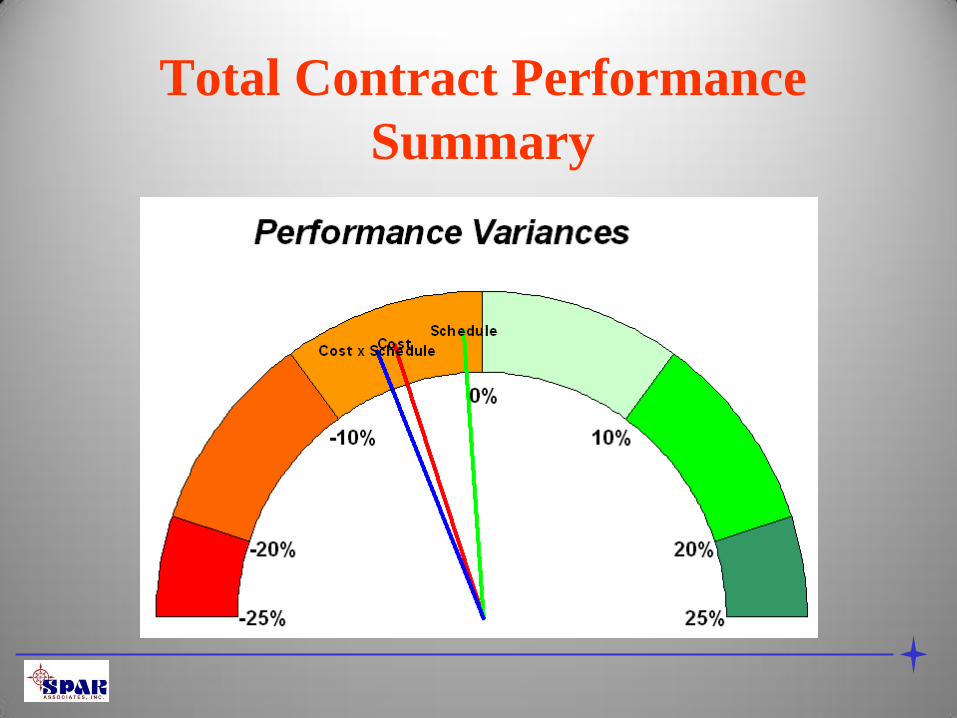
Total Contract Performance
Summary
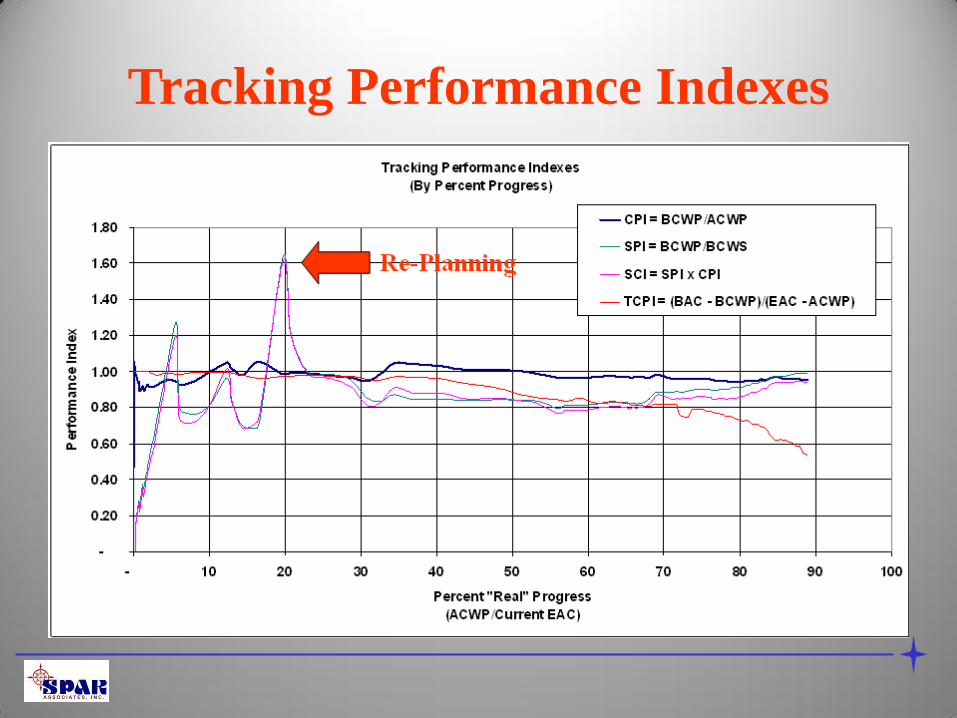
Tracking Performance Indexes
Tracking & Managing Dollar Costs
and Schedules:
Direct Labor Costs
Overheads Costs
Material & Subcontract Costs
Management Reserves
Tracking & Managing Dollar
Costs and Schedules
• Direct Labor Costs
• Overheads Costs
• Material & Subcontract Costs
• Management Reserves
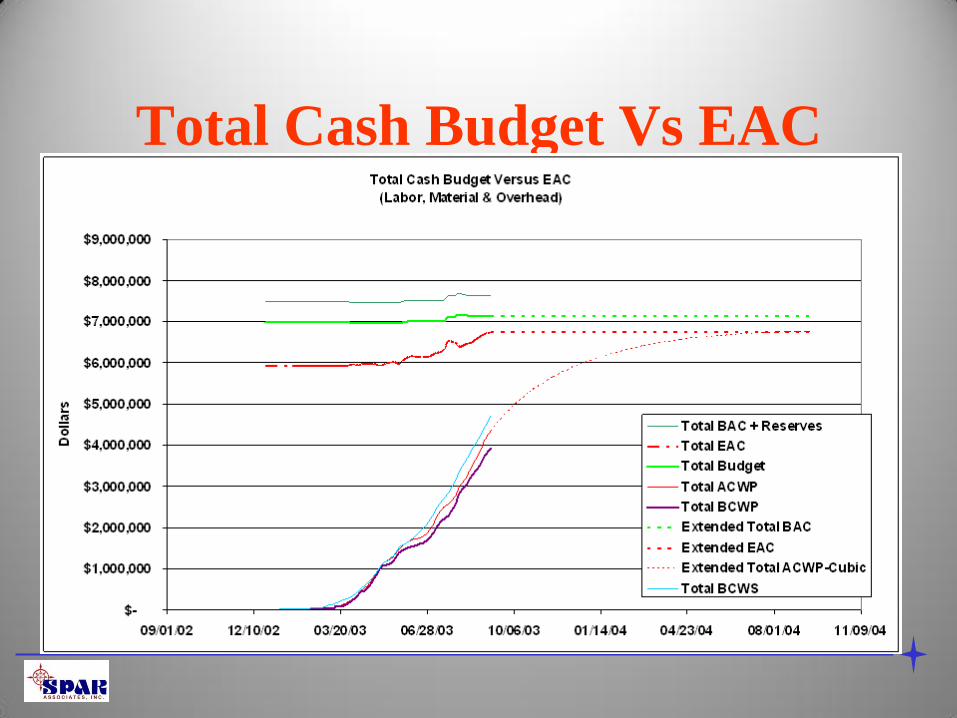
Total Cash Budget Vs EAC
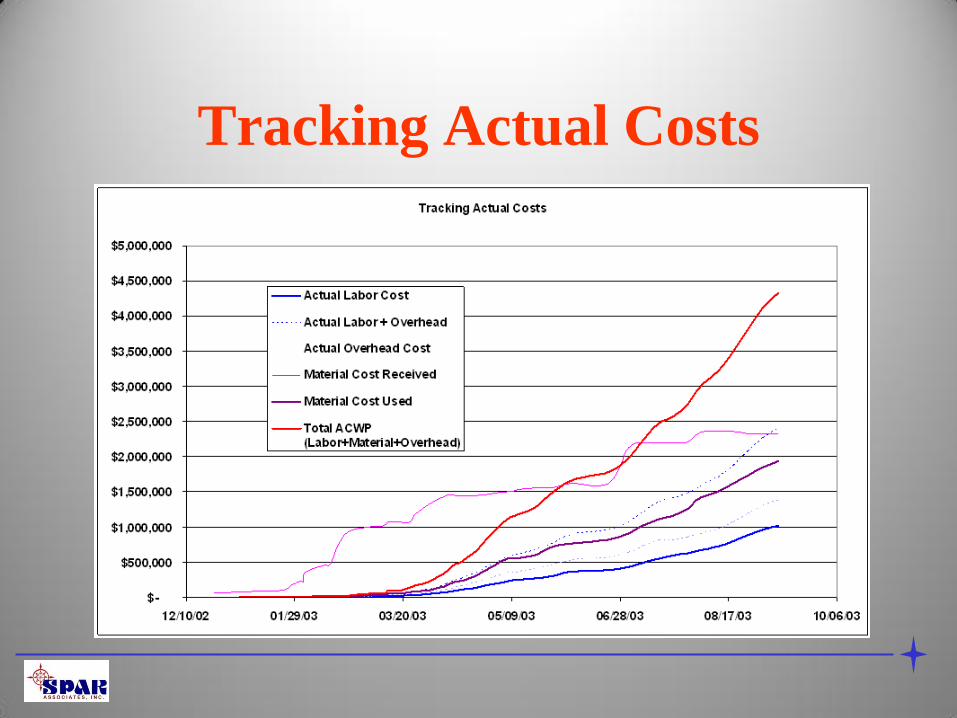
Tracking Actual Costs
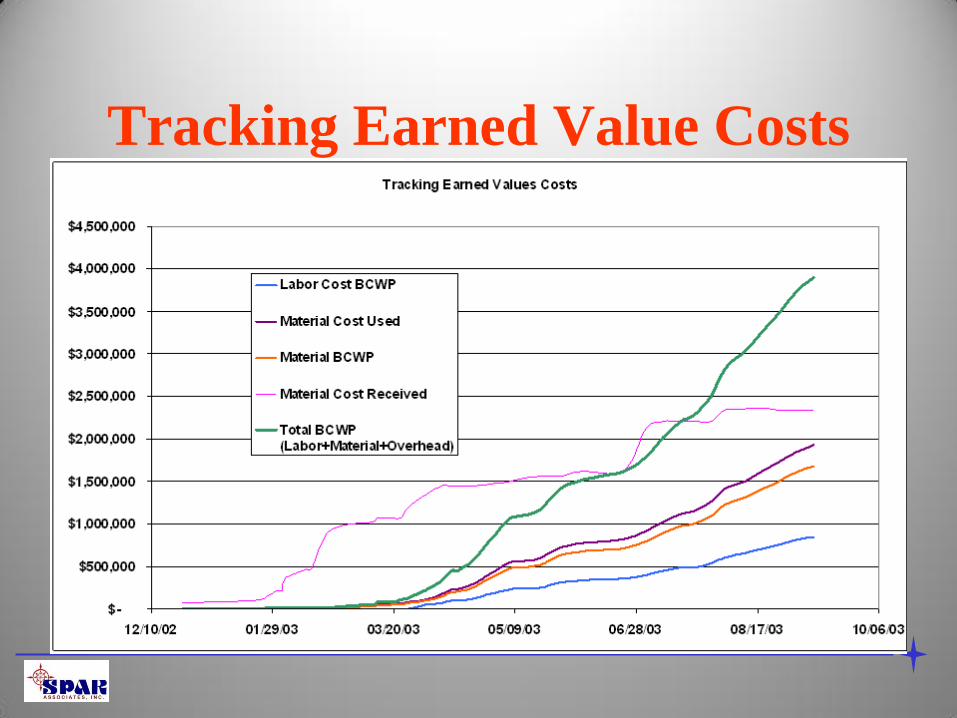
Tracking Earned Value Costs
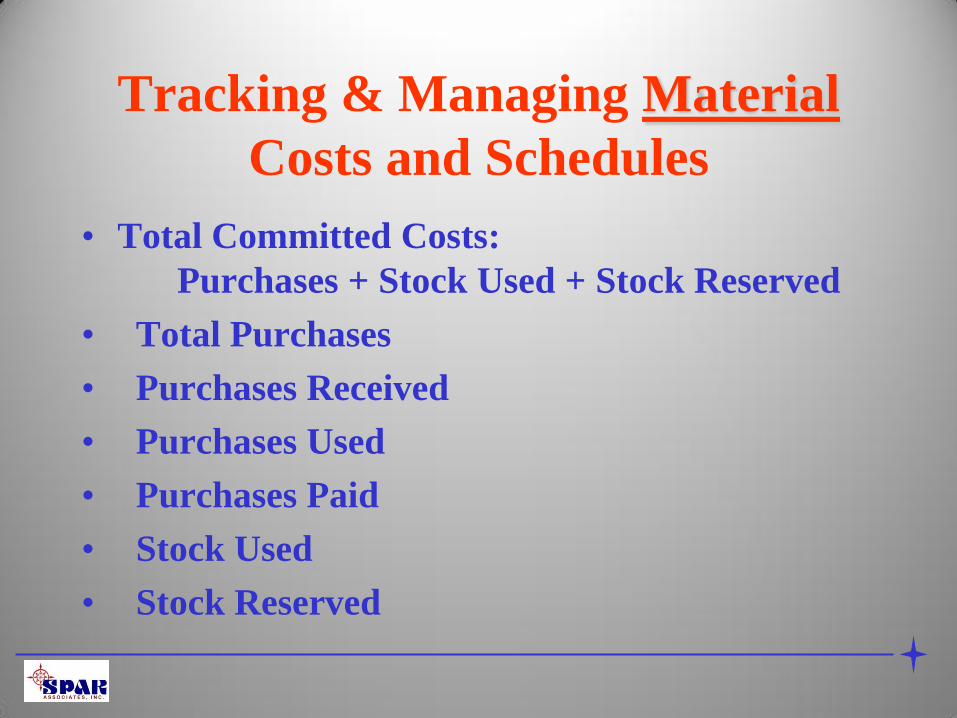
Tracking & Managing Material
Costs and Schedules
• Total Committed Costs:
Purchases + Stock Used + Stock Reserved
• Total Purchases
• Purchases Received
• Purchases Used
• Purchases Paid
• Stock Used
• Stock Reserved
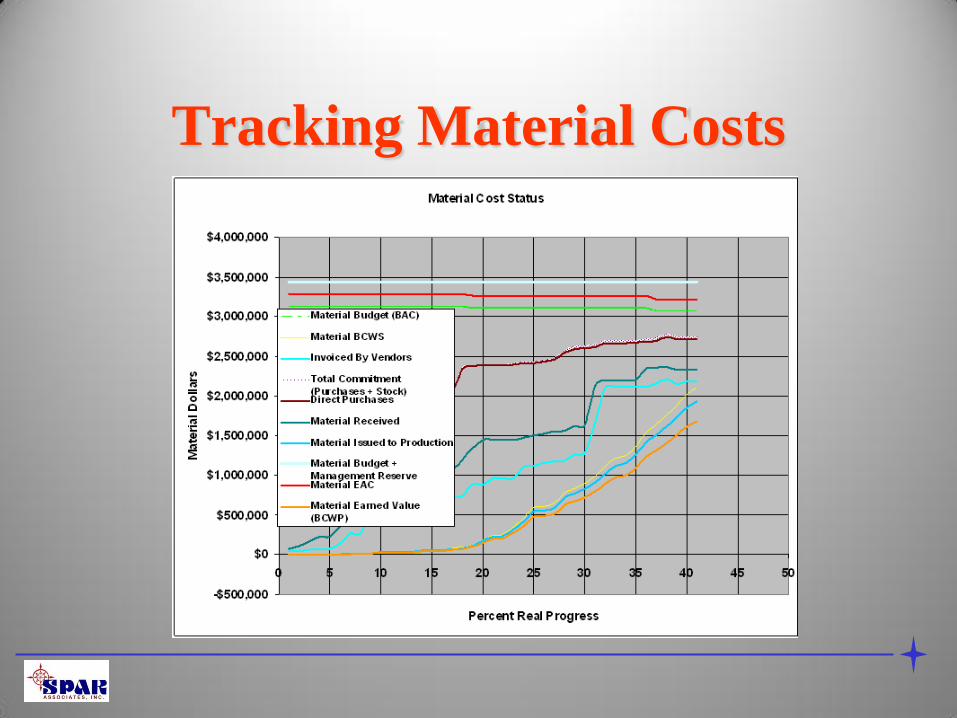
Tracking Material Costs
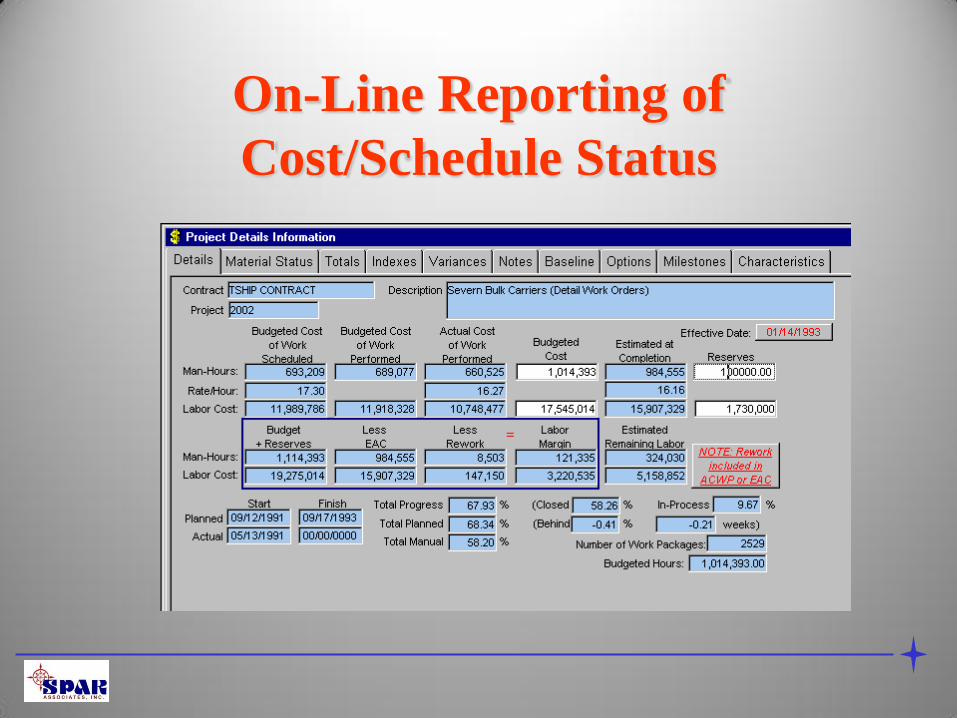
On-Line Reporting of
Cost/Schedule Status
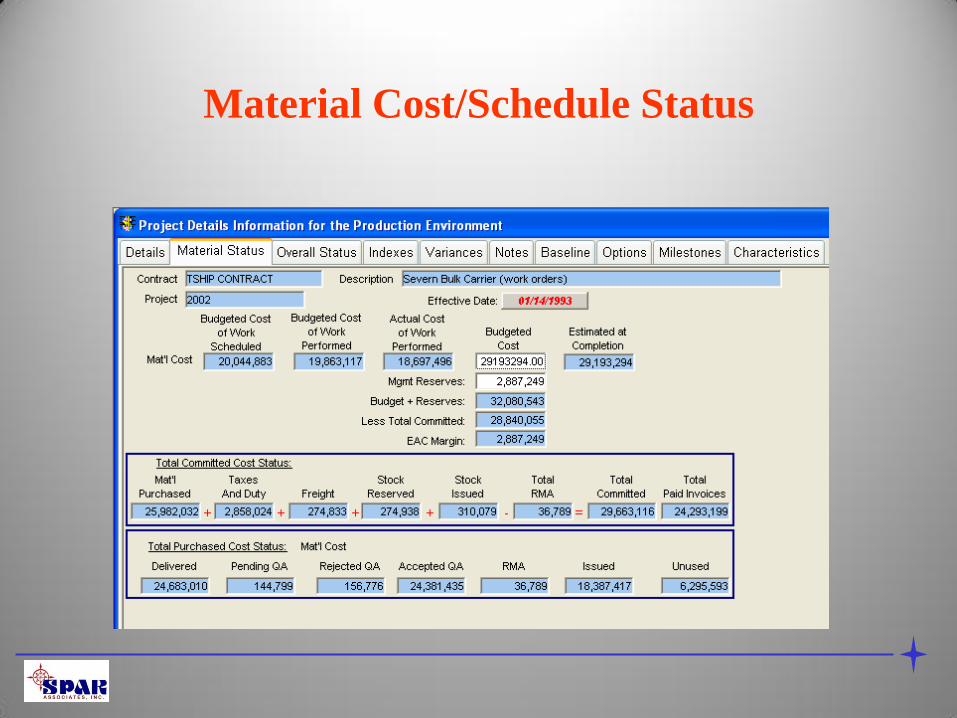
Material Cost/Schedule Status
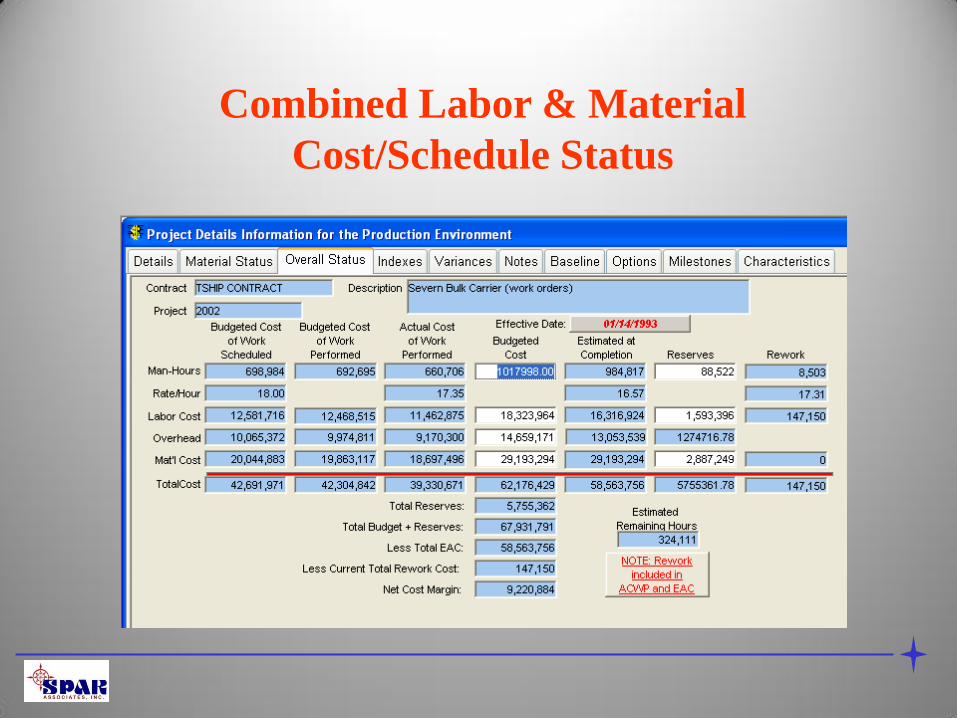
Combined Labor & Material
Cost/Schedule Status
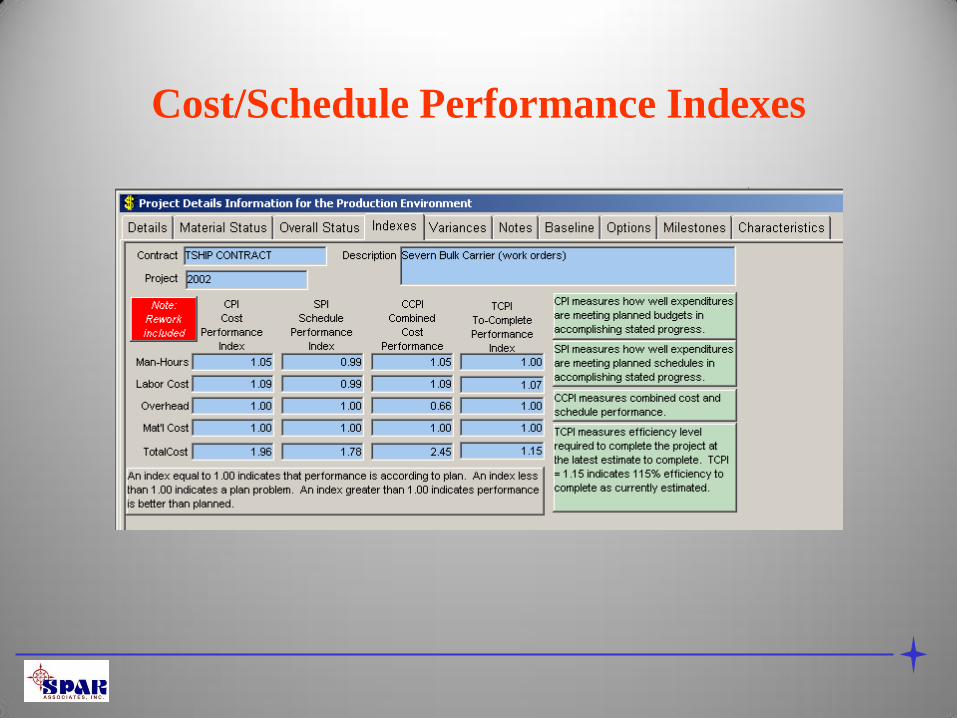
Cost/Schedule Performance Indexes
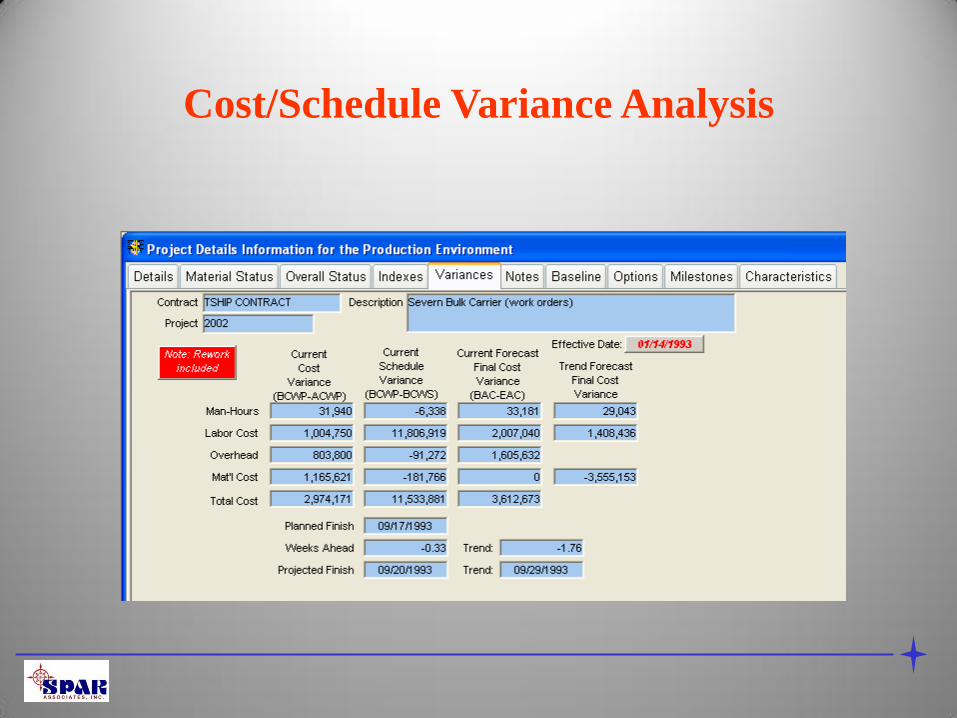
Cost/Schedule Variance Analysis
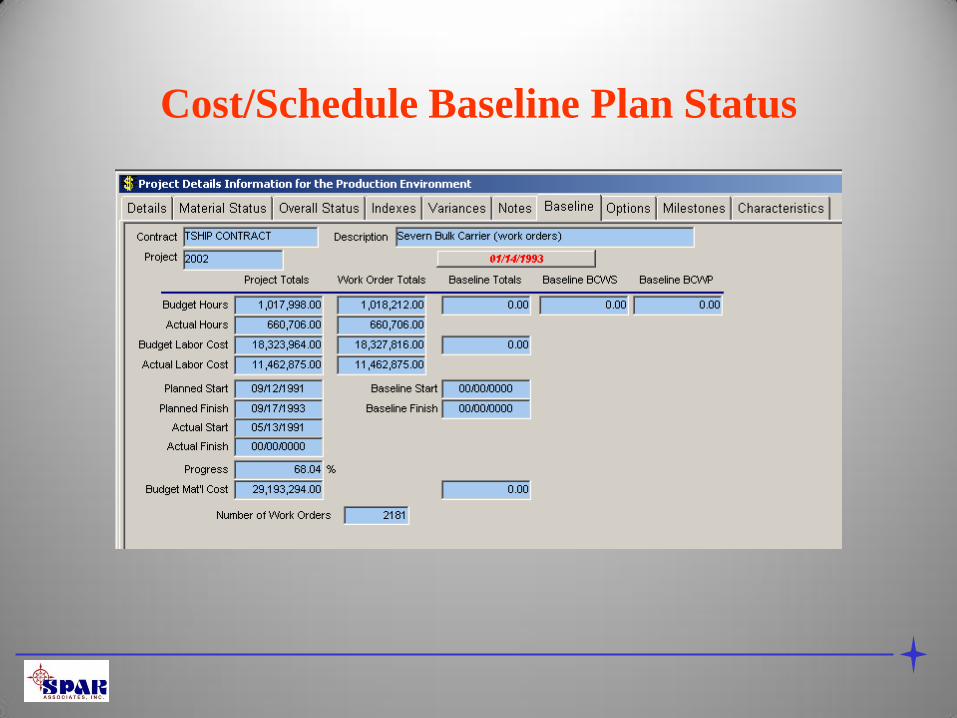
Cost/Schedule Baseline Plan Status
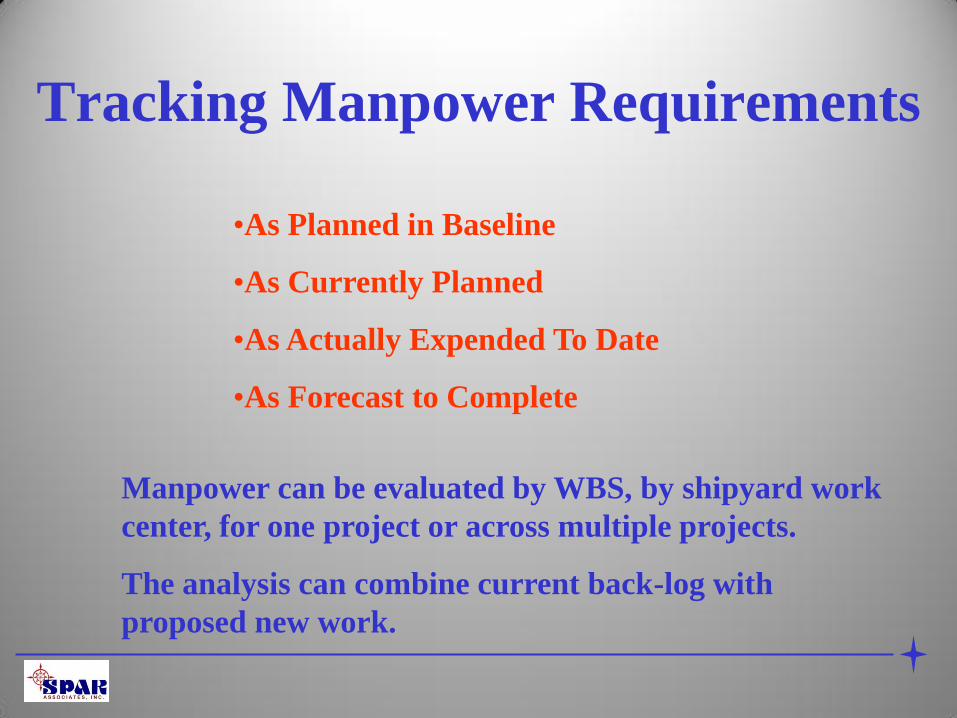
Tracking Manpower Requirements
•As Planned in Baseline
•As Currently Planned
•As Actually Expended To Date
•As Forecast to Complete
Manpower can be evaluated by WBS, by shipyard work
center, for one project or across multiple projects.
The analysis can combine current back-log with
proposed new work.
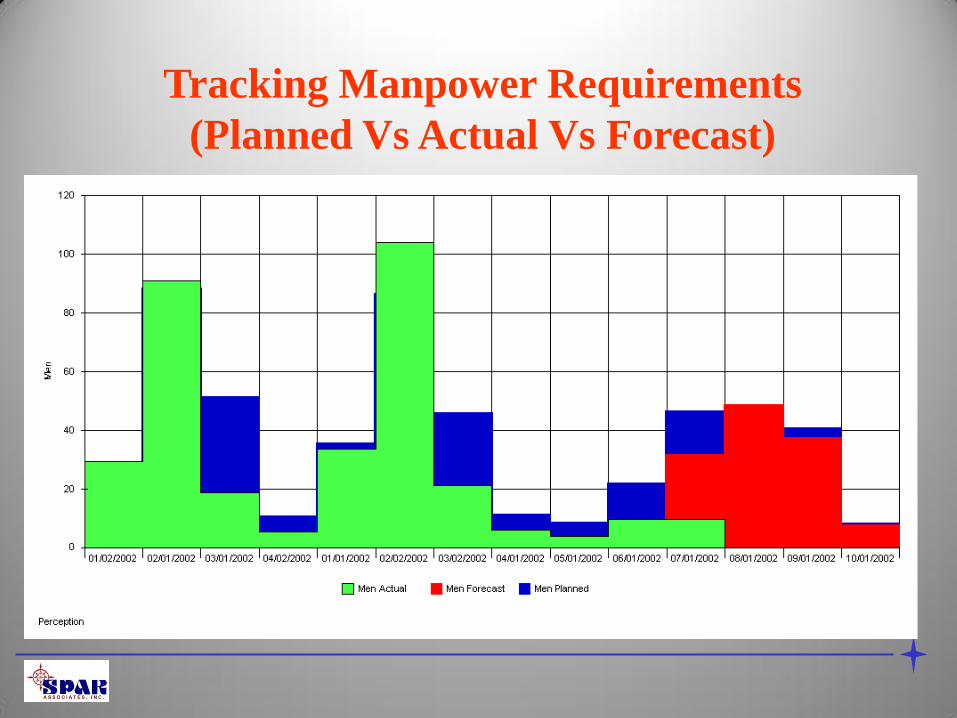
Tracking Manpower Requirements
(Planned Vs Actual Vs Forecast)
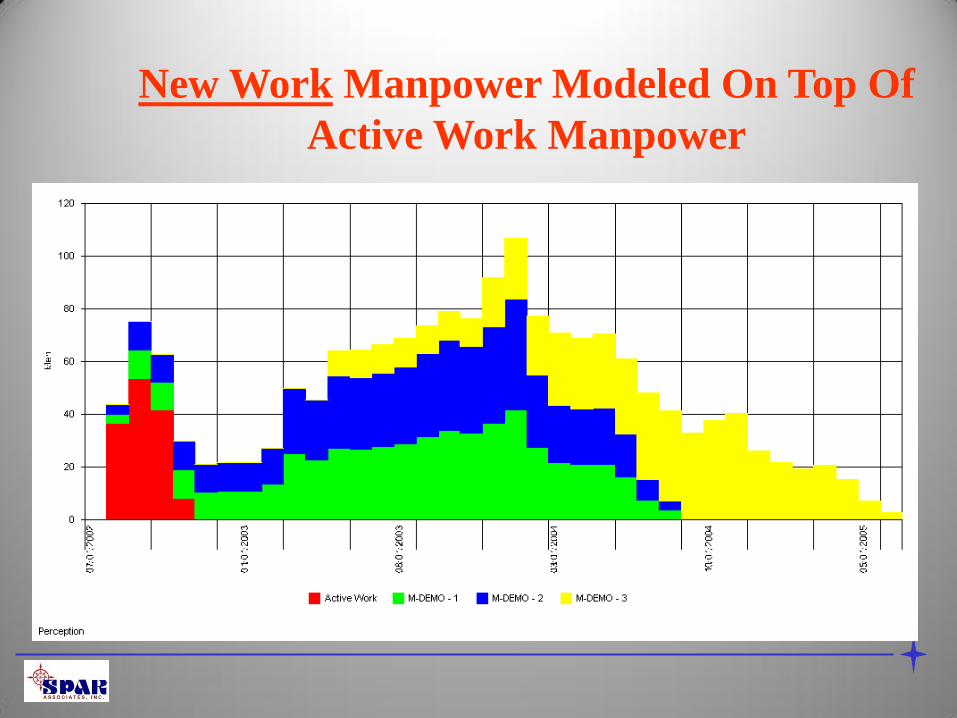
New Work Manpower Modeled On Top Of
Active Work Manpower
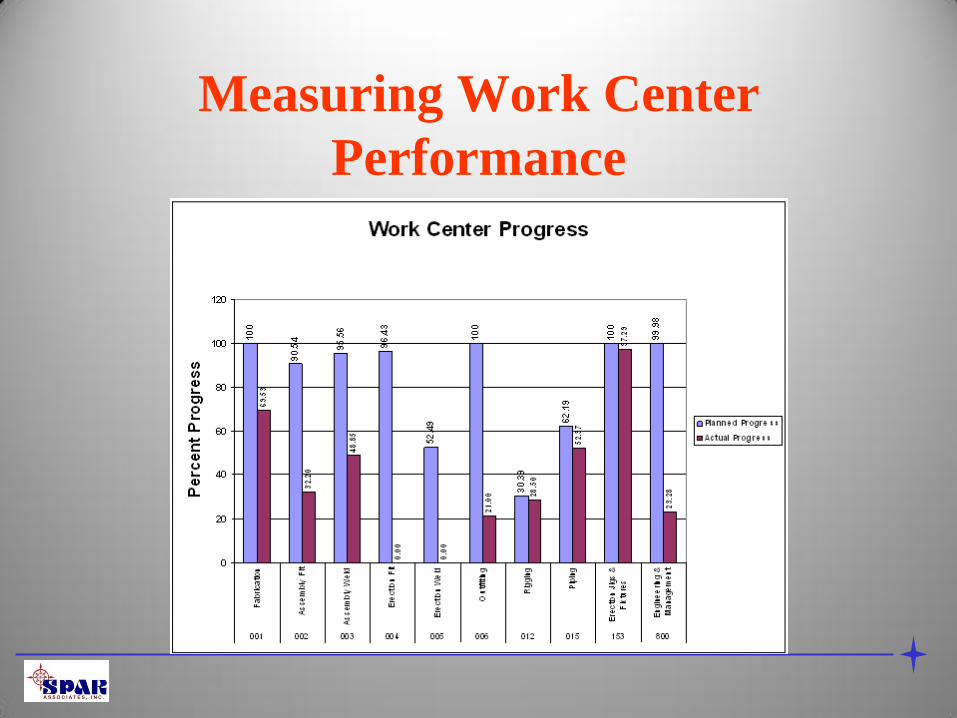
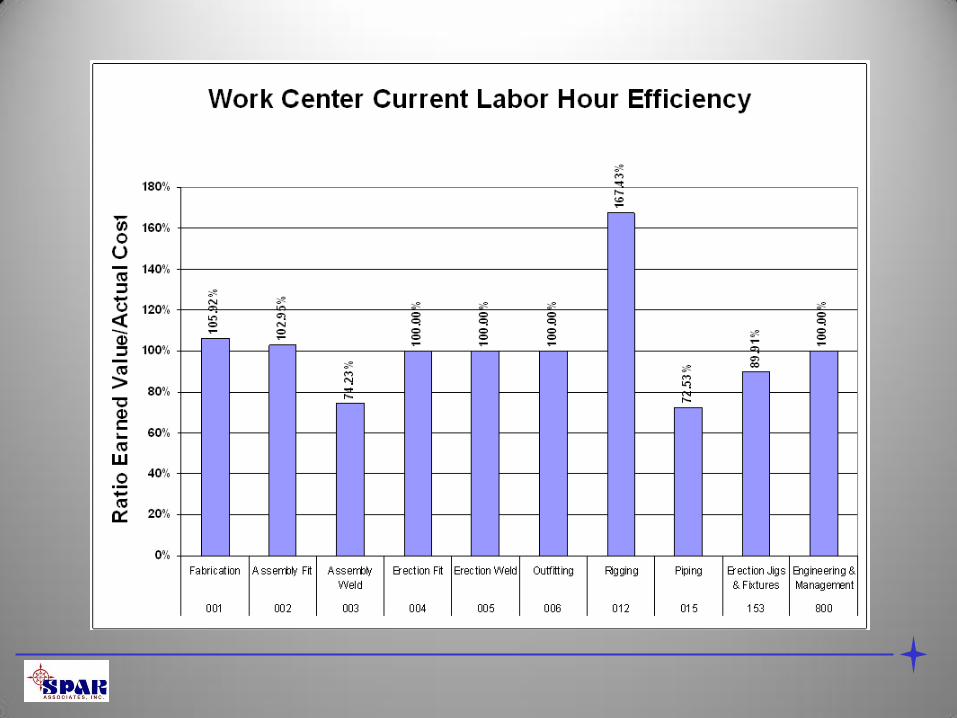
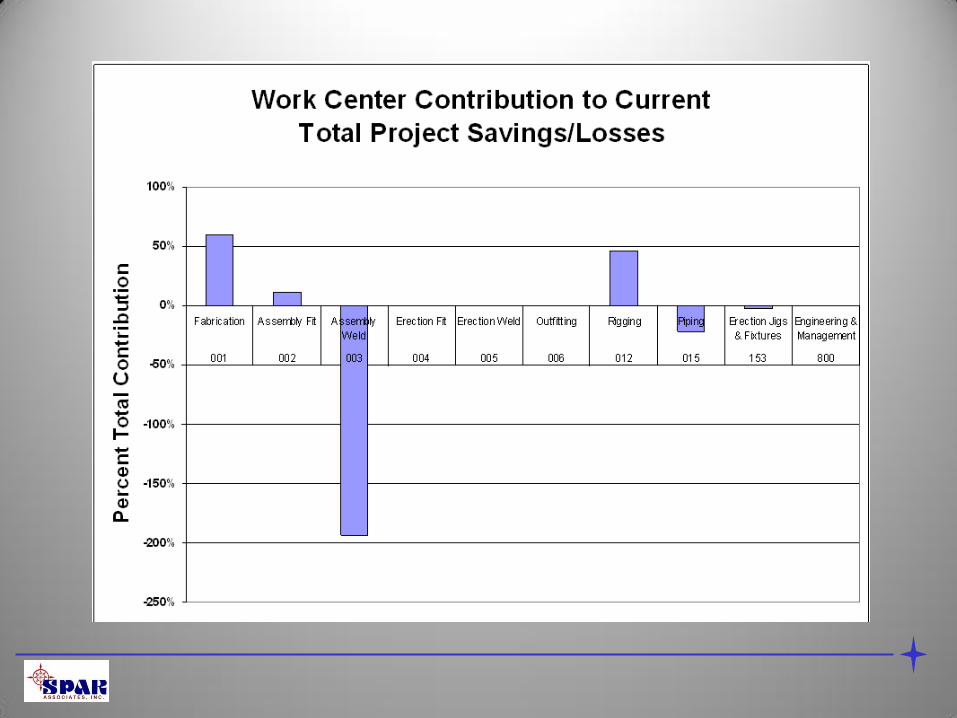
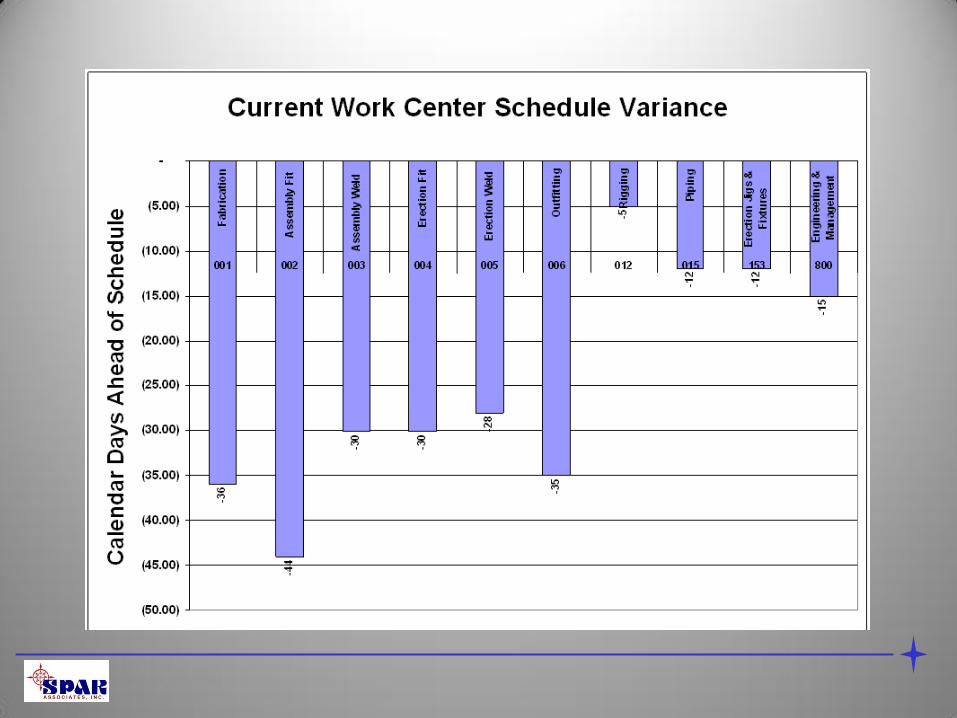
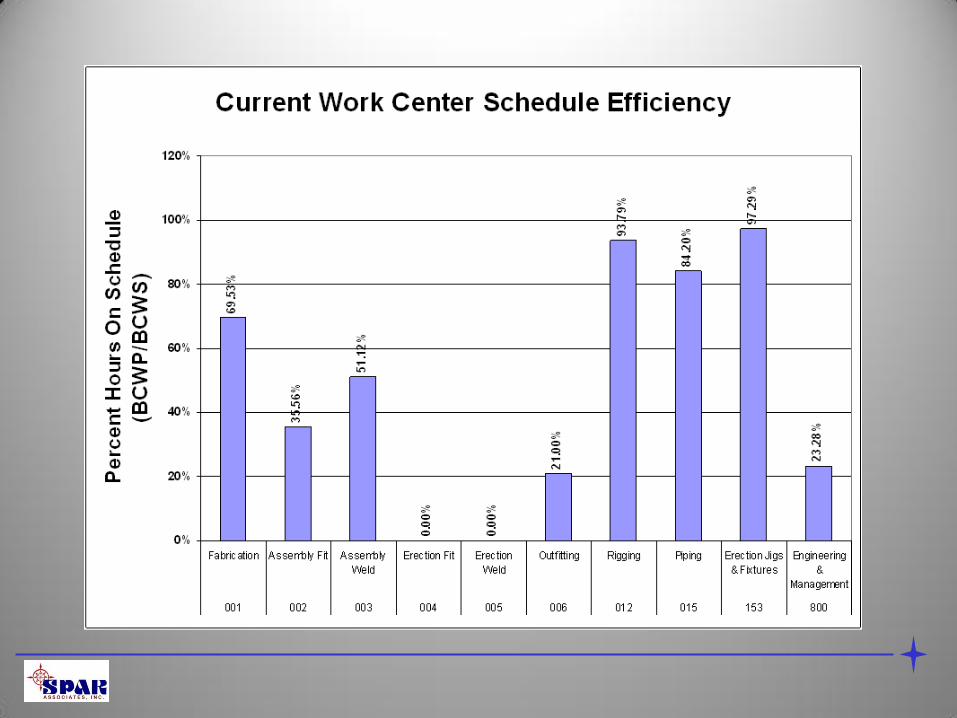
Measuring Work Center
Performance
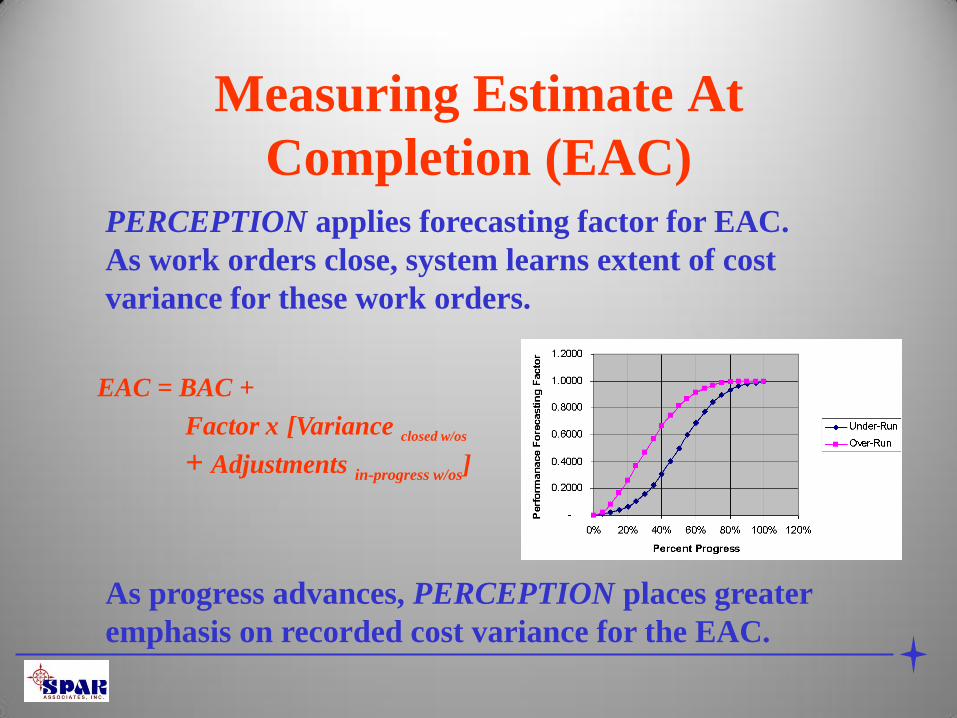
Measuring Estimate At
Completion (EAC) PERCEPTION applies forecasting factor for EAC.
As work orders close, system learns extent of cost
variance for these work orders.
EAC = BAC +
Factor x [Variance closed w/os
+ Adjustments in-progress w/os]
As progress advances, PERCEPTION places greater
emphasis on recorded cost variance for the EAC.
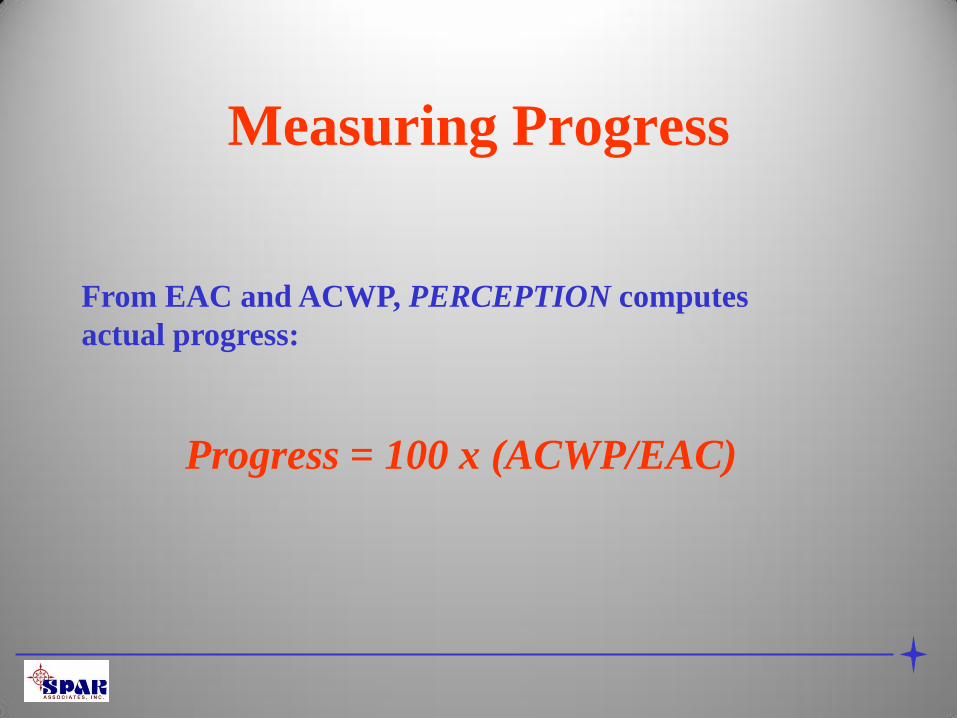
Measuring Progress
Progress = 100 x (ACWP/EAC)
From EAC and ACWP, PERCEPTION computes
actual progress:
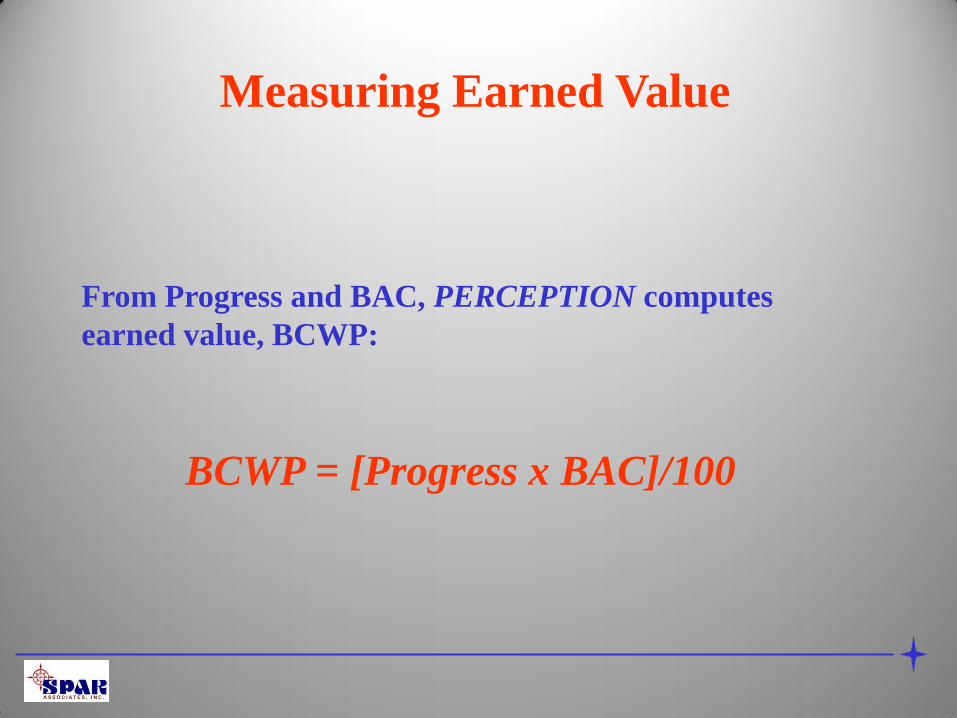
Measuring Earned Value
BCWP = [Progress x BAC]/100
From Progress and BAC, PERCEPTION computes
earned value, BCWP:
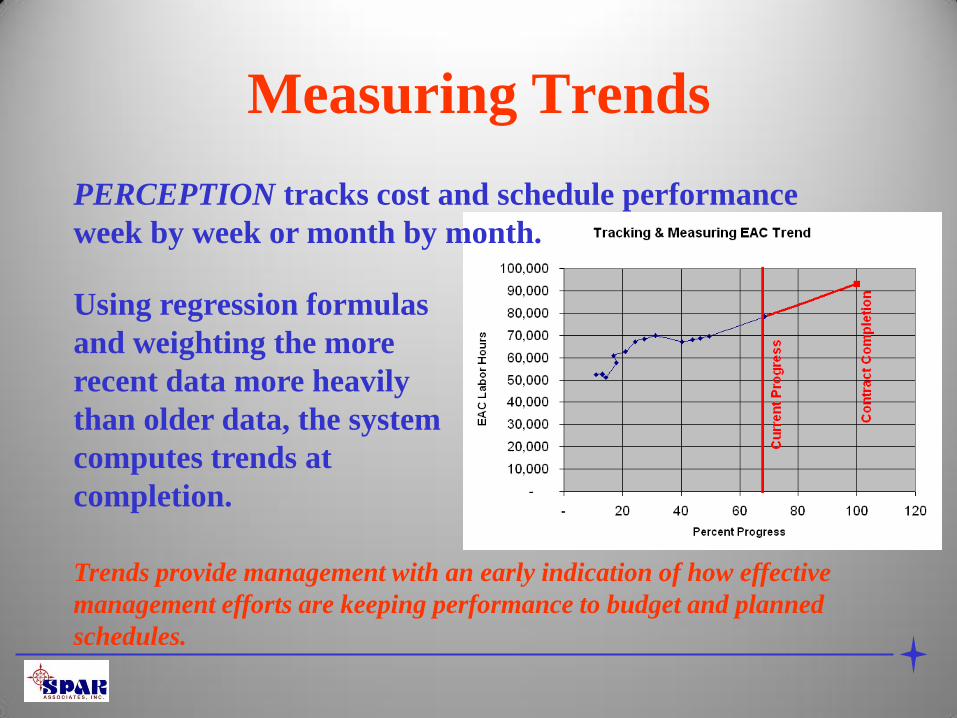
Measuring Trends
Trends provide management with an early indication of how effective
management efforts are keeping performance to budget and planned
schedules.
Using regression formulas
and weighting the more
recent data more heavily
than older data, the system
computes trends at
completion.
PERCEPTION tracks cost and schedule performance
week by week or month by month.
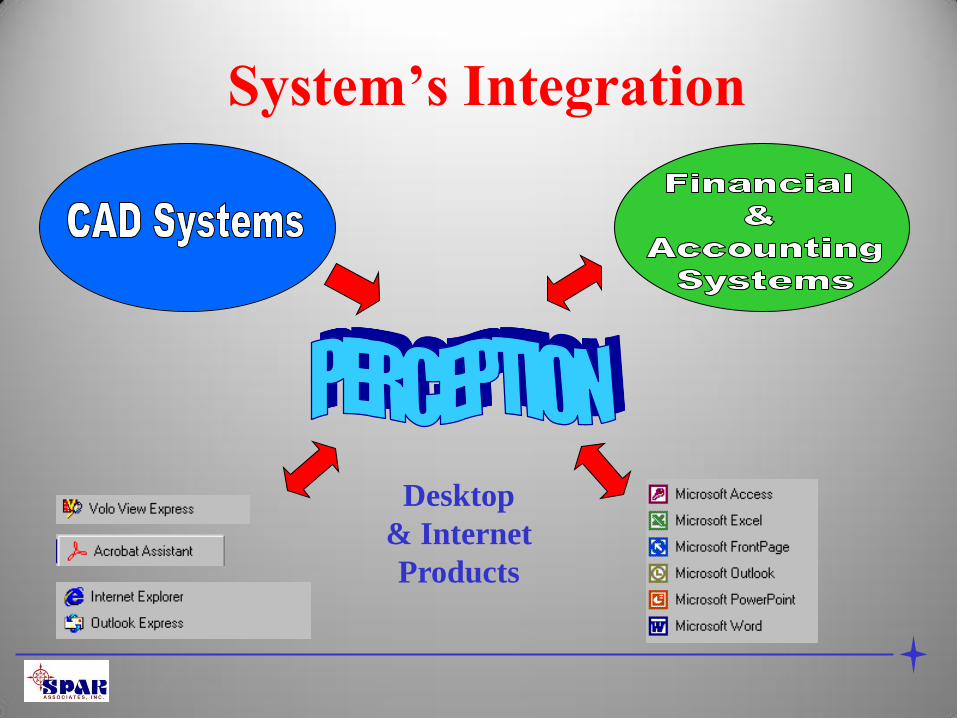
System’s Integration
Desktop
& Internet
Products
PERCEPTION has been linked to various Ship Design and
Engineering systems:
• ARL’s ShipConstructor
•The Navy’s ASSET Ship Concept Model
• Proteus Engineering’s Flagship suite
• Intergraph’s GSCAD
• Autodesk’s AutoCAD general design system
• Rebis’ AutoPLANT piping system design and engineering system
• Bentley’s MicroStation general design system
System’s Integration
CAD interfaces can be used to down-
load detailed bills of material for
• Cost Estimating
• Purchase Requisitions
• Work Order Bills of Materials
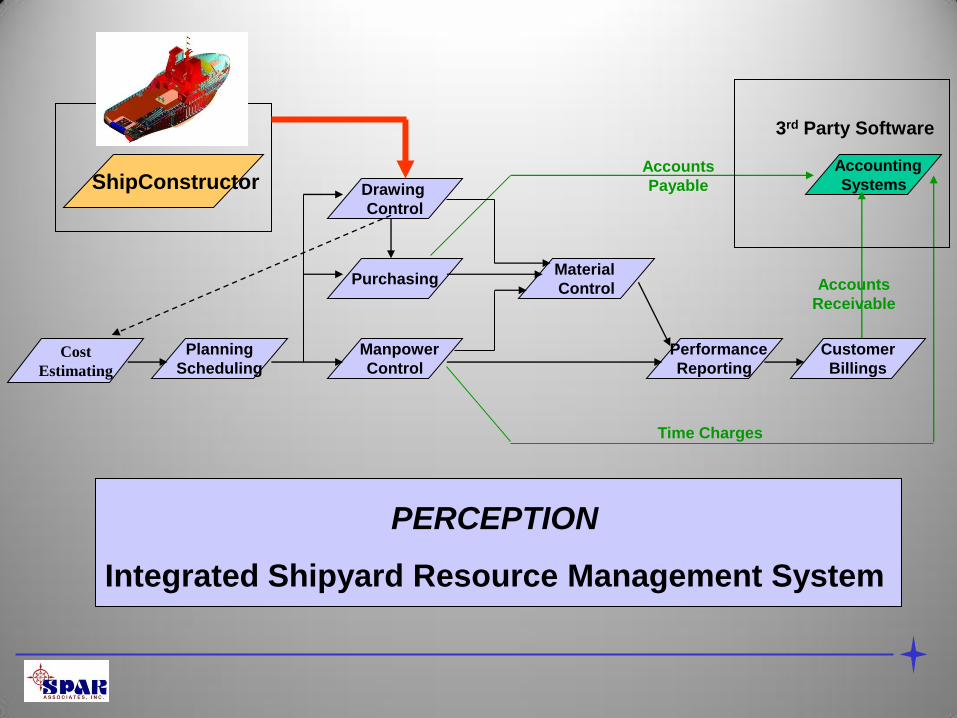
ShipConstructor
Cost
Estimating
Planning
Scheduling
Purchasing
Manpower
Control
Drawing
Control
Material
Control
Performance
Reporting
Customer
Billings
Accounting
Systems Accounts
Payable
Accounts
Receivable
Time Charges
3rd Party Software
PERCEPTION
Integrated Shipyard Resource Management System
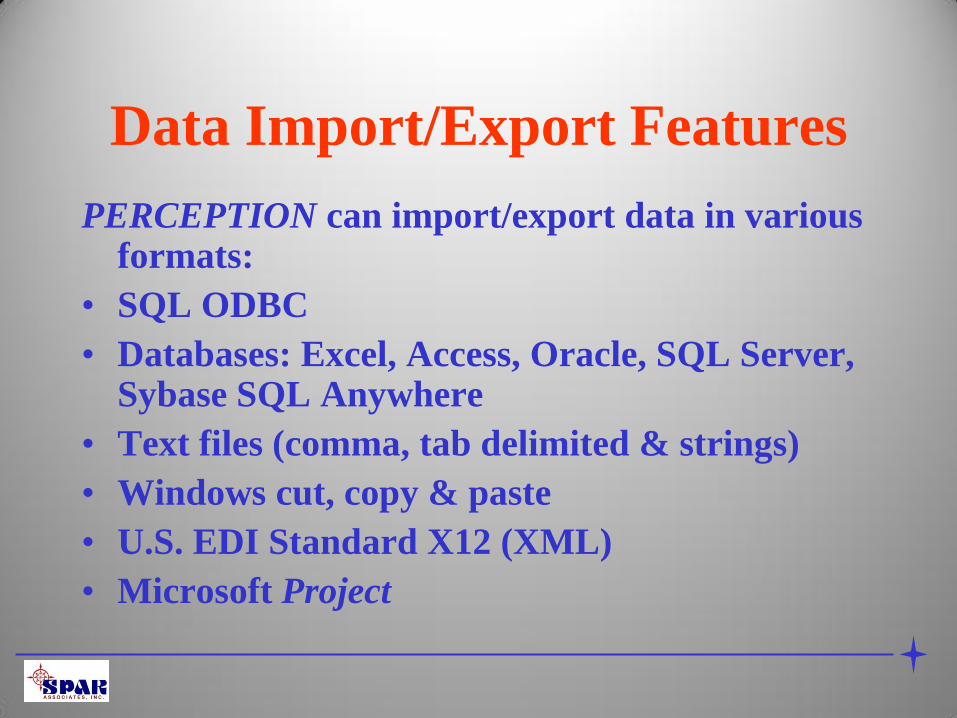
Data Import/Export Features
PERCEPTION can import/export data in various formats:
• SQL ODBC
• Databases: Excel, Access, Oracle, SQL Server, Sybase SQL Anywhere
• Text files (comma, tab delimited & strings)
• Windows cut, copy & paste
• U.S. EDI Standard X12 (XML)
• Microsoft Project
SPAR Associates, Inc.
• A Full Service Company
• Systems Development
• Systems Sales, Training & Support
• Independent Cost Estimating
• Planning & Scheduling Services
• Contract Cost/Schedule Tracking &
Performance Analysis
SPAR has provided systems and services to
the shipbuilding and ship repair industries
around the world since 1972.
Our clients are both large and small, and they
deal with commercial and/or government
work.
SPAR understands the detail nature of this
business, from the way shipyards organize
and perform their work and manage their
business.
SPAR has followed and has implemented
features in its systems to support “world
class” shipbuilding practices.
These practices enable shipyards to be
much more efficient and improve the
quality of their products and services.
Serving Government Agencies Too
• The U.S. Coast Guard
• The U.S. Navy
• The Federal Maritime Administration (MARAD)
These services include software developed by SPAR, training and system support, as well as independent cost estimating and cost realism evaluations.

Over 40 Years Serving the Shipbuilding &
Repair Industry