Dr. Pekka Manninen CSC - IT Center for Science Finland
64
Performance Engineering Dr. Pekka Manninen CSC - IT Center for Science Finland PDC Summer School 2018
Transcript of Dr. Pekka Manninen CSC - IT Center for Science Finland

Performance Engineering
Dr. Pekka ManninenCSC - IT Center for ScienceFinland
PDC Summer School 2018

Overview
9.15-9.30 Introduction to application performance
9.30-10.00 Application performance analysis
10.00-10.15 Coffee break
10.15-11.00 Node-level performance considerations
11.00-11.15 Break
11.15-12.00 Improving parallel scalability
12.00-13.00 Lunch break
13.00-17.00 Lab: Performance engineering

Introduction to application performance

Improving application performance
Obvious benefits
– Better throughput => more science
– Cheaper than new hardware
– Save energy, compute quota etc.
..and some non-obvious ones
– Potential cross-disciplinary research
– Deeper understanding of application

Performance engineering
Adapting the problem to the underlying hardware
Performance is an outcome of several intertwinedfactors
– Algorithm – code – compiler – libraries – hardware
Key considerations in improving application performance
– Effective algorithms, doing things right
– High CPU cycle utilization
– Efficient memory access
– Parallel scalability
– File I/O efficiency
Performance engineering
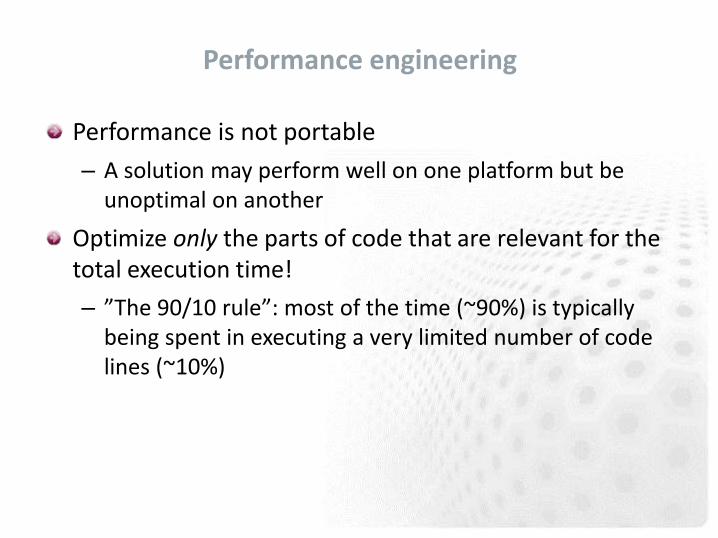
Performance is not portable
– A solution may perform well on one platform but beunoptimal on another
Optimize only the parts of code that are relevant for thetotal execution time!
– ”The 90/10 rule”: most of the time (~90%) is typicallybeing spent in executing a very limited number of codelines (~10%)

Performance analysis

Application timing
Most fundamental information: total wall clock time
– System commands (e.g. time) or batch system statistics
– Built-in timers in the program
Built-in timers (e.g. MPI_Wtime) can provide also more fine-grained information
– Have to be inserted by hand
– Typically no information about hardware related issues
– Information about load imbalance and communication statistics of parallel program is difficult to obtain

Profiling
Purpose of the profiling is to find the "hot spots" of the program
– Usually execution time, also memory
Usually the code has to be recompiled or relinked, sometimes also small code changes are needed
Often several profiling runs with different techiques is needed
– Identify the hot spots with one approach, identify the reason for poor performance

Profiling: Sampling and tracing
When application is profiled using sampling, the execution is stopped at predetermined intervals and the state of the application is examined
– Lightweight, but may give skewed results
Tracing records every event, e.g. function call
– Usually requires modification to the executable
These modifications are called instrumentation
– More accurate, but may affect program behavior
– Generates lots of data

Performance analysis tools
Instrumentation of code
– Adding special measurement code to binary
– Normally all routines do not need to be measured
Measurement: running the instrumented binary
– Profile: sum of events over time
– Trace: sequence of events over time
Analysis
– Text based analysis reports
– Visualization

Code optimization cycle
Instrument & run
Identify scalability
bottlenecks
Identify single-core issues
Optimize
Validate/debug
Measure scalability
Select test case

Step 1: Choose a test problem
The dataset used in the analysis should
– Make sense, i.e. resemble the intended use of the code
– Be large enough for getting a good view on scalability
– Complete in a reasonable time
– For instance, with simulation codes almost a full-blown model but run only for a few time steps
Remember that initialization/finalization stages are usually exaggerated and exclude them in the analysis

Step 2: Measure scalability
Run the uninstrumented code with different core counts and see where the parallel scaling stops
Often we look at strong scaling
– Also weak scaling is definitely of interest

Step 3: Instrument & run
Profile the code with
– The core count where the scalability is still ok
– The core count where the scalability has ended
and compare these side-by-side: what are the largest differences between these profiles?

Example with CrayPAT (1/2)
Load performance tools softwaremodule load perftools-basemodule load perftools
Re-build application (keep .o files)make clean && make
Instrument application for automatic profiling analysis
– You should get an instrumented program a.out+patpat_build a.out
Run the instrumented application (...+pat) to get a sampling profile
– You should get a performance file (“<sdatafile>.xf”) or multiple files in a directory <sdatadir>
.

Example with CrayPAT (2/2)
Generate text report and an .apa instrumentation filepat_report <sdatafile>.xf
– Inspect the .apa file and sampling report whether additional instrumentation is needed
Instrument application for further analysis (a.out+apa)pat_build –O <apafile>.apa
Re-run application (...+apa)
Generate text report and visualization file (.ap2)pat_report –o my_text_report.txt <data>
View report in text and/or with Cray Apprentice2app2 <datafile>.ap2

Step 4: Identify scalability bottlenecks
Signature: User routines scaling but MPI time blowing up
– Issue: Not enough to compute in a domain
Weak scaling could still continue
– Issue: Expensive collectives
– Issue: Communication increasing as a function of tasks
Signature: MPI_Sync times increasing
– Issue: Load imbalance
Tasks not having a balanced role in communication?
Tasks not having a balanced role in computation?
Synchronous (single-writer) I/O or stderr I/O?

Step 5: Find single-core hotspots
Remember to focus only on user routines that consume significant portion of the total time
Collect the key hardware utilization details, for example
– Cache & TLB metrics
– L1, L2, L3 cache metrics
Trace the math intrinsics to see if expensive operations (exp, log, sin, cos,...) have a significant role
See the compiler output – are the hotspot loops being optimized by the compiler?
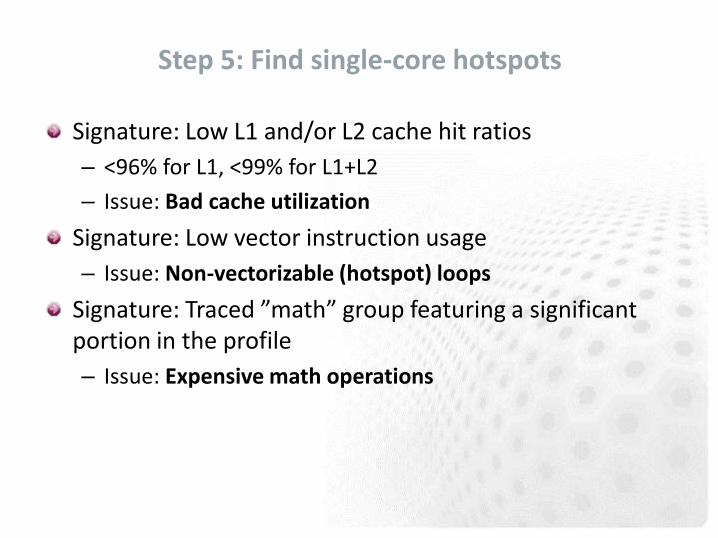
Step 5: Find single-core hotspots
Signature: Low L1 and/or L2 cache hit ratios
– <96% for L1, <99% for L1+L2
– Issue: Bad cache utilization
Signature: Low vector instruction usage
– Issue: Non-vectorizable (hotspot) loops
Signature: Traced ”math” group featuring a significant portion in the profile
– Issue: Expensive math operations

Profiling: take-home messages
1. Profile your code
– There is no other way of knowing what is important for the performance and what is not.
2. Do the profiling yourself
– Do not believe what the others tell you. They are wrong.
3. Profile the code on the hardware you are going to runit
4. Profile with a representative test case
– Working on a toy model on your laptop will not havemuch in common with running production runs on a supercomputer.
5. Reprofile the code after optimizations

Web resources
CrayPAT documentationhttp://docs.cray.com
Scalasca http://www.scalasca.org/
Paraverhttp://www.bsc.es/computer-sciences/performance-tools/paraver
Tau performance analysis utilityhttp://www.cs.uoregon.edu/Research/tau
Intel VTune Amplifierhttps://software.intel.com/en-us/intel-vtune-amplifier-xe

Node-level performance considerations

Setting the scene
Modern multicore CPUs are very complex (with evermore increasing complexity)
– Multiple CPU cores within one socket
– Superscalar out-of-order instruction execution with branch prediction
– Multilevel coherent caches
– SIMD vector units
– SMT capabilities for multithreading
Typical supercomputer node contains 2-4 sockets
To get most out of the hardware, performance engineering is needed

Memory hierarchy
Registers
L1 Cache
L2 Cache
L3 Cache
Physical memory
Remote memory (overinterconnect)
File system disks
<= 1
~4
~10
~25
O(105...6)
O(100 B)
O(100 kB)
O(1 MB)
O(10 MB)
GB’s
TB’s
100s GB’sO(103)
O(102)

SIMD instructions operate on multiple elements at onecycle
AVX/AVX2: 256 bits:
– 4 DP values or 8 SP values
– Fused multiply-add (AVX2)
AVX512: 512 bits
– 8 DP values or 16 SP values
SIMD vectorization
double * A, * B, * C;int i, N;
for (i=0; i<N; i++)C[i]=B[i]+A[i];
+
+
+
=
=
=
Scalar
AVX
AVX512

OPTIMAL PORTING

Optimal porting
”Improving application performance without touchingthe source code”
– Compilers & compiler flags
– Numerical libraries
– MPI rank placement
– Thread affinities
– Filesystem parameters
Potential to get significant performance improvementswith little effort
Should be revisited routinely
Effort
Theoretical peak
Perf
orm
ance

Choosing a compiler
Many different choices
– GNU, PGI, Intel, Cray, XL etc.
Compatibility
– Different proprietary intrinsics
– Different rounding rules
Performance
– There is no universally fastest compiler
– Depends on the application or even input

Compiler optimization techniques
Architecture-specific tuning
– Tunes all applicable parameters to the definedmicroarchitecture
Vectorization
– Exploiting the vector units of the CPU (AVX etc.)
– Improves performance in most cases
Loop transformations
– Fusing, splitting, interchanging, unrolling etc.
– Effectiveness varies
Compiler flag examples
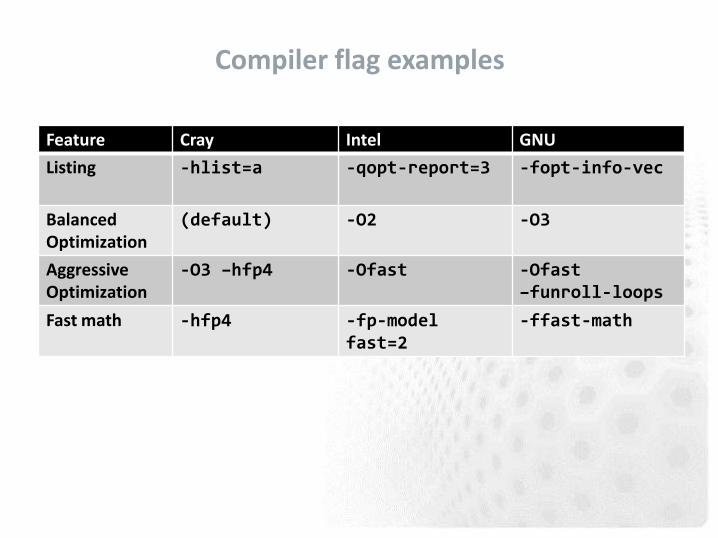
Feature Cray Intel GNU
Listing -hlist=a -qopt-report=3 -fopt-info-vec
Balanced Optimization
(default) -O2 -O3
Aggressive Optimization
-O3 –hfp4 -Ofast -Ofast–funroll-loops
Fast math -hfp4 -fp-model fast=2
-ffast-math

Doesn't the compiler do everything?
You can make a big difference to code performance
– Helping the compiler spot optimisation opportunities
– Using the insight of your application
– Removing obscure (and obsolescent) “optimizations” in older code
Simple code is the best, until otherwise proven
This is a dark art, mostly: optimize on case-by-case basis
– First, check what the compiler is already doing
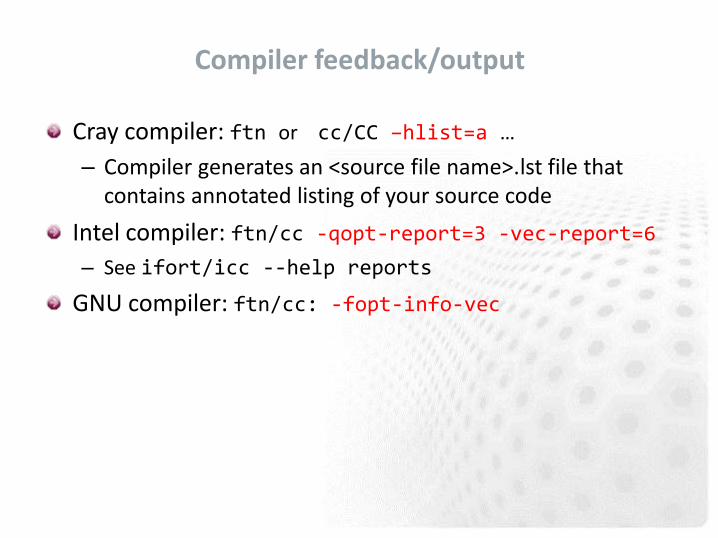
Compiler feedback/output
Cray compiler: ftn or cc/CC –hlist=a …
– Compiler generates an <source file name>.lst file that contains annotated listing of your source code
Intel compiler: ftn/cc -qopt-report=3 -vec-report=6
– See ifort/icc --help reports
GNU compiler: ftn/cc: -fopt-info-vec

ISSUE: BAD CACHE UTILIZATION

General considerations
Always try to use all data in cache line (64 bytes)
– Memory is always read in terms of cache lines
Use regular access patterns
– Helps hardware prefetchers
Try to re-use data, so that data loaded into caches areused multiple times
– Blocking of operations on high dimensional data
– Sorting of data before operations
Does structure-of-arrays (SoA) or array-of-structures (AoS) fit your work best?

Loop interchange
If multi-dimensional arrays are addressed in a wrong (non-consecutive) order, it causes a lot of cache misses => horrible performance
– C is row-major, Fortran column-major
– The compiler may (but also may not) re-order loops automatically (see compiler diagnostics)
do i=1,N do j=1,M
sum = sum + a(i,j)end do
end do
do j=1,M do i=1,N
sum = sum + a(i,j)end do
end do

Loop blocking
Loop blocking = Large loops are partitioned by hand such that the data in inner loops stays in caches
– A prime example is matrix-matrix multiply coding
Complicated optimization: optimal block size is a machine dependent factor as there is a strong connection to L1 and L2 cache sizes
Some compilers do loop blocking automatically
– See the compiler output
– You can assist & control with compiler pragmas/directives

Loop fission/fusion
Loop fission and fusion are optimization techniques to improve cache efficiency by improving the locality of reference to the variables within a loop
– Loop fission: a large loop is divided into multiple loops
– Loop fusion: multiple small loops are combined into a large loop
When provided with sufficient information about theloop trip counts, the compiler automatically tries to perform loop fission/fusion based on performanceheuristics

ISSUE: LOOPS NOT VECTORIZED

General considerations
The compiler will only vectorize loops
Constant (unit) strides are best
Indirect addressing will not vectorize (efficiently)
Can vectorize across inlined functions but not if a procedure call is not inlined
Needs to know loop tripcount (but only at runtime)
– i.e. while style loops will not vectorize
No recursion allowed

Helping the compiler
Does the non-vectorized loop have true dependencies?
– No: add the pragma/directive ivdep on top of the loop
– Or the OpenMP SIMD pragma (#pragma omp simd)
– C/C++: the __restrict__ keyword for fixing aliasing
– Yes: Accept the situation or rewrite the loop
Convert loop scalars to vectors
Move if statements out of the loop
If you cannot vectorize the entire loop, consider splitting it - so as much of the loop is vectorized as possible
Align data
– Most efficient code achieved when arrays are aligned i.e. their starting address are multiples of SIMD width

Example
See compiler feedback on why some loops were not vectorized
127. + 1------< for (i = 1; i < nx + 1; i++)128. + 1 r2---< for (j = 1; j < ny + 1; j++) {129. + 1 r2 new[i][j] = old[i][j] + a * dt *130. 1 r2 ((old[i+1][j] - 2.0 * old[i][j] + old[i-1][j]) / dx2 +131. 1 r2 (old[i][j+1] - 2.0 * old[i][j] + old[i][j-1]) / dy2);132. 1 r2-->> }
CC-6290 CC: VECTOR File = ex7_heat.c, Line = 127
A loop was not vectorized because a recurrence
was
found between "old" and "new" at line 129.
CC-6308 CC: VECTOR File = ex7_heat.c, Line = 128
A loop was not vectorized because the loop
initialization would be too costly.
CC-6005 CC: SCALAR File = ex7_heat.c, Line = 128
A loop was unrolled 2 times.
Runtime: 8.55 s

Example
127. + 1-------< for (i = 1; i < nx + 1; i++)128. 1 #pragma ivdep129. 1 Vr2---< for (j = 1; j < ny + 1; j++) {130. + 1 Vr2 new[i][j] = old[i][j] + a * dt *131. 1 Vr2 ((old[i+1][j] - 2.0 * old[i][j] + old[i-1][j]) / dx2 +132. 1 Vr2 (old[i][j+1] - 2.0 * old[i][j] + old[i][j-1]) / dy2);133. 1 Vr2-->> }
CC-6294 CC: VECTOR File = ex7_heat.c, Line = 127
A loop was not vectorized because a better candidate was
found at line 129.
CC-6005 CC: SCALAR File = ex7_heat.c, Line = 129
A loop was unrolled 2 times.
CC-6204 CC: VECTOR File = ex7_heat.c, Line = 129
A loop was vectorized.
Tell the compiler that old and new do not overlap
Runtime: 6.55 s

ISSUE: EXPENSIVE MATH OPERATIONS

General consideration
The cost of different scalar floating-point operations is roughly as follows:
<= 1 cycle: +, *
~20 cycles: /, sqrt, 1/sqrt
~100-300 cycles: sin, cos, exp, log, ...
Note that there is also instruction latency and issues related to the pipelining

Strength reduction techniques
Loop hoisting: try to get the expensive operations out of innermost loops– Precomputing values, look-up tables etc
Consider replacing division (a/b) with multiplication by reciprocal (a*(1/b))
Reduce the use of sin, cos, exp, log, pow by usingidentities, such as
– pow(x,2.5) = x*x*sqrt(x)
– sin(x)*cos(x) = 0.5*sin(2*x)
Use vectorized versions of the operations (through library calls)

Summary
Do the performance analysis!
– Then you know what to look for
Utilize the compiler diagnostics
– Check especially whether the hot-spot loops have been vectorized or not
– Then you know the reason why some optimizations havenot been applied, and you can assist the compiler to overcome those restrictions
Utilize the CPU efficiently, especially caches and SIMD vector units
Mind the way you implement your equations, the cost of arithmetic operations vary greatly

Improving parallel scalability

IMPROVING LOAD BALANCE
Issue: Load imbalances
Identify the cause
– Decomposition, communication design, additional duties(i.e. I/O)?
Unfortunately algorithmic, decomposition and data structure revisions are needed to fix load balance issues
– Dynamic load balancing schemas
– MPMD style programming
– There may be still something we can try without code re-design

Hybrid programming
Shared memory programming (OpenMP) inside a node, message passing between nodes
Reduces the number of MPI tasks - less pressure for loadbalance
May be doable with very little effort
– However, in many cases large portions of the code has to be hybridized to outperform flat MPI
In order to reach very big core counts, one needs to be ready to start tackling this
Needs experimentation with the best threads-per-task-ratio, care with thread affinities, etc

Rank placement
Remote access (over the interconnect) is far fromhomogeneous
– Three-level network on Cray XC, islands on Infiniband etc
Rank placement does matter: place the ranks thatcommunicate the most onto the same node
Changing rank placement happens via environment variables
– So easy to experiment with that it should be tested with every application
– For example: CrayPAT is able to make suggestions for optimal rank placement

REDUCING PARALLEL OVERHEAD

Time-consuming point-to-point communication
Use non-blocking operations and try to overlapcommunication with other work
– Post MPI_Irecv calls before the MPI_Isend calls to avoid unnecessary buffer copies and buffer overflows
Bandwidth and latency depend on the used protocol
– Eager or rendezvous
Latency and bandwidth higher in rendezvous
– Rendezvous messages usually do not allow for overlap of computation and communication, even when using non-blocking communication routines
– The platform will select the protocol basing on the message size, these limits can be adjusted
E.g. on Cray XC MPICH_GNI_MAX_EAGER_MSG_SIZE

Issue: Expensive collectives
Reducing MPI tasks by hybridizing with OpenMP is likelyto help here as well
See if you can live with the basic version of a routine instead of a vector version (MPI_Alltoallv etc)
– May be faster even if some tasks would be receivingunrefenced data
In case of very sparse Alltoallv’s, point-to-point or one-sided communication may outperform the collectiveoperation

Issue: Expensive collectives
Use non-blocking collectives (MPI_Ialltoall,...)
– Allow for overlapping collectives with other operations, e.g. computation, I/O or other communication
– May be fasterthan the blocking corresponds even without the overlap
– Replacement is trivial
See the documentation of your MPI library for tunableparameters, and test the impact of them
– E.g. on Cray XC: increase the value of MPICH_ALLTOALL_SHORT_MSG

ADDRESSING I/O BOTTLENECKS

General considerations
Parallelize your I/O !
– MPI I/O, I/O libraries (HDF5, NetCDF), hand-written schemas,...
– Without parallelization, I/O will be a scalability bottleneck in every application
Try to hide I/O (asynchronous I/O)
Compute I/O Compute I/O Compute I/O Compute I/O
Compute
I/O
Compute
I/O
Compute
I/O
Compute
I/O

Lustre file striping
Striping pattern of a file/directory can queried or set with the lfs command
lfs getstripe <dir|file>
lfs setstripe –c count dir
– Set the default stripe count for directory dir to count
– All the new files within the directory will have the specified striping
– Also stripe size can be specified, see man lfs for details
Proper striping can enhance I/O performance a lot

Filesystem parameters
Writing a single file on a Cray XC40 (4 PB DDN Lustre, 141 OSTs)

Summary
Find the optimal decomposition & rank placement
– Load balance is established at algorithmic and data structure level
Use non-blocking communication operations for p2p and collective communication both
Hybridize (mix MPI+OpenMP) the code to improve loadbalance and alleviate bottleneck collectives
All large-scale file I/O needs to be parallelized
– I/O performance is sensitive to the platform setup
– Dedicated I/O ranks needed even for simple I/O

Wrap-up

Four easy steps towards better applicationperformance
Find best-performing compilers and compiler flags
Employ tuned libraries wherever possible
Find suitable settings for environment parameters
Mind the I/O
– Do not checkpoint too often
– Do not ask for the output you do not need

Performance engineering: take-home messages
Mind the application performance: it is for the benefit of you, other users and the service provider
Profile the code and identify the performance issues first, before optimizing anything
– “Premature code optimization is the root of all evil”
Quite often algorithmic or intrusive design changes are needed to improve parallel scalability
– To utilize cutting-edge supercomputers, one must beready to start tackling these
Serial optimization is mostly about helping the compiler to optimize for the target CPU
– Good cache utilization crucial for performance, together with vectorization