Donelson Paper
71
Audit Committee Financial Expertise and Earnings Management: The Role of Status Patrick Badolato The University of Texas at Austin [email protected] Dain C. Donelson The University of Texas at Austin [email protected] Matthew Ege University of Florida [email protected] September 2013 Abstract: Regulatory pressure to increase audit committee financial expertise has resulted in lower status for audit committees relative to management. This status differential is important because expertise and relative status are important determinants of each party’s ability to influence outcomes, particularly when parties are faced with conflicting goals. We find that audit committees with both financial expertise and high relative status are more effective at deterring earnings management, as measured by both accounting irregularities and abnormal accruals. Thus, regulatory pressure to increase financial expertise may have decreased the ability of some audit committees to deter earnings management. Keywords: audit committees; earnings management; status; financial expertise We appreciate comments and suggestions from Wayne Guay (editor), an anonymous referee, Shuping Chen, Lisa De Simone, Ross Jennings, Bill Kinney, Bill Mayew, John Robinson, Jaime Schmidt, Bridget Stomberg, Laura Wang and workshop participants at the University of Texas at Austin. We appreciate the helpful research assistance of Patrick Kielty. Patrick Badolato and Dain Donelson acknowledge support from the Red McCombs School of Business. Matthew Ege acknowledges support from the Fisher School of Accounting and the Accounting Doctoral Scholars Program.
-
Upload
wasik-abdullah-momit -
Category
Documents
-
view
225 -
download
1
description
Paper
Transcript of Donelson Paper
Audit Committee Financial Expertise and Earnings Management: The Role of Status
Patrick Badolato
The University of Texas at Austin
Dain C. Donelson
The University of Texas at Austin
Matthew Ege
University of Florida
September 2013
Abstract:
Regulatory pressure to increase audit committee financial expertise has resulted in lower status
for audit committees relative to management. This status differential is important because
expertise and relative status are important determinants of each party’s ability to influence
outcomes, particularly when parties are faced with conflicting goals. We find that audit
committees with both financial expertise and high relative status are more effective at deterring
earnings management, as measured by both accounting irregularities and abnormal accruals.
Thus, regulatory pressure to increase financial expertise may have decreased the ability of some
audit committees to deter earnings management.
Keywords: audit committees; earnings management; status; financial expertise
We appreciate comments and suggestions from Wayne Guay (editor), an anonymous referee,
Shuping Chen, Lisa De Simone, Ross Jennings, Bill Kinney, Bill Mayew, John Robinson, Jaime
Schmidt, Bridget Stomberg, Laura Wang and workshop participants at the University of Texas at
Austin. We appreciate the helpful research assistance of Patrick Kielty. Patrick Badolato and
Dain Donelson acknowledge support from the Red McCombs School of Business. Matthew Ege
acknowledges support from the Fisher School of Accounting and the Accounting Doctoral
Scholars Program.

1
1. Introduction
This study examines the joint effects of audit committee financial expertise and status on
earnings management. Specifically, we test whether audit committee status, relative to
management status, interacts with financial expertise to constrain accounting irregularities and
abnormal accruals. We expect that higher status audit committees will be more effective than
those with financial expertise alone. Thus, managers will be constrained only when the audit
committee has both expertise and the authority inherent in high status.
Status is an aspect of personal power, reflecting the ability to influence outcomes based on
perceived skills, qualities and personal attributes (Adler and Kwon, 2002; D’Aveni, 1990;
Fischer and Pollock, 2004; Pollock et al., 2011). Thus, high status individuals are perceived to
have high ability, command more authority and have greater influence on outcomes than lower-
status individuals. We focus on aspects of status that are particularly relevant in a corporate
setting, including education and public and private board membership (D’Aveni, 1990; Erkens
and Bonner, 2013; Finkelstein, 1992; Pollock et al., 2011).
Recent regulatory actions have explicitly targeted audit committee financial expertise with
the goal of increasing audit committee effectiveness (e.g., U.S. Congress, 2002). However, an
unintended consequence is that audit committee status has declined (Erkens and Bonner, 2013).
This status decline could impede regulatory goals by limiting the ability of audit committees to
constrain opportunistic financial reporting by managers. This is because when parties face
conflicting goals, each party’s knowledge (expertise) and relative status affect its ability to
influence outcomes, especially in non-routine, challenging and ambiguous situations (D’Aveni,
1990; Finkelstein, 1992; Hambrick, 2007; Pollock et al., 2011). The relationship between
managers and audit committees has the potential for significant conflict as managers have

2
incentives to misreport, while audit committees are intended to constrain opportunistic financial
reporting (AICPA, 1990; U.S. Congress, 2002). A movement towards greater financial expertise
that resulted in a decreased ability to constrain opportunistic financial reporting would be a
serious unintended effect of recent regulatory action.
There are several reasons that the status differential between managers and the audit
committee is likely to influence audit committee effectiveness. First, audit committees must have
both the ability and authority necessary to gain the respect of managers in order to influence
financial reporting outcomes. The relative status of audit committee members directly influences
how managers view them because status enhances perceived ability and commands authority and
respect (D’Aveni, 1990; Pollock et al., 2011). Thus, managers would view higher status audit
committee members as more competent and authoritative, providing a disincentive for managers
to manipulate accounting numbers.
Second, high status directors are likely to be more active monitors because they have more to
lose personally in terms of both reputation and wealth (Fama and Jensen, 1983). This conclusion
flows directly from traditional measures of status, such as elite education and public and private
board memberships (D’Aveni, 1990; Finkelstein, 1992; Pollock et al., 2011). For example,
individuals with elite educations earn more over their lifetimes (Brewer et al., 1999), while
holding more directorships indicates high reputation and earning power.
Third, higher status audit committee members are likely to be more active monitors because
they would be less affected by management’s status. As a result, in more challenging situations,
they would be more willing to confront managers if necessary than would low status audit
committee members (D’Aveni, 1990; Giordana, 1983). Thus, higher status audit committee
members are likely to be more effective in situations involving questionable financial reporting.
3
In contrast, low status audit committee members would tend to defer to management due to the
authority and respect higher status management commands.
Overall, higher status audit committees should be more effective monitors compared to lower
status audit committees. Importantly, the above theories apply when individuals face negative
repercussions for failing to act. In an analogous situation, low-power directors paired with
higher-power managers allow such managers to extract higher compensation (Grinstein and
Hribar, 2004) even though it may cause the directors embarrassment, loss of reputation and
negative career concerns (Bebchuk et al., 2002). Adverse outcomes are magnified in financial
reporting situations, given potential negative publicity (Miller, 2006). Thus, the ability of the
audit committee to act as an influential peer in potential confrontations with managers is critical.
We gather a sample of firms from BoardEx, a business network database that provides
biographical information and employment history for corporate directors and officers. We create
measures of financial expertise and relative status (i.e., audit committee status relative to
management status). Based on the rules implemented by the SEC (2003) under SOX, we define
“financial experts” broadly as individuals with experience with or oversight over the creation or
auditing of financial reports. We also consider the underlying types of financial expertise such as
accounting, supervisory, and finance expertise because prior studies find differing effects based
on type of financial expertise (e.g., Bédard and Gendron, 2010; DeFond et al., 2005; Dhaliwal et
al., 2010).
Our relative status measure includes (1) the number of contemporaneous public board
directorships, (2) the number of contemporaneous private board directorships, and (3) elite
education (D’Aveni, 1990; Erkens and Bonner, 2013; Finkelstein, 1992; Pollock et al., 2011;
Useem, 1979). We find that the average number of audit committee members with financial

4
expertise increased monotonically from 2001 through 2008, driven by members with accounting
and finance expertise. Additionally, audit committee status relative to management has decreased
over the same period.
We measure earnings management in two ways. First, we measure irregularities based on
settled, accounting-based securities class-action lawsuits from RiskMetrics and SEC and
Department of Justice enforcement actions claiming fraud or other intentional misconduct from
Karpoff et al. (2008a and 2008b). Irregularities are an objective measure of GAAP violations, a
severe form of earnings management. Second, to validate these results, we examine abnormal
accruals, a common measure of within-GAAP earnings management (Zhao and Chen, 2008).
In multivariate tests involving the likelihood of an irregularity, the interaction between audit
committee financial expertise and relative status is significantly negative. From an economic
perspective, firm-years with audit committees that have high relative status are between 0.5 and
1.3 percentage points less likely to have an irregularity compared to those without high relative
audit committee status. This represents between 17.9 and 46.4 percent of the 2.8 unconditional
probability of having an irregularity. These results support the notion that only audit committees
with sufficient expertise and relative status deter irregularities.
To confirm the importance of audit committee status with respect to financial reporting
quality, we also examine abnormal accrual measures. This test follows the Healy and Wahlen
(1999) definition of earnings management and considers abnormal accruals to be influenced by
judgments to alter financial reports.1 We find corroborating results for our main tests in that the
interaction of financial expertise and status results in lower abnormal accruals.
1Healy and Wahlen (1999, 368) define earnings management as “when managers use judgment in financial reporting
and in structuring transactions to alter financial reports to either mislead some stakeholders about the underlying
economic performance of the company or to influence contractual outcomes that depend on reported accounting
numbers.”

5
Moreover, additional tests which examine the status of the audit committee chair alone
and the status of the independent, non-audit committee directors suggest that it is the status of the
entire audit committee that is important for limiting irregularities. This finding is consistent with
regulations that focus on audit committees as a whole, listing rules that require a minimum of
three audit committee members, and research stressing the importance of examining groups with
direct functional responsibility (e.g., Hambrick, 2007). For completeness, we examine whether
specific types of financial expertise (accounting, supervisory, and finance) drive the results. We
find evidence that supervisory expertise is negatively associated with a lower likelihood of an
accounting irregularity, but only when the audit committee has high status. We also perform a
falsification test with error-based restatements. In this test, we find no significant interaction
between financial expertise and status differential.
It is possible that our results are due to high status directors either avoiding directorships
at firms with high financial reporting risk or leaving the firm as soon as an irregularity is
detected. Importantly, this concern is somewhat tempered by two factors inherent in our focus on
relative rather than absolute audit committee status. First, firms with high financial reporting risk
likely have lower status managers (all else being equal), because they are less attractive
employment options. Therefore, even if these firms attract lower status audit committees, it is not
clear that relative status would be affected. Second, managers who commit irregularities lose
their positions at a very high rate (Karpoff et al., 2008a). It is likely that executive positions at
irregularity firms are less desirable than other firms (all else being equal), and thus the status of
the executives at firms post-irregularity revelation is also likely to fall. Thus, even if high status
audit committee members leave, it is again unclear that relative status would be affected.
We attempt to further allay these concerns empirically. First, we examine the relation

6
between changes in audit committee status that accompany member turnover within irregularity
firms. Contrary to the endogeneity concerns, we find that the change in relative audit committee
status when there is turnover does not differ between years before and after an irregularity
begins, and relative status increases after irregularity revelation compared to years prior to the
revelation. Additionally, for all firms with audit committee turnover, the change in relative audit
committee status from t-1 to t is unassociated with the predicted probability of an irregularity for
t-1 (i.e., ex ante risk of an irregularity that should be observable to potential director candidates).
These results are inconsistent with relatively high status audit committees being affected by high
status directors either leaving firms before malfeasance begins or upon malfeasance detection.
This study makes two primary contributions to the accounting literature. First, we provide
insight into the ability of audit committees to constrain earnings management. We find evidence
that audit committee financial expertise does not constrain irregularities unless the audit
committee also has high status. Similarly, abnormal accruals are lower when the audit committee
has both high relative status and financial expertise. These results speak to benefits and
limitations of financial expertise, the focus of considerable debate. Notably, the combination of
financial expertise and relative status is critical for constraining earnings management.
Second, we extend the literature on status of corporate leaders. While surveys of
individuals involved in financial reporting have proposed that audit committee status can affect
financial reporting quality, ours is the first study to directly test this and with externally
observable measures. This finding adds to research that examines the conditions in which board
of director status can influence firm outcomes (D’Aveni, 1990; Pollock et al., 2011; Stuart et al.,
1999). It also complements the emerging literature that suggests that external auditor status is
important for audit quality (Bennett and Hatfield, 2013).

7
2. Literature Review and Hypothesis Development
2.1. Audit Committees and Accounting Irregularities
Audit committees are intended to monitor the financial reporting process and constrain
opportunistic managerial reporting. This role reflects agency theory and the need to monitor
managers (agents) to reduce their ability to extract rents from the firm (e.g., Beasley et al., 2009;
Fama and Jensen, 1983). Due to this monitoring role, numerous regulators have highlighted the
importance of audit committees.2 For example, then-SEC Chairman Arthur Levitt (2000) echoed
the advice of the Blue Ribbon Commission by stating that “one of the most reliable guardians of
the public interest is a competent, committed, independent and tough-minded audit committee.”
Following Levitt’s advice, SOX requires that firms must have fully independent audit
committees. In addition, SOX effectively mandates financial expertise by requiring that firms
disclose financial expertise (U.S. Congress, 2002).3 However, there is still substantial variation
in audit committee composition and operation (Beasley et al., 2009; Cohen et al., 2010).
Several studies find that audit committee financial expertise limits “routine” earnings
management as measured by accrual-based variables.4 However, the primary goal of SOX was
constraining financial reporting outside of GAAP (irregularities involving potential fraud) rather
than routine earnings management (Coates, 2007; Lucas, 2004). Constraining accounting
irregularities is a significant challenge faced by audit committees. For example, while executives
2 In addition to SOX, the Treadway Commission of 1987, the Cadbury Commission of 1992, the Blue Ribbon
Commission of 1999, the New York Stock Exchange’s Corporate Governance Rules of 2004, and the Canadian
Securities Administrators Audit Committee Rules of 2004 all stress the importance of audit committees. 3 Aside from regulatory requirements, audit committee members also face incentives to effectively monitor
managers in the form of legal liability and reputational risk (e.g., Beasley et al., 2009). 4 Financial expertise on the audit committee is associated with better financial reporting quality, as measured by
lower abnormal accruals, better accrual quality and more conservatism (Bédard et al., 2004; Carcello et al., 2006;
Dhaliwal et al., 2010; Krishnan and Visvanathan, 2008; Xie et al., 2003). Financial expertise is also associated with
a lower likelihood of internal controls weaknesses (Krishnan, 2005) and is valued by market participants with a
positive stock price reaction when firms disclose the appointment of a financial expert to the audit committee
(Davidson et al., 2004; DeFond et al., 2005).

8
admit to routine earnings management,5 they actively hide fraud from financial reporting
monitors due to the career consequences and other severe penalties for intentional GAAP
violations (e.g., Larcker et al., 2007; Schrand and Zechman, 2012).
This intentional obfuscation makes it difficult for audit committees to detect and prevent
irregularities.6 Despite these difficulties, three prior studies find a negative relation between audit
committee financial expertise and irregularities.7 Notably, all three studies involved sample
periods prior to SOX, when choice of audit committee members was less restricted. While these
studies present evidence that requiring financial expertise improved financial reporting quality, it
is unclear whether their results will continue to hold given changes in the composition of audit
committees for at least two reasons. First, the intended result of the audit committee financial
disclosure requirement of SOX is an increase in the number of financial experts. Second, audit
committees now include lower status members as a consequence of placing financial experts on
the audit committee who would not have otherwise been considered for directorships.
2.2. Status and the Audit Committee
Given the role of the audit committee as the financial reporting gatekeeper within a firm, the
ability of the committee to influence financial reporting outcomes is critical in constraining
misbehavior. One important attribute that affects firm outcomes, especially in challenging
5 Graham et al. (2005) find that 78% of CFOs and other top executives admit to using discretion to smooth earnings,
noting that “Several CFOs argue that, ‘you have to start with the premise that every company manages earnings.’”
Graham et al. (2005) focus on within-GAAP earnings management and stress “…these executives are not talking
about violating GAAP or committing fraud.” Moreover, measures of earnings management such as abnormal
accruals have a very low relation to accounting irregularities (see Price et al., 2011). 6 For example, Beasley et al. (2009) report that audit committee members believe they cannot prevent fraud. In
particular, one NYSE audit committee chair states: “It is totally beyond the competency of any audit committee
member to be able to sniff out fraud. So much of this risk relates to the people, thus you must rely on your judgment
regarding management’s integrity” (Beasley et al., 2009, 97). 7 Abbott et al. (2004) sample 44 fraud firms from 1991 through 1999 and find that audit committee financial
expertise reduces the likelihood of fraud. Farber (2005) examines 87 firms with Accounting and Auditing
Enforcement Releases detected through 1997 and finds a lower number of audit committee financial experts when
compared to control firms. Agrawal and Chadha (2005) find a negative association between financial expertise and
the likelihood of a restatement. Their sample includes 159 public companies that restated their earnings between
2000 and 2001 and includes restatements that would be considered irregularities.

9
settings that involve uncertainty, is the personal status or personal power of corporate leaders
(D’Aveni, 1990; Finkelstein, 1992; Hambrick, 2007; Pollock et al., 2011). Status is a form of
power based on personal qualities. A corporate leader with higher status is more able to influence
firm outcomes and decisions (Finkelstein, 1992; Pollock et al., 2011; Stuart et al., 1999).
While SOX and related regulations now call for the generally desirable traits of financial
expertise and independence on the audit committee, these same regulations have altered the
demand for directors. By requiring higher levels of overall board independence, audit committee
independence, and audit committee financial expertise, firms must appoint individuals to boards
and audit committees who they may not have considered absent the regulations (see Engel et al.,
2010). One of the side effects of this wider net for directors is that, in recent years, individuals
with lower social status have been appointed to boards.
Erkens and Bonner (2013) find that typical accounting experts (e.g., retired auditors) have
lower status than individuals with supervisory expertise (e.g., CEOs), and that firms with higher
status are less likely to appoint an accounting expert to the audit committee. Thus, status plays a
significant role in appointments of financial experts (Erkens and Bonner, 2013). In other words,
firms are concerned with both the financial expertise and status of audit committee members.
While financial expertise provides the knowledge necessary to improve financial reporting
quality, it may not be sufficient by itself to effectively reduce accounting irregularities. This is
due to the deterrent role of the audit committee with respect to accounting irregularities, which is
shaped by the personal interactions of managers and directors and is thus dependent on status.
2.3. Status and Potential Conflict
The primary role of status with respect to manager-audit committee interaction involves a
deterrent effect from being monitored by a group of peers versus a group with lower status. This

10
deterrent effect comes from management’s perception of the audit committee, particularly the
competence of the committee and the committee’s willingness to confront managers over
earnings management. This deterrent effect comes from three areas.
First, an audit committee with higher status will be viewed as more competent and
authoritative because status enhances perceived ability and commands respect (D’Aveni, 1990;
Pollock et al., 2011). This enhanced competence and authority would make managers more
reluctant to manipulate accounting numbers because they would believe the audit committee
would be more likely to detect such actions.
Second, audit committee members with status that is more similar to management will be
more willing to question and confront management. Conversely, when status differentials are
large, high status individuals are often able to avoid sanctions for inappropriate behavior (see
D’Aveni, 1990). This is particularly true when the task in question is complex (Giordano, 1983),
as financial reporting issues often are. Therefore, this issue is important in deterring irregularities
given that the types of executives who are predisposed to intentionally violate GAAP are often
willing to engage in significant conflict in order to achieve their goals (e.g., Byrne, 2003; Helyar,
2003).8 Given the domineering personalities of many CEOs who seek to commit fraud,
gatekeepers frequently encounter difficulty constraining their behavior.9 However, executives are
8 Anecdotes regarding the CEOs involved in accounting scandals are remarkably consistent, describing such CEOs
as narcissists and bullies. Examples include Al Dunlap, the former CEO of Sunbeam (e.g., Sutton, 2007) and former
HealthSouth CEO Richard Scrushy, described as “a supercilious bully” (Helyar, 2003). 9 While little direct evidence is available with respect to audit committees, numerous analogous cases exist with
respect to auditors. These cases are instructive because auditors provide a similar gatekeeping role. Even
gatekeepers with relevant expertise, such as auditors, frequently have difficulty standing up to misconduct,
highlighting that more than mere financial expertise is necessary to constrain misreporting. For example, Arthur
Andersen detected numerous misstatements by Waste Management, but could not convince the client to correct
them. “Cowed by the client’s executives…the SEC charged that the auditors simply caved when the company
refused to implement the changes they wanted” (Toffler and Reingold, 2003, 147). In another case, the court found
that the audits had been “sufficiently thorough…to uncover virtually all of the violations of GAAP which were
ultimately corrected in the restatements” but that the cause of the failed audit “lay in the seeming spinelessness of
[the audit partner] and the other E&Y accountants in their dealings with [the client]” (AUSA Life Insurance Co. v.

11
less likely to believe that they will be able to intimidate a committee of peers, versus a committee
comprised of relatively low status individuals (see Giordano, 1983).
2.4. Relative Status
We focus on audit committee status relative to the top management team. We focus on
the entire audit committee as the commissioned recommendations, exchange requirements, and
SEC regulations focus on the existence, size, independence, and other characteristics of the audit
committee as a group (SEC 2003). Moreover, research analyzing corporate decisions shows that
examining the groups primarily responsible for certain decisions rather than isolated individuals
provides better explanatory power of organizational outcomes (Carpenter and Fredrickson, 2001;
Hambrick, 2007; Jackson, 1992). In additional support for this approach, Hambrick (2007) notes
that “leadership of a complex organization is a shared activity, and the collective cognitions,
capabilities, and interactions of the entire [top management team] enter into strategic behaviors.”
For the management team, we include the CEO and the CFO because they have ultimate
authority over the financial reporting process. The SOX reforms designed to improve financial
reporting quality largely focused on the CEO and CFO, requiring their personal certification of
financial statements while enhancing criminal penalties for fraud (Karpoff et al., 2008a). In
addition, CEOs and CFOs are personally named in most SEC enforcement actions dealing with
financial reporting issues (Karpoff et al., 2008a; Feng et al., 2011), as well as nearly all securities
class actions that allege fraudulent financial reporting (Klausner and Hegland, 2010).
Our focus on the status differential between the audit committee and management is
Ernst & Young, 991 F. Supp. 234, 247-248 (S.D.N.Y. 1997)). The trial court found the auditor not liable on other
grounds, but was reversed in AUSA Life Insurance Co. v. Ernst & Young, 206 F.3d 202 (2d Cir. 2000).
Cases involving the domination of auditors by their clients are sufficiently common that ethics rules deal
with situations involving status differentials. Interpretation 101-2, dealing with former auditors going to work for the
client, states that the audit firm must determine “whether existing attest engagement team members have appropriate
experience and stature to effectively deal with the former employee when that person will have significant
interaction with the attest engagement team” (AICPA, 2003, emphasis added). Although it focuses on auditors, this
rule reflects a specific recognition of the importance of status in the effectiveness of gatekeepers.

12
logical because characteristics of individuals or groups, such as status, are not held in isolation.
That is, the ability of one party to influence organizational outcomes, especially when parties
have conflicting goals, is a function of that party’s position or power relative to the other parties
involved in the decision making process (Adams et al., 2005; Bebchuk et al., 2002; Finkelstein,
1992; Hambrick, 2007; Pettigrew and McNulty, 1995). For example, Finkelstein finds that
weighting executives on their relative levels of power (including the relative level of status)
increases the explanatory power of the relation between executive backgrounds and firm
outcomes, including diversification and acquisition choices.
The relative power between groups in other corporate settings (for example, managers
versus shareholders and directors) is a powerful determinant of outcomes. For example, Gompers
et al. (2003) and Bebchuk et al. (2009) find that firms with entrenched (powerful) managers
experience worse performance than firms with more shareholder power. Grinstein and Hribar
(2004) and Bebchuk et al. (2002) find that managers with more power relative to the board
extract higher rents through compensation. While these studies focus on governance structure,
few choices remain with respect to audit committee governance because full independence is
required and financial expertise is essentially required due to disclosure regulations. Status,
however, is unregulated and displays substantial cross-sectional variation.
2.5. Primary Hypothesis
Given the recent trends in audit committee characteristics, there is strong reason to
examine the relation between financial expertise, status and accounting irregularities. As
discussed, directors appointed to audit committees are now substantially different from those of
earlier periods. In addition, as noted, status often influences effectiveness in challenging business
situations (e.g., D’Aveni, 1990). Managers are undoubtedly aware ex ante that such higher status

13
individuals have more clout, more to offer and are more likely to stand up and challenge
management if faced with potential financial reporting issues. Thus, managers are less likely to
commit an irregularity in the first place due to deterrence provided by audit committees when
they have the necessary combination of ability and authority. Turley and Zaman (2007, 779)
support this deterrence function of the audit committee, quoting the Group Finance Director of
Asburton PLC as saying, “The present Audit Committee team, they are all individually sort of
strong characters, with a clear view of what’s going on. No one would dream of pulling a fast
one on any of them.”
As accounting irregularities involve financial reporting choices, we expect that financial
expertise is a necessary, but not sufficient, condition for reducing the likelihood of accounting
irregularities. Therefore, we propose that audit committee status, relative to management status,
interacts with audit committee financial expertise to reduce the likelihood of accounting
irregularities. In other words, managers are likely to be more reluctant to commit an accounting
irregularity when they believe that not only will it be discovered, but that the audit committee
will not back down. We state our primary hypothesis in the alternative form:
H1: Relative audit committee status interacted with audit committee financial
expertise decreases the likelihood of a financial reporting irregularity.
2.6. Secondary Hypothesis
Similar to the description above regarding accounting irregularities, there is also reason
to believe that audit committees with relatively higher status could help constrain other forms of
earnings management, including those which could lie within-GAAP. That is, managers are
again likely to more closely consider the commission of earnings management when faced with
an audit committee that has the necessary combination of ability and authority. However, this
14
relation is somewhat less clear given that various forms of within-GAAP earnings management
is regarded as a relatively normal business practice (see Graham et al., 2005).
We propose that audit committee status, relative to management status, interacts with
audit committee financial expertise to reduce the likelihood of abnormal accruals. We state our
secondary hypothesis in the alternative form:
H2: Relative audit committee status interacted with audit committee financial expertise
decreases the magnitude of abnormal accruals.
3. Sample and Research Design
3.1. Sample
We obtain our initial sample from BoardEx, a professional business network database.
BoardEx provides biographical information and employment history for corporate directors and
officers, which we utilize to determine audit committee member financial expertise and the
relative status of board members to management. Given data restrictions and allowing for
sufficient time for irregularity revelation, our sample covers 2001 to 2008. During this period,
boards were pressured to increase the financial expertise of the audit committee. We exclude all
firm-year observations with CEO or CFO turnover, as it is unclear how to determine the proper
status measures for these years.
To obtain our irregularity sample, we obtain SEC and Department of Justice enforcement
actions that allege fraud or other intentional misconduct from the Federal Securities Regulation
Database10 and settled securities class-action lawsuits that allege violations of GAAP per
RiskMetrics. IRREGULARITY is an indicator variable equal to one for years with alleged
management misconduct. Specifically, it is set to one for either (1) violation years from SEC and
10 For more information on these data see http://www.fesreg.com/. These data were hand-collected by Jerry Martin
and initially used in Karpoff et al. (2008a and 2008b).

15
Department of Justice enforcement actions that establish intent under Section 17(a) of the
Securities Act of 1933, or either Section 10(b) (including Rule 10b-5) or 13(b)(5) of the
Securities Exchange Act of 1934 or (2) class period years related to the class-action lawsuits.
Our primary management misconduct model controls for incentives to materially manipulate
the financial statements, corporate governance variables related to monitoring, and other
determinants of misconduct. Data for these control variables come from Compustat, CRSP and
Thompson Reuters. In a second model, we also include the entrenchment index (Bebchuk et al.,
2009), which results in a substantial reduction of firm-years. Our final sample includes 29,074
firm-year observations from 2001 through 2008, with 9,633 of these firm-years having
entrenchment index data.
3.2. Primary Variable Definitions
3.2.1. Financial Expertise
We classify audit committee members as having financial expertise if their biographical
information in BoardEx includes terms reflecting accounting experience, experience supervising
the preparation of financial statements, or expertise using the financial statements. Our main
measure of audit committee financial expertise, EXPERTISE, is based upon the SEC’s definition
of financial expertise, which includes three areas of expertise: accounting, supervisory and
finance expertise (SEC, 2003) (see Appendix C for a list of terms included in each category).11
EXPERTISE is the percent of audit committee members that have financial expertise.
We also create more granular expertise measures for accounting, supervisory, and finance
11 The SEC specifically states that financial expertise is evidenced by, “(1) education and experience as a principal
financial officer, principal accounting officer, controller, public accountant or auditor or experience in one or more
positions that involve the performance of similar functions; (2) experience actively supervising a principal financial
officer, principal accounting officer, controller, public accountant, auditor or person performing similar functions;
(3) experience overseeing or assessing the performance of companies or public accountants with respect to the
preparation, auditing or evaluation of financial statements; or (4) other relevant experience” (SEC, 2003).

16
experience. SOXACC, SOXSUPER, and SOXFIN are the percentage of audit committee members
that have accounting, supervisory, and finance expertise, respectively.12 SOXACC_DUM,
SOXSUPER_DUM, and SOXFIN_DUM are indicators that are set to one if the audit committee
has at least one member with accounting, supervisory, and finance expertise, respectively.
3.2.2. Status
We calculate status measures for audit committees, non-audit committee independent
directors, and management (i.e., CEO and CFO). With these status measures we demonstrate that
director and executive status is positively correlated at the firm level and that accountants lower
the status of audit committees (e.g., Erkens and Bonner, 2013; Fahlenbrach et al., 2010). We also
calculate status measures that capture the differential status between the audit committee and
management (i.e., CEO and CFO) and also the differential status between independent directors
not on the audit committee and management. Stated another way, these two differential measures
capture the relative status of these two groups of directors compared to management. We use
these measures to test our main hypothesis. Our status measures are composite measures based
upon prior literature (Finkelstein, 1992; Erkens and Bonner, 2013; Pollock et al., 2011) that
include (1) the number of contemporaneous public board of directorships, (2) the number of
contemporaneous private board of directorships and (3) elite education.13
For audit committee status, PUBBODS_AC is an indicator that equals one if the mean
number of audit committee concurrent public board appointments is greater than the median for
all audit committees, and zero otherwise. PRIBODS_AC is an indicator that equals one if the
12 We expand our analysis to these three types of expertise as the literature presents mixed evidence on whether and
which types of expertise affect financial reporting outcomes (Bédard and Gendron, 2010). 13 Consistent with empirical studies that examine the entire board (e.g., Ferris et al., 2003) and the majority of audit
committee studies recently reviewed (see Bédard and Gendron, 2010), we predict that more directorships signals
higher quality directors and better monitoring as opposed to excessive “busyness.” Consistent with smaller sample
surveys (e.g., Cohen et al., 2010), the audit committee members in our large sample serve on a mean (median) of
2.10 (2.67) total boards. The fact that more than half of these directors serve on fewer than two other boards
provides additional evidence that is inconsistent with directors being over-extended.

17
mean number of audit committee concurrent private board appointments is greater than the
median for all audit committees, and zero otherwise. ELITEED_AC is an indicator that equals if
the mean number of elite institution degrees for members of the audit committee is greater than
the median for all audit committees, and zero otherwise. Elite institutions are noted in Appendix
B and are consistent with prior research, including Useem and Karabel (1986), Finkelstein
(1992), and Erkens and Bonner (2013). Then, STATUS_AC is an indicator that equals one if the
sum of PUBBODS_AC, PRIBODS_AC, and ELITEED_AC is three, and zero otherwise.
STATUS_AC is our measure of audit committee status.
We calculate similar measures for executive status (STATUS_EXEC) and independent, non-
audit committee director status (STATUS_NAC) that are also based on (1) the number of
contemporaneous public board of directorships, (2) the number of contemporaneous private
board of directorships and (3) elite education. To calculate the relative status of the audit
committee compared to management, we consider the same underlying measures used to create
our audit committee status measure, but we consider the difference in those measures between
each audit committee-management pair.14 STATUS_DIF is our measure of the status differential
between audit committees and management, with values of one indicating instances where
relative audit committee status is high.15 For parsimony, detailed variable definitions throughout
the study are provided in Appendix A.
14 Specifically, PUBBODS_DIF is an indicator that equals one if the mean number of audit committee member
concurrent public board appointments minus the mean number of CEO and CFO concurrent public board
appointments is greater than the median difference across all audit committee-management pairs, and zero
otherwise. PRIBODS_DIF is an indicator that equals one if the mean number of audit committee member concurrent
private board appointments minus the mean number of CEO and CFO concurrent private board appointments is
greater than the median difference across all audit committee-management pairs, and zero otherwise. ELITEED_DIF
is an indicator that equals one if the mean number of elite institution degrees for audit committee members minus
the mean number of elite institution degrees for the CEO and CFO is greater than the median difference across all
audit committee-management pairs, and zero otherwise. STATUS_DIF is an indicator that equals one if the sum of
PUBBODS_DIF, PRIBODS_DIF, and ELITEED_DIF is three, and zero otherwise. 15 In untabulated robustness tests, we find that inferences remain the same if we calculate relative audit committee
status based upon audit committee status compared to only the CEO’s status.

18
We also control for the relative status of the independent directors not on the audit committee
compared to management. We use the same underlying status measures, but we consider the
difference in those measures between each independent, non-audit committee director-
management pair. STATUS_DIF_NAC is an indicator that equals one if the sum of three
underlying variables (PUBBODS_DIF_NAC, PRIBODS_DIF_NAC, and ELITEED_DIF_NAC)
is three, and zero otherwise.16 STATUS_DIF_NAC captures the status differential between
independent, non-audit committee directors and management.
3.3 Regression Model, Dependent Variable, and Control Variables
We begin by investigating the role of audit committee financial expertise in explaining audit
committee status (Erkens and Bonner, 2013). In this initial model, we include controls for
executive and independent, non-audit committee status. We also include our control variables
from our main model of interest, equation (3), which is presented later. Model 1 is specified:
Prob(STATUS_ACt = 1) = F(β0+ β1EXPERTISEt + β2STATUS_EXECt +
β3STATUS_NACt + β4NUM_ACt + β5NUM_BRDt + β6BRD_PCT_INDt +
β7CEOISCHAIRt + β8INSTITUTIONAL_OWNt + β9LMARKETCAPt + β10BMt +
β11LEVERAGEt + β12ISSUEt + β13ROAt + Year Fixed Effects + Industry Fixed Effects)
(1)
The dependent variable, STATUS_AC, is set to one for firm-years with high audit committee
status. As we do for each model, we re-estimate equation (1) controlling for the entrenchment
index (EINDEX). We provide separate estimations with and without the entrenchment index
because the entrenchment index is only available for a small subset of our overall sample.
16 Specifically, PUBBODS_DIF_NAC is an indicator that equals one if the mean number of independent, non-audit
committee directors concurrent public board appointments minus the mean number of CEO and CFO concurrent
public board appointments is greater than the median difference across all pairs, and zero otherwise.
PRIBODS_DIF_NAC is an indicator that equals one if the mean number of independent, non-audit committee
directors concurrent private board appointments minus the mean number of CEO and CFO concurrent private board
appointments is greater than the median difference across all pairs, and zero otherwise. ELITEED_DIF_NAC is an
indicator that equals one if the mean number of elite institution degrees for independent, non-audit committee
directors minus the mean number of elite institution degrees for the CEO and CFO is greater than the median
difference across all pairs, and zero otherwise.

19
Our coefficient of interest is β1, which is for EXPERTISE. The sign and significance of β1
provides insights into how a change in audit committee financial expertise is associated with
audit committee status. In subsequent specifications of equation (1) we replace EXPERTISE with
SOXACC, SOXSUPER, and SOXFIN and also with SOXACC_DUM, SOXSUPER_DUM, and
SOXFIN_DUM to investigate how specific types of audit committee expertise are associated
with audit committee status. A negative and significant coefficient on SOXACC and
SOXACC_DUM would be consistent with the findings of Erkens and Bonner (2013) that
accountants lower the status of the audit committee.
Because our main interest is how relative audit committee status interacts with financial
expertise in deterring irregularities, we also investigate whether financial expertise and the types
of financial expertise affect relative audit committee status. To do this, we replace the status
measures in model (1) with our relative status measures. Model 2 is specified as follows:
Prob(STATUS_DIFt = 1) = F(β0+ β1EXPERTISEt + β2STATUS_DIF_NACt +
β3NUM_ACt + β4NUM_BRDt + β5BRD_PCT_INDt + β6CEOISCHAIRt +
β7INSTITUTIONAL_OWNt + β8LMARKETCAPt + β9BMt + β10LEVERAGEt +
β11ISSUEt + β12ROAt + Year Fixed Effects + Industry Fixed Effects) (2)
The dependent variable, STATUS_DIF, is set to one for firm-years where relative audit
committee status is high.
As in equation (1), the coefficient of interest is β1, for EXPERTISE. The sign and significance
of β1 provides insights into how a change in audit committee financial expertise is associated
with the differential status between audit committees and management. In subsequent
specifications of equation (1) we replace EXPERTISE with SOXACC, SOXSUPER, and SOXFIN
and also with SOXACC_DUM, SOXSUPER_DUM, and SOXFIN_DUM to investigate how
specific types of expertise are associated with relative audit committee status. Similar to equation
(1), we anticipate a negative and significant coefficient on SOXACC and SOXACC_DUM. This

20
would be consistent with the proposition that accountants lower audit committee status, which
would contribute to lowering the likelihood of high relative audit committee status.
After investigating the effects of audit committee financial expertise on audit committee
status and on relative audit committee status, we examine the relation between financial
expertise, relative audit committee status, and accounting irregularities. The model controls for
major incentives for managers to misreport financial results, including debt and equity offerings,
size, growth prospects and leverage (see Dechow et al., 2011; Kim and Skinner, 2012), as well as
corporate governance variables related to monitoring the financial reporting process (see
Dechow et al., 2011; Dechow et al., 1996; Klein, 2002). Model 3 is specified as follows:
Prob(IRREGULARITYt = 1) = F(β0+ β1EXPERTISEt + β2EXPERTISEt*STATUS_DIFt
+ β3STATUS_DIFt + β4STATUS_DIF_NACt + β5NUM_ACt + β6NUM_BRDt +
β7BRD_PCT_INDt + β8CEOISCHAIRt + β9INSTITUTIONAL_OWNt +
β10LMARKETCAPt + β11BMt + β12LEVERAGEt + β13ISSUEt + β14ROAt + Year Fixed
Effects + Industry Fixed Effects) (3)
The dependent variable, IRREGULARITY, is set to one for firm-years associated with an
irregularity (e.g., the years of the class period for a class-action lawsuit and the violation years
associated with SEC and Department of Justice Enforcement Actions).
The coefficient of interest is β2, the interaction of EXPERTISE and STATUS_DIF. A
negative and significant coefficient would be consistent with our first hypothesis. We make no
prediction for β1, the main effect for audit committee financial expertise, and β3, the main effect
of relative audit committee status, as it is unclear whether either of these without the other would
serve to deter managers from committing an irregularity. In subsequent specifications of
equation (3) we replace EXPERTISE with the underlying expertise variables (SOXACC,
SOXSUPER, and SOXFIN and also with SOXACC_DUM, SOXSUPER_DUM, and
SOXFIN_DUM) and include the associated interactions of STATUS_DIF and the underlying

21
expertise variables to investigate how the interactions of relative audit committee status with the
specific types of audit committee expertise are associated with the likelihood of an irregularity.
We control for other board of director characteristics that affect governance and could
affect the likelihood of an irregularity. Specifically, we control for the relative status of
independent directors who are not on the audit committee and management
(STATUS_DIF_NAC), audit committee size (NUM_AC), board size (NUM_BRD), board
independence (BRD_PCT_IND), CEO duality (CEOISCHAIR), institutional ownership
(INSTITUTIONAL_OWN), firm size (LMARKETCAP), growth prospects (BM and ROA),
leverage (LEVERAGE), and debt and equity offerings (ISSUE). As we do for the other regression
models, we re-estimate equation (3) after also controlling for the entrenchment index (EINDEX).
Next, we examine the relation between financial expertise, relative audit committee status,
and abnormal accruals. While abnormal accruals are a common measure of earnings
management, the models are also noisy (e.g., Bernard and Skinner, 1996; Kothari et al., 2005).
This makes results less reliable and more difficult to interpret as compared to the more objective
measure of accounting irregularities (Erickson et al., 2004). In addition, predicting an effect of
relative audit committee status interacted with audit committee financial expertise on abnormal
accruals is less clear because within-GAAP earnings management is relatively routine and many
executives admit to this behavior (see Graham et al., 2005). Therefore, relative audit committee
status may not serve as a substantial deterrent with respect to abnormal accruals.
We calculate abnormal accruals using the modified-Jones model with an intercept. Our
measure of abnormal accruals, ABN_ACC, is the error term for firm i in year t as measured using
the following equation estimated by year and two-digit Standard Industrial Classification code:

22
TOTAL_ACCRUALSit = β0 + β1*(1/ASSETSit-1) + β2*(∆REVit - ∆ARit) + β3*PPEit + ε
(4)
We require ten firm-year observations per industry to compute ABN_ACC.
After calculating abnormal accruals, we use the following model, based upon prior
literature (e.g., Doyle et al., 2007; Ashbaugh-Skaife et al., 2008; Prawitt et al., 2009; Dhaliwal et
al., 2010) to test whether the status differential between audit committees and management
interacts with audit committee financial expertise to lower abnormal accruals.
ABN_ACCt = β0+ β1EXPERTISEt + β2EXPERTISEt*STATUS_DIFt +
β3STATUS_DIFt + β4STATUS_DIF_NACt + β5NUM_ACt + β6NUM_BRDt +
β7BRD_PCT_INDt + β8CEOISCHAIRt + β9INSTITUTIONAL_OWNt + β10STD_CFOt
+ β11STD_SALEt + β12FORSALESt + Β13LSEGCOUNTt + β14EXTREMESGt +
β15MERGERt + Β16RESTRUCTURINGt + β17LNASSETSt + β18AGGLOSSt +
β19SHUMWAYt + β20BIG4t + β21LEVERAGEt + β22BMt + β23ROAt + Year Fixed Effects
+ Industry Fixed Effects + ε (5)
The coefficient of interest is β2, the interaction of EXPERTISE and STATUS_DIF. A
negative and significant coefficient would be consistent with our second hypothesis. We also
predict a negative coefficient for β1, the main effect for audit committee financial expertise,
because audit committee financial expertise has been show in prior studies to be negatively
related to various measures of accrual-related financial reporting quality (i.e., Xie et al., 2003;
Krishnan and Visvanathan, 2008; Dhaliwal et al., 2010).17 We make no prediction for β3, the
main effect of relative audit committee status, as it is unclear whether relative audit committee
status would serve to restrain abnormal accruals without the presence of financial expertise.
17 We are not aware of any large-sample, post-SOX evidence of the relation between audit committee financial
expertise and abnormal accruals, but research provides evidence of a positive relation between financial expertise
and accrual-related financial reporting quality. For example, Dhaliwal et al. (2010) have a post-SOX sample of 770
firm observations and find a relation between financial expertise and accruals quality. Krishnan and Visvanathan
(2008) have a pre-SOX sample of 929 firm-year observations and find a relation between financial expertise and
measures of accruals quality and conservatism. Xie et al. (2003) have 282, pre-SOX firm-year observations and find
a relation between financial expertise and current abnormal accruals. Given the audit committee data available in
BoardEx, our sample comprises eight years and over 21,000 observations.
23
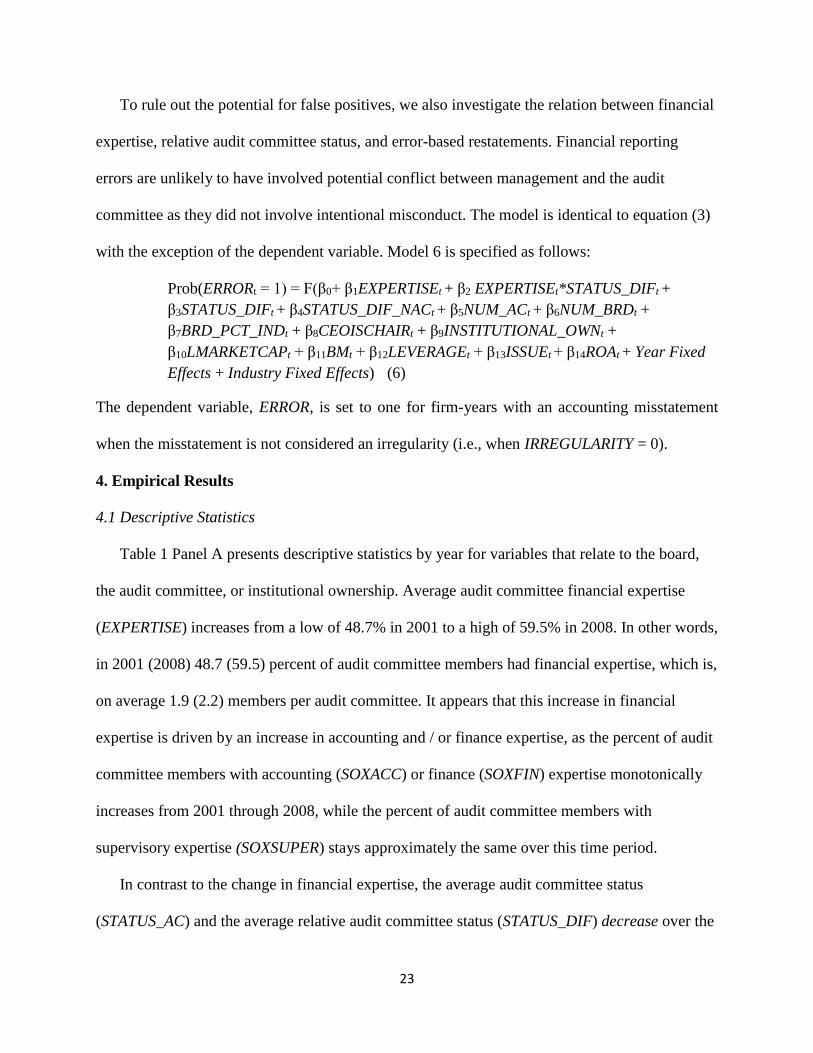
To rule out the potential for false positives, we also investigate the relation between financial
expertise, relative audit committee status, and error-based restatements. Financial reporting
errors are unlikely to have involved potential conflict between management and the audit
committee as they did not involve intentional misconduct. The model is identical to equation (3)
with the exception of the dependent variable. Model 6 is specified as follows:
Prob(ERRORt = 1) = F(β0+ β1EXPERTISEt + β2 EXPERTISEt*STATUS_DIFt +
β3STATUS_DIFt + β4STATUS_DIF_NACt + β5NUM_ACt + β6NUM_BRDt +
β7BRD_PCT_INDt + β8CEOISCHAIRt + β9INSTITUTIONAL_OWNt +
β10LMARKETCAPt + β11BMt + β12LEVERAGEt + β13ISSUEt + β14ROAt + Year Fixed
Effects + Industry Fixed Effects) (6)
The dependent variable, ERROR, is set to one for firm-years with an accounting misstatement
when the misstatement is not considered an irregularity (i.e., when IRREGULARITY = 0).
4. Empirical Results
4.1 Descriptive Statistics
Table 1 Panel A presents descriptive statistics by year for variables that relate to the board,
the audit committee, or institutional ownership. Average audit committee financial expertise
(EXPERTISE) increases from a low of 48.7% in 2001 to a high of 59.5% in 2008. In other words,
in 2001 (2008) 48.7 (59.5) percent of audit committee members had financial expertise, which is,
on average 1.9 (2.2) members per audit committee. It appears that this increase in financial
expertise is driven by an increase in accounting and / or finance expertise, as the percent of audit
committee members with accounting (SOXACC) or finance (SOXFIN) expertise monotonically
increases from 2001 through 2008, while the percent of audit committee members with
supervisory expertise (SOXSUPER) stays approximately the same over this time period.
In contrast to the change in financial expertise, the average audit committee status
(STATUS_AC) and the average relative audit committee status (STATUS_DIF) decrease over the

24
sample period. The increase in accounting expertise over this period is consistent with
accountants having lower status than other directors (Erkens and Bonner, 2013).
Additionally, the size of the audit committee (NUM_AC) is fairly constant, so it appears that
firms replaced high-status members with accounting or finance experts rather than adding
accounting or finance members to the audit committee. Finally, the percentage of independent
board members and percentage of institutional ownership increase over time, and the instances of
CEO duality decrease over the sample period. These trends seem consistent with pressure from
regulators and shareholder advocates to increase the quality of boards. Table 1 Panel A also
shows that irregularities increased from 2001 through 2003 and then declined through 2008.
Table 1 Panel B presents descriptive statistics for our irregularity and control (firms without
an irregularity) samples. Panel B provides evidence that there is a significant difference between
our irregularity and control samples with respect to a number of variables. Specifically, audit
committee accounting expertise is higher in the control sample compared to the irregularity
sample, which is expected. Surprisingly, the percentage of audit committee financial expertise
and supervisory expertise (both the percentage and presence) are higher in the irregularity
sample compared to the control sample. Additionally, the status and relative status of the audit
committee are higher in the irregularity sample than in the control sample. These correlations
could be the result of larger firms having an increased likelihood of an irregularity and also
having an increased likelihood of being able to attract high-status directors (Erkens and Bonner,
2013). Table 2 show positive and significant correlations between LMARKETCAP and
EXPERTISE, SOXSUPER, SOXSUPER_DUM, STATUS_AC, and STATUS_DIF.
4.2. Results – Audit Committee Status and Status Differential
Our results for equation (1) are presented in Table 3 Panel A. Column one reveals that the

25
percentage of audit committee financial expertise (EXPERTISE) is positively associated with
audit committee status (STATUS_AC). However, the negative and significant coefficients in
columns three through six on SOXACC and SOXACC_DUM are consistent with accounting
experts lowering audit committee status. Additionally, the positive and significant coefficients in
columns three through six on SOXSUPER_DUM, SOXFIN, and SOXFIN_DUM suggest that
supervisory and finance experts increase audit committee status. These results are also consistent
with the status of executives and other independent directors not serving on the audit committee
being positively associated with audit committee status, as is evidenced by positive and
significant coefficients on STATUS_EXEC and STATUS_NAC. Thus, it appears that high status
directors and executives prefer to serve with other high status executives and directors.
Results from equation (2) relating to the determinants of relative audit committee status
are presented in Table 3 Panel B. These results are consistent and stronger than the results in
Table 3 Panel A. Specifically, the magnitude and statistical significance for the coefficients on
the audit committee expertise variables increase when we switch the dependent variable from
STATUS_AC to STATUS_DIF. The results are consistent with accounting experts on the audit
committee decreasing relative audit committee status and with supervisory and finance experts
on the audit committee increasing relative audit committee status. Additionally, there is a
positive and significant coefficient on STATUS_DIF_NAC suggesting that companies where the
relative status of independent, non-audit committee directors is high are the same companies
where the relative status of the audit committee is high. This is consistent with the claim that
high status directors seek out other high status directors to fill directorships.
4.3. Results – Irregularities, Abnormal Accruals, and Errors
Table 4 Panel A presents results of equation (3), where the dependent variable is

26
IRREGULARITY. Both columns one and two reveal that the coefficients on EXPERTISE are
insignificant, suggesting that financial expertise is not associated with accounting irregularities.
However, both columns three and four reveal that the coefficient on EXPERTISE*STATUS_DIF
is negative and significant. Additionally, Figures 1 and 2 reveal that plotting the average
significance of the interaction term for model (3) is significant and negative. To put these results
in economic perspective, the results from column (3) suggest that firm-years with audit
committees that have high relative status are 0.5 percentage points less likely to have an
irregularity compared to those without high relative audit committee status. This represents
approximately 17.9 percent of the 2.8 unconditional probability of having an irregularity.18 This
supports H1 and is consistent with the proposition that relative status of the audit committee
interacts with audit committee financial expertise to deter management from accounting
irregularities.19
Table 4 Panel B presents the results of equation (5), where the dependent variable is
ABN_ACC. Both columns one and two reveal that the coefficient on EXPERTISE is negative and
significant, suggesting that the percentage of audit committee members with financial expertise
limits abnormal accruals. Both columns three and four reveal that the coefficient on
18 Marginal effects are computed using the average of discrete or partial changes over all observations (Bartus,
2005). The -0.5 percent marginal effect was computed by adding the marginal effect on STATUS_DIF and
EXPERTISE*STATUS_DIF that correspond to the associated values in column (3) of Table 4 Panel A. These
marginal effects are 0.021 and -0.026, respectively. The marginal effects corresponding to the associated values in
column (4) represent a -1.3 percentage point marginal effect, suggesting that the effect of audit committee relative
status is even more pronounced for larger firms (i.e., those with an entrenchment index). 19 To ensure that our result hold in the period following SOX, we run additional tests in which we drop 2001 only,
2001 and 2002, or 2001 through 2003. SOX became effective in 2002, but the requirements to have the external
auditor perform internal control testing did not become effective until 2004. Inferences are consistent in all tests. In
addition, the coefficient on the interaction of STATUS_DIF and EXPERTISE becomes more negative as we drop
observations from 2001, 2001 and 2002, and then 2001 through 2003. This is consistent with relative audit
committee status becoming more important for deterring irregularities as more directors who otherwise would not be
selected for audit committee service were selected because of their financial expertise.

27
EXPERTISE*STATUS_DIF is negative and significant.20 This supports H2 and suggests that the
relative status of the audit committee compared to management further assists the audit
committee in constraining opportunistic financial reporting.
Table 4 Panel C presents results of equation (6), where the dependent variable is ERROR.
Both columns one and two reveal that the coefficient on EXPERTISE is insignificant. Also,
columns three and four reveal that the coefficient on EXPERTISE*STATUS_DIF is negative and
insignificant. This suggests that audit committee expertise as well as relative audit committee
status interacted with audit committee expertise are unrelated to accounting errors.
Overall, these results suggest that the interaction of relative audit committee status and
financial expertise limits only intentional earnings management (irregularities and abnormal
accruals). In the falsification test, errors are not related to our interaction term of interest.
4.3. Endogeneity
It is also possible that our results are due to the self-selection of audit committee
members at firms with high financial reporting risk. Due to personal risks in terms of reputation
and legal liability, high status individuals may be unlikely to accept an audit committee role in a
firm where management has a questionable reputation or may leave a firm when an accounting
irregularity is detected (see Beasley et al., 2009). Thus, low status audit committees may be
matched with managers who are more likely to commit an irregularity, leading to our results.
Importantly, this concern is somewhat tempered by two factors inherent in our focus on relative
rather than absolute audit committee status. First, firms with high financial reporting risk likely
have lower status managers, because they are less attractive employment options. Therefore,
even if these firms attract lower status audit committees, it is not clear that relative status would
20 In untabulated robustness tests, we find that inferences remain the same if we use performance-matched abnormal
accruals (see Kothari et al. 2005).

28
be affected. Second, managers who commit irregularities lose their positions at a very high rate
(Karpoff et al., 2008a). It is likely that executive positions at irregularity firms are less desirable
than other firms (all else being equal), and thus the status of the executives at firms post-
irregularity revelation is also likely to fall. Thus, even if high status audit committee members
leave, it is again unclear that relative status would be affected.
We also attempt to allay this concern empirically, in two ways. First, we examine audit
committee expertise, status, and relative status for the irregularity firms before the irregularity
commences, during the irregularity, and after the irregularity is revealed. Second, we examine
the relation between audit committee expertise, status, and relative status with the ex ante risk of
an irregularity for all firms with audit committee turnover.
Table 5 Panel A presents descriptive statistics for variables of interest for firm-years from
irregularity firms. The number of firm-years with audit committee turnover (either directors
leaving the board or joining the audit committee) increase monotonically from the pre-
irregularity years to the irregularity and post-irregularity years. The average percentage of audit
committee financial expertise increases over this time period, while the average audit committee
status and firm size decrease. Most relevant, average relative audit committee status increases
from the pre-irregularity years to the years where the irregularity is being committed, but then
decreases in the post-irregularity years. This is exactly the opposite of the self-selection story
outline above. The same pattern holds for the interaction of audit committee expertise and
relative audit committee status.
To formally test whether the changes in audit committee expertise, status, and relative
status are significant, we first compare the change in audit committee expertise, status, and
relative status for the irregularity firms before the irregularity commences to the period after the

29
irregularity commences (including both during the irregularity and post-revelation). Table 5
Panel B suggests that there is no difference in the change in audit committee status and relative
status before and after irregularity commencement as evidenced by the insignificant coefficients
on the interaction of PRE_IRREGULARITY with CH_STATUS_DIF and CH_STATUS_AC.
We then compare the change in audit committee expertise, status, and relative status for
the irregularity firms before and during the irregularity to the period after irregularity revelation.
Table 5 Panel C suggests that the change in relative audit committee status increases after
irregularity revelation as is evidenced by the positive and significant coefficient on
POST_REVELATION*CH_STATUS_DIF. The negative and significant coefficient on
POST_REVELATION*CH_STATUS_AC suggests that the status of the audit committee
decreases after irregularity revelation.
Taken together, these results show that executive status decreases incrementally to the
decrease in audit committee status after irregularity revelation. Importantly, in both panels the
coefficient on the change in the interaction of the change in audit committee expertise and the
change in relative status is insignificant. Overall, this is inconsistent with the self-selection story.
In untabulated results, we also find an insignificant association between relative audit
committee status change and financial reporting risk (which we measure using model (3) without
the relative audit committee status-related variables) from the year prior to an audit committee
turnover event (the information that would be available to a prospective audit committee member
at the time of accepting the appointment). We also find a positive association between the change
in audit committee expertise that accompanies audit committee member turnover and ex ante
financial reporting risk. Thus, this provides some evidence that the role of status director
selection does not confound our inferences. Overall, these analyses are consistent with relative

30
audit committee status serving a deterrence role, rather than being a self-selection story.
5. Additional Analyses and Results
5.1 Specific Types of Audit Committee Expertise
Next, we explore whether relative audit committee status interacts with specific types of
audit committee expertise, suggesting that specific types of expertise assist in irregularity
deterrence. To do this, we re-estimate equation (3), but replace EXPERTISE with measures of
audit committee accounting, supervisory, and finance expertise.
Table 6 presents our results. The coefficients on the interactions of audit committee
accounting expertise with relative audit committee status and of audit committee finance
expertise with relative audit committee status are insignificant. However, the coefficients on
SOXSUPER*STATUS_DIF in columns one and two and on SOXSUPER_IND*STATUS_DIF in
column four are negative and significant.21 These results suggest that relative audit committee
status specifically interacts with audit committee supervisory expertise to deter accounting
irregularities. It is possible that past experience as a CEO, combined with high relative audit
committee status, is a key to irregularity deterrence.22
5.2 Relative Audit Committee Chair Status and Relative Independent Director Status
Because we find evidence that audit committee member status improves the ability of
audit committee financial experts to constrain accounting irregularities, we also investigate
whether relative audit committee chair or non-audit committee independent director status
provides similar benefits. As the audit committee chair is the leader of the audit committee, it is
reasonable to think that it is the chair’s status that really matters when it comes to standing up to
21 The negative coefficient on SOXSUPER_IND*STATUS_DIF in column three has a p-value of 0.1081, suggesting
that it too is marginally significant. 22 Interestingly, McDaniel et al. (2002) find that financial literates (such as CEOs) are better than experts (i.e.,
individuals with accounting backgrounds) at identifying non-recurring accounting issues.

31
management who are intentionally materially misstating the financial statements.23 Similarly, it
is possible that high status independent directors who do not sit on the audit committee could
support the audit committee when confronting management about possible irregularities. In
untabulated results, we find no evidence that relative audit committee chair status or relative
independent, non-audit committee director status interact with audit committee expertise to deter
accounting irregularities. These results provide evidence that audit committee status as a whole,
as compared to audit committee chair or non-audit committee independent director status, is
most important in assisting audit committee financial experts in reducing irregularities.
6. Conclusion
This study examines the importance of the interaction of audit committee status and financial
expertise in constraining earnings management. Our results suggest that the presence of both
relative audit committee status and financial expertise deters management from committing
irregularities. In addition, the combination of relative audit committee status and financial
expertise limits abnormal accruals. Thus, our findings imply that the calls of regulators to
increase financial expertise on the audit committee are insufficient without considering audit
committee status.
In particular, the push for more accounting experts may have had the unintended
consequence of increasing the likelihood of accounting irregularities as these directors on
average have low status compared to other directors. Thus, the broader definition of audit
committee financial expertise allowed by the SEC as part of SOX may have had a positive effect
by allowing firms to appoint higher status financial experts and constrain earnings management.
Our findings are important to the various stakeholders interested in the appointment of
23 For example, Turley and Zaman (2007) and Bédard and Gendron (2010) discuss the importance of the audit
committee chair in ensuring financial reporting quality.

32
effective audit committee members. Moreover, these results are particularly relevant given that
audit committee financial expertise has increased in recent years (from 2001 through 2008), but
audit committee status relative to management has decreased during this time frame.
In addition, we extend the academic literature by providing evidence regarding both the
benefits and limitations of audit committee financial expertise, which has been the focus of
considerable debate and discussion. This is the first study to directly test, with externally
observable measures, how relative audit committee status can affect earnings management. Our
findings add to research that examines the conditions in which board of director status can
influence firm outcomes (D’Aveni, 1990; Pollock et al., 2011; Stuart et al., 1999) and
complement the studies suggesting that external auditor status is important for audit quality
(Bennett and Hatfield, 2013).

33
References
American Institute of Certified Public Accountants (AICPA), 1990. AICPA Codification of
Statements of Auditing Standards. Chicago: Commerce Clearing House.
American Institute of Certified Public Accountants (AICPA), 2003. ET Section 101-
Independence. Available at:
http://www.aicpa.org/research/standards/codeofconduct/pages/et_101.aspx.
Abbott, L. J., Parker, S., Peters, G.F., 2004. Audit committee characteristics and restatements.
Auditing: A Journal of Practice & Theory 23: 69-87.
Adams, R.B., Almeida, H., Ferreira, D., 2005. Powerful CEOs and their impact on corporate
performance. Review of Financial Studies 18 (4): 1403-1432.
Adler, P.S., Kwon, S. K., 2002. Social capital: prospects for a new concept. The Academy of
Management Review 27 (1): 17-40.
Agrawal, A., Chadha, S., 2005. Corporate governance and accounting scandals. Journal of Law
and Economics 48 (2): 371-406.
Ashbaugh-Skaife, H. D., Collins, W., Kinney, W. R., LaFond, R., 2008. The effect of SOX
internal control deficiencies and their remediation on accrual quality. The Accounting
Review 83: 217-250.
Bartus, T., 2005. Estimation of marginal effects using margeff. Stata Journal 5 (3): 309-329.
Beasley, M.S., 1996. An empirical analysis of the relation between the board of director
composition and financial statement fraud. The Accounting Review 71: 443–465.
Beasley, M.S., Carcello, J. V., Hermanson, D. R., Neal, T.L., 2009. The audit committee
oversight process. Contemporary Accounting Research 26 (1): 65-122.
Bebchuk, L., Cohen, A., Ferrell, A., 2009. What matters in corporate governance? Review of
Financial Studies 22: 783-827.
Bebchuk, L.A., Fried, J.M., Walker, D.I., 2002. Managerial power and rent extraction in the
design of executive compensation. The University of Chicago Law Review 69: 751-846.
Bédard, J., Chtourou, S.M., Courteau, L., 2004. The effect of audit committee expertise,
independence, and activity on aggressive earnings management. Auditing: A Journal of
Practice & Theory 23 (2): 13–35.
Bédard, J, Gendron, Y., 2010. Strengthening the financial reporting system: can audit
committees deliver? International Journal of Auditing 14: 174-210.
34
Bernard, V. L., Skinner, D. J., 1996. What motivates managers' choice of discretionary
accruals? Journal of Accounting and Economics 22: 313-325.
Bennett, G. B., Hatfield, R. C., 2013. The effect of the social mismatch between staff auditors
and client management on the collection of audit evidence. The Accounting Review 88
(1): 31-50.
Blue Ribbon Committee on Improving the Effectiveness of Corporate Audit Committees, 1999.
Report and recommendations of the Blue Ribbon Committee on improving the
effectiveness of corporate audit committees. New York Stock Exchange and National
Association of Securities Dealers.
Brewer, D.J., Eide, E.R., Ehrenberg, R.G., 1999. Does it pay to attend an elite private college?
Cross-cohort evidence on the effects of college type on earnings. The Journal of Human
Resources 34 (1): 104-123.
Byrne, J.A., 2003. Chainsaw: the notorious career of Al Dunlap in the era of profit-at-any-price.
HarperCollins: New York, NY.
Carcello, J., Hollingsworth, C., Klein, A., Neal, T., 2006. Audit committee financial expertise,
competing corporate governance mechanisms and earnings management. Working Paper.
Carpenter, M.A., Fredrickson, J. W., 2001. Top management teams, global strategic posture, and
the moderating role of uncertainty. Academy of Management Journal, 44(3), 533-545.
Coates, J. C., 2007. The goals and promise of the Sarbanes-Oxley Act. Journal of Economic
Perspectives 21: 91–116.
Cohen, J., Krishnamoorthy, G., Wright, A., 2010. Corporate governance in the post-Sarbanes-
Oxley Era: auditors’ experiences. Contemporary Accounting Research 27 (3): 751-786.
D’Aveni, R., 1990. Top managerial status and organizational bankruptcy Organizational
Science 1 (2): 121-142.
Davidson, W.N., Xie, B., Xu, W., 2004. Market reaction to voluntary announcements of audit
committee appointments: The effect of financial expertise. Journal of Accounting and
Public Policy 23 (4): 279-293.
Dechow, P.M., Sloan, R.G., Sweeney, A.P., 1996. Causes and consequences of earnings
manipulation: an analysis of firms subject to enforcement actions by the SEC.
Contemporary Accounting Research 13: 1–36.
Dechow, P.M., Ge, W., Larson, C.R., Sloan, R.G., 2011. Predicting material accounting
misstatements. Contemporary Accounting Research 28: 17-82.
DeFond, M., Hann, R., Hu, X., 2005. Does the market value financial expertise on audit
committees of boards of directors? Journal of Accounting Research 43 (2): 153-193.

35
Dhaliwal, D., Naiker, V., Navissi, F., 2010. The association between accruals quality and the
characteristics of accounting experts and mix of expertise on audit committees.
Contemporary Accounting Research 27: 787–827.
Doyle, J.T., Ge, W., McVay, S., 2007. Accruals quality and internal control over financial
reporting. The Accounting Review 82: 1141-1170.
Engel, E., Hayes, R.M., Wang, X., 2010. Audit committee compensation and the demand for
monitoring of the financial reporting process. Journal of Accounting and Economics 49:
136-154.
Erickson, M., Hanlon, M., Maydew, E.L., 2004. How much will firms pay for earnings that do
not exist? Evidence of taxes paid on allegedly fraudulent earnings. The Accounting
Review, 79 (2), 387-408.
Erkens, D.H., Bonner, S.E., 2013. The role of firm status in appointments of financial
experts to audit committees. The Accounting Review 88: 107-136.
Fahlenbrach, R., Low, A., Stulz, R.M., 2010. Why do firms appoint CEOs as outside
directors? Journal of Financial Economics, 97(1), 12-32.
Fama, E.F., Jensen, M.C., 1983. Separation of ownership and control. Journal of Law and
Economics 26: 301-325.
Farber, D., 2005. Restoring trust after fraud: does corporate governance matter? The Accounting
Review 80 (2): 539-561.
Feng, M., Ge, W., Luo, S., Shevlin, T., 2011. Why do CFOs become involved in material
accounting manipulation? Journal of Accounting and Economics 51 (1-2): 21-36.
Ferris, S.P., Jagannathan, M., Pritchard, A.C., 2003. Too busy to mind the business? Monitoring
by directors with multiple board appointments. The Journal of Finance 58 (3): 1087-
1112.
Finkelstein, S., 1992. Power in top management teams: dimensions, measurement, and
validation. Academy of Management Journal 35 (3): 505-538.
Fischer, H.M., Pollock, T.G., 2004. Effects of social capital and power on surviving
transformational change: the case of initial public offerings. The Academy of
Management Journal 47 (4): 463-481.
Giordano, P.C., 1983. Sanctioning the high-status deviant: An attributional analysis. Social
Psychology Quarterly 46 (4): 329-342.

36
Gompers, P., Ishii, J., Metrick, A., 2003. Corporate governance and equity prices. The Quarterly
Journal of Economics, 118(1), 107-156.
Graham, J., Harvey, C., Rajgopal, S., 2005. The economic implications of corporate financial
reporting. Journal of Accounting and Economics 40 (1-3): 3-73.
Grinstein, Y., Hribar, P., 2004. CEO compensation and incentives: evidence from M&A
bonuses. Journal of Financial Economics 73: 119-143.
Hambrick, D.C., 2007. Upper echelons theory: An update. Academy of Management Review 32
(2): 334-343.
Healy, P.M., Wahlen, J.M., 1999. A review of the earnings management literature and its
implications for standard setting. Accounting horizons, 13(4), 365-383.
Helyar, J., 2003. The insatiable King Richard. Fortune. Available at:
http://money.cnn.com/magazines/fortune/fortune_archive/2003/07/07/345534/index.htm.
Jackson, S.E., 1992. Consequences of group composition for the interpersonal dynamics of
strategic issue processing. Advances in strategic management, 8(3), 345-382.
Karpoff, J.M., Lee, D.S., Martin, G.S., 2008a. The consequences to managers for financial
misrepresentation. Journal of Financial Economics 88 (2): 193-215.
Karpoff, J.M., Lee, D.S., Martin, G.S., 2008b. The cost to firms of cooking the books. Journal of
Financial and Quantitative Analysis 43 (3): 581-612.
Kim, I., Skinner, D.J., 2012. Measuring securities litigation risk. Journal of Accounting and
Economics 53: 290-310.
Klausner, M., and J. Hegland. 2010. How protective is D&O insurance in securities class
actions? – Part I. PLUS Journal 23 (2): 1-4.
Klein, A., 2002. Audit committee, board of director characteristics, and earnings management.
Journal of Accounting and Economics 33(3): 375-400.
Kothari, S.P., Leone, A.J., Wasley, C.E., 2005. Performance matched discretionary accrual
measures. Journal of Accounting and Economics 39(1): 163-197.
Krishnan, J., 2005. Audit committee quality and internal control: An empirical analysis
The Accounting Review 80 (2): 649-675.
Krishnan, G.V., Visvanathan, G., 2008. Does the SOX definition of an accounting expert matter?
The association between audit committee directors’ accounting expertise and accounting
conservatism. Contemporary Accounting Research 25: 827–858.

37
Larcker, D.F., Richardson, S.A., Tuna, I., 2007. Corporate governance, accounting outcomes and
organizational performance. The Accounting Review 82 (4): 963-1008.
Levitt, A., 2000. Remarks before the conference on the rise and effectiveness of new corporate
governance standards. U.S. Securities & Exchange Commission Federal Reserve Bank of
New York New York, New York December 12, 2000 Available at
http://www.sec.gov/news/speech/spch449.htm.
Lucas, N., 2004. An interview with the United States Senator Paul S. Sarbanes Journal of
Leadership and Organizational Studies 11 (1): 3-9.
McDaniel, L., Martin, R.D., Maines, L.A., 2002. Evaluating financial reporting quality: the
effects of financial expertise vs. financial literacy. The Accounting Review 77
(supplement): 139-167.
Miller, G.S., 2006. The press as a watchdog for accounting fraud. Journal of Accounting
Research 44: 1001–1033.
Norton, E.C., Wang, H., Ai, C., 2004. Computing interaction effects and standard errors in logit
and probit models. The Stata Journal 4 (2): 154-167.
Pettigrew, A., McNulty, T., 1995. Power and influence in and around the boardroom. Human
Relations 48(8): 845-873.
Pollock, T., Chen, G., Jackson, E., Hambrick, D., 2011. How much status is enough? Assessing
the value of multiple types of high-status affiliates for young firms, Journal of Business
Venturing 25 (1): 6-23.
Prawitt, D.F., Smith, J.L., Wood, D.A., 2009. Internal audit quality and earnings
management. The Accounting Review, 84(4), 1255-1280.
Price, R.A., Sharp, N.Y., Wood, D.A., 2011. Detecting and predicting accounting irregularities: a
comparison of commercial and academic risk measures. Accounting Horizons 25 (4):
755-780.
Schrand, C.M., Zechman, S.L.C., 2012. Executive overconfidence and the slippery slope to
financial misreporting. Journal of Accounting and Economics 53 (1–2): 311-329.
Securities and Exchange Commission (SEC)., 2003. Disclosure Required by Sections 406 and
407 of the Sarbanes-Oxley Act of 2002. Release Nos. 33-8177, 34-47235. Washington,
D.C.: SEC. http://www.sec.gov/rules/final/33-8177.htm.
Stuart, I.E., Hoang, H., Hybels, R.C., 1999. Interorganizational endorsements and the
performance of entrepreneurial ventures. Administrative Science Quarterly 44: 315-349.
Sutton, R.I., 2007. The no asshole rule. Business Plus: New York, NY.

38
Toffler, B.L., Reingold, J., 2003. Final accounting: ambition, greed, and the fall of Arthur
Andersen. New York, NY: Random House, Inc.
Turley, S., Zaman, M., 2007. Audit committee effectiveness: informal processes and behavioral
effects. Accounting, Auditing, & Accountability Journal 20 (5): 765-788.
U.S. Congress., 2002. The Sarbanes-Oxley Act of 2002. Public Law 107-204. United States
Government Printing Office, Washington, D.C.
Useem, M., 1979. The social organization of American business elite and participation of
corporation directors in the governance of American institutions. American Sociological
Review 44: 553-572.
Useem, M., Karabel, J., 1986. Pathways to top corporate management. American Sociological
Review 51: 184-200.
Xie, B., Davidson, W., DaDalt, P., 2003. Earnings management and corporate governance: The
role of the board and the audit committee. Journal of Corporate Finance 9 (3): 295-
316.
Zhao, Y., Chen, K.H., 2008. Staggered boards and earnings management. The Accounting
Review 83 (5): 1347-1381.

39
Appendix A: Variable Definitions
Definition
IRREGULARITY An indicator variable equal to one for (1) violation years from SEC and Department of Justice
enforcement actions that establish intent under Section 17(a) of the Securities Act of 1933, or
either Section 10(b) (including Rule 10b-5) or 13(b)(5) of the Securities Exchange Act of 1934
and (2) class period years related to settled securities class-action lawsuits that allege violations
of Generally Accepted Accounting Principles.
ERROR An indicator variable equal to one for misstated years when a restatement is not considered an
irregularity (i.e., when IRREGULARITY=0).
ABN_ACC The value of the error term for firm i in year t as measured using the following equation
estimated by year and two-digit Standard Industrial Classification code:
TOTAL_ACCRUALS it = β 0 + β 1 *(1/ASSETS it-1 ) + β 2 *(∆REV it - ∆AR it ) + β 3 *PPE it + ε
Dependent Variables

40
Definition
EXPERTISE The percentage of audit committee members with financial expertise as defined as prior
employment or a professional distinction that fits into at least one of SOXACC, SOXFIN and
SOXSUPER as defined below, and zero otherwise.
SOXACC The percentage of audit committee members with accounting expertise as defined as work
experience as a public auditor at one of the 25 audit firms listed in Compustat, as a CPA or
Chartered Accountant or in an accounting-specific position, such as CFO, Treasurer, Controller,
Head of Accounting, etc.
SOXSUPER The percentage of audit committee members with supervisory expertise as defined as work
experience at a public firm in a supervisory position that involves the supervision of individuals
involved in financial reporting, such as a CEO, COO or President.
SOXFIN The percentage of audit committee members with finance expertise as defined as work
experience in a financial position that uses financial reports, such as an Analyst or an Investment
Banker.
SOXACC_DUM An indicator that is equal to one if at least one audit committee member has accounting expertise
as defined as work experience as a public auditor at one of the 25 audit firms listed in Compustat,
as a CPA or Chartered Accountant or in an accounting-specific position, such as CFO,
Treasurer, Controller, Head of Accounting, etc.
SOXSUPER_DUM An indicator that is equal to one if at least one audit committee member has supervisory expertise
as defined as work experience at a public firm in a supervisory position that involves the
supervision of individuals involved in financial reporting, such as a CEO, COO or President.
SOXFIN_DUM An indicator that is equal to one if at least one audit committee member has finance expertise as
defined as work experience in a financial position that uses financial reports, such as an Analyst
or an Investment Banker.
Expertise Variables - all data come from BoardEx.

41
Definition
STATUS_AC A measure of the status of the AC. It is an indicator that equals one if the sum of
PUBBODS_AC , PRIBODS_AC, and ELITEED_AC is three, and zero otherwise.
STATUS_EXEC A measure of the status of the CEO and CFO. It is an indicator that equals one if the sum of
PUBBODS_EXEC , PRIBODS_EXEC, and ELITEED_EXEC is three, and zero otherwise.
STATUS_DIF A measure of the status differential between the AC and the Executive Team (CEO and CFO).
It is an indicator that equals one if the sum of PUBBODS_DIF , PRIBODS_DIF, and ELITEED
is three, and zero otherwise.
STATUS_NAC A measure of the status of the non-AC independent directors. It is an indicator that equals one if
the sum of PUBBODS_NAC , PRIBODS_NAC, and ELITEED_NAC is three, and zero
otherwise.
STATUS_DIF_NAC A measure of the status differential between non-AC independent directors and the executive
team (CEO and CFO). It is an indicator that equals one if the sum of PUBBODS_DIF_NAC ,
PRIBODS_DIF_NAC, and ELITEED_DIF_NAC is three, and zero otherwise.
PUBBODS_AC An indicator that equals one if the mean number of AC concurrent public board appointments is
greater than the median for all ACs, and zero otherwise.
PRIBODS_AC An indicator that equals one if the mean number of AC concurrent private board appointments is
greater than the median for all ACs, and zero otherwise.
ELITEED_AC An indicator that equals one if the mean number of elite institution degrees for members of the
AC is greater than the median for all ACs, and zero otherwise. Elite institutions are noted in
Appendix B.
PUBBODS_EXEC An indicator that equals one if the mean number of concurrent public board appointments for the
CEO and CFO is greater than the median for all CEOs and CFOs, and zero otherwise.
PRIBODS_EXEC An indicator that equals one if the mean number of concurrent private board appointments for the
CEO and CFO is greater than the median for all CEOs and CFOs, and zero otherwise.
ELITEED_EXEC An indicator that equals one if the mean number of elite institution degrees for members of the
executive team (i.e., the CEO and CFO) is greater than the median for all executive teams, and
zero otherwise. Elite institutions are noted in Appendix B.
Status Variables - all data come from BoardEx.

42
Definition
PUBBODS_DIF An indicator that equals one if the mean number of AC concurrent public board appointments
minus the mean number of CEO and CFO concurrent public board appointments is greater than
the median difference across all executive and AC pairs, and zero otherwise.
PRIBODS_DIF An indicator that equals one if the mean number of AC concurrent private board appointments
minus the mean number of CEO and CFO concurrent private board appointments is greater than
the median difference across all executive and AC pairs, and zero otherwise.
ELITEED_DIF An indicator that equals one if the mean number of elite institution degrees for members of the
AC minus the mean number of elite institution degrees for the CEO and CFO is greater than the
median difference across all executive and AC pairs, and zero otherwise. Elite institutions are
noted in Appendix B.
PUBBODS_NAC An indicator that equals one if the mean number of concurrent public board appointments for non-
AC independent directors is greater than the median for all non-AC independent directors, and
zero otherwise.
PRIBODS_NAC An indicator that equals one if the mean number of concurrent private board appointments for
non-AC independent directors is greater than the median for all non-AC independent directors,
and zero otherwise.
ELITEED_NAC An indicator that equals one if the mean number of elite institution degrees for non-AC
independent directors is greater than the median for all non-AC independent directors, and zero
otherwise. Elite institutions are noted in Appendix B.
PUBBODS_DIF_NAC An indicator that equals one if the mean number of concurrent public board appointments for non-
AC independent directors minus the mean number of CEO and CFO concurrent public board
appointments is greater than the median difference across all executive and non-AC
independent director pairs, and zero otherwise.
PRIBODS_DIF_NAC An indicator that equals one if the mean number of concurrent private board appointments for
non-AC independent directors minus the mean number of CEO and CFO concurrent private
board appointments is greater than the median difference across all executive and non-AC
independent director pairs, and zero otherwise.
ELITEED_DIF_NAC An indicator that equals one if the mean number of elite institution degrees for non-AC
independent directors minus the mean number of elite institution degrees for the CEO and CFO is
greater than the median difference across all executive and non-AC independent director pairs,
and zero otherwise. Elite institutions are noted in Appendix B.
Status Variables (continued) - all data come from BoardEx.
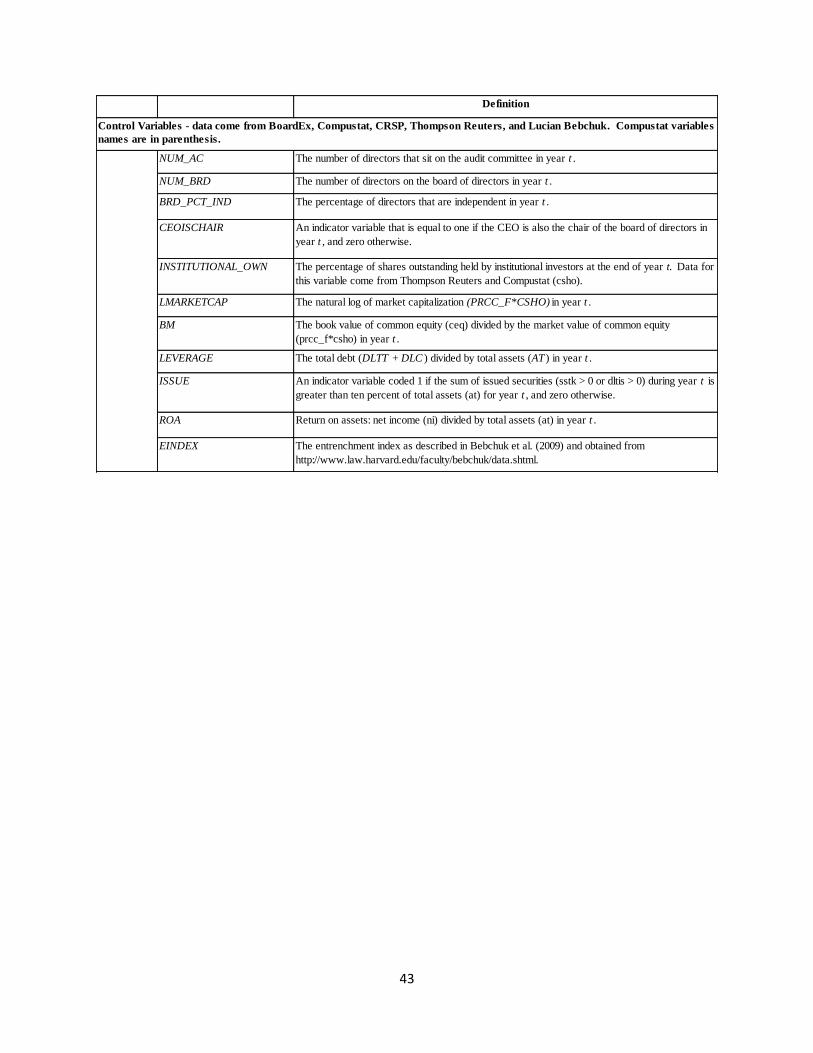
43
Definition
NUM_AC The number of directors that sit on the audit committee in year t .
NUM_BRD The number of directors on the board of directors in year t .
BRD_PCT_IND The percentage of directors that are independent in year t .
CEOISCHAIR An indicator variable that is equal to one if the CEO is also the chair of the board of directors in
year t , and zero otherwise.
INSTITUTIONAL_OWN The percentage of shares outstanding held by institutional investors at the end of year t. Data for
this variable come from Thompson Reuters and Compustat (csho).
LMARKETCAP The natural log of market capitalization (PRCC_F*CSHO) in year t .
BM The book value of common equity (ceq) divided by the market value of common equity
(prcc_f*csho) in year t .
LEVERAGE The total debt (DLTT + DLC ) divided by total assets (AT ) in year t .
ISSUE An indicator variable coded 1 if the sum of issued securities (sstk > 0 or dltis > 0) during year t is
greater than ten percent of total assets (at) for year t , and zero otherwise.
ROA Return on assets: net income (ni) divided by total assets (at) in year t .
EINDEX The entrenchment index as described in Bebchuk et al. (2009) and obtained from
http://www.law.harvard.edu/faculty/bebchuk/data.shtml.
Control Variables - data come from BoardEx, Compustat, CRSP, Thompson Reuters, and Lucian Bebchuk. Compustat variables
names are in parenthesis.
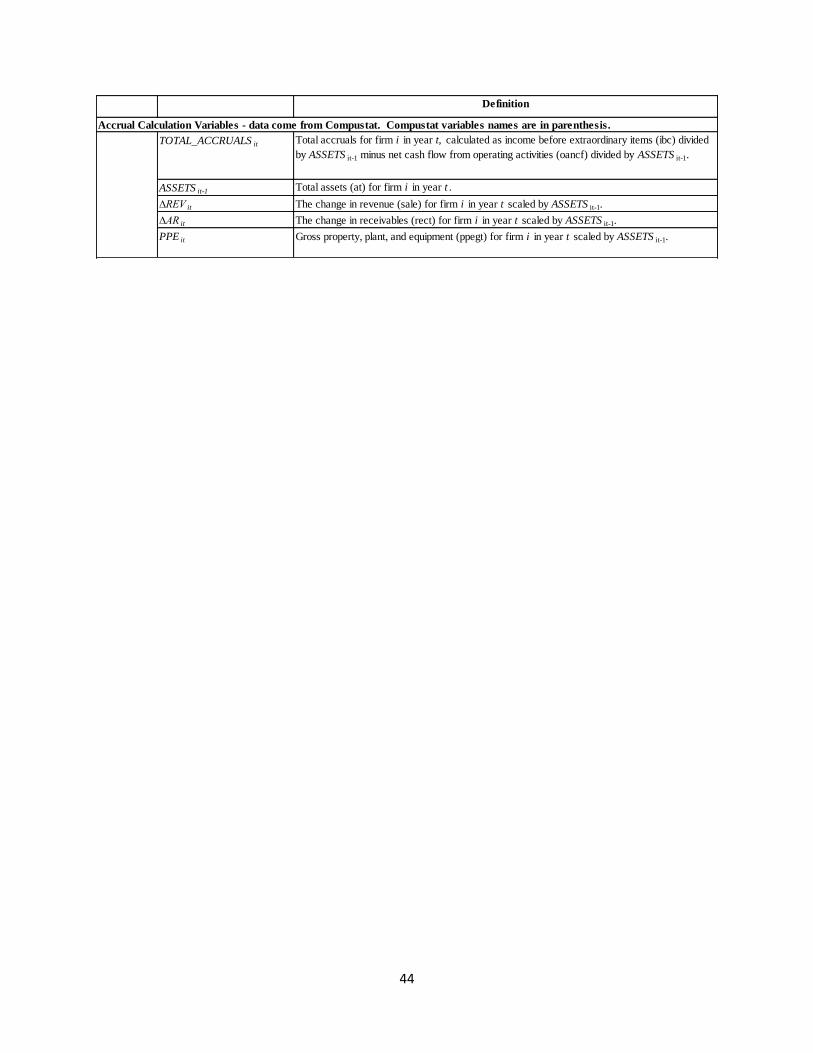
44
Definition
TOTAL_ACCRUALS it Total accruals for firm i in year t, calculated as income before extraordinary items (ibc) divided
by ASSETS it-1 minus net cash flow from operating activities (oancf) divided by ASSETS it-1.
ASSETS it-1 Total assets (at) for firm i in year t .
∆REV it The change in revenue (sale) for firm i in year t scaled by ASSETS it-1.
∆AR it The change in receivables (rect) for firm i in year t scaled by ASSETS it-1.
PPE it Gross property, plant, and equipment (ppegt) for firm i in year t scaled by ASSETS it-1.
Accrual Calculation Variables - data come from Compustat. Compustat variables names are in parenthesis.

45
Definition
AGGLOSS An indicator variable equal to one if earnings before extraordinary items (IB) in years t and t-1
sum to less than zero, and zero otherwise.
EXTREMESG An indicator variable that is equal to one if year-over-year industry-adjusted sales growth
(SALE) falls into the top quintile in year t , and zero otherwise.
RESTRUCTURING The aggregate restructuring charges (RCP * -1) in years t and t-1, scaled by the firm's year t
market capitalization (PRCC_F*CSHO).
STD_CFO Standard deviation of cash flow from operations (oancf) divided by total assets (at), where the
standard deviation is calculated using the prior five fiscal years, requiring a minimum of three
years of data.
STD_SALE Standard deviation of sales (sale) divided by total assets (at), where the standard deviation is
calculated using the prior five fiscal years, requiring a minimum of three years of data.
FORSALES An indicator that is equal to one if the firm reports foreign sales (from Compustat Segment file)
in year t, and zero otherwise.
LSEGCOUNT The natural log of the sum of the number of operating and geographic segments reported by the
Compustat Segments database for the firm in year t .
MERGER An indicator variable that is equal to one if the firm has a non-zero acquisition expense (aqp) in
years t or t-1 , and zero otherwise.
LNASSETS The natural log of total assets (at) for the firm in year t .
SHUMWAY The decile rank of the percentage probability of bankruptcy in year t from the default hazard
model prediction based on Shumway (2001). Note: higher score translates to higher probability
of bankruptcy.
BIG4 An indicator variable that is equal to one if the firm engaged one of the largest four audit firms in
year t as reported by Compustat (au). The largest four audit firms include Deloitte and Touche,
Ernst and Young, KPMG, and PricewaterhouseCoopers.
Additional Control Variables for Accrual Regressions - data come from Compustat, and CRSP. Compustat variables names are
in parenthesis.
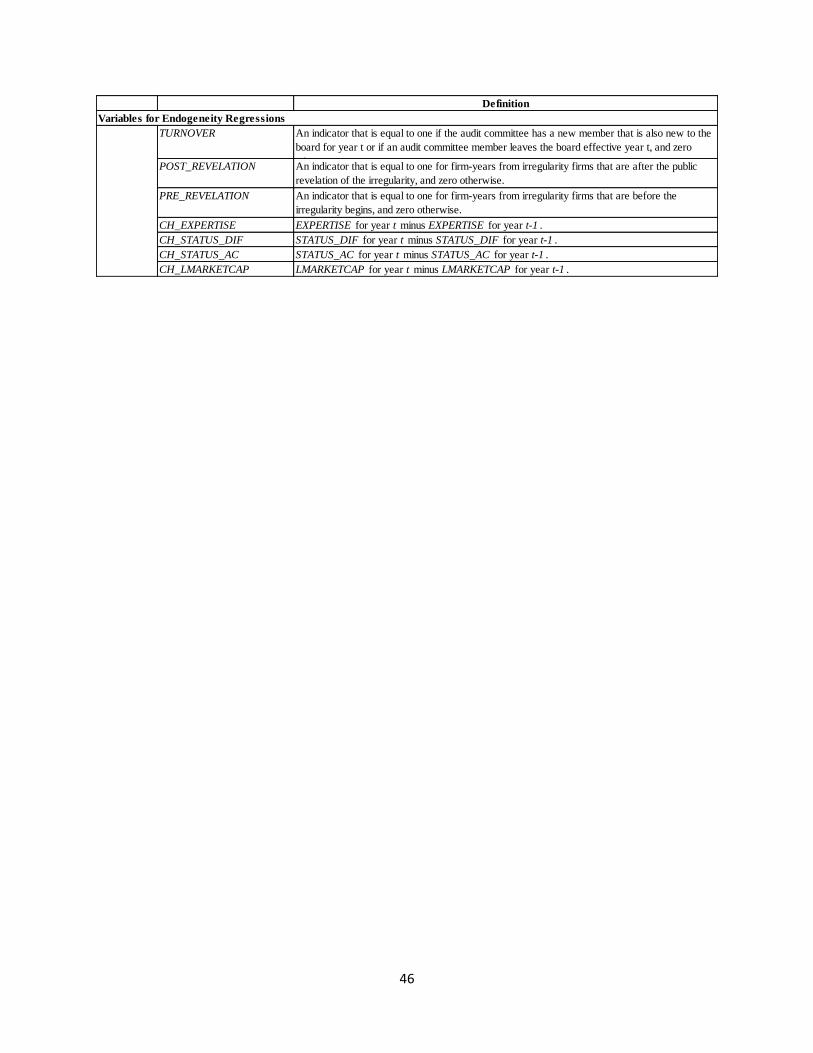
46
Definition
TURNOVER An indicator that is equal to one if the audit committee has a new member that is also new to the
board for year t or if an audit committee member leaves the board effective year t, and zero
otherwise.POST_REVELATION An indicator that is equal to one for firm-years from irregularity firms that are after the public
revelation of the irregularity, and zero otherwise.
PRE_REVELATION An indicator that is equal to one for firm-years from irregularity firms that are before the
irregularity begins, and zero otherwise.
CH_EXPERTISE EXPERTISE for year t minus EXPERTISE for year t-1 .
CH_STATUS_DIF STATUS_DIF for year t minus STATUS_DIF for year t-1 .
CH_STATUS_AC STATUS_AC for year t minus STATUS_AC for year t-1 .
CH_LMARKETCAP LMARKETCAP for year t minus LMARKETCAP for year t-1 .
Variables for Endogeneity Regressions

47
Appendix B: List of Elite Institutions
Amherst College
Brown University
Carleton College
Columbia University
Cornell University
Dartmouth College
Grinnell College
Harvard University
Haverford College
John Hopkins University
Massachusetts Institute of Technology
New York University
Northwestern University
Oberlin College
Pomona College
Princeton University
Stanford University
Swarthmore College
United States Military Academy
United States Naval Academy
University of California, Berkeley
University of California, Los Angeles
University of Chicago
University of Michigan
University of Pennsylvania
Wellesley College
Wesleyan University
Williams College
Yale University
Using the US News and World Report Rankings from 1991 through 2011, we added Universities
that achieved a top 25 ranking for Top Universities for more than one year. The following four
universities fall into this category.
Following Useem and Karable (1986) and Finkelstein (1992) the following institutions are
considered elite educational institutions:
Emory University
Duke University
Washington University in St Louis
California Institute of Technology

48
Appendix C: BoardEx Expertise Search Terms
Accounting Supervisory Finance
Chief Financial Officer Chief Executive Officer Banker
Accounting Officer President Analyst
Chief Accountant Chief Operating Officer Loan Officer
Controller Investment Manager
Certified Public Accountant Fund Manager
Chartered Accountant Asset Manager
Financial Officer Treasurer
Head of Accounting Finance Director
Vice President of Accounting Manager Finance
Vice President Finance
Also:
Employment at one of the 25
current and historical Audit Firms
listed in Compustat
* Note: As BoardEx allows considerable variation in titles and roles, we scanned a complete
list of distinct titles to also include various prefixes, suffixes, and abbreviations for these titles
as well as discernable misspellings. We code each search term independent of spacing,
punctuation or case.

49
Figure 1: Model (1) Interaction Effects
As is described in Norton et al. (2004), this figure diplays the z-statistics for the interaction of EXPERTISE and
STATUS_DIF from model (3). This provides a graphical analysis of the interactive effect for each observation. The
average effects are displayed in Table 4, Panel A.
-5
0
5
10
z-s
tatistic
0 .1 .2 .3 .4Predicted Probability that y = 1
z-statistics of Interaction Effects after Logit

50
Figure 2: Model (2) Interaction Effects
As is described in Norton et al. (2004), this figure diplays the z-statistics for the interaction of EXPERTISE and
STATUS_DIF from model (3) when we also control for EINDEX. This provides a graphical analysis of the
interactive effect for each observation. The average effects are displayed in Table 4, Panel A.
-5
0
5
10
z-s
tatistic
0 .2 .4 .6Predicted Probability that y = 1
z-statistics of Interaction Effects after Logit

Table 1, Panel A: Board of Director Variables of Interest by Year
This panel provides descriptive statistics regarding board composition and accounting irregularities by year. Variable
defintions are provided in Appendix A.
Year No. of Obs. No. of Irregularities STATUS_AC STATUS_DIF STATUS_DIF_NAC
2001 1775 125 0.159 0.208 0.176
2002 1858 126 0.154 0.218 0.182
2003 3452 155 0.114 0.180 0.131
2004 4229 143 0.099 0.163 0.133
2005 4542 116 0.098 0.166 0.130
2006 4553 66 0.095 0.157 0.144
2007 4484 58 0.086 0.145 0.148
2008 4181 24 0.082 0.136 0.137
Year No. of Obs. EXPERTISE SOXACC SOXSUPER SOXFIN
2001 1775 0.487 0.185 0.299 0.213
2002 1858 0.511 0.202 0.306 0.231
2003 3452 0.511 0.244 0.275 0.251
2004 4229 0.533 0.278 0.274 0.270
2005 4542 0.556 0.304 0.274 0.292
2006 4553 0.572 0.324 0.280 0.307
2007 4484 0.586 0.336 0.285 0.320
2008 4181 0.595 0.346 0.285 0.331
Year No. of Obs. SOXACC_DUM SOXSUPER_DUM SOXFIN_DUM NUM_AC
2001 1775 0.530 0.677 0.566 3.878
2002 1858 0.580 0.691 0.608 3.969
2003 3452 0.659 0.636 0.645 3.834
2004 4229 0.725 0.633 0.681 3.796
2005 4542 0.763 0.633 0.710 3.771
2006 4553 0.790 0.634 0.724 3.767
2007 4484 0.804 0.634 0.742 3.737
2008 4181 0.815 0.634 0.756 3.761
Year No. of Obs. NUM_BRD BRD_PCT_IND CEOISCHAIR INSTITUTIONAL_OWN
2001 1775 12.519 0.579 0.655 0.367
2002 1858 12.515 0.579 0.651 0.399
2003 3452 10.479 0.662 0.582 0.321
2004 4229 10.056 0.689 0.559 0.341
2005 4542 9.894 0.703 0.524 0.356
2006 4553 9.843 0.714 0.499 0.392
2007 4484 9.718 0.719 0.489 0.426
2008 4181 9.751 0.724 0.482 0.422

Table 1, Panel B: Descriptive Statistics
This panel provides descriptive statistics. We obtain an irregularity sample made up of (1) violation years from SEC and
Department of Justice enforcement actions that establish intent under Section 17(a) of the Securities Act of 1933, or either
Section 10(b) (including Rule 10b-5) or 13(b)(5) of the Securities Exchange Act of 1934 per the Federal Securities
Regulation Database and (2) class period years related to settled securities class-action lawsuits that allege violations of
Generally Accepted Accounting Principles per RiskMetrics. We obtain audit committee expertise and status measures from
BoardEx from 2001 through 2008. *, **, and *** represent two-tailed statistical significance at the 10%, 5%, and 1%
levels, respectively. Variable defintions are provided in Appendix A.
Mean Std Dev Median Mean Std Dev Median Mean Median
Expertise Variables
EXPERTISE 0.575 0.265 0.667 0.552 0.283 0.600 0.022 ** 0.067 **
SOXACC 0.271 0.225 0.250 0.294 0.235 0.333 -0.023 *** -0.083 **
SOXSUPER 0.333 0.266 0.333 0.281 0.266 0.250 0.053 *** 0.083 ***
SOXFIN 0.286 0.239 0.333 0.288 0.248 0.286 -0.002 0.048
SOXACC_DUM 0.710 0.454 1.000 0.738 0.440 1.000 -0.028 * 0.000 *
SOXSUPER_DUM 0.727 0.446 1.000 0.638 0.481 1.000 0.089 *** 0.000 ***
SOXFIN_DUM 0.700 0.459 1.000 0.696 0.460 1.000 0.004 0.000
Status Variables
STATUS_AC 0.178 0.383 0.000 0.101 0.301 0.000 0.078 *** 0.000 ***
STATUS_DIF 0.213 0.410 0.000 0.163 0.369 0.000 0.050 *** 0.000 ***
STATUS_DIF_NAC 0.151 0.359 0.000 0.142 0.349 0.000 0.009 0.000
Control Variables
NUM_AC 3.843 1.117 4.000 3.793 1.076 4.000 0.050 0.000
NUM_BRD 11.533 3.843 11.000 10.222 3.664 10.000 1.310 *** 1.000 ***
BRD_PCT_IND 0.623 0.133 0.615 0.689 0.139 0.667 -0.067 *** -0.051 ***
CEOISCHAIR 0.624 0.471 1.000 0.534 0.490 1.000 0.089 *** 0.000 ***
INSTITUTIONAL_OWN 0.398 0.364 0.408 0.378 0.346 0.332 0.020 0.076
LMARKETCAP 7.391 1.777 7.283 6.167 1.913 6.133 1.223 *** 1.150 ***
BM 0.477 0.479 0.389 0.571 0.638 0.471 -0.095 *** -0.082 ***
LEVERAGE 0.231 0.211 0.197 0.211 0.215 0.160 0.020 *** 0.037 ***
ISSUE 0.373 0.484 0.000 0.350 0.477 0.000 0.023 0.000
ROA -0.009 0.211 0.025 -0.042 0.638 0.022 0.033 *** 0.002
EINDEX 2.105 1.286 2.000 2.546 1.266 3.000 -0.441 *** -1.000 ***
IRREGULARITY = 1 (n=813) IRREGULARITY = 0 (n=28,261) Differences
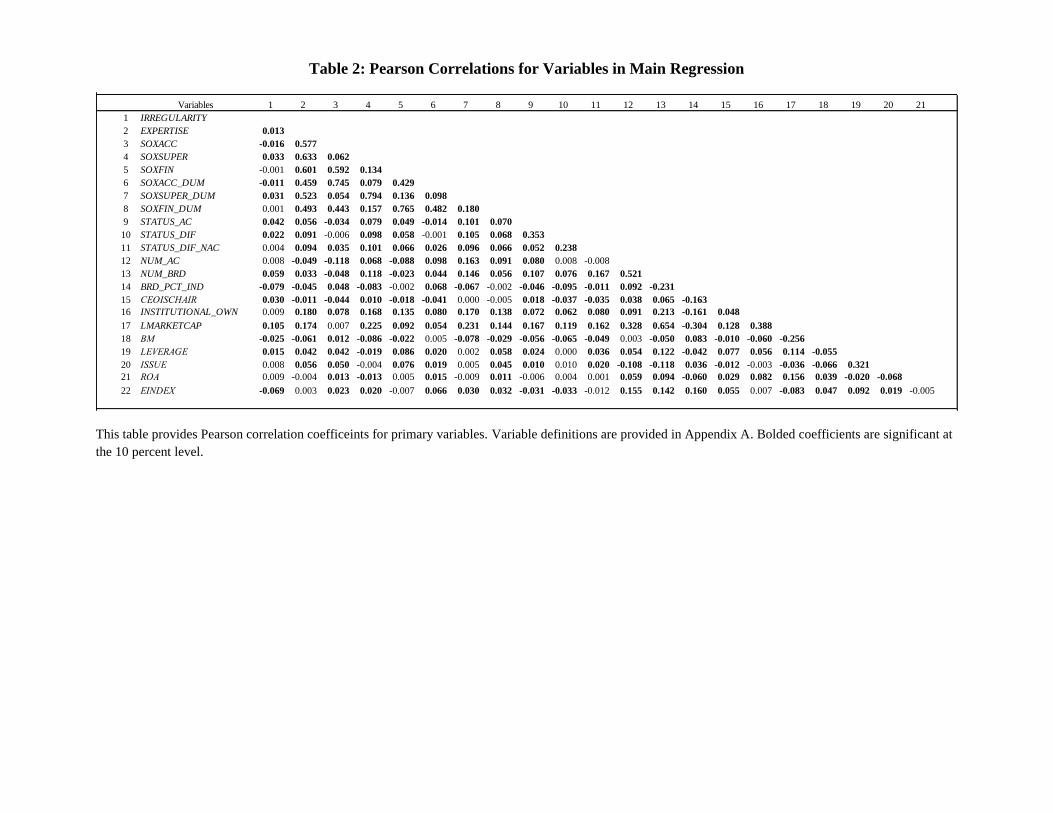
Table 2: Pearson Correlations for Variables in Main Regression
This table provides Pearson correlation coefficeints for primary variables. Variable definitions are provided in Appendix A. Bolded coefficients are significant at
the 10 percent level.
Variables 1 2 3 4 5 6 7 8 9 10 11 12 13 14 15 16 17 18 19 20 21
1 IRREGULARITY
2 EXPERTISE 0.013
3 SOXACC -0.016 0.577
4 SOXSUPER 0.033 0.633 0.062
5 SOXFIN -0.001 0.601 0.592 0.134
6 SOXACC_DUM -0.011 0.459 0.745 0.079 0.429
7 SOXSUPER_DUM 0.031 0.523 0.054 0.794 0.136 0.098
8 SOXFIN_DUM 0.001 0.493 0.443 0.157 0.765 0.482 0.180
9 STATUS_AC 0.042 0.056 -0.034 0.079 0.049 -0.014 0.101 0.070
10 STATUS_DIF 0.022 0.091 -0.006 0.098 0.058 -0.001 0.105 0.068 0.353
11 STATUS_DIF_NAC 0.004 0.094 0.035 0.101 0.066 0.026 0.096 0.066 0.052 0.238
12 NUM_AC 0.008 -0.049 -0.118 0.068 -0.088 0.098 0.163 0.091 0.080 0.008 -0.008
13 NUM_BRD 0.059 0.033 -0.048 0.118 -0.023 0.044 0.146 0.056 0.107 0.076 0.167 0.521
14 BRD_PCT_IND -0.079 -0.045 0.048 -0.083 -0.002 0.068 -0.067 -0.002 -0.046 -0.095 -0.011 0.092 -0.231
15 CEOISCHAIR 0.030 -0.011 -0.044 0.010 -0.018 -0.041 0.000 -0.005 0.018 -0.037 -0.035 0.038 0.065 -0.163
16 INSTITUTIONAL_OWN 0.009 0.180 0.078 0.168 0.135 0.080 0.170 0.138 0.072 0.062 0.080 0.091 0.213 -0.161 0.048
17 LMARKETCAP 0.105 0.174 0.007 0.225 0.092 0.054 0.231 0.144 0.167 0.119 0.162 0.328 0.654 -0.304 0.128 0.388
18 BM -0.025 -0.061 0.012 -0.086 -0.022 0.005 -0.078 -0.029 -0.056 -0.065 -0.049 0.003 -0.050 0.083 -0.010 -0.060 -0.256
19 LEVERAGE 0.015 0.042 0.042 -0.019 0.086 0.020 0.002 0.058 0.024 0.000 0.036 0.054 0.122 -0.042 0.077 0.056 0.114 -0.055
20 ISSUE 0.008 0.056 0.050 -0.004 0.076 0.019 0.005 0.045 0.010 0.010 0.020 -0.108 -0.118 0.036 -0.012 -0.003 -0.036 -0.066 0.321
21 ROA 0.009 -0.004 0.013 -0.013 0.005 0.015 -0.009 0.011 -0.006 0.004 0.001 0.059 0.094 -0.060 0.029 0.082 0.156 0.039 -0.020 -0.068
22 EINDEX -0.069 0.003 0.023 0.020 -0.007 0.066 0.030 0.032 -0.031 -0.033 -0.012 0.155 0.142 0.160 0.055 0.007 -0.083 0.047 0.092 0.019 -0.005

Table 3, Panel A: Effect of Audit Committee Expertise on Audit Committee Status
This table reports the results of a logistic regression examining the effect of audit committee expertise on the
likelihood of high audit committee status based on the following model:
Prob(STATUS_ACt = 1) = F(β1EXPERTISEt + β’(CONTROLS))
EXPERTISE 0.2355 * -0.1425
(0.134) (0.213)
SOXACC -1.1765 *** -1.1607 ***
(0.203) (0.307)
SOXSUPER 0.1879 -0.1870
(0.135) (0.207)
SOXFIN 1.1811 *** 1.0333 ***
(0.169) (0.261)
SOXACC_DUM -0.4407 *** -0.5119 ***
(0.087) (0.121)
SOXSUPER_DUM 0.3520 *** 0.1338
(0.085) (0.135)
SOXFIN_DUM 0.5704 *** 0.5537 ***
(0.090) (0.130)
STATUS_EXEC 0.3488 *** 0.4025 *** 0.3098 *** 0.3427 ** 0.3140 *** 0.3596 ***
(0.109) (0.137) (0.109) (0.139) (0.109) (0.138)
STATUS_NAC 0.4701 *** 0.3093 *** 0.4442 *** 0.3032 *** 0.4375 *** 0.2810 ***
(0.074) (0.107) (0.074) (0.108) (0.074) (0.107)
NUM_AC 0.1721 *** 0.1572 *** 0.1660 *** 0.1535 *** 0.1403 *** 0.1455 ***
(0.031) (0.043) (0.031) (0.044) (0.031) (0.044)
NUM_BRD -0.0283 * -0.0325 -0.0235 -0.0254 -0.0236 -0.0251
(0.015) (0.025) (0.015) (0.025) (0.015) (0.025)
BRD_PCT_IND 0.1409 -0.0690 0.1621 -0.0948 0.1637 -0.1404
(0.292) (0.600) (0.293) (0.607) (0.292) (0.609)
CEOISCHAIR -0.0418 0.0137 -0.0508 0.0152 -0.0444 0.0030
(0.070) (0.107) (0.070) (0.107) (0.070) (0.107)
INSTITUTIONAL_OWN 0.1610 -0.0079 0.1396 -0.0184 0.1293 -0.0290
(0.114) (0.168) (0.114) (0.167) (0.113) (0.166)
LMARKETCAP 0.2732 *** 0.2568 *** 0.2655 *** 0.2498 *** 0.2551 *** 0.2395 ***
(0.027) (0.049) (0.028) (0.049) (0.027) (0.048)
BM -0.0250 0.0014 -0.0274 -0.0039 -0.0366 -0.0069
(0.065) (0.114) (0.066) (0.113) (0.065) (0.115)
LEVERAGE 0.2599 0.7612 *** 0.2415 0.6688 ** 0.2600 0.7166 **
(0.173) (0.288) (0.173) (0.288) (0.172) (0.288)
ISSUE 0.1226 ** 0.0335 0.1160 ** 0.0394 0.1132 ** 0.0351
(0.055) (0.089) (0.055) (0.089) (0.055) (0.090)
ROA -0.0673 -0.4194 -0.0628 -0.4061 -0.0613 -0.3784
(0.049) (0.355) (0.042) 0.406 (0.042) (0.345)
EINDEX -0.0179 -0.0128 -0.0165
(0.045) (0.045) (0.045)
Year Fixed Effects? Yes Yes Yes Yes Yes Yes
Industry Fixed Effects? Yes Yes Yes Yes Yes Yes
Obs. where STATUS_AC =1 2,988 1,396 2,988 1,396 2,988 1,396
Total Obs. 29,074 9,633 29,074 9,633 29,074 9,633
Pseudo R2
0.10 0.07 0.11 0.08 0.11 0.08
(6)
Logistic Regressions, Dependent Variable is STATUS_AC
Independent Variables (1) (3) (5)(2) (4)
55
STATUS_AC is an indicator variable that is set to one when the audit committee has high status, and zero otherwise.
Columns one and two include EXPERTISE, which includes accounting, supervisory, and finance expertise. Columns
three and four include SOXACC, SOXSUPER, and SOXFIN, which measure the percent of the audit committee with
accounting, supervisory, and finance expertise, respectively. Columns five and six include SOXACC_DUM,
SOXSUPER_DUM, and SOXFIN_DUM, which measure the presence of accounting, supervisory, and finance
expertise, respectively, on the audit committee. Columns two, four, and six include EINDEX as an additional
control, which reduces the sample size.
Variable defintions are provided in Appendix A. Standard errors clustered by firm in parentheses. Pseudo R-Square
is the max re-scaled r-square from SAS (also known as Cragg & Uhler's pseudo r-square). *, **, and *** represent
two-tailed statistical significance at the 10%, 5%, and 1% levels, respectively.

56
Table 3, Panel B: Effect of Audit Committee Expertise on Relative Audit Committee Status
This table reports the results of a logistic regression examining the effect of audit committee expertise on the
likelihood of high relative audit committee status compared to management status based on the following model:
Prob(STATUS_DIFt = 1) = F(β1EXPERTISEt + β’(CONTROLS))
STATUS_DIF is an indicator variable that is set to one when relative audit committee status is high, and zero
otherwise. Columns one and two include EXPERTISE, which includes accounting, supervisory, and fiance expertise.
EXPERTISE 0.5068 *** 0.3520 **
(0.106) (0.175)
SOXACC -0.6768 *** -0.7612 ***
(0.161) (0.264)
SOXSUPER 0.3514 *** 0.1834
(0.112) (0.176)
SOXFIN 0.7970 *** 0.7884 ***
(0.145) (0.235)
SOXACC_DUM -0.2609 *** -0.3143 ***
(0.075) (0.117)
SOXSUPER_DUM 0.3055 *** 0.1352
(0.066) (0.110)
SOXFIN_DUM 0.3846 *** 0.3698 ***
(0.077) (0.122)
STATUS_DIF_NAC 1.3041 *** 1.2116 *** 1.2995 *** 1.2172 *** 1.2923 *** 1.2104 ***
(0.060) (0.088) (0.060) (0.088) (0.060) (0.088)
NUM_AC 0.0859 *** 0.0949 ** 0.0721 ** 0.0808 ** 0.0487 * 0.0747 *
(0.028) (0.039) (0.028) (0.040) (0.028) (0.040)
NUM_BRD -0.0187 -0.0016 -0.0160 0.0043 -0.0157 0.0039
(0.012) (0.019) (0.012) (0.019) (0.012) (0.019)
BRD_PCT_IND -1.4076 *** -2.2410 *** -1.3978 *** -2.2457 *** -1.3890 *** -2.2237 ***
(0.234) (0.445) (0.234) (0.444) (0.234) (0.444)
CEOISCHAIR -0.2914 *** -0.1781 * -0.2959 *** -0.1783 * -0.2907 *** -0.1814 **
(0.058) (0.091) (0.058) (0.091) (0.058) (0.091)
INSTITUTIONAL_OWN 0.0903 0.0765 0.0862 0.0832 0.0789 0.0839
(0.093) (0.139) (0.093) (0.139) (0.093) (0.138)
LMARKETCAP 0.1123 *** 0.0107 0.1085 *** 0.0036 0.1059 *** 0.0057
(0.021) (0.037) (0.022) (0.037) (0.022) (0.037)
BM -0.0865 * -0.1515 * -0.0882 * -0.1572 * -0.0934 * -0.1608 *
(0.052) (0.091) (0.052) (0.090) (0.052) (0.091)
LEVERAGE -0.0001 0.3223 0.0001 0.2757 0.0084 0.3127
(0.144) (0.253) (0.144) (0.252) (0.143) (0.254)
ISSUE 0.0705 0.0323 0.0718 0.0401 0.0684 0.0339
(0.046) (0.081) (0.046) (0.081) (0.046) (0.081)
ROA -0.0133 -0.1293 -0.0089 -0.1054 -0.0086 -0.1014
(0.020) (0.233) (0.021) 0.105 (0.021) (0.236)
EINDEX -0.0191 -0.0145 -0.0170
(0.038) (0.038) (0.039)
Year Fixed Effects? Yes Yes Yes Yes Yes Yes
Industry Fixed Effects? Yes Yes Yes Yes Yes Yes
Obs. where STATUS_DIF =1 4,771 1,983 4,771 1,983 4,771 1,983
Total Obs. 29,074 9,633 29,074 9,633 29,074 9,633
Pseudo R2
0.13 0.10 0.13 0.11 0.14 0.11
Logistic Regressions, Dependent Variable is STATUS_DIF
Independent Variables (1) (2) (3) (4) (5) (6)
57
Columns three and four include SOXACC, SOXSUPER, and SOXFIN, which measure the percent of the audit
committee with accounting, supervisory, and finance expertise, respectively. Columns five and six include
SOXACC_DUM, SOXSUPER_DUM, and SOXFIN_DUM, which measure the presence of accounting, supervisory,
and finance expertise, respectively, on the audit committee. Columns two, four, and six include EINDEX as an
additional control, which reduces the sample size.
Variable defintions are provided in Appendix A. Standard errors clustered by firm in parentheses. Pseudo R-Square
is the max re-scaled r-square from SAS (also known as Cragg & Uhler's pseudo r-square). *, **, and *** represent
two-tailed statistical significance at the 10%, 5%, and 1% levels, respectively.

58
Table 4, Panel A: Effect of the Interaction of Audit Committee Expertise and Relative
Audit Committee Status on Irregularities
This table reports the results of a logistic regression examining the effect of the interaction of audit committee
financial expertise and relative audit committee status on the likelihood of an irregularity based on the following
model:
Prob(IRREGULARITYt = 1) = F(β1EXPERTISEt + β2 EXPERTISEt *STATUS_DIFt + β3STATUS_DIFt +
β’(CONTROLS))
EXPERTISE 0.0067 0.4145 0.2001 0.7812 *
(0.237) (0.384) (0.249) (0.411)
EXPERTISE*STATUS_DIF -0.9929 * -1.7906 ***
(0.514) (0.655)
STATUS_DIF 0.0877 0.0172 0.6645 * 1.0748 **
(0.136) (0.180) (0.344) (0.435)
STATUS_DIF_NAC -0.2522 * -0.3408 * -0.2547 * -0.3461 *
(0.151) (0.199) (0.151) (0.197)
NUM_AC -0.0569 -0.0331 -0.0584 -0.0383
(0.059) (0.078) (0.059) (0.077)
NUM_BRD -0.0262 0.0144 -0.0251 0.0161
(0.028) (0.037) (0.028) (0.037)
BRD_PCT_IND -0.9464 * -0.3612 -0.9273 * -0.2941
(0.535) (1.003) (0.532) (0.991)
CEOISCHAIR 0.1071 0.0549 0.1093 0.0762
(0.131) (0.186) (0.130) (0.185)
INSTITUTIONAL_OWN -0.2859 -0.5304 * -0.2973 -0.5505 *
(0.211) (0.307) (0.211) (0.306)
LMARKETCAP 0.4076 *** 0.3380 *** 0.4060 *** 0.3361 ***
(0.047) (0.076) (0.047) (0.076)
BM 0.3279 *** 0.4655 *** 0.3250 *** 0.4636 ***
(0.111) (0.158) (0.112) (0.161)
LEVERAGE 0.6704 ** 1.3245 *** 0.6660 ** 1.3149 ***
(0.294) (0.429) (0.294) (0.429)
ISSUE 0.2428 ** 0.0919 0.2408 ** 0.0939
(0.099) (0.149) (0.099) (0.149)
ROA -0.0213 -0.2117 -0.0206 -0.1850
(0.049) (0.339) (0.052) (0.344)
EINDEX -0.1820 ** -0.1869 **
(0.074) (0.074)
Year Fixed Effects? Yes Yes Yes Yes
Industry Fixed Effects? Yes Yes Yes Yes
Obs. where IRREGULARITY=1 813 400 813 400
Total Obs. 29,074 9,633 29,074 9,633
Pseudo R2
0.14 0.15 0.14 0.16
Logistic Regressions, Dependent Variable is IRREGULARITY
Independent Variables (1) (2) (3) (4)
59
We obtain an irregularity sample made up of (1) violation years from SEC and Department of Justice enforcement
actions that establish intent under Section 17(a) of the Securities Act of 1933, or either Section 10(b) (including Rule
10b-5) or 13(b)(5) of the Securities Exchange Act of 1934 per the Federal Securities Regulation Database and (2)
class period years related to settled securities class-action lawsuits that allege violations of Generally Accepted
Accounting Principles per RiskMetrics. Columns two and four include EINDEX as an additional control, which
reduces the sample size.
Variable defintions are provided in Appendix A. Standard errors clustered by firm in parentheses. Pseudo R-Square
is the max re-scaled r-square from SAS (also known as Cragg & Uhler's pseudo r-square). *, **, and *** represent
two-tailed statistical significance at the 10%, 5%, and 1% levels, respectively.

60
Table 4, Panel B: Effect of the Interaction of Audit Committee Expertise and Relative
Audit Committee Status on Abnormal Accruals
EXPERTISE -0.0170 *** -0.0167 *** -0.0130 *** -0.0125 **
(0.005) (0.005) (0.005) (0.005)
EXPERTISE*STATUS_DIF -0.0301 *** -0.0261 **
(0.011) (0.012)
STATUS_DIF -0.0021 0.0023 0.0164 ** 0.0188 **
(0.003) (0.003) (0.007) (0.009)
STATUS_DIF_NAC 0.0019 -0.0009 0.0020 -0.0009
(0.003) (0.003) (0.003) (0.003)
NUM_AC 0.0014 0.0004 0.0014 0.0004
(0.001) (0.001) (0.001) (0.001)
NUM_BRD 0.0000 0.0004 0.0000 0.0004
(0.001) (0.001) (0.001) (0.001)
BRD_PCT_IND 0.0151 0.0218 0.0150 0.0219
(0.010) (0.014) (0.010) (0.014)
CEOISCHAIR 0.0047 * 0.0040 0.0046 * 0.0041
(0.003) (0.003) (0.003) (0.003)
INSTITUTIONAL_OWN -0.0186 *** -0.0119 *** -0.0187 *** -0.0120 ***
(0.003) (0.004) (0.003) (0.004)
STD_CFO -0.0192 0.0316 -0.0190 0.0299
(0.046) (0.066) (0.046) (0.067)
STD_SALE 0.0058 -0.0242 0.0057 -0.0248
(0.008) (0.019) (0.008) (0.019)
FORSALES 0.0019 0.0047 0.0019 0.0048
(0.004) (0.004) (0.004) (0.004)
LSEGCOUNT 0.0043 0.0020 0.0043 0.0019
(0.003) (0.003) (0.003) (0.003)
EXTREMESG 0.0069 -0.0010 0.0070 -0.0010
(0.004) (0.005) (0.004) (0.005)
MERGER -0.0099 * -0.0024 -0.0100 * -0.0024
(0.006) (0.006) (0.006) (0.006)
RESTRUCTURING -0.0046 0.0159 -0.0042 0.0161
(0.023) (0.022) (0.023) (0.022)
LNASSETS -0.0123 *** -0.0028 * -0.0123 *** -0.0029 *
(0.001) (0.002) (0.001) (0.002)
AGGLOSS -0.0538 *** -0.0027 -0.0539 *** -0.0027
(0.007) (0.004) (0.007) (0.004)
SHUMWAY -0.0065 *** 0.0023 *** -0.0065 *** 0.0023 ***
(0.001) (0.001) (0.001) (0.001)
BIG4 -0.0034 -0.0013 -0.0038 -0.0018
(0.004) (0.006) (0.004) (0.006)
LEVERAGE 0.0714 *** 0.0350 *** 0.0716 *** 0.0351 ***
(0.012) (0.011) (0.012) (0.011)
BM 0.0126 *** 0.0133 *** 0.0126 *** 0.0133 ***
(0.002) (0.004) (0.002) (0.004)
ROA 0.0958 *** 0.3625 *** 0.0957 *** 0.3627 ***
(0.036) (0.018) (0.036) (0.018)
EINDEX -0.0005 -0.0005
(0.001) (0.001)
Year Fixed Effects? Yes Yes Yes Yes
Industry Fixed Effects? Yes Yes Yes Yes
Total Obs. 21,031 7,768 21,031 7,768
R2
0.12 0.26 0.12 0.26
Independent Variables (1) (3) (4)(2)
OLS Regressions, Dependent Variable is ABN_ACC

61
This table reports the results of a ordinary least squares regression examining the effect of the interaction of audit
committee financial expertise and relative audit committee status on signed abnormal accruals. The model is:
ABN_ACCt = β0+ β1EXPERTISEt + β2 EXPERTISEt *STATUS_DIFt + β3STATUS_DIFt +
β’(CONTROLS) + ε
We calculate abnormal accruals using the modified-Jones model with an intercept. Columns two and four include
EINDEX as an additional control, which reduces the sample size.
Variable defintions are provided in Appendix A. Standard errors clustered by firm in parentheses. *, **, and ***
represent two-tailed statistical significance at the 10%, 5%, and 1% levels, respectively.
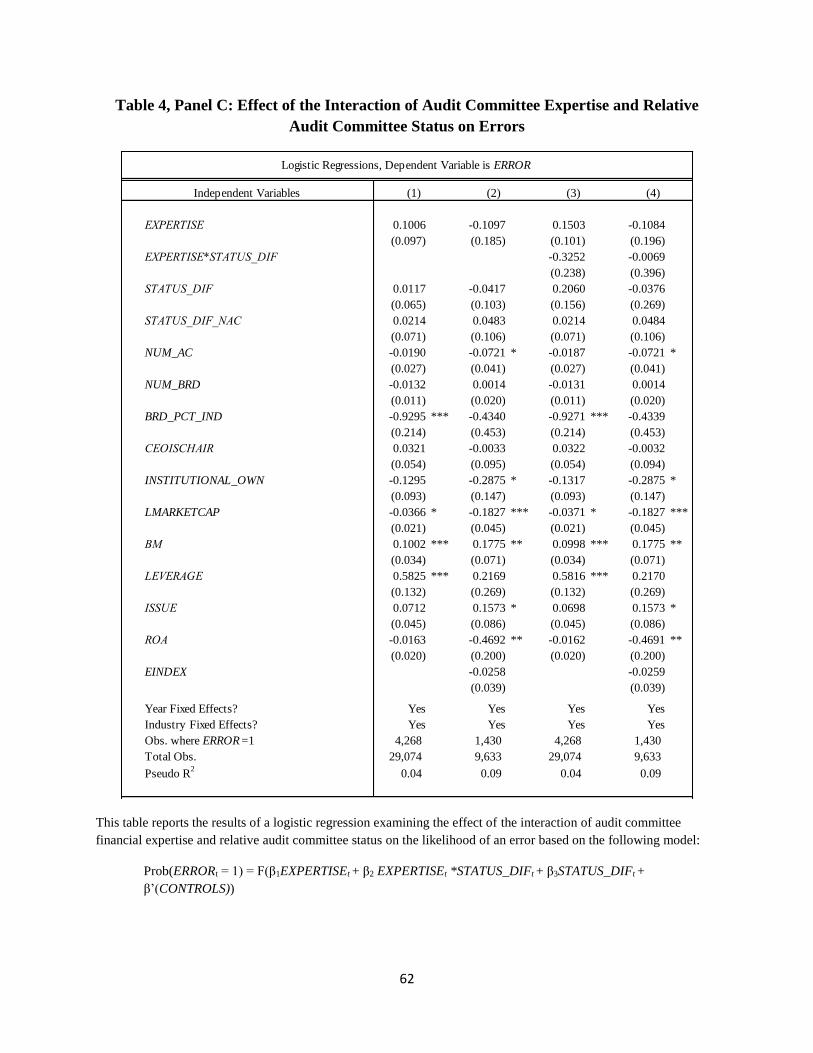
62
Table 4, Panel C: Effect of the Interaction of Audit Committee Expertise and Relative
Audit Committee Status on Errors
This table reports the results of a logistic regression examining the effect of the interaction of audit committee
financial expertise and relative audit committee status on the likelihood of an error based on the following model:
Prob(ERRORt = 1) = F(β1EXPERTISEt + β2 EXPERTISEt *STATUS_DIFt + β3STATUS_DIFt +
β’(CONTROLS))
EXPERTISE 0.1006 -0.1097 0.1503 -0.1084
(0.097) (0.185) (0.101) (0.196)
EXPERTISE*STATUS_DIF -0.3252 -0.0069
(0.238) (0.396)
STATUS_DIF 0.0117 -0.0417 0.2060 -0.0376
(0.065) (0.103) (0.156) (0.269)
STATUS_DIF_NAC 0.0214 0.0483 0.0214 0.0484
(0.071) (0.106) (0.071) (0.106)
NUM_AC -0.0190 -0.0721 * -0.0187 -0.0721 *
(0.027) (0.041) (0.027) (0.041)
NUM_BRD -0.0132 0.0014 -0.0131 0.0014
(0.011) (0.020) (0.011) (0.020)
BRD_PCT_IND -0.9295 *** -0.4340 -0.9271 *** -0.4339
(0.214) (0.453) (0.214) (0.453)
CEOISCHAIR 0.0321 -0.0033 0.0322 -0.0032
(0.054) (0.095) (0.054) (0.094)
INSTITUTIONAL_OWN -0.1295 -0.2875 * -0.1317 -0.2875 *
(0.093) (0.147) (0.093) (0.147)
LMARKETCAP -0.0366 * -0.1827 *** -0.0371 * -0.1827 ***
(0.021) (0.045) (0.021) (0.045)
BM 0.1002 *** 0.1775 ** 0.0998 *** 0.1775 **
(0.034) (0.071) (0.034) (0.071)
LEVERAGE 0.5825 *** 0.2169 0.5816 *** 0.2170
(0.132) (0.269) (0.132) (0.269)
ISSUE 0.0712 0.1573 * 0.0698 0.1573 *
(0.045) (0.086) (0.045) (0.086)
ROA -0.0163 -0.4692 ** -0.0162 -0.4691 **
(0.020) (0.200) (0.020) (0.200)
EINDEX -0.0258 -0.0259
(0.039) (0.039)
Year Fixed Effects? Yes Yes Yes Yes
Industry Fixed Effects? Yes Yes Yes Yes
Obs. where ERROR =1 4,268 1,430 4,268 1,430
Total Obs. 29,074 9,633 29,074 9,633
Pseudo R2
0.04 0.09 0.04 0.09
Logistic Regressions, Dependent Variable is ERROR
Independent Variables (1) (2) (3) (4)

63
ERROR is an indicator variable equal to one for mistated years when the associated restatement is not considered an
irregularity (i.e., when IRREGULARITY=0). Columns two and four include EINDEX as an additional control,
which reduces the sample size.
Variable defintions are provided in Appendix A. Standard errors clustered by firm in parentheses. Pseudo R-Square
is the max re-scaled r-square from SAS (also known as Cragg & Uhler's pseudo r-square). *, **, and *** represent
two-tailed statistical significance at the 10%, 5%, and 1% levels, respectively.

64
Table 5, Panel A: Descriptives for Irregularity Firms
This panel provides descriptive statistics related to firm-years from firms that had an irregularity during the sample
period. We obtain an irregularity sample made up of (1) violation years from SEC and Department of Justice
enforcement actions that establish intent under Section 17(a) of the Securities Act of 1933, or either Section 10(b)
(including Rule 10b-5) or 13(b)(5) of the Securities Exchange Act of 1934 per the Federal Securities Regulation
Database and (2) class period years related to settled securities class-action lawsuits that allege violations of
Generally Accepted Accounting Principles per RiskMetrics. The first row captures firm-years where either there is
an audit committee member who is new to the board for year t or an audit committee member that left the board
effective year t. The second row captures firm-years where there is an audit committee member who is new to the
board for year t. The third row captures firm-years where there is an audit committee member that left the board
effective year t. Variable defintions are provided in Appendix A.
Pre-irregularity years Irregularity years Post-irregularity years
With turnover events 56 124 176
With AC members that are also new to the board 33 77 121
With AC members who left the board 38 76 114
Mean EXPERTISE 0.5363 0.6132 0.6612
Mean STATUS_AC 0.1704 0.1633 0.1380
Mean STATUS_DIF 0.2148 0.2245 0.1864
Mean EXPERTISE*STATUS_DIF 0.1207 0.1353 0.1308
Mean LMARKETCAP 7.5235 7.4060 7.1914
Irregularity Firms

65
Table 5, Panel B: Effect of Irregularity Commencement on the Change in Audit Committee
Expertise, Status, and Relative Status
Using firm-years from irregularity firms, this table reports the results of a logistic regression examining how
changes in audit committee status, audit committee expertise, and relative audit committee status are associated with
audit committee turnover events and how these relations differ pre- and post-irregularity commencement. The model
is:
Prob(TURNOVERt = 1) = F(β1PRE_IRREGULARITYt + β2CH_EXPERTISEt +
β3PRE_IRREGULARITYt*CH_EXPERTISEt + β4CH_STATUS_DIFt +
β5PRE_IRREGULARITYt*CH_STATUS_DIFt + β6CH_EXPERTISEt *CH_STATUS_DIFt +
β7PRE_IRREGULARITYt*CH_EXPERTISEt*CH_STATUS_DIFt + β8CH_STATUS_ACt +
β9PRE_IRREGULARITYt*CH_STATUS_ACt + β10CH_LMARKETCAPt +
β11PRE_IRREGULARITYt*CH_LMARKETCAPt)
TURNOVER is an indicator set to one for firm-years where either there is an audit committee member who is new to
the board for year t or an audit committee member that left the board effective year t, and zero otherwise.
PRE_IRREGULARITY -0.4441
(1.455)
CH_EXPERTISE 2.0660 ***
(0.754)
PRE_IRREGULARITY*CH_EXPERTISE 0.1501
(0.539)
CH_STATUS_DIF -0.1473
(0.257)
PRE_IRREGULARITY*CH_STATUS_DIF -0.6855
(0.613)
CH_EXPERTISE*CH_STATUS_DIF -1.4305
(1.728)
PRE_IRREGULARITY*CH_EXPERTISE*CH_STATUS_DIF 4.0633
(3.860)
CH_STATUS_AC 0.1138
(0.301)
PRE_IRREGULARITY*CH_STATUS_AC 0.8608
(1.148)
CH_LMARKETCAP -0.2870 *
(0.150)
PRE_IRREGULARITY*CH_LMARKETCAP 0.5950
(0.472)
Year Fixed Effects? Yes
Industry Fixed Effects? Yes
Fully Interacted Model? Yes
Obs. where dependent variable=1 356
Total Obs. 842
Pseudo R2
0.12
Logistic Regressions, Dependent Variable is TURNOVER
Independent Variables

66
PRE_IRREGULARITY is an indicator that is equal to one for firm-years from irregularity firms that are before the
irregularity begins, and zero otherwise.
Variable defintions are provided in Appendix A. Standard errors clustered by firm in parentheses. Pseudo R-Square
is the max re-scaled r-square from SAS (also known as Cragg & Uhler's pseudo r-square). *, **, and *** represent
two-tailed statistical significance at the 10%, 5%, and 1% levels, respectively.

67
Table 5, Panel C: Effect of Irregularity Revelation on the Change in Audit Committee
Expertise, Status, and Relative Status
Using firm-years from irregularity firms, this table reports the results of a logistic regression examining how
changes in audit committee status, audit committee expertise, and relative audit committee status are associated with
audit committee turnover events and how these relations differ pre- and post-irregularity revelation. The model is:
Prob(TURNOVERt = 1) = F(β1POST_REVELATIONt + β2CH_EXPERTISEt +
β3POST_REVELATIONt*CH_EXPERTISEt + β4CH_STATUS_DIFt +
β5POST_REVELATIONt*CH_STATUS_DIFt + β6CH_EXPERTISEt *CH_STATUS_DIFt +
β7POST_REVELATIONt*CH_EXPERTISEt *CH_STATUS_DIFt + β8CH_STATUS_ACt +
β9POST_REVELATIONt*CH_STATUS_ACt + β10CH_LMARKETCAPt + β11POST_REVELATIONt
*CH_LMARKETCAPt)
TURNOVER is an indicator set to one for firm-years where either there is an audit committee member who is new to
the board for year t or an audit committee member that left the board effective year t, and zero otherwise.
POST_REVELATION is an indicator that is equal to one for firm-years from irregularity firms that are after the
public revelation of the irregularity, and zero otherwise.
POST_REVELATION -0.0120
(0.735)
CH_EXPERTISE 1.2953
(1.186)
POST_REVELATION*CH_EXPERTISE 1.2494
(1.474)
CH_STATUS_DIF -0.6906 **
(0.298)
POST_REVELATION*CH_STATUS_DIF 0.7430 *
(0.440)
CH_EXPERTISE*CH_STATUS_DIF -0.2478
(2.624)
POST_REVELATION*CH_EXPERTISE*CH_STATUS_DIF -0.9227
(3.000)
CH_STATUS_AC 0.9590 *
(0.545)
POST_REVELATION*CH_STATUS_AC -1.1610 *
(0.700)
CH_LMARKETCAP -0.0030
(0.243)
POST_REVELATION*CH_LMARKETCAP -0.3583
(0.305)
Year Fixed Effects? Yes
Industry Fixed Effects? Yes
Fully Interacted Model? Yes
Obs. where dependent variable=1 356
Total Obs. 842
Pseudo R2
0.14
Logistic Regressions, Dependent Variable is TURNOVER
Independent Variables

68
Variable defintions are provided in Appendix A. Standard errors clustered by firm in parentheses. Pseudo R-Square
is the max re-scaled r-square from SAS (also known as Cragg & Uhler's pseudo r-square). *, **, and *** represent
two-tailed statistical significance at the 10%, 5%, and 1% levels, respectively.

69
Table 6: Effect of the Interaction of Audit Committee Expertise Types and Relative Audit
Committee Status on Irregularities
SOXACC 0.0328 0.0747
(0.393) (0.661)
SOXACC*STATUS_DIF -0.6675 -1.1130
(0.679) (1.098)
SOXSUPER 0.2536 0.5718
(0.256) (0.385)
SOXSUPER*STATUS_DIF -1.1755 ** -1.9422 ***
(0.457) (0.695)
SOXFIN 0.1434 0.5388
(0.361) (0.587)
SOXFIN*STATUS_DIF 0.1036 -0.2618
(0.626) (0.954)
SOXACC_DUM 0.0792 0.1913
(0.165) (0.223)
SOXACC_DUM*STATUS_DIF -0.1191 -0.4711
(0.326) (0.450)
SOXSUPER_DUM 0.1275 0.1265
(0.151) (0.230)
SOXSUPER_DUM*STATUS_DIF -0.4369 -0.7876 **
(0.272) (0.401)
SOXFIN_DUM 0.0355 0.2109
(0.156) (0.229)
SOXFIN_DUM*STATUS_DIF -0.0458 -0.0131
(0.335) (0.496)
STATUS_DIF 0.6177 ** 1.0373 *** 0.5272 0.9487 **
(0.300) (0.367) (0.381) (0.476)
STATUS_DIF_NAC -0.2548 * -0.3377 * -0.2522 * -0.3302 *
(0.150) (0.197) (0.151) (0.200)
NUM_AC -0.0570 -0.0380 -0.0633 -0.0512
(0.059) (0.077) (0.060) (0.079)
NUM_BRD -0.0248 0.0193 -0.0262 0.0177
(0.028) (0.037) (0.028) (0.037)
BRD_PCT_IND -0.9376 * -0.3050 -0.9396 * -0.2956
(0.532) (0.996) (0.535) (0.999)
CEOISCHAIR 0.1085 0.0744 0.1114 0.0736
(0.131) (0.187) (0.131) (0.187)
INSTITUTIONAL_OWN -0.3058 -0.5544 * -0.2932 -0.5040
(0.213) (0.309) (0.213) (0.313)
LMARKETCAP 0.4030 *** 0.3350 *** 0.4034 *** 0.3455 ***
(0.047) (0.076) (0.047) (0.076)
BM 0.3199 *** 0.4599 *** 0.3247 *** 0.4613 ***
(0.114) (0.161) (0.112) (0.161)
LEVERAGE 0.6596 ** 1.2992 *** 0.6618 ** 1.3476 ***
(0.294) (0.422) (0.293) (0.430)
ISSUE 0.2405 ** 0.1043 0.2408 ** 0.0883
(0.099) (0.149) (0.099) (0.149)
ROA -0.0172 -0.1619 -0.0191 -0.2069
(0.060) 0.162 (0.054) (0.344)
EINDEX -0.1870 ** -0.1877 **
(0.074) (0.075)
Year Fixed Effects? Yes Yes Yes Yes
Industry Fixed Effects? Yes Yes Yes Yes
Obs. where IRREGULARITY =1 813 400 813 400
Total Obs. 29,074 9,633 29,074 9,633
Pseudo R2
0.14 0.16 0.14 0.16
Logistic Regressions, Dependent Variable is IRREGULARITY
Independent Variables (1) (2) (3) (4)

70
This table reports the results of a logistic regression examining the effect of the interaction of audit committee
financial expertise type and relative audit committee status on the likelihood of an irregularity based on the
following model:
Prob(IRREGULARITYt = 1) = F(β1SOXACCt + β2 SOXACCt *STATUS_DIFt + β3SOXSUPERt + β4
SOXSUPERt *STATUS_DIFt + β5SOXFINt + β6 SOXFINt *STATUS_DIFt + β7STATUS_DIFt +
β’(CONTROLS))
We obtain an irregularity sample made up of (1) violation years from SEC and Department of Justice enforcement
actions that establish intent under Section 17(a) of the Securities Act of 1933, or either Section 10(b) (including Rule
10b-5) or 13(b)(5) of the Securities Exchange Act of 1934 per the Federal Securities Regulation Database and (2)
class period years related to settled securities class-action lawsuits that allege violations of Generally Accepted
Accounting Principles per RiskMetrics. Columns one and two include SOXACC, SOXSUPER, and SOXFIN, which
measure the percent of the audit committee with accounting, supervisory, and finance expertise, respectively.
Columns three and four replace the audit committee expertise type variables based on the percentage of expertise
with SOXACC_DUM, SOXSUPER_DUM, and SOXFIN_DUM, which measure the presence of accounting,
supervisory, and finance expertise, respectively, on the audit committee. Columns two and four include EINDEX as
an additional control, which reduces the sample size.
Variable defintions are provided in Appendix A. Standard errors clustered by firm in parentheses. Pseudo R-Square
is the max re-scaled r-square from SAS (also known as Cragg & Uhler's pseudo r-square). *, **, and *** represent
two-tailed statistical significance at the 10%, 5%, and 1% levels, respectively.