Document No. IR-QAM Section Revision No.: 0 Section ... · Document No. IR-QAM Section Revision...
50
Document No. IR-QAM Section Revision No.: 0 Section Effective Date: 01/31/2008 Page 18-5 of 18-5 Company Confidential & Proprietary • Specific examples of breaches of ethical behavior (e.g. peak shaving, altering data or computer clocks, improper macros, etc., accepting/offering kickbacks, illegal accounting practices, unfair competition/collusion) • Internal monitoring. Investigations and data recalls. • Consequences for infractions including potential for immediate termination, debarment, or criminal prosecution. • Importance of proper written narration / data qualification by the analyst and project manager with respect to those cases where the data may still be usable but are in one sense or another partially deficient. Additionally, a data integrity hotline (1-800-736-9407) is maintained by TestAmerica and administered by the Corporate Quality Department.
Transcript of Document No. IR-QAM Section Revision No.: 0 Section ... · Document No. IR-QAM Section Revision...

Document No. IR-QAMSection Revision No.: 0
Section Effective Date: 01/31/2008Page 18-5 of 18-5
Company Confidential & Proprietary
• Specific examples of breaches of ethical behavior (e.g. peak shaving, altering data orcomputer clocks, improper macros, etc., accepting/offering kickbacks, illegal accountingpractices, unfair competition/collusion)
• Internal monitoring. Investigations and data recalls.
• Consequences for infractions including potential for immediate termination, debarment, orcriminal prosecution.
• Importance of proper written narration / data qualification by the analyst and projectmanager with respect to those cases where the data may still be usable but are in onesense or another partially deficient.
Additionally, a data integrity hotline (1-800-736-9407) is maintained by TestAmerica andadministered by the Corporate Quality Department.

Document No. IR-QAMSection Revision No.: 0
Section Effective Date: 01/31/2008Page 19-1 of 19-3
Company Confidential & Proprietary
SECTION 19
ACCOMMODATIONS AND ENVIRONMENTAL CONDITIONS(NELAC 5.5.3)
19.1 OVERVIEWTestAmerica Irvine is a 45,000 ft2 secure laboratory facility with controlled access and designedto accommodate an efficient workflow and to provide a safe and comfortable work environmentfor employees. All visitors sign in and are escorted by laboratory personnel. Access is controlledby various measures.
The laboratory is equipped with structural safety features. Each employee is familiar with thelocation, use, and capabilities of general and specialized safety features associated with theirworkplace. The laboratory provides and requires the use of protective equipment includingsafety glasses, protective clothing, gloves, etc. OSHA and other regulatory agency guidelinesregarding required amounts of bench and fume hood space, lighting, ventilation (temperatureand humidity controlled), access, and safety equipment are met or exceeded.
Traffic flow through sample preparation and analysis areas is minimized to reduce the likelihoodof contamination. Adequate floor space and bench top area is provided to allow unencumberedsample preparation and analysis space. Sufficient space is also provided for storage of reagentsand media, glassware, and portable equipment. Ample space is also provided for refrigeratedsample storage before analysis and archival storage of samples after analysis. LaboratoryHVAC and deionized water systems are designed to minimize potential trace contaminants.
The laboratory is separated into specific areas for sample receiving, sample preparation, volatileorganic sample analysis, non-volatile organic sample analysis, inorganic sample analysis, andadministrative functions.
19.2 ENVIRONMENTLaboratory accommodation, test areas, energy sources, lighting are adequate to facilitateproper performance of tests. The facility is equipped with heating, ventilation, and airconditioning (HVAC) systems appropriate to the needs of environmental testing performed atthis laboratory.
The environment in which these activities are undertaken does not invalidate the results oradversely affect the required accuracy of any measurements.
The laboratory provides for the effective monitoring, control and recording of environmentalconditions that may effect the results of environmental tests as required by the relevantspecifications, methods, and procedures. Such environmental conditions include temperatureand barometric pressure. These are monitored in relevant testing areas during the testingperiod.
Document No. IR-QAMSection Revision No.: 0
Section Effective Date: 01/31/2008Page 19-2 of 19-3
Company Confidential & Proprietary
When any of the method or regulatory required environmental conditions change to a pointwhere they may adversely affect test results, analytical testing will be discontinued until theenvironmental conditions are returned to the required levels (refer to Section 12).
Environmental conditions of the facility housing the computer network and LIMS are regulated toprotect against raw data loss.
19.3 WORK AREASThere is effective separation between neighboring areas when the activities therein areincompatible with each other. Examples include:
• Volatile organic analysis is performed in a separate room provided with positive air pressure.
• Volatile organic chemical handling areas, including sample preparation and waste disposal,and volatile organic chemical analysis areas.
Access to and use of all areas affecting the quality of analytical testing is defined and controlledby secure access to the laboratory building as described below in the Building Security section.
Adequate measures are taken to ensure good housekeeping in the laboratory and to ensurethat any contamination does not adversely affect data quality. These measures include regularcleaning to control dirt and dust within the laboratory.
Work areas are available to ensure an unencumbered work area. Work areas include:
• Access and entryways to the laboratory.
• Sample receipt areas.
• Sample storage areas.
• Chemical and waste storage areas.
• Data handling and storage areas.
• Sample processing areas.
• Sample analysis areas.
19.4 FLOOR PLANA floor plan can be found in Appendix 3.

Document No. IR-QAMSection Revision No.: 0
Section Effective Date: 01/31/2008Page 19-3 of 19-3
Company Confidential & Proprietary
19.5 BUILDING SECURITYBuilding electronic keys are distributed to employees as necessary.
Visitors to the laboratory sign in and out in a visitor’s logbook. A visitor is defined as any personwho visits the laboratory who is not an employee of TestAmerica Irvine. In addition to signinginto the laboratory, the Environmental, Health and Safety Manual contains requirements forvisitors and vendors. There are specific safety forms that must be reviewed and signed.
Visitors (with the exception of company employees) are escorted by laboratory personnel at alltimes, or the location of the visitor is noted in the visitor’s logbook.
Signs are posted in the laboratory designating employee only areas - “Authorized employeesbeyond this point”.

Document No. IR-QAMSection Revision No.: 0
Section Effective Date: 01/31/2008Page 20-1 of 20-22
Company Confidential & Proprietary
SECTION 20.0
TEST METHODS AND METHOD VALIDATION(NELAC 5.5.4)
20.1 OVERVIEW
TestAmerica Irvine uses methods that are appropriate to meet our clients’ requirements and thatare within the scope of the laboratory’s capabilities. These include sampling, handling,transport, storage and preparation of samples, and, where appropriate, an estimation of themeasurement of uncertainty as well as statistical techniques for analysis of environmental data.
Instructions are available in the laboratory for the operation of equipment as well as for thehandling and preparation of samples. All instructions, Standard Operating Procedures (SOPs),reference methods and manuals relevant to the working of the laboratory are readily available toall staff. Deviations from published methods are documented (with justification) in the laboratory’sapproved SOPs. SOPs are submitted to clients for review at their request. Significant deviationsfrom published methods require client approval and regulatory approval where applicable.
20.2 STANDARD OPERATING PROCEDURES (SOPs)TestAmerica Irvine maintains SOPs that accurately reflect all phases of the laboratory such asassessing data integrity, corrective actions, handling customer complaints as well as allanalytical methods and sampling procedures. The method SOPs are derived from the mostrecently promulgated/approved, published methods and are specifically adapted to thelaboratory facility. Modifications or clarifications to published methods are clearly noted in theSOPs. All SOPs are controlled in the laboratory (refer to Section 6 on Document Control):
• All SOPs contain a revision number, effective date, and appropriate approval signatures.Controlled copies are available to all staff.
• Procedures for preparation, review, revision and control are incorporated by reference toSOPs: CW-Q-S-002 (Writing a Standard Operating Procedure (SOP) and SOP IR-QA-DOC(Document Control and Review)
• SOPs are reviewed at a minimum of every 2 years (annually for Drinking Water and DoDSOPs), and where necessary, revised to ensure continuing suitability and compliance withapplicable requirements.
20.3 LABORATORY METHODS MANUALFor each test method, the laboratory shall have available the published referenced method aswell as the laboratory developed SOP. Refer to the corporate SOP CW-Q-S-002 “Writing aStandard Operating Procedure” for content and requirements of technical and non-technicalSOPs.
Note: If more stringent standards or requirements are included in a mandated test methodor regulation than those specified in this manual, the laboratory shall demonstrate that suchrequirements are met. If it is not clear which requirements are more stringent, the standard from
Document No. IR-QAMSection Revision No.: 0
Section Effective Date: 01/31/2008Page 20-2 of 20-22
Company Confidential & Proprietary
the method or regulation is to be followed. Any exceptions or deviations from the referencedmethods or regulations are noted in the specific analytical SOP.
20.4 SELECTION OF METHODSSince numerous methods and analytical techniques are available, continued communicationbetween the client and laboratory is imperative to assure the correct methods are utilized. Onceclient methodology requirements are established, this and other pertinent information issummarized by the Project Manager. These mechanisms ensure that the proper analyticalmethods are applied when the samples arrive for log-in. For non-routine analytical services(e.g., special matrices, non-routine compound lists, etc..), the method of choice is selectedbased on client needs and available technology. The methods selected should be capable ofmeasuring the specific parameter of interest, in the concentration range of interest, and with therequired precision and accuracy.
20.4.1 Sources of Methods
Routine analytical services are performed using standard EPA-approved methodology. In somecases, modification of standard approved methods may be necessary to provide accurateanalyses of particularly complex matrices. When the use of specific methods for sampleanalysis is mandated through project or regulatory requirements, only those methods shall beused.
In general, TestAmerica Irvine follows procedures from the referenced methods shown below in20.3.1.4.
When clients do not specify the method to be used or methods are not required, the methodsused will be clearly validated and documented in an SOP and available to clients and/or the enduser of the data.
20.4.1.1 The analytical methods used by the laboratory are those currently accepted andapproved by the U. S. EPA and the state or territory from which the samples were collected.Reference methods include:
• Method 1664, Revision A: N-Hexane Extractable Material (HEM; Oil and Grease) and Silica GelTreated N-Hexane Extractable Material (SGT-HEM); Non-polar Material) by Extraction andGravimetry, EPA-821-R-98-002, February 1999
• Guidelines Establishing Test Procedures for the Analysis of Pollutants Under the Clean Water Act,and Appendix A-C; 40 CFR Part 136, USEPA Office of Water. Revised as of July 1, 1995, AppendixA to Part 136 - Methods for Organic Chemical Analysis of Municipal and Industrial Wastewater (EPA600 Series)
• Methods for Chemical Analysis of Water and Wastes, EPA 600 (4-79-020), 1983.
• Methods for the Determination of Inorganic Substances in Environmental Samples, EPA-600/R-93/100, August 1993.
• Methods for the Determination of Metals in Environmental Samples, EPA/600/4-91/010, June 1991.Supplement I: EPA-600/R-94/111, May 1994.
Document No. IR-QAMSection Revision No.: 0
Section Effective Date: 01/31/2008Page 20-3 of 20-22
Company Confidential & Proprietary
• Methods for the Determination of Organic Compounds in Drinking Water, EPA-600/4-88-039,December 1988, Revised, July 1991, Supplement I, EPA-600-4-90-020, July 1990, Supplement II,EPA-600/R-92-129, August 1992. Supplement III EPA/600/R-95/131 - August 1995 (EPA 500 Series)(EPA 500 Series methods)
• Technical Notes on Drinking Water Methods, EPA-600/R94-173, October 1994
• Standard Methods for the Examination of Water and Wastewater, 18th/19th /20th edition; Eaton, A.D.Clesceri, L.S. Greenberg, A.E. Eds; American Water Works Association, Water Pollution ControlFederation, American Public Health Association: Washington, D.C.
• Test Methods for Evaluating Solid Waste Physical/Chemical Methods (SW846), Third Edition,September 1986, Final Update I, July 1992, Final Update IIA, August 1993, Final Update II,September 1994; Final Update IIB, January 1995; Final Update III, December 1996.
• Annual Book of ASTM Standards, American Society for Testing & Materials (ASTM), Philadelphia,PA.
• Manual for the Certification of Laboratories Analyzing Drinking Water (EPA 815-R-05-004, January2005)
• Code of Federal Regulations (CFR) 40, Parts 136, 141, 172, 173, 178, 179 and 261
The laboratory reviews updated versions to all the aforementioned references for adaptationbased upon capabilities, instrumentation, etc., and implements them as appropriate. As such,the laboratory strives to perform only the latest versions of each approved method asregulations allow or require.
Other reference procedures for non-routine analyses may include methods established byspecific states (e.g., Underground Storage Tank methods), ASTM or equipment manufacturers.Sample type, source, and the governing regulatory agency requiring the analysis will determinethe method utilized.
The laboratory shall inform the client when a method proposed by the client may beinappropriate or out of date. After the client has been informed, and they wish to proceedcontrary to the laboratory’s recommendation, it will be documented.
20.4.2 Demonstration of CapabilityBefore the laboratory may institute a new method and begin reporting results, the laboratoryshall confirm that it can properly operate the method. In general, this demonstration does nottest the performance of the method in real world samples, but in an applicable and availableclean matrix sample. If the method is for the testing of analytes that are not conducive tospiking, demonstration of capability may be performed on quality control samples.
20.4.2.1 A demonstration of capability is performed whenever there is a change in instrumenttype, method or personnel.
20.4.2.2 The initial demonstration of capability must be thoroughly documented and approvedby the Technical Director and QA Manager prior to independently analyzing clientsamples. All associated documentation must be retained in accordance with thelaboratories archiving procedures (refer to Section 15, Control of Records).

Document No. IR-QAMSection Revision No.: 0
Section Effective Date: 01/31/2008Page 20-4 of 20-22
Company Confidential & Proprietary
20.4.2.3 The laboratory must have an approved SOP, demonstrate satisfactory performance,and conduct a method detection limit study (when applicable). There may be otherrequirements as stated within the published method or regulations (i.e., retentiontime window study).
Note: In some instances, a situation may arise where a client requests that an unusualanalyte be reported using a method where this analyte is not normally reported. If the analyte isbeing reported for regulatory purposes, the method must meet all procedures outlined within thisQA Manual (SOP, MDL, and Demonstration of Capability). If the client states that theinformation is not for regulatory purposes, the result may be reported as long as the followingcriteria are met:
• The instrument is calibrated for the analyte to be reported using the criteria for themethod and ICV/CCV criteria are met (unless an ICV/CCV is not required by themethod).
• The reporting limit is set at or above the first standard of the curve for the analyte.
• The client request is documented and the lab informs the client of its procedure forworking with unusual compounds. The final report must be footnoted: Reporting Limitbased on the low standard of the calibration curve.
• Refer to Section 12 (Control of Non-Conforming Work).
20.4.3 Initial Demonstration of Capability (IDOC) ProceduresThe laboratory’s SOP IR-QA-TRAIN (Training and Documentation) describes in detail theprocess by which IDOCs are prepared, performed, evaluated, and documented.
20.4.3.1 The following criteria are to be met for any IDOC:
• The spiking standard used must be prepared independently from those used ininstrument calibration.
• The analyte(s) shall be diluted in a volume of clean matrix sufficient to prepare fouraliquots at the concentration specified by a method or the laboratory SOP.
• At least four aliquots shall be prepared (including any applicable clean-up procedures)and analyzed according to the test method (either concurrently or over a period ofdays).
• Using all of the results, calculate the mean recovery in the appropriate reporting unitsand the standard deviations for each parameter of interest.
• When it is not possible to determine the mean and standard deviations, such as forpresence, absence and logarithmic values, the laboratory will assess performanceagainst criteria described in the Method SOP.
• Compare the information obtained above to the corresponding acceptance criteria forprecision and accuracy in the test method (if applicable) or in laboratory generated
Document No. IR-QAMSection Revision No.: 0
Section Effective Date: 01/31/2008Page 20-5 of 20-22
Company Confidential & Proprietary
acceptance criteria (LCS or interim criteria) if there is no mandatory criteriaestablished. If any one of the parameters do not meet the acceptance criteria, theperformance is unacceptable for that parameter.
20.4.3.2 When one or more of the tested parameters fail at least one of the acceptancecriteria, the analyst must proceed according to either option listed below:
• Locate and correct the source of the problem and repeat the test for all parametersof interest beginning with 20.4.3.3 above.
• Beginning with 20.4.3.3 above, repeat the test for all parameters that failed to meetcriteria. Repeated failure, however, will confirm a general problem with themeasurement system. If this occurs, locate and correct the source of the problemand repeat the test for all compounds of interest beginning with 20.4.3.1 above.
A certification statement (see Figure 20-1) shall be used to document the completion of eachinitial demonstration of capability. A copy of the certification is archived in the analyst’s trainingfolder.
20.5 LABORATORY DEVELOPED METHODS AND NON-STANDARD METHODSAny new method developed by the laboratory must be fully defined in an SOP/Methods Manual(Section 20.2) and validated by qualified personnel with adequate resources to perform themethod. Method specifications and the relation to client requirements must be clearly conveyedto the client if the method is a non-standard method (not a published or routinely acceptedmethod). The client must also be in agreement to the use of the non-standard method. Theinformation included in the checklist below (Figure 20-2) is needed before samples are acceptedfor analysis by a new method.
20.6 VALIDATION OF METHODSValidation is the confirmation by examination and the provision of objective evidence that theparticular requirements for a specific intended use are fulfilled. (From 2003 NELAC Standard)
All non-standard methods, laboratory designed/developed methods, standard methods usedoutside of their scope, and major modifications to published methods must be validated toconfirm they are fit for their intended use. The validation will be as extensive as necessary tomeet the needs of the given application. The results are documented with the validationprocedure used and contain a statement as to the fitness for use.
20.6.1 Method Validation and Verification Activities for All New MethodsWhile method validation can take various courses, the following activities can be required aspart of method validation. Method validation records are designated QC records and arearchived accordingly.
20.6.1.1 Determination of Method Selectivity
Document No. IR-QAMSection Revision No.: 0
Section Effective Date: 01/31/2008Page 20-6 of 20-22
Company Confidential & Proprietary
Method selectivity is the demonstrated ability to discriminate the analyte(s) of interest from othercompounds in the specific matrix or matrices from other analytes or interference. In somecases to achieve the required selectivity for an analyte, a confirmation analysis is required aspart of the method.
20.6.1.2 Determination of Method Sensitivity
Sensitivity can be both estimated and demonstrated. Whether a study is required to estimatesensitivity depends on the level of method development required when applying a particularmeasurement system to a specific set of samples. Where estimations and/or demonstrations ofsensitivity are required by regulation or client agreement, such as the procedure in 40 CFR Part136 Appendix B, under the Clean Water Act, these shall be followed. The laboratorydeterminations of MDLs are described in Section 20.6.
20.6.1.3 Relationship of Limit of Detection (LOD) to the Quantitation Limit (QL)
An important characteristic of expression of sensitivity is the difference in the LOD and the QL.The LOD is the minimum level at which the presence of an analyte can be reliably concluded.The QL is the minimum level at which both the presence of an analyte and its concentration canbe reliably determined. For most instrumental measurement systems, there is a region wheresemi-quantitative data is generated around the LOD (both above and below the estimated MDLor LOD) and below the QL. In this region, detection of an analyte may be confirmed butquantification of the analyte is unreliable within the accuracy and precision guidelines of themeasurement system. When an analyte is detected below the QL, and the presence of theanalyte is confirmed by meeting the qualitative identification criteria for the analyte, the analytecan be reliably reported, but the amount of the analyte can only be estimated. If data is to bereported in this region, it must be done so with a qualification that denotes the semi-quantitativenature of the result.
20.6.1.4 Determination of Interferences
A determination that the method is free from interferences in a blank matrix is performed.
20.6.1.5 Determination of Range
Where appropriate, a determination of the applicable range of the method may be performed.In most cases, range is determined and demonstrated by comparison of the response of ananalyte in a curve to established or targeted criteria. The curve is used to establish the range ofquantitation and the lower and upper values of the curve represent upper and lower quantitationlimits. Curves are not limited to linear relationships.
20.6.1.6 Determination of Accuracy and Precision
Accuracy and precision studies are generally performed using replicate analyses, with aresulting percent recovery and measure of reproducibility (standard deviation, relative standarddeviation) calculated and measured against a set of target criteria.
20.6.1.7 Documentation of Method

Document No. IR-QAMSection Revision No.: 0
Section Effective Date: 01/31/2008Page 20-7 of 20-22
Company Confidential & Proprietary
The method is formally documented in an SOP. If the method is a minor modification of astandard laboratory method that is already documented in an SOP, an SOP Attachmentdescribing the specific differences in the new method is acceptable in place of a separate SOP.
20.6.1.8 Continued Demonstration of Method Performance
Continued demonstration of Method Performance is addressed in the SOP. Continueddemonstration of method performance is generally accomplished by batch specific QC samplessuch as LCS, method blanks or PT samples.
20.7 METHOD DETECTION LIMITS (MDL)/ LIMITS OF DETECTION (LOD)Method detection limits (MDL) are initially determined in accordance with 40 CFR Part 136,Appendix B or alternatively by other technically acceptable practices that have been acceptedby regulators. MDL is also sometimes referred to as Limit of Detection (LOD). The MDLtheoretically represents the concentration level for each analyte within a method at which theAnalyst is 99% confident that the true value is not zero. The MDL is determined for each analyteinitially during the method validation process and updated as required in the analytical methods,whenever there is a significant change in the procedure or equipment, or based on project specificrequirements (refer to 20.7.10). The analyst prepares at least seven replicates of solution spikedat one to five times the estimated method detection limit (most often at the lowest standard in thecalibration curve) into the applicable matrix with all the analytes of interest. Each of these aliquotsis extracted (including any applicable clean-up procedures) and analyzed in the same manner asthe samples. Where possible, the seven replicates should be analyzed over 2-4 days to providea more realistic MDL.
20.7.1 MDL’s are initially performed for each individual instrument and non-microbiologicalmethod analysis. Unless there are requirements to the contrary, the laboratory will use thehighest calculated MDL for all instruments used for a given method as the MDL for reportingpurposes. This MDL is not required for methods that are not readily spiked (e.g. pH, turbidity,etc.) or where the lab does not report values to the MDL. Titration and gravimetric methodswhere there is no additional preparation involved, the MDL is based on the lowest discernableunit of measure that can be observed.
20.7.2 MDL’s must be run against acceptable instrument QC, including ICV's and Tunes.This is to insure that the instrument is in proper working condition and falsely high or low MDL’sare not calculated.
20.7.3 Use only clean matrix which is free of target analytes (e.g.: Laboratory reagent water,Ottawa Sand) unless a project specific MDL is required in a field sample matrix.
20.7.4 The Reporting Limit (also may be referred to as Limit of Quantitation or LOQ) shouldgenerally be between 2 and 5 times the MDL. If the MDL is being performed during methoddevelopment, use this guideline to determine the Reporting Limit for the analysis.
20.7.5 If a sample is diluted, the reported MDL is adjusted according to the dilution factor.
20.7.6 The calculated MDL cannot be greater than the spike amount.

Document No. IR-QAMSection Revision No.: 0
Section Effective Date: 01/31/2008Page 20-8 of 20-22
Company Confidential & Proprietary
20.7.7 If the most recent calculated MDL does not permit qualitative identification of theanalyte then the laboratory may use technical judgment for establishing the MDL (e.g., calculatewhat level would give a qualitative ID, compare with IDL (20.7), spike at a level where qualitativeID is determined and assign that value as MDL, minimum sensitivity requirements, Standarddeviation of method blanks over time, etc.). These alternate verification procedures aredocumented in the laboratory’s MDL.SOP (Determination of Method Detection Limits).
20.7.8 Each of the replicate spikes must be qualitatively identifiable (e.g., appear in bothcolumns for dual column methods, characteristic ions for GCMS mass spectra, etc). Manualintegrations to force the baseline for detection are not allowed.
20.7.9 The initial MDL is calculated as follows:
MDL = t(n-1, 1-a = 0.99) x (Standard Deviation of replicates)
where t(n-1, 1-a = 0.99) = 3.143 for seven replicates. (2.998 for eight)
20.7.10 Subsequent to the initial MDL determination, periodic MDL verification, confirmationor determinations may be performed by the procedure in 40 CFR Part 136, Appendix B oralternatively by other technically acceptable practices (e.g., method blanks over time, singlestandard spikes that have been subjected to applicable sample prep processes, etc.). Theprocedures utilized is documented in the laboratory SOP MDL.SOP (Determination of MethodDetection Limts).
20.7.11 Because of the inherent variability in results outside of the calibration range,TestAmerica does not recommend the reporting of results below the lowest calibration point in acurve; however, it is recognized that some projects and agencies require the reporting of resultsbelow the RL. Any result that falls between the MDL and the Reporting limit, when reported, willbe qualified as an estimated value.
20.7.12 Detections reported down to the MDL must be qualitatively identified.
20.7.13 MDLs and Reporting limits are adjusted in LIMs based on moisture content andsample aliquot size.
20.8 INSTRUMENT DETECTION LIMITS (IDL)20.8.1 The IDL is sometimes used to assess the reasonableness of the MDLs or in somecases required by the analytical method or program requirements. IDLs are most used inmetals analyses but may be useful in demonstration of instrument performance in other areas.
20.8.2 IDLs are calculated to determine an instrument’s sensitivity independent of anypreparation method. IDLs are calculated either using 7 replicate spike analyses, like MDL butwithout sample preparation, or by the analysis of 10 instrument blanks and calculating 3 x theabsolute value of the standard deviation.
20.8.3 If IDL is > than the MDL, it may be used as the reported MDL.
20.9 VERIFICATION OF DETECTION AND REPORTING LIMITS

Document No. IR-QAMSection Revision No.: 0
Section Effective Date: 01/31/2008Page 20-9 of 20-22
Company Confidential & Proprietary
20.9.1 Once an MDL is established, it must be verified, on each instrument, by analyzing aquality control sample (prepared as a sample) at approximately 2-3 times the calculated MDLfor single analyte analyses (e.g. most wet chemistry methods, Atomic Absorption, etc.) and 1-4times the calculated MDL for multiple analyte methods (e.g. GC, GCMS, ICP, etc.). Theanalytes must be qualitatively identified or see section 20.6.7 for other options. This verificationdoes not apply to methods that are not readily spiked (e.g. pH, turbidity, etc.) or where the labdoes not report to the MDL. If the MDL does not verify, then the lab will not report to the MDL,or redevelop their MDL or use the level where qualitative identification is established (See20.6.7). MDLs must be verified at least annually if an annual MDL study is not performed.
20.9.2 When a Reporting limit is established, it must be initially verified by the analysis of alow level standard or QC sample (LCS at 1-2 the reporting limit) and annually thereafter. Unlessthere are requirements to the contrary the acceptance criteria is + 50%. The annualrequirement is waved for methods that have an annually verified MDL.
20.10 RETENTION TIME WINDOWSMost organic analyses and some inorganic analyses use chromatography techniques forqualitative and quantitative determinations. For every chromatography analysis each analyte willhave a specific time of elution from the column to the detector. This is known as the analyte’sretention time. The variance in the expected time of elution is defined as the retention timewindow. As the key to analyte identification in chromatography, retention time windows must beestablished on every column for every analyte used for that method. These records are kept withthe files associated with an instrument for later quantitation of the analytes.
For GC, HPLC and IC methods, there must be sufficient separation between analyte peaks so asto not misidentify analytes. In the mid-level standard, the distance between the valley and peakheight cannot be any less than 25% of the sum of the peak heights of the analytes. This alsoapplies to GCMS in the case where the two compounds share the same quantitation ion.
Note: Some analytes do not separate sufficiently to be able to identify or quantitate them asseparate analytes (e.g. m-xylene and p-xylene) and are quantitated and reported as a singleanalyte (e.g. m,p-xylenes).
Once the analyst has determined that the instrument is in optimum working condition throughcalibration and calibration verification procedures, he or she uses a mid-range calibration orcalibration verification standard to establish the retention times for each of the individual analytesin a method. The analyst makes three injections of the same standard over a 72-hour (24 hrperiod for 300.0) period, tabulating the retention times for each analyte for each of the threeinjections. The width of retention time window is normally the average absolute retention time ± 3Standard Deviations. A peak outside the retention time window will not be identified by thecomputer as a positive match of the analyte of interest.
It is possible for the statistically calculated RT window to be too tight and need to be adjustedbased on analyst experience. In these instances method default retention time windows may beused (e.g., for 8000 series methods a default of 0.03 minutes may be used, and EPA CLP 0.05
Document No. IR-QAMSection Revision No.: 0
Section Effective Date: 01/31/2008Page 20-10 of 20-22
Company Confidential & Proprietary
minutes is used). The same concept is applied when any peak outside of that window will not beidentified by the computer as a positive match.
The calibration verification standard at the beginning of a run may be used to adjust the RT for ananalyte. This is essentially re-centering the window but the size of the window remains the same.The RTs are verified when all analytes are within their RT windows and are properly identified.
20.11 EVALUATION OF SELECTIVITYThe laboratory evaluates selectivity by following the checks within the applicable analyticalmethods, which include mass spectral tuning, second column confirmation, ICP interelementinterference checks, chromatography retention time windows, sample blanks and specificelectrode response factors.
20.12 ESTIMATION OF UNCERTAINTY OF MEASUREMENT20.12.1 Uncertainty is “a parameter associated with the result of a measurement, thatcharacterizes the dispersion of the values that could reasonably be attributed to the measurand”(as defined by the International Vocabulary of Basic and General Terms in Metrology, ISOGeneva, 1993, ISBN 92-67-10175-1). Knowledge of the uncertainty of a measurement providesadditional confidence in a result’s validity. Its value accounts for all the factors which couldpossibly affect the result, such as adequacy of analyte definition, sampling, matrix effects andinterferences, climatic conditions, variances in weights, volumes, and standards, analyticalprocedure, and random variation. Some national accreditation organizations require the use ofan “expanded uncertainty”: the range within which the value of the measurand is believed to liewithin at least a 95% confidence level with the coverage factor k=2.
20.12.2 Uncertainty is not error. Error is a single value, the difference between the true resultand the measured result. On environmental samples, the true result is never known. Themeasurement is the sum of the unknown true value and the unknown error. Unknown error is acombination of systematic error, or bias, and random error. Bias varies predictably, constantly,and independently from the number of measurements. Random error is unpredictable,assumed to be Gaussian in distribution, and reducible by increasing the number ofmeasurements.
20.12.3 The uncertainty associated with results generated by the laboratory can bedetermined by using the Laboratory Control Sample (LCS) accuracy range for a given analyte.The LCS limits are used to assess the performance of the measurement system since they takeinto consideration all of the laboratory variables associated with a given test over time (exceptfor variability associated with the sampling). The percent recovery of the LCS is comparedeither to the method-required LCS accuracy limits or to the statistical, historical, in-house LCSaccuracy limits.
20.12.4 To calculate the uncertainty for the specific result reported, multiply the result by thedecimal of the lower end of the LCS range percent value for the lower end of the uncertaintyrange, and multiply the result by the decimal of the upper end of the LCS range percent valuefor the upper end of the uncertainty range. These calculated values represent a 99%-certainrange for the reported result. As an example, suppose that the result reported is 1.0 mg/l, and

Document No. IR-QAMSection Revision No.: 0
Section Effective Date: 01/31/2008Page 20-11 of 20-22
Company Confidential & Proprietary
the LCS percent recovery range is 50 to 150%. The uncertainty range would be 0.5 to 1.5 mg/l,which could also be written as 1.0 +/- 0.5 mg/l.
20.12.5 In the case where a well recognized test method specifies limits to the values ofmajor sources of uncertainty of measurement (e.g. 524.2, 525, etc) and specifies the form ofpresentation of calculated results, no further discussion of uncertainty is required.
20.13 CONTROL OF DATAThe laboratory has policies and procedures in place to ensure the authenticity, integrity, andaccuracy of the analytical data generated by the laboratory.
20.13.1 Computer and Electronic Data Related RequirementsThe three basic objectives of our computer security procedures and policies are shown below.More detail is outlined in SOP COMPSECU.SOP (Computer Security). The laboratory is currentlyrunning the Element which is a 3rd party LIMS system that has been highly customized to meetthe needs of the laboratory. It is referred to as LIMS for the remainder of this section. TheLIMS utilizes SQL which is an industry standard relational database platform. It is referred to asDatabase for the remainder of this section.
20.13.1.1 Maintain the Database IntegrityAssurance that data is reliable and accurate through data verification (review) procedures,password-protecting access, anti-virus protection, data change requirements, as well as aninternal LIMS permissions procedure.
• LIMS Database Integrity is achieved through data input validation, internal usercontrols, and data change requirements.
• Spreadsheets and other software developed in-house must be verified withdocumentation through hand calculations prior to use.
Note: “Commercial off-the-shelf software in use within the designed applicationrange is considered to be sufficiently validated.” From NELAC 2003 Standard.However, laboratory specific configurations or modifications are validated prior touse.
• In order to assure accuracy, all data entered or transferred into the LIMS datasystem goes through a minimum of two levels of review.
• The QA department performs random data audits to ensure the correct informationhas been reported.
• Changes to reports are documented using the non-conformance/corrective actiondatabase. Changed report files are named “revision_a”, “revision_b”, etc to clearlydifferentiate them from the originally reported file.
• Analytical data file security is provided through three policies.- The first policy forbids unauthorized personnel from using laboratory data
acquisition computers.- The second policy is the implementation of network passwords and login names
that restrict directory access.
Document No. IR-QAMSection Revision No.: 0
Section Effective Date: 01/31/2008Page 20-12 of 20-22
Company Confidential & Proprietary
- The third layer is maintained through the LIMS and includes the use ofusername/password combinations to gain access to the LIMS system, the fact thatall data in the LIMS is associated with the user to added/reviewed the data, andthe restriction of review authority of data.
• All software installations will be in accordance with any relevant copyright licensingregulations.
• All software installed on any computer within the laboratory must be approved by theInformation Technology Department regional support technician assigned to thelaboratory Shrink-wrapped or otherwise sealed OEM software that is directly relatedto instrument usage does not need approval but the Information Technologydepartment must be notified of the installation.
• Anti-virus software shall be installed on all servers and workstations. The anti-virussoftware shall be configured to check for virus signature file and program updates on adaily basis and these updates will be pushed to all servers and workstations. The anti-virus software will be configured to clean any virus-infected file if possible, otherwisethe file will be deleted. Disks and CDs brought from any outside source that are notOEM software must be scanned for viruses before being accessed.
• Interlab LIMS Permissions Policy- PURPOSE - The purpose of this policy is to provide a mechanism for maintaining
the integrity of information contained in each laboratory’s LIMS while providing thenecessary access for information sharing to staff at other laboratory facilities.
- DEFINITIONS - Host Laboratory: The laboratory facility that ‘owns’ the LIMSsystem or ‘hosts’ a project/job.
- POLICIES(a) All permissions for the laboratory’s LIMS system must only be granted by arepresentative of that laboratory.• If someone outside of the host lab needs permissions for Project
Management or other uses, they must go through the Lab Director or his/herdesignated representative.
• Permissions must never be granted without the knowledge of the hostlaboratory.
(b) Only laboratory analytical or QA staff from the home laboratory may haveedit permissions for laboratory analysis data.(c) Any changes made in laboratory’s LIMS system:• Must be documented and traceable.• If made by staff of an affiliate lab, written permission from the home lab to
make the changes (email approval is sufficient) is required.• No corrections may be made in another laboratories system without their
knowledge.(d) Data qualifiers in laboratory reports must only be corrected, edited, etc. by thestaff at the host laboratory.(e) Full analytical data “View” only permissions may be granted to outside ProjectManagement and Sales staff. Query Search permissions may also be granted sostatus may be checked.(f) All qualifiers must be approved by QA staff before adding to standard reference(static) tables.(g) Please contact Corporate QA or IT staff if you have any questionsregarding implementation or interpretation of this policy.

Document No. IR-QAMSection Revision No.: 0
Section Effective Date: 01/31/2008Page 20-13 of 20-22
Company Confidential & Proprietary
20.13.1.2 Ensure Information Availability: Protection against loss of information or servicethrough scheduled back-ups, secure storage of media, line filter, UninterruptiblePower Supply (UPS), and maintaining older versions of software as revisions areimplemented.
• Insured by timely backup procedures on reliable backup media, stable file servernetwork architecture, and UPS protection
• UPS Protection:- Each fileserver is protected by an appropriate power protection/backup unit. In the
event of a power outage, there is approximately 15-30 minutes of up-time for theservers prior to shutdown. This allows for proper shutdown procedures to befollowed with the fileservers.
• File Server Architecture- All files are maintained on multiple Windows 2000 or newer servers which are
secured physically in the Information Technology office. Access to these servers islimited to members of the Information Technology staff.
- All supporting software is maintained for at least 5 years from the last raw datagenerated using that software. [ Length of time is dependent on local regulationsor client requirements (e.g., OVAP requires 10 years). ]
• System Back-up Overview and Procedures- Data from both servers and instrument attached PC’s are backed up and purged in
compliance with the corporate back-up policy.- A Maintenance Plan has been defined to create a daily archive of all data within
the LIMS database to a backup location. This backup is initiated automatically byeither the database or back-up system.
- Backup tapes will be stored in compliance with the corporate Data Backup Policy.Backup verifications are carried out in accordance with the corporate Data BackupPolicy.
- Instrument data back-ups are verified on a periodic basis by the QA departmentwhen performing electronic data audits. The audit takes place on data that hasbeen moved to a back-up location ensuring that it has been moved.
20.13.1.3 Maintain Confidentiality: Ensure data confidentiality through physical accesscontrols, and encryption of when electronically transmitting data.
• All servers are located in a secure area of the IT department offices. Access to theservers is limited to IT staff (Desktop Support, Director of LIMS support, Databaseadministrator) and Lab Director.
• The company website contains SSL (Secure Socket Layer) encryption for securewebsite sessions and data transfers.
• The reporting portion of the LIMS system requires a project manager to enter theirunique password anytime they create a report that displays a signature on it (.PDF).
• Electronic documents such as PDF files and electronic data deliverables will bemade available to clients via the secure web site. The logon page for this web sitecontains an agreement that the customer must accept before they will be logged onwhich states that the customer agrees not to alter any electronic data made availableto them.

Document No. IR-QAMSection Revision No.: 0
Section Effective Date: 01/31/2008Page 20-14 of 20-22
Company Confidential & Proprietary
• If electronic documents are made available outside of the web site, the customermust sign an agreement in advance that states they will not alter the data in any way.
20.13.2 Data ReductionThe complexity of the data reduction depends on the analytical method and the number of discreteoperations involved (e.g., extractions, dilutions, instrument readings and concentrations). Theanalyst calculates the final results from the raw data or uses appropriate computer programs toassist in the calculation of final reportable values.
For manual data entry, e.g., Wet Chemistry, the data is reduced by the analyst and then verified bythe Department Manager or alternate analyst prior to entering the data in LIMS. The spreadsheets,or any other type of applicable documents, are signed by both the analyst and reviewer to confirmthe accuracy of the manual entry(s).
Manual integration of peaks will be documented and reviewed and the raw data will be flagged inaccordance with the TestAmerica Corporate SOP CA-Q-S-002, Acceptable Manual IntegrationPractices.
Analytical results are reduced to appropriate concentration units specified by the analyticalmethod, taking into account factors such as dilution, sample weight or volume, etc. Blank correctionwill be applied only when required by the method or per manufacturer’s indication; otherwise, itshould not be performed. Calculations are independently verified by appropriate laboratory staff.Calculations and data reduction steps for various methods are summarized in the respectiveanalytical SOPs or program requirements.
20.13.2.1 All raw data must be retained in the daily run sequence folder, computer file (ifappropriate), and/or logbook. All criteria pertinent to the method must be recorded.The documentation is recorded at the time observations or calculations are madeand must be signed or initialed/dated (month/day/year). It must be easily identifiablewho performed which tasks if multiple people were involved.
20.13.2.2 In general, concentration results are reported in milligrams per liter (mg/l) ormicrograms per liter (µg/l) for liquids and milligrams per kilogram (mg/kg) ormicrograms per kilogram (µg/kg) for solids. The units “mg/l” and “mg/kg” are thesame as “parts per million (ppm)”. The units “µg/l” and “µg/kg” are the same as“parts per billion (ppb).” For values greater than 10,000 mg/l, results can be reportedin percent, i.e., 10,000 mg/l = 1%.
• Several environmental methods, such as color, turbidity, conductivity, use veryspecific, non-concentration units to report results (e.g., NTU, umhos/cm etc).
• Occasionally, the client requests that results be reported in units which take intoaccount the measured flow of water or air during the collection of the sample. Whenthey provide this information, the calculations can be performed and reported.
20.13.2.3 In reporting, the analyst or the instrument output records the raw data result usingvalues of known certainty plus one uncertain digit. If final calculations are performedexternal to LIMS, the results should be entered in LIMS with at least three significant

Document No. IR-QAMSection Revision No.: 0
Section Effective Date: 01/31/2008Page 20-15 of 20-22
Company Confidential & Proprietary
figures. In general, client sample results are reported to 2 significant figures and QCsamples are reported to 3 significant figures on the final report.
20.13.2.4 For those methods that do not have an instrument printout or an instrumental outputcompatible with the LIMS System, the raw results and dilution factors are entereddirectly into LIMS by the analyst, and the software calculates the final result for theanalytical report. LIMS has a defined significant figure criterion for each analyte.
20.13.2.5 The laboratory strives to import data directly from instruments or calculationspreadsheets to ensure that the reported data are free from transcription andcalculation errors. For those analyses with an instrumental output compatible withthe LIMS, the raw results and dilution factors are transferred into LIMS electronicallyafter reviewing the quantitation report, and removing unrequested or poor spectrally-matched compounds. The analyst prints a copy of what has been entered to checkfor errors. This printout and the instrument’s printout of calibrations, concentrations,retention times, chromatograms, and mass spectra, if applicable, are retained withthe data file. The data file is stored in a monthly folder on the instrument computer;periodically, this file is transferred to the server and, eventually, to a tape file.
20.13.3 Logbook / Worksheet Use GuidelinesLogbooks and worksheets are filled out ‘real time’ and have enough information on them totrace the events of the applicable analysis/task. (e.g. calibrations, standards, analyst, sampleID, date, time on short holding time tests, temperatures when applicable, calculations aretraceable, etc.)
• Corrections are made following the procedures outlined in Section 13.
• Logbooks are controlled by the QA department. A record is maintained of all logbooks inthe lab.
• Unused portions of pages must be “Z”’d out, signed and dated.
• Worksheets are created with the approval of the Technical Director and QA Manager at thefacility. The QA Manager controls all worksheets following the procedures in Section 6.
20.13.4 Review / Verification ProceduresReview procedures are outlined in several SOPs (LOGIN.SOP [Sample Control],DATAREV.SOP [General Data Review], PMDATA.SOP [Project Management Data Reporting,Validation and Distribution]) to ensure that reported data are free from calculation andtranscription errors, that QC parameters have been reviewed and evaluated before data isreported. The laboratory also has an SOP discussing Manual Integrations to ensure theauthenticity of the data. (CA-Q-S-002, Acceptable Manual Integration Practices) The generalreview concepts are discussed below, more specific information can be found in the SOPs.
20.13.4.1 The data review process at TestAmerica Irvine starts at the Sample Control level.Sample Control personnel review chain-of-custody forms and input the sampleinformation and required analyses into a computer LIMS. The Sample ControlSupervisor reviews the transaction of the chain-of-custody forms and the inputted
Document No. IR-QAMSection Revision No.: 0
Section Effective Date: 01/31/2008Page 20-16 of 20-22
Company Confidential & Proprietary
information. The Project Managers perform final review of the chain-of-custody formsand inputted information.
20.13.4.2 The next level of data review occurs with the Analysts. As results are generated,analysts review their work to ensure that the results generated meet QC requirementsand relevant EPA methodologies. The Analysts transfer the data into the LIMS andadd data qualifiers if applicable (see Appendix 7 for list of common data qualifiers). Toensure data compliance, a different analyst performs a second level of review.Second level review is accomplished by checking reported results against raw dataand evaluating the results for accuracy. During the second level review, blank runs,QA/QC check results, continuing calibration results, laboratory control samples,sample data, qualifiers and spike information are evaluated. Approximately 15% ofall sample data from manual methods and from automated methods, all GC/MSspectra and all manual integrations are reviewed. Manual integrations are alsoelectronically reviewed utilizing auditing software to help ensure compliance to ethicsand manual integration policies. Issues that deem further review include the following:
• QC data are outside the specified control limits for accuracy and precision
• Reviewed sample data does not match with reported results
• Unusual detection limit changes are observed
• Samples having unusually high results
• Samples exceeding a known regulatory limit
• Raw data indicating some type of contamination or poor technique
• Inconsistent peak integration
• Transcription errors
• Results outside of calibration range
20.13.4.3 Unacceptable analytical results may require reanalysis of the samples. Anyproblems are brought to the attention of the Laboratory Director, Project Manager,Quality Assurance Manager, Department Manager for further investigation.Corrective action is initiated whenever necessary.
20.13.4.4 The results are then entered or directly transferred into the computer database and ahard copy (or .pdf) is printed for the client.
20.13.4.5 As a final review prior to the release of the report, the Project Manager reviews theresults for appropriateness and completeness. This review and approval ensuresthat client requirements have been met and that the final report has been properlycompleted. The process includes, but is not limited to, verifying that chemicalrelationships are evaluated, COC is followed, cover letters/ narratives are present,flags are appropriate, and project specific requirements are met. The following aresome examples of chemical relationships that are reviewed (if data is available):
• Total Results are > Dissolved results (e.g. metals)

Document No. IR-QAMSection Revision No.: 0
Section Effective Date: 01/31/2008Page 20-17 of 20-22
Company Confidential & Proprietary
• Total Solids (TS) > TDS or TSS
• TKN > Ammonia
• Total Phosphorus > Orthophosphate
• COD > TOC
• Total cyanide > Amenable Cyanide
• TDS > individual anions
20.13.4.6 Any project that requires a data package is subject to a tertiary data review fortranscription errors and acceptable quality control requirements. The ProjectManager then signs the final report. (Also see section 26 on Reporting Results).The accounting personnel also check the report for any clerical or invoicing errors.When complete, the report is sent out to the client.
20.13.4.7 A visual summary of the flow of samples and information through the laboratory, aswell as data review and validation, is presented in Figure 20-3.

Document No. IR-QAMSection Revision No.: 0
Section Effective Date: 01/31/2008Page 20-18 of 20-22
Company Confidential & Proprietary
20.13.5 Manual IntegrationsComputerized data systems provide the analyst with the ability to re-integrate raw instrumentdata in order to optimize the interpretation of the data. Though manual integration of data is aninvaluable tool for resolving variations in instrument performance and some sample matrixproblems, when used improperly, this technique would make unacceptable data appear to meetquality control acceptance limits. Improper re-integrations lead to legally indefensible data, apoor reputation, or possible laboratory decertification. Because guidelines for re-integration ofdata are not provided in the methods and most methods were written prior to widespreadimplementation of computerized data systems, the laboratory trains all analytical staff on propermanual integration techniques using SOP CA-Q-S-002 as the guidelines.
20.13.5.1 The analyst must adjust baseline or the area of a peak in some situations, forexample when two compounds are not adequately resolved or when a peak shoulderneeds to be separated from the peak of interest. The analyst must use professionaljudgment and common sense to determine when manual integrating is required.Analysts are encouraged to ask for assistance from a senior analyst or managerwhen in doubt.
20.13.5.2 Analysts shall not increase or decrease peak areas to for the sole purpose ofachieving acceptable QC recoveries that would have otherwise been unacceptable.The intentional recording or reporting of incorrect information (or the intentionalomission of correct information) is against company principals and policy and isgrounds for immediate termination.
20.13.5.3 Client samples, performance evaluation samples, and quality control samples are alltreated equally when determining whether or not a peak area or baseline should bemanually adjusted.
20.13.5.4 All manual integrations receive a second level review. Manual integrations must beindicated on an expanded scale “after” chromatograms such that the integrationperformed can be easily evaluated during data review. Expanded scale “before”chromatograms are also required for all manual integrations on QC parameters(calibrations, calibration verifications, laboratory control samples, internal standards,surrogates, etc.) unless the laboratory has another documented corporate approvedprocedure in place that can demonstrate an active process for detection anddeterrence of improper integration practices.
Document No. IR-QAMSection Revision No.: 0
Section Effective Date: 01/31/2008Page 20-19 of 20-22
Company Confidential & Proprietary
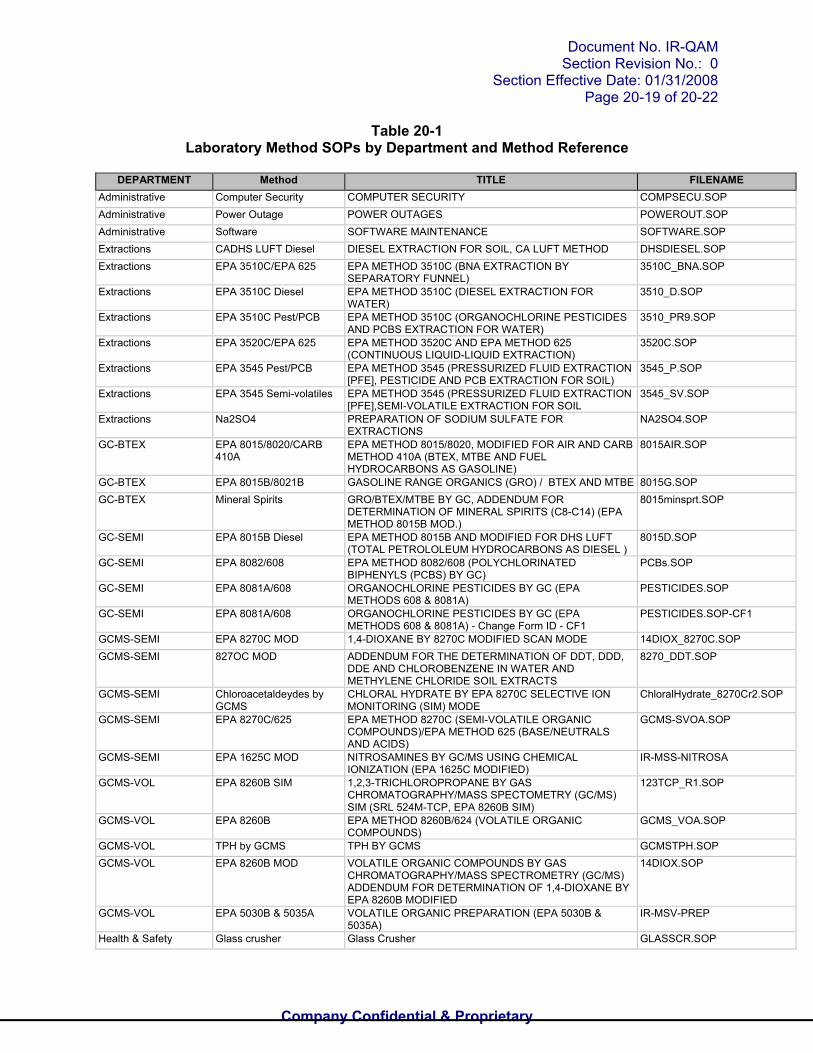
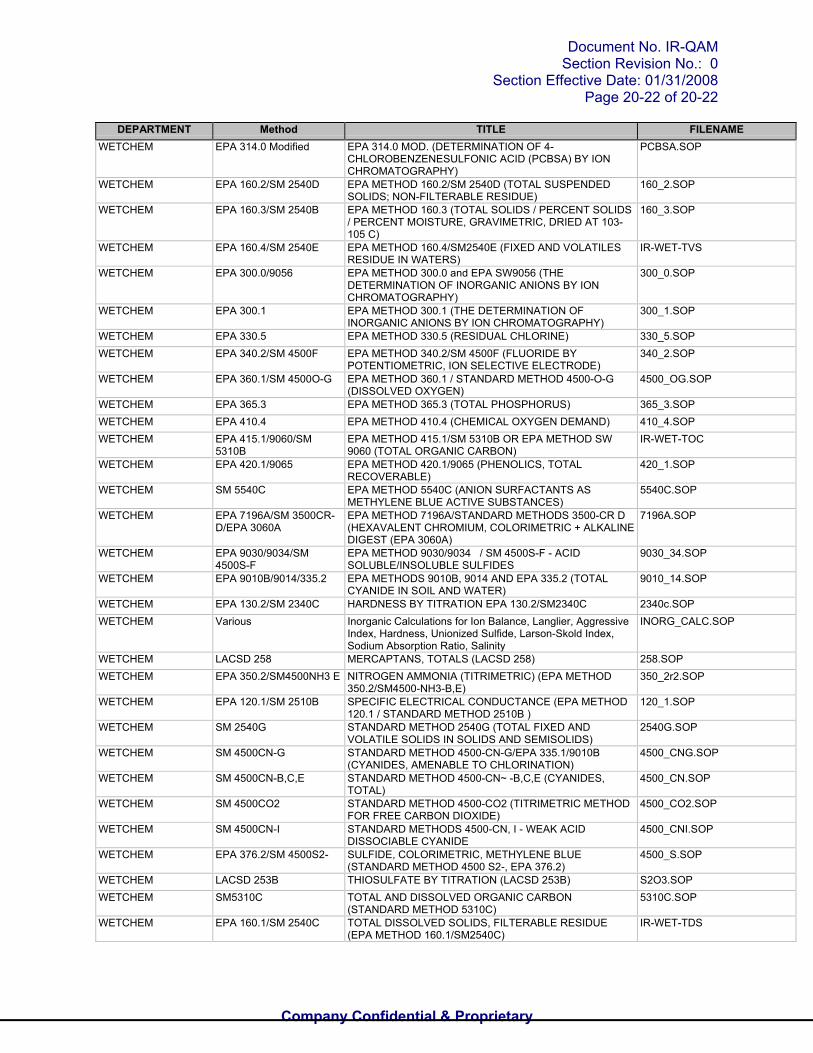
Table 20-1Laboratory Method SOPs by Department and Method Reference
DEPARTMENT Method TITLE FILENAMEAdministrative Computer Security COMPUTER SECURITY COMPSECU.SOPAdministrative Power Outage POWER OUTAGES POWEROUT.SOPAdministrative Software SOFTWARE MAINTENANCE SOFTWARE.SOPExtractions CADHS LUFT Diesel DIESEL EXTRACTION FOR SOIL, CA LUFT METHOD DHSDIESEL.SOPExtractions EPA 3510C/EPA 625 EPA METHOD 3510C (BNA EXTRACTION BY
SEPARATORY FUNNEL)3510C_BNA.SOP
Extractions EPA 3510C Diesel EPA METHOD 3510C (DIESEL EXTRACTION FORWATER)
3510_D.SOP
Extractions EPA 3510C Pest/PCB EPA METHOD 3510C (ORGANOCHLORINE PESTICIDESAND PCBS EXTRACTION FOR WATER)
3510_PR9.SOP
Extractions EPA 3520C/EPA 625 EPA METHOD 3520C AND EPA METHOD 625(CONTINUOUS LIQUID-LIQUID EXTRACTION)
3520C.SOP
Extractions EPA 3545 Pest/PCB EPA METHOD 3545 (PRESSURIZED FLUID EXTRACTION[PFE], PESTICIDE AND PCB EXTRACTION FOR SOIL)
3545_P.SOP
Extractions EPA 3545 Semi-volatiles EPA METHOD 3545 (PRESSURIZED FLUID EXTRACTION[PFE],SEMI-VOLATILE EXTRACTION FOR SOIL
3545_SV.SOP
Extractions Na2SO4 PREPARATION OF SODIUM SULFATE FOREXTRACTIONS
NA2SO4.SOP
GC-BTEX EPA 8015/8020/CARB410A
EPA METHOD 8015/8020, MODIFIED FOR AIR AND CARBMETHOD 410A (BTEX, MTBE AND FUELHYDROCARBONS AS GASOLINE)
8015AIR.SOP
GC-BTEX EPA 8015B/8021B GASOLINE RANGE ORGANICS (GRO) / BTEX AND MTBE 8015G.SOPGC-BTEX Mineral Spirits GRO/BTEX/MTBE BY GC, ADDENDUM FOR
DETERMINATION OF MINERAL SPIRITS (C8-C14) (EPAMETHOD 8015B MOD.)
8015minsprt.SOP
GC-SEMI EPA 8015B Diesel EPA METHOD 8015B AND MODIFIED FOR DHS LUFT(TOTAL PETROLOLEUM HYDROCARBONS AS DIESEL )
8015D.SOP
GC-SEMI EPA 8082/608 EPA METHOD 8082/608 (POLYCHLORINATEDBIPHENYLS (PCBS) BY GC)
PCBs.SOP
GC-SEMI EPA 8081A/608 ORGANOCHLORINE PESTICIDES BY GC (EPAMETHODS 608 & 8081A)
PESTICIDES.SOP
GC-SEMI EPA 8081A/608 ORGANOCHLORINE PESTICIDES BY GC (EPAMETHODS 608 & 8081A) - Change Form ID - CF1
PESTICIDES.SOP-CF1
GCMS-SEMI EPA 8270C MOD 1,4-DIOXANE BY 8270C MODIFIED SCAN MODE 14DIOX_8270C.SOPGCMS-SEMI 827OC MOD ADDENDUM FOR THE DETERMINATION OF DDT, DDD,
DDE AND CHLOROBENZENE IN WATER ANDMETHYLENE CHLORIDE SOIL EXTRACTS
8270_DDT.SOP
GCMS-SEMI Chloroacetaldeydes byGCMS
CHLORAL HYDRATE BY EPA 8270C SELECTIVE IONMONITORING (SIM) MODE
ChloralHydrate_8270Cr2.SOP
GCMS-SEMI EPA 8270C/625 EPA METHOD 8270C (SEMI-VOLATILE ORGANICCOMPOUNDS)/EPA METHOD 625 (BASE/NEUTRALSAND ACIDS)
GCMS-SVOA.SOP
GCMS-SEMI EPA 1625C MOD NITROSAMINES BY GC/MS USING CHEMICALIONIZATION (EPA 1625C MODIFIED)
IR-MSS-NITROSA
GCMS-VOL EPA 8260B SIM 1,2,3-TRICHLOROPROPANE BY GASCHROMATOGRAPHY/MASS SPECTOMETRY (GC/MS)SIM (SRL 524M-TCP, EPA 8260B SIM)
123TCP_R1.SOP
GCMS-VOL EPA 8260B EPA METHOD 8260B/624 (VOLATILE ORGANICCOMPOUNDS)
GCMS_VOA.SOP
GCMS-VOL TPH by GCMS TPH BY GCMS GCMSTPH.SOPGCMS-VOL EPA 8260B MOD VOLATILE ORGANIC COMPOUNDS BY GAS
CHROMATOGRAPHY/MASS SPECTROMETRY (GC/MS)ADDENDUM FOR DETERMINATION OF 1,4-DIOXANE BYEPA 8260B MODIFIED
14DIOX.SOP
GCMS-VOL EPA 5030B & 5035A VOLATILE ORGANIC PREPARATION (EPA 5030B &5035A)
IR-MSV-PREP
Health & Safety Glass crusher Glass Crusher GLASSCR.SOP

Document No. IR-QAMSection Revision No.: 0
Section Effective Date: 01/31/2008Page 20-20 of 20-22
Company Confidential & Proprietary
DEPARTMENT Method TITLE FILENAMEHealth & Safety Plastic shredder PLASTIC SHREDDER PLASTSH.SOPHealth & Safety Safety Manual SAFETY MANUAL & CHEMICAL HYGIENE PLAN SMCHP.DOCINORGANIC PREP EPA 3050B ACID DIGESTION FOR TOTAL METALS BY GFAA AND
ICP IN SOIL (EPA METHOD 3050B)3050B.SOP
INORGANIC PREP EPA 3020A ACID DIGESTION OF AQUEOUS SAMPLES ANDEXTRACTS FOR TOTAL METALS BY GFAA (EPAMETHOD 3020A)
3020A.SOP
INORGANIC PREP EPA 3010A ACID DIGESTION OF AQUEOUS SAMPLES ANDEXTRACTS FOR TOTAL METALS BY ICP (EPA METHOD3010A)
3010A.SOP
INORGANIC PREP EPA 200.2/3005A Acid Digestion of Water for Total Recoveralbe or DissolvedMetals by ICP and ICPMS
METPREP-W.SOP
INORGANIC PREP EPA 1010 EPA METHOD 1010 (PENSKY-MARTENS CLOSED-CUPMETHOD FOR DETERMINING IGNITABILITY)
1010.SOP
INORGANIC PREP EPA 150.1/9040/9045/SM4500H,B
EPA METHOD 150.1/ 9040B/ 9045C (ELECTROMETRICpH)
150_1.SOP
INORGANIC PREP SM 2120B EPA METHOD 2120B (COLOR, COLORIMETRIC-PLATINUM-COBALT)
2120B.SOP
INORGANIC PREP EPA 413.1 EPA METHOD 413.1 (TOTAL RECOVERABLE OIL ANDGREASE FOR WATER)
413_1.SOP
INORGANIC PREP EPA 413.2 EPA METHOD 413.2 (TOTAL RECOVERABLE OIL ANDGREASE FOR WATER)
413_2.SOP
INORGANIC PREP EPA 418.1 EPA METHOD 418.1 (TOTAL RECOVERABLEPETROLEUM HYDROCARBONS)
418_1.SOP
INORGANIC PREP SM 3500Fe-D FERROUS IRON BY SM 3500Fe-D 3500Fe_D.SOPINORGANIC PREP Glass Washing GLASSWARE CLEANING GLASS_E.SOPINORGANIC PREP EPA 1664A GRAVIMETRIC DETERMINATION OF N-HEXANE
EXTRACTABLE MATERIAL AND SILICA GEL TREATED N-HEXANE EXTRACTABLE MATERIAL IN WATER
1664A.SOP
INORGANIC PREP Ignitability IGNITABILITY IN SOIL IGNITE.SOPINORGANIC PREP EPA 160.5 SETTLEABLE MATTER (EPA METHOD 160.5 / SM2540F) IR-WET-SETTINORGANIC PREP SM 2710F SPECIFIC GRAVITY BY MASS RATIO (SM2710F) 2710F.SOPINORGANIC PREP SM 2580B STANDARD METHOD 2580B (OXIDATION REDUCTION
POTENTIAL)ORP.SOP
INORGANIC PREP STLC TITLE 22,SECTION 66261.126,APPENDIX II)
STLC/WET EXTRACTION (TITLE 22, SECTION 66261.126,APPENDIX II)
STLC.SOP
INORGANIC PREP EPA 1311/1312 TCLP & SPLP (EPA METHOD 1311 & 1312) 1311_1312.SOPINORGANIC PREP SM 2150B & EPA 140.1 THRESHOLD ODOR (SM 2150B & EPA 140.1) IR-WET-ODORINORGANIC PREP EPA 180.1 TURBIDITY, NEPHELOMETRIC (EPA METHOD 180.1 AND
STANDARD METHOD 2130B)180_1.SOP
METALS EPA 200.9 DETERMINATION OF TRACE ELEMENTS BY STABILIZEDTEMPERATURE GRAPHITE FURNACE AA (EPA METHOD200.9 & STANDARD METHOD 3113)
200_9.SOP
METALS EPA 9081A EPA METHOD 9081A CATION-EXCHANGE CAPACITY OFSOILS (SODIUM ACETATE)
9081A.SOP
METALS EPA 6010B/EPA 200.7 ICP METALS ANALYSES (EPA METHOD 6010B, EPAMETHOD 200.7)
ICP.SOP
METALS EPA 245.1/7470A/7471A MERCURY, COLD-VAPOR ATOMIC ABSORPTIONSPECTROMETRY (EPA METHODs 245.1/7470A/7471)
MERCURY.SOP
METALS EPA 200.8 METALS BY ICP/MS (EPA METHOD 200.8) 200_8.SOPMETALS EPA 6020 METALS BY ICP/MS (EPA METHOD 6020) 6020.SOPMETALS CA DTSC 939-M ORGANIC LEAD BY GRAPHITE FURNACE AA (CA DTSC
939-M)ORG_PB_GFAA.SOP
PM Data packages DATA PACKAGE GENERATION DATAPACKPM EDFs EDF (ELECTRONIC DATA FORMAT) EDF.SOPPM Client/Project set-up PROJECT MANAGEMENT--CLIENT/PROJECT SET-UP PMCLIENT.SOPPM Client communication PROJECT MANAGEMENT--COMMUNICATION AND
DOCUMENTATIONPMDOC.SOP

Document No. IR-QAMSection Revision No.: 0
Section Effective Date: 01/31/2008Page 20-21 of 20-22
Company Confidential & Proprietary
DEPARTMENT Method TITLE FILENAMEPM Data reporting PROJECT MANAGEMENT--DATA REPORTING,
VALIDATION AND DISTRIBUTIONPMDATA.SOP
PM WIP packages WELL INVESTIGATION PROGRAM (WIP) PackageGeneration
WIP.SOP
QA Balances BALANCE CALIBRATION VERIFICATION ANDDOCUMENTATION
BAL.SOP
QA BP GCLN BP GCLN Technical Requirements BPREQS.SOPQA Lot testing CONTAINER AND REAGENT VERIFICATION BY LOT
TESTINGLOTTEST.SOP
QA Control Limits CONTROL CHARTS AND STATISTICAL PROCESSCONTROL
CNTRLLIM.SOP
QA Corrective Actions CORRECTIVE ACTIONS CAR.SOPQA Data Integrity DATA INTEGRITY AND BUSINESS ETHICS PLAN DIBEP.SOPQA Ethics Policy DATA INTEGRITY AND ETHICAL PRACTICES POLICY
AND PROCEDUREDMA_ETHICS.SOP
QA MDLs DETERMINATION OF METHOD DETECTION LIMITS MDL.SOPQA Documents DOCUMENT CONTROL DOCCNTRL.SOPQA ET Edwards EARTH TECH/EDWARDS AFB PROJECT
REQUIREMENTSIR-QA-ETEDW.SOP
QA Data Review GENERAL DATA REVIEW DATAREV.SOPQA ICOC LEGAL CUSTODY PROCEDURES LEGALCOC.SOPQA Logbooks LOGBOOK DOCUMENTATION LOGBOOK.SOPQA Manual Integration MANUAL INTEGRATION AND DATA INTEGRITY MANINT.SOPQA Pipets PIPET CALIBRATION PIP.SOPQA QA Manual QUALITY ASSURANCE MANUAL QAMQA QA Department QUALITY ASSURANCE DEPARTMENT QADR5.SOPQA Reagents and Standards REAGENT AND STANDARD CONTROL AND
DOCUMENTATIONSTDCTRL.SOP
QA Archiving RECORD ARCHIVING ARCHIV.SOPQA Storage Blanks REFRIGERATOR STORAGE BLANKS REFBLK.SOPQA Sig Figs SIGNIFICANT FIGURES SIGFIGS.SOPQA Subsampling SUBSAMPLING SUBSAMP.SOPQA Thermometers THERMOMETER CALIBRATION, TEMPERATURE
MONITORING, AND DOCUMENTATIONTHERMA.SOP
QA Training TRAINING AND DOCUMENTATION TRAINING.SOPQA Qualifiers USE OF DATA QUALIFIERS DATAQUAL.SOPSample Control Bottle Prep BOTTLE PRESERVATION BTLPRP.SOPSample Control Courier COURIER COURIER.SOPSample Control Field Sampling FIELD SAMPLING FIELD.SOPSample Control Manual Entry MANUAL ENTRY OF SAMPLES FOR SAMPLE CONTROL MANUALOG.SOPSample Control Sample Control SAMPLE CONTROL LOGIN.SOPWETCHEM EPA 305.1 ACIDITY, TITRIMETRIC (EPA METHOD 305.1) 305_1.SOPWETCHEM EPA 3060A ALKALINE DIGESTION PROCEDURE FOR HEXAVALENT
CHROMIUM IN SOILS3060A.SOP
WETCHEM EPA 310.1/SM 2320B ALKALINITY BY SM2320B, EPA METHOD 310.1 2320B.SOPWETCHEM EPA 350.3/SM 4500 NH3 AMMONIA POTENTIOMETRIC, ION SELECTIVE
ELECTRODE350_3r6.SOP
WETCHEM EPA 405.1/SM 5210B BIOCHEMICAL OXYGEN DEMAND / CARBONACEOUSBIOLOGICAL OXYGEN DEMAND (EPA METHOD405.1/SM 5210B)
405_1.SOP
WETCHEM EPA 7199/218.6 Determination of Hexavalent Chromium by IonChromatography--EPA Methods 7199 and 218.6
Cr6IC.SOP
WETCHEM EPA 314.0 Determination of Perchlorate by Ion Chromatography--EPA314.0
314_0.SOP
Document No. IR-QAMSection Revision No.: 0
Section Effective Date: 01/31/2008Page 20-22 of 20-22
Company Confidential & Proprietary
DEPARTMENT Method TITLE FILENAMEWETCHEM EPA 314.0 Modified EPA 314.0 MOD. (DETERMINATION OF 4-
CHLOROBENZENESULFONIC ACID (PCBSA) BY IONCHROMATOGRAPHY)
PCBSA.SOP
WETCHEM EPA 160.2/SM 2540D EPA METHOD 160.2/SM 2540D (TOTAL SUSPENDEDSOLIDS; NON-FILTERABLE RESIDUE)
160_2.SOP
WETCHEM EPA 160.3/SM 2540B EPA METHOD 160.3 (TOTAL SOLIDS / PERCENT SOLIDS/ PERCENT MOISTURE, GRAVIMETRIC, DRIED AT 103-105 C)
160_3.SOP
WETCHEM EPA 160.4/SM 2540E EPA METHOD 160.4/SM2540E (FIXED AND VOLATILESRESIDUE IN WATERS)
IR-WET-TVS
WETCHEM EPA 300.0/9056 EPA METHOD 300.0 and EPA SW9056 (THEDETERMINATION OF INORGANIC ANIONS BY IONCHROMATOGRAPHY)
300_0.SOP
WETCHEM EPA 300.1 EPA METHOD 300.1 (THE DETERMINATION OFINORGANIC ANIONS BY ION CHROMATOGRAPHY)
300_1.SOP
WETCHEM EPA 330.5 EPA METHOD 330.5 (RESIDUAL CHLORINE) 330_5.SOPWETCHEM EPA 340.2/SM 4500F EPA METHOD 340.2/SM 4500F (FLUORIDE BY
POTENTIOMETRIC, ION SELECTIVE ELECTRODE)340_2.SOP
WETCHEM EPA 360.1/SM 4500O-G EPA METHOD 360.1 / STANDARD METHOD 4500-O-G(DISSOLVED OXYGEN)
4500_OG.SOP
WETCHEM EPA 365.3 EPA METHOD 365.3 (TOTAL PHOSPHORUS) 365_3.SOPWETCHEM EPA 410.4 EPA METHOD 410.4 (CHEMICAL OXYGEN DEMAND) 410_4.SOPWETCHEM EPA 415.1/9060/SM
5310BEPA METHOD 415.1/SM 5310B OR EPA METHOD SW9060 (TOTAL ORGANIC CARBON)
IR-WET-TOC
WETCHEM EPA 420.1/9065 EPA METHOD 420.1/9065 (PHENOLICS, TOTALRECOVERABLE)
420_1.SOP
WETCHEM SM 5540C EPA METHOD 5540C (ANION SURFACTANTS ASMETHYLENE BLUE ACTIVE SUBSTANCES)
5540C.SOP
WETCHEM EPA 7196A/SM 3500CR-D/EPA 3060A
EPA METHOD 7196A/STANDARD METHODS 3500-CR D(HEXAVALENT CHROMIUM, COLORIMETRIC + ALKALINEDIGEST (EPA 3060A)
7196A.SOP
WETCHEM EPA 9030/9034/SM4500S-F
EPA METHOD 9030/9034 / SM 4500S-F - ACIDSOLUBLE/INSOLUBLE SULFIDES
9030_34.SOP
WETCHEM EPA 9010B/9014/335.2 EPA METHODS 9010B, 9014 AND EPA 335.2 (TOTALCYANIDE IN SOIL AND WATER)
9010_14.SOP
WETCHEM EPA 130.2/SM 2340C HARDNESS BY TITRATION EPA 130.2/SM2340C 2340c.SOPWETCHEM Various Inorganic Calculations for Ion Balance, Langlier, Aggressive
Index, Hardness, Unionized Sulfide, Larson-Skold Index,Sodium Absorption Ratio, Salinity
INORG_CALC.SOP
WETCHEM LACSD 258 MERCAPTANS, TOTALS (LACSD 258) 258.SOPWETCHEM EPA 350.2/SM4500NH3 E NITROGEN AMMONIA (TITRIMETRIC) (EPA METHOD
350.2/SM4500-NH3-B,E)350_2r2.SOP
WETCHEM EPA 120.1/SM 2510B SPECIFIC ELECTRICAL CONDUCTANCE (EPA METHOD120.1 / STANDARD METHOD 2510B )
120_1.SOP
WETCHEM SM 2540G STANDARD METHOD 2540G (TOTAL FIXED ANDVOLATILE SOLIDS IN SOLIDS AND SEMISOLIDS)
2540G.SOP
WETCHEM SM 4500CN-G STANDARD METHOD 4500-CN-G/EPA 335.1/9010B(CYANIDES, AMENABLE TO CHLORINATION)
4500_CNG.SOP
WETCHEM SM 4500CN-B,C,E STANDARD METHOD 4500-CN~ -B,C,E (CYANIDES,TOTAL)
4500_CN.SOP
WETCHEM SM 4500CO2 STANDARD METHOD 4500-CO2 (TITRIMETRIC METHODFOR FREE CARBON DIOXIDE)
4500_CO2.SOP
WETCHEM SM 4500CN-I STANDARD METHODS 4500-CN, I - WEAK ACIDDISSOCIABLE CYANIDE
4500_CNI.SOP
WETCHEM EPA 376.2/SM 4500S2- SULFIDE, COLORIMETRIC, METHYLENE BLUE(STANDARD METHOD 4500 S2-, EPA 376.2)
4500_S.SOP
WETCHEM LACSD 253B THIOSULFATE BY TITRATION (LACSD 253B) S2O3.SOPWETCHEM SM5310C TOTAL AND DISSOLVED ORGANIC CARBON
(STANDARD METHOD 5310C)5310C.SOP
WETCHEM EPA 160.1/SM 2540C TOTAL DISSOLVED SOLIDS, FILTERABLE RESIDUE(EPA METHOD 160.1/SM2540C)
IR-WET-TDS

Document No. IR-QAMSection Revision No.: 0
Section Effective Date: 01/31/2008Page 20-23 of 20-22
Company Confidential & Proprietary
DEPARTMENT Method TITLE FILENAMEWETCHEM SM4500-Norg-C TOTAL KJELDAHL NITROGEN 4500NORG_C.SOP

Document No. IR-QAMSection Revision No.: 0
Section Effective Date: 01/31/2008Page 20-24 of 20-22
Company Confidential & Proprietary
Figure 20-1a.Example - Demonstration of Capability Checklist

Document No. IR-QAMSection Revision No.: 0
Section Effective Date: 01/31/2008Page 20-25 of 20-22
Company Confidential & Proprietary
Figure 20-1b.Example - Demonstration of Capability Document
DEMONSTRATION OF CAPABILITYCERTIFICATION STATEMENT
Date: Page 25 of 284Laboratory Name:Laboratory Address:Analyst(s) Name(s):
Matrix:SOP# and Rev#:Parameter:
We, the undersigned, CERTIFY that:
1. The analysts identified above, using the cited test method(s), which is in use at thisfacility for the analyses of samples under the National Environmental LaboratoryAccreditation Program, have met the Demonstration of Capability.
2. The test method(s) was performed by the analyst(s) identified on this certification.
3. A copy of the test method(s) and the laboratory-specific SOPs are available for allpersonnel on-site.
4. The data associated with the demonstration capability are true, accurate, complete, and self explanatory.1
5. All raw data (including a copy of this certification form) necessary toreconstruct and validate these analyses have been retained at the facility,and that the associated information is well organized and available forreview by authorized assessors.
Technical Director’s Name and Title Signature Date
___________________________________ Quality Assurance Manager Signature Date
1 True: Consistent with supporting data.Accurate: Based on good laboratory practices consistent with sound scientificprinciples/practices.Complete: Includes the results of all supporting performance testing.Self-Explanatory: Date properly labeled and stored so that the results are clear and require noadditional explanation.

Document No. IR-QAMSection Revision No.: 0
Section Effective Date: 01/31/2008Page 20-26 of 20-22
Company Confidential & Proprietary
Figure 20-2.
Example - New Method / Additional Analyte Checklist
New Method / Additional Analyte ChecklistThe following items are required to be completed prior to the acceptance of client samples. Fill in any blanks that donot apply with “NA”. Provide associated instrument QC when samples or QC samples are analyzed (includes runlog).
New Method _____________ Added Analytes _____________
1_____ Standard Operating Procedure• Note: For additional analytes, a ROMD [or whatever an internal communication memo is named in
your lab] can be used to add the analytes, include RL and matrix._____ Analysis SOP_____ Preparation SOP_____ SOP for any other relevant process_____ Pages from any applicable logbooks (instrument, standards, etc)
2_____Evaluation of Selectivity. As applicable: e.g. Retention Time Window Study, second column confirmation,Interelement correction checks, spectral or fluorescence profiles, etc.
3_____ Initial Calibration Curve (Include Tune verification or similar (e.g. degradation checks) if applicable)
4_____ Method Detection Limit (MDL) Study (summary and raw data) ______ Water
______ Soil______ Other
5_____ Real Sample and MS, MSD (CA ELAP Requirement)• Tap Water for water only methods• Local Soil sample for SW-846 methods (if applying for soil or soil/water)• Local water sample may be used in lieu of tap water if it is a non- drinking water method• Does not have to contain the target analytes
6_____ Reporting Limit Verification standard• Spike a blank matrix at the RL and process through the entire method. MDL study should be able to be
used if recovery is good. Note the spike level(s) and recovery(yies)
7_____ Demonstration of Capability (DOC) per analyst (Precision and Accuracy (P&A) verification)• 4 LCS for each matrix – most acceptance criteria are in the methods. The MDL study may be used if
DOC criteria are met.• Non-Standard methods – 3 x ( 1 LCS at LOQ-25%, 50%, 75% of the calibration range + Blank)
prepared each day. (see NELAC Chpt 5, appendix C.3.3 (b))
8_____ Acceptable PT sample(s) if available
Notes: PT sample required for all new methodsPT sample required for all new analytes under NELAP
Submitted by ______________________________ Date ____________
9_____ Certification/Approval from Regulatory Agency where available.
QA Review / Acceptance ________________________________ Date ___________

Document No. IR-QAMSection Revision No.: 0
Section Effective Date: 01/31/2008Page 20-27 of 20-22
Company Confidential & Proprietary
Figure 20-3.Work Flow

Document No. IR-QAMSection Revision No.: 0
Section Effective Date: 01/31/2008Page 21-1 of 21-50
Company Confidential & Proprietary
SECTION 21
EQUIPMENT (AND CALIBRATIONS(NELAC 5.5.5)
21.1 OVERVIEWTestAmerica purchases the most technically advanced analytical instrumentation for sampleanalyses. Instrumentation is purchased on the basis of accuracy, dependability, efficiency andsensitivity. Each laboratory is furnished with all items of sampling, preparation, analytical testingand measurement equipment necessary to correctly perform the tests for which the laboratoryhas capabilities. Each piece of equipment is capable of achieving the required accuracy andcomplies with specifications relevant to the method being performed. Before being placed intouse, the equipment (including sampling equipment) is calibrated and checked to establish that itmeets its intended specification. The calibration routines for analytical instruments establish therange of quantitation. Calibration procedures are specified in laboratory SOPs and aresummarized in Appendix 4 of the QA manual. A list of laboratory equipment and instrumentationis presented in Table 21-1.
Equipment is only operated by authorized and trained personnel. Manufacturer instructions forequipment use are readily accessible to all appropriate laboratory personnel.
21.2 PREVENTIVE MAINTENANCE
21.2.1 TestAmerica Irvine follows a well-defined program to ensure proper equipmentoperation and to prevent the failure of laboratory equipment or instrumentation during use. Thisprogram of preventive maintenance helps to avoid delays due to instrument failure.
21.2.2 Routine preventive maintenance procedures and frequency, such as lubrication,cleaning, and replacements, should be performed according to the procedures outlined in themanufacturer's manual. Qualified personnel must also perform maintenance when there isevidence of degradation of peak resolution, a shift in the calibration curve, loss of sensitivity, orfailure to continually meet one of the quality control criteria.
21.2.2.1 Calibrations, routine maintenance, and adjustments are part of the analysts' andDepartment Managers' responsibilities. However, service contracts may be in placefor some instruments to cover any major repairs.
21.2.2.2 High purity gases, reagents, and spare parts are kept on hand to minimize repairtime and optimize instrument performance.
21.2.3 Table 21-2 summarizes the schedule for routine maintenance. It is the responsibilityof each Department Manager to ensure that instrument maintenance logs are kept for allequipment in his/her department. Preventative maintenance procedures may also be outlined inanalytical SOPs or instrument manuals. (Note: for some equipment, the log used to monitorperformance is also the maintenance log. Multiple pieces of equipment may share the same logas long as it is clear as to which instrument is associated with an entry.)
Document No. IR-QAMSection Revision No.: 0
Section Effective Date: 01/31/2008Page 21-2 of 21-50
Company Confidential & Proprietary
21.2.4 Instrument maintenance logs are controlled and are used to document instrumentproblems, instrument repair and maintenance activities. Maintenance logs shall be kept for allmajor pieces of equipment. Instrument maintenance logs may also be used to specifyinstrument parameters.
21.2.4.1 Documentation must include all major maintenance activities such as contractedpreventive maintenance and service and in-house activities such as the replacementof electrical components, lamps, tubing, valves, columns, detectors, cleaning andadjustments.
21.2.4.2 Each entry in the instrument log includes the Analyst's initials, the date, a detaileddescription of the problem (or maintenance needed/scheduled), a detailed explanationof the solution or maintenance performed, and a verification that the equipment isfunctioning properly (state what was used to determine a return to control. e.g. CCVrun on ‘date’ was acceptable, or instrument recalibrated on ‘date’ with acceptableverification, etc.).
21.2.4.3 When maintenance or repair is performed by an outside agency, service receiptsdetailing the service performed can be affixed into the logbooks adjacent to pagesdescribing the maintenance performed. This stapled-in page must be signed acrossthe page entered and the logbook so that it is clear that a page is missing if only halfa signature is found in the logbook.
21.2.5 In addition, the maintenance records contain:
• The identification of the instrument/equipment (instrument’s Serial Number and ModelNumber)
• The date the instrument/equipment was put into use.• If available, the condition when the instrument was received (e.g. new, used, reconditioned).• Routine maintenance procedures and frequency or a reference to their location in the
method SOP(s).
21.2.6 If an instrument requires repair (subjected to overloading or mishandling, givessuspect results, or otherwise has shown to be defective or outside of specified limits) it shall betaken out of operation and tagged as out of service or otherwise isolated until such a time as therepairs have been made and the instrument can be demonstrated as operational by calibrationand/or verification or other test to demonstrate acceptable performance. The laboratory shallexamine the effect of this defect on previous analyses (refer to Sections 12 and 13).
21.2.7 In the event of equipment malfunction that cannot be resolved, service shall beobtained from the instrument vendor manufacturer, or qualified service technician, if such aservice can be tendered. If on-site service is unavailable, arrangements shall be made to havethe instrument shipped back to the manufacturer for repair. Back up instruments, which havebeen approved, for the analysis shall perform the analysis normally carried out by themalfunctioning instrument. If the back up is not available and the analysis cannot be carried outwithin the needed timeframe, the samples shall be subcontracted using the procedures outlinedin Section 8.

Document No. IR-QAMSection Revision No.: 0
Section Effective Date: 01/31/2008Page 21-3 of 21-50
Company Confidential & Proprietary
If an instrument is sent out for service or transferred to another facility, it must be recalibratedand verified (including new initial MDL study) prior to return to lab operations.
21.3 SUPPORT EQUIPMENTThis section applies to all devices that may not be the actual test instrument, but are necessaryto support laboratory operations. These include but are not limited to: balances, ovens,refrigerators, freezers, incubators, water baths, field sampling devices, temperature measuringdevices, thermal/pressure sample preparation devices and volumetric dispensing devices ifquantitative results are dependent on their accuracy, as in standard preparation and dispensingor dilution into a specified volume. All raw data records associated with the support equipmentare retained to document instrument performance.
21.3.1 Weights and Balances
The accuracy of the balances used in the laboratory is checked every working day, before use.All balances are placed on stable counter tops.
Each balance is checked prior to use with at least two certified ASTM type 1 weights spanningits range of use (weights that have been calibrated to ASTM type 1 weights may also be usedfor daily verification). ASTM type 1 weights used only for calibration of other weights (and noother purpose) are inspected for corrosion, damage or nicks at least annually and if no damageis observed, they are calibrated at least every 5 years by an outside calibration laboratory. Anyweights (including ASTM Type 1) used for daily balance checks or other purposes arerecalibrated/recertified annually to NIST standards (this may be done internally if laboratorymaintains “calibration only” ASTM type 1 weights).
All balances are serviced annually by a qualified service representative, who supplies thelaboratory with a certificate that identifies traceability of the calibration to the NIST standards.
All of this information is recorded in logs, and the recalibration/recertification certificates are kepton file. The laboratory SOP BAL.SOP (Balance Calibration, Verification and Documentation)covers these procedures in greater detail.
21.3.2 pH, Conductivity, and Turbidity Meters
The pH meters used in the laboratory are accurate to + 0.1 pH units, and have a scalereadability of at least 0.05 pH units. The meters automatically compensate for the temperature,and are calibrated with at least two working range buffer solutions before each use.
Conductivity meters are also calibrated before each use with a known standard to demonstratethe meters do not exceed an error of 1% or one umhos/cm.
Turbidity meters are also calibrated before each use. All of this information is documented inlogs.
Consult pH and Conductivity, and Turbidity SOPs for further information.
21.3.3 Thermometers

Document No. IR-QAMSection Revision No.: 0
Section Effective Date: 01/31/2008Page 21-4 of 21-50
Company Confidential & Proprietary
All thermometers are calibrated on an annual basis with a NIST-traceable thermometer. IRthermometers, digital probes and thermocouples are calibrated quarterly.
The NIST thermometer is recalibrated every five years (unless thermometer has been exposedto temperature extremes or apparent separation of internal liquid) by an approved outsideservice and the provided certificate of traceability is kept on file. The NIST thermometer hasincrements of 0.2 ºC, and has a range applicable to all method and certification requirements.The NIST traceable thermometer is used for no other purpose than to calibrate otherthermometers.
All of this information is documented in logbooks. Monitoring method-specific temperatures,including incubators, heating blocks, water baths, and ovens, is documented in method-specificlogbooks. More information on this subject can be found in the laboratory’s SOP THERMA.SOP(Thermometer Calibration/Temperature Monitoring and Documentation).
21.3.4 Refrigerators/Freezer Units, Waterbaths, Ovens and Incubators
The temperatures of all refrigerator units and freezers used for sample and standard storage aremonitored each working day.
Ovens, waterbaths and incubators are monitored on days of use.
All of this equipment has a unique identification number, and is assigned a unique thermometerfor monitoring.
Sample storage refrigerator temperatures are kept between > 0ºC and < 6 ºC.
Specific temperature settings/ranges for other refrigerators, ovens waterbaths, and incubatorscan be found in method specific SOPs.
All of this information is documented in Daily Temperature Logbooks and method-specificlogbooks.
21.3.5 Autopipettors, Dilutors, and Syringes
Mechanical volumetric dispensing devices including burettes (except Class A Glassware) arechecked for accuracy at least quarterly. Glass micro-syringes with volumes of 500 µL or greaterare checked for accuracy every six months.
The laboratory maintains a sufficient inventory of autopipettors, and dilutors of differingcapacities that fulfill all method requirements.
These devices are given unique identification numbers, and the delivery volumes are verifiedgravimetrically, at a minimum, on a quarterly basis (every six months for applicable syringes).
For those dispensers that are not used for analytical measurements, a label is applied to thedevice stating that it is not calibrated. Any device not regularly verified can not be used for any

Document No. IR-QAMSection Revision No.: 0
Section Effective Date: 01/31/2008Page 21-5 of 21-50
Company Confidential & Proprietary
quantitative measurements. See PIP.SOP (Pipet Calibration) for more details on pipettor,syringe, and dispenser calibration procedures.
Micro-syringes are purchased from Hamilton Company. Each syringe is traceable to NIST. Thelaboratory keeps on file an “Accuracy and Precision Statement of Conformance” from Hamiltonattesting established accuracy.
21.3.6 Field Sampling Devices (Isco Auto Samplers)
Each Auto Sampler (ISCO) is assigned a unique identification number in order to keep track of thecalibration. This number is also recorded on the sampling documentation.
The Auto Sampler is calibrated monthly by setting the sample volume to 100ml and recordingthe volume received. The results are filed in a logbook/binder. The Auto Sampler isprogrammed to run three (3) cycles and each of the three cycles is measured into a graduatedcylinder to verify 100ml are received.
If the RSD (Relative Standard Deviation) between the 3 cycles is greater than 10%, the procedureis repeated and if the result is still greater than 10%, then the Auto Sampler is taken out of serviceuntil it is repaired and calibration verification criteria can be met. The results of this check are keptin a logbook/binder.
21.4 INSTRUMENT CALIBRATIONSCalibration of analytical instrumentation is essential to the production of quality data. Strictcalibration procedures are followed for each method. These procedures are designed todetermine and document the method detection limits, the working range of the analyticalinstrumentation and any fluctuations that may occur from day to day.
Sufficient raw data records are retained to allow an outside party to reconstruct all facets of theinitial calibration. Records contain, but are not limited to, the following: calibration date, method,instrument, analyst(s) initials or signatures, analysis date, analytes, concentration, response,type of calibration (Avg RF, curve, or other calculations that may be used to reduce instrumentresponses to concentration.)
Sample results must be quantitated from the initial calibration and may not be quantitated fromany continuing instrument calibration verification unless otherwise required by regulation,method or program.If the initial calibration results are outside of the acceptance criteria, corrective action isperformed and any affected samples are reanalyzed if possible. If the reanalysis is notpossible, any data associated with an unacceptable initial calibration will be reported withappropriate data qualifiers (refer to Section 13).
Note: Instruments are calibrated initially and as needed after that and at least annually.
21.4.1 CALIBRATION STANDARDS

Document No. IR-QAMSection Revision No.: 0
Section Effective Date: 01/31/2008Page 21-6 of 21-50
Company Confidential & Proprietary
Calibration standards are prepared using the procedures indicated in the Reagents andStandards section of the determinative method SOP. However, the general procedures aredescribed below.
21.4.1.1 For each analyte and surrogate (if applicable) of interest, prepare calibrationstandards at the minimum number of concentrations as stated in the analyticalmethods. If a reference or mandated method does not specify the number ofcalibration standards, the minimum number is three, not including blanks or a zerostandard. All of the standard solutions are prepared using Class A volumetricglassware, calibrated pipettes, and/or microsyringes and appropriate laboratory qualitysolvents and stock standards.
21.4.1.2 Standards for instrument calibration are obtained from a variety of sources. Allstandards are traceable to NIST whenever possible. Dilution standards are preparedfrom stock standards purchased from commercial suppliers. The laboratory uses itsLIMS to document the following standard information: department, concentration, dateof receipt, date of standard preparation, expiration date, any dilutions made, lotnumber, supplier, type of solvent and a unique code number to identify the standard.
21.4.1.3 The lowest concentration calibration standard that is analyzed during an initialcalibration must be at or below the stated reporting limit for the method based on thefinal volume of extract (or sample).
21.4.1.4 The other concentrations define the working range of the instrument/method orcorrespond to the expected range of concentrations found in actual samples that arealso within the working range of the instrument/method. Results of samples notbracketed by initial instrument calibration standards (within calibration range to 3significant figures) must be reported as having less certainty, e.g., defined qualifiersor flags (additional information may be included in the case narrative). The lowestcalibration standard must be at or below the reporting limit. The exception to theserules is ICP methods or other methods where the referenced method does notspecify two or more standards.
21.4.1.5 Given the number of target compounds addressed by some of the organic methods,it may be necessary to prepare several sets of calibration standards, each setconsisting of the appropriate number of solutions at different concentrations. Theinitial calibration will then involve the analysis of each of these sets of the appropriatenumber of standards.
21.4.1.6 All initial calibrations are verified with a standard obtained from a second source andtraceable to a national standard, when available (or vendor certified different lot if asecond source is not available). For unique situations, such as air analysis where noother source or lot is available, a standard made by a different analyst would beconsidered a second source. This verification occurs immediately after thecalibration curve has been analyzed, and before the analysis of any samples.
21.4.2 CALIBRATION FOR ORGANIC METHODS (GC, HPLC, GC/MS)

Document No. IR-QAMSection Revision No.: 0
Section Effective Date: 01/31/2008Page 21-7 of 21-50
Company Confidential & Proprietary
21.4.2.1 Many of the organic analytical methods utilize an internal standard calibration(GCMS and some GC). Because of the complex nature of the multipeakchromatograms produced by the method, some instruments necessitate the use ofexternal standard calibration (most GC and HPLC). Surrogate compounds areincluded in the calibration processes for all appropriate organic analyses. For moredetails on the calibration types listed below, refer to SOP No. CA-Q-S-005,Calibration Curves.
21.4.2.2 Once the operating parameters have been established according to the method, eachinstrument is calibrated for the appropriate method. The analyst prepares five or morestandard solutions at various concentrations containing all of the analytes of interest,internal standards, and surrogates that are appropriate for the method. Note: Thereare a several EPA methods that have different requirements and are exceptions (e.g.EPA 547) where a minimum of 3 calibration standards are prepared and analyzed.
21.4.2.3 The standard solutions are introduced into the instrument in the same manner assamples are; whether it be by direct injection, by headspace analysis, or by purgeand trap. The calibration factor (CF) for methods that use external standards, andthe response factor (RF) for methods that use internal standards are calculated forthe five standards.
• External standard calibration involves comparison of instrument responses from thesample to the responses from the target compounds in the calibration standards.Sample peak areas (or peak heights) are compared to peak areas (or heights) of thestandards. The ratio of the response to the amount of analyte in the calibrationstandard is defined as the Calibration factor (CF).
• Internal standard calibration involves the comparison of instrument responses fromthe target compounds in the sample to the responses of specific standards added tothe sample or sample extract prior to injection. The ratio of the peak area (or height)of the target compound in the sample or sample extract to the peak area (or height)of the internal standard in the sample or sample extract is compared to a similar ratioderived for each calibration standard. The ratio is termed the response factor (RF),and may also be known as a relative response factor in other methods.
In many cases, internal standards are recommended. These recommended internal standardsare often brominated, fluorinated, or stable isotopically labeled analogs of specific targetcompounds, or are closely related compounds whose presence in environmental samples ishighly unlikely. The use of specific internal standards is available in the method SOP.
Whichever internal standards are employed, the analyst needs to demonstrate that themeasurement of the internal standard is not affected by method analytes and surrogates or bymatrix interferences. In general, internal standard calibration is not as useful for GC and HPLCmethods with non-MS detectors because of the inability to chromatographically resolve manyinternal standards from the target compounds. The use of MS detectors makes internalstandard calibration practical because the masses of the internal standards can be resolvedfrom those of the target compounds even when chromatographic resolution cannot be achieved.

Document No. IR-QAMSection Revision No.: 0
Section Effective Date: 01/31/2008Page 21-8 of 21-50
Company Confidential & Proprietary
When preparing calibration standards for use with internal standard calibration, add the sameamount of the internal standard solution to each calibration standard, such that theconcentration of each internal standard is constant across all of the calibration standards,whereas the concentrations of the target analytes will vary. The internal standard solution willcontain one or more internal standards and the concentration of the individual internal standardsmay differ within the spiking solution (e.g., not all internal standards need to be at the sameconcentration in this solution). The mass of each internal standard added to each sampleextract immediately prior to injection into the instrument or to each sample prior to purging mustbe the same as the mass of the internal standard in each calibration standard. The volume ofthe solution spiked into sample extracts should be such that minimal dilution of the extractoccurs (e.g., 10 uL of solution added to a 1 mL final extract results in only a negligible 1%change in the final extract volume which can be ignored in the calculations).
An ideal internal standard concentration would yield a response factor of 1 for each analyte.However, this is not practical when dealing with more than a few target analytes. Therefore, asa general rule, the amount of internal standard should produce an instrument response (e.g.,area counts) that is no more than 100 times that produced by the lowest concentration of theleast responsive target analyte associated with the internal standard. This should result in aminimum response factor of approximately 0.01 for the least responsive target compound. Referto SOP No. CA-Q-S-005, Calibration Curves, for specific calculations.
21.4.2.4 Policies regarding the use of calibration standard results for creating the calibrationcurve are as follows:
• A low calibration standard may be excluded from the calibration if the signal-to-noiseratio or spectral criteria are not suitable. The reporting level must be elevated to bethe lowest calibration standard used for calibration.
• The upper calibration standard may be excluded if it saturates the detector or isobviously becoming non-linear. Any sample exceeding the upper standard used inthe calibration must be diluted and re-analyzed.
• Mid-calibration standards may not be excluded unless an obvious reason is found,i.e., cracked vial, incorrectly made, etc. The failed standard should be re-runimmediately and inserted into the initial calibration. If not useful, recalibration isrequired.
21.4.2.5 Percent RSD Corrective Action
Given the potentially large numbers of analytes that may be analyzed in some methods, it islikely that some analytes may exceed the acceptance limit for the RSD for a given calibration. Inthose instances, the following steps are recommended, but not required.
21.4.2.5.1 The first step is generally to check the instrument operating conditions. Thisoption will apply in those instances where a linear instrument response isexpected. It may involve some trade-offs to optimize performance across alltarget analytes. For instance, changes to the operating conditions necessary toachieve linearity for problem compounds may cause the RSD for othercompounds to increase, but as long as all analytes meet the RSD limits forlinearity, the calibration is acceptable.

Document No. IR-QAMSection Revision No.: 0
Section Effective Date: 01/31/2008Page 21-9 of 21-50
Company Confidential & Proprietary
21.4.2.5.2 If the RSD for any analyte is greater than the applicable acceptance criteria in theapplicable analytical method (see also Appendix 4), the analyst may wish toreview the results (area counts, calibration or response factors, and RSD) forthose analytes to ensure that the problem is not associated with just one of theinitial calibration standards. If the problem appears to be associated with a singlestandard, that one standard may be reanalyzed and the RSD recalculated.Replacing the standard may be necessary in some cases.
21.4.2.5.3 A third alternative is to narrow the calibration range by replacing one or more ofthe calibration standards with standards that cover a narrower range. If linearitycan be achieved using a narrower calibration range, document the calibrationlinearity, and proceed with analyses. The changes to the upper end of thecalibration range will affect the need to dilute samples above the range, whilechanges to the lower end will affect the overall sensitivity of the method.Consider the regulatory limits or action levels associated with the target analyteswhen adjusting the lower end of the range.
Note: When the purpose of the analysis is to demonstrate compliance with aspecific regulatory limit or action level, the laboratory must ensure that themethod quantitation limit is at least as low as the regulatory limit or action level.
21.4.2.6 Alternatively, the least squares regression may be used to determine linearity. Afive point line must result in a correlation coefficient (r) of 0.990 or better usingthe least squares method to be considered acceptable. In many cases it may bepreferred that the curves be forced through zero (not to be confused withincluding the origin as an additional data point, which is not allowed). Note: EPAmethod 8000B does not allow forcing through zero however the agency hasrevaluated this position and has since changed this stance to allow forcingthrough zero. In addition, from EPA Method 8000C: “However, the use of alinear regression or forcing the regression through zero may NOT be used as arationale for reporting results below the calibration range demonstrated by theanalysis of the standards.”).
21.4.2.7 Instead of a linear curve model (either Average RF or least squares regression),a second order curve (Quadratic) may be used (and preferred) as long as itcontains at least six data points. As a rule of thumb, if there is a consistent trendin RFs (or CFs) in the calibration curve, either up or down, then quadratic curvefit may be indicated as the preferred calibration routine for that analyte. Thecoefficient of determination (COD or r2) for the quadratic curve must be at least0.99 for it to be considered acceptable. For more details on the calculations seeCalibration Curve SOP CA-Q-S-005. Some limitations on the use of QuadraticCurve fits:
21.4.2.7.1 Care MUST be exercised to assure that the results from this equation are real,positive, and fit the range of the initial calibration.
21.4.2.7.2 They may not be used to mask instrument problems that can be corrected bymaintenance. (Not to be used where the analyte is normally found to be linear ina properly maintained instrument).

Document No. IR-QAMSection Revision No.: 0
Section Effective Date: 01/31/2008Page 21-10 of 21-50
Company Confidential & Proprietary
21.4.2.7.3 They may not be used to compensate for detector saturation. If it is suspectedthat the detector is being saturated at the high end of the curve, remove thehigher concentration standards from the curve and try a 1st order fit or averageRF.
21.4.3 Calibration for Inorganic Analyses
EPA Method 7000 from EPA SW-846 is a general introduction to the quality controlrequirements for metals analysis. For inorganic methods, quality control measures set out inthe individual methods and in the Standard Methods for the Examination of Water andWastewater (20th Edition) may also be included. Standard Operating Procedures for theanalysis and the quality control documentation measures are kept in each department’s SOPbinder.
In general, inorganic instrumentation is calibrated with external standards. Some exceptionswould be Inductively Coupled Plasma (ICP), Inductively Coupled Plasma Mass Spec (ICPMS),and Ion Chromatography Mass Spec (ICMS). These analyses may use an internal standard tocompensate for viscosity or other matrix effects. While the calibration procedures are much thesame for inorganics as they are for organics, CF's or RF’s are not used. The calibration modelin 21.4.2.6 is generally used for most methods, however in some instances the model fromsection 21.4.2.7 may be used. A correlation coefficient (r) of 0.995 or greater must be used toaccept a calibration curve generated for an inorganic procedure. Correlation coefficients aredetermined by hand-held scientific calculators or by computer programs [state what your labuses] and documented as part of the calibration raw data. Coefficients of calibration curvesused for quantitation must be documented as part of the raw data. Curves are not allowed to bestored in calculator memories and must be written on the raw data for the purposes of datavalidation.
21.4.3.1 “Calibrations” for titrimetric analyses are performed by standardizing the titrantsagainst a primary standard solution. See specific methods in Standard Methods forthe Examination of Water and Wastewater (20th Edition) for more information.
21.4.3.2 Spreadsheets that are used for general chemistry calculations must have all cellscontaining calculations locked to prevent accidental changes to the calculations.
21.4.3.3 Instrument technologies (e.g. ICP) with validated techniques from the instrumentmanufacturer or other methods using a zero point and single point calibration requirethe following:
21.4.3.3.1 The instrument is calibrated using a zero point and a single point calibrationstandard.
21.4.3.3.2 The linear range is established by analyzing a series of standards, one at thereporting limit (RL).
21.4.3.3.3 Sample results within the established linear range do not need to be qualified.
21.4.3.3.4 The zero point and single standard is run daily with each analytical batch.
21.4.3.3.5 A standard at the RL is analyzed daily with each analytical batch and must meetestablished acceptance criteria.

Document No. IR-QAMSection Revision No.: 0
Section Effective Date: 01/31/2008Page 21-11 of 21-50
Company Confidential & Proprietary
21.4.3.3.6 The linearity is verified at a frequency established by the manufacturer ormethod.
21.4.4 Calibration Verification
The calibration relationship established during the initial calibration must be verified at periodicintervals as specified in the laboratory method SOPs in accordance with the referencedanalytical methods and NELAC (2003) standard, Section 5.5.5.10. The process of calibrationverification applies to both external standard and internal standard calibration techniques, aswell as to linear and non-linear calibration models.
Note: The process of calibration verification referred to is fundamentally different from theapproach called "calibration" in some methods. As described in those methods, the calibrationfactors or response factors calculated during calibration are used to update the calibrationfactors or response factors used for sample quantitation. This approach, while employed inother EPA programs, amounts to a daily single-point calibration, and is not appropriate norpermitted in SW-846 chromatographic procedures for trace environmental analyses.
21.4.4.1 Generally, the initial calibrations must be verified at the beginning of each 12-houranalytical shift during which samples are analyzed. (Some methods may specifymore or less frequent verifications). The 12-hour analytical shift begins with theinjection of the calibration verification standard (or the MS tuning standard in MSmethods). The shift ends after the completion of the analysis of the last sample orstandard that can be injected within 12 hours of the beginning of the shift.
21.4.4.2 A continuing instrument calibration verification (CCV) must be repeated at thebeginning and, for methods that have quantitation by external calibration models, atthe end of each analytical batch. Some methods have more frequent CCVrequirements see specific SOPs. Most Inorganic methods require the CCV to beanalyzed after ever 10 samples.
21.4.4.3 The acceptance limits for calibration verifications can be found in each method SOP.As a rule of thumb: GCMS + 20%, GC and HPLC + 15%, Inorganics: + 10 or 15%.Actual methods may have wider or tighter limits; see the method SOP for specifics.
21.4.4.4 If the response (or calculated concentration) for an analyte is within the acceptancelimits of the response obtained during the initial calibration, then the initial calibrationis considered still valid, and the analyst may continue to use the CF, RF or % driftvalues from the initial calibration to quantitate sample results.
21.4.4.5 If the response (or calculated concentration) for any analyte varies from the meanresponse obtained during the initial calibration by more than the acceptance criteria,then the initial calibration relationship may no longer be valid. If routine correctiveaction procedures fail to produce a second consecutive (immediate) calibrationverification within acceptance criteria, then either the laboratory has to demonstrateperformance after corrective action with two consecutive successful calibrationverifications, or a new initial instrument calibration must be performed. However,sample data associated with an unacceptable calibration verification may be reportedas qualified data under the following special conditions:

Document No. IR-QAMSection Revision No.: 0
Section Effective Date: 01/31/2008Page 21-12 of 21-50
Company Confidential & Proprietary
21.4.4.5.1 When the acceptance criteria for the calibration verification are exceeded high,i.e., high bias, and there are associated samples that are non-detects, then thosenon-detects may be reported. Otherwise, the samples affected by theunacceptable calibration verification shall be reanalyzed after a new calibrationcurve has been established, evaluated and accepted.
21.4.4.5.2 When the acceptance criteria for the calibration verification are exceeded low,i.e., low bias, those sample results may be reported if they exceed a maximumregulatory limit/decision level. Otherwise, the samples affected by theunacceptable verification shall be reanalyzed after a new calibration curve hasbeen established, evaluated and accepted. Alternatively, a reporting limitstandard may be analyzed to demonstrate that the laboratory can still supportnon-detects at their reporting limit.
21.4.4.6 Verification of Linear Calibrations
Calibration verification for linear calibrations involves the calculation of the percent drift or thepercent difference of the instrument response between the initial calibration and eachsubsequent analysis of the verification standard. Use the equations below to calculate % Driftor % Difference, depending on the procedure specified in the method SOP. Verificationstandards are evaluated based on the % Difference from the average CF or RF of the initialcalibration or based on % Drift or % Recovery if a linear or quadratic curve is used.
The Percent Difference is calculated as follows:
% Difference = (CF(v) or RF(v)) - (Avg. CF or RF) X 100(Avg. CF or RF)
Where: CF(v) or RF(v) = CF or RF from verification standardAvg. CF or RF = Average CF or RF from Initial Calibration.
The Percent Drift is calculated as follows:
% Drift = Result - True Value X 100 True Value
The Percent Recovery is calculated as follows:
% Recovery = Result X 100 True Value
21.4.4.7 Verification of a Non-Linear Calibration
Calibration verification of a non-linear calibration is performed using the percent drift or percentrecovery calculations described in 21.4.4.6 above.

Document No. IR-QAMSection Revision No.: 0
Section Effective Date: 01/31/2008Page 21-13 of 21-50
Company Confidential & Proprietary
Regardless of whether a linear or non-linear calibration model is used, if initial verificationcriterion is not met, then no sample analyses may take place until the calibration has beenverified or a new initial calibration is performed that meets the specifications listed in the methodSOPs. If the calibration cannot be verified after the analysis of a single verification standard,then adjust the instrument operating conditions and/or perform instrument maintenance, andanalyze another aliquot of the verification standard. If the calibration cannot be verified with thesecond standard, then a new initial calibration is performed.
All target analytes and surrogates, including those reported as non-detects, must be included inperiodic calibration verifications for purposes of retention time confirmation and to demonstratethat calibration verification criteria are being met.
All samples must be bracketed by periodic analyses of standards that meet the QC acceptancecriteria (e.g., calibration and retention time). The frequency is found in the laboratory’s SOP forthe specific method.
Note: If an internal standard calibration is being used (basically GCMS) then bracketingstandards are not required, only daily verifications are needed. The results from theseverification standards must meet the calibration verification criteria and the retention time criteria(if applicable).
21.5 POLICY ON TENTATIVELY IDENTIFIED COMPOUNDS (TICS) – GC/MS ANALYSISFor samples containing components not associated with the calibration standards, a librarysearch may be made for the purpose of tentative identification. The necessity to perform thistype of identification will be determined by the purpose of the analyses being conducted. Datasystem library search routines should not use normalization routines that would misrepresentthe library or unknown spectra when compared to each other.
Note: If the TIC compound is not part of the client target analyte list but is calibrated by thelaboratory and is both qualitatively and/or quantitatively identifiable, it will not be reported as aTIC. If the compound is reported on the same form as true TICs, it must be qualified and/ornarrated that the reported compound is qualitatively and quantitatively (if verification in control)reported compared to a known standard that is in control (where applicable).
For example, the RCRA permit or waste delisting requirements may require the reporting ofnon-target analytes. Only after visual comparison of sample spectra with the nearest librarysearches may the analyst assign a tentative identification. See SOPs IR-MSV-8260 and IR-MSS-8270 for guidelines on making tentative identifications
21.5.1 The following guidelines for making tentative identifications are taken from EPASW846 III edition, method 8260B.
21.5.1.1.1 Relative intensities of major ions in the reference spectrum (ions greater than 10% ofthe most abundant ion) should be present in the sample spectrum.
Document No. IR-QAMSection Revision No.: 0
Section Effective Date: 01/31/2008Page 21-14 of 21-50
Company Confidential & Proprietary
21.5.1.1.2 The relative intensities of the major ions should agree within ± 20%. (Example: Foran ion with an abundance of 50% in the standard spectrum, the correspondingsample ion abundance must be between 30 and 70%).
21.5.1.1.3 Molecular ions present in the reference spectrum should be present in the samplespectrum.
21.5.1.1.4 Ions present in the sample spectrum but not in the reference spectrum should bereviewed for possible background contamination or presence of coelutingcompounds.
21.5.1.1.5 Ions present in the reference spectrum but not in the sample spectrum should bereviewed for possible subtraction from the sample spectrum because of backgroundcontamination or coeluting peaks. Data system library reduction programs cansometimes create these discrepancies.
21.5.1.1.6 The concentration of any non-target analytes identified in the sample (see above)should be estimated. The same formulae as calibrated analytes should be used withthe following modifications: The areas Ax and Ais should be from the total ionchromatograms, and the RF for the compound should be assumed to be 1.
21.5.1.1.7 The resulting concentration should be reported indicating: (1) that the value is anestimate, and (2) which internal standard was used to determine concentration. Usethe nearest internal standard free of interferences.
21.5.1.2 For general reporting if TICs are requested, the ten (10), largest non-target analytepeaks whose area count exceeds 10% of the nearest internal standard will betermed “Tentatively Identified Compounds” (TICs). More or fewer TICs may beidentified based on client requirements.
21.5.1.3 TIC Reporting Limits
In general Reporting limits cannot be specified because of the unknown nature of the TIC. Anyreporting limit that is reported can only be evaluated as an estimate as the quantitation is basedon the assumption that the TIC responds exactly as the IS responds which is most likely not thecase. In general, it is not recommended to set a Reporting limit at too low of a concentration asit gives a false impression.
TICs that meet the above identification criteria (Section 21.5.1) at 10% area of the IS: The RLwould be 10% of the concentration of the internal standard used for quantitation. (e.g. 2.5 ug/Lfor 8260B, 4.0 ug/L for 8270C). In general, if the 10% area criteria is not met, the TIC RLsshould be set at a level approximately 5x the level of the poorest performer in the analysis.
If a compound meets the TIC criteria, the reporting limit will reflect the ratio between the TIC andthe IS or 5x the level of the poorest performer whichever is lower.
21.6 POLICY ON GC/MS TUNING

Document No. IR-QAMSection Revision No.: 0
Section Effective Date: 01/31/2008Page 21-15 of 21-50
Company Confidential & Proprietary
Prior to any GCMS analytical sequence, including calibration, the instrument parameters for thetune and subsequent sample analyses within that sequence must be set.
Prior to tuning/auto-tuning the mass spec, the parameters may be adjusted within thespecifications set by the manufacturer or the analytical method. These generally don't need anyadjustment but it may be required based on the current instrument performance. If the tuneverification does not pass it may be necessary to clean the source or perform additionalmaintenance. Any maintenance is documented in the maintenance log.
21.6.1 The concentration of the BFB or DFTPP must be at or below the concentrations thatare referenced in the analytical methods. Part of the purpose of the tune is to demonstratesensitivity and analyzing solutions at higher concentrations does not support this purpose. Tunefailures may be due to saturation and a lower BFB/DFTPP concentration may be warranted.
21.6.2 Tune evaluations usually utilize the "Autofind" function and are set up to look at theapex +/- 1 scan and average the three scans. Background correction is required prior to thestart of the peak but no more than 20 scans before. Background correction cannot include anypart of the target peak.
21.6.3 Other Options or if Auto Tune Fails:
21.6.3.1 Sometimes the instrument does not always correctly identify the apex on somepeaks when the peak is not perfectly shaped. In this case, manually identify andaverage the apex peak +/- 1 scan and background correct as in 21.6.4 above. Thisis consistent with EPA 8260 and 8270.
21.6.3.2 Or the scan across the peak at one half peak height may be averaged andbackground corrected. This is consistent with Standard Methods 6200, EPA 624 andEPA 625.
21.6.3.3 Adjustments such as adjustments to the repeller and ion focus lenses, adjusting theEM Voltage, etc. may be made prior to tune verification as long as all of thesubsequent injections in the 12 hour tune cycle are analyzed under the same MStune settings and it is documented in the run sequence log and/or maintenance logthat an adjustment was made. Excessive adjusting (more than 2 tries) without cleardocumentation is not allowed. Necessary maintenance is performed anddocumented in instrument log.
21.6.3.4 A single scan at the Apex (only) may also be used for the evaluation of the tune. ForSW 846 and EPA 600 series methods, background correction is still required.
21.6.3.5 Cleaning the source or other maintenance may be performed and then follow stepsfor tune evaluation above. Note: If significant maintenance was performed, seemethods 8000B or 8000C then the instrument may require recalibration prior toproceeding.
21.6.4 Tune evaluation printouts must include the chromatogram and spectra as well as theTune evaluation information. In addition, the verifications must be sent directly to the printer orpdf file (no screen prints for DFTPP or BFB tunes). This ability should be built into theinstrument software.

Document No. IR-QAMSection Revision No.: 0
Section Effective Date: 01/31/2008Page 21-16 of 21-50
Company Confidential & Proprietary
21.6.5 Since the limits are expressed in whole percentages, the results may be rounded towhole percentage before comparing to criteria when assessing the tune verification against thetune requirements. However, the comparison to the criteria is usually done automatically by thesoftware and if the printout says “Fail” then there would have to be documentation of the handcalculation on the raw data and comparison to the criteria if the lab intends to still accept thetune. In most cases the analyst is better off performing an adjustment and rerunning the tunestandard.
21.6.6 All MS tune settings must remain constant between running the tune check and allother samples. It is recommended that a separate tune method not be used, however aseparate method may be used as long as the MS conditions between the methods are the sameas the sample analysis method and tracked so any changes that are made to the analysismethod are also made to the tune method.

Document No. IR-QAMSection Revision No.: 0
Section Effective Date: 01/31/2008Page 21-17 of 21-50
Company Confidential & Proprietary
Table 21-1. Laboratory Equipment and Instrumentation
Instrument/Equipment
Manufacturer Model Number Serial Number YearPut intoService
ConditionWhen
ReceivedAcceleratedSolvent Extractor
Dionex ASE 200 96040278 2000 NEW
AcceleratedSolvent Extractor
Dionex ASE 200 120362 2001 NEW
AcceleratedSolvent Extractor
Dionex ASE 200 97040463 2001 NEW
AcceleratedSolvent Extractor
Dionex ASE 200 96090216 2001 NEW
AcceleratedSolvent Extractor
Dionex ASE 200 99120782 2002 NEW
AcceleratedSolvent Extractor
Dionex ASE 200E 07090745 2007 NEW
AcceleratedSolvent Extractor
Dionex ASE 200E 07090746 2007 NEW
Air Concentrator Entech 2000 1993 NEWAmmonia Probe Orion 96-12 Footnote
1Atomic AbsorptionSpectrophotometer
Perkin Elmer SIMAA 6000 5016 1995 NEW
Auto sampler Dionex AS40 98050117 2007 NEWAuto Sampler(Archon)
O.I. Analytical 4552 12243 2001 NEW
Auto Sampler(Archon)
Varian Archon 14636 2006 NEW
Auto Sampler(Archon)
Varian Archon 14633 2006 NEW
Auto Sampler(Archon)
Varian Archon 14634 2006 NEW
Auto Sampler(Archon)
Varian Archon 14632 2006 NEW
Auto Sampler(Archon)
Varian Archon 13171 2006 NEW
Auto Sampler(Archon)
Varian Archon 14638 2006 NEW
Auto Sampler(Archon)
O.I. Analytical 4552 14418 2004 NEW
Auto Sampler(Archon)
Varian Archon 14407 2006 NEW
Auto Sampler(Archon)
O.I. Analytical 4552 14417 2006 NEW
Auto Sampler(Archon)
Varian Archon 14418 2006 NEW
Auto Sampler(Archon)
Varian Archon 14195 2006 NEW
Auto Sampler(Archon)
Varian Archon 13388 2006 NEW

Document No. IR-QAMSection Revision No.: 0
Section Effective Date: 01/31/2008Page 21-18 of 21-50
Company Confidential & Proprietary
Instrument/Equipment
Manufacturer Model Number Serial Number YearPut intoService
ConditionWhen
ReceivedAuto Sampler(Archon)
Archon 14411 2006 NEW
Auto Sampler(Archon)
Varian Archon 14492 2006 NEW
Auto Sampler(Archon)
Varian Archon 14637 2006 NEW
Auto Sampler(Archon)
Varian Archon 14639 2006 NEW
Auto Sampler(Archon)
Varian Archon 13389 2006 NEW
Auto Sampler(DPM)
O.I. Analytical MPM 16 1993 NEW
Auto Sampler(DPM)
O.I. Analytical MPM 16 1997 NEW
Auto Sampler(DPM)
O.I. Analytical MPM/DPM 16 1993 NEW
Auto Sampler(DPM)
O.I. Analytical MPM 16 1992 NEW
Auto Sampler(DPM)
O.I. Analytical MPM-16 1993 NEW
Auto Sampler(DPM)
O.I. Analytical DPM 16 2003 NEW
Auto Sampler(DPM)
O.I. Analytical MPM 16 Footnote1
Auto Sampler forGC
Hewlett Packard 7673A Footnote1
Auto Sampler forGC
Hewlett Packard 7673B Footnote1
Auto Sampler forGC
Hewlett Packard 7673B Footnote1
Auto Sampler forGC
Hewlett Packard 7673A Footnote1
Auto Sampler forGC
LEAP
Auto Sampler forGC
Hewlett Packard 7673B Footnote1
Auto Sampler forGC
Agilent 7683 Footnote1
Auto Sampler forGC
Hewlett Packard 18596M Footnote1
Auto Sampler forGC
Agilent 7683 Footnote1
Auto Sampler forGC
Hewlett Packard 7673 Footnote1
Auto Sampler forGC
Hewlett Packard 7673 Footnote1
Auto Sampler forGC
Hewlett Packard 7673B 1993 NEW
Auto Sampler forGC
Hewlett Packard 7673B 1995 NEW

Document No. IR-QAMSection Revision No.: 0
Section Effective Date: 01/31/2008Page 21-19 of 21-50
Company Confidential & Proprietary
Instrument/Equipment
Manufacturer Model Number Serial Number YearPut intoService
ConditionWhen
ReceivedAuto Sampler forGC
Hewlett Packard 7673B 1993 NEW
Auto Sampler forGC
Agilent 7683 2003 NEW
Auto Sampler forGC
Agilent 7683 2005 NEW
Auto Sampler forGC
Hewlett Packard 7673B 1993 NEW
Auto Sampler forGC
Agilent 7683B CN63340749 2006 NEW
Auto Sampler forGC
Hewlett Packard 18593B 3120A26939 1992 NEW
Auto Sampler forGC
Agilent 7683 CN42637490 Footnote1
Auto Sampler forGC
Agilent G2614A CN55237971 Footnote1
Auto Sampler forIC
Dionex AS Footnote1
Auto Sampler forIC
Dionex AS 96060542 Footnote1
Auto Sampler forIC
Dionex AS 3080145 Footnote1
Auto Sampler forIC
Dionex AS 3080145 Footnote1
Auto Sampler forIC
Dionex AS50 0411004Y 2002 NEW
Auto Sampler forIC
Dionex AS50 99010302 2005 NEW
Auto Sampler forIC
Dionex AS40 932811 Footnote1
Auto Sampler forIC
Dionex AS40 06110242 2007 NEW
Auto Sampler forIC
Dionex AS50 00100242 Footnote1
Auto Sampler forMetals
Perkin Elmer AS-72 1464 1995 NEW
Auto Sampler forMetals
Perkin Elmer CETAC 060019ASX 2001 NEW
Auto Sampler forMetals
Perkin Elmer AS 91 913S3040101 1997 NEW
Auto Sampler forMetals
Perkin Elmer AS 93 1075 2002 NEW
Auto Sampler forMetals
Perkin Elmer AS 90 3380 1995 NEW
Auto Sampler forMetals
Perkin Elmer CETAC 080002ADX 2004 NEW
Auto Sampler forMetals
Perkin Elmer AS 91 6060 1995 NEW
Auto Sampler forMetals
Perkin Elmer AS 91 3023 2006 NEW