Distance Education- Emerging Technologies and Opportunities in Africa
NATIONAL CENTER FOR EDUCATION STATISTICS
Statistical Analysis Report December 1999
Distance Education atPostsecondary EducationInstitutions: 1997-98
Laurie LewisKyle SnowElizabeth FarrisWestat
Douglas LevinAmerican Institutes for Research
Bernie GreeneProject OfficerNational Center for Education Statistics
U.S. Department of EducationOffice of Educational Research and Improvement NCES 2000-013

U.S. Department of EducationRichard W. RileySecretary
Office of Educational Research and ImprovementC. Kent McGuireAssistant Secretary
National Center for Education StatisticsGary W. PhillipsActing Commissioner
The National Center for Education Statistics (NCES) is the primary federal entity for collecting, analyzing,and reporting data related to education in the United States and other nations. It fulfills a congressionalmandate to collect, collate, analyze, and report full and complete statistics on the condition of education inthe United States; conduct and publish reports and specialized analyses of the meaning and significanceof such statistics; assist state and local education agencies in improving their statistical systems; andreview and report on education activities in foreign countries.
NCES activities are designed to address high priority education data needs; provide consistent, reliable,complete, and accurate indicators of education status and trends; and report timely, useful, and highquality data to the U.S. Department of Education, the Congress, the states, other education policymakers,practitioners, data users, and the general public.
We strive to make our products available in a variety of formats and in language that is appropriate to avariety of audiences. You, as our customer, are the best judge of our success in communicatinginformation effectively. If you have any comments or suggestions about this or any other NCES productor report, we would like to hear from you. Please direct your comments to:
National Center for Education StatisticsOffice of Educational Research and ImprovementU.S. Department of Education555 New Jersey Avenue NWWashington, DC 20208-5574
December 1999
The NCES World Wide Web Home Page is:http://nces.ed.gov
Suggested CitationU.S. Department of Education, National Center for Education Statistics. Distance Education atPostsecondary Education Institutions: 1997-98. NCES 2000-013, by Laurie Lewis, Kyle Snow, ElizabethFarris, Douglas Levin. Bernie Greene, project officer. Washington, DC: 1999.
For ordering information on this report, writeU.S. Department of EducationED PubsP.O. Box 1398Jessup, MD 20794-1398
or by calling toll free 1-877-4ED-Pubs.
Content Contact:Bernie Greene(202) 219-1366
iii
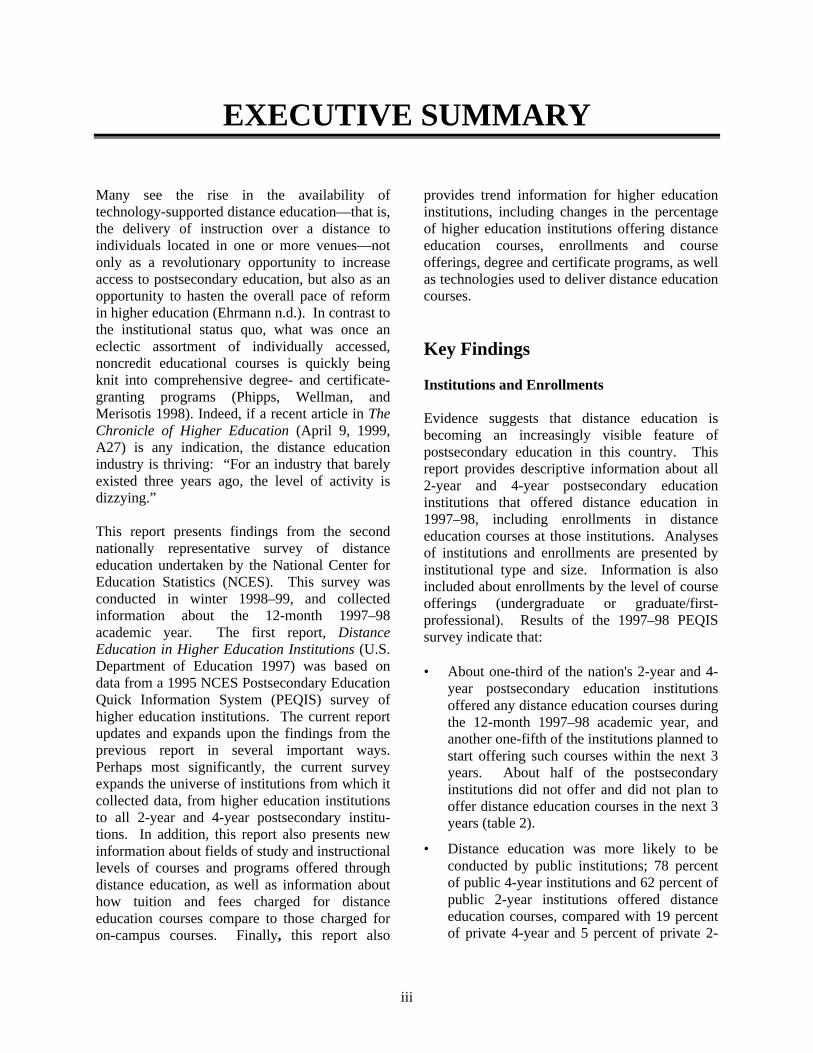
EXECUTIVE SUMMARY
Many see the rise in the availability oftechnology-supported distance education—that is,the delivery of instruction over a distance toindividuals located in one or more venues—notonly as a revolutionary opportunity to increaseaccess to postsecondary education, but also as anopportunity to hasten the overall pace of reformin higher education (Ehrmann n.d.). In contrast tothe institutional status quo, what was once aneclectic assortment of individually accessed,noncredit educational courses is quickly beingknit into comprehensive degree- and certificate-granting programs (Phipps, Wellman, andMerisotis 1998). Indeed, if a recent article in TheChronicle of Higher Education (April 9, 1999,A27) is any indication, the distance educationindustry is thriving: “For an industry that barelyexisted three years ago, the level of activity isdizzying.”
This report presents findings from the secondnationally representative survey of distanceeducation undertaken by the National Center forEducation Statistics (NCES). This survey wasconducted in winter 1998–99, and collectedinformation about the 12-month 1997–98academic year. The first report, DistanceEducation in Higher Education Institutions (U.S.Department of Education 1997) was based ondata from a 1995 NCES Postsecondary EducationQuick Information System (PEQIS) survey ofhigher education institutions. The current reportupdates and expands upon the findings from theprevious report in several important ways.Perhaps most significantly, the current surveyexpands the universe of institutions from which itcollected data, from higher education institutionsto all 2-year and 4-year postsecondary institu-tions. In addition, this report also presents newinformation about fields of study and instructionallevels of courses and programs offered throughdistance education, as well as information abouthow tuition and fees charged for distanceeducation courses compare to those charged foron-campus courses. Finally, this report also
provides trend information for higher educationinstitutions, including changes in the percentageof higher education institutions offering distanceeducation courses, enrollments and courseofferings, degree and certificate programs, as wellas technologies used to deliver distance educationcourses.
Key Findings
Institutions and Enrollments
Evidence suggests that distance education isbecoming an increasingly visible feature ofpostsecondary education in this country. Thisreport provides descriptive information about all2-year and 4-year postsecondary educationinstitutions that offered distance education in1997–98, including enrollments in distanceeducation courses at those institutions. Analysesof institutions and enrollments are presented byinstitutional type and size. Information is alsoincluded about enrollments by the level of courseofferings (undergraduate or graduate/first-professional). Results of the 1997–98 PEQISsurvey indicate that:
• About one-third of the nation's 2-year and 4-year postsecondary education institutionsoffered any distance education courses duringthe 12-month 1997–98 academic year, andanother one-fifth of the institutions planned tostart offering such courses within the next 3years. About half of the postsecondaryinstitutions did not offer and did not plan tooffer distance education courses in the next 3years (table 2).
• Distance education was more likely to beconducted by public institutions; 78 percentof public 4-year institutions and 62 percent ofpublic 2-year institutions offered distanceeducation courses, compared with 19 percentof private 4-year and 5 percent of private 2-
iv
year institutions. Distance education was alsostrongly related to institutional size; distanceeducation courses were more likely to beoffered by medium and large institutions thanby small institutions (table 2).
• There were an estimated 1,661,100enrollments1 in all distance education courses,and 1,363,670 enrollments in college-level,credit-granting distance education courses,with most of these at the undergraduate level(table 5). About half of the institutions thatreported offering distance education coursesin 1997–98 reported 300 or fewer enrollmentsin those courses (figure 1).
Course Offerings
Comprehensive information about the coursesavailable through distance education andenrollments in those courses has not been widelyavailable. To address this gap in the knowledgebase, this report provides information about totalcourses and college-level, credit-granting coursesoffered through distance education by allpostsecondary institutions. Analyses of courseofferings are presented by institutional type,general field of study, and instructional level ofthe course (undergraduate or graduate/first-professional). According to the 1997–98 PEQISsurvey:
• An estimated 54,470 different distanceeducation courses2 were offered, most ofwhich were college-level, credit-grantingcourses (49,690) (table 6). About half of theinstitutions that offered distance educationcourses in 1997–98 offered 15 or fewerdifferent distance education courses, with 23percent offering 1 to 5 courses (figure 2).Public 2-year and 4-year institutions
1 If a student was enrolled in multiple courses, institutions were
instructed to count the student for each course in which he or shewas enrolled. Thus, enrollments may include duplicated counts ofstudents.
2 If a course had multiple sections or was offered multiple timesduring the academic year, institutions were instructed to count it asonly one course.
combined offered about 8 out of 10 of thedistance education courses offered (table 6).
• The two fields in which more institutions thatoffered distance education courses offeredcollege-level, credit-granting distance educa-tion courses were the general field of English,humanities, and the social and behavioralsciences (70 percent of institutions) and thefield of business and management (55 percentof institutions) (table 7).
• The general pattern was for institutions tooffer for-credit distance education coursesmore at the undergraduate than at thegraduate/first-professional level. The excep-tions were in the fields of education,engineering, and library and informationsciences, where more college-level, credit-granting distance education courses wereoffered at the graduate/first-professional levelthan at the undergraduate level (table 7).
Degree and Certificate Programs
While taking individual courses through distanceeducation has the potential to increase access topostsecondary education among those whotraditionally have not had access, it is thepossibility of completing degree and certificateprograms solely through distance education thatoffers the potential for the most dramatic changesin access and opportunity. This report presentsinformation about the prevalence of distanceeducation degree and certificate programs in allpostsecondary institutions by institutional type,level of the degree and certificate programs, andgeneral field of study. The 1997–98 PEQISsurvey indicates that:
• Eight percent of all 2-year and 4-yearpostsecondary institutions offered college-level degree or certificate programs that weredesigned to be completed totally throughdistance education. Among the 34 percent ofinstitutions that offered any distanceeducation courses in 1997–98, 25 percentoffered distance education degrees orcertificates. Among all postsecondaryinstitutions, public 4-year institutions weremore likely than other types of institutions to
v
offer distance education degree and certificateprograms (table 13).
• In 1997–98, 2-year and 4-year postsecondaryinstitutions offered an estimated 1,230distance education degree programs and 340distance education certificate programs (table15). Postsecondary institutions offeringdistance education programs were more likelyto offer graduate/first-professional degrees orcertificates than undergraduate degrees orcertificates (table 15). Graduate/first-professional degree programs were mostlikely to be offered in business and manage-ment, the health professions, education, andengineering (table 14).
Distance Education Technologies Employed
Changes in the types of technologies available fordelivering distance education, including changesin the capabilities of networking technology andthe rise of the Internet, have played a role in theadoption of distance education by postsecondaryinstitutions. This report provides informationabout the types of technologies employed by allpostsecondary institutions to deliver distanceeducation in 1997–98. To provide insight into thedynamic nature of distance education tech-nologies, the report also includes informationabout institutions’ plans for the use of differenttechnologies in the next 3 years. According to the1997–98 PEQIS survey:
• While postsecondary education institutionsemployed a wide variety of distanceeducation technologies during 1997–98, moreinstitutions that offered distance educationcourses were likely to use several types ofvideo technologies and the Internet-basedtechnologies than any other modes ofdelivery included in the survey. Specifically,asynchronous Internet instruction, two-wayinteractive video, and one-way prerecordedvideo were used by more institutions than anyother distance education technologies (table17).
• Two-way interactive video was more likely tobe used by public 4-year institutions (80percent) than by any other type of institution,
and by public 2-year institutions (53 percent)more than private 4-year institutions (29percent). One-way prerecorded video wasmore likely to be used by public 2-yearinstitutions (62 percent) than by either publicor private 4-year institutions, and by public 4-year institutions (44 percent) more often thanby private 4-year institutions (26 percent).The Internet technologies, however, weregenerally about equally likely to be used bythe various types of institutions, ranging from16 percent to 22 percent for synchronousInternet instruction, and from 57 percent to61 percent for asynchronous Internetinstruction (table 17).
• Institutions that offered distance education in1997–98 or that planned to offer distanceeducation in the next 3 years reported thatthey planned to start using or increase theiruse of Internet-based technologies and two-way interactive video in the next 3 yearsmore than any other types of technologies.This suggests that Internet and interactivevideo technologies will be a growing mode ofdelivery among postsecondary institutions(table 18).
Tuition and Fees
While distance education can be seen as a costsavings approach to providing postsecondaryeducation, the costs in developing, implementing,and delivering distance education courses canalso be substantial. One might expect thatinstitutions might pass these costs or cost savingson by charging different tuition and fees tostudents enrolled in distance education courses.To examine this issue, this report providesinformation about how tuition and fees fordistance education courses compare to those fortraditional campus-based courses. Analyses arepresented by institutional type. Findings from the1997–98 PEQIS survey indicate that:
• About three-quarters of institutions thatoffered any distance education courses in1997–98 charged the same tuition for thesecourses as for comparable on-campuscourses. Public 2-year institutions were more
vi
likely than public or private 4-year institu-tions to indicate that tuition charges werealways the same for distance education andon-campus courses, with 90 percent of public2-year institutions giving this response (table20).
• Two-thirds of institutions offering distanceeducation courses in 1997–98 reported thatthey did not add special fees to their college-level, credit-granting distance educationcourses that were not added to on-campuscourses (figure 4).
• Overall, 57 percent of institutions arecharging both comparable tuition andcomparable fees for distance education andon-campus courses.
Changes in Distance Education Since 1994–95
While this report primarily presents findings onvarious aspects of distance education for allpostsecondary institutions for 1997–98, ananalysis of the data for the subset of highereducation institutions allows trend comparisonswith the previous NCES report on distanceeducation. Changes in distance education since1994–953 are presented in this report in terms ofthe percentage of institutions offering distanceeducation courses, the number of distanceeducation courses offered, the number ofenrollments in distance education courses, theavailability of distance education degree andcertificate programs, and the technologies used todeliver distance education courses. Findingsindicate that:
• Between fall 1995 and 1997–98, thepercentage of higher education institutionsoffering distance education courses increasedby about one-third, from 33 percent to 44percent (table 21). From 1994–95 to 1997–98, the number of course offerings andenrollments in distance education approxi-
3 The first PEQIS study, conducted in fall 1995, sometimes asked for
information about the current time frame (i.e., fall 1995), andsometimes asked for information about academic year 1994–95.Thus, both dates appear in the discussion of the results.
mately doubled (tables 22 and 23). And,although the percentages of institutionsoffering distance education degree andcertificate programs were essentially the samein 1997–98 as in 1995, the number of degreeand certificate programs that were offerednearly doubled (table 24). Taken together,these findings suggest that the expansion indistance education appears to be amonginstitutions that have offered distanceeducation for the past 3 years. Theseinstitutions have substantially increased thenumber of distance education courses,enrollments, and degree and certificateprograms that they offer.
• Among all higher education institutionsoffering any distance education, thepercentages of institutions using two-wayinteractive video and one-way prerecordedvideo were essentially the same in 1997–98as in 1995. The percentage of institutionsusing asynchronous Internet-based tech-nologies, however, nearly tripled, from 22percent of institutions in 1995 to 60 percentof institutions in 1997–98 (table 25)4.
Conclusions
This PEQIS report presents findings for the 12-month 1997–98 academic year about the status ofdistance education in all postsecondary educationinstitutions. It also includes an analysis of trendsin distance education since 1994–95 for thesubset of higher education institutions. In themost general terms, it finds that distanceeducation appears to have become a commonfeature of many postsecondary education institu-tions and that, by their own accounts, it willbecome only more common in the future.
While findings from this report will help toinform stakeholders—including individualsconsidering a postsecondary education, faculty
4 In 1997–98, the wording of the computer-based technologies was
changed to more accurately reflect how these technologies areused. For this comparison, other computer-based technology (e.g.,Internet) is considered to be approximately equivalent to Internetcourses using asynchronous computer-based instruction.
vii
and administrators at postsecondary institutions,providers of technologies used for distanceeducation, and policymakers at federal, state, andlocal levels—they do not address many of thequestions about distance education. Thesequestions include issues related to:
• equity of access to postsecondary education,
• the costs of developing and implementingdistance education programs,
• accreditation of and quality assurance indistance education programs,
• copyright and intellectual property rights,
• changes and challenges facing the role ofpostsecondary faculty, and
• pressures on existing organizational struc-tures and arrangements.
It is a dynamic time for postsecondary educationinstitutions facing the opportunities andchallenges brought by technological innovation.As Gladieux and Swail (1999) assert: given thefact that computer and related technologies areevolving so quickly—and new providers andbrokers of higher education proliferating sorapidly—no one knows how traditional highereducation will change.

viii
ix
Table of Contents
Chapter Page
Executive Summary ......................................................................................... iii
1 Introduction ...................................................................................................... 1
Overview .......................................................................................................... 2
What is Distance Education?............................................................... 2Why Might Institutions Implement Distance Education? ................... 2How is Distance Education Delivered?............................................... 3How is Distance Education Organized?.............................................. 5How Effective is Distance Education?................................................ 6Emerging Policy Issues ....................................................................... 7
Organization of this Report .............................................................................. 8
2 Institutions and Enrollments............................................................................. 11
Institutions Included in This Study................................................................... 11Institutions Offering Distance Education Courses ........................................... 12Overall Enrollment in Distance Education Courses......................................... 15Summary .......................................................................................................... 17
3 Course Offerings and Enrollments ................................................................... 19
Number of Distance Education Courses Offered in 1997–98 .......................... 19Course Offerings Included in the Study ........................................................... 22Course Offerings by Field of Study.................................................................. 23Enrollments by Field of Study.......................................................................... 27Summary .......................................................................................................... 29
4 Degree and Certificate Programs...................................................................... 31
Institutions Offering Degree and Certificate Programs.................................... 31Number of Degree and Certificate Programs ................................................... 34Summary .......................................................................................................... 36
5 Distance Education Technologies .................................................................... 37
Technologies Included in This Study............................................................... 37Instruction Technologies Used in 1997–98...................................................... 37Plans for Use of Instructional Technologies in the Next 3 Years .................... 39Summary .......................................................................................................... 41

x
Table of Contents (continued)
Chapter Page
6 Tuition and Fees ............................................................................................... 43
Tuition ............................................................................................................. 43Fees ............................................................................................................. 45Summary .......................................................................................................... 46
7 Changes in Distance Education Since 1994–95 .............................................. 47
Comparing the PEQIS Studies: An Overview................................................. 47Institutions Offering Distance Education Courses ........................................... 47Number of Distance Education Courses Offered ............................................. 49Enrollment in Distance Education Courses...................................................... 50Degree and Certificate Programs...................................................................... 51Distance Education Technologies .................................................................... 52Summary .......................................................................................................... 54
8 Conclusions ...................................................................................................... 55
References ........................................................................................................ 57
List of Appendices
Appendix
A: Survey Methodology and Data Reliability ....................................................... A-1
B: Tables of Standard Errors................................................................................. B-1
C: Survey Questionnaire ....................................................................................... C-1
List of Text Tables
Text Table
1 Percentage distribution of 2-year and 4-year postsecondary education institutions inthe nation, and the percentage distribution of students enrolled at those institutions,by institutional characteristics: 1997–98 ........................................................................ 12
2 Number and percentage distribution of 2-year and 4-year postsecondary educationinstitutions that offered distance education courses in 1997–98, that planned tooffer them in the next 3 years, and that did not offer and did not plan to offer themin the next 3 years, by institutional characteristics .......................................................... 12
3 Percentage distribution of 2-year and 4-year postsecondary education institutionsthat offered distance education courses in 1997–98, and the percentage distributionof students enrolled at those institutions, by institutional characteristics........................ 13

xi
Table of Contents (continued)
List of Text Tables
Text Table Page
4 Total number of 2-year and 4-year postsecondary education institutions, and thenumber and percent of institutions in the nation that offered distance educationcourses in 1997–98, by level of institutional offerings.................................................... 14
5 Total number of enrollments in all distance education courses, and the number ofenrollments in college-level, credit-granting distance education courses offered by2-year and 4-year postsecondary education institutions in 1997–98, by institutionalcharacteristics .................................................................................................................. 16
6 Total number of different distance education courses, and the number of differentcollege-level, credit-granting distance education courses offered by 2-year and 4-year postsecondary education institutions in 1997–98, by institutionalcharacteristics .................................................................................................................. 20
7 Percent of 2-year and 4-year postsecondary education institutions offering anydistance education courses in 1997–98 that offered college-level, credit-grantingdistance education courses in various fields of study in 1997–98, by course leveland field ........................................................................................................................... 23
8 Percent of all 2-year and 4-year postsecondary education institutions offering anydistance education courses in 1997–98 that offered college-level, credit-grantingdistance education courses in various fields of study in 1997–98, by institutionaltype and field ................................................................................................................... 24
9 Number of different college-level, credit-granting distance education coursesoffered in various fields by 2-year and 4-year postsecondary education institutionsin 1997–98, by course level and field.............................................................................. 25
10 Number of different college-level, credit-granting distance education coursesoffered in various fields by 2-year and 4-year postsecondary education institutionsin 1997–98, by institutional type and field ...................................................................... 26
11 Number of enrollments in college-level, credit-granting distance education coursesoffered in various fields at 2-year and 4-year postsecondary education institutionsin 1997–98, by course level and field.............................................................................. 27
12 Number of enrollments in college-level, credit-granting distance education coursesoffered in various fields at 2-year and 4-year postsecondary education institutionsin 1997–98, by institutional type and field ...................................................................... 28
13 Percent of all 2-year and 4-year postsecondary education institutions offering anydistance education courses in 1997–98, and the percent that had college-leveldegree or certificate programs designed to be completed totally through distanceeducation in 1997–98, by institutional characteristics..................................................... 32

xii
Table of Contents (continued)
List of Text Tables
Text Table Page
14 Percent of 2-year and 4-year postsecondary education institutions offering anydistance education courses in 1997–98 that had college-level degree or certificateprograms in various fields that were designed to be completed totally throughdistance education, by level and field.............................................................................. 33
15 Number of college-level degree and certificate programs designed to be completedtotally through distance education offered by 2-year and 4-year postsecondaryeducation institutions in 1997–98, by institutional characteristics .................................. 34
16 Number of college-level degree programs in selected fields designed to becompleted totally through distance education offered by 2-year and 4-yearpostsecondary education institutions in 1997–98, by level and field .............................. 35
17 Percent of 2-year and 4-year postsecondary education institutions offering distanceeducation courses in 1997–98 indicating that the institution used various types oftechnology as a primary mode of instructional delivery for distance educationcourses in 1997–98, by institutional characteristics ........................................................ 38
18 Percentage distribution of 2-year and 4-year postsecondary education institutionsthat offered distance education in 1997–98 or that planned to offer distanceeducation in the next 3 years according to their plans for the next 3 yearsconcerning the number of distance education courses that will be offered, by typeof technology that will be used as the primary mode of instructional delivery ............... 39
19 Percent of 2-year and 4-year postsecondary education institutions offering distanceeducation in 1997–98 or planning to offer distance education in the next 3 yearsthat planned to start or increase their use of various types of technologies as theprimary mode of instructional delivery during the next 3 years...................................... 40
20 Percentage distribution of 2-year and 4-year postsecondary education institutionsoffering distance education courses in 1997–98 according to how tuition chargesfor college-level, credit-granting courses offered through distance educationcompare to tuition charges for equivalent on-campus courses at their institution, byinstitutional characteristics .............................................................................................. 43
21 Percentage distribution of 2-year and 4-year higher education institutions accordingto current or planned offering of distance education courses, by institutionalcharacteristics: Fall 1995 and 1997–98 .......................................................................... 48
22 Number of different distance education courses offered by 2-year and 4-year highereducation institutions in 1994–95 and 1997–98, by institutional characteristics ............ 49
23 Number of enrollments in 1994–95 and 1997–98 in distance education coursesoffered by 2-year and 4-year higher education institutions, by institutionalcharacteristics .................................................................................................................. 50
xiii
Table of Contents (continued)
List of Text Tables
Text Table Page
24 Percent of 2-year and 4-year higher education institutions offering distanceeducation courses that offered distance education degree and certificate programs,and the number of such programs in 1995 and 1997–98................................................. 51
25 Percent of 2-year and 4-year higher education institutions offering distanceeducation courses that used various types of technologies to deliver distanceeducation courses in 1995 and 1997–98.......................................................................... 52
26 Percent of 2-year and 4-year higher education institutions offering distanceeducation courses that used selected types of technologies to deliver distanceeducation courses in 1995 and 1997–98, by institutional type ........................................ 53
List of Figures
Figure
1 Percentage distribution of 2-year and 4-year postsecondary education institutionsoffering distance education courses in 1997–98 according to number of enrollmentsin distance education courses........................................................................................... 17
2 Percentage distribution of 2-year and 4-year postsecondary education institutionsoffering distance education courses in 1997–98 according to number of distanceeducation courses............................................................................................................. 21
3 Percentage distribution of 2-year and 4-year postsecondary education institutionswith variable charges for distance education courses compared with equivalent on-campus courses in 1997–98 indicating how those tuition charges for distanceeducation courses differ................................................................................................... 44
4 Percentage distribution of 2-year and 4-year postsecondary education institutionsoffering distance education courses in 1997–98 indicating whether the institutionadds any special fees to college-level, credit-granting distance education coursesthat are not added to on-campus courses ......................................................................... 45
5 Percentage distribution of 2-year and 4-year postsecondary education institutionswith the same tuition for distance education and comparable on-campus courses in1997–98 indicating whether the institution adds any special fees to college-level,credit-granting distance education courses that are not added to on-campus courses ..... 45
List of Exhibits
Exhibit
1 Generations of Distance Education Technologies ........................................................... 4

xiv

1
1. INTRODUCTION
Management pundit Peter Drucker has predicted that the residential university campus aswe know it will be defunct within 30 years. A better bet is that traditional highereducation will change, not disappear. The question is: How will it change? The fact is,computer and related technologies are evolving so quickly—and new providers andbrokers of higher education proliferating so rapidly—no one knows. (Gladieux and Swail1999, 7)
Many see the rise in the availability oftechnology-supported distance education—that is,the delivery of instruction over a distance toindividuals located in one or more venues—notonly as a revolutionary opportunity to increaseaccess to postsecondary education, but also as anopportunity to hasten the overall pace of reformin higher education (Ehrmann n.d.). In contrast tothe institutional status quo, what was once aneclectic assortment of individually accessed,noncredit educational courses is quickly beingknit into comprehensive degree- and certificate-granting programs (Phipps, Wellman, andMerisotis 1998). Indeed, if a recent article in theChronicle of Higher Education (April 9, 1999,A27) is any indication, the distance educationindustry is thriving: “For an industry that barelyexisted three years ago, the level of activity isdizzying.”
This report, conducted by the National Center forEducation Statistics (NCES), presents findingsfrom the second nationally representative surveyof distance education at the postsecondary level.This survey, conducted in winter 1998–99,collected information about the 12-month 1997–98 academic year. The first report, DistanceEducation in Higher Education Institutions (U.S.Department of Education 1997) was based ondata from a 1995 NCES Postsecondary EducationQuick Information System (PEQIS) survey ofhigher education institutions. It reported findingson the number of institutions offering distanceeducation courses, the number of distance
education courses offered, enrollments in distanceeducation courses, the number of distanceeducation degree and certificate programsoffered, and the types of technologies used todeliver distance education. As the first NCESreport on the topic, it provided valuable baselineinformation about the status of distance educationin higher education institutions.
The current report updates and expands upon thefindings presented in the previous report inseveral important ways. Perhaps mostsignificantly, the current survey expands theuniverse of institutions from which it collecteddata, from higher education institutions to all 2-year and 4-year postsecondary institutions. Inaddition, this report also presents newinformation about fields of study and instructionallevels of courses and programs offered throughdistance education, as well as information abouthow tuition and fees charged for distanceeducation courses compare to those charged foron-campus courses. Finally, this report alsoprovides trend information for higher educationinstitutions, including changes in the percentageof higher education institutions offering distanceeducation courses, enrollments and courseofferings, degree and certificate programs, as wellas technologies used to deliver distance educationcourses. These empirical results are provided inthe following chapters of this report. Theremainder of this chapter provides a briefoverview of issues related to distance education.

2
Overview
What is Distance Education?
Distance education in the most general sense ofthe term is instruction delivered over a distance toone or more individuals located in one or morevenues (Phipps, Wellman, and Merisotis 1998).By this definition, the history of distanceeducation can be traced back as far as the 1830swith the advent of commercial correspondencecourses (Hanson et al. 1997). But the advent ofadvanced information technologies and, inparticular, the Internet, has profoundly altered thecharacter of distance education. Indeed, rapidchanges in technology continue to challenge thetraditional ways in which distance education isdefined (Hanson et al. 1997)—resulting in thepresent situation where the term “distanceeducation” is applied to a great variety ofprograms, providers, audiences, and media(Sherry 1996).
For the purposes of this study, distance educationrefers to education or training courses deliveredto remote (off-campus) location(s) via audio,video (live or prerecorded), or computertechnologies, including both synchronous andasynchronous instruction. Courses conductedexclusively on campus, as well as classesconducted exclusively via written corres-pondence, are not included in this definition ofdistance education (although some on-campusinstruction or testing may be involved, and someinstruction may be conducted via writtencorrespondence). In addition, for the purposes ofthis study, distance education does not includecourses in which the instructor travels to a remotesite to deliver instruction in person, althoughcourses may include a small amount of on-campus coursework or labwork, on-campusexams, or occasional on-campus meetings.
Why Might Institutions ImplementDistance Education?
Several forces are at work in what some havecharacterized as the “current rush” to implementdistance learning programs by colleges and
universities, including the convergence ofcommunication and computing technologies, thechanging demographics of students pursuingpostsecondary education, and the need to reducethe cost of education (Sherron and Boettcher1997). It has been suggested that the primarybenefits of implementing distance educationprograms for postsecondary institutions includethe potential to increase enrollments ofnontraditional students and to reduce programcosts (Willis 1995). The 1995 PEQIS findingsindicate, for example, that a large majority ofinstitutions believed it somewhat or veryimportant that their distance education offeringsincrease access to new audiences and increaseenrollments. In addition, fewer institutions (butstill a majority) reported that reducing institu-tional per-student costs was a somewhat or veryimportant goal to their distance educationprogram.
It has also been suggested that the benefits ofimplementing distance education programs alsoaccrue to students. Accordingly, the primarybenefit of distance education may be that it hasthe potential to provide access to postsecondaryeducation where otherwise it might not have beenavailable, due to such constraints as geography,time, job and family responsibilities, or finances(Sherron and Boettcher 1997). Increased accessto certificate and degree programs via distanceeducation may have the further benefit ofencouraging students to undertake these programsor to complete them more quickly, particularly forpart-time students (Turoff 1997). Findings fromthe 1995 PEQIS study on distance educationindicate that institutions support these goals. Forinstance, a large majority of higher educationinstitutions using distance education reported thatimproving access by making courses available atconvenient locations and by reducing timeconstraints were somewhat or very importantgoals in their decision to use distance education.However, research evidence on the impact ofdistance education on access, as well as researchevidence on distance education’s impact on bothenrollments and program costs, is not conclusive(Gladieux and Swail 1999).
3
How is Distance Education Delivered?
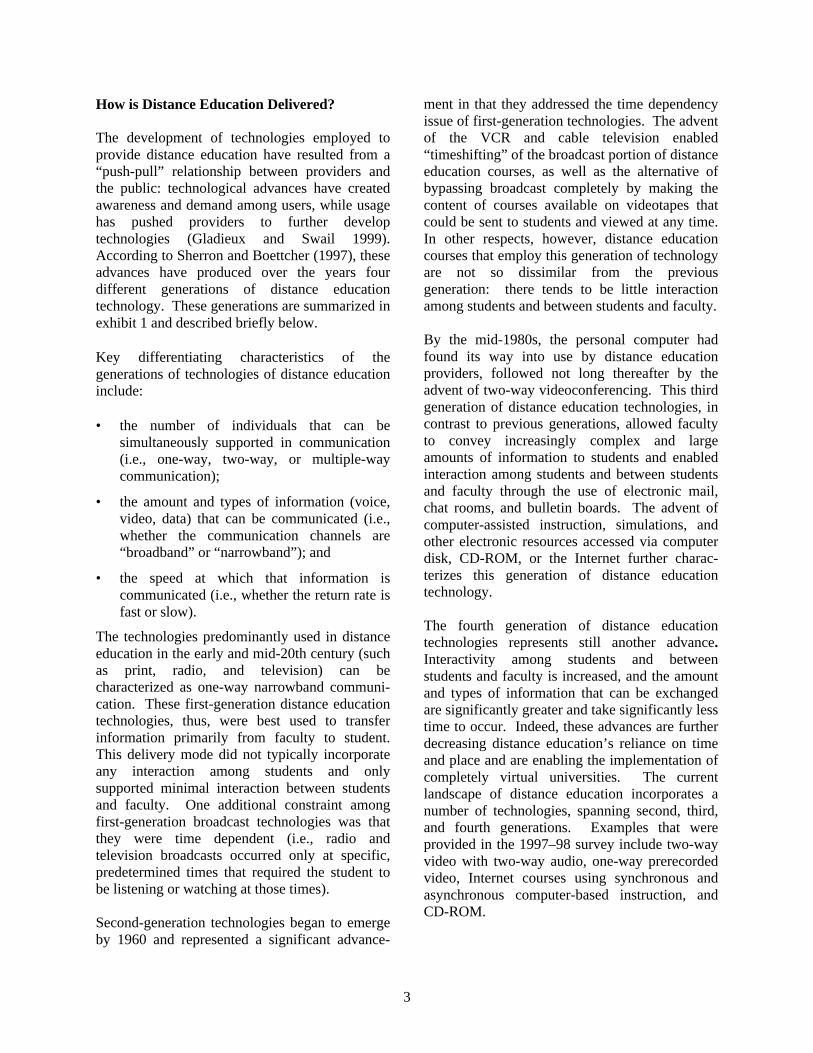
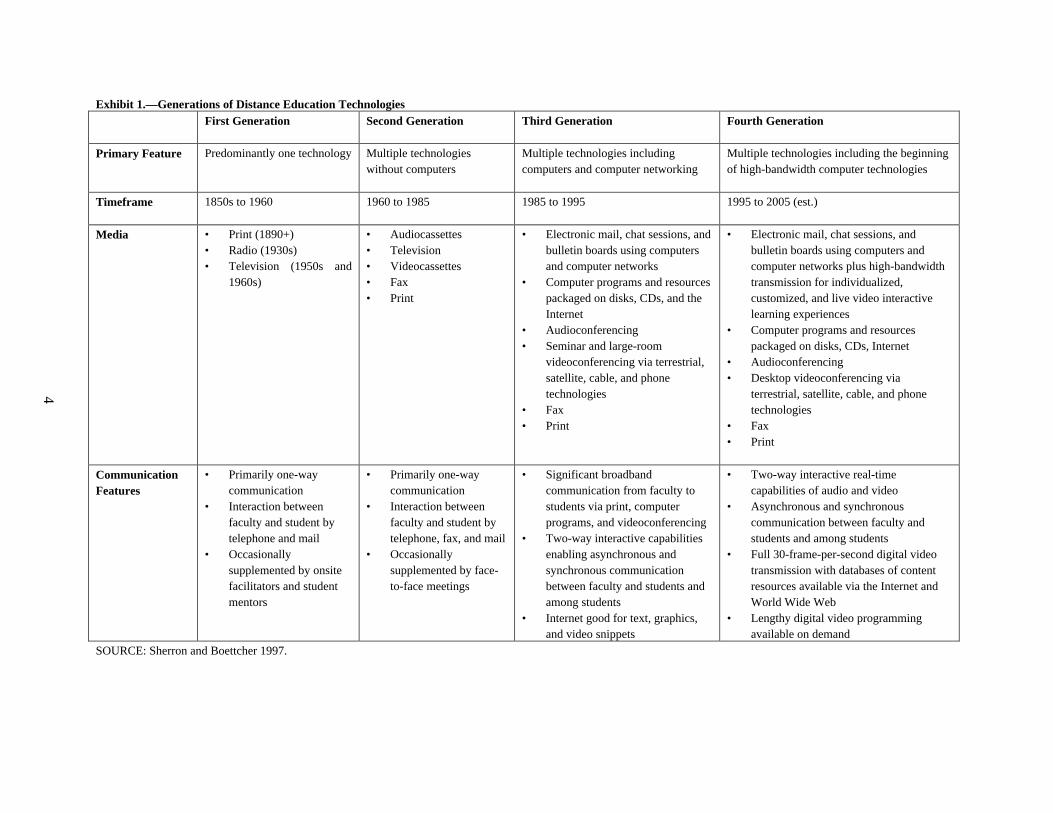
The development of technologies employed toprovide distance education have resulted from a“push-pull” relationship between providers andthe public: technological advances have createdawareness and demand among users, while usagehas pushed providers to further developtechnologies (Gladieux and Swail 1999).According to Sherron and Boettcher (1997), theseadvances have produced over the years fourdifferent generations of distance educationtechnology. These generations are summarized inexhibit 1 and described briefly below.
Key differentiating characteristics of thegenerations of technologies of distance educationinclude:
• the number of individuals that can besimultaneously supported in communication(i.e., one-way, two-way, or multiple-waycommunication);
• the amount and types of information (voice,video, data) that can be communicated (i.e.,whether the communication channels are“broadband” or “narrowband”); and
• the speed at which that information iscommunicated (i.e., whether the return rate isfast or slow).
The technologies predominantly used in distanceeducation in the early and mid-20th century (suchas print, radio, and television) can becharacterized as one-way narrowband communi-cation. These first-generation distance educationtechnologies, thus, were best used to transferinformation primarily from faculty to student.This delivery mode did not typically incorporateany interaction among students and onlysupported minimal interaction between studentsand faculty. One additional constraint amongfirst-generation broadcast technologies was thatthey were time dependent (i.e., radio andtelevision broadcasts occurred only at specific,predetermined times that required the student tobe listening or watching at those times).
Second-generation technologies began to emergeby 1960 and represented a significant advance-
ment in that they addressed the time dependencyissue of first-generation technologies. The adventof the VCR and cable television enabled“timeshifting” of the broadcast portion of distanceeducation courses, as well as the alternative ofbypassing broadcast completely by making thecontent of courses available on videotapes thatcould be sent to students and viewed at any time.In other respects, however, distance educationcourses that employ this generation of technologyare not so dissimilar from the previousgeneration: there tends to be little interactionamong students and between students and faculty.
By the mid-1980s, the personal computer hadfound its way into use by distance educationproviders, followed not long thereafter by theadvent of two-way videoconferencing. This thirdgeneration of distance education technologies, incontrast to previous generations, allowed facultyto convey increasingly complex and largeamounts of information to students and enabledinteraction among students and between studentsand faculty through the use of electronic mail,chat rooms, and bulletin boards. The advent ofcomputer-assisted instruction, simulations, andother electronic resources accessed via computerdisk, CD-ROM, or the Internet further charac-terizes this generation of distance educationtechnology.
The fourth generation of distance educationtechnologies represents still another advance.Interactivity among students and betweenstudents and faculty is increased, and the amountand types of information that can be exchangedare significantly greater and take significantly lesstime to occur. Indeed, these advances are furtherdecreasing distance education’s reliance on timeand place and are enabling the implementation ofcompletely virtual universities. The currentlandscape of distance education incorporates anumber of technologies, spanning second, third,and fourth generations. Examples that wereprovided in the 1997–98 survey include two-wayvideo with two-way audio, one-way prerecordedvideo, Internet courses using synchronous andasynchronous computer-based instruction, andCD-ROM.
4
Exhibit 1.—Generations of Distance Education TechnologiesFirst Generation Second Generation Third Generation Fourth Generation
Primary Feature Predominantly one technology Multiple technologieswithout computers
Multiple technologies includingcomputers and computer networking
Multiple technologies including the beginningof high-bandwidth computer technologies
Timeframe 1850s to 1960 1960 to 1985 1985 to 1995 1995 to 2005 (est.)
Media • Print (1890+)• Radio (1930s)• Television (1950s and
1960s)
• Audiocassettes• Television• Videocassettes• Fax• Print
• Electronic mail, chat sessions, andbulletin boards using computersand computer networks
• Computer programs and resourcespackaged on disks, CDs, and theInternet
• Audioconferencing• Seminar and large-room
videoconferencing via terrestrial,satellite, cable, and phonetechnologies
• Fax• Print
• Electronic mail, chat sessions, andbulletin boards using computers andcomputer networks plus high-bandwidthtransmission for individualized,customized, and live video interactivelearning experiences
• Computer programs and resourcespackaged on disks, CDs, Internet
• Audioconferencing• Desktop videoconferencing via
terrestrial, satellite, cable, and phonetechnologies
• Fax• Print
CommunicationFeatures
• Primarily one-waycommunication
• Interaction betweenfaculty and student bytelephone and mail
• Occasionallysupplemented by onsitefacilitators and studentmentors
• Primarily one-waycommunication
• Interaction betweenfaculty and student bytelephone, fax, and mail
• Occasionallysupplemented by face-to-face meetings
• Significant broadbandcommunication from faculty tostudents via print, computerprograms, and videoconferencing
• Two-way interactive capabilitiesenabling asynchronous andsynchronous communicationbetween faculty and students andamong students
• Internet good for text, graphics,and video snippets
• Two-way interactive real-timecapabilities of audio and video
• Asynchronous and synchronouscommunication between faculty andstudents and among students
• Full 30-frame-per-second digital videotransmission with databases of contentresources available via the Internet andWorld Wide Web
• Lengthy digital video programmingavailable on demand
SOURCE: Sherron and Boettcher 1997.
5
In characterizing different implementations ofdistance education, it is important to note thatresearch does not conclusively support the notionthat more advanced technologies necessarilyrepresent better distance education implemen-tations (Hanson et al. 1997). Different distanceeducation technologies meet different instruc-tional and learner needs and the consequent coststo implement different technologies forinstitutions and students vary. For instance,Tuckey (1993, as cited in Hanson et al. 1997)compared the use of an electronic whiteboard, aform of synchronous audio-conferencing, andasynchronous computer conferencing, concludingthat each form of technology had its advantages:“Visual channels enabled through the whiteboardtechnology may be more important in subjectareas such as mathematics and the sciences,whereas [computer conferencing] may be moresuitable in areas requiring extensive discourse”(p. 70). Furthermore, other factors such aslearner ages, cultural and socioeconomic back-grounds, interests and experiences, educationallevels, and familiarity with distance educationmethods and delivery systems may all beassociated with the effectiveness of distanceeducation (Sherry 1996).
How is Distance Education Organized?
With the increased capabilities of newergenerations of distance education technology,postsecondary institutions are being forced torevisit, if not altogether redefine, their missions(Ehrmann n.d.; Gallick 1998). In this regard, theforces acting upon postsecondary institutions areno different than those acting upon larger society.New technologies are challenging fundamentalassumptions about the nature and organization ofwork, as well as the need for workers to engage incontinuous learning (e.g., Carnevale 1991; Kelly1998). A range of unconventional providers,such as corporate universities and unaffiliateddistance learning providers, have entered thepostsecondary marketplace, offering instructionand credentials in new settings, on flexibleschedules—blurring lines between public andprivate, for-profit and not-for-profit (Gladieuxand Swail 1999).
Indeed, the institutional response to technology’spressure on organizational structures andrelationships can be traced back over 20 years(Oblinger and Maruyama 1996). Through the endof the 1970s, institutions generally actedindividually with regard to distance education,creating their own materials or purchasing themfrom other institutions. With the advent ofsatellite technology in the 1980s, consortia ofinstitutions formed to share the correspondinglyhigh costs of course development and delivery.With the rise of the networked computer and theInternet, the 1990s have brought pressure oninstitutions to consider their niche in an evenbroader national or international distanceeducation marketplace, thereby fosteringinnovations in institution-to-institution relation-ships.
One way to conceptualize these new andemerging arrangements of institutions is byconsidering what distinguishes different types ofpostsecondary providers, both in terms of whoprovides the education and who awards thedegree or certificate. Phipps, Wellman, andMerisotis (1998) created such a typology andidentified four basic types of organizationalarrangements employed by institutions thatprovide distance education:
• Enhancements to traditional campus-basedinstruction. Perhaps the most prevalent formof distance education occurs as anenhancement to campus-based instructionoffered at traditional colleges and univer-sities. In this type of arrangement, studentsare regularly matriculated, enrolled in theusual courses, taught by the same faculty, andare generally on campus all or most of thetime they are studying. The instruction canbe offered through off-campus centers as wellas on campus. The difference is that distanceeducation students are not in the samelocation as their instructors. Distanceeducation arises primarily through facultyinitiatives to employ available technologiesand may be particularly beneficial to studentswho live off campus or who work full- orpart-time.
6
• Consortia or collaboratives. Another formof distance education is provided by consortiaor collaboratives that represent cooperativepooling and sharing arrangements amonginstitutions (typically, traditional colleges anduniversities). In these arrangements, multipleinstitutions join together to provide distanceeducation on a statewide or regional basis.The authority to award degrees and credits,however, remains with each memberinstitution and does not shift to theconsortium.
• Contracted or brokered arrangements.Contracted or brokered arrangements areconfigurations of institutions, faculty, or otherproviders brought together solely for thepurpose of delivering distance education. Incontrast to consortia or collaboratives, theauthority to award degrees and credits restswith the contracting or organizing entity, notwith the originating institution.
• Virtual universities. Virtual universities areinstitutions that offer most or all of theirinstruction via technological means and aredistinguished by their nearly exclusive use oftechnology as the educational deliverydevice.
As new types of organizational arrangementsemerge, challenges to the flexibility of the highereducation community may continue. For now,distance education providers are offeringtraditional and nontraditional students alike theopportunity to pursue postsecondary educationthrough a variety of arrangements (Phipps,Wellman, and Merisotis 1998).
How Effective is Distance Education?
As distance education has grown, so has interestin its effectiveness. Research on the effectivenessof distance education typically seeks to comparethe performance, attitudes, and satisfaction ofdistance education students with those oftraditional on-campus students (Phipps andMerisotis 1999). Like research on othereducational interventions, the distance educationliterature is largely anecdotal in nature (Hanson et
al. 1997), contains a considerable amount ofcross-referencing (where many of the papers andsummaries cite similar research or reference eachother), consists of only a rather small body ofhigh-quality original research (Phipps andMerisotis 1999), and—given the rapid evolutionof distance education—is dated.
Three recent reviews of the distance educationresearch offer some insights into its effectiveness.An oft-cited report entitled The No SignificantDifference Phenomenon (Russell 1999) compileshundreds of sources that indicate that the learningoutcomes of distance education students aresimilar to the learning outcomes of traditional on-campus students. This body of work alsosuggests that the attitudes and satisfaction ofdistance education students are generally positive.Other reviews of this body of evidence are morecritical (Phipps, Wellman, and Merisotis 1998),arguing that there is not conclusive evidence toindicate that student learning outcomes are higherin the vast majority of distance education settingsthan in traditional on-campus ones. Noting issueswith the quality of the research base, Hanson andhis colleagues (1997) in their review of thedistance education literature tentatively concludethat:
• Distance education is just as effective astraditional education in regards to learneroutcomes.
• Distance education learners generally have amore favorable attitude toward distanceeducation than traditional learners have, anddistance learners feel they learn as well as ifthey were in a regular classroom.
• Successful distance education learners tend tobe abstract learners who are intrinsicallymotivated and possess internal locus ofcontrol.
• Each form of distance education technologyhas its own advantages and disadvantages incontributing to the overall quality of thelearning experience.
Despite these tentative statements, studiescomparing the outcomes of distance educationstudents with traditional on-campus students,
7
while commonly conducted, have been criticizedby many as inappropriate (Hanson et al. 1997):
It is likely that when different mediatreatments of the same informationalcontent to the same students yields similarlearning results, the cause of the results canbe found in a method which the twotreatments share in common…give up yourenthusiasm for the belief that mediaattributes cause learning (Clark 1994, 28)
In addition to general concerns about quality andappropriateness, researchers also have identifiedgaps in the existing research base on distanceeducation. For instance, according to Phipps andMerisotis (1999) the research on distanceeducation:
• tends to emphasize student outcomes forindividual courses rather than for a totalacademic program;
• does not take into account differences amongstudents;
• does not adequately explain why the dropoutrates of distance learners are higher;
• does not take into consideration how thedifferent learning styles of students relate tothe use of particular technologies;
• focuses mostly on the impact of individualtechnologies rather than on the interaction ofmultiple technologies;
• does not include a theoretical or conceptualframework; and
• does not adequately address the impact ofaccess to resource materials and supportservices.
Emerging Policy Issues
According to Phipps, Wellman, and Merisotis(1998), the pace at which institutions are movinginto technology-mediated learning is remarkable.Predictions are that distance education—whichwas once a “poor and often unwelcome stepchildwithin the academic community”—will continue
to have a profound impact on postsecondaryinstitutions and their faculty (Phipps andMerisotis 1999, 29). As Kenneth Green, projectdirector of the Campus Computing Project,asserts: “The genie will not go back into thebottle: demand for technology will continue, notdiminish; the opportunities for distance andonline education will grow, not recede” (1997,J-9). Evidence of this can be seen in the adoptionof distance education by postsecondaryinstitutions, as well as recent legislationsupporting distance education. For instance,Public Law 105-224 (enacted October 7, 1998),which extends the authorization of programsunder the Higher Education Act, contains threeprovisions related to distance education:
• The Distance Education DemonstrationProgram, which is intended to test the qualityand viability of distance education programscurrently ineligible for student aid fundsunder Title IV of the Act;
• The Learning Anytime Anywhere Partner-ships program, which is intended to supportinnovative partnerships among colleges,employers, technology companies, and othersto implement asynchronous distance educa-tion on a national or regional scale; and
• The Web-Based Education Commission,which is charged with conducting a thoroughstudy to assess the educational softwareavailable in retail markets for secondary andpostsecondary students who choose to usesuch software.
The support and adoption of distance educationhas led to the emergence of a number of policyissues that postsecondary institutions face:
• Equity of access to postsecondaryeducation. Many assert that the primarybenefit of distance education is that access topostsecondary education is increased.However, distance education requires thatstudents have access to appropriate (andsometimes costly) technology and that theyknow how to use it (Phipps and Merisotis1999), and some have raised concerns aboutspecial challenges students with disabilitiesface in accessing distance education
8
(Chronicle of Higher Education, October 29,1999). Currently, there is very littleinformation available on how many studentsare actually making use of distance educationcourse offerings, and we know even lessabout the characteristics of distance learners.Without such information, there is no way toknow whether distance education is reachingthose who might not otherwise have access topostsecondary education, or simplyaccommodating those who already takeadvantage of such opportunities (Gladieuxand Swail 1999).
• The costs of developing and implementingdistance education programs. Some haveasserted that distance education programs area cost-savings approach to providingpostsecondary education, but cost informationis scant (Gladieux and Swail 1999).Anecdotally, there is some evidence tosuggest that these costs savings are not beinguniversally realized (New York Times 1998).Given these concerns, it is important to notethat more than 60 percent of colleges anduniversities do not have an informationtechnology financial plan in place (Green1998).
• Accreditation of and quality assurance indistance education programs. Distanceeducation poses many challenges to thetraditional model of academic accreditation.Some fear that quality assurance mechanismsare being bypassed by some distanceeducation providers and that the risk is adegradation of public perception about themeaning of a college degree and an increasein the potential for consumer fraud and abuse(Phipps, Wellman, and Merisotis 1998). Onthe other hand, online institutions have beenaccredited using established standards; forexample, the North Central Association’sCommission on Institutions of HigherEducation have evaluated and accreditedonline institutions (e.g., Jones International)using the Commission’s accreditationstandards (Chronicle of Higher Education,November 4, 1999).
• Copyright and intellectual property rights.As more course syllabi, readings, and
discussions occur on line, ownership ofintellectual property—a legally complex andpotentially controversial issue—is acontinuing source of debate in the universitysetting. A fourth of colleges and universitieshave a campus policy regarding intellectualproperty for Web-based instructionalresources developed by faculty (Green 1998).
• Changes and challenges facing the role ofpostsecondary faculty. The rise of distanceeducation poses significant and substantialchallenges to faculty compensation practicesand existing norms of faculty development(Sherron and Boettcher 1997), includingissues of promotion and tenure, release time,course load, course updating and revision,publishing, faculty mentoring, and consis-tency across departments.
• Pressures on existing organizationalstructures and arrangements. Aspreviously noted, changes in distanceeducation technology are having an impact onthe missions and structures of participatingpostsecondary institutions (Ehrmann n.d.;Gallick 1998). For instance, institutions arebeing forced to define the differencesbetween (traditional) residential and distanceeducation programs, and new arrangementsbetween the business, government, andeducation sectors are emerging that arechallenging the traditional organization ofpostsecondary education.
Organization of this Report
As the preceding discussion illustrates, distanceeducation is a topic of great interest to a numberof stakeholders, including individuals consideringa postsecondary education, faculty andadministrators at postsecondary institutions,providers of technologies used for distanceeducation, and policymakers at federal, state, andlocal levels. As such, there are a number ofquestions that have been raised about thisphenomenon, including: How many institutionsoffer distance education? How many plan to inthe future? How is distance education delivered?How much does it cost? Has the status of

9
distance education changed in recent years? Theremaining chapters of this report address thesequestions, as well as others. The next chapter(chapter 2) provides information about the 2-yearand 4-year postsecondary education institutionsthat offered distance education in 1997–98 andthe overall enrollments in distance educationoffered at those institutions. Chapter 3 providesinformation about the total number of distanceeducation courses offered, and the number ofcollege-level, credit-granting distance educationcourses by field of study and instructional level ofthe course. Information about enrollments byfield and level is also provided. Chapter 4describes college-level degree and certificate
programs that are designed to be completedtotally through distance education. Chapter 5describes the types of technologies thatinstitutions used as primary modes of instruc-tional delivery and plans for future technologyuse, and chapter 6 provides information abouthow tuition and fees for distance educationcourses compare to those for comparable on-campus courses. Chapter 7 provides comparisonsof distance education course offerings,enrollments, degrees and certificates, andtechnologies between 1994–95 and 1997–98.The concluding chapter discusses the findings ofthis study.

10
11
2. INSTITUTIONS AND ENROLLMENTS
There is some evidence to suggest that distanceeducation is becoming an increasingly visiblefeature of postsecondary education in thiscountry. This chapter provides descriptiveinformation about all 2-year and 4-yearpostsecondary education institutions that offereddistance education in 1997–98, including overallenrollments in distance education courses at thoseinstitutions. Analyses of institutions andenrollments are presented by institutional typeand size. Information is also included aboutenrollments by the level of course offerings(undergraduate or graduate/first-professional).As previously noted, the first NCES report ondistance education was of higher educationinstitutions and not of all postsecondaryinstitutions. Consequently, trend analyses ofdistance education offerings and enrollments forhigher education institutions can be found inchapter 7, Changes in Distance Education Since1994–95. Since some readers may be unfamiliarwith the distinction between higher educationinstitutions and all postsecondary institutions, thischapter begins with a description of the types ofinstitutions included in this study.
Institutions Included in This Study
This PEQIS study was designed to providenationally representative data about distanceeducation at 2-year and 4-year postsecondaryeducation institutions. There are approximately5,000 postsecondary institutions at the 2-year and4-year level in the nation, enrollingapproximately 14.4 million students.5 Post-secondary education institutions include bothinstitutions of higher education (traditional
5 Information about the numbers of institutions and students is from
the 1996 PEQIS panel, which provided the sample for the Surveyon Distance Education at Postsecondary Education Institutions,1998–1999. The 1996 PEQIS panel was constructed from theIntegrated Postsecondary Education Data System 1995–96“Institutional Characteristics” file and the 1994 “Fall Enrollment”file.
colleges and universities) and other post-secondary institutions (e.g., allied health andvocational-technical schools). Thus, 2-year and4-year postsecondary institutions are a diversegroup, including universities, baccalaureatecolleges, community colleges, graduate andprofessional schools (including law, medical, andclinical psychology schools), technical schools,nursing and allied health schools, Bible collegesand seminaries, and other postsecondary schoolssuch as business and computer processingschools. At the 4-year level (i.e., at institutionsthat offer baccalaureate or higher degrees), about9 out of 10 of the private institutions are nonprofitinstitutions, while at the 2-year level, about halfof the private institutions are nonprofit (notshown in tables). Public and private institutionshave somewhat different institutional missionsand constituencies, partially because of thefinancial support and programmatic oversight thepublic institutions receive from state and localgovernments.
The distributions of 2-year and 4-yearpostsecondary institutions and the enrollments ofstudents at those institutions vary widely (seetable 1). While private 2-year institutions accountfor 22 percent of the institutions, they enroll2 percent of the students. The largest proportionsof students attend public 2-year (37 percent) andpublic 4-year institutions (40 percent), althoughthese institutions account for 25 percent and12 percent, respectively, of 2-year and 4-yearpostsecondary institutions. Similarly, while76 percent of the institutions are small (i.e., haveenrollments of less than 3,000 students),49 percent of the students attend large institutions(i.e., institutions that enroll 10,000 or morestudents). Thus, while about three-quarters of theinstitutions are small, about half of the studentsattend large institutions.

12
Table 1.—Percentage distribution of 2-yearand 4-year postsecondary educationinstitutions in the nation, and thepercentage distribution of studentsenrolled at those institutions, byinstitutional characteristics: 1997–98
Institutional characteristic Institutions Students
All institutions .................... 100 100
Institutional typePublic 2-year....................... 25 37Private 2-year...................... 22 2Public 4-year....................... 12 40Private 4-year...................... 41 20
Size of institutionLess than 3,000 ................... 76 193,000 to 9,999 ..................... 16 3210,000 or more.................... 8 49
NOTE: Percentages are computed within each classificationvariable. Percentages may not sum to 100 because of rounding.Information about the distributions of institutions and students isfrom the 1996 PEQIS panel, which was constructed from the 1995–96 Integrated Postsecondary Education Data System (IPEDS)“Institutional Characteristics” file, and the IPEDS 1994 “FallEnrollment” file. The 1996 PEQIS panel provides the sample for theSurvey on Distance Education at Postsecondary Institutions,1998–1999.
SOURCE: U.S. Department of Education, National Center forEducation Statistics, Postsecondary Education Quick InformationSystem, Survey on Distance Education at Postsecondary EducationInstitutions, 1998–1999.
Institutions OfferingDistance Education Courses
Institutions were asked whether they offered anydistance education courses in 1997–98 (12-monthacademic year), or planned to offer any suchcourses in the next 3 years. Institutions thatoffered any distance education courses wereasked about their total distance educationofferings (including offerings for all levels andaudiences), and their college-level, credit-granting distance education offerings. A third ofthe postsecondary education institutions at the2-year and 4-year level offered distance educationcourses in 1997–98 (table 2). This represents anestimated 1,680 institutions. Another 20 percentof the institutions planned to start offeringdistance education courses in the next 3 years,and 47 percent did not offer and did not plan tooffer distance education courses in the next3 years.
Table 2.—Number and percentage distribution of 2-year and 4-year postsecondary educationinstitutions that offered distance education courses in 1997–98, that planned to offerthem in the next 3 years, and that did not offer and did not plan to offer them in the next3 years, by institutional characteristics
Offered distance education
in 1997–98
Planned to offer distance
education in the
next 3 years
Did not offer in 1997–98 and
did not plan to offer in the
next 3 yearsInstitutional characteristic
Total number
of institutions
Number Percent Number Percent Number Percent
All institutions ...................... 5,010 1,680 34 990 20 2,340 47
Institutional typePublic 2-year......................... 1,230 760 62 250 20 230 18Private 2-year........................ 1,120 60 5 220 20 840 75Public 4-year......................... 610 480 78 70 12 60 10Private 4-year........................ 2,050 390 19 450 22 1,210 59
Size of institutionLess than 3,000..................... 3,800 730 19 840 22 2,230 593,000 to 9,999 ....................... 820 610 75 110 14 90 1210,000 or more...................... 400 350 87 30 8 20 5
NOTE: Percentages are based on the estimated 5,010 2-year and 4-year postsecondary education institutions in the nation. Percentages arecomputed across each row. Details may not sum to totals because of rounding.
SOURCE: U.S. Department of Education, National Center for Education Statistics, Postsecondary Education Quick Information System, Surveyon Distance Education at Postsecondary Education Institutions, 1998–1999.

13
Distance education was more likely to beconducted by public institutions; 78 percent ofpublic 4-year and 62 percent of public 2-yearinstitutions offered distance education courses,compared with 19 percent of private 4-year and5 percent of private 2-year institutions (table 2).Distance education was also strongly related toinstitutional size, with most large (87 percent) andmedium-sized (75 percent) institutions offeringdistance education in 1997–98, compared with 19percent of small institutions. Since most studentsare enrolled in public 2-year and 4-yearinstitutions and in medium and large institutions(see table 1), most students attend institutions thatoffer distance education courses.
There are approximately 11 million studentsenrolled at the institutions that offered distanceeducation courses in 1997–98 (not shown intables). Table 3 shows the percentagedistributions of institutions that offered distanceeducation courses in 1997–98, and the percentagedistributions of students at those institutions.Among the institutions offering distanceeducation courses, public 2-year institutionsaccount for 45 percent of the institutions and41 percent of the students, private 2-yearinstitutions account for 3 percent of theinstitutions and less than 0.5 percent of thestudents, public 4-year institutions account for 28percent of the institutions and 47 percent of thestudents, and private 4-year institutions accountfor 23 percent of the institutions and 11 percent ofthe students.
Table 3.—Percentage distribution of 2-yearand 4-year postsecondary educationinstitutions that offered distanceeducation courses in 1997–98, andthe percentage distribution ofstudents enrolled at thoseinstitutions, by institutionalcharacteristics
Institutional characteristic Institutions Students
All institutions .................... 100 100
Institutional typePublic 2-year....................... 45 41Private 2-year...................... 3 (††)Public 4-year....................... 28 47Private 4-year...................... 23 11
Size of institutionLess than 3,000 ................... 43 103,000 to 9,999 ..................... 36 3310,000 or more.................... 21 58
††Less than 0.5 percent.
NOTE: Percentages are computed within each classificationvariable. Percentages may not sum to 100 because of rounding.Information about the distributions of institutions and students isfrom the 1996 PEQIS panel, which was constructed from the1995–96 Integrated Postsecondary Education Data System (IPEDS)“Institutional Characteristics” file, and the IPEDS 1994 “FallEnrollment” file. The 1996 PEQIS panel provides the sample forthe Survey on Distance Education at Postsecondary EducationInstitutions, 1998–1999.
SOURCE: U.S. Department of Education, National Center forEducation Statistics, Postsecondary Education Quick InformationSystem, Survey on Distance Education at Postsecondary EducationInstitutions, 1998–1999.
14
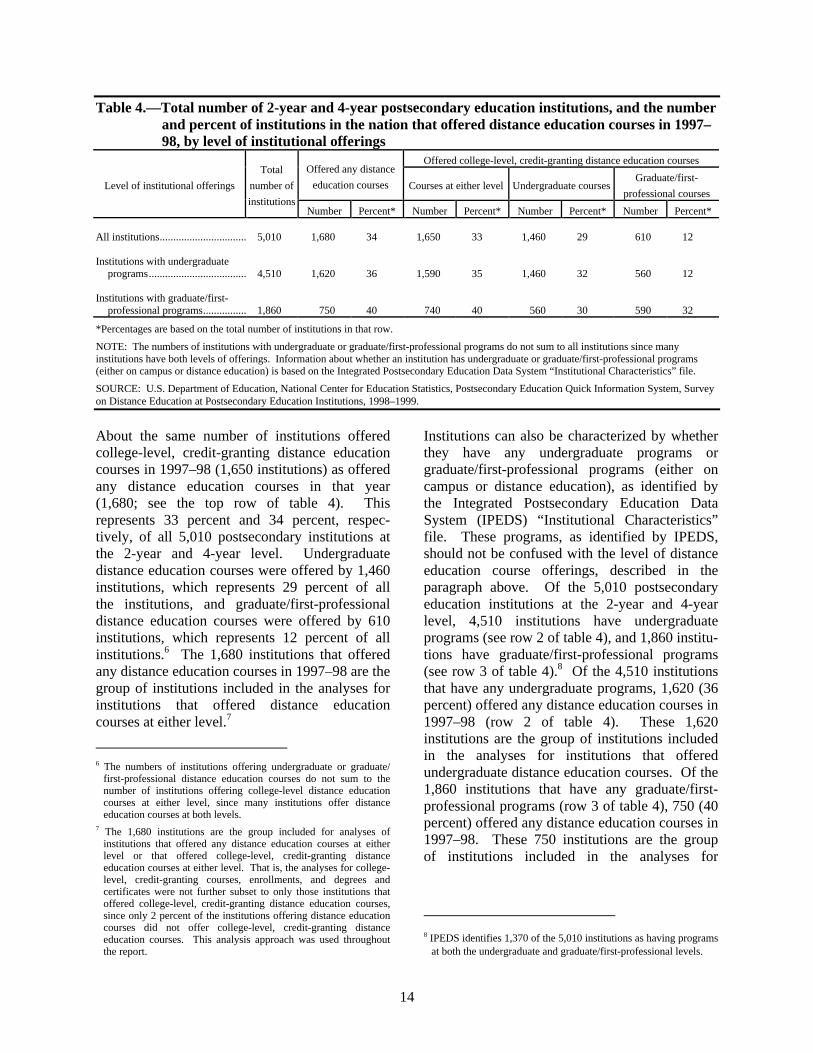
Table 4.—Total number of 2-year and 4-year postsecondary education institutions, and the numberand percent of institutions in the nation that offered distance education courses in 1997–98, by level of institutional offerings
Offered college-level, credit-granting distance education coursesOffered any distance
education courses Courses at either level Undergraduate coursesGraduate/first-
professional coursesLevel of institutional offerings
Total
number of
institutionsNumber Percent* Number Percent* Number Percent* Number Percent*
All institutions................................ 5,010 1,680 34 1,650 33 1,460 29 610 12
Institutions with undergraduateprograms.................................... 4,510 1,620 36 1,590 35 1,460 32 560 12
Institutions with graduate/first-professional programs................ 1,860 750 40 740 40 560 30 590 32
*Percentages are based on the total number of institutions in that row.
NOTE: The numbers of institutions with undergraduate or graduate/first-professional programs do not sum to all institutions since manyinstitutions have both levels of offerings. Information about whether an institution has undergraduate or graduate/first-professional programs(either on campus or distance education) is based on the Integrated Postsecondary Education Data System “Institutional Characteristics” file.
SOURCE: U.S. Department of Education, National Center for Education Statistics, Postsecondary Education Quick Information System, Surveyon Distance Education at Postsecondary Education Institutions, 1998–1999.
About the same number of institutions offeredcollege-level, credit-granting distance educationcourses in 1997–98 (1,650 institutions) as offeredany distance education courses in that year(1,680; see the top row of table 4). Thisrepresents 33 percent and 34 percent, respec-tively, of all 5,010 postsecondary institutions atthe 2-year and 4-year level. Undergraduatedistance education courses were offered by 1,460institutions, which represents 29 percent of allthe institutions, and graduate/first-professionaldistance education courses were offered by 610institutions, which represents 12 percent of allinstitutions.6 The 1,680 institutions that offeredany distance education courses in 1997–98 are thegroup of institutions included in the analyses forinstitutions that offered distance educationcourses at either level.7
6 The numbers of institutions offering undergraduate or graduate/
first-professional distance education courses do not sum to thenumber of institutions offering college-level distance educationcourses at either level, since many institutions offer distanceeducation courses at both levels.
7 The 1,680 institutions are the group included for analyses ofinstitutions that offered any distance education courses at eitherlevel or that offered college-level, credit-granting distanceeducation courses at either level. That is, the analyses for college-level, credit-granting courses, enrollments, and degrees andcertificates were not further subset to only those institutions thatoffered college-level, credit-granting distance education courses,since only 2 percent of the institutions offering distance educationcourses did not offer college-level, credit-granting distanceeducation courses. This analysis approach was used throughoutthe report.
Institutions can also be characterized by whetherthey have any undergraduate programs orgraduate/first-professional programs (either oncampus or distance education), as identified bythe Integrated Postsecondary Education DataSystem (IPEDS) “Institutional Characteristics”file. These programs, as identified by IPEDS,should not be confused with the level of distanceeducation course offerings, described in theparagraph above. Of the 5,010 postsecondaryeducation institutions at the 2-year and 4-yearlevel, 4,510 institutions have undergraduateprograms (see row 2 of table 4), and 1,860 institu-tions have graduate/first-professional programs(see row 3 of table 4).8 Of the 4,510 institutionsthat have any undergraduate programs, 1,620 (36percent) offered any distance education courses in1997–98 (row 2 of table 4). These 1,620institutions are the group of institutions includedin the analyses for institutions that offeredundergraduate distance education courses. Of the1,860 institutions that have any graduate/first-professional programs (row 3 of table 4), 750 (40percent) offered any distance education courses in1997–98. These 750 institutions are the groupof institutions included in the analyses for
8 IPEDS identifies 1,370 of the 5,010 institutions as having programs
at both the undergraduate and graduate/first-professional levels.
15
institutions that offered distance educationcourses at the graduate/first-professional level.9
Overall Enrollment inDistance Education Courses
Institutions that offered any distance educationcourses were asked about the total enrollment inall distance education courses in 1997–98(including enrollments in courses designed for alltypes of students), and the enrollment in college-level, credit-granting distance education coursesin 1997–98, both overall and by the level of thecourse. If a student was enrolled in multiplecourses, institutions were instructed to count thestudent for each course in which he or she wasenrolled. Thus, enrollments may includeduplicated counts of students.10
The PEQIS survey indicates that there were anestimated 1,661,100 enrollments in all distanceeducation courses offered by 2-year and 4-yearpostsecondary institutions in 1997–98 (table 5).There were an estimated 1,363,670 enrollments incollege-level, credit-granting distance educationcourses in 1997–98, with most of these(1,082,380) at the undergraduate level. Theremaining enrollments (281,300) were at thegraduate/first-professional level. To put thesenumbers into context, the National Center forEducation Statistics (NCES) estimates that therewere 14.6 million students enrolled in 2-year and4-year postsecondary education institutions in fall
9 Of the 1,680 institutions that offered any distance education
courses in 1997–98, IPEDS identifies 690 institutions as havingany programs (either on campus or distance education) at both theundergraduate and graduate/first-professional levels.
10This approach was used because discussions with institutionsduring the survey development process indicated that institutionscould not report unduplicated counts of students enrolled indistance education courses.
1996 (the most recent year for which informationis available), with an estimated 12.5 millionstudents enrolled at the undergraduate level, andan estimated 2.1 million students enrolled at thegraduate/first-professional level (unpublishedtabulations from the 1996 IPEDS “FallEnrollment” file).11 Consistent with the distribu-tions of the percentage of institutions that offereddistance education courses, most of theenrollments in distance education courses were atpublic 2-year and public 4-year institutions. Inaddition, the number of enrollments in college-level, credit-granting distance education courseswas considerably higher at public 2-year institu-tions than at public 4-year institutions.
Private 4-year institutions put relatively moreemphasis on distance education at thegraduate/first-professional level than did public 4-year institutions (table 5). That is, for public 4-year institutions, 36 percent of the enrollments incollege-level distance education courses (163,080out of 452,600) were at the graduate/first-professional level, compared with 57 percent atthe graduate/first-professional level for private 4-year institutions (118,070 out of 208,590). Thismay be because public and private postsecondaryinstitutions have different institutional missionsand constituencies, or because private institutionsare approaching distance education moreselectively, focusing more on specializedprograms and professional school offerings(Chronicle of Higher Education, June 20, 1997;Mulugetta and Mulugetta 1999).
11It is important to remember that the distance education enrollments
collected in the PEQIS survey may include duplicated counts ofstudents, while the NCES estimate of 14.6 million studentsenrolled is an unduplicated count of students. Information abouttotal course enrollments at postsecondary institutions is notavailable for comparison to the PEQIS distance education courseenrollments.

16
Table 5.—Total number of enrollments in all distance education courses, and the number ofenrollments in college-level, credit-granting distance education courses offered by 2-yearand 4-year postsecondary education institutions in 1997–98, by institutionalcharacteristics
Number of enrollments in college-level,
credit-granting distance education courses
Institutional characteristicTotal number of
institutions
Number of
institutions that
offered distance
education courses
Total number of
enrollments in all
distance
education
courses1
Enrollment in
courses at both
levels1
Enrollments in
undergraduate
courses2
Enrollments in
graduate/
first-professional
courses3
All institutions .................. 5,010 1,680 1,661,100 1,363,670 1,082,380 281,300
Institutional type4
Public 2-year..................... 1,230 760 714,160 690,700 690,550 —Public 4-year..................... 610 480 711,350 452,600 289,520 163,080Private 4-year.................... 2,050 390 222,350 208,590 90,520 118,070
Size of institutionLess than 3,000................. 3,800 730 382,060 270,400 177,150 93,2503,000 to 9,999................... 820 610 477,470 461,880 413,770 48,10010,000 or more.................. 400 350 801,570 631,400 491,460 139,950
—Too few cases for a reliable estimate. Two-year branches of public 4-year institutions occasionally offer graduate/first-professional levelcourses.1Includes information for the estimated 1,680 institutions that offered any distance education courses in 1997–98.2Includes information for the estimated 1,620 institutions that had undergraduate programs and that offered any distance education courses in1997–98.3Includes information for the estimated 750 institutions that had graduate or first-professional programs and that offered any distance educationcourses in 1997–98.4Data for private 2-year institutions are not reported as a separate type of institution because too few of them in the sample offered distanceeducation courses in 1997–98 to make reliable estimates. Data for private 2-year institutions are included in the totals and in analyses by otherinstitutional characteristics.
NOTE: Numbers may not sum to totals because of rounding and not reporting where there are too few cases for a reliable estimate. Enrollmentsmay include duplicated counts of students, since institutions were instructed to count a student enrolled in multiple courses for each course inwhich he or she was enrolled.
SOURCE: U.S. Department of Education, National Center for Education Statistics, Postsecondary Education Quick Information System, Surveyon Distance Education at Postsecondary Education Institutions, 1998–1999.

17
Figure 1.—Percentage distribution of 2-year and 4-year postsecondary education institutionsoffering distance education courses in 1997–98 according to number of enrollments indistance education courses
Enrollments in all distance education courses
1-80 enrollments
26%
81-300 enrollments
26%
301-800 enrollments
22%
More than 800
enrollments26%
1-80 enrollments
26%
81-300 enrollments
25%
301-800 enrollments
22%
More than 800
enrollments25%
Enrollments in college-level, credit-granting distance education courses
0 enrollments*2%
*Two percent of the institutions that offered any distance education courses did not offer college-level, credit-granting distance educationcourses.
NOTE: Percentages are based on the estimated 1,680 institutions that offered any distance education courses in 1997–98. Enrollments mayinclude duplicated counts of students, since institutions were instructed to count a student enrolled in multiple courses for each course in which heor she was enrolled.
SOURCE: U.S. Department of Education, National Center for Education Statistics, Postsecondary Education Quick Information System, Surveyon Distance Education at Postsecondary Education Institutions, 1998–1999.
About half of the institutions that offered distanceeducation courses in 1997–98 had 300 or fewerenrollments in those courses; 26 percent had 80 orfewer enrollments (figure 1). The distributionsare similar for enrollments in all distanceeducation courses, and for enrollments in college-level, credit-granting distance education courses.
Summary
A third of 2-year and 4-year postsecondaryeducation institutions offered any distanceeducation courses in 1997–98, and another 20percent planned to start offering distanceeducation courses in the next 3 years. Thelikelihood of offering distance education wasstrongly related to institutional type and size, with
distance education being much more common atpublic 2-year and 4-year institutions than atprivate 2-year and 4-year institutions, and atmedium and large compared with smallinstitutions. These 2-year and 4-yearpostsecondary institutions had an estimated1,661,100 enrollments in all distance educationcourses in 1997–98, and an estimated 1,363,670enrollments in college-level, credit-grantingdistance education courses, with most of these atthe undergraduate level. Consistent with thedistributions of institutions offering distanceeducation, most of the enrollments in distanceeducation courses were at public 2-year andpublic 4-year institutions. About half of theinstitutions that offered distance educationcourses in 1997–98 had 300 or fewer enrollmentsin those courses.

18
19
3. COURSE OFFERINGSAND ENROLLMENTS
Comprehensive information about the coursesavailable through distance education andenrollments in those courses has not been widelyavailable. To address this gap in the knowledgebase, this chapter provides information about thetotal number of distance education coursesoffered, and the number of college-level, credit-granting distance education courses offered bygeneral field of study and instructional level ofthe course (undergraduate or graduate/first-professional). The chapter begins withinformation about the number of distanceeducation courses offered in 1997–98. The fieldsof study included in this report are then defined.The chapter concludes with discussions of courseofferings and enrollments by field of study andinstructional level of the course.
Number of Distance EducationCourses Offered in 1997–98
An estimated 54,470 different distance educationcourses12 were offered in the 12-month 1997–98academic year by 2-year and 4-yearpostsecondary education institutions (table 6).This included both noncredit and credit-grantingdistance education courses designed for all typesand levels of students, including elementary/secondary, college, adult basic education,continuing professional education, etc. Anestimated 49,690 different college-level, credit-granting distance education courses were offeredin 1997–98, with most of those (35,550) at theundergraduate level. The remaining credit-granting courses (14,140) were at the graduate/first-professional level. Consistent with thedistributions of the percentage of institutions thatoffered distance education courses, most of the
12If a course had multiple sections or was offered multiple times
during the academic year, institutions were instructed to count it asonly one course.
distance education courses were offered by public2-year and public 4-year institutions (43,800 outof 54,470, or 80 percent, for total distanceeducation courses, and 39,360 out of 49,690, or79 percent, for college-level, credit-grantingdistance education courses).
Private 4-year institutions put particular emphasison offering college-level, credit-granting distanceeducation courses (9,740 out of 10,060, or97 percent of their total distance educationcourses), while a somewhat higher percentage ofdistance education courses provided by public 2-year and public 4-year institutions were notcollege-level, credit-granting courses (table 6).At public 2-year institutions, 92 percent (18,860out of 20,410) of their total distance educationcourses were college-level, credit-grantingcourses; at public 4-year institutions, 88 percent(20,500 out of 23,390) of the total distanceeducation courses were college-level credit-granting courses. This may be because publicand private postsecondary institutions havedifferent institutional missions and constituencies,leading public institutions to offer more coursesfor other audiences, such as elementary/secondaryor adult basic education students, or to offer morenoncredit courses, such as continuing professionaleducation for medical workers.

20
Table 6.—Total number of different distance education courses, and the number of differentcollege-level, credit-granting distance education courses offered by 2-year and 4-yearpostsecondary education institutions in 1997–98, by institutional characteristics
Number of different college-level,
credit-granting distance education courses offered
Institutional characteristicTotal number of
institutions
Number of
institutions that
offered distance
education courses
Total number of
different distance
education courses
offered1
Courses at both
levels1
Undergraduate
courses2
Graduate/
first-professional
courses3
All institutions .................... 5,010 1,680 54,470 49,690 35,550 14,140
Institutional type4
Public 2-year ...................... 1,230 760 20,410 18,860 18,820 —Public 4-year ...................... 610 480 23,390 20,500 11,190 9,310Private 4-year ..................... 2,050 390 10,060 9,740 4,950 4,790
Size of institutionLess than 3,000................... 3,800 730 16,180 14,230 10,510 3,7203,000 to 9,999..................... 820 610 17,030 15,920 13,530 2,39010,000 or more ................... 400 350 21,260 19,550 11,510 8,030
—Too few cases for a reliable estimate. Two-year branches of public 4-year institutions occasionally offer graduate/first-professional levelcourses.1Includes information for the estimated 1,680 institutions that offered any distance education courses in 1997–98.2Includes information for the estimated 1,620 institutions that had undergraduate programs and that offered any distance education courses in1997–98.3Includes information for the estimated 750 institutions that had graduate or first-professional programs and that offered any distance educationcourses in 1997–98.4Data for private 2-year institutions are not reported as a separate type of institution because too few of them in the sample offered distanceeducation courses in 1997–98 to make reliable estimates. Data for private 2-year institutions are included in the totals and in analyses by otherinstitutional characteristics.
NOTE: Numbers may not sum to totals because of rounding and not reporting where there are too few cases for a reliable estimate. If a coursehad multiple sections or was offered multiple times during the academic year, institutions were instructed to count it as only one course.
SOURCE: U.S. Department of Education, National Center for Education Statistics, Postsecondary Education Quick Information System, Surveyon Distance Education at Postsecondary Education Institutions, 1998–1999.
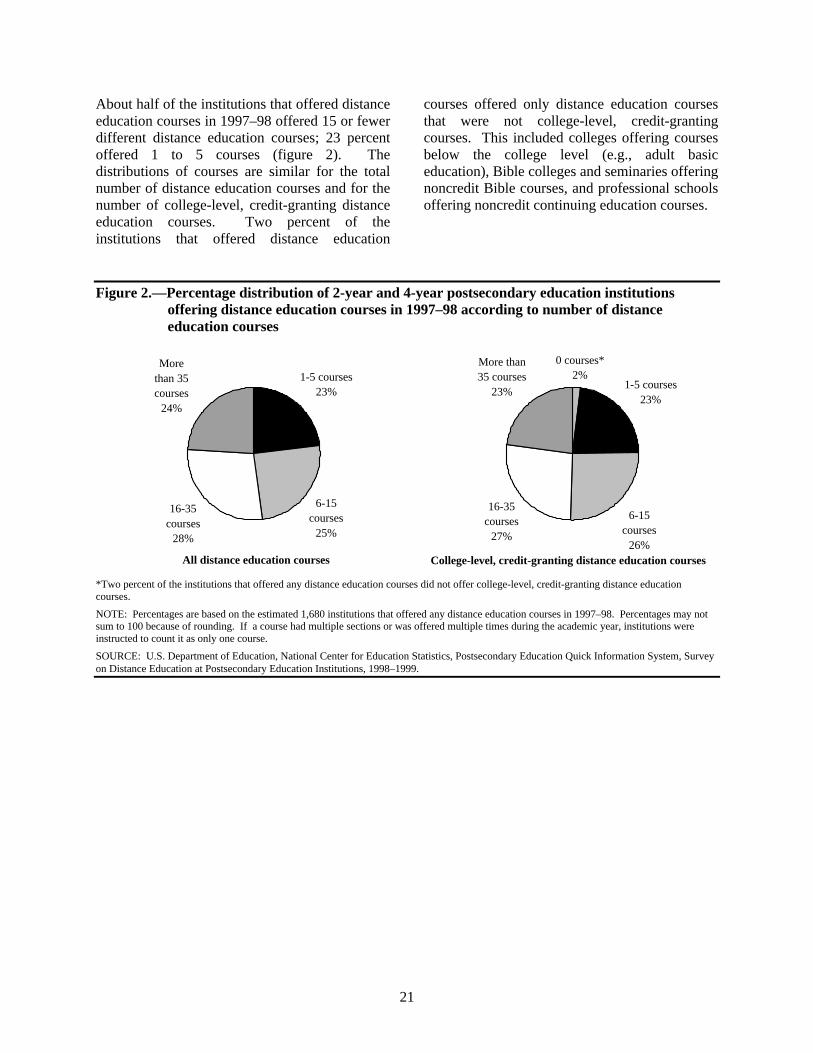
21
About half of the institutions that offered distanceeducation courses in 1997–98 offered 15 or fewerdifferent distance education courses; 23 percentoffered 1 to 5 courses (figure 2). Thedistributions of courses are similar for the totalnumber of distance education courses and for thenumber of college-level, credit-granting distanceeducation courses. Two percent of theinstitutions that offered distance education
courses offered only distance education coursesthat were not college-level, credit-grantingcourses. This included colleges offering coursesbelow the college level (e.g., adult basiceducation), Bible colleges and seminaries offeringnoncredit Bible courses, and professional schoolsoffering noncredit continuing education courses.
Figure 2.—Percentage distribution of 2-year and 4-year postsecondary education institutionsoffering distance education courses in 1997–98 according to number of distanceeducation courses
All distance education courses
6-15 courses
25%
16-35 courses
28%
More than 35 courses
24%
1-5 courses23%
1-5 courses23%
More than 35 courses
23%
0 courses*2%
16-35 courses
27%
6-15 courses
26%College-level, credit-granting distance education courses
*Two percent of the institutions that offered any distance education courses did not offer college-level, credit-granting distance educationcourses.
NOTE: Percentages are based on the estimated 1,680 institutions that offered any distance education courses in 1997–98. Percentages may notsum to 100 because of rounding. If a course had multiple sections or was offered multiple times during the academic year, institutions wereinstructed to count it as only one course.
SOURCE: U.S. Department of Education, National Center for Education Statistics, Postsecondary Education Quick Information System, Surveyon Distance Education at Postsecondary Education Institutions, 1998–1999.
22
Course Offerings Includedin the Study
Institutions that offered distance educationcourses in 1997–98 were asked about theircollege-level, credit-granting distance educationcourses by general field of study and theinstructional level of the course (i.e., whether thecourse was an undergraduate course or agraduate/first-professional course). The generalfields of study provided on the questionnaire andexamples of what is included under each are asfollows:
• Agriculture and natural resources: agricul-tural business and production, agriculturalsciences, conservation and renewable naturalresources;
• Business and management: businessadministration, accounting, administrativeassistant/secretarial skills, human resourcesmanagement, marketing;
• Education: general teacher education, specialeducation, curriculum and instruction,education administration and supervision;
• Engineering: general engineering, civil,electrical, and mechanical engineering,engineering-related technologies;
• Mathematics: mathematics, statistics;
• Computer science: general computer science,computer programming, computer systemsanalysis;
• Physical and biological/life sciences:biology, chemistry, physics, geology;
• English, humanities, social and behavioralsciences: English language and literature,foreign languages, philosophy, history,economics, psychology, sociology;
• Library and information sciences: libraryscience, librarianship;
• Health professions: nursing, medicine,pharmacy, physical therapy, medical andlaboratory technology, health servicesadministration;
• Vocational/technical fields: air conditioningand heating repair, computer and electronicstechnology, drafting; and
• Other fields: all areas not covered above.Institutions were asked to specify what theother fields were. The most frequentlymentioned were theology and biblical studies.Also frequently mentioned were art, physicaleducation, law and legal sciences, and studentand career development courses.
Some of the categories of general fields of studyare much broader than others.13 For example, thecategory of English, humanities, and social andbehavioral sciences is very broad, whilemathematics is very narrow. This can influencewhether an institution offers courses (either oncampus or through distance education) in thatgeneral field. In addition, some of the fields ofstudy are much more specialized than others, andare offered (either on campus or through distanceeducation) by fewer institutions than are many ofthe other fields. For example, courses inagriculture and natural resources and library andinformation sciences are offered by fewerinstitutions than are courses in physical andbiological/life sciences. Some fields of study(both on campus and distance education) alsovary by institutional type. For example, coursesin agriculture and natural resources are offeredprimarily by community colleges and public land-grant universities, courses in vocational/technicalfields are offered primarily by public 2-yearcommunity and technical colleges, and biblicaland theological studies are heavily concentratedin religiously affiliated colleges and seminaries.Fields that are part of a general undergraduateeducation, however, such as English, humanities,and social and behavioral sciences, and physicaland biological/life sciences, are much more likelyto be offered (either on campus or throughdistance education) by most types of institutions.
13In preparing the list of general fields of study for the questionnaire,
considerations included the time institutions would have to spendin sorting their courses into the various categories, distinctionsbetween the fields of study, and some general assumptions aboutthe prevalence of distance education offerings in various fields.These assumptions were based on discussions with institutionsduring the survey development process, and articles on distanceeducation from media sources such as the Chronicle of HigherEducation.

23
All of these factors should be kept in mind wheninterpreting the following sections on courses andenrollments by fields of study.
Course Offerings by Field of Study
About two-thirds (70 percent) of the institutionsthat offered any distance education courses in1997–98 offered college-level, credit-grantingdistance education courses in the broad categoryof English, humanities, and the social andbehavioral sciences; 55 percent offered for-creditdistance education courses in business andmanagement (table 7). About a third of theinstitutions offering any distance educationcourses in 1997–98 offered college-level, credit-granting distance education courses in the healthprofessions (36 percent), physical and biological/life sciences (33 percent), and mathematics(32 percent); 29 percent offered for-creditdistance education courses in education; and26 percent offered for-credit distance educationcourses in computer sciences. College-level,credit-granting distance education courses wereoffered in the remaining fields of study by17 percent or fewer of the institutions that offereddistance education courses in 1997–98.
The general pattern was for institutions to offerfor-credit distance education courses in thevarious fields of study more at the undergraduatelevel than at the graduate level. For example,71 percent of the institutions that had anyundergraduate programs and that offered distanceeducation courses in 1997–98 offered for-creditundergraduate distance education courses inEnglish, humanities, and the social and behavioralsciences, compared with 22 percent of theinstitutions that had any graduate/first-professional programs offering for-credit distanceeducation courses at the graduate/first-professional level (table 7). An exception to thisgeneral pattern was in the field of education,where 19 percent of the institutions withundergraduate programs offered for-creditundergraduate distance education courses ineducation, compared with 40 percent of theinstitutions with graduate/first-professionalprograms offering for-credit distance educationcourses at the graduate/first-professional level.For-credit engineering and library and infor-mation sciences courses were also offered moreoften at the graduate/first-professional level thanat the undergraduate level.
Table 7.—Percent of 2-year and 4-year postsecondary education institutions offering any distanceeducation courses in 1997–98 that offered college-level, credit-granting distanceeducation courses in various fields of study in 1997–98, by course level and field
FieldCourses at either
level1
Undergraduate
courses2
Graduate/
first-professional
courses3
English, humanities, social and behavioral sciences........................................ 70 71 22Business and management............................................................................... 55 51 30Health professions ........................................................................................... 36 31 24Physical and biological/life sciences ............................................................... 33 32 8Mathematics .................................................................................................... 32 32 7Education ........................................................................................................ 29 19 40Computer science ............................................................................................ 26 25 10Vocational/technical fields .............................................................................. 17 17 3Engineering ..................................................................................................... 12 9 16Agriculture and natural resources .................................................................... 7 7 3Library and information sciences .................................................................... 6 4 7Other fields...................................................................................................... 16 13 13
1Based on the estimated 1,680 institutions that offered any distance education courses in 1997–98.2Based on the estimated 1,620 institutions that had undergraduate programs and that offered any distance education courses in 1997–98.3Based on the estimated 750 institutions that had graduate or first-professional programs and that offered any distance education courses in1997–98.
SOURCE: U.S. Department of Education, National Center for Education Statistics, Postsecondary Education Quick Information System, Surveyon Distance Education at Postsecondary Education Institutions, 1998–1999.
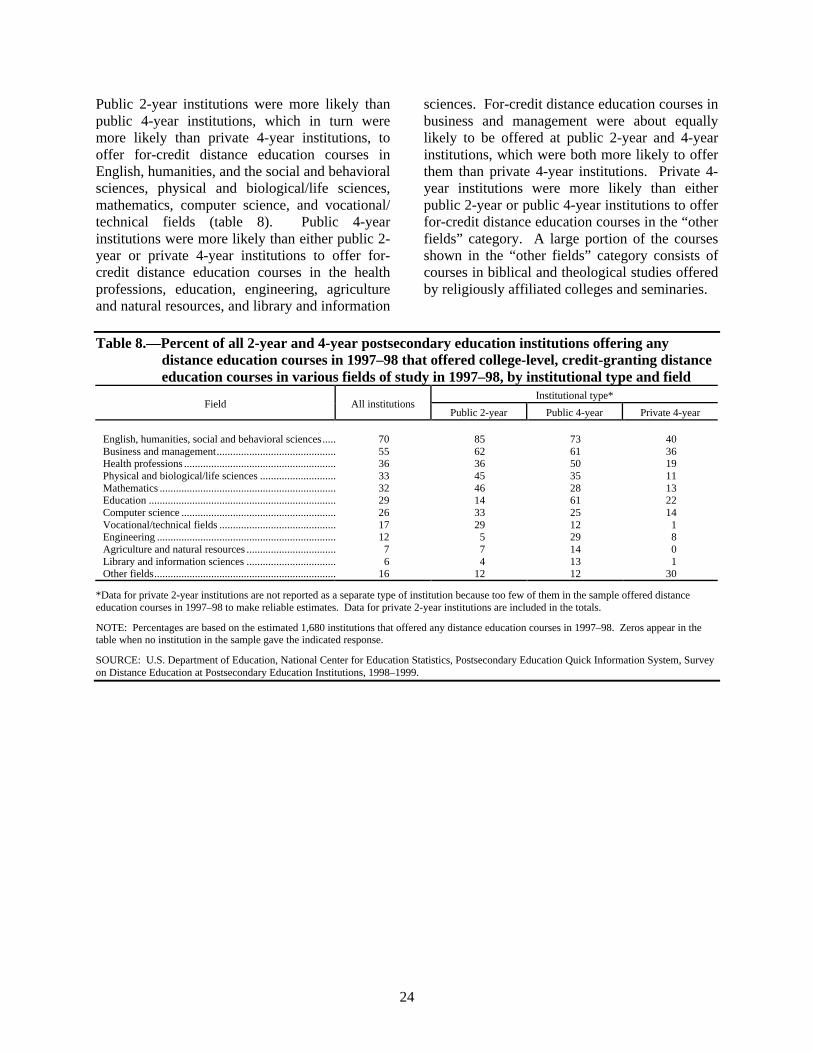
24
Public 2-year institutions were more likely thanpublic 4-year institutions, which in turn weremore likely than private 4-year institutions, tooffer for-credit distance education courses inEnglish, humanities, and the social and behavioralsciences, physical and biological/life sciences,mathematics, computer science, and vocational/technical fields (table 8). Public 4-yearinstitutions were more likely than either public 2-year or private 4-year institutions to offer for-credit distance education courses in the healthprofessions, education, engineering, agricultureand natural resources, and library and information
sciences. For-credit distance education courses inbusiness and management were about equallylikely to be offered at public 2-year and 4-yearinstitutions, which were both more likely to offerthem than private 4-year institutions. Private 4-year institutions were more likely than eitherpublic 2-year or public 4-year institutions to offerfor-credit distance education courses in the “otherfields” category. A large portion of the coursesshown in the “other fields” category consists ofcourses in biblical and theological studies offeredby religiously affiliated colleges and seminaries.
Table 8.—Percent of all 2-year and 4-year postsecondary education institutions offering anydistance education courses in 1997–98 that offered college-level, credit-granting distanceeducation courses in various fields of study in 1997–98, by institutional type and field
Institutional type*Field All institutions
Public 2-year Public 4-year Private 4-year
English, humanities, social and behavioral sciences..... 70 85 73 40Business and management............................................ 55 62 61 36Health professions ........................................................ 36 36 50 19Physical and biological/life sciences ............................ 33 45 35 11Mathematics ................................................................. 32 46 28 13Education ..................................................................... 29 14 61 22Computer science ......................................................... 26 33 25 14Vocational/technical fields ........................................... 17 29 12 1Engineering .................................................................. 12 5 29 8Agriculture and natural resources ................................. 7 7 14 0Library and information sciences ................................. 6 4 13 1Other fields................................................................... 16 12 12 30
*Data for private 2-year institutions are not reported as a separate type of institution because too few of them in the sample offered distanceeducation courses in 1997–98 to make reliable estimates. Data for private 2-year institutions are included in the totals.
NOTE: Percentages are based on the estimated 1,680 institutions that offered any distance education courses in 1997–98. Zeros appear in thetable when no institution in the sample gave the indicated response.
SOURCE: U.S. Department of Education, National Center for Education Statistics, Postsecondary Education Quick Information System, Surveyon Distance Education at Postsecondary Education Institutions, 1998–1999.
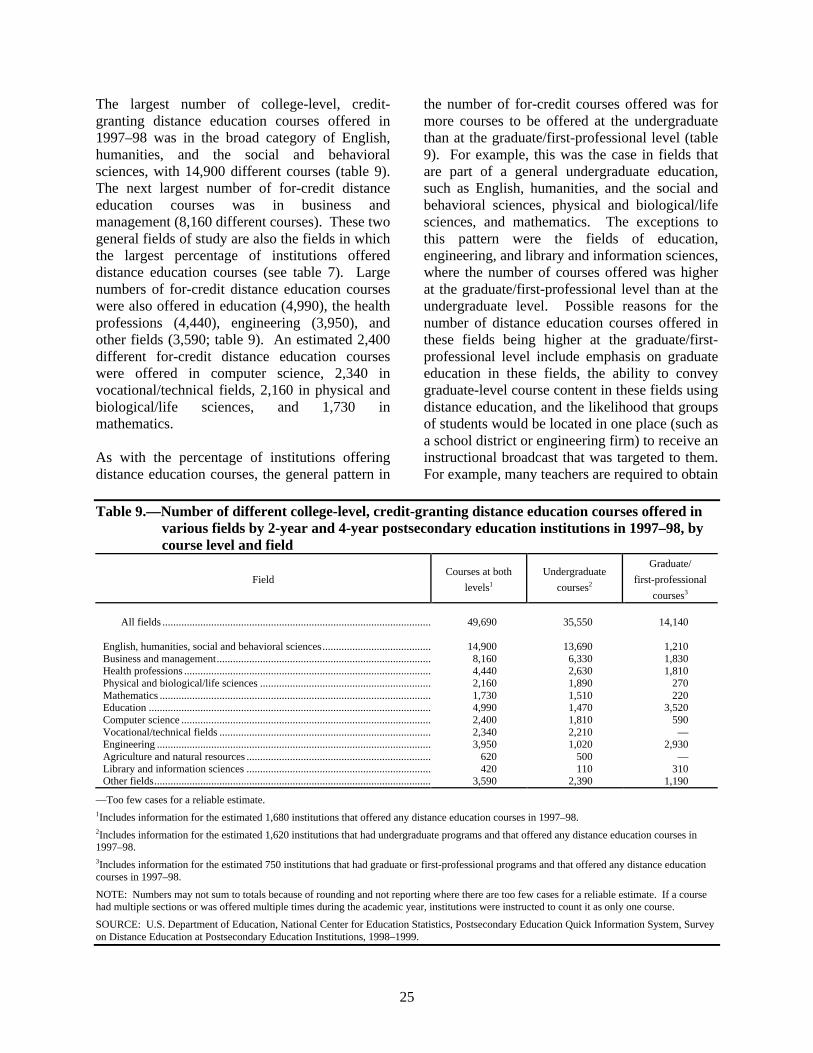
25
The largest number of college-level, credit-granting distance education courses offered in1997–98 was in the broad category of English,humanities, and the social and behavioralsciences, with 14,900 different courses (table 9).The next largest number of for-credit distanceeducation courses was in business andmanagement (8,160 different courses). These twogeneral fields of study are also the fields in whichthe largest percentage of institutions offereddistance education courses (see table 7). Largenumbers of for-credit distance education courseswere also offered in education (4,990), the healthprofessions (4,440), engineering (3,950), andother fields (3,590; table 9). An estimated 2,400different for-credit distance education courseswere offered in computer science, 2,340 invocational/technical fields, 2,160 in physical andbiological/life sciences, and 1,730 inmathematics.
As with the percentage of institutions offeringdistance education courses, the general pattern in
the number of for-credit courses offered was formore courses to be offered at the undergraduatethan at the graduate/first-professional level (table9). For example, this was the case in fields thatare part of a general undergraduate education,such as English, humanities, and the social andbehavioral sciences, physical and biological/lifesciences, and mathematics. The exceptions tothis pattern were the fields of education,engineering, and library and information sciences,where the number of courses offered was higherat the graduate/first-professional level than at theundergraduate level. Possible reasons for thenumber of distance education courses offered inthese fields being higher at the graduate/first-professional level include emphasis on graduateeducation in these fields, the ability to conveygraduate-level course content in these fields usingdistance education, and the likelihood that groupsof students would be located in one place (such asa school district or engineering firm) to receive aninstructional broadcast that was targeted to them.For example, many teachers are required to obtain
Table 9.—Number of different college-level, credit-granting distance education courses offered invarious fields by 2-year and 4-year postsecondary education institutions in 1997–98, bycourse level and field
FieldCourses at both
levels1
Undergraduate
courses2
Graduate/
first-professional
courses3
All fields ................................................................................................... 49,690 35,550 14,140
English, humanities, social and behavioral sciences........................................ 14,900 13,690 1,210Business and management............................................................................... 8,160 6,330 1,830Health professions ........................................................................................... 4,440 2,630 1,810Physical and biological/life sciences ............................................................... 2,160 1,890 270Mathematics .................................................................................................... 1,730 1,510 220Education ........................................................................................................ 4,990 1,470 3,520Computer science ............................................................................................ 2,400 1,810 590Vocational/technical fields .............................................................................. 2,340 2,210 —Engineering ..................................................................................................... 3,950 1,020 2,930Agriculture and natural resources .................................................................... 620 500 —Library and information sciences .................................................................... 420 110 310Other fields...................................................................................................... 3,590 2,390 1,190
—Too few cases for a reliable estimate.1Includes information for the estimated 1,680 institutions that offered any distance education courses in 1997–98.2Includes information for the estimated 1,620 institutions that had undergraduate programs and that offered any distance education courses in1997–98.3Includes information for the estimated 750 institutions that had graduate or first-professional programs and that offered any distance educationcourses in 1997–98.
NOTE: Numbers may not sum to totals because of rounding and not reporting where there are too few cases for a reliable estimate. If a coursehad multiple sections or was offered multiple times during the academic year, institutions were instructed to count it as only one course.
SOURCE: U.S. Department of Education, National Center for Education Statistics, Postsecondary Education Quick Information System, Surveyon Distance Education at Postsecondary Education Institutions, 1998–1999.

26
a master’s degree to continue teaching or toreceive increases in their pay, and school districtssometimes accommodate this requirement byarranging for distance education courses ineducation to be received at a site in their districtthat is readily available to teachers. Technology-intensive fields such as engineering are likely torequire constant updating of knowledge and skillsbeyond the bachelor’s degree, and may be moreamenable to distance education than fields thatrequire laboratory work, such as biology andchemistry. For example, Stanford University hasbeen using its instructional television network tobroadcast graduate courses in engineering tocorporate sites throughout the country for nearly30 years (Chronicle of Higher Education, June20, 1997).
Public 2-year institutions offered more for-creditdistance education courses than public 4-yearinstitutions in English, humanities, and the socialand behavioral sciences, business and manage-ment, computer science, and mathematics(table 10). Public 4-year institutions offered morefor-credit distance education courses than public
2-year institutions in the health professions andeducation. For engineering, agriculture andnatural resources, and library and informationsciences, there were too few cases for reliableestimates of the number of courses offered atpublic 2-year institutions. For private 4-yearinstitutions, the number of courses offered couldnot be reported for most of the fields of studybecause there were too few cases for reliableestimates. Where the data could be reported, thenumber of for-credit distance education coursesoffered by private 4-year institutions was lowerthan at public 2-year institutions in English,humanities, and the social and behavioralsciences and in business and management. Thenumber of for-credit distance education coursesoffered by private 4-year institutions was lowerthan at public 4-year institutions in English,humanities, and the social and behavioralsciences and in the health professions. Thenumber of for-credit distance education coursesoffered in the “other fields” category was higherfor private 4-year institutions than for public4-year institutions.
Table 10.—Number of different college-level, credit-granting distance education courses offered invarious fields by 2-year and 4-year postsecondary education institutions in 1997–98, byinstitutional type and field
Institutional type*Field All institutions
Public 2-year Public 4-year Private 4-year
All fields ................................................................ 49,690 18,860 20,500 9,740
English, humanities, social and behavioral sciences..... 14,900 8,090 4,990 1,680Business and management............................................ 8,160 3,450 2,600 1,970Health professions ........................................................ 4,440 1,260 2,170 980Physical and biological/life sciences ............................ 2,160 1,090 870 —Mathematics ................................................................. 1,730 860 600 —Education ..................................................................... 4,990 340 3,930 —Computer science ......................................................... 2,400 960 710 —Vocational/technical fields ........................................... 2,340 1,800 420 —Engineering .................................................................. 3,950 — 3,020 —Agriculture and natural resources ................................. 620 — 460 —Library and information sciences ................................. 420 — 340 —Other fields................................................................... 3,590 650 390 2,500
—Too few cases for a reliable estimate.
*Data for private 2-year institutions are not reported as a separate type of institution because too few of them in the sample offered distanceeducation courses in 1997–98 to make reliable estimates. Data for private 2-year institutions are included in the totals.
NOTE: The table includes information for the estimated 1,680 institutions that offered any distance education courses in 1997–98. Numbersmay not sum to totals because of rounding and not reporting where there are too few cases for a reliable estimate. If a course had multiplesections or was offered multiple times during the academic year, institutions were instructed to count it as only one course.
SOURCE: U.S. Department of Education, National Center for Education Statistics, Postsecondary Education Quick Information System, Surveyon Distance Education at Postsecondary Education Institutions, 1998–1999.
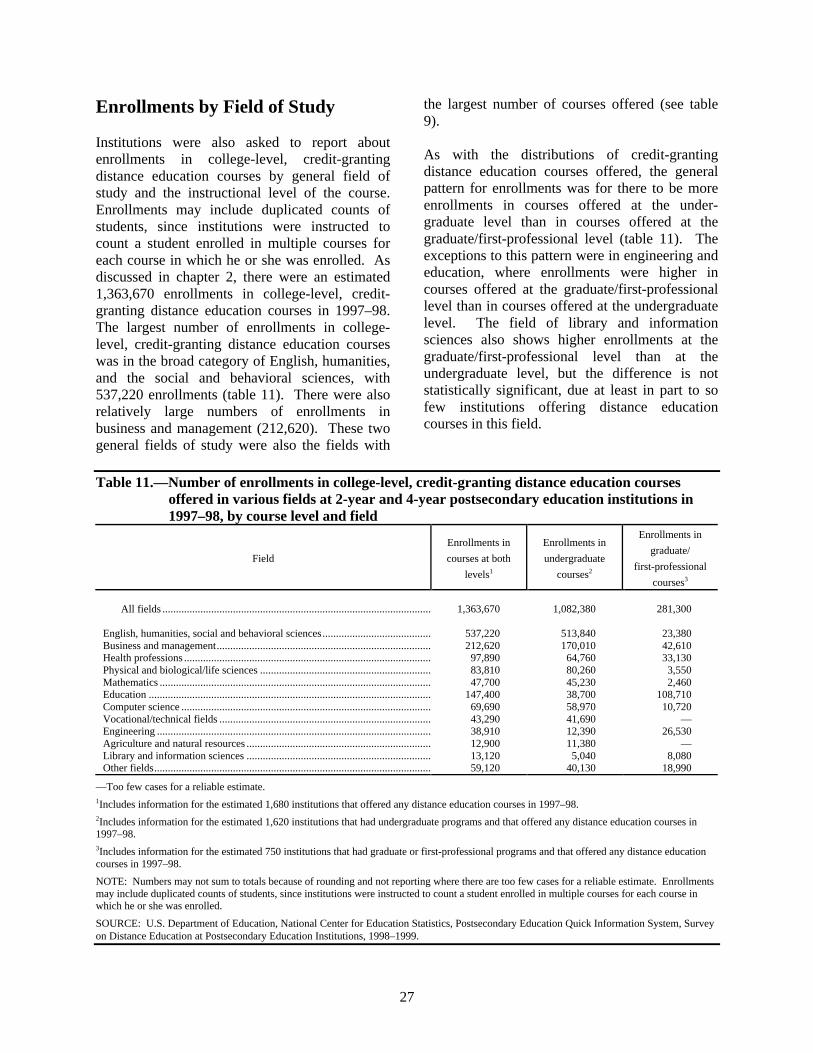
27
Enrollments by Field of Study
Institutions were also asked to report aboutenrollments in college-level, credit-grantingdistance education courses by general field ofstudy and the instructional level of the course.Enrollments may include duplicated counts ofstudents, since institutions were instructed tocount a student enrolled in multiple courses foreach course in which he or she was enrolled. Asdiscussed in chapter 2, there were an estimated1,363,670 enrollments in college-level, credit-granting distance education courses in 1997–98.The largest number of enrollments in college-level, credit-granting distance education courseswas in the broad category of English, humanities,and the social and behavioral sciences, with537,220 enrollments (table 11). There were alsorelatively large numbers of enrollments inbusiness and management (212,620). These twogeneral fields of study were also the fields with
the largest number of courses offered (see table9).
As with the distributions of credit-grantingdistance education courses offered, the generalpattern for enrollments was for there to be moreenrollments in courses offered at the under-graduate level than in courses offered at thegraduate/first-professional level (table 11). Theexceptions to this pattern were in engineering andeducation, where enrollments were higher incourses offered at the graduate/first-professionallevel than in courses offered at the undergraduatelevel. The field of library and informationsciences also shows higher enrollments at thegraduate/first-professional level than at theundergraduate level, but the difference is notstatistically significant, due at least in part to sofew institutions offering distance educationcourses in this field.
Table 11.—Number of enrollments in college-level, credit-granting distance education coursesoffered in various fields at 2-year and 4-year postsecondary education institutions in1997–98, by course level and field
Field
Enrollments in
courses at both
levels1
Enrollments in
undergraduate
courses2
Enrollments in
graduate/
first-professional
courses3
All fields ................................................................................................... 1,363,670 1,082,380 281,300
English, humanities, social and behavioral sciences........................................ 537,220 513,840 23,380Business and management............................................................................... 212,620 170,010 42,610Health professions ........................................................................................... 97,890 64,760 33,130Physical and biological/life sciences ............................................................... 83,810 80,260 3,550Mathematics .................................................................................................... 47,700 45,230 2,460Education ........................................................................................................ 147,400 38,700 108,710Computer science ............................................................................................ 69,690 58,970 10,720Vocational/technical fields .............................................................................. 43,290 41,690 —Engineering ..................................................................................................... 38,910 12,390 26,530Agriculture and natural resources .................................................................... 12,900 11,380 —Library and information sciences .................................................................... 13,120 5,040 8,080Other fields...................................................................................................... 59,120 40,130 18,990
—Too few cases for a reliable estimate.1Includes information for the estimated 1,680 institutions that offered any distance education courses in 1997–98.2Includes information for the estimated 1,620 institutions that had undergraduate programs and that offered any distance education courses in1997–98.3Includes information for the estimated 750 institutions that had graduate or first-professional programs and that offered any distance educationcourses in 1997–98.
NOTE: Numbers may not sum to totals because of rounding and not reporting where there are too few cases for a reliable estimate. Enrollmentsmay include duplicated counts of students, since institutions were instructed to count a student enrolled in multiple courses for each course inwhich he or she was enrolled.
SOURCE: U.S. Department of Education, National Center for Education Statistics, Postsecondary Education Quick Information System, Surveyon Distance Education at Postsecondary Education Institutions, 1998–1999.

28
Public 2-year institutions had higher distanceeducation enrollments than public 4-yearinstitutions in the following fields (see table 12):English, humanities, and the social and behavioralsciences, business and management, physical andbiological/life sciences, mathematics, computerscience, and vocational/technical fields. Thenumber of enrollments in the broad category ofEnglish, humanities, and social and behavioralsciences is particularly large at public 2-yearinstitutions; it accounts for about half of thedistance education enrollments at theseinstitutions. Courses in this broad categoryconstitute a large portion of lower divisioncoursework at the undergraduate level, suggestingthat many of the enrollments in distance
education courses at public 2-year institutionscould be used to fulfill lower division courserequirements. Distance education enrollments atpublic 4-year institutions were higher than atpublic 2-year institutions in education; thedifference for the health professions was notstatistically significant. As with the number ofcourses offered, some of the enrollment data byfield of study cannot be reported for private 4-year institutions because there were too few casesfor reliable estimates. Where the data could bereported, enrollments at private 4-year institutionswere lower than at public 2-year and public 4-year institutions, except in the “other fields”category, which did not differ significantly.
Table 12.—Number of enrollments in college-level, credit-granting distance education coursesoffered in various fields at 2-year and 4-year postsecondary education institutions in1997–98, by institutional type and field
Institutional type*Field All institutions
Public 2-year Public 4-year Private 4-year
All fields ................................................................ 1,363,670 690,700 452,600 208,590
English, humanities, social and behavioral sciences..... 537,220 355,130 133,210 47,830Business and management............................................ 212,620 99,120 76,050 36,180Health professions ........................................................ 97,890 39,250 48,310 9,900Physical and biological/life sciences ............................ 83,810 59,390 18,710 —Mathematics ................................................................. 47,700 30,830 11,620 —Education ..................................................................... 147,400 13,080 81,530 —Computer science ......................................................... 69,690 36,640 15,140 —Vocational/technical fields ........................................... 43,290 30,960 6,930 —Engineering .................................................................. 38,910 — 29,440 —Agriculture and natural resources ................................. 12,900 — 10,160 —Library and information sciences ................................. 13,120 — 8,520 —Other fields................................................................... 59,120 18,130 12,990 24,650
—Too few cases for a reliable estimate.
*Data for private 2-year institutions are not reported as a separate type of institution because too few of them in the sample offered distanceeducation courses in 1997–98 to make reliable estimates. Data for private 2-year institutions are included in the totals.
NOTE: The table includes information for the estimated 1,680 institutions that offered any distance education courses in 1997–98. Numbersmay not sum to totals because of rounding and not reporting where there are too few cases for a reliable estimate. Enrollments may includeduplicated counts of students, since institutions were instructed to count a student enrolled in multiple courses for each course in which he or shewas enrolled.
SOURCE: U.S. Department of Education, National Center for Education Statistics, Postsecondary Education Quick Information System, Surveyon Distance Education at Postsecondary Education Institutions, 1998–1999.
29
Summary
There were an estimated 54,470 different distanceeducation courses offered in 1997–98 (includingcourses designed for all types of students), and anestimated 49,690 different college-level, credit-granting distance education courses, with most ofthese in courses at the undergraduate level. Thisis consistent with the pattern of enrollmentsdiscussed in chapter 2. The largest numbers ofcourses and enrollments were in the broadcategory of English, humanities, and social andbehavioral sciences. There were also large
numbers of enrollments in business and manage-ment, education, and the health professions. Withthe exceptions of engineering, education, andlibrary and information sciences, the generalpattern was for the numbers of courses to behigher at the undergraduate level than at thegraduate/first-professional level. As with thedistributions of distance education coursesoffered, the general pattern was for there to bemore enrollments in courses offered at theundergraduate level than in courses offered at thegraduate/first-professional level.

30
31
4. DEGREE ANDCERTIFICATE PROGRAMS
While taking individual courses through distanceeducation has the potential to increase access topostsecondary education among those whotraditionally have not had access, it is thepossibility of completing degree and certificateprograms solely through distance education thatoffers the potential for the most dramatic changesin access and opportunity. This chapter presentsinformation about the prevalence of distanceeducation degree and certificate programs in allpostsecondary institutions by institutional type,level of the degree and certificate programs, andgeneral field of study. Trend analyses for thesubset of higher education institutions can befound in chapter 7, Changes in DistanceEducation Since 1994–95.
Institutions Offering Degree andCertificate Programs
In 1997–98, 8 percent of all 2-year and 4-yearpostsecondary education institutions had anycollege-level degree or certificate programs thatwere designed to be completed totally throughdistance education (table 13).14 Among the
14For this survey, institutions were instructed to include only degree
or certificate programs based on credit-granting courses. Theywere also instructed to include programs that may require a smallamount of on-campus coursework or labwork, clinical work inhospitals, or similar arrangements. An example of this type ofprogram would be a nursing program where students receive alltheir coursework through distance education and then completetheir clinical work in hospitals located near their homes.Institutions were also instructed to include baccalaureate degreecompletion programs, which are programs where students enter aninstitution with an associate’s degree (or the equivalent number ofcredits) and then complete their final 2 years of coursework at thenew institution. These are sometimes structured as articulationprograms between community colleges and public 4-year collegesin the state, with students completing the first 2 years ofcoursework on campus at the community college, and thenreceiving the last 2 years of coursework through a distanceeducation baccalaureate completion program offered by the public4-year college.
34 percent of institutions that offered any distanceeducation courses in 1997–98, 25 percent had anycollege-level degree or certificate programs thatwere designed to be completed totally throughdistance education. Among all institutions, public4-year institutions were more likely than the othertypes of institutions to have distance educationdegree and certificate programs; 30 percent of allpublic 4-year institutions had any distanceeducation degree or certificate programs,compared with 8 percent of public 2-year and6 percent of private 4-year institutions. Degreeprograms were more prevalent than certificateprograms; 22 percent of the institutions thatoffered distance education courses offered degreeprograms and 7 percent offered certificateprograms. Both degree and certificate programswere more likely to be offered at thegraduate/first-professional level than at theundergraduate level (31 percent compared with13 percent for degrees, and 9 percent comparedwith 4 percent for certificates).
Table 14 shows the percentage of institutions thatoffered distance education courses in 1997–98that had degree and certificate programs designedto be completed totally through distanceeducation, by field of study and instructional levelof the distance education degree or certificateprogram. Overall, distance education degree andcertificate programs were not widely offered inmost fields. Graduate/first-professional degreeprograms were most likely to be offered inbusiness and management, the health professions,education, and engineering, although thepercentages of institutions offering programs inthese fields were still quite low.
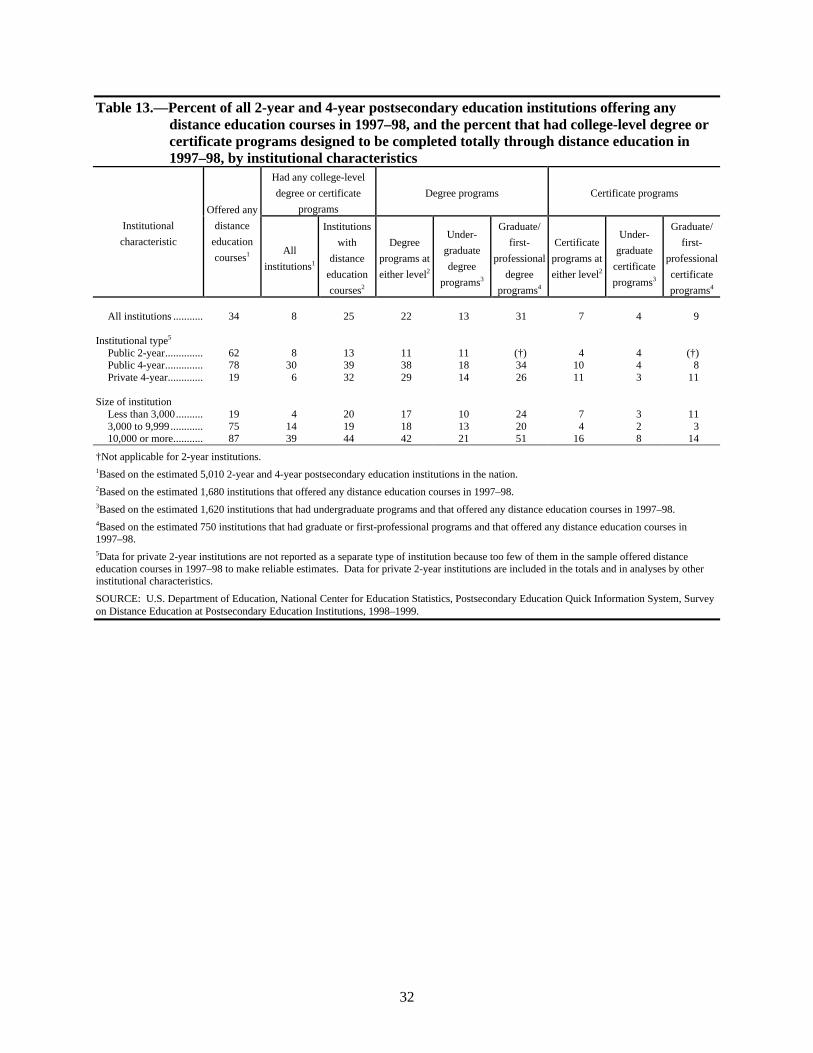
32
Table 13.—Percent of all 2-year and 4-year postsecondary education institutions offering anydistance education courses in 1997–98, and the percent that had college-level degree orcertificate programs designed to be completed totally through distance education in1997–98, by institutional characteristics
Had any college-level
degree or certificate
programs
Degree programs Certificate programs
Institutional
characteristic
Offered any
distance
education
courses1 All
institutions1
Institutions
with
distance
education
courses2
Degree
programs at
either level2
Under-
graduate
degree
programs3
Graduate/
first-
professional
degree
programs4
Certificate
programs at
either level2
Under-
graduate
certificate
programs3
Graduate/
first-
professional
certificate
programs4
All institutions ........... 34 8 25 22 13 31 7 4 9
Institutional type5
Public 2-year.............. 62 8 13 11 11 (†) 4 4 (†)Public 4-year.............. 78 30 39 38 18 34 10 4 8Private 4-year............. 19 6 32 29 14 26 11 3 11
Size of institutionLess than 3,000.......... 19 4 20 17 10 24 7 3 113,000 to 9,999............ 75 14 19 18 13 20 4 2 310,000 or more........... 87 39 44 42 21 51 16 8 14
†Not applicable for 2-year institutions.1Based on the estimated 5,010 2-year and 4-year postsecondary education institutions in the nation.2Based on the estimated 1,680 institutions that offered any distance education courses in 1997–98.3Based on the estimated 1,620 institutions that had undergraduate programs and that offered any distance education courses in 1997–98.4Based on the estimated 750 institutions that had graduate or first-professional programs and that offered any distance education courses in1997–98.5Data for private 2-year institutions are not reported as a separate type of institution because too few of them in the sample offered distanceeducation courses in 1997–98 to make reliable estimates. Data for private 2-year institutions are included in the totals and in analyses by otherinstitutional characteristics.
SOURCE: U.S. Department of Education, National Center for Education Statistics, Postsecondary Education Quick Information System, Surveyon Distance Education at Postsecondary Education Institutions, 1998–1999.

33
Table 14.—Percent of 2-year and 4-year postsecondary education institutions offering any distanceeducation courses in 1997–98 that had college-level degree or certificate programs invarious fields that were designed to be completed totally through distance education, bylevel and field
Degree programs Certificate programs
Field Undergraduate
degree programs1
Graduate/
first-professional
degree programs2
Undergraduate
certificate
programs1
Graduate/
first-professional
certificate
programs2
English, humanities, social and behavioral sciences..... 3 4 (††) 1Business and management............................................ 4 11 1 2Health professions ........................................................ 3 9 1 3Physical and biological/life sciences ............................ (††) 1 (††) (††)Mathematics ................................................................. 0 (††) 0 (††)Education ..................................................................... 1 9 1 2Computer science ......................................................... 1 4 1 1Vocational/technical fields ........................................... 1 1 1 0Engineering .................................................................. 1 8 (††) 1Agriculture and natural resources ................................. (††) 1 (††) (††)Library and information sciences ................................. 0 1 (††) (††)Liberal/general studies.................................................. 4 (††) 0 0Other fields................................................................... 1 3 (††) 0
††Less than 0.5 percent.1Based on the estimated 1,620 institutions that had undergraduate programs and that offered any distance education courses in 1997–98.2Based on the estimated 750 institutions that had graduate or first-professional programs and that offered any distance education courses in1997–98.
NOTE: Zeros appear in the table when no institution in the sample gave the indicated response.
SOURCE: U.S. Department of Education, National Center for Education Statistics, Postsecondary Education Quick Information System, Surveyon Distance Education at Postsecondary Education Institutions, 1998–1999.
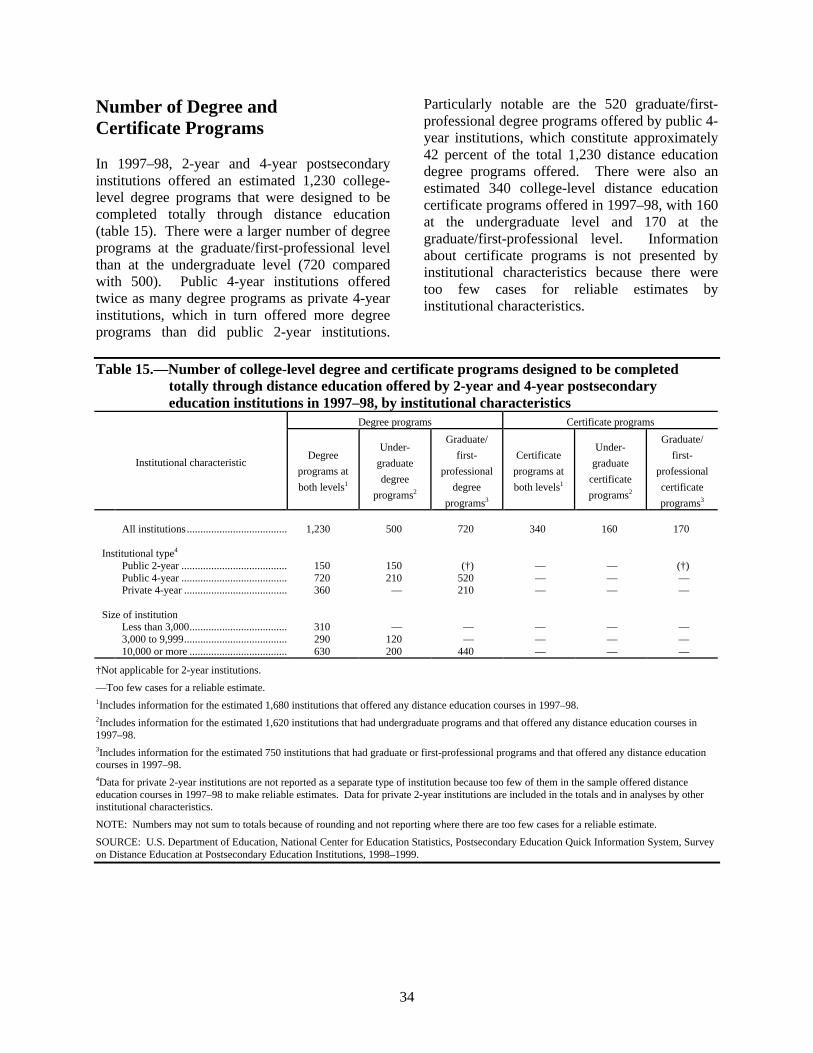
34
Number of Degree andCertificate Programs
In 1997–98, 2-year and 4-year postsecondaryinstitutions offered an estimated 1,230 college-level degree programs that were designed to becompleted totally through distance education(table 15). There were a larger number of degreeprograms at the graduate/first-professional levelthan at the undergraduate level (720 comparedwith 500). Public 4-year institutions offeredtwice as many degree programs as private 4-yearinstitutions, which in turn offered more degreeprograms than did public 2-year institutions.
Particularly notable are the 520 graduate/first-professional degree programs offered by public 4-year institutions, which constitute approximately42 percent of the total 1,230 distance educationdegree programs offered. There were also anestimated 340 college-level distance educationcertificate programs offered in 1997–98, with 160at the undergraduate level and 170 at thegraduate/first-professional level. Informationabout certificate programs is not presented byinstitutional characteristics because there weretoo few cases for reliable estimates byinstitutional characteristics.
Table 15.—Number of college-level degree and certificate programs designed to be completedtotally through distance education offered by 2-year and 4-year postsecondaryeducation institutions in 1997–98, by institutional characteristics
Degree programs Certificate programs
Institutional characteristicDegree
programs at
both levels1
Under-
graduate
degree
programs2
Graduate/
first-
professional
degree
programs3
Certificate
programs at
both levels1
Under-
graduate
certificate
programs2
Graduate/
first-
professional
certificate
programs3
All institutions ..................................... 1,230 500 720 340 160 170
Institutional type4
Public 2-year ....................................... 150 150 (†) — — (†)Public 4-year ....................................... 720 210 520 — — —Private 4-year ...................................... 360 — 210 — — —
Size of institutionLess than 3,000.................................... 310 — — — — —3,000 to 9,999...................................... 290 120 — — — —10,000 or more .................................... 630 200 440 — — —
†Not applicable for 2-year institutions.
—Too few cases for a reliable estimate.1Includes information for the estimated 1,680 institutions that offered any distance education courses in 1997–98.2Includes information for the estimated 1,620 institutions that had undergraduate programs and that offered any distance education courses in1997–98.3Includes information for the estimated 750 institutions that had graduate or first-professional programs and that offered any distance educationcourses in 1997–98.4Data for private 2-year institutions are not reported as a separate type of institution because too few of them in the sample offered distanceeducation courses in 1997–98 to make reliable estimates. Data for private 2-year institutions are included in the totals and in analyses by otherinstitutional characteristics.
NOTE: Numbers may not sum to totals because of rounding and not reporting where there are too few cases for a reliable estimate.
SOURCE: U.S. Department of Education, National Center for Education Statistics, Postsecondary Education Quick Information System, Surveyon Distance Education at Postsecondary Education Institutions, 1998–1999.
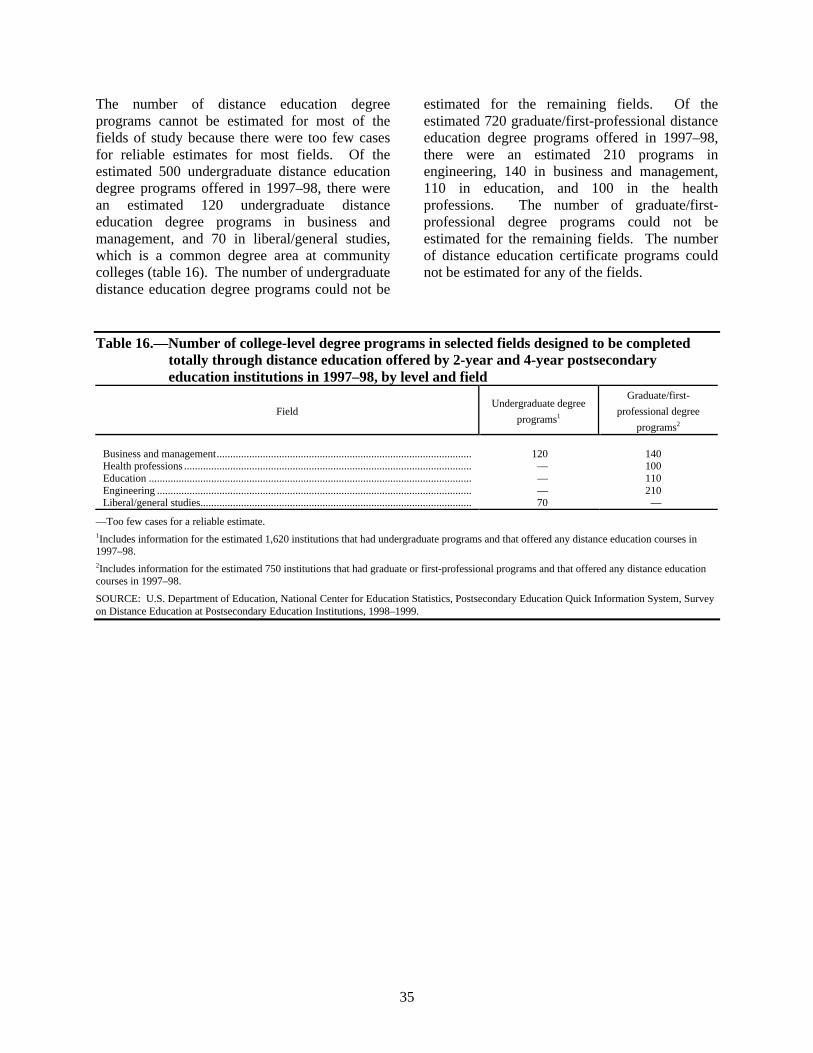
35
The number of distance education degreeprograms cannot be estimated for most of thefields of study because there were too few casesfor reliable estimates for most fields. Of theestimated 500 undergraduate distance educationdegree programs offered in 1997–98, there werean estimated 120 undergraduate distanceeducation degree programs in business andmanagement, and 70 in liberal/general studies,which is a common degree area at communitycolleges (table 16). The number of undergraduatedistance education degree programs could not be
estimated for the remaining fields. Of theestimated 720 graduate/first-professional distanceeducation degree programs offered in 1997–98,there were an estimated 210 programs inengineering, 140 in business and management,110 in education, and 100 in the healthprofessions. The number of graduate/first-professional degree programs could not beestimated for the remaining fields. The numberof distance education certificate programs couldnot be estimated for any of the fields.
Table 16.—Number of college-level degree programs in selected fields designed to be completedtotally through distance education offered by 2-year and 4-year postsecondaryeducation institutions in 1997–98, by level and field
FieldUndergraduate degree
programs1
Graduate/first-
professional degree
programs2
Business and management.............................................................................................. 120 140Health professions .......................................................................................................... — 100Education ....................................................................................................................... — 110Engineering .................................................................................................................... — 210Liberal/general studies.................................................................................................... 70 —
—Too few cases for a reliable estimate.1Includes information for the estimated 1,620 institutions that had undergraduate programs and that offered any distance education courses in1997–98.2Includes information for the estimated 750 institutions that had graduate or first-professional programs and that offered any distance educationcourses in 1997–98.
SOURCE: U.S. Department of Education, National Center for Education Statistics, Postsecondary Education Quick Information System, Surveyon Distance Education at Postsecondary Education Institutions, 1998–1999.
36
Summary
In 1997–98, degree and certificate programsdesigned to be completed totally through distanceeducation were offered by 8 percent of all 2-yearand 4-year postsecondary education institutionsand by 25 percent of the postsecondaryinstitutions that offered distance educationcourses. Degree programs were more prevalentthan certificate programs and were more likely tobe offered at the graduate/first-professional levelthan at the undergraduate level. Public 4-yearinstitutions were particularly likely to havedistance education degree and certificate
programs. Overall, distance education degree andcertificate programs were not widely offered inmost fields of study. Graduate/first-professionaldegree programs were most likely to be offered inbusiness and management, the health professions,education, and engineering, although thepercentages of institutions offering programs inthese fields were still quite low. There were anestimated 1,230 college-level degree programsand 340 college-level certificate programsdesigned to be completed totally through distanceeducation.

37
5. DISTANCE EDUCATIONTECHNOLOGIES
Changes in the types of technologies available fordelivering distance education, including changesin the capabilities of networking technology andthe rise of the Internet, have played a role in theadoption of distance education by postsecondaryinstitutions. This chapter provides informationabout the types of technologies employed by allpostsecondary institutions to deliver distanceeducation. The chapter begins by defining thetechnologies included in this study, and thenproceeds to describe the technologies used during1997–98 by institutional type. To provide insightinto the dynamic nature of distance educationtechnologies, the chapter concludes withinformation about postsecondary institutions’plans for the use of various technologies in thenext 3 years. Trend analyses for the subset ofhigher education institutions can be found inchapter 7, Changes in Distance Education Since1994–95.
Technologies Included in This Study
This study asked about the following technologiesavailable for the instructional delivery of distanceeducation courses. Courses conducted exclu-sively through written correspondence were notincluded in this study.
• Video technologies: two-way video with two-way audio (also referred to as two-wayinteractive video), one-way video with two-way audio, one-way live video, and one-wayprerecorded video (including prerecordedvideotapes provided to students, andtelevision broadcast and cable transmissionusing prerecorded video).
• Audio technologies: two-way audio trans-mission (e.g., audio/phone conferencing) andone-way audio transmission (including radio
broadcast and prerecorded audiotapesprovided to students).
• Internet-based technologies: Internet coursesusing synchronous (i.e., simultaneous or “realtime”) computer-based instruction (e.g.,interactive computer conferencing orInteractive Relay Chat), and Internet coursesusing asynchronous (i.e., not simultaneous)computer-based instruction (e.g., e-mail,listserves, and most World Wide Web-basedcourses).
• Other technologies: CD-ROM, mixed modepackages (i.e., a mix of technologies thatcannot be assigned to a primary mode), andan open-ended “other, specify” category.
Instructional TechnologiesUsed in 1997–98
Institutions that offered distance educationcourses in 1997–98 were asked which types oftechnology the institution used as a primary modeof instructional delivery for distance educationcourses in 1997–98. An individual course couldhave only one predominant mode of delivery.15
Institutions could, however, indicate that theyused many different technologies as primarymodes of instructional delivery across all of theirdistance education courses, since differentdistance education courses could use differenttypes of technology. Information was notcollected about the number of courses offeredusing each technology as the primaryinstructional delivery mode, only whether theinstitution used it at all as a primary mode ofinstruction for distance education courses. 15If a course used multiple technologies to deliver instruction but one
mode predominated, institutions were instructed to indicate thepredominant mode for the course. If no primary mode could beidentified, then the course would be considered to use a mixed-mode package as the primary mode of instructional delivery.
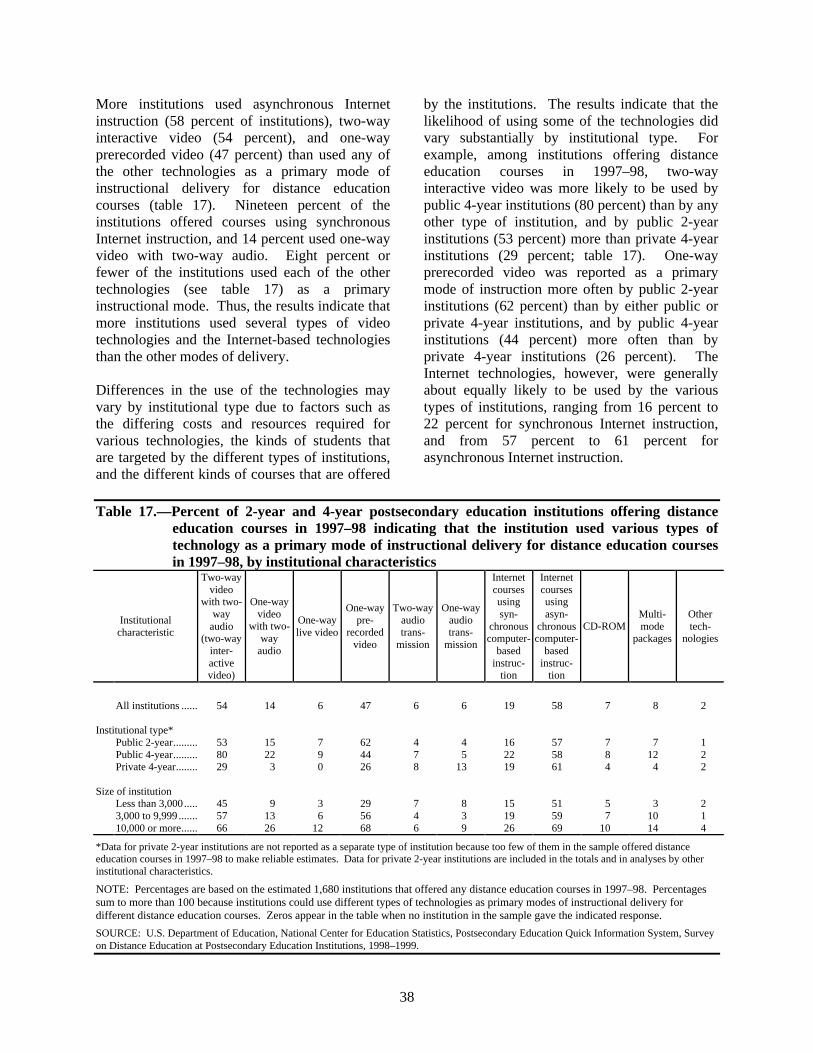
38
More institutions used asynchronous Internetinstruction (58 percent of institutions), two-wayinteractive video (54 percent), and one-wayprerecorded video (47 percent) than used any ofthe other technologies as a primary mode ofinstructional delivery for distance educationcourses (table 17). Nineteen percent of theinstitutions offered courses using synchronousInternet instruction, and 14 percent used one-wayvideo with two-way audio. Eight percent orfewer of the institutions used each of the othertechnologies (see table 17) as a primaryinstructional mode. Thus, the results indicate thatmore institutions used several types of videotechnologies and the Internet-based technologiesthan the other modes of delivery.
Differences in the use of the technologies mayvary by institutional type due to factors such asthe differing costs and resources required forvarious technologies, the kinds of students thatare targeted by the different types of institutions,and the different kinds of courses that are offered
by the institutions. The results indicate that thelikelihood of using some of the technologies didvary substantially by institutional type. Forexample, among institutions offering distanceeducation courses in 1997–98, two-wayinteractive video was more likely to be used bypublic 4-year institutions (80 percent) than by anyother type of institution, and by public 2-yearinstitutions (53 percent) more than private 4-yearinstitutions (29 percent; table 17). One-wayprerecorded video was reported as a primarymode of instruction more often by public 2-yearinstitutions (62 percent) than by either public orprivate 4-year institutions, and by public 4-yearinstitutions (44 percent) more often than byprivate 4-year institutions (26 percent). TheInternet technologies, however, were generallyabout equally likely to be used by the varioustypes of institutions, ranging from 16 percent to22 percent for synchronous Internet instruction,and from 57 percent to 61 percent forasynchronous Internet instruction.
Table 17.—Percent of 2-year and 4-year postsecondary education institutions offering distanceeducation courses in 1997–98 indicating that the institution used various types oftechnology as a primary mode of instructional delivery for distance education coursesin 1997–98, by institutional characteristics
Institutionalcharacteristic
Two-wayvideo
with two-way
audio(two-way
inter-activevideo)
One-wayvideo
with two-way
audio
One-waylive video
One-waypre-
recordedvideo
Two-wayaudiotrans-
mission
One-wayaudiotrans-
mission
Internetcoursesusingsyn-
chronouscomputer-
basedinstruc-
tion
Internetcoursesusingasyn-
chronouscomputer-
basedinstruc-
tion
CD-ROMMulti-mode
packages
Othertech-
nologies
All institutions ...... 54 14 6 47 6 6 19 58 7 8 2
Institutional type*Public 2-year......... 53 15 7 62 4 4 16 57 7 7 1Public 4-year......... 80 22 9 44 7 5 22 58 8 12 2Private 4-year........ 29 3 0 26 8 13 19 61 4 4 2
Size of institutionLess than 3,000..... 45 9 3 29 7 8 15 51 5 3 23,000 to 9,999 ....... 57 13 6 56 4 3 19 59 7 10 110,000 or more...... 66 26 12 68 6 9 26 69 10 14 4
*Data for private 2-year institutions are not reported as a separate type of institution because too few of them in the sample offered distanceeducation courses in 1997–98 to make reliable estimates. Data for private 2-year institutions are included in the totals and in analyses by otherinstitutional characteristics.
NOTE: Percentages are based on the estimated 1,680 institutions that offered any distance education courses in 1997–98. Percentagessum to more than 100 because institutions could use different types of technologies as primary modes of instructional delivery fordifferent distance education courses. Zeros appear in the table when no institution in the sample gave the indicated response.
SOURCE: U.S. Department of Education, National Center for Education Statistics, Postsecondary Education Quick Information System, Surveyon Distance Education at Postsecondary Education Institutions, 1998–1999.
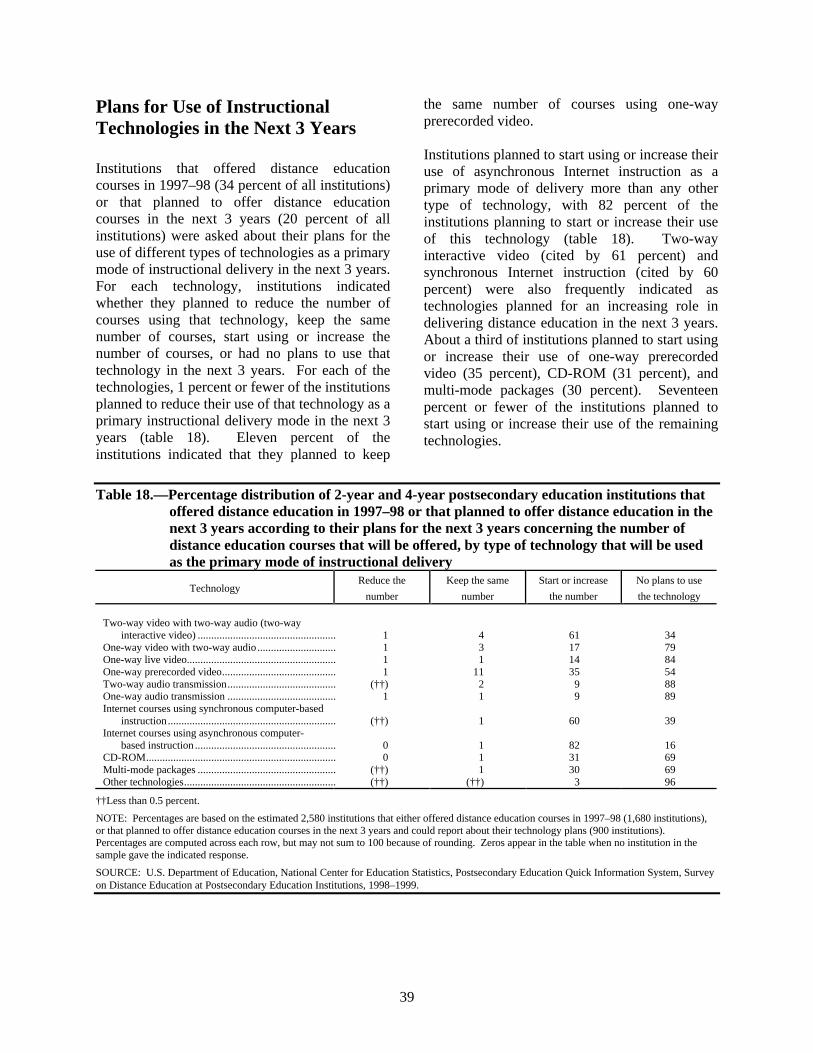
39
Plans for Use of InstructionalTechnologies in the Next 3 Years
Institutions that offered distance educationcourses in 1997–98 (34 percent of all institutions)or that planned to offer distance educationcourses in the next 3 years (20 percent of allinstitutions) were asked about their plans for theuse of different types of technologies as a primarymode of instructional delivery in the next 3 years.For each technology, institutions indicatedwhether they planned to reduce the number ofcourses using that technology, keep the samenumber of courses, start using or increase thenumber of courses, or had no plans to use thattechnology in the next 3 years. For each of thetechnologies, 1 percent or fewer of the institutionsplanned to reduce their use of that technology as aprimary instructional delivery mode in the next 3years (table 18). Eleven percent of theinstitutions indicated that they planned to keep
the same number of courses using one-wayprerecorded video.
Institutions planned to start using or increase theiruse of asynchronous Internet instruction as aprimary mode of delivery more than any othertype of technology, with 82 percent of theinstitutions planning to start or increase their useof this technology (table 18). Two-wayinteractive video (cited by 61 percent) andsynchronous Internet instruction (cited by 60percent) were also frequently indicated astechnologies planned for an increasing role indelivering distance education in the next 3 years.About a third of institutions planned to start usingor increase their use of one-way prerecordedvideo (35 percent), CD-ROM (31 percent), andmulti-mode packages (30 percent). Seventeenpercent or fewer of the institutions planned tostart using or increase their use of the remainingtechnologies.
Table 18.—Percentage distribution of 2-year and 4-year postsecondary education institutions thatoffered distance education in 1997–98 or that planned to offer distance education in thenext 3 years according to their plans for the next 3 years concerning the number ofdistance education courses that will be offered, by type of technology that will be usedas the primary mode of instructional delivery
TechnologyReduce the
number
Keep the same
number
Start or increase
the number
No plans to use
the technology
Two-way video with two-way audio (two-wayinteractive video) ................................................... 1 4 61 34
One-way video with two-way audio............................. 1 3 17 79One-way live video....................................................... 1 1 14 84One-way prerecorded video.......................................... 1 11 35 54Two-way audio transmission........................................ (††) 2 9 88One-way audio transmission ........................................ 1 1 9 89Internet courses using synchronous computer-based
instruction.............................................................. (††) 1 60 39Internet courses using asynchronous computer-
based instruction .................................................... 0 1 82 16CD-ROM...................................................................... 0 1 31 69Multi-mode packages ................................................... (††) 1 30 69Other technologies........................................................ (††) (††) 3 96
††Less than 0.5 percent.
NOTE: Percentages are based on the estimated 2,580 institutions that either offered distance education courses in 1997–98 (1,680 institutions),or that planned to offer distance education courses in the next 3 years and could report about their technology plans (900 institutions).Percentages are computed across each row, but may not sum to 100 because of rounding. Zeros appear in the table when no institution in thesample gave the indicated response.
SOURCE: U.S. Department of Education, National Center for Education Statistics, Postsecondary Education Quick Information System, Surveyon Distance Education at Postsecondary Education Institutions, 1998–1999.

40
Table 19 shows the percentage of institutions thatplanned to start or increase their use of thetechnologies in the next 3 years, presentedseparately for institutions that offered distanceeducation in 1997–98 and institutions thatplanned to start offering distance education in thenext 3 years. Plans for the two groups were notsignificantly different for most technologies.
Two-way interactive video, asynchronousInternet instruction, and multi-mode packageswere some exceptions. For each of these threetechnologies, institutions that offered distanceeducation courses in 1997–98 were more likelythan institutions that planned to start offeringdistance education in the next 3 years to plan tostart or increase their use of this technology.
Table 19.—Percent of 2-year and 4-year postsecondary education institutions offering distanceeducation in 1997–98 or planning to offer distance education in the next 3 years thatplanned to start or increase their use of various types of technologies as the primarymode of instructional delivery during the next 3 years
Technology
Institutions that offered
distance education
in 1997–981
Institutions that planned
to offer distance
education in
the next 3 years2
Two-way video with two-way audio (two-way interactive video)................................ 65 52One-way video with two-way audio............................................................................. 16 19One-way live video....................................................................................................... 12 16One-way prerecorded video.......................................................................................... 37 30Two-way audio transmission........................................................................................ 9 10One-way audio transmission ........................................................................................ 10 8Internet courses using synchronous computer-based instruction .................................. 59 62Internet courses using asynchronous computer-based instruction................................. 87 73CD-ROM...................................................................................................................... 32 27Multi-mode packages ................................................................................................... 35 21Other technologies........................................................................................................ 3 3
1Percentages are based on the estimated 1,680 institutions that offered distance education courses in 1997–98.
2Percentages are based on the estimated 900 institutions that planned to offer distance education courses in the next 3 years and could report abouttheir technology plans.
SOURCE: U.S. Department of Education, National Center for Education Statistics, Postsecondary Education Quick Information System, Surveyon Distance Education at Postsecondary Education Institutions, 1998–1999.
41
Summary
In 1997–98, more institutions used several typesof video technologies and the Internet-basedtechnologies to deliver distance education coursesthan the other modes of delivery. Specifically,more institutions used asynchronous Internetinstruction, two-way interactive video, and one-way prerecorded video than used any of the othertechnologies as a primary mode of instructionaldelivery.
Use of some of the technologies differed byinstitutional type. For example, two-wayinteractive video was more likely to be used bypublic 4-year institutions than by any other typeof institution, and by public 2-year institutionsmore than private 4-year institutions. One-wayprerecorded video was more likely to be used bypublic 2-year institutions than by any other typeof institution, and by public 4-year institutionsmore than private 4-year institutions. TheInternet technologies, however, were about
equally likely to be used by the various types ofinstitutions. Differences in the use of thetechnologies by institutional type may be due tofactors such as the differing costs and resourcesrequired for the various technologies, thedifferent kinds of courses that are offered by theinstitutions and how well those courses fit withthe technologies, and whether the types ofstudents targeted by the institutions are a good fitwith the technologies.
The results suggest that planned investments indistance education technology over the next 3years are more likely to be made on moreadvanced generations of distance educationtechnologies. More institutions indicated plans tostart using or increase their use of asynchronousInternet instruction , two-way interactive video,and synchronous Internet instruction in the next 3years than of other technologies. This suggeststhat interactive video and the Internettechnologies are a growing mode of deliveryamong postsecondary institutions.

42

43
6. TUITION AND FEES
While distance education can be seen as a cost-savings approach to providing postsecondaryeducation, the costs of developing, implementing,and delivering distance education courses can besubstantial. One might expect that institutionswould pass these costs or cost savings on bycharging different tuition and fees to studentsenrolled in distance education courses. Toexamine this issue, this chapter providesinformation about how tuition and fees fordistance education courses compare to those fortraditional campus-based courses. Analyses arepresented by institutional type.
Tuition
Institutions were asked how the tuition chargedfor college-level, credit-granting distanceeducation courses compared with tuition chargedfor equivalent on-campus courses. Table 20shows how tuition costs for distance educationand on-campus courses compared amonginstitutions that offered any distance educationcourses in 1997–98. About three-quarters(77 percent) of the institutions charged the sametuition for distance education courses as forcomparable on-campus courses. Relatively fewinstitutions indicated that their tuition chargeswere always lower (3 percent) or always higher (6percent) for distance education courses than foron-campus courses, and 14 percent indicated that
Table 20.—Percentage distribution of 2-year and 4-year postsecondary education institutionsoffering distance education courses in 1997–98 according to how tuition charges forcollege-level, credit-granting courses offered through distance education compare totuition charges for equivalent on-campus courses at their institution, by institutionalcharacteristics
Institutional characteristic
Tuition charges arealways higher fordistance education
courses than for on-campus courses
Tuition charges arealways lower for
distance educationcourses than for on-
campus courses
Tuition charges arealways the same for bothdistance education and
on-campus courses
Tuition charges fordistance education
courses are sometimesthe same as, and
sometimes different than,tuition charges for on-
campus courses
All institutions .............................. 6 3 77 14
Institutional type*Public 2-year................................. 4 0 90 6Public 4-year................................. 6 3 64 28Private 4-year................................ 6 10 71 13
Size of institutionLess than 3,000............................. 5 5 79 113,000 to 9,999 ............................... 7 1 79 1310,000 or more.............................. 5 3 70 23
*Data for private 2-year institutions are not reported as a separate type of institution because too few of them in the sample offered distanceeducation courses in 1997–98 to make reliable estimates. Data for private 2-year institutions are included in the totals and in analyses by otherinstitutional characteristics.
NOTE: Percentages are based on the estimated 1,680 institutions that offered distance education courses in 1997–98. Zeros appear in the tablewhen no institution in the sample gave the indicated response. Percentages are computed across each row, but may not sum to 100 because ofrounding.
SOURCE: U.S. Department of Education, National Center for Education Statistics, Postsecondary Education Quick Information System, Surveyon Distance Education at Postsecondary Education Institutions, 1998–1999.
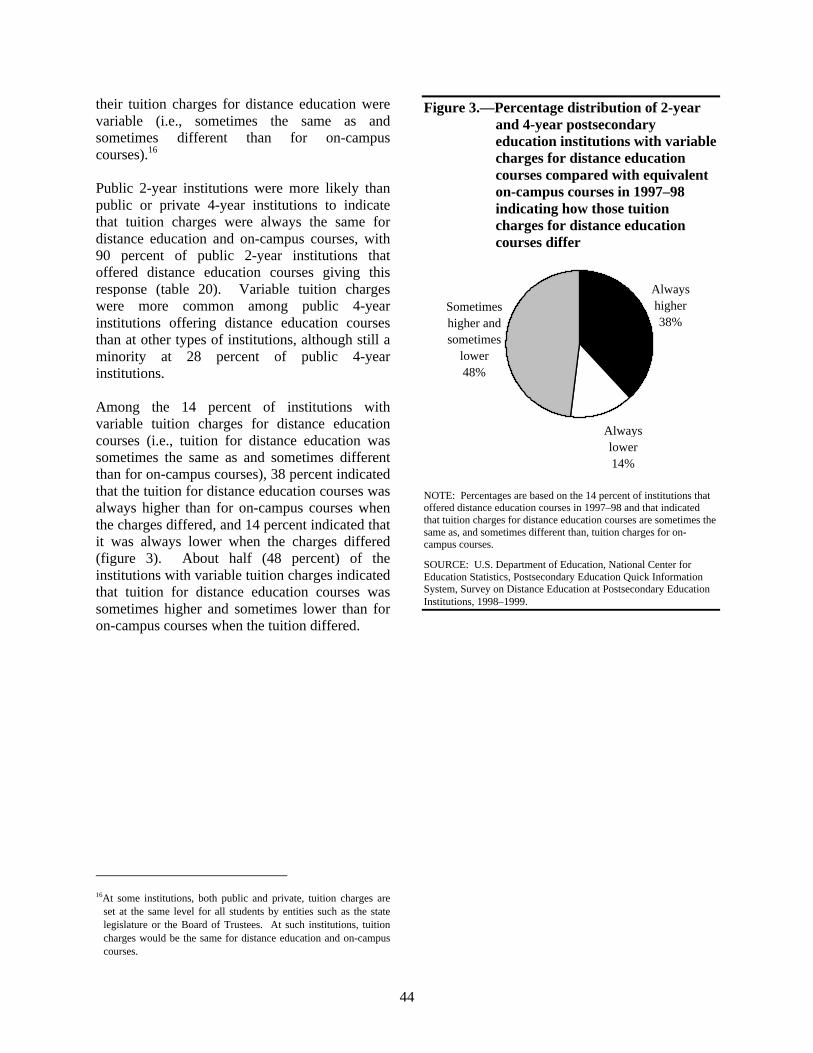
44
their tuition charges for distance education werevariable (i.e., sometimes the same as andsometimes different than for on-campuscourses).16
Public 2-year institutions were more likely thanpublic or private 4-year institutions to indicatethat tuition charges were always the same fordistance education and on-campus courses, with90 percent of public 2-year institutions thatoffered distance education courses giving thisresponse (table 20). Variable tuition chargeswere more common among public 4-yearinstitutions offering distance education coursesthan at other types of institutions, although still aminority at 28 percent of public 4-yearinstitutions.
Among the 14 percent of institutions withvariable tuition charges for distance educationcourses (i.e., tuition for distance education wassometimes the same as and sometimes differentthan for on-campus courses), 38 percent indicatedthat the tuition for distance education courses wasalways higher than for on-campus courses whenthe charges differed, and 14 percent indicated thatit was always lower when the charges differed(figure 3). About half (48 percent) of theinstitutions with variable tuition charges indicatedthat tuition for distance education courses wassometimes higher and sometimes lower than foron-campus courses when the tuition differed.
16At some institutions, both public and private, tuition charges are
set at the same level for all students by entities such as the statelegislature or the Board of Trustees. At such institutions, tuitioncharges would be the same for distance education and on-campuscourses.
Figure 3.—Percentage distribution of 2-yearand 4-year postsecondaryeducation institutions with variablecharges for distance educationcourses compared with equivalenton-campus courses in 1997–98indicating how those tuitioncharges for distance educationcourses differ
Always higher 38%
Always lower14%
Sometimes higher and sometimes
lower48%
NOTE: Percentages are based on the 14 percent of institutions thatoffered distance education courses in 1997–98 and that indicatedthat tuition charges for distance education courses are sometimes thesame as, and sometimes different than, tuition charges for on-campus courses.
SOURCE: U.S. Department of Education, National Center forEducation Statistics, Postsecondary Education Quick InformationSystem, Survey on Distance Education at Postsecondary EducationInstitutions, 1998–1999.
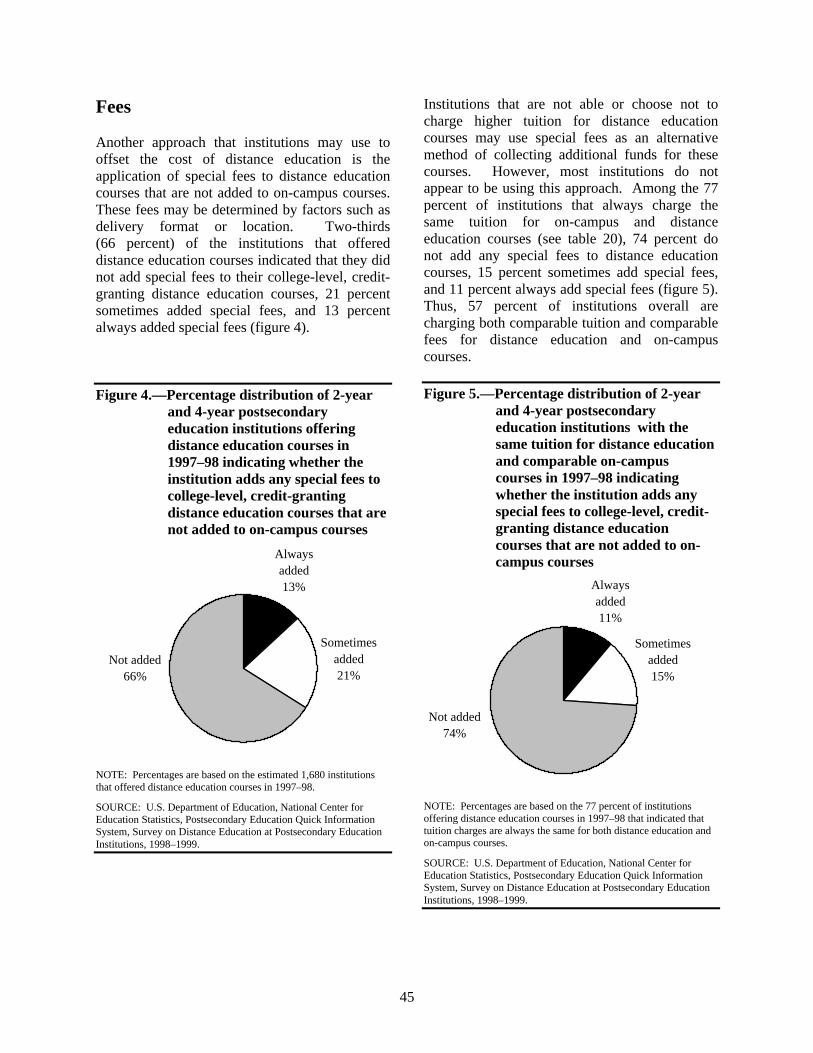
45
Fees
Another approach that institutions may use tooffset the cost of distance education is theapplication of special fees to distance educationcourses that are not added to on-campus courses.These fees may be determined by factors such asdelivery format or location. Two-thirds(66 percent) of the institutions that offereddistance education courses indicated that they didnot add special fees to their college-level, credit-granting distance education courses, 21 percentsometimes added special fees, and 13 percentalways added special fees (figure 4).
Figure 4.—Percentage distribution of 2-yearand 4-year postsecondaryeducation institutions offeringdistance education courses in1997–98 indicating whether theinstitution adds any special fees tocollege-level, credit-grantingdistance education courses that arenot added to on-campus courses
Always added13%
Sometimes added21%
Not added66%
NOTE: Percentages are based on the estimated 1,680 institutionsthat offered distance education courses in 1997–98.
SOURCE: U.S. Department of Education, National Center forEducation Statistics, Postsecondary Education Quick InformationSystem, Survey on Distance Education at Postsecondary EducationInstitutions, 1998–1999.
Institutions that are not able or choose not tocharge higher tuition for distance educationcourses may use special fees as an alternativemethod of collecting additional funds for thesecourses. However, most institutions do notappear to be using this approach. Among the 77percent of institutions that always charge thesame tuition for on-campus and distanceeducation courses (see table 20), 74 percent donot add any special fees to distance educationcourses, 15 percent sometimes add special fees,and 11 percent always add special fees (figure 5).Thus, 57 percent of institutions overall arecharging both comparable tuition and comparablefees for distance education and on-campuscourses.
Figure 5.—Percentage distribution of 2-yearand 4-year postsecondaryeducation institutions with thesame tuition for distance educationand comparable on-campuscourses in 1997–98 indicatingwhether the institution adds anyspecial fees to college-level, credit-granting distance educationcourses that are not added to on-campus courses
Always added11%
Sometimes added15%
Not added74%
NOTE: Percentages are based on the 77 percent of institutionsoffering distance education courses in 1997–98 that indicated thattuition charges are always the same for both distance education andon-campus courses.
SOURCE: U.S. Department of Education, National Center forEducation Statistics, Postsecondary Education Quick InformationSystem, Survey on Distance Education at Postsecondary EducationInstitutions, 1998–1999.
46
Summary
Results indicate that most postsecondaryeducation institutions do not pass on the costs orcost savings of distance education programs bycharging different tuition or fees to studentsenrolled in distance education courses. Aboutthree-quarters of institutions with distanceeducation always charge the same tuition fordistance education and comparable on-campuscourses. Public 2-year institutions were the most
likely to indicate that tuition charges were alwaysthe same, with 90 percent of public 2-yearinstitutions always charging comparable tuitionfor on-campus and distance education courses.Moreover, two-thirds of institutions do not addspecial fees to distance education courses that arenot added to on-campus courses. Further,57 percent of institutions charge both comparabletuition and comparable fees for distanceeducation and on-campus courses.
47
7. CHANGES IN DISTANCEEDUCATION SINCE 1994–95
Chapters 2 through 6 of this report presentfindings on various aspects of distance educationfor all 2-year and 4-year postsecondary educationinstitutions for 1997–98. This chapter providescomparisons of distance education courseofferings, enrollments, degrees and certificates,and technologies at the subset of 2-year and 4-year higher education institutions for 1994–95and 1997–98. These comparisons are based onthe two PEQIS distance education studiesconducted by NCES.17 The chapter begins withan overview of the similarities and differencesbetween the two PEQIS studies. Information isthen provided about the extent of change in thepercentage of institutions offering distanceeducation courses, the number of distanceeducation courses offered, the number ofenrollments in distance education courses, theavailability of distance education degree andcertificate programs, and the technologies used todeliver distance education courses.
Comparing the PEQIS Studies:An Overview
The 1997–98 study was sent to all postsecondaryeducation institutions in the PEQIS panel, bothhigher education and other postsecondaryeducation institutions. In order to makecomparisons between the 1997–98 study and the1995 study, which was sent only to highereducation institutions, the data from the 1997–98study were analyzed for the subset of highereducation institutions. It is the data from thissubset of institutions that are presented in this 17The first PEQIS study, conducted in fall 1995, sometimes asked
for information about the current time frame (i.e., fall 1995), andsometimes asked for information about academic year 1994–95.Thus, both dates appear in the results section of this chapter. Thesecond PEQIS study, conducted in winter 1998–99, is referred toas the 1997–98 study, since the data were collected for that timeperiod.
chapter. Additional information about differencesin the samples between the two studies ispresented in appendix A.
In addition, there were slight variations inwording between some of the items on the twosurveys. This included the wording for thenumber of distance education courses offered,enrollment in distance education courses, degreeand certificate programs, and the distanceeducation technologies used. These variations inquestion wording are discussed in appendix A.Also, the data from the 1995 study were notimputed for item nonresponse. However, itemnonresponse was very low and did notsubstantially affect the results. In the followingsections, item nonresponse is noted where itoccurred.
Institutions OfferingDistance Education Courses
In fall 1995, 33 percent of 2-year and 4-yearhigher education institutions offered distanceeducation courses (table 21). In 1997–98, thishad grown to 44 percent of 2-year and 4-yearhigher education institutions. Growth occurredfor all institutional types except private 2-year,and for all sizes of institutions. The percentage ofpublic 2-year institutions offering distanceeducation courses grew from 58 percent to72 percent, and the percentage of public 4-yearinstitutions offering distance education coursesincreased from 62 percent to 79 percent. Whiledistance education continued to be offered morefrequently by public institutions, the percentageof private 4-year institutions offering distanceeducation was approximately double in 1997–98(22 percent) what it was in 1995 (12 percent).
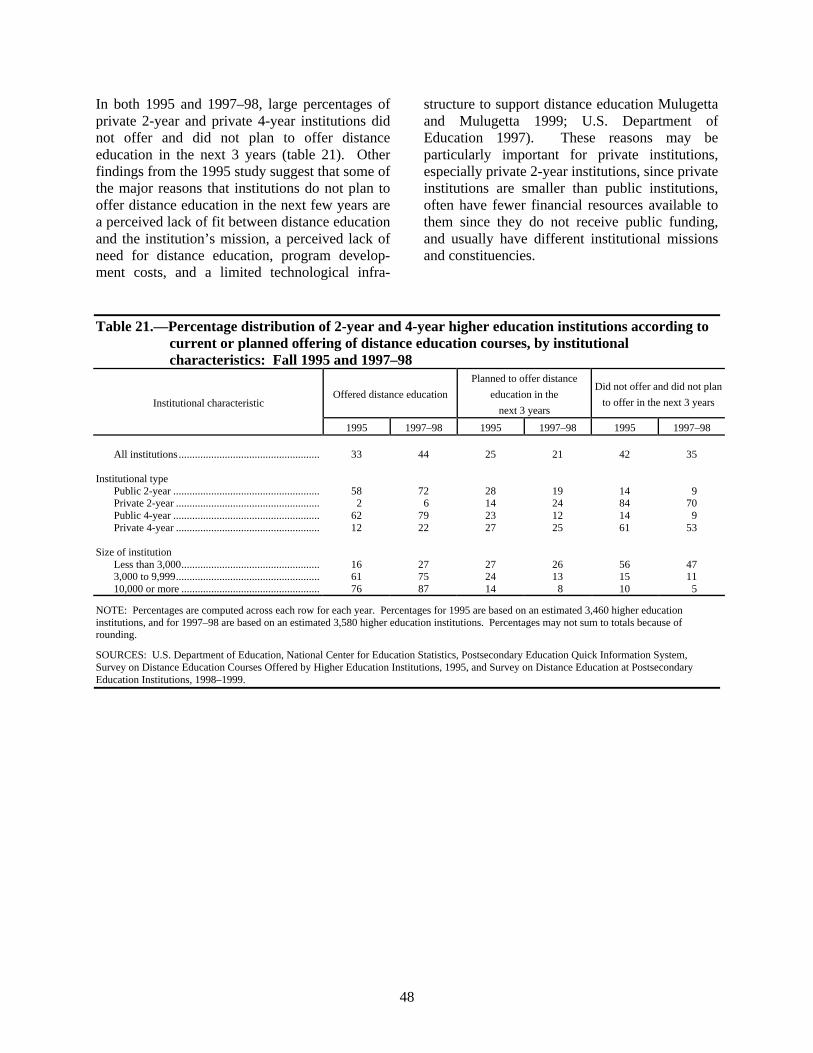
48
In both 1995 and 1997–98, large percentages ofprivate 2-year and private 4-year institutions didnot offer and did not plan to offer distanceeducation in the next 3 years (table 21). Otherfindings from the 1995 study suggest that some ofthe major reasons that institutions do not plan tooffer distance education in the next few years area perceived lack of fit between distance educationand the institution’s mission, a perceived lack ofneed for distance education, program develop-ment costs, and a limited technological infra-
structure to support distance education Mulugettaand Mulugetta 1999; U.S. Department ofEducation 1997). These reasons may beparticularly important for private institutions,especially private 2-year institutions, since privateinstitutions are smaller than public institutions,often have fewer financial resources available tothem since they do not receive public funding,and usually have different institutional missionsand constituencies.
Table 21.—Percentage distribution of 2-year and 4-year higher education institutions according tocurrent or planned offering of distance education courses, by institutionalcharacteristics: Fall 1995 and 1997–98
Offered distance education
Planned to offer distance
education in the
next 3 years
Did not offer and did not plan
to offer in the next 3 yearsInstitutional characteristic
1995 1997–98 1995 1997–98 1995 1997–98
All institutions .................................................... 33 44 25 21 42 35
Institutional typePublic 2-year ...................................................... 58 72 28 19 14 9Private 2-year ..................................................... 2 6 14 24 84 70Public 4-year ...................................................... 62 79 23 12 14 9Private 4-year ..................................................... 12 22 27 25 61 53
Size of institutionLess than 3,000................................................... 16 27 27 26 56 473,000 to 9,999..................................................... 61 75 24 13 15 1110,000 or more ................................................... 76 87 14 8 10 5
NOTE: Percentages are computed across each row for each year. Percentages for 1995 are based on an estimated 3,460 higher educationinstitutions, and for 1997–98 are based on an estimated 3,580 higher education institutions. Percentages may not sum to totals because ofrounding.
SOURCES: U.S. Department of Education, National Center for Education Statistics, Postsecondary Education Quick Information System,Survey on Distance Education Courses Offered by Higher Education Institutions, 1995, and Survey on Distance Education at PostsecondaryEducation Institutions, 1998–1999.
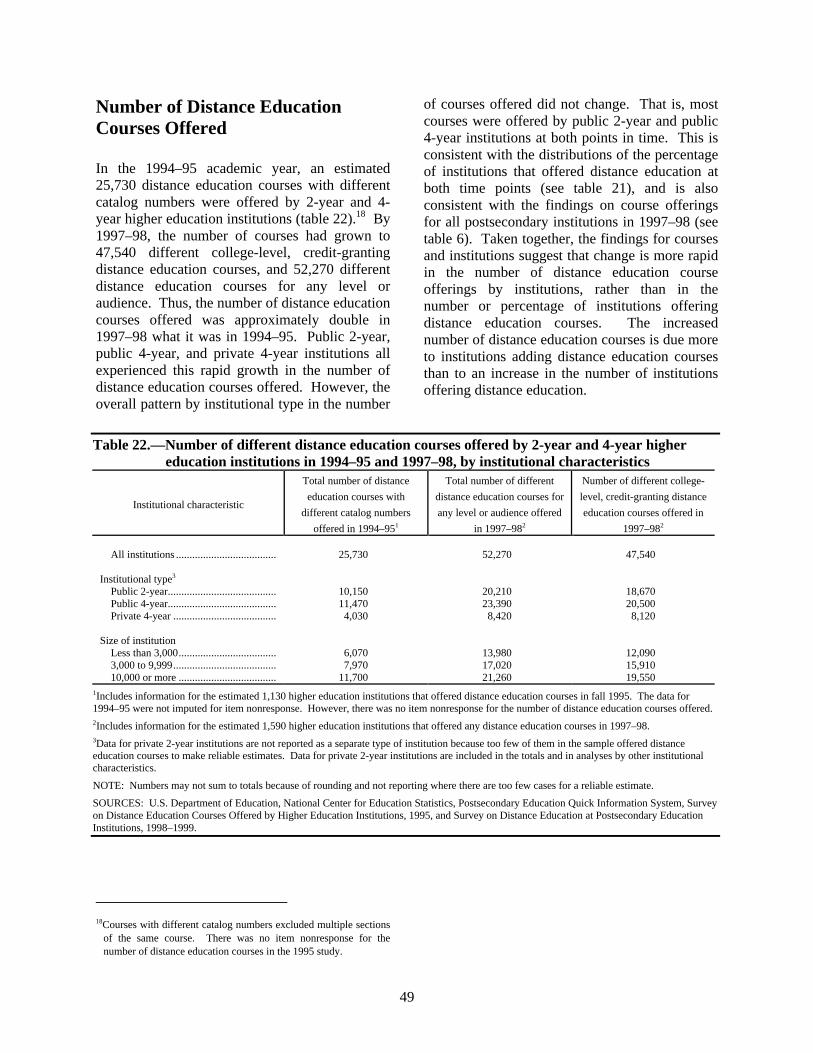
49
Number of Distance EducationCourses Offered
In the 1994–95 academic year, an estimated25,730 distance education courses with differentcatalog numbers were offered by 2-year and 4-year higher education institutions (table 22).18 By1997–98, the number of courses had grown to47,540 different college-level, credit-grantingdistance education courses, and 52,270 differentdistance education courses for any level oraudience. Thus, the number of distance educationcourses offered was approximately double in1997–98 what it was in 1994–95. Public 2-year,public 4-year, and private 4-year institutions allexperienced this rapid growth in the number ofdistance education courses offered. However, theoverall pattern by institutional type in the number
18Courses with different catalog numbers excluded multiple sections
of the same course. There was no item nonresponse for thenumber of distance education courses in the 1995 study.
of courses offered did not change. That is, mostcourses were offered by public 2-year and public4-year institutions at both points in time. This isconsistent with the distributions of the percentageof institutions that offered distance education atboth time points (see table 21), and is alsoconsistent with the findings on course offeringsfor all postsecondary institutions in 1997–98 (seetable 6). Taken together, the findings for coursesand institutions suggest that change is more rapidin the number of distance education courseofferings by institutions, rather than in thenumber or percentage of institutions offeringdistance education courses. The increasednumber of distance education courses is due moreto institutions adding distance education coursesthan to an increase in the number of institutionsoffering distance education.
Table 22.—Number of different distance education courses offered by 2-year and 4-year highereducation institutions in 1994–95 and 1997–98, by institutional characteristics
Institutional characteristic
Total number of distance
education courses with
different catalog numbers
offered in 1994–951
Total number of different
distance education courses for
any level or audience offered
in 1997–982
Number of different college-
level, credit-granting distance
education courses offered in
1997–982
All institutions ..................................... 25,730 52,270 47,540
Institutional type3
Public 2-year........................................ 10,150 20,210 18,670Public 4-year........................................ 11,470 23,390 20,500Private 4-year ...................................... 4,030 8,420 8,120
Size of institutionLess than 3,000.................................... 6,070 13,980 12,0903,000 to 9,999...................................... 7,970 17,020 15,91010,000 or more .................................... 11,700 21,260 19,550
1Includes information for the estimated 1,130 higher education institutions that offered distance education courses in fall 1995. The data for1994–95 were not imputed for item nonresponse. However, there was no item nonresponse for the number of distance education courses offered.2Includes information for the estimated 1,590 higher education institutions that offered any distance education courses in 1997–98.3Data for private 2-year institutions are not reported as a separate type of institution because too few of them in the sample offered distanceeducation courses to make reliable estimates. Data for private 2-year institutions are included in the totals and in analyses by other institutionalcharacteristics.
NOTE: Numbers may not sum to totals because of rounding and not reporting where there are too few cases for a reliable estimate.
SOURCES: U.S. Department of Education, National Center for Education Statistics, Postsecondary Education Quick Information System, Surveyon Distance Education Courses Offered by Higher Education Institutions, 1995, and Survey on Distance Education at Postsecondary EducationInstitutions, 1998–1999.

50
Enrollment in DistanceEducation Courses
There were an estimated 753,640 formalenrollments in distance education courses at 2-year and 4-year higher education institutions inthe 1994–95 academic year (table 23).19 By1997–98, the number of enrollments had grown to1,343,580 enrollments in college-level, credit-granting distance education courses, and1,632,350 enrollments in all distance educationcourses.20 Thus, as with courses, distanceeducation enrollments overall were approximatelydouble in 1997–98 what they were in 1994–95.Public 2-year, public 4-year, and private 4-yearinstitutions all experienced rapid growth inenrollments. For public 4-year institutions, thenumber of enrollments in all distance education
19The data for the 1995 study were not imputed for item
nonresponse. However, only 0.6 percent of the institutionsoffering distance education courses did not report the number ofenrollments in those courses.
20In both studies, if a student was enrolled in multiple courses,institutions were instructed to count the student for each course inwhich he or she was enrolled. Thus, enrollments may includeduplicated counts of students.
courses was approximately triple in 1997–98(711,350) what it was in 1994–95 (234,020).Enrollment growth was somewhat less at thesepublic 4-year institutions for college-level, credit-granting distance education courses, with 452,600enrollments in 1997–98. As with the number ofcourses offered, most of the enrollments in alltypes of distance education courses in both yearswere in public 2-year and public 4-yearinstitutions.
The patterns of increases in enrollment andcourse offerings and the percentage of institutionsoffering distance education, when consideredtogether, reinforce the suggestion that while moreinstitutions began to offer distance education, themost dramatic changes were in the number ofdistance education courses and enrollments.
Table 23.—Number of enrollments in 1994–95 and 1997–98 in distance education courses offeredby 2-year and 4-year higher education institutions, by institutional characteristics
Institutional characteristic
Total number of formalenrollments in distance
education courses in1994–951
Total number of enrollmentsin all distance education
courses in 1997–982
Total number of enrollmentsin college-level, credit-
granting distance educationcourses in 1997–982
All institutions ..................................... 753,640 1,632,350 1,343,580
Institutional type3
Public 2-year ....................................... 414,160 712,170 688,710Public 4-year ....................................... 234,020 711,350 452,600Private 4-year ...................................... 104,960 206,210 199,650
Size of institutionLess than 3,000.................................... 116,320 353,870 250,8703,000 to 9,999...................................... 232,750 476,900 461,31010,000 or more .................................... 404,570 801,570 631,400
1Includes information for the estimated 1,130 higher education institutions that offered distance education courses in fall 1995. The data for1994–95 were not imputed for item nonresponse. However, only 0.6 percent of the institutions offering distance education courses did not reportthe number of enrollments in those courses.2Includes information for the estimated 1,590 higher education institutions that offered any distance education courses in 1997–98.3Data for private 2-year institutions are not reported as a separate type of institution because too few of them in the sample offered distanceeducation courses to make reliable estimates. Data for private 2-year institutions are included in the totals and in analyses by other institutionalcharacteristics.
NOTE: Numbers may not sum to totals because of rounding and not reporting where there are too few cases for a reliable estimate. Enrollmentsmay include duplicated counts of students, since institutions were instructed to count a student enrolled in multiple courses for each course inwhich he or she was enrolled.
SOURCES: U.S. Department of Education, National Center for Education Statistics, Postsecondary Education Quick Information System,Survey on Distance Education Courses Offered by Higher Education Institutions, 1995, and Survey on Distance Education at PostsecondaryEducation Institutions, 1998–1999.
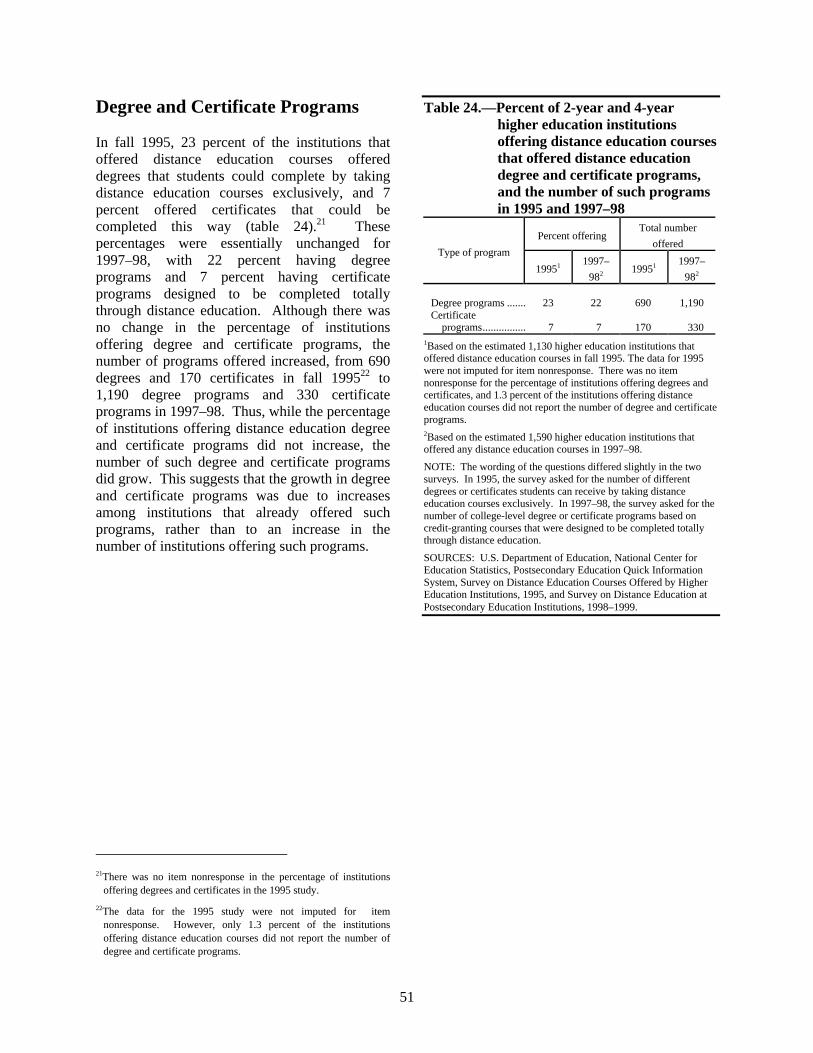
51
Degree and Certificate Programs
In fall 1995, 23 percent of the institutions thatoffered distance education courses offereddegrees that students could complete by takingdistance education courses exclusively, and 7percent offered certificates that could becompleted this way (table 24).21 Thesepercentages were essentially unchanged for1997–98, with 22 percent having degreeprograms and 7 percent having certificateprograms designed to be completed totallythrough distance education. Although there wasno change in the percentage of institutionsoffering degree and certificate programs, thenumber of programs offered increased, from 690degrees and 170 certificates in fall 199522 to1,190 degree programs and 330 certificateprograms in 1997–98. Thus, while the percentageof institutions offering distance education degreeand certificate programs did not increase, thenumber of such degree and certificate programsdid grow. This suggests that the growth in degreeand certificate programs was due to increasesamong institutions that already offered suchprograms, rather than to an increase in thenumber of institutions offering such programs.
21There was no item nonresponse in the percentage of institutions
offering degrees and certificates in the 1995 study.
22The data for the 1995 study were not imputed for itemnonresponse. However, only 1.3 percent of the institutionsoffering distance education courses did not report the number ofdegree and certificate programs.
Table 24.—Percent of 2-year and 4-yearhigher education institutionsoffering distance education coursesthat offered distance educationdegree and certificate programs,and the number of such programsin 1995 and 1997–98
Percent offeringTotal number
offeredType of program
19951 1997–
982 19951 1997–
982
Degree programs ....... 23 22 690 1,190Certificate
programs................ 7 7 170 3301Based on the estimated 1,130 higher education institutions thatoffered distance education courses in fall 1995. The data for 1995were not imputed for item nonresponse. There was no itemnonresponse for the percentage of institutions offering degrees andcertificates, and 1.3 percent of the institutions offering distanceeducation courses did not report the number of degree and certificateprograms.2Based on the estimated 1,590 higher education institutions thatoffered any distance education courses in 1997–98.
NOTE: The wording of the questions differed slightly in the twosurveys. In 1995, the survey asked for the number of differentdegrees or certificates students can receive by taking distanceeducation courses exclusively. In 1997–98, the survey asked for thenumber of college-level degree or certificate programs based oncredit-granting courses that were designed to be completed totallythrough distance education.
SOURCES: U.S. Department of Education, National Center forEducation Statistics, Postsecondary Education Quick InformationSystem, Survey on Distance Education Courses Offered by HigherEducation Institutions, 1995, and Survey on Distance Education atPostsecondary Education Institutions, 1998–1999.
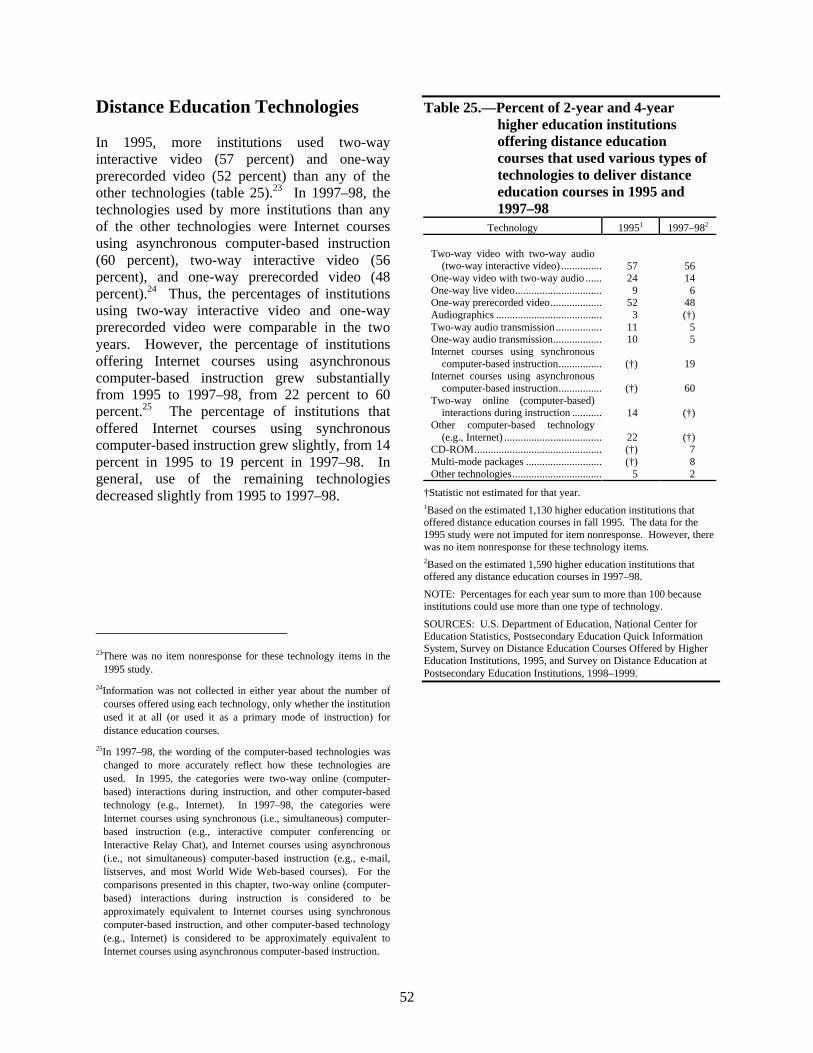
52
Distance Education Technologies
In 1995, more institutions used two-wayinteractive video (57 percent) and one-wayprerecorded video (52 percent) than any of theother technologies (table 25).23 In 1997–98, thetechnologies used by more institutions than anyof the other technologies were Internet coursesusing asynchronous computer-based instruction(60 percent), two-way interactive video (56percent), and one-way prerecorded video (48percent).24 Thus, the percentages of institutionsusing two-way interactive video and one-wayprerecorded video were comparable in the twoyears. However, the percentage of institutionsoffering Internet courses using asynchronouscomputer-based instruction grew substantiallyfrom 1995 to 1997–98, from 22 percent to 60percent.25 The percentage of institutions thatoffered Internet courses using synchronouscomputer-based instruction grew slightly, from 14percent in 1995 to 19 percent in 1997–98. Ingeneral, use of the remaining technologiesdecreased slightly from 1995 to 1997–98.
23There was no item nonresponse for these technology items in the
1995 study.
24Information was not collected in either year about the number ofcourses offered using each technology, only whether the institutionused it at all (or used it as a primary mode of instruction) fordistance education courses.
25In 1997–98, the wording of the computer-based technologies waschanged to more accurately reflect how these technologies areused. In 1995, the categories were two-way online (computer-based) interactions during instruction, and other computer-basedtechnology (e.g., Internet). In 1997–98, the categories wereInternet courses using synchronous (i.e., simultaneous) computer-based instruction (e.g., interactive computer conferencing orInteractive Relay Chat), and Internet courses using asynchronous(i.e., not simultaneous) computer-based instruction (e.g., e-mail,listserves, and most World Wide Web-based courses). For thecomparisons presented in this chapter, two-way online (computer-based) interactions during instruction is considered to beapproximately equivalent to Internet courses using synchronouscomputer-based instruction, and other computer-based technology(e.g., Internet) is considered to be approximately equivalent toInternet courses using asynchronous computer-based instruction.
Table 25.—Percent of 2-year and 4-yearhigher education institutionsoffering distance educationcourses that used various types oftechnologies to deliver distanceeducation courses in 1995 and1997–98
Technology 19951 1997–982
Two-way video with two-way audio(two-way interactive video) ............... 57 56
One-way video with two-way audio ...... 24 14One-way live video................................ 9 6One-way prerecorded video................... 52 48Audiographics ....................................... 3 (†)Two-way audio transmission................. 11 5One-way audio transmission.................. 10 5Internet courses using synchronous
computer-based instruction................ (†) 19Internet courses using asynchronous
computer-based instruction................ (†) 60Two-way online (computer-based)
interactions during instruction ........... 14 (†)Other computer-based technology
(e.g., Internet) .................................... 22 (†)CD-ROM............................................... (†) 7Multi-mode packages ............................ (†) 8Other technologies................................. 5 2
†Statistic not estimated for that year.1Based on the estimated 1,130 higher education institutions thatoffered distance education courses in fall 1995. The data for the1995 study were not imputed for item nonresponse. However, therewas no item nonresponse for these technology items.2Based on the estimated 1,590 higher education institutions thatoffered any distance education courses in 1997–98.
NOTE: Percentages for each year sum to more than 100 becauseinstitutions could use more than one type of technology.
SOURCES: U.S. Department of Education, National Center forEducation Statistics, Postsecondary Education Quick InformationSystem, Survey on Distance Education Courses Offered by HigherEducation Institutions, 1995, and Survey on Distance Education atPostsecondary Education Institutions, 1998–1999.
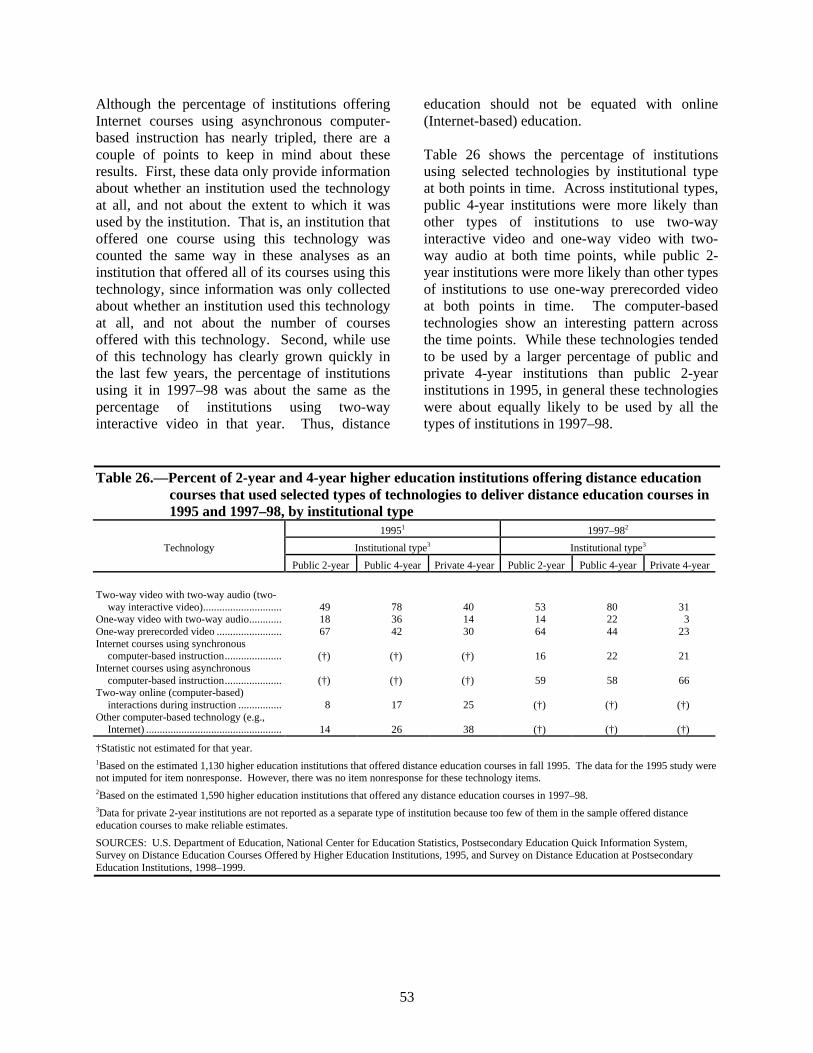
53
Although the percentage of institutions offeringInternet courses using asynchronous computer-based instruction has nearly tripled, there are acouple of points to keep in mind about theseresults. First, these data only provide informationabout whether an institution used the technologyat all, and not about the extent to which it wasused by the institution. That is, an institution thatoffered one course using this technology wascounted the same way in these analyses as aninstitution that offered all of its courses using thistechnology, since information was only collectedabout whether an institution used this technologyat all, and not about the number of coursesoffered with this technology. Second, while useof this technology has clearly grown quickly inthe last few years, the percentage of institutionsusing it in 1997–98 was about the same as thepercentage of institutions using two-wayinteractive video in that year. Thus, distance
education should not be equated with online(Internet-based) education.
Table 26 shows the percentage of institutionsusing selected technologies by institutional typeat both points in time. Across institutional types,public 4-year institutions were more likely thanother types of institutions to use two-wayinteractive video and one-way video with two-way audio at both time points, while public 2-year institutions were more likely than other typesof institutions to use one-way prerecorded videoat both points in time. The computer-basedtechnologies show an interesting pattern acrossthe time points. While these technologies tendedto be used by a larger percentage of public andprivate 4-year institutions than public 2-yearinstitutions in 1995, in general these technologieswere about equally likely to be used by all thetypes of institutions in 1997–98.
Table 26.—Percent of 2-year and 4-year higher education institutions offering distance educationcourses that used selected types of technologies to deliver distance education courses in1995 and 1997–98, by institutional type
19951 1997–982
Institutional type3 Institutional type3Technology
Public 2-year Public 4-year Private 4-year Public 2-year Public 4-year Private 4-year
Two-way video with two-way audio (two-way interactive video)............................. 49 78 40 53 80 31
One-way video with two-way audio............ 18 36 14 14 22 3One-way prerecorded video ........................ 67 42 30 64 44 23Internet courses using synchronous
computer-based instruction..................... (†) (†) (†) 16 22 21Internet courses using asynchronous
computer-based instruction..................... (†) (†) (†) 59 58 66Two-way online (computer-based)
interactions during instruction ................ 8 17 25 (†) (†) (†)Other computer-based technology (e.g.,
Internet) .................................................. 14 26 38 (†) (†) (†)
†Statistic not estimated for that year.1Based on the estimated 1,130 higher education institutions that offered distance education courses in fall 1995. The data for the 1995 study werenot imputed for item nonresponse. However, there was no item nonresponse for these technology items.2Based on the estimated 1,590 higher education institutions that offered any distance education courses in 1997–98.3Data for private 2-year institutions are not reported as a separate type of institution because too few of them in the sample offered distanceeducation courses to make reliable estimates.
SOURCES: U.S. Department of Education, National Center for Education Statistics, Postsecondary Education Quick Information System,Survey on Distance Education Courses Offered by Higher Education Institutions, 1995, and Survey on Distance Education at PostsecondaryEducation Institutions, 1998–1999.
54
The information in table 26 about technologyusage can also be examined within eachinstitutional type for the two points in time.Public 2-year institutions were more likely to useone-way prerecorded video than any othertechnology in 1995; in 1997–98, however, public2-year institutions were about equally likely touse one-way prerecorded video, asynchronousInternet instruction, and two-way interactivevideo. Public 4-year institutions were more likelyto use two-way interactive video than any othertechnology in both 1995 and 1997–98. Notechnology stood out as particularly prevalent forprivate 4-year institutions in 1995; in 1997–98,however, private 4-year institutions were morelikely to use asynchronous Internet instructionthan any other technology.
Summary
Data presented in this chapter indicate that anumber of changes occurred in the time periodbetween the two studies. For example, betweenfall 1995 and 1997–98, the percentage of highereducation institutions offering distance educationcourses increased by about one-third, from 33percent to 44 percent. Growth in the percentageof institutions offering distance educationoccurred for all institutional types except private2-year institutions, and for all sizes of institutions.In 1997–98, about three-quarters of the public
2-year and 4-year institutions were offeringdistance education courses. The number ofdistance education enrollments and courseofferings approximately doubled between 1994–95 and 1997–98. For public 4-year institutions,increases in enrollments in all distance educationcourses approximately tripled in that time period.
Although the percentages of institutions offeringdistance education degree and certificateprograms were unchanged, the number of degreeand certificate programs that were offered nearlydoubled. This pattern suggests that while there ischange in the percentage of institutions offeringdistance education, the most dramatic changesappear to be within the institutions that have beenoffering distance education for the past 3 years—these institutions have greatly increased thenumber of distance education courses, enroll-ments, and degree and certificate programs thatthey offer.
With regard to changes in distance educationtechnologies employed among all highereducation institutions offering any distanceeducation, the percentages of institutions usingtwo-way interactive video and one-wayprerecorded video were essentially the same in1997–98 as in 1995. The use of asynchronousInternet-based technologies, however, grew from22 percent of institutions in 1995 to 60 percent ofinstitutions in 1997–98.
55
8. CONCLUSIONS
This report presents findings for the 12-month1997–98 academic year about the status ofdistance education in all postsecondary educationinstitutions. It also includes an analysis of trendsin distance education since 1994–95 for thesubset of higher education institutions. In themost general terms, it finds that distanceeducation appears to have become a commonfeature of many postsecondary educationinstitutions and that, by their own accounts, it willbecome more common in the future.
More specifically, this study found that aboutone-third of 2-year and 4-year postsecondaryeducation institutions offered any courses throughdistance education during 1997–98, and that 25percent of those that offered any courses throughdistance education also offered degree orcertificate programs that could be completedentirely through distance education. Publicinstitutions were also found to be more likely tooffer distance education courses than privateinstitutions. While institutions employed a widevariety of technologies to deliver distanceeducation, more institutions were likely toemploy several types of video and the Internet-based technologies than any other modes ofdelivery included in the survey.
There were an estimated 1,661,100 enrollments indistance education courses during 1997–98. Thevast majority of these enrollments were incollege-level, credit-granting courses, mostly atthe undergraduate level. Institutions offered anestimated 54,470 different distance educationcourses in 1997–98. The largest number ofcourses were in English, humanities, and thesocial and behavioral sciences, and in businessand management. The majority of postsecondaryinstitutions charged students the same tuition andfees for distance education courses as they did fortraditional on-campus courses.
Trend analyses reveal that the percentage ofhigher education institutions (a subset of all
postsecondary institutions) offering coursesthrough distance education grew by one-thirdfrom 1995 to 1997–98. The percentage ofinstitutions offering such degree and certificateprograms remained constant between 1995 and1997–98. Between 1994–95 and 1997–98, thenumber of distance education enrollments andcourse offerings and the number of distanceeducation degree and certificate programsapproximately doubled. This suggests that thegreatest growth in offerings through distanceeducation at higher education institutionsoccurred not so much in terms of the percentageof institutions offering distance education, butrather in terms of the number of distanceeducation course offerings and enrollments ofthose institutions that have been offering distanceeducation since 1995.
While these findings will help to informstakeholders—including individuals considering apostsecondary education, faculty and admini-strators at postsecondary institutions, providers oftechnologies used for distance education, andpolicymakers at federal, state, and local levels—they do not address many of the pertinentquestions about distance education. As describedin the introductory chapter, these questionsinclude issues related to:
• equity of access to postsecondary education;
• the costs of developing and implementingdistance education programs;
• accreditation of and quality assurance indistance education programs;
• copyright and intellectual property rights;
• changes in the role of postsecondary facultyand challenges facing them as a result; and
• pressures on existing organizational struc-tures and arrangements.
56
Given rapidly evolving societal and institutionaltrends brought about by changes in technology(e.g., Carnevale 1991; Kelly 1998; Sherron andBoettcher 1997), research on distance educationwill continue to face fundamental challenges.These challenges include evolving conceptionsand definitions of distance education26 and therise of nontraditional arrangements of post-secondary education institutions and programs,including the rise of virtual universities. Otherbasic challenges facing those conducting researchon distance education include the need to respondto the information needs of stakeholders in atimely manner. In this ever-changing environ-
26 For example, a definition has recently been developed through the
1998 passage of P.L. 105-244, Amendments to the HigherEducation Act of 1965. This set forth a new legislative definitionof distance education (Title IV, Part G, Section 488): “the term‘distance education’ means an educational process that ischaracterized by the separation, in time or place, betweeninstructor and student. Such term may include courses offeredprincipally through the use of (1) television, audio, or computertransmission, such as open broadcast, closed circuit, cable,microwave, or satellite transmission; (2) audio or computerconferencing; (3) video cassettes or discs; or (4) correspondence.”
ment, anecdotal data often must suffice until morecomprehensive studies can be conducted—studiesthat remain relevant for only brief periods.
It is a dynamic time for postsecondary educa-tion institutions facing the opportunities andchallenges brought by technological innovation.As Gladieux and Swail (1999) assert, given thefact that computer and related technologies areevolving so quickly—and new providers andbrokers of higher education proliferating sorapidly—no one knows how traditional highereducation will change.
57
References
Carnevale, A. P. 1991. America and the New Economy: How New Competitive Standards are RadicallyChanging American Workplaces. San Francisco, CA: Jossey-Bass.
Chronicle of Higher Education. June 20, 1997. Elite Private Universities Get Serious About DistanceLearning.
Chronicle of Higher Education. April 9, 1999. The Marketing Intensifies in Distance Learning.
Chronicle of Higher Education. October 29,1999. Colleges Strive to Give Disabled Students Access toOn-line Courses.
Chronicle of Higher Education. November 4, 1999. Virtual Universities Can Meet High Standards.
Clark, R. E. 1994. Media Will Never Influence Learning. Educational Technology Research andDevelopment 42(2):21-29.
Ehrmann, S. n.d.. Grand Challenges Raised by Technology: Will This Revolution be a Good One?Washington, DC: TLT Group.(http://www.tltgroup.org/resources/grand_challenges_ raised_by_techn.htm).
Gallick, S. 1998. Technology in Higher Education: Opportunities and Threats. (ED 415 929). LosAngeles, CA: Faculty Association of the University of California-Los Angeles.
Gladieux, L., and Swail, W. S. 1999. The Virtual University and Educational Opportunity: Issues ofEquity and Access for the Next Generation. Policy Perspectives. Washington, DC: The CollegeBoard. (http://www.collegeboard.org/policy/html/virtual.html).
Green, K. 1997. Drawn to the Light, Burned by the Flame? Money, Technology, and DistanceEducation. ED Journal (11)5:J-1 - J-9.
Green, K. 1998. The 1998 National Survey of Information Technology in Higher Education: CollegesStruggle with IT Planning. Encino, CA: Campus Computing.(http://www.campuscomputing.net/summaries/1998/).
Hanson, D., Maushak, N., Schlosser, C., Anderson, M., Sorensen, C., and Simonson, M. 1997. DistanceEducation: Review of the Literature, 2nd Ed. Washington, DC, and Ames, IA: Association forEducational Communications and Technology and Research Institute for Studies in Education.
The Institute for Higher Education Policy (IHEP). 1999. Distance Learning in Higher Education.Produced for the Council for Higher Education Accreditation, February.(http://www.ihep.com/ace.pdf).
Kelly, K. 1998. New Rules for the New Economy: 10 Radical Strategies for a Connected World. NewYork: Viking Press.
Mulugetta, Y., and Mulugetta, A. 1999. Exploring Primary Factors Hindering the Development ofDistance Learning in the Higher Education Market. Paper presented at the 15th AnnualConference on Distance Teaching and Learning, Madison, WI, August.

58
National Commission on the Cost of Higher Education. 1998. Straight Talk about College Costs andPrices – The Report of the National Commission on the Cost of Higher Education. Washington,DC: American Institutes for Research.
New York Times. November 2, 1998. More Colleges Plunging into Uncharted Waters of On-line Courses.
Oblinger, D., and Maruyama, M. 1996. Distributed Learning. CAUSE Professional Paper Series #14.Boulder, CO: CAUSE. (http://www.educause.edu/ir/library/pdf/PUB3014/pdf).
Phipps, R., Wellman, J., and Merisotis, J. 1998. Assuring Quality in Distance Learning: A PreliminaryReview. A report prepared for the Council of Higher Education Accreditation. Washington, DC:The Institute for Higher Education Policy. (http://www.ihep.com/ PUB.html).
Phipps, R., and Merisotis, J. 1999. What’s the Difference? A Review of Contemporary Research on theEffectiveness of Distance Learning in Higher Education. Washington, DC: The Institute forHigher Education Policy. (http://www.ihep.com/difference.pdf).
Russell, T. L. 1999. The No Significant Difference Phenomenon. Chapel Hill, NC: Office ofInstructional Telecommunications, North Carolina State University.(http://cuda.teleeducation.nb.ca/nosignificantdifference/index.cfm).
Sherron, G., and Boettcher, J. 1997 Distance Learning: The Shift to Interactivity. CAUSE ProfessionalPaper Series #17. Boulder, CO: CAUSE.(http://www.educause.edu/ir/library/ pdf/PUB3017.pdf).
Sherry, L. 1996. Issues in Distance Learning. International Journal of Educational Telecommunications1 (4):337-365. (http://www.cudenver.edu/~lsherry/pubs/issues.html).
Turoff, M. 1997. Alternative Futures for Distance Learning: The Force and the Darkside. Paperutilized for an invited keynote presentation at the UNESCO/Open University InternationalColloquium, April 27-29: Virtual Learning Environments and the Role of the Teacher.(http://www.eies.njit.edu/`turoff/Papers/darkaln.html).
U.S. Department of Education, National Center for Education Statistics. 1997. Distance Education inHigher Education Institutions, NCES 97-062, by Laurie Lewis, Debbie Alexander, and ElizabethFarris. Project Officer, Bernie Greene. Washington, DC.
Willis, B. 1995. Distance Education: Research. Distance Education at a Glance. Guide #10.University of Idaho, College of Engineering, Engineering Outreach.(http://www.uidaho.edu/evo/dist10.html).
A-1
Appendix A
Survey Methodology and Data Reliability

A-2

A-3
Table of Contents
Page
Postsecondary Education Quick Information System ................................................................ A-5Sample and Response Rates ....................................................................................................... A-5Sampling and Nonsampling Errors ............................................................................................ A-6Variances .................................................................................................................................... A-8Definitions of Analysis Variables .............................................................................................. A-8Comparing the PEQIS Studies: Technical Notes and Limitations ............................................ A-9
Differences in the Samples ............................................................................................. A-9Variations in Question Wording ..................................................................................... A-10
Background Information ............................................................................................................ A-11
List of Appendix Tables
Table
A Number and percentage distribution of postsecondary education institutions in thestudy, and the estimated number and percentage distribution in the nation, for the totalsample and for institutions that offered distance education courses in 1997–98,by institutional characteristics: 1998–1999........................................................................ A-7

A-4
A-5
Postsecondary EducationQuick Information System
The Postsecondary Education Quick InformationSystem (PEQIS) was established in 1991 by theNational Center for Education Statistics, U.S.Department of Education. PEQIS is designed toconduct brief surveys of postsecondaryinstitutions or state higher education agencies onpostsecondary education topics of nationalimportance. Surveys are generally limited to twoor three pages of questions, with a responseburden of about 30 minutes per respondent. MostPEQIS institutional surveys use a previouslyrecruited, nationally representative panel ofinstitutions. The PEQIS panel was originallyselected and recruited in 1991–92. In 1996, thePEQIS panel was reselected to reflect changes inthe postsecondary education universe that hadoccurred since the original panel was selected. Amodified Keyfitz approach was used to maximizeoverlap between the 1996 panel and the 1991–92panel. The sampling frame for the PEQIS panelrecruited in 1996 was constructed from the 1995–96 Integrated Postsecondary Education DataSystem (IPEDS) “Institutional Characteristics”file. Institutions eligible for the PEQIS frame forthe panel recruited in 1996 included 2-year and 4-year (including graduate-level) institutions (bothinstitutions of higher education and otherpostsecondary institutions), and less-than-2-yearinstitutions of higher education located in the 50states and the District of Columbia: a total of5,353 institutions.
The PEQIS sampling frame for the panelrecruited in 1996 was stratified by instructionallevel (4-year, 2-year, less-than-2-year), control(public, private nonprofit, private for-profit),highest level of offering (doctor’s/first-professional, master’s, bachelor’s, less thanbachelor’s), total enrollment, and status as eitheran institution of higher education or otherpostsecondary institution. Within each of thestrata, institutions were sorted by region(Northeast, Southeast, Central, West), whetherthe institution had a relatively high minorityenrollment, and whether the institution hadresearch expenditures exceeding $1 million. Thesample of 1,669 institutions was allocated to the
strata in proportion to the aggregate square root oftotal enrollment. Institutions within a stratumwere sampled with equal probabilities ofselection. The modified Keyfitz approachresulted in 80 percent of the institutions in the1996 panel overlapping with the 1991–92 panel.Panel recruitment was conducted with the 338institutions that were not part of the overlapsample. During panel recruitment, 20 institutionswere found to be ineligible for PEQIS, primarilybecause they had closed or offered justcorrespondence courses. The final unweightedresponse rate at the end of PEQIS panelrecruitment with the institutions that were not partof the overlap sample was 98 percent (312 of the318 eligible institutions). The final participationrate across the 1,669 institutions that wereselected for the 1996 panel was 1,628participating institutions out of 1,634 eligibleinstitutions. There were 1,634 eligibleinstitutions because 15 institutions in the overlapsample were determined to be ineligible forvarious reasons.
Each institution in the PEQIS panel was asked toidentify a campus representative to serve assurvey coordinator. The campus representativefacilitates data collection by identifying theappropriate respondent for each survey andforwarding the questionnaire to that person.
Sample and Response Rates
The sample for this survey consisted of all of theinstitutions in the PEQIS panel, for a sample of1,612 institutions.27 In October 1998, ques-tionnaires (see appendix C) were mailed to thePEQIS coordinators at the institutions.Coordinators were told that the survey wasdesigned to be completed by the person(s) at theinstitution most knowledgeable about theinstitution’s distance education course offerings.
Eleven institutions were found to be out of thescope of the survey because they were closed,leaving 1,601 eligible institutions. These 1,601
27The number of institutions in the PEQIS panel decreased from
1,628 to 1,612 because of institutional closures and mergers.
A-6
institutions represent the universe ofapproximately 5,010 2-year and 4-year (includinggraduate-level) postsecondary educationinstitutions in the 50 states and the District ofColumbia. Telephone followup of nonrespon-dents was initiated in November 1998; datacollection and clarification was completed inMarch 1999. For the eligible institutions thatreceived surveys, an unweighted response rate of93 percent (1,487 responding institutions dividedby the 1,601 eligible institutions in the sample)was obtained. The weighted response rate for thissurvey was also 93 percent. The unweightedoverall response rate was 93 percent (99.6 percentpanel recruitment participation rate multiplied bythe 92.9 percent survey response rate). Theweighted overall response rate was 92 percent(99.7 percent weighted panel recruitmentparticipation rate multiplied by the 92.7 percentweighted survey response rate).
Weighted item nonresponse rates ranged from 0percent to 2.6 percent. Item nonresponse rates formost items were less than 1 percent. The itemswith the highest nonresponse rates involved thenumbers of courses and enrollments. Becauseone of the major reasons for conducting thissurvey was to make national estimates for thesenumbers, imputation was implemented for allitem nonresponse in the survey. The imputationprocedures involved a combination of hot-deckimputation procedures for questions 2, 3, and 4,involving numbers of courses and enrollments,and the assignment of modal values fromimputation classes for question 10, concerningplans for distance education technologies. Theseprocedures are described in more detail below.
There were 33 institutions, which represent about4.4 percent of the 753 responding institutionsoffering a distance education course, that did notreport one or more data items in questions 2, 3,and 4. However, only a very few institutions didnot report the numbers of different college-level,credit-granting courses offered by general fieldsof study in question 4. To impute the missingnumbers of courses and enrollments, hot-deckimputation procedures were used. Hot-deckimputation selects a donor value from anotherinstitution with similar characteristics to use asthe imputed value. The institutions were grouped
to form imputation classes according to sector(public, private nonprofit, private for-profit),institutional level (4-year, 2-year) and enrollmentsize class. A donor institution was selectedamong the responding institutions within theimputation class. The donor institution wasselected randomly, if the total number of creditgranting courses and total enrollment were notreported. However, if these totals were reported,the institution with the closest totals to therecipient institution was selected as the donor. Ifenrollment was not reported but the number ofcourses offered was reported, enrollment for aspecific field of study was imputed bymultiplying the reported number of coursesoffered by the institution with the ratio of the totalenrollment to the total number of courses offeredfor the field of study, computed using theresponding institutions within the imputationclass.
There were 29 institutions (or about 3 percent ofthe total number of institutions eligible forquestion 10) with missing data in one or more ofthe parts of question 10. The imputed items forquestion 10 had to be consistent with thecorresponding reported data items in question 9.The institutions were grouped into imputationclasses according to sector, institutional level,enrollment size class, and the reported value forquestion 9. The reported modal value among theresponding institutions within the imputationclass was assigned as the imputed value for themissing data item in question 10.
Sampling and Nonsampling Errors
The response data were weighted to producenational estimates (see table A). The weightswere designed to adjust for the variableprobabilities of selection and differentialnonresponse. The findings in this report areestimates based on the sample selected and,consequently, are subject to sampling variability.
The survey estimates are also subject tononsampling errors that can arise because ofnonobservation (nonresponse or noncoverage)errors, errors of reporting, and errors made in data
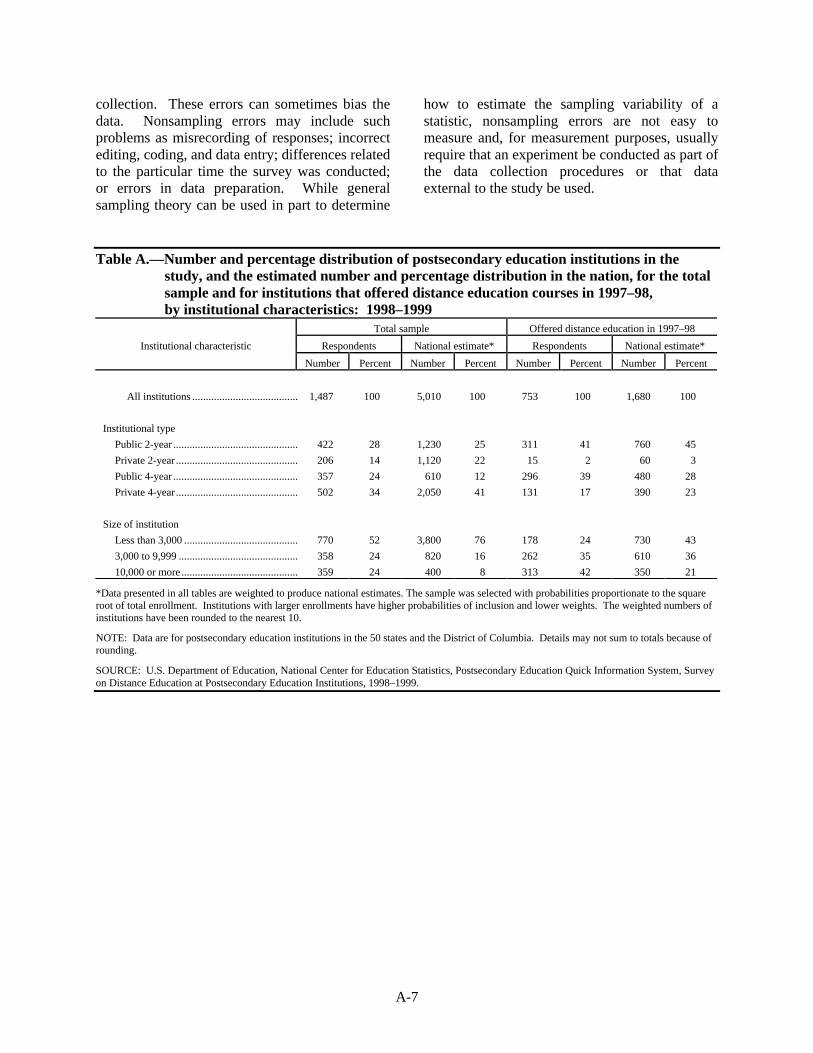
A-7
collection. These errors can sometimes bias thedata. Nonsampling errors may include suchproblems as misrecording of responses; incorrectediting, coding, and data entry; differences relatedto the particular time the survey was conducted;or errors in data preparation. While generalsampling theory can be used in part to determine
how to estimate the sampling variability of astatistic, nonsampling errors are not easy tomeasure and, for measurement purposes, usuallyrequire that an experiment be conducted as part ofthe data collection procedures or that dataexternal to the study be used.
Table A.—Number and percentage distribution of postsecondary education institutions in thestudy, and the estimated number and percentage distribution in the nation, for the totalsample and for institutions that offered distance education courses in 1997–98,by institutional characteristics: 1998–1999
Total sample Offered distance education in 1997–98
Respondents National estimate* Respondents National estimate*Institutional characteristic
Number Percent Number Percent Number Percent Number Percent
All institutions ....................................... 1,487 100 5,010 100 753 100 1,680 100
Institutional type
Public 2-year .............................................. 422 28 1,230 25 311 41 760 45
Private 2-year ............................................. 206 14 1,120 22 15 2 60 3
Public 4-year .............................................. 357 24 610 12 296 39 480 28
Private 4-year ............................................. 502 34 2,050 41 131 17 390 23
Size of institution
Less than 3,000 .......................................... 770 52 3,800 76 178 24 730 43
3,000 to 9,999 ............................................ 358 24 820 16 262 35 610 36
10,000 or more........................................... 359 24 400 8 313 42 350 21
*Data presented in all tables are weighted to produce national estimates. The sample was selected with probabilities proportionate to the squareroot of total enrollment. Institutions with larger enrollments have higher probabilities of inclusion and lower weights. The weighted numbers ofinstitutions have been rounded to the nearest 10.
NOTE: Data are for postsecondary education institutions in the 50 states and the District of Columbia. Details may not sum to totals because ofrounding.
SOURCE: U.S. Department of Education, National Center for Education Statistics, Postsecondary Education Quick Information System, Surveyon Distance Education at Postsecondary Education Institutions, 1998–1999.
A-8
To minimize the potential for nonsampling errors,the questionnaire was pretested with respondentsat institutions like those that completed thesurvey. During the design of the survey and thesurvey pretest, an effort was made to check forconsistency of interpretation of questions and toeliminate ambiguous items. The questionnaireand instructions were extensively reviewed by theNational Center for Education Statistics, U.S.Department of Education. Manual and machineediting of the questionnaire responses wereconducted to check the data for accuracy andconsistency. Cases with missing or inconsistentitems were recontacted by telephone. Data werekeyed with 100 percent verification.
Variances
The standard error is a measure of the variabilityof estimates due to sampling. It indicates thevariability of a sample estimate that would beobtained from all possible samples of a givendesign and size. Standard errors are used as ameasure of the precision expected from aparticular sample. If all possible samples weresurveyed under similar conditions, intervals of1.96 standard errors below to 1.96 standard errorsabove a particular statistic would include the truepopulation parameter being estimated in about95 percent of the samples. This is a 95 percentconfidence interval. For example, the estimatedpercentage of institutions reporting that theyoffered distance education courses in 1997–98 is33.6 percent, and the estimated standard error is1.0 percent. The 95 percent confidence intervalfor the statistic extends from [33.6 - (1.0 times1.96)] to [33.6 + (1.0 times 1.96)], or from 31.6 to35.6 percent. Tables of standard errors for eachtable and figure in the report are provided inappendix B.
Estimates of standard errors were computed usinga technique known as jackknife replication. Aswith any replication method, jackknife replicationinvolves constructing a number of subsamples(replicates) from the full sample and computingthe statistic of interest for each replicate. Themean squared error of the replicate estimatesaround the full sample estimate provides an
estimate of the variances of the statistics.28 Toconstruct the replications, 51 stratifiedsubsamples of the full sample were created andthen dropped one at a time to define 51 jackknifereplicates.29 A computer program (WesVarPC),distributed free of charge by Westat through theInternet,30 was used to calculate the estimates ofstandard errors. WesVarPC is a stand-aloneWindows application that computes samplingerrors for a wide variety of statistics (totals,percents, ratios, log-odds ratios, general functionsof estimates in tables, linear regressionparameters, and logistic regression parameters).
The test statistics used in the analysis werecalculated using the jackknife variances and thusappropriately reflected the complex nature of thesample design. In particular, an adjusted chi-square test using Satterthwaite’s approximation tothe design effect was used in the analysis of thetwo-way tables.31 Finally, Bonferroniadjustments were made to control for multiplecomparisons where appropriate. For example, foran “experiment-wise” comparison involving gpairwise comparisons, each difference was testedat the 0.05/g significance level to control for thefact that g differences were simultaneously tested.
Definitions of Analysis Variables
The following institutional characteristics wereused as variables for analyzing the survey data:
• Type of institution: public 2-year, private 2-year, public 4-year, private 4-year. Type wascreated from a combination of level (2-year,4-year) and control (public, private). Two-year institutions are defined as institutions atwhich the highest level of offering is at least
28K. Wolter. Introduction to Variance Estimation, Springer-Verlag,
1985.
29Ibid, 183.
30WesVarPC version 2 is available through the Internet athttp://www.westat.com/wesvar /.
31For example, see J.N.K. Rao and A. Scott, “On Chi-square Testsfor Multi-way Contingency Tables with Cell ProportionsEstimated from Survey Data,” Annals of Statistics 12 (1984): 46-60.
A-9
2 but less than 4 years (below thebaccalaureate degree); 4-year institutions arethose at which the highest level of offering is4 or more years (baccalaureate or higherdegree).32 Private comprises privatenonprofit and private for-profit institutions;these private institutions are reported togetherbecause there are too few private for-profitinstitutions in the sample for this survey toreport them as a separate category.Postsecondary education institutions includeboth institutions of higher education(traditional colleges and universities) andother postsecondary institutions (e.g., alliedhealth and vocational-technical schools).Less-than-2-year institutions are not includedin the PEQIS panel or in this survey.
• Size of institution: less than 3,000 students(small); 3,000 to 9,999 students (medium);and 10,000 or more students (large).
Comparing the PEQIS Studies:Technical Notes and Limitations
There are a number of factors that must beconsidered when comparing the 1995 and 1997–98 PEQIS studies. Differences in the samplesand variations in question wording are discussedhere. In addition, the data from the 1995 studywere not imputed for item nonresponse.However, item nonresponse was very low and didnot substantially affect the results. Itemnonresponse is noted where it occurred when thedata are presented in chapter 7.
Differences in the Samples
The two studies were sent to two somewhatdifferent groups of institutions. The sample forthe 1995 study consisted of all of the 2-yearand 4-year higher education institutions in thePEQIS panel selected in 1991–92, which wasbased on the 1990–91 IPEDS “Institutional 32Definitions for level are from the data file documentation for the
Integrated Postsecondary Education Data System (IPEDS)“Institutional Characteristics” file, U.S. Department of Education,National Center for Education Statistics.
Characteristics” file. This sample of 1,274institutions (of which 1,203 were respondents)represented the universe of approximately 3,460higher education institutions at the 2-year and 4-year level in the 50 states, the District ofColumbia, and Puerto Rico estimated to exist atthe time of the survey. At the time the 1991–92PEQIS panel was selected, NCES defined highereducation institutions as institutions that areaccredited at the college level by an agencyrecognized by the Secretary of the U.S.Department of Education.33 Higher educationinstitutions are a subset of all postsecondaryeducation institutions. The 1995 study was sentonly to higher education institutions in the PEQISpanel.
The sample for the 1997–98 study consisted of allof the 2-year and 4-year postsecondary educationinstitutions in the PEQIS panel selected in 1996,which was based on the 1995–96 IPEDS“Institutional Characteristics” file. The 1996PEQIS panel was selected in a way thatmaximized the overlap between the 1991–92 and1996 panels. The 1,601 institutions in the 1997–98 study represented the universe ofapproximately 5,010 postsecondary educationinstitutions at the 2-year and 4-year level in the50 states and the District of Columbia estimatedto exist at the time of the survey. At the time the1996 PEQIS panel was selected, NCES was stilldefining higher education institutions in the sameway as it was when the 1991–92 PEQIS panelwas selected. The 1997–98 study was sent to allpostsecondary education institutions in the PEQISpanel, both higher education and otherpostsecondary education institutions. In order tomake comparisons between the two studies, thedata from the 1997–98 study were analyzed forthe subset of higher education institutions. These1,347 institutions (of which 1,244 wererespondents) represented the universe of
33NCES now defines higher education institutions as those
institutions that are eligible for Title IV financial aid programs andthat grant degrees (i.e., awarded at least one associate’s or higherdegree in the previous academic year). In 1997–98, there were4,096 higher education institutions that met this revised definition,out of a universe of 9,632 postsecondary education institutions(U.S. Department of Education, National Center for EducationStatistics, Postsecondary Institutions in the United States: 1997–98. Washington, DC: 1999).
A-10
approximately 3,580 higher education institutionsat the 2-year and 4-year level in the 50 states andthe District of Columbia estimated to exist at thetime of the study. It is the data from this subsetof institutions that are presented in the chapter onchanges in distance education since 1994–95.
Variations in Question Wording
Number of distance education courses offered.In the 1995 study, institutions were asked for thetotal number of distance education courses withdifferent catalog numbers offered by theinstitution in academic year 1994–95. Courseswith different catalog numbers excluded multiplesections of the same course. In the 1997–98study, institutions were asked to report the totalnumber of different distance education courses(including courses for all levels and audiences),and the number of different college-level, credit-granting distance education courses offered at theinstitution in the 12-month 1997–98 academicyear. If a course had multiple sections or wasoffered multiple times during the year,institutions were instructed to count it as only onecourse.
Enrollment in distance education courses. In1995, institutions that offered any distanceeducation courses were asked how many studentswere formally enrolled in the institution’sdistance education courses in academic year1994–95. In the 1997–98 study, institutions thatoffered any distance education courses wereasked about the total enrollment in all distanceeducation courses in the 12-month 1997–98academic year (including enrollments in coursesdesigned for all levels and types of students,including elementary/secondary, adult education,etc.), and the enrollment in college-level, credit-granting distance education courses in 1997–98.In both studies, if a student was enrolled inmultiple courses, institutions were instructed tocount the student for each course in which he orshe was enrolled. Thus, enrollments may includeduplicated counts of students.
Degree and certificate programs. In 1995,institutions were asked whether students couldcomplete degrees or certificates by taking
distance education courses exclusively, and if so,how many different degrees or certificates couldbe received in this way. In the 1997–98 study,institutions were asked if they had any college-level degree or certificate programs based oncredit-granting courses designed to be completedtotally through distance education, and if so, howmany such degree and certificate programs theyhad. In 1997–98, they were also instructed toinclude programs that may require a smallamount of on-campus coursework or labwork,clinical work in hospitals, or similar arrange-ments, and to include baccalaureate degreecompletion programs.
Distance education technologies. In 1995,institutions were asked which types of technologythey used to deliver their distance educationcourses. In 1997–98, institutions were askedwhich types of technology they used as a primarymode of instructional delivery for distanceeducation courses. An individual course couldonly have one predominant mode of delivery.Institutions could, however, indicate that theyused many different technologies as primarymodes of instructional delivery across all of theirdistance education courses, since differentdistance education courses could use differenttypes of technology. Information was notcollected in either year about the number ofcourses offered using each technology, onlywhether the institution used it at all (or used it asa primary mode of instruction) for distanceeducation courses.
The lists of technologies in the 2 years weresimilar but not identical. The incidence ofaudiographics was so low in 1995 that it was notincluded as a separate category in 1997–98. CD-ROM and multi-mode packages were added ascategories in 1997–98. The wording of thecomputer-based technologies was changed tomore accurately reflect how these technologiesare used. In 1995, the categories were two-wayonline (computer-based) interactions duringinstruction, and other computer-based technology(e.g., Internet). In 1997–98, the categories wereInternet courses using synchronous (i.e.,simultaneous) computer-based instruction (e.g.,interactive computer conferencing or InteractiveRelay Chat), and Internet courses using
A-11
asynchronous (i.e., not simultaneous) computer-based instruction (e.g., e-mail, listserves, andmost World Wide Web-based courses). For thecomparisons presented in this report, two-wayonline (computer-based) interactions duringinstruction is compared to Internet courses usingsynchronous computer-based instruction, andother computer-based technology (e.g., Internet)is compared to Internet courses usingasynchronous computer-based instruction.
Background Information
The survey was performed under contract withWestat, using the Postsecondary Education QuickInformation System (PEQIS). This is the ninthPEQIS survey to be conducted. Westat’s ProjectDirector was Elizabeth Farris, and the SurveyManager was Laurie Lewis. Bernie Greene wasthe NCES Project Officer.
The following individuals reviewed this report:
Outside NCES
• Gary Adams, California Community Colleges
• Stephanie Cronen, American Institutes forResearch
• Ann Hiros, Consortium of DistanceEducation
• David Hurst, Education Statistics ServicesInstitute
• James Lubell, Office of PostsecondaryEducation, U.S. Department of Education
• Becky Smerdon, American Institutes forResearch
• Karen Spahn, University of Phoenix
Inside NCES
• Ellen Bradburn, Early Childhood,International, and CrosscuttingStudies Division
• Chris Chapman, Early Childhood,International, and CrosscuttingStudies Division
• Paula Knepper, Postsecondary StudiesDivision
• Roslyn Korb, Postsecondary Studies Division
• Marilyn McMillen, Chief Statistician
For more information about the PostsecondaryEducation Quick Information System or theSurvey on Distance Education at PostsecondaryEducation Institutions, contact:
Bernie GreeneEarly Childhood, International, and
Crosscutting Studies DivisionNational Center for Education StatisticsOffice of Educational Research
and ImprovementU.S. Department of Education555 New Jersey Avenue, NWWashington, DC 20208-5651Email: [email protected]: (202) 219-1366

A-12

B-1
Appendix B
Tables of Standard Errors

B-2

B-3
Table of Contents
Standard Error Tables for Text Tables and Figures
Table Page
1a Standard errors of the percentage distribution of 2-year and 4-year postsecondaryeducation institutions in the nation, and the percentage distribution of studentsenrolled at those institutions, by institutional characteristics: 1997–98 ........................... B-7
2a Standard errors of the number and percentage distribution of 2-year and 4-yearpostsecondary education institutions that offered distance education courses in1997–98, that planned to offer them in the next 3 years, and that did not offer and didnot plan to offer them in the next 3 years, by institutional characteristics ........................ B-8
3a Standard errors of the percentage distribution of 2-year and 4-year postsecondaryeducation institutions that offered distance education courses in 1997–98, and thepercentage distribution of students enrolled at those institutions, by institutionalcharacteristics .................................................................................................................... B-9
4a Standard errors of the total number of 2-year and 4-year postsecondary educationinstitutions, and the number and percent of institutions in the nation that offereddistance education courses in 1997–98, by level of institutional offerings ....................... B-10
5a Standard errors of the total number of enrollments in all distance education courses,and the number of enrollments in college-level, credit-granting distance educationcourses offered by 2-year and 4-year postsecondary education institutions in1997–98, by institutional characteristics ........................................................................... B-11
6a Standard errors of the total number of different distance education courses, and thenumber of different college-level, credit-granting distance education courses offeredby 2-year and 4-year postsecondary education institutions in 1997–98, byinstitutional characteristics ................................................................................................ B-12
7a Standard errors of the percent of 2-year and 4-year postsecondary educationinstitutions offering any distance education courses in 1997–98 that offered college-level, credit-granting distance education courses in various fields of study in1997–98, by course level and field .................................................................................... B-13
8a Standard errors of the percent of all 2-year and 4-year postsecondary educationinstitutions offering any distance education courses in 1997–98 that offered college-level, credit-granting distance education courses in various fields of study in1997–98, by institutional type and field ............................................................................ B-14
9a Standard errors of the number of different college-level, credit-granting distanceeducation courses offered in various fields by 2-year and 4-year postsecondaryeducation institutions in 1997–98, by course level and field............................................. B-15
10a Standard errors of the number of different college-level, credit-granting distanceeducation courses offered in various fields by 2-year and 4-year postsecondaryeducation institutions in 1997–98, by institutional type and field ..................................... B-16
B-4
Table of Contents (continued)
Standard Error Tables for Text Tables and Figures (continued)
Table Page
11a Standard errors of the number of enrollments in college-level, credit-grantingdistance education courses offered in various fields at 2-year and 4-yearpostsecondary education institutions in 1997–98, by course level and field..................... B-17
12a Standard errors of the number of enrollments in college-level, credit-grantingdistance education courses offered in various fields at 2-year and 4-yearpostsecondary education institutions in 1997–98, by institutional type and field ............. B-18
13a Standard errors of the percent of all 2-year and 4-year postsecondary educationinstitutions offering any distance education courses in 1997–98, and the percent thathad college-level degree or certificate programs designed to be completed totallythrough distance education in 1997–98, by institutional characteristics ........................... B-19
14a Standard errors of the percent of 2-year and 4-year postsecondary educationinstitutions offering any distance education courses in 1997–98 that had college-leveldegree or certificate programs in various fields that were designed to be completedtotally through distance education, by level and field ....................................................... B-20
15a Standard errors of the number of college-level degree and certificate programsdesigned to be completed totally through distance education offered by 2-year and4-year postsecondary education institutions in 1997–98, by institutionalcharacteristics .................................................................................................................... B-21
16a Standard errors of the number of college-level degree programs in selected fieldsdesigned to be completed totally through distance education offered by 2-year and4-year postsecondary education institutions in 1997–98, by level and field ..................... B-22
17a Standard errors of the percent of 2-year and 4-year postsecondary educationinstitutions offering distance education courses in 1997–98 indicating that theinstitution used various types of technology as a primary mode of instructionaldelivery for distance education courses in 1997–98, by institutional characteristics ........ B-23
18a Standard errors of the percentage distribution of 2-year and 4-year postsecondaryeducation institutions that offered distance education in 1997–98 or that planned tooffer distance education in the next 3 years according to their plans for the next3 years concerning the number of distance education courses that will be offered,by type of technology that will be used as the primary mode of instructional delivery .... B-24
19a Standard errors of the percent of 2-year and 4-year postsecondary educationinstitutions offering distance education in 1997–98 or planning to offer distanceeducation in the next 3 years that planned to start or increase their use of varioustypes of technologies as the primary mode of instructional delivery during the next3 years................................................................................................................................ B-25
B-5
Table of Contents (continued)
Standard Error Tables for Text Tables and Figures (continued)
Table Page
20a Standard errors of the percentage distribution of 2-year and 4-year postsecondaryeducation institutions offering distance education courses in 1997–98 according tohow tuition charges for college-level, credit-granting courses offered throughdistance education compare to tuition charges for equivalent on-campus courses attheir institution, by institutional characteristics................................................................. B-26
21a Standard errors of the percentage distribution of 2-year and 4-year higher educationinstitutions according to current or planned offering of distance education courses,by institutional characteristics: Fall 1995 and 1997–98 ................................................... B-27
22a Standard errors of the number of different distance education courses offered by2-year and 4-year higher education institutions in 1994–95 and 1997–98,by institutional characteristics ........................................................................................... B-28
23a Standard errors of the number of enrollments in 1994–95 and 1997–98 in distanceeducation courses offered by 2-year and 4-year higher education institutions,by institutional characteristics ........................................................................................... B-29
24a Standard errors of the percent of 2-year and 4-year higher education institutionsoffering distance education courses that offered distance education degree andcertificate programs, and the number of such programs in 1995 and 1997–98................. B-30
25a Standard errors of the percent of 2-year and 4-year higher education institutionsoffering distance education courses that used various types of technologies to deliverdistance education courses in 1995 and 1997–98.............................................................. B-31
26a Standard errors of the percent of 2-year and 4-year higher education institutionsoffering distance education courses that used selected types of technologies to deliverdistance education courses in 1995 and 1997–98, by institutional type ............................ B-32
27 Standard errors for the figures and for data not shown in tables ....................................... B-33

B-6
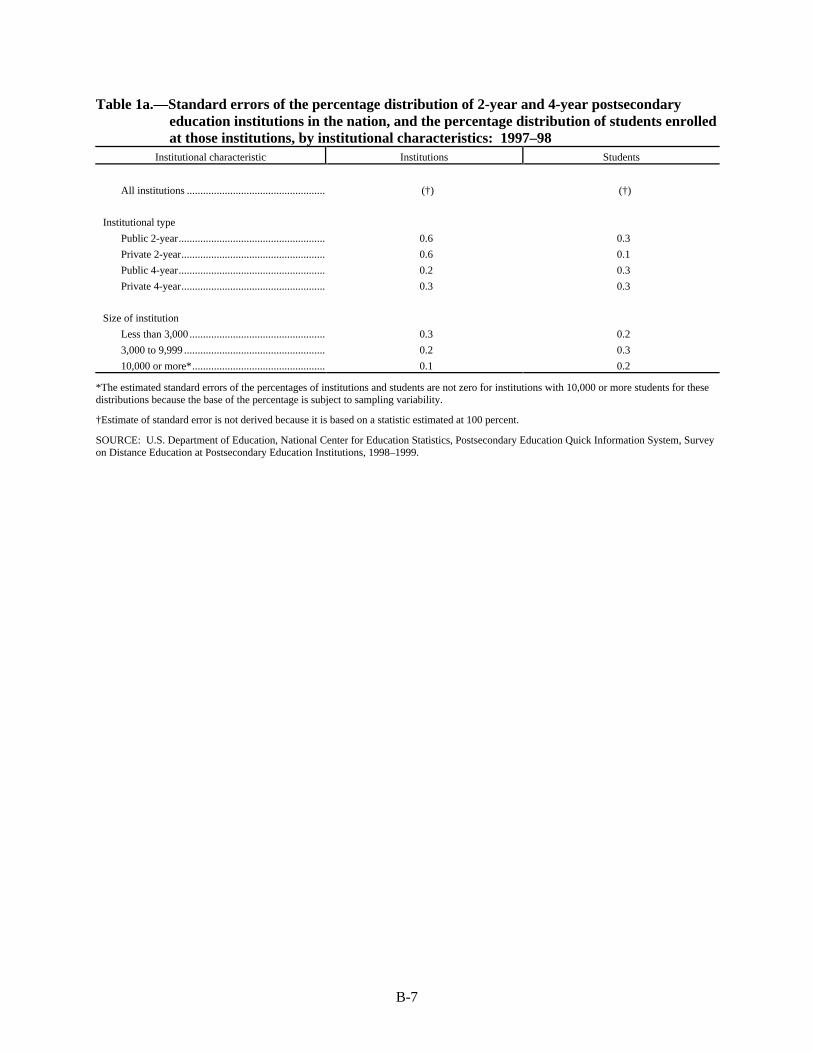
B-7
Table 1a.—Standard errors of the percentage distribution of 2-year and 4-year postsecondaryeducation institutions in the nation, and the percentage distribution of students enrolledat those institutions, by institutional characteristics: 1997–98
Institutional characteristic Institutions Students
All institutions ................................................... (†) (†)
Institutional type
Public 2-year...................................................... 0.6 0.3
Private 2-year..................................................... 0.6 0.1
Public 4-year...................................................... 0.2 0.3
Private 4-year..................................................... 0.3 0.3
Size of institution
Less than 3,000 .................................................. 0.3 0.2
3,000 to 9,999 .................................................... 0.2 0.3
10,000 or more*................................................. 0.1 0.2
*The estimated standard errors of the percentages of institutions and students are not zero for institutions with 10,000 or more students for thesedistributions because the base of the percentage is subject to sampling variability.
†Estimate of standard error is not derived because it is based on a statistic estimated at 100 percent.
SOURCE: U.S. Department of Education, National Center for Education Statistics, Postsecondary Education Quick Information System, Surveyon Distance Education at Postsecondary Education Institutions, 1998–1999.

B-8
Table 2a.—Standard errors of the number and percentage distribution of 2-year and 4-yearpostsecondary education institutions that offered distance education courses in 1997–98, that planned to offer them in the next 3 years, and that did not offer and did notplan to offer them in the next 3 years, by institutional characteristics
Offered distance education
in 1997–98
Planned to offer distance
education in the
next 3 years
Did not offer in 1997–98 and
did not plan to offer in the
next 3 yearsInstitutional characteristic
Total number
of institutions
Number Percent Number Percent Number Percent
All institutions ...................... 41.9 44.5 1.0 77.3 1.5 77.2 1.4
Institutional type
Public 2-year......................... 31.9 24.8 2.5 22.5 1.7 29.6 2.1
Private 2-year........................ 36.0 16.7 1.5 31.2 2.7 44.3 2.8
Public 4-year......................... 8.9 11.5 1.8 9.2 1.5 9.3 1.5
Private 4-year........................ 20.7 30.8 1.5 56.2 2.7 50.3 2.5
Size of institution
Less than 3,000..................... 42.5 42.6 1.2 76.7 2.0 76.4 1.7
3,000 to 9,999 ....................... 8.3 13.4 1.5 10.2 1.3 11.4 1.4
10,000 or more*.................... 0 0 0 0 0 0 0
*The estimated standard error is zero for institutions with 10,000 or more students, because all institutions of this size were included in thesample with certainty.
NOTE: Standard errors are computed on unrounded numbers.
SOURCE: U.S. Department of Education, National Center for Education Statistics, Postsecondary Education Quick Information System, Surveyon Distance Education at Postsecondary Education Institutions, 1998–1999.
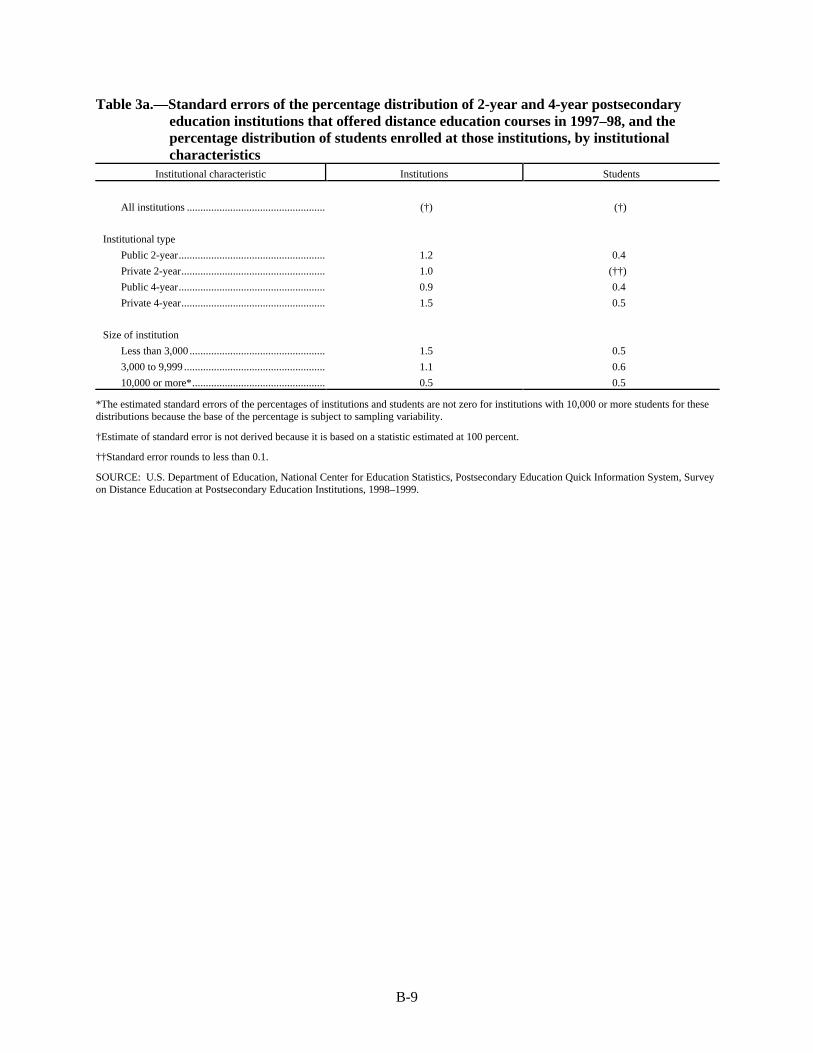
B-9
Table 3a.—Standard errors of the percentage distribution of 2-year and 4-year postsecondaryeducation institutions that offered distance education courses in 1997–98, and thepercentage distribution of students enrolled at those institutions, by institutionalcharacteristics
Institutional characteristic Institutions Students
All institutions ................................................... (†) (†)
Institutional type
Public 2-year...................................................... 1.2 0.4
Private 2-year..................................................... 1.0 (††)
Public 4-year...................................................... 0.9 0.4
Private 4-year..................................................... 1.5 0.5
Size of institution
Less than 3,000 .................................................. 1.5 0.5
3,000 to 9,999 .................................................... 1.1 0.6
10,000 or more*................................................. 0.5 0.5
*The estimated standard errors of the percentages of institutions and students are not zero for institutions with 10,000 or more students for thesedistributions because the base of the percentage is subject to sampling variability.
†Estimate of standard error is not derived because it is based on a statistic estimated at 100 percent.
††Standard error rounds to less than 0.1.
SOURCE: U.S. Department of Education, National Center for Education Statistics, Postsecondary Education Quick Information System, Surveyon Distance Education at Postsecondary Education Institutions, 1998–1999.
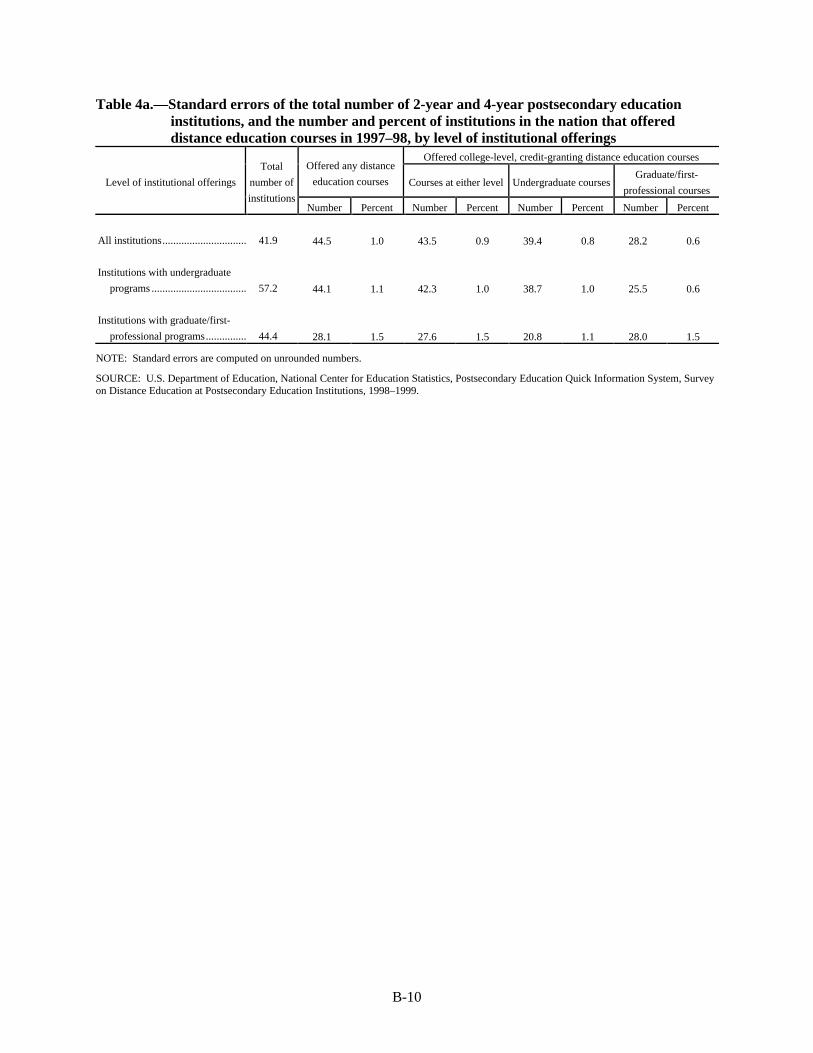
B-10
Table 4a.—Standard errors of the total number of 2-year and 4-year postsecondary educationinstitutions, and the number and percent of institutions in the nation that offereddistance education courses in 1997–98, by level of institutional offerings
Offered college-level, credit-granting distance education coursesOffered any distance
education courses Courses at either level Undergraduate coursesGraduate/first-
professional coursesLevel of institutional offerings
Total
number of
institutionsNumber Percent Number Percent Number Percent Number Percent
All institutions............................... 41.9 44.5 1.0 43.5 0.9 39.4 0.8 28.2 0.6
Institutions with undergraduate
programs ................................... 57.2 44.1 1.1 42.3 1.0 38.7 1.0 25.5 0.6
Institutions with graduate/first-
professional programs............... 44.4 28.1 1.5 27.6 1.5 20.8 1.1 28.0 1.5
NOTE: Standard errors are computed on unrounded numbers.
SOURCE: U.S. Department of Education, National Center for Education Statistics, Postsecondary Education Quick Information System, Surveyon Distance Education at Postsecondary Education Institutions, 1998–1999.
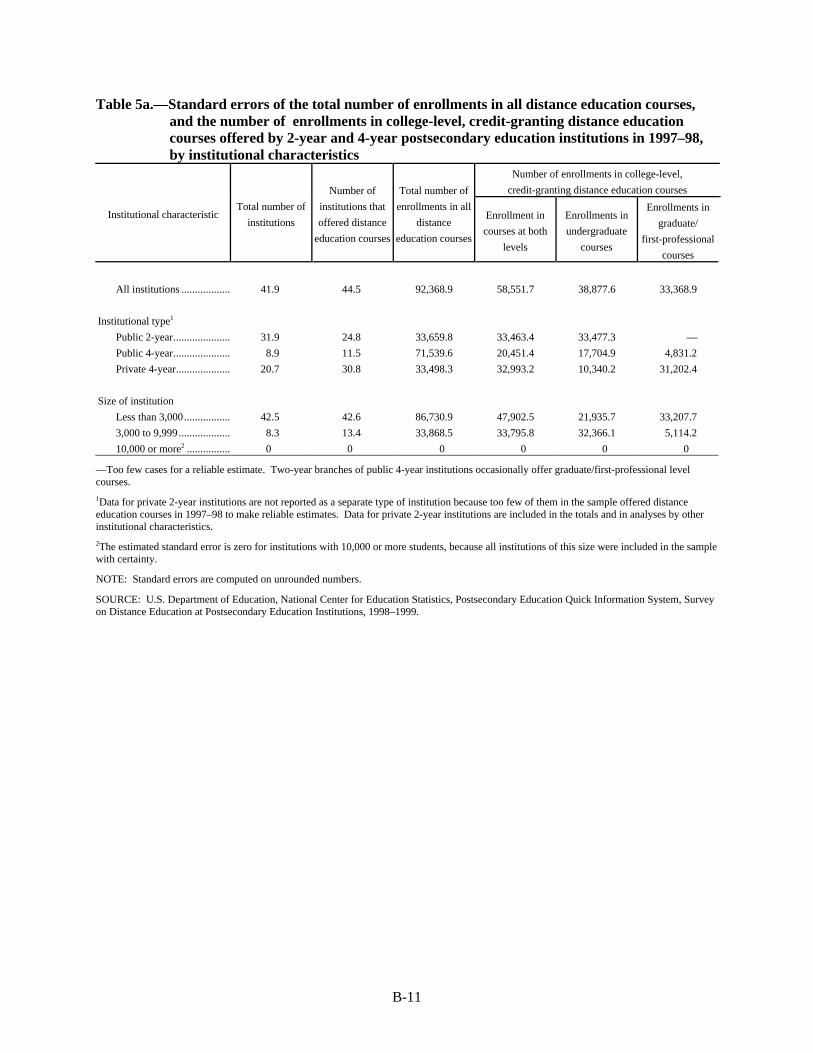
B-11
Table 5a.—Standard errors of the total number of enrollments in all distance education courses,and the number of enrollments in college-level, credit-granting distance educationcourses offered by 2-year and 4-year postsecondary education institutions in 1997–98,by institutional characteristics
Number of enrollments in college-level,
credit-granting distance education courses
Institutional characteristicTotal number of
institutions
Number of
institutions that
offered distance
education courses
Total number of
enrollments in all
distance
education courses
Enrollment in
courses at both
levels
Enrollments in
undergraduate
courses
Enrollments in
graduate/
first-professional
courses
All institutions .................. 41.9 44.5 92,368.9 58,551.7 38,877.6 33,368.9
Institutional type1
Public 2-year..................... 31.9 24.8 33,659.8 33,463.4 33,477.3 —
Public 4-year..................... 8.9 11.5 71,539.6 20,451.4 17,704.9 4,831.2
Private 4-year.................... 20.7 30.8 33,498.3 32,993.2 10,340.2 31,202.4
Size of institution
Less than 3,000................. 42.5 42.6 86,730.9 47,902.5 21,935.7 33,207.7
3,000 to 9,999................... 8.3 13.4 33,868.5 33,795.8 32,366.1 5,114.2
10,000 or more2 ................ 0 0 0 0 0 0
—Too few cases for a reliable estimate. Two-year branches of public 4-year institutions occasionally offer graduate/first-professional levelcourses.
1Data for private 2-year institutions are not reported as a separate type of institution because too few of them in the sample offered distanceeducation courses in 1997–98 to make reliable estimates. Data for private 2-year institutions are included in the totals and in analyses by otherinstitutional characteristics.
2The estimated standard error is zero for institutions with 10,000 or more students, because all institutions of this size were included in the samplewith certainty.
NOTE: Standard errors are computed on unrounded numbers.
SOURCE: U.S. Department of Education, National Center for Education Statistics, Postsecondary Education Quick Information System, Surveyon Distance Education at Postsecondary Education Institutions, 1998–1999.
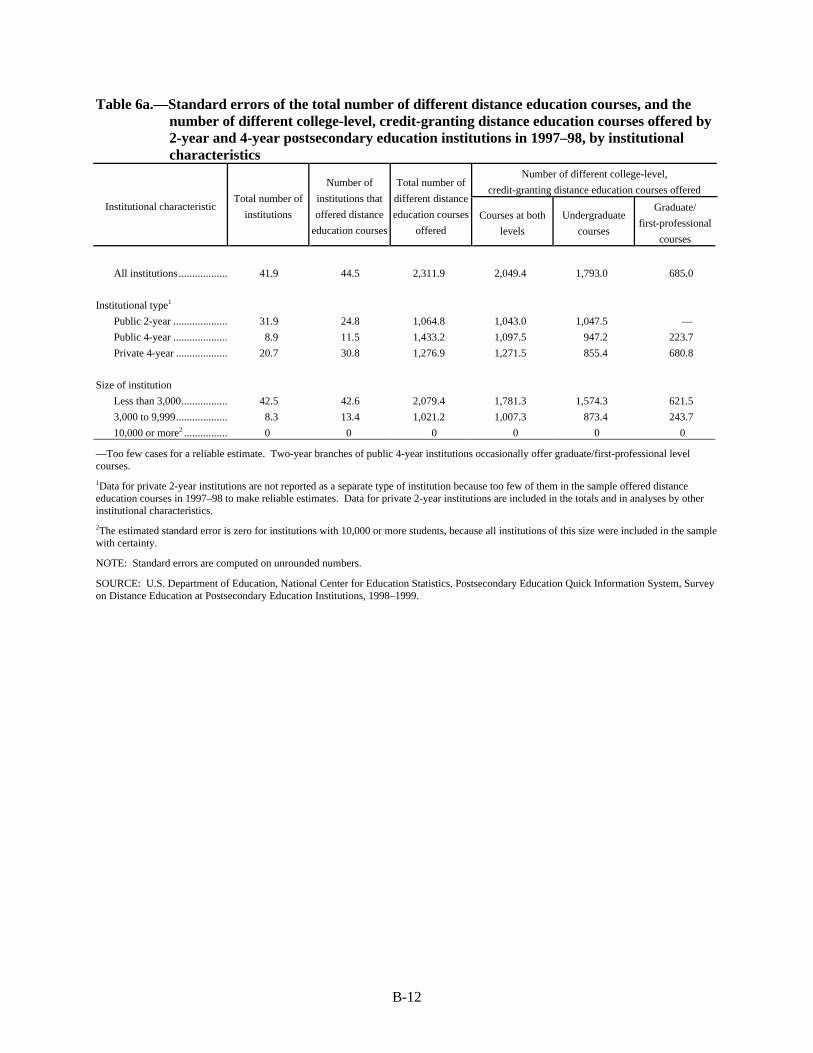
B-12
Table 6a.—Standard errors of the total number of different distance education courses, and thenumber of different college-level, credit-granting distance education courses offered by2-year and 4-year postsecondary education institutions in 1997–98, by institutionalcharacteristics
Number of different college-level,
credit-granting distance education courses offered
Institutional characteristicTotal number of
institutions
Number of
institutions that
offered distance
education courses
Total number of
different distance
education courses
offered
Courses at both
levels
Undergraduate
courses
Graduate/
first-professional
courses
All institutions .................. 41.9 44.5 2,311.9 2,049.4 1,793.0 685.0
Institutional type1
Public 2-year .................... 31.9 24.8 1,064.8 1,043.0 1,047.5 —
Public 4-year .................... 8.9 11.5 1,433.2 1,097.5 947.2 223.7
Private 4-year ................... 20.7 30.8 1,276.9 1,271.5 855.4 680.8
Size of institution
Less than 3,000................. 42.5 42.6 2,079.4 1,781.3 1,574.3 621.5
3,000 to 9,999................... 8.3 13.4 1,021.2 1,007.3 873.4 243.7
10,000 or more2 ................ 0 0 0 0 0 0
—Too few cases for a reliable estimate. Two-year branches of public 4-year institutions occasionally offer graduate/first-professional levelcourses.
1Data for private 2-year institutions are not reported as a separate type of institution because too few of them in the sample offered distanceeducation courses in 1997–98 to make reliable estimates. Data for private 2-year institutions are included in the totals and in analyses by otherinstitutional characteristics.
2The estimated standard error is zero for institutions with 10,000 or more students, because all institutions of this size were included in the samplewith certainty.
NOTE: Standard errors are computed on unrounded numbers.
SOURCE: U.S. Department of Education, National Center for Education Statistics, Postsecondary Education Quick Information System, Surveyon Distance Education at Postsecondary Education Institutions, 1998–1999.
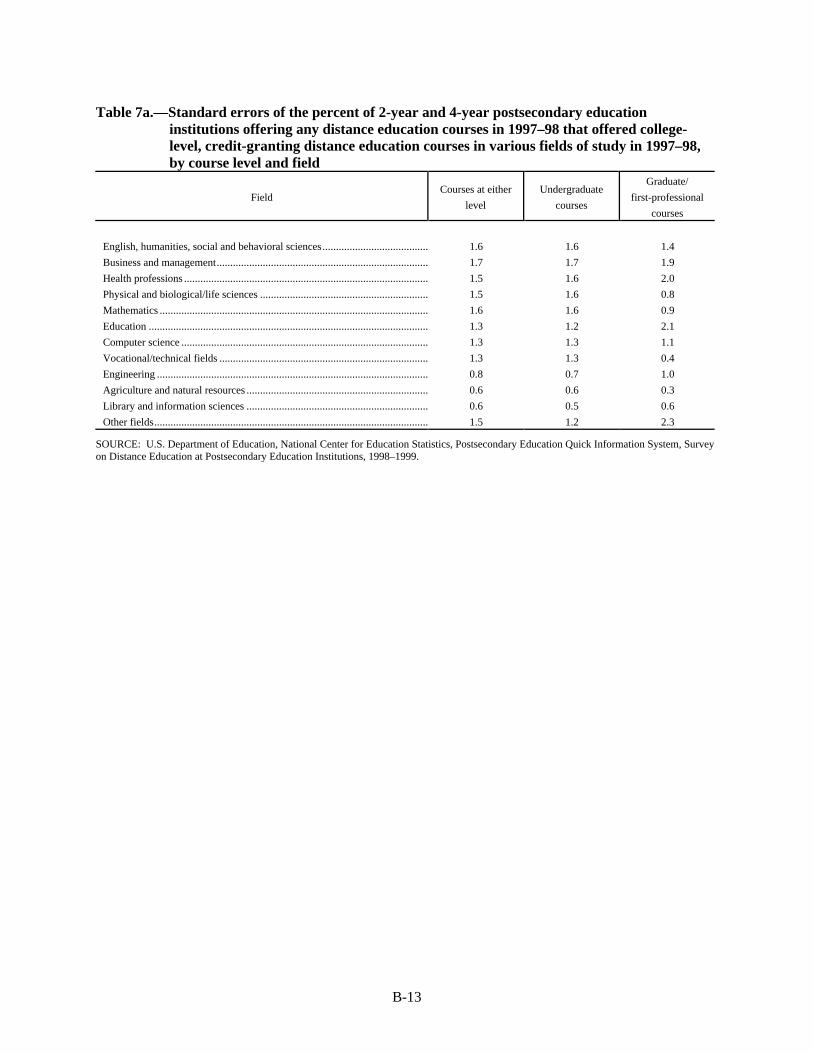
B-13
Table 7a.—Standard errors of the percent of 2-year and 4-year postsecondary educationinstitutions offering any distance education courses in 1997–98 that offered college-level, credit-granting distance education courses in various fields of study in 1997–98,by course level and field
FieldCourses at either
level
Undergraduate
courses
Graduate/
first-professional
courses
English, humanities, social and behavioral sciences....................................... 1.6 1.6 1.4
Business and management.............................................................................. 1.7 1.7 1.9
Health professions .......................................................................................... 1.5 1.6 2.0
Physical and biological/life sciences .............................................................. 1.5 1.6 0.8
Mathematics ................................................................................................... 1.6 1.6 0.9
Education ....................................................................................................... 1.3 1.2 2.1
Computer science ........................................................................................... 1.3 1.3 1.1
Vocational/technical fields ............................................................................. 1.3 1.3 0.4
Engineering .................................................................................................... 0.8 0.7 1.0
Agriculture and natural resources ................................................................... 0.6 0.6 0.3
Library and information sciences ................................................................... 0.6 0.5 0.6
Other fields..................................................................................................... 1.5 1.2 2.3
SOURCE: U.S. Department of Education, National Center for Education Statistics, Postsecondary Education Quick Information System, Surveyon Distance Education at Postsecondary Education Institutions, 1998–1999.
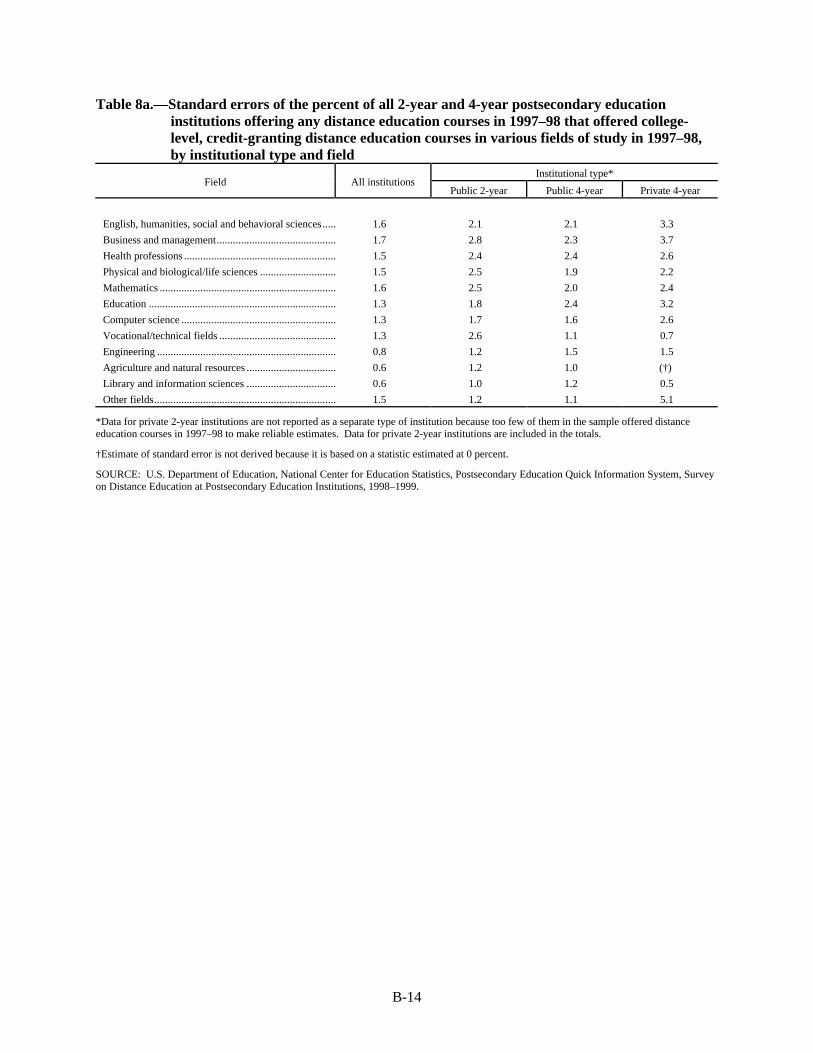
B-14
Table 8a.—Standard errors of the percent of all 2-year and 4-year postsecondary educationinstitutions offering any distance education courses in 1997–98 that offered college-level, credit-granting distance education courses in various fields of study in 1997–98,by institutional type and field
Institutional type*Field All institutions
Public 2-year Public 4-year Private 4-year
English, humanities, social and behavioral sciences..... 1.6 2.1 2.1 3.3
Business and management............................................ 1.7 2.8 2.3 3.7
Health professions ........................................................ 1.5 2.4 2.4 2.6
Physical and biological/life sciences ............................ 1.5 2.5 1.9 2.2
Mathematics ................................................................. 1.6 2.5 2.0 2.4
Education ..................................................................... 1.3 1.8 2.4 3.2
Computer science ......................................................... 1.3 1.7 1.6 2.6
Vocational/technical fields ........................................... 1.3 2.6 1.1 0.7
Engineering .................................................................. 0.8 1.2 1.5 1.5
Agriculture and natural resources ................................. 0.6 1.2 1.0 (†)
Library and information sciences ................................. 0.6 1.0 1.2 0.5
Other fields................................................................... 1.5 1.2 1.1 5.1
*Data for private 2-year institutions are not reported as a separate type of institution because too few of them in the sample offered distanceeducation courses in 1997–98 to make reliable estimates. Data for private 2-year institutions are included in the totals.
†Estimate of standard error is not derived because it is based on a statistic estimated at 0 percent.
SOURCE: U.S. Department of Education, National Center for Education Statistics, Postsecondary Education Quick Information System, Surveyon Distance Education at Postsecondary Education Institutions, 1998–1999.
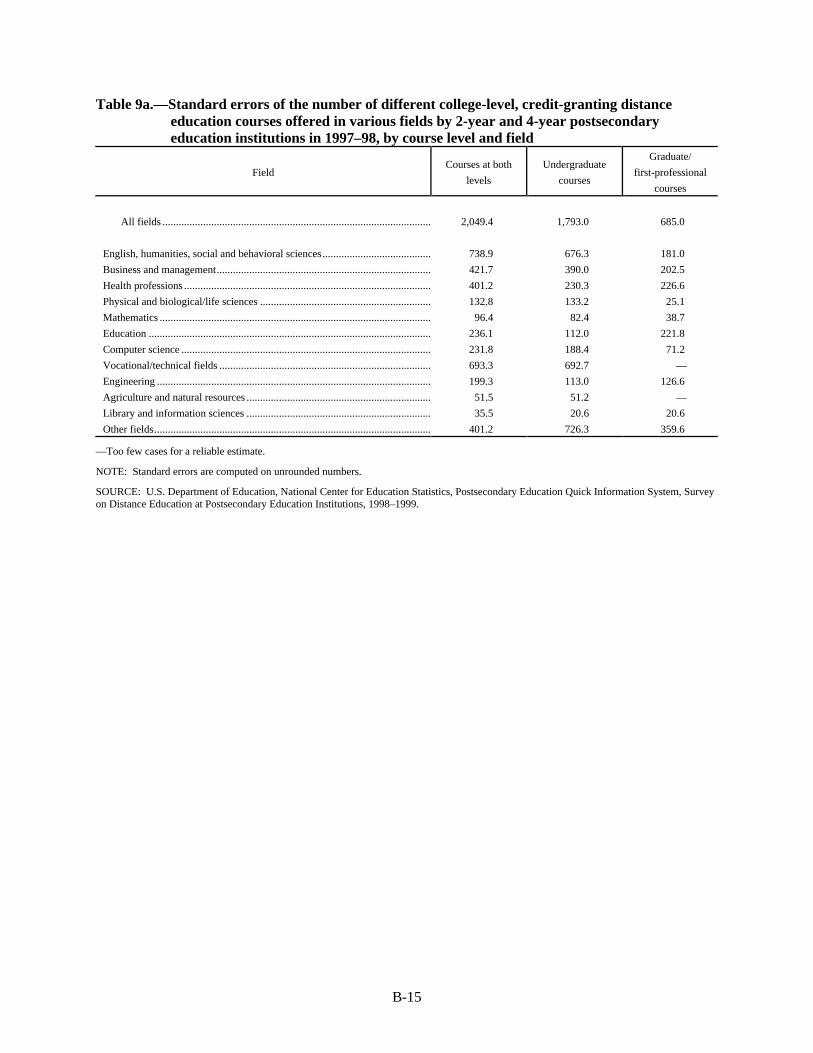
B-15
Table 9a.—Standard errors of the number of different college-level, credit-granting distanceeducation courses offered in various fields by 2-year and 4-year postsecondaryeducation institutions in 1997–98, by course level and field
FieldCourses at both
levels
Undergraduate
courses
Graduate/
first-professional
courses
All fields ................................................................................................... 2,049.4 1,793.0 685.0
English, humanities, social and behavioral sciences........................................ 738.9 676.3 181.0
Business and management............................................................................... 421.7 390.0 202.5
Health professions ........................................................................................... 401.2 230.3 226.6
Physical and biological/life sciences ............................................................... 132.8 133.2 25.1
Mathematics .................................................................................................... 96.4 82.4 38.7
Education ........................................................................................................ 236.1 112.0 221.8
Computer science ............................................................................................ 231.8 188.4 71.2
Vocational/technical fields .............................................................................. 693.3 692.7 —
Engineering ..................................................................................................... 199.3 113.0 126.6
Agriculture and natural resources .................................................................... 51.5 51.2 —
Library and information sciences .................................................................... 35.5 20.6 20.6
Other fields...................................................................................................... 401.2 726.3 359.6
—Too few cases for a reliable estimate.
NOTE: Standard errors are computed on unrounded numbers.
SOURCE: U.S. Department of Education, National Center for Education Statistics, Postsecondary Education Quick Information System, Surveyon Distance Education at Postsecondary Education Institutions, 1998–1999.

B-16
Table 10a.—Standard errors of the number of different college-level, credit-granting distanceeducation courses offered in various fields by 2-year and 4-year postsecondaryeducation institutions in 1997–98, by institutional type and field
Institutional type*Field All institutions
Public 2-year Public 4-year Private 4-year
All fields ................................................................ 2,049.4 1,043.0 1,097.5 1,271.5
English, humanities, social and behavioral sciences..... 738.9 442.2 468.4 289.9
Business and management............................................ 421.7 234.4 251.5 349.9
Health professions ........................................................ 401.2 139.8 18.4 251.2
Physical and biological/life sciences ............................ 132.8 78.5 97.7 —
Mathematics ................................................................. 96.4 47.7 53.3 —
Education ..................................................................... 236.1 68.2 162.7 —
Computer science ......................................................... 231.8 85.2 36.7 —
Vocational/technical fields ........................................... 693.3 694.6 39.5 —
Engineering .................................................................. 199.3 — 65.4 —
Agriculture and natural resources ................................. 51.5 — 37.7 —
Library and information sciences ................................. 35.5 — 21.2 —
Other fields................................................................... 401.2 261.3 41.8 860.8
*Data for private 2-year institutions are not reported as a separate type of institution because too few of them in the sample offered distanceeducation courses in 1997–98 to make reliable estimates. Data for private 2-year institutions are included in the totals.
—Too few cases for a reliable estimate.
NOTE: Standard errors are computed on unrounded numbers.
SOURCE: U.S. Department of Education, National Center for Education Statistics, Postsecondary Education Quick Information System, Surveyon Distance Education at Postsecondary Education Institutions, 1998–1999.

B-17
Table 11a.—Standard errors of the number of enrollments in college-level, credit-granting distanceeducation courses offered in various fields at 2-year and 4-year postsecondaryeducation institutions in 1997–98, by course level and field
Field
Enrollments in
courses at both
levels
Enrollments in
undergraduate
courses
Enrollments in
graduate/
first-professional
courses
All fields ................................................................................................... 58,551.7 38,877.6 33,368.9
English, humanities, social and behavioral sciences........................................ 23,494.8 22,175.4 6,207.0
Business and management............................................................................... 8,574.0 7,327.5 3,377.1
Health professions ........................................................................................... 6,759.6 5,090.5 3,456.6
Physical and biological/life sciences ............................................................... 6,329.2 6,409.5 415.4
Mathematics .................................................................................................... 2,193.6 2,150.6 204.2
Education ........................................................................................................ 30,247.7 3,375.5 30,317.2
Computer science ............................................................................................ 6,341.0 4,893.4 2,107.0
Vocational/technical fields .............................................................................. 8,129.9 8,095.3 —
Engineering ..................................................................................................... 1,884.0 1,055.1 1,139.0
Agriculture and natural resources .................................................................... 2,495.0 2,499.2 —
Library and information sciences .................................................................... 1,697.8 1,602.0 472.3
Other fields...................................................................................................... 8,817.3 5,893.5 4,555.9
—Too few cases for a reliable estimate.
NOTE: Standard errors are computed on unrounded numbers.
SOURCE: U.S. Department of Education, National Center for Education Statistics, Postsecondary Education Quick Information System, Surveyon Distance Education at Postsecondary Education Institutions, 1998–1999.

B-18
Table 12a.—Standard errors of the number of enrollments in college-level, credit-granting distanceeducation courses offered in various fields at 2-year and 4-year postsecondaryeducation institutions in 1997–98, by institutional type and field
Institutional type*Field All institutions
Public 2-year Public 4-year Private 4-year
All fields ................................................................ 58,551.7 33,463.4 20,451.4 32,993.2
English, humanities, social and behavioral sciences..... 23,494.8 19,056.3 8,796.4 7,176.1
Business and management............................................ 8,574.0 4,678.5 5,678.1 5,903.3
Health professions ........................................................ 6,759.6 4,121.4 2,875.4 3,096.1
Physical and biological/life sciences ............................ 6,329.2 6,216.2 1,629.2 —
Mathematics ................................................................. 2,193.6 1,890.0 969.0 —
Education ..................................................................... 30,247.7 2,713.8 3,287.7 —
Computer science ......................................................... 6,341.0 3,113.5 1,062.6 —
Vocational/technical fields ........................................... 8,129.9 6,788.4 606.4 —
Engineering .................................................................. 1,884.0 — 944.9 —
Agriculture and natural resources ................................. 2,495.0 — 2,337.3 —
Library and information sciences ................................. 1,697.8 — 506.7 —
Other fields................................................................... 8,817.3 4,349.1 539.5 5,570.3
*Data for private 2-year institutions are not reported as a separate type of institution because too few of them in the sample offered distanceeducation courses in 1997–98 to make reliable estimates. Data for private 2-year institutions are included in the totals.
—Too few cases for a reliable estimate.
NOTE: Standard errors are computed on unrounded numbers.
SOURCE: U.S. Department of Education, National Center for Education Statistics, Postsecondary Education Quick Information System, Surveyon Distance Education at Postsecondary Education Institutions, 1998–1999.
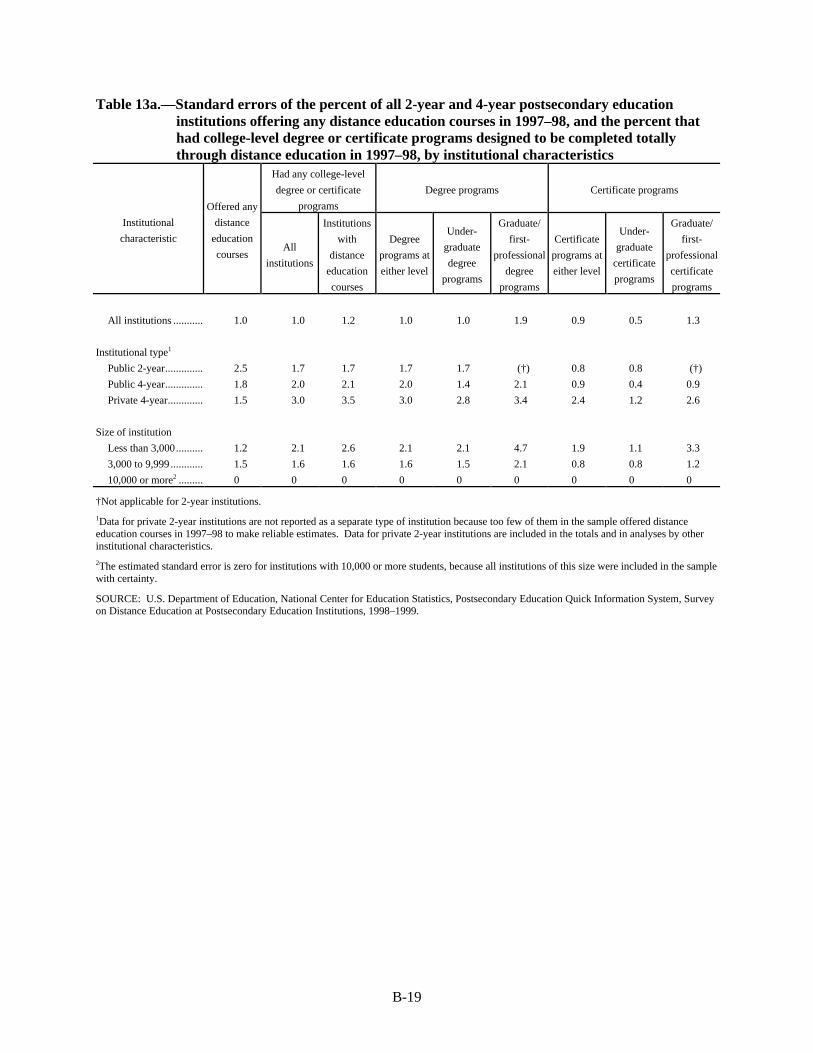
B-19
Table 13a.—Standard errors of the percent of all 2-year and 4-year postsecondary educationinstitutions offering any distance education courses in 1997–98, and the percent thathad college-level degree or certificate programs designed to be completed totallythrough distance education in 1997–98, by institutional characteristics
Had any college-level
degree or certificate
programs
Degree programs Certificate programs
Institutional
characteristic
Offered any
distance
education
coursesAll
institutions
Institutions
with
distance
education
courses
Degree
programs at
either level
Under-
graduate
degree
programs
Graduate/
first-
professional
degree
programs
Certificate
programs at
either level
Under-
graduate
certificate
programs
Graduate/
first-
professional
certificate
programs
All institutions ........... 1.0 1.0 1.2 1.0 1.0 1.9 0.9 0.5 1.3
Institutional type1
Public 2-year.............. 2.5 1.7 1.7 1.7 1.7 (†) 0.8 0.8 (†)
Public 4-year.............. 1.8 2.0 2.1 2.0 1.4 2.1 0.9 0.4 0.9
Private 4-year............. 1.5 3.0 3.5 3.0 2.8 3.4 2.4 1.2 2.6
Size of institution
Less than 3,000.......... 1.2 2.1 2.6 2.1 2.1 4.7 1.9 1.1 3.3
3,000 to 9,999............ 1.5 1.6 1.6 1.6 1.5 2.1 0.8 0.8 1.2
10,000 or more2 ......... 0 0 0 0 0 0 0 0 0
†Not applicable for 2-year institutions.
1Data for private 2-year institutions are not reported as a separate type of institution because too few of them in the sample offered distanceeducation courses in 1997–98 to make reliable estimates. Data for private 2-year institutions are included in the totals and in analyses by otherinstitutional characteristics.
2The estimated standard error is zero for institutions with 10,000 or more students, because all institutions of this size were included in the samplewith certainty.
SOURCE: U.S. Department of Education, National Center for Education Statistics, Postsecondary Education Quick Information System, Surveyon Distance Education at Postsecondary Education Institutions, 1998–1999.

B-20
Table 14a.—Standard errors of the percent of 2-year and 4-year postsecondary educationinstitutions offering any distance education courses in 1997–98 that had college-leveldegree or certificate programs in various fields that were designed to be completedtotally through distance education, by level and field
Degree programs Certificate programs
Field Undergraduate
degree programs
Graduate/
first-professional
degree programs
Undergraduate
certificate
programs
Graduate/
first-professional
certificate
programs
English, humanities, social and behavioral sciences..... 0.4 0.6 (††) 0.6
Business and management............................................ 0.5 1.2 0.2 0.7
Health professions ........................................................ 0.4 1.0 0.3 0.8
Physical and biological/life sciences ............................ 0.1 0.3 0.1 0.2
Mathematics ................................................................. (†) (††) (†) (††)
Education ..................................................................... 0.3 1.1 0.2 0.2
Computer science ......................................................... 0.3 0.6 0.2 0.3
Vocational/technical fields ........................................... 0.5 (††) 0.4 (†)
Engineering .................................................................. 0.3 0.6 (††) 0.3
Agriculture and natural resources ................................. 0.1 (††) 0.2 (††)
Library and information sciences ................................. (†) (††) (††) (††)
Liberal/general studies.................................................. 0.6 (††) (†) (†)
Other fields................................................................... 0.5 0.7 0.2 (†)
†Estimate of standard error is not derived because it is based on a statistic estimated at 0 percent.
††Standard error rounds to less than 0.1.
SOURCE: U.S. Department of Education, National Center for Education Statistics, Postsecondary Education Quick Information System, Surveyon Distance Education at Postsecondary Education Institutions, 1998–1999.
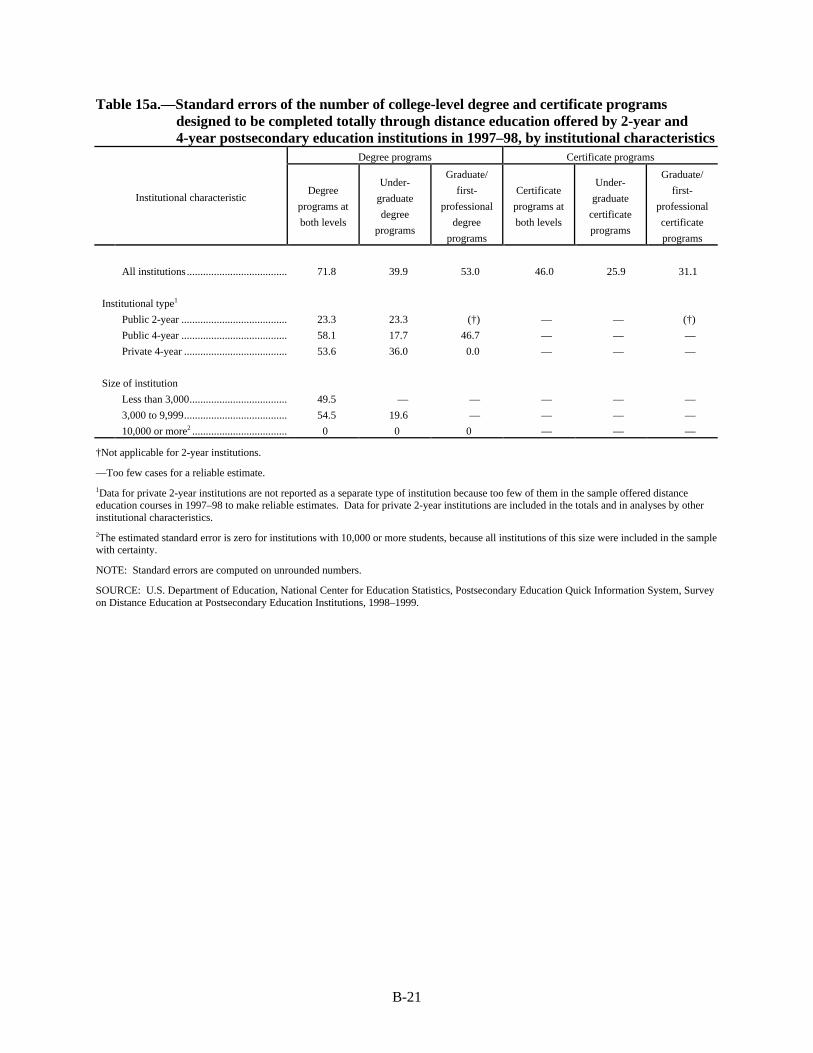
B-21
Table 15a.—Standard errors of the number of college-level degree and certificate programsdesigned to be completed totally through distance education offered by 2-year and4-year postsecondary education institutions in 1997–98, by institutional characteristics
Degree programs Certificate programs
Institutional characteristicDegree
programs at
both levels
Under-
graduate
degree
programs
Graduate/
first-
professional
degree
programs
Certificate
programs at
both levels
Under-
graduate
certificate
programs
Graduate/
first-
professional
certificate
programs
All institutions ..................................... 71.8 39.9 53.0 46.0 25.9 31.1
Institutional type1
Public 2-year ....................................... 23.3 23.3 (†) — — (†)
Public 4-year ....................................... 58.1 17.7 46.7 — — —
Private 4-year ...................................... 53.6 36.0 0.0 — — —
Size of institution
Less than 3,000.................................... 49.5 — — — — —
3,000 to 9,999...................................... 54.5 19.6 — — — —
10,000 or more2 ................................... 0 0 0 — — —
†Not applicable for 2-year institutions.
—Too few cases for a reliable estimate.
1Data for private 2-year institutions are not reported as a separate type of institution because too few of them in the sample offered distanceeducation courses in 1997–98 to make reliable estimates. Data for private 2-year institutions are included in the totals and in analyses by otherinstitutional characteristics.
2The estimated standard error is zero for institutions with 10,000 or more students, because all institutions of this size were included in the samplewith certainty.
NOTE: Standard errors are computed on unrounded numbers.
SOURCE: U.S. Department of Education, National Center for Education Statistics, Postsecondary Education Quick Information System, Surveyon Distance Education at Postsecondary Education Institutions, 1998–1999.
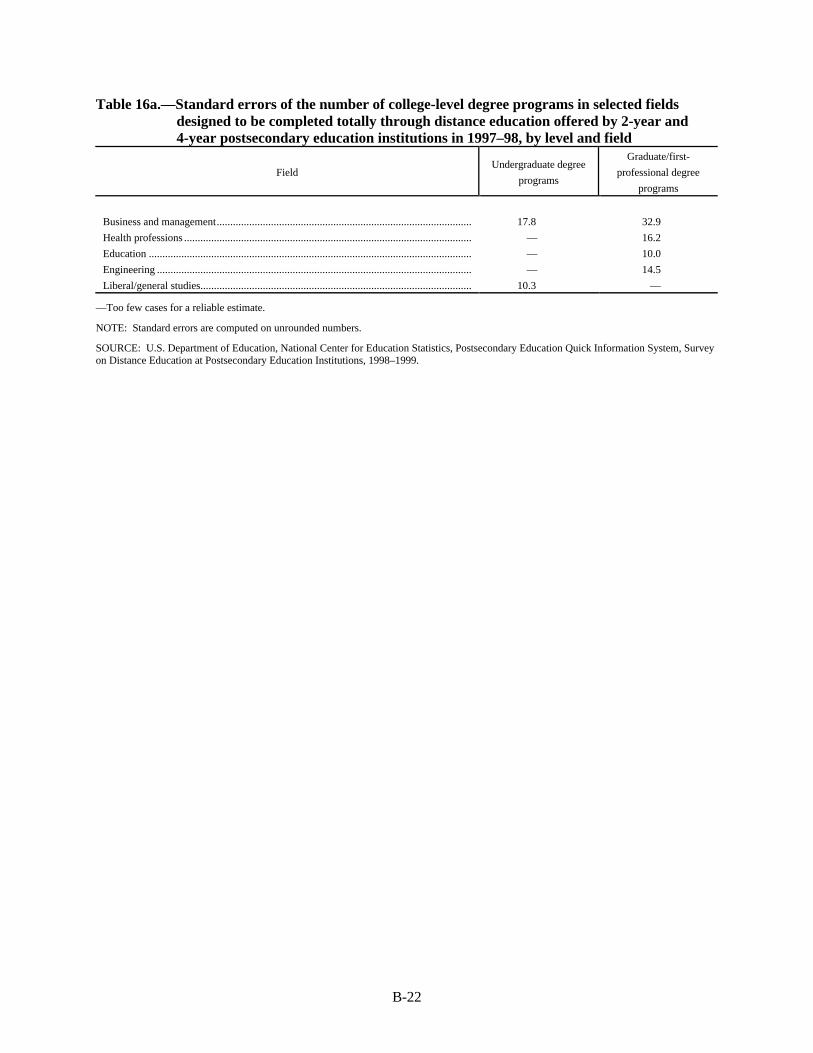
B-22
Table 16a.—Standard errors of the number of college-level degree programs in selected fieldsdesigned to be completed totally through distance education offered by 2-year and4-year postsecondary education institutions in 1997–98, by level and field
FieldUndergraduate degree
programs
Graduate/first-
professional degree
programs
Business and management.............................................................................................. 17.8 32.9
Health professions .......................................................................................................... — 16.2
Education ....................................................................................................................... — 10.0
Engineering .................................................................................................................... — 14.5
Liberal/general studies.................................................................................................... 10.3 —
—Too few cases for a reliable estimate.
NOTE: Standard errors are computed on unrounded numbers.
SOURCE: U.S. Department of Education, National Center for Education Statistics, Postsecondary Education Quick Information System, Surveyon Distance Education at Postsecondary Education Institutions, 1998–1999.
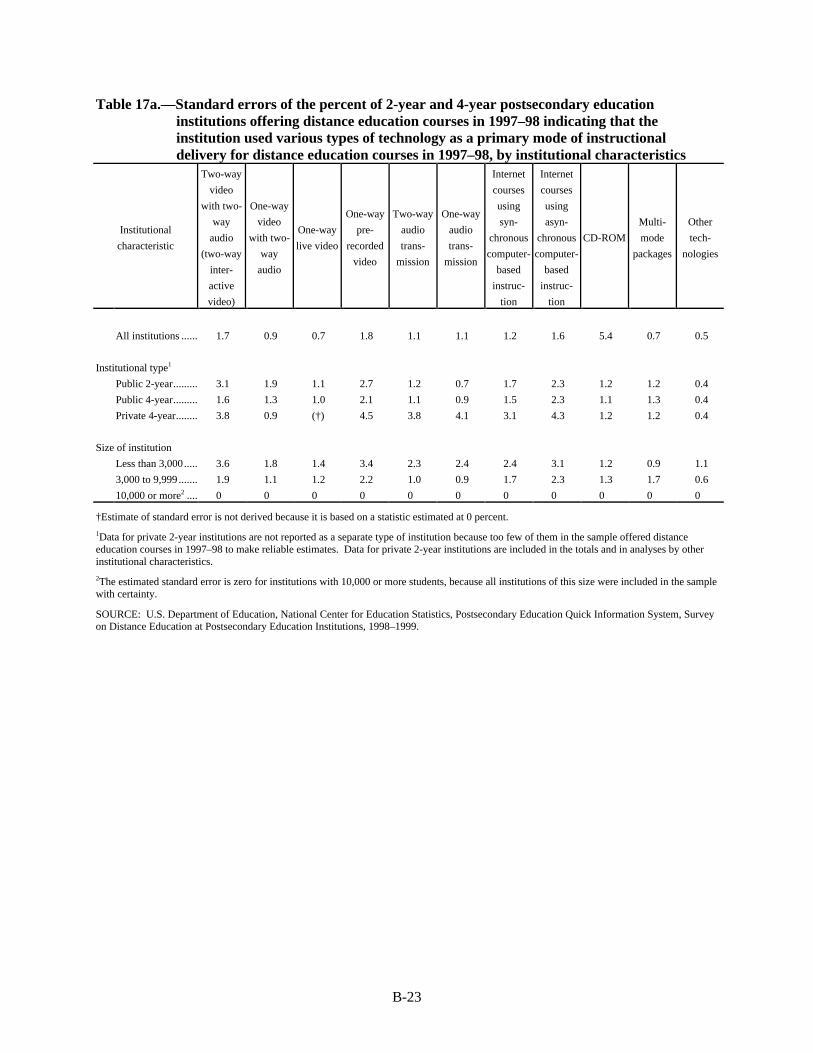
B-23
Table 17a.—Standard errors of the percent of 2-year and 4-year postsecondary educationinstitutions offering distance education courses in 1997–98 indicating that theinstitution used various types of technology as a primary mode of instructionaldelivery for distance education courses in 1997–98, by institutional characteristics
Institutional
characteristic
Two-way
video
with two-
way
audio
(two-way
inter-
active
video)
One-way
video
with two-
way
audio
One-way
live video
One-way
pre-
recorded
video
Two-way
audio
trans-
mission
One-way
audio
trans-
mission
Internet
courses
using
syn-
chronous
computer-
based
instruc-
tion
Internet
courses
using
asyn-
chronous
computer-
based
instruc-
tion
CD-ROM
Multi-
mode
packages
Other
tech-
nologies
All institutions ...... 1.7 0.9 0.7 1.8 1.1 1.1 1.2 1.6 5.4 0.7 0.5
Institutional type1
Public 2-year......... 3.1 1.9 1.1 2.7 1.2 0.7 1.7 2.3 1.2 1.2 0.4
Public 4-year......... 1.6 1.3 1.0 2.1 1.1 0.9 1.5 2.3 1.1 1.3 0.4
Private 4-year........ 3.8 0.9 (†) 4.5 3.8 4.1 3.1 4.3 1.2 1.2 0.4
Size of institution
Less than 3,000..... 3.6 1.8 1.4 3.4 2.3 2.4 2.4 3.1 1.2 0.9 1.1
3,000 to 9,999 ....... 1.9 1.1 1.2 2.2 1.0 0.9 1.7 2.3 1.3 1.7 0.6
10,000 or more2 .... 0 0 0 0 0 0 0 0 0 0 0
†Estimate of standard error is not derived because it is based on a statistic estimated at 0 percent.
1Data for private 2-year institutions are not reported as a separate type of institution because too few of them in the sample offered distanceeducation courses in 1997–98 to make reliable estimates. Data for private 2-year institutions are included in the totals and in analyses by otherinstitutional characteristics.
2The estimated standard error is zero for institutions with 10,000 or more students, because all institutions of this size were included in the samplewith certainty.
SOURCE: U.S. Department of Education, National Center for Education Statistics, Postsecondary Education Quick Information System, Surveyon Distance Education at Postsecondary Education Institutions, 1998–1999.
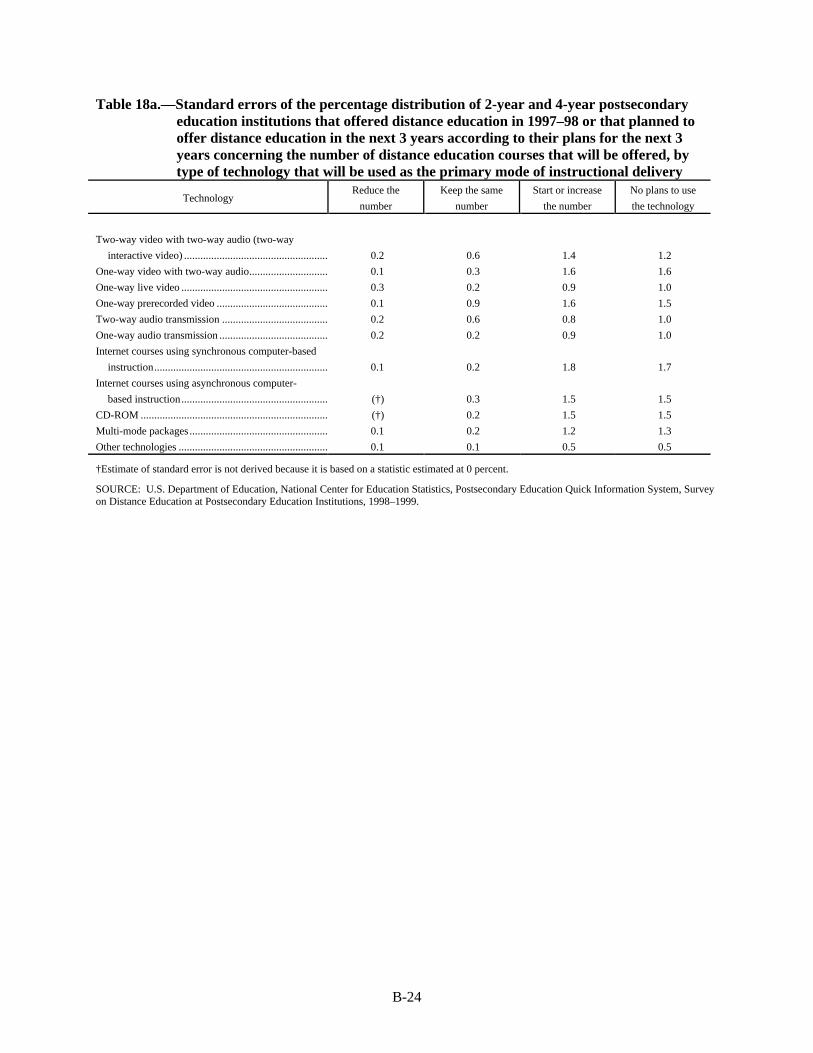
B-24
Table 18a.—Standard errors of the percentage distribution of 2-year and 4-year postsecondaryeducation institutions that offered distance education in 1997–98 or that planned tooffer distance education in the next 3 years according to their plans for the next 3years concerning the number of distance education courses that will be offered, bytype of technology that will be used as the primary mode of instructional delivery
TechnologyReduce the
number
Keep the same
number
Start or increase
the number
No plans to use
the technology
Two-way video with two-way audio (two-way
interactive video) ..................................................... 0.2 0.6 1.4 1.2
One-way video with two-way audio............................. 0.1 0.3 1.6 1.6
One-way live video ...................................................... 0.3 0.2 0.9 1.0
One-way prerecorded video ......................................... 0.1 0.9 1.6 1.5
Two-way audio transmission ....................................... 0.2 0.6 0.8 1.0
One-way audio transmission ........................................ 0.2 0.2 0.9 1.0
Internet courses using synchronous computer-based
instruction................................................................ 0.1 0.2 1.8 1.7
Internet courses using asynchronous computer-
based instruction...................................................... (†) 0.3 1.5 1.5
CD-ROM ..................................................................... (†) 0.2 1.5 1.5
Multi-mode packages ................................................... 0.1 0.2 1.2 1.3
Other technologies ....................................................... 0.1 0.1 0.5 0.5
†Estimate of standard error is not derived because it is based on a statistic estimated at 0 percent.
SOURCE: U.S. Department of Education, National Center for Education Statistics, Postsecondary Education Quick Information System, Surveyon Distance Education at Postsecondary Education Institutions, 1998–1999.
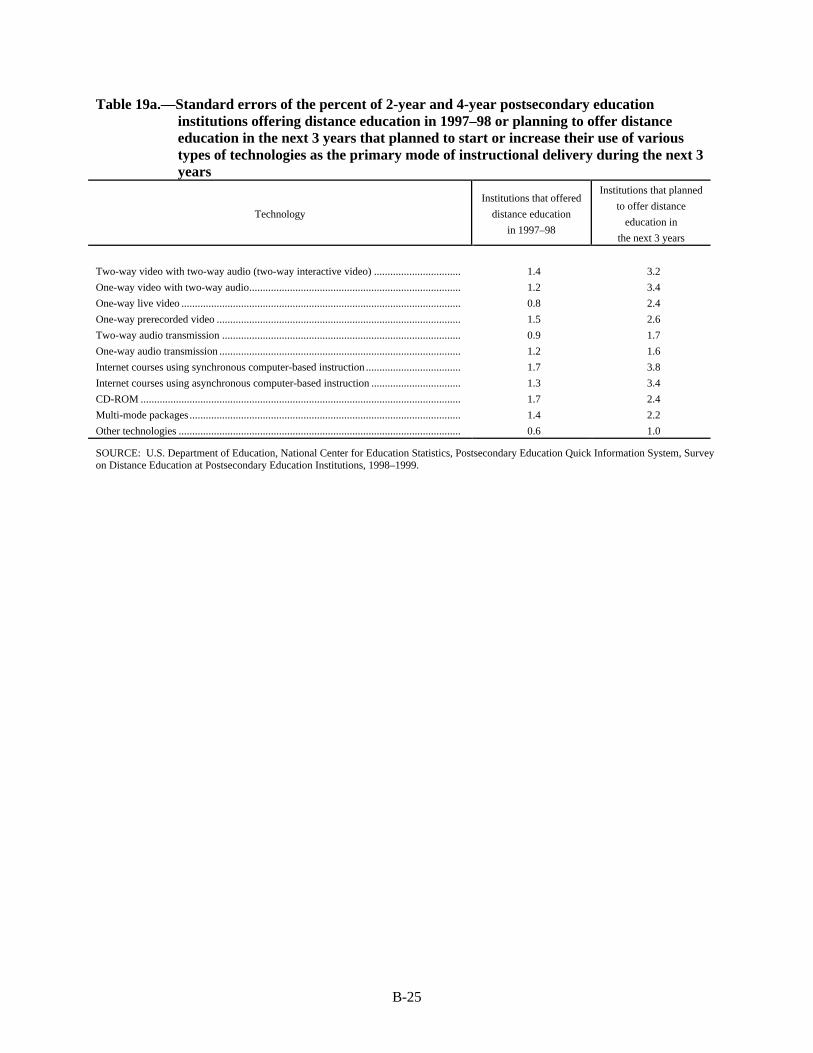
B-25
Table 19a.—Standard errors of the percent of 2-year and 4-year postsecondary educationinstitutions offering distance education in 1997–98 or planning to offer distanceeducation in the next 3 years that planned to start or increase their use of varioustypes of technologies as the primary mode of instructional delivery during the next 3years
Technology
Institutions that offered
distance education
in 1997–98
Institutions that planned
to offer distance
education in
the next 3 years
Two-way video with two-way audio (two-way interactive video) ................................ 1.4 3.2
One-way video with two-way audio.............................................................................. 1.2 3.4
One-way live video ....................................................................................................... 0.8 2.4
One-way prerecorded video .......................................................................................... 1.5 2.6
Two-way audio transmission ........................................................................................ 0.9 1.7
One-way audio transmission ......................................................................................... 1.2 1.6
Internet courses using synchronous computer-based instruction ................................... 1.7 3.8
Internet courses using asynchronous computer-based instruction ................................. 1.3 3.4
CD-ROM ...................................................................................................................... 1.7 2.4
Multi-mode packages .................................................................................................... 1.4 2.2
Other technologies ........................................................................................................ 0.6 1.0
SOURCE: U.S. Department of Education, National Center for Education Statistics, Postsecondary Education Quick Information System, Surveyon Distance Education at Postsecondary Education Institutions, 1998–1999.
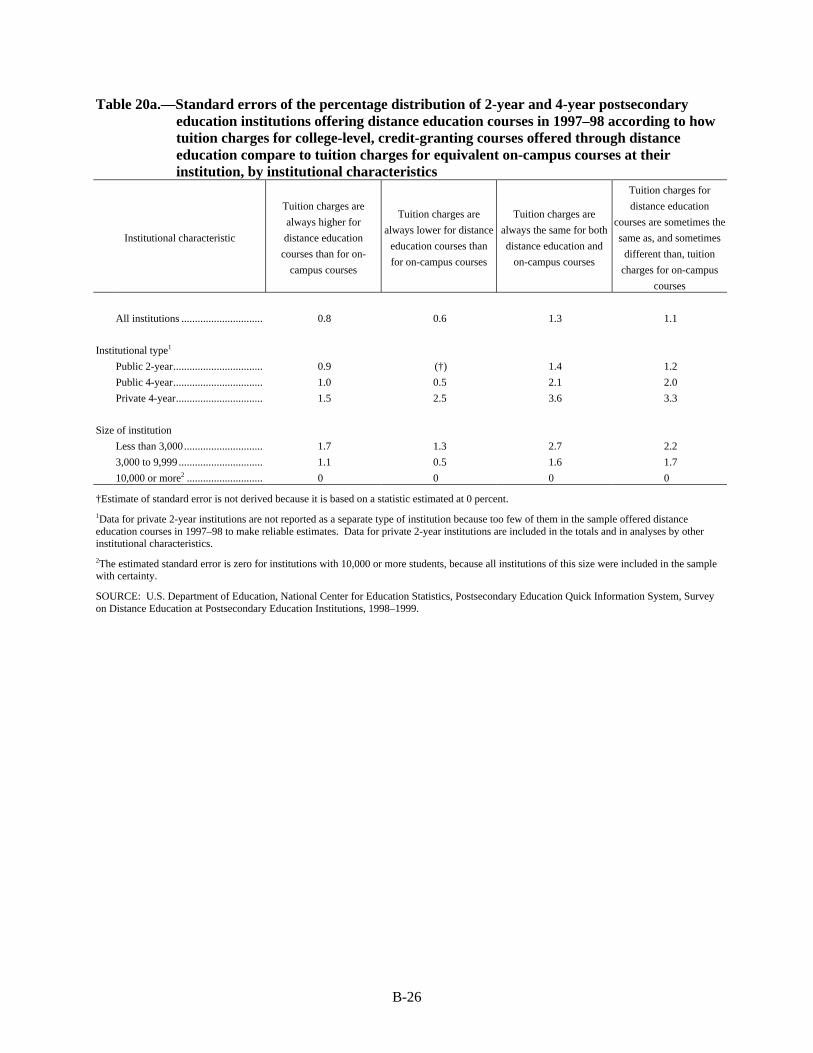
B-26
Table 20a.—Standard errors of the percentage distribution of 2-year and 4-year postsecondaryeducation institutions offering distance education courses in 1997–98 according to howtuition charges for college-level, credit-granting courses offered through distanceeducation compare to tuition charges for equivalent on-campus courses at theirinstitution, by institutional characteristics
Institutional characteristic
Tuition charges are
always higher for
distance education
courses than for on-
campus courses
Tuition charges are
always lower for distance
education courses than
for on-campus courses
Tuition charges are
always the same for both
distance education and
on-campus courses
Tuition charges for
distance education
courses are sometimes the
same as, and sometimes
different than, tuition
charges for on-campus
courses
All institutions .............................. 0.8 0.6 1.3 1.1
Institutional type1
Public 2-year................................. 0.9 (†) 1.4 1.2
Public 4-year................................. 1.0 0.5 2.1 2.0
Private 4-year................................ 1.5 2.5 3.6 3.3
Size of institution
Less than 3,000............................. 1.7 1.3 2.7 2.2
3,000 to 9,999 ............................... 1.1 0.5 1.6 1.7
10,000 or more2 ............................ 0 0 0 0
†Estimate of standard error is not derived because it is based on a statistic estimated at 0 percent.
1Data for private 2-year institutions are not reported as a separate type of institution because too few of them in the sample offered distanceeducation courses in 1997–98 to make reliable estimates. Data for private 2-year institutions are included in the totals and in analyses by otherinstitutional characteristics.
2The estimated standard error is zero for institutions with 10,000 or more students, because all institutions of this size were included in the samplewith certainty.
SOURCE: U.S. Department of Education, National Center for Education Statistics, Postsecondary Education Quick Information System, Surveyon Distance Education at Postsecondary Education Institutions, 1998–1999.
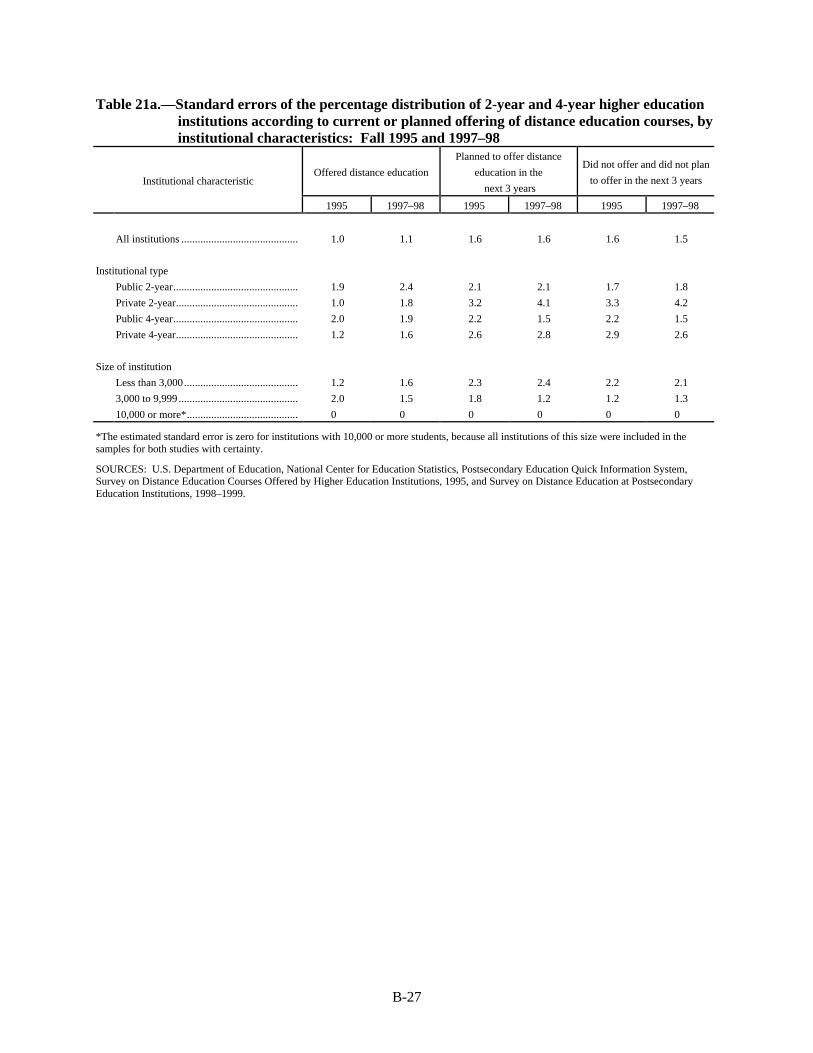
B-27
Table 21a.—Standard errors of the percentage distribution of 2-year and 4-year higher educationinstitutions according to current or planned offering of distance education courses, byinstitutional characteristics: Fall 1995 and 1997–98
Offered distance education
Planned to offer distance
education in the
next 3 years
Did not offer and did not plan
to offer in the next 3 yearsInstitutional characteristic
1995 1997–98 1995 1997–98 1995 1997–98
All institutions ........................................... 1.0 1.1 1.6 1.6 1.6 1.5
Institutional type
Public 2-year.............................................. 1.9 2.4 2.1 2.1 1.7 1.8
Private 2-year............................................. 1.0 1.8 3.2 4.1 3.3 4.2
Public 4-year.............................................. 2.0 1.9 2.2 1.5 2.2 1.5
Private 4-year............................................. 1.2 1.6 2.6 2.8 2.9 2.6
Size of institution
Less than 3,000.......................................... 1.2 1.6 2.3 2.4 2.2 2.1
3,000 to 9,999 ............................................ 2.0 1.5 1.8 1.2 1.2 1.3
10,000 or more*......................................... 0 0 0 0 0 0
*The estimated standard error is zero for institutions with 10,000 or more students, because all institutions of this size were included in thesamples for both studies with certainty.
SOURCES: U.S. Department of Education, National Center for Education Statistics, Postsecondary Education Quick Information System,Survey on Distance Education Courses Offered by Higher Education Institutions, 1995, and Survey on Distance Education at PostsecondaryEducation Institutions, 1998–1999.
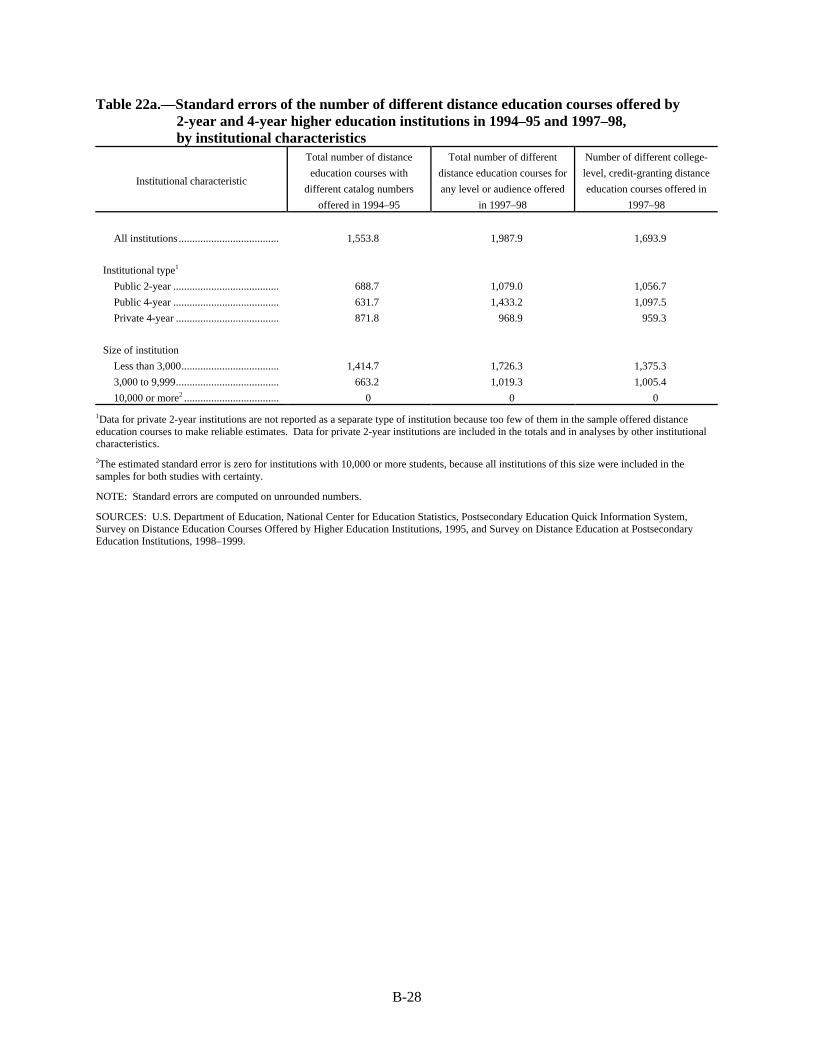
B-28
Table 22a.—Standard errors of the number of different distance education courses offered by2-year and 4-year higher education institutions in 1994–95 and 1997–98,by institutional characteristics
Institutional characteristic
Total number of distance
education courses with
different catalog numbers
offered in 1994–95
Total number of different
distance education courses for
any level or audience offered
in 1997–98
Number of different college-
level, credit-granting distance
education courses offered in
1997–98
All institutions ..................................... 1,553.8 1,987.9 1,693.9
Institutional type1
Public 2-year ....................................... 688.7 1,079.0 1,056.7
Public 4-year ....................................... 631.7 1,433.2 1,097.5
Private 4-year ...................................... 871.8 968.9 959.3
Size of institution
Less than 3,000.................................... 1,414.7 1,726.3 1,375.3
3,000 to 9,999...................................... 663.2 1,019.3 1,005.4
10,000 or more2 ................................... 0 0 0
1Data for private 2-year institutions are not reported as a separate type of institution because too few of them in the sample offered distanceeducation courses to make reliable estimates. Data for private 2-year institutions are included in the totals and in analyses by other institutionalcharacteristics.
2The estimated standard error is zero for institutions with 10,000 or more students, because all institutions of this size were included in thesamples for both studies with certainty.
NOTE: Standard errors are computed on unrounded numbers.
SOURCES: U.S. Department of Education, National Center for Education Statistics, Postsecondary Education Quick Information System,Survey on Distance Education Courses Offered by Higher Education Institutions, 1995, and Survey on Distance Education at PostsecondaryEducation Institutions, 1998–1999.
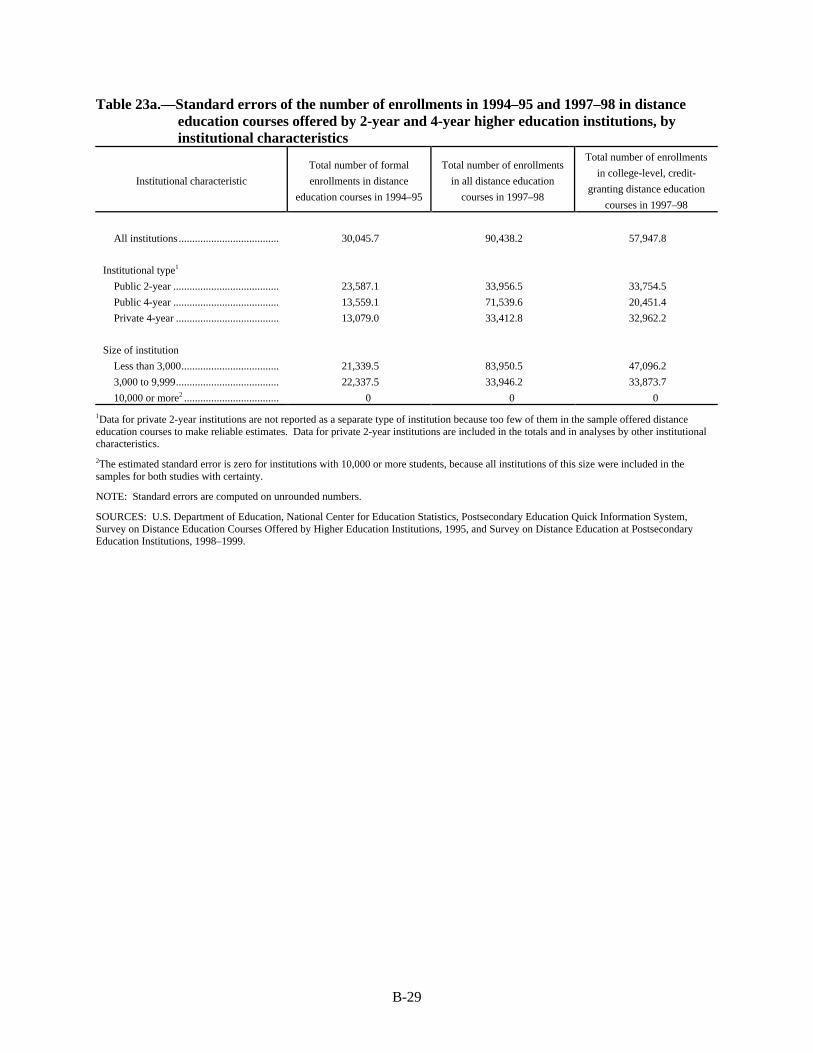
B-29
Table 23a.—Standard errors of the number of enrollments in 1994–95 and 1997–98 in distanceeducation courses offered by 2-year and 4-year higher education institutions, byinstitutional characteristics
Institutional characteristic
Total number of formal
enrollments in distance
education courses in 1994–95
Total number of enrollments
in all distance education
courses in 1997–98
Total number of enrollments
in college-level, credit-
granting distance education
courses in 1997–98
All institutions ..................................... 30,045.7 90,438.2 57,947.8
Institutional type1
Public 2-year ....................................... 23,587.1 33,956.5 33,754.5
Public 4-year ....................................... 13,559.1 71,539.6 20,451.4
Private 4-year ...................................... 13,079.0 33,412.8 32,962.2
Size of institution
Less than 3,000.................................... 21,339.5 83,950.5 47,096.2
3,000 to 9,999...................................... 22,337.5 33,946.2 33,873.7
10,000 or more2 ................................... 0 0 0
1Data for private 2-year institutions are not reported as a separate type of institution because too few of them in the sample offered distanceeducation courses to make reliable estimates. Data for private 2-year institutions are included in the totals and in analyses by other institutionalcharacteristics.
2The estimated standard error is zero for institutions with 10,000 or more students, because all institutions of this size were included in thesamples for both studies with certainty.
NOTE: Standard errors are computed on unrounded numbers.
SOURCES: U.S. Department of Education, National Center for Education Statistics, Postsecondary Education Quick Information System,Survey on Distance Education Courses Offered by Higher Education Institutions, 1995, and Survey on Distance Education at PostsecondaryEducation Institutions, 1998–1999.
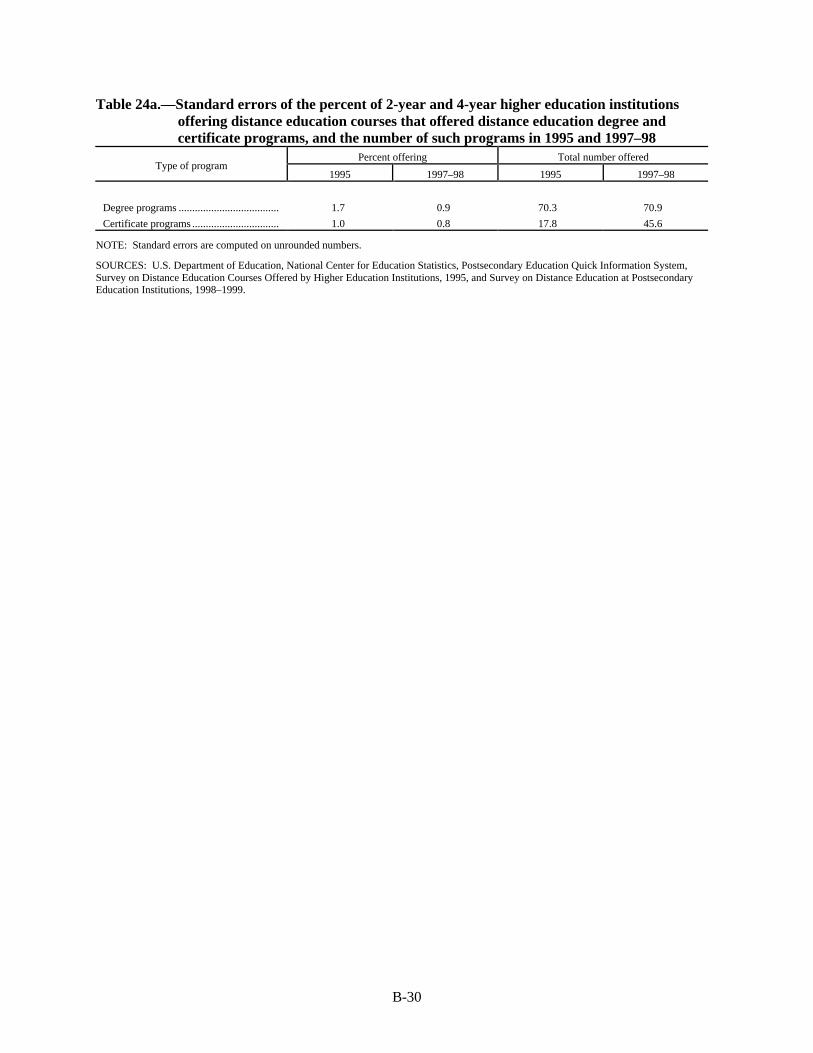
B-30
Table 24a.—Standard errors of the percent of 2-year and 4-year higher education institutionsoffering distance education courses that offered distance education degree andcertificate programs, and the number of such programs in 1995 and 1997–98
Percent offering Total number offeredType of program
1995 1997–98 1995 1997–98
Degree programs ..................................... 1.7 0.9 70.3 70.9
Certificate programs ................................ 1.0 0.8 17.8 45.6
NOTE: Standard errors are computed on unrounded numbers.
SOURCES: U.S. Department of Education, National Center for Education Statistics, Postsecondary Education Quick Information System,Survey on Distance Education Courses Offered by Higher Education Institutions, 1995, and Survey on Distance Education at PostsecondaryEducation Institutions, 1998–1999.

B-31
Table 25a.—Standard errors of the percent of 2-year and 4-year higher education institutionsoffering distance education courses that used various types of technologies to deliverdistance education courses in 1995 and 1997–98
Technology 1995 1997–98
Two-way video with two-way audio (two-way interactive video)............................................. 1.5 1.6
One-way video with two-way audio.......................................................................................... 1.3 0.9
One-way live video.................................................................................................................... 0.9 0.6
One-way prerecorded video....................................................................................................... 1.6 1.7
Audiographics ........................................................................................................................... 0.4 (†)
Two-way audio transmission..................................................................................................... 1.3 0.8
One-way audio transmission ..................................................................................................... 1.7 0.8
Internet courses using synchronous computer-based instruction ............................................... (†) 1.1
Internet courses using asynchronous computer-based instruction.............................................. (†) 1.6
Two-way online (computer-based) interactions during instruction............................................ 1.3 (†)
Other computer-based technology (e.g., Internet)...................................................................... 2.0 (†)
CD-ROM................................................................................................................................... (†) 0.6
Multi-mode packages ................................................................................................................ (†) 0.7
Other technologies..................................................................................................................... 1.0 0.3
†Statistic not estimated for that year.
SOURCES: U.S. Department of Education, National Center for Education Statistics, Postsecondary Education Quick Information System,Survey on Distance Education Courses Offered by Higher Education Institutions, 1995, and Survey on Distance Education at PostsecondaryEducation Institutions, 1998–1999.

B-32
Table 26a.—Standard errors of the percent of 2-year and 4-year higher education institutionsoffering distance education courses that used selected types of technologies to deliverdistance education courses in 1995 and 1997–98, by institutional type
1995 1997–98
Institutional type* Institutional type*Technology
Public 2-year Public 4-year Private 4-year Public 2-year Public 4-year Private 4-year
Two-way video with two-way audio (two-
way interactive video)............................. 2.7 1.6 5.9 3.1 1.6 3.8
One-way video with two-way audio............ 2.2 2.0 5.8 1.7 1.3 0.8
One-way prerecorded video ........................ 2.7 2.1 5.3 2.7 2.1 3.6
Internet courses using synchronous
computer-based instruction..................... (†) (†) (†) 1.8 1.5 3.2
Internet courses using asynchronous
computer-based instruction..................... (†) (†) (†) 2.3 2.3 3.9
Two-way online (computer-based)
interactions during instruction ................ 1.1 1.4 6.6 (†) (†) (†)
Other computer-based technology (e.g.,
Internet) .................................................. 2.2 2.0 6.8 (†) (†) (†)
†Statistic not estimated for that year.
*Data for private 2-year institutions are not reported as a separate type of institution because too few of them in the sample offered distanceeducation courses to make reliable estimates.
SOURCES: U.S. Department of Education, National Center for Education Statistics, Postsecondary Education Quick Information System,Survey on Distance Education Courses Offered by Higher Education Institutions, 1995, and Survey on Distance Education at PostsecondaryEducation Institutions, 1998–1999.

B-33
Table 27.—Standard errors for the figures and for data not shown in tablesItem Estimate Standard error
Figure 1: Percentage distribution of 2-year and 4-year postsecondary education institutions offeringdistance education courses in 1997–98 according to number of enrollments in distance educationcoursesEnrollments in all courses
1-80 enrollments ............................................................................................................................ 26 1.681-300 enrollments ........................................................................................................................ 26 1.8301-800 enrollments ...................................................................................................................... 22 1.4More than 800 enrollments ............................................................................................................ 26 1.0
Enrollments in college-level, credit-granting courses0 enrollments.................................................................................................................................. 2 0.71-80 enrollments ............................................................................................................................ 26 1.681-300 enrollments ........................................................................................................................ 25 1.6301-800 enrollments ...................................................................................................................... 22 1.4More than 800 enrollments ............................................................................................................ 25 1.0
Figure 2: Percentage distribution of 2-year and 4-year postsecondary education institutions offeringdistance education courses in 1997–98 according to number of distance education coursesTotal courses
1-5 courses ..................................................................................................................................... 23 1.66-15 courses ................................................................................................................................... 25 1.816-35 courses ................................................................................................................................. 28 1.3More than 35 courses ..................................................................................................................... 24 1.3
College-level, credit-granting courses0 courses ........................................................................................................................................ 2 0.71-5 courses ..................................................................................................................................... 23 1.76-15 courses ................................................................................................................................... 26 2.016-35 courses ................................................................................................................................. 27 1.3More than 35 courses ..................................................................................................................... 23 1.3
Figure 3: Percentage distribution of 2-year and 4-year postsecondary education institutions with
variable charges for distance education courses compared with equivalent on-campus courses in
1997–98 indicating how those tuition charges for distance education courses differ
Always higher .................................................................................................................................... 38 4.2
Always lower...................................................................................................................................... 14 5.1
Sometimes higher and sometimes lower............................................................................................. 48 4.4
Figure 4: Percentage distribution of 2-year and 4-year postsecondary education institutions offering
distance education courses in 1997–98 indicating whether the institution adds any special fees to
college-level, credit-granting distance education courses that are not added to on-campus courses
Always added ..................................................................................................................................... 13 1.1
Sometimes added................................................................................................................................ 21 1.3
Not added ........................................................................................................................................... 66 1.7
Figure 5: Percentage distribution of 2-year and 4-year postsecondary education institutions with thesame tuition for distance education and comparable on-campus courses in 1997–98 indicating whetherthe institution adds any special fees to college-level, credit-granting distance education courses thatare not added to on-campus courses
Always added ..................................................................................................................................... 11 1.1
Sometimes added................................................................................................................................ 15 1.5
Not added ........................................................................................................................................... 74 1.9
Chapter 6, section on feesPercent of institutions charging both the same tuition and fees .......................................................... 57 1.7
SOURCE: U.S. Department of Education, National Center for Education Statistics, Postsecondary Education Quick Information System, Surveyon Distance Education at Postsecondary Education Institutions, 1998–1999.

B-34

C-1
Appendix C
Survey Questionnaire

C-2

C-3
Info
rmat
ion
Copy
Do
not c
ompl
ete
U.S. DEPARTMENT OF EDUCATION FORM APPROVEDNATIONAL CENTER FOR EDUCATION STATISTICS O.M.B. No.: 1850-0733
WASHINGTON, D.C. 20208-5651 EXPIRATION DATE: 07/1999
DISTANCE EDUCATION ATPOSTSECONDARY EDUCATION INSTITUTIONS
POSTSECONDARY EDUCATION QUICK INFORMATION SYSTEMThis survey is authorized by law (P.L. 103-382). While participation in this survey is voluntary, your cooperation is criticalto make the results of this survey comprehensive, accurate, and timely.
Definition of distance education for this survey refers to education or training courses delivered to remote (off-campus) location(s) via audio, video (live or prerecorded), or computer technologies, including both synchronous andasynchronous instruction. For purposes of this survey, courses conducted exclusively on campus are not included in thisdefinition of distance education (although some on-campus instruction or testing may be involved); courses conductedexclusively via written correspondence are also not included (although some instruction may be conducted via writtencorrespondence). Distance education also does not include courses in which the instructor travels to a remote site todeliver instruction in person. Distance education courses may include a small amount of on-campus course or lab work,on-campus exams, or occasional on-campus meetings.
The survey is designed to be completed by the person(s) most knowledgeable about your institution’s distance educationcourse offerings. Since we are interested in all such courses offered by your institution, we ask that you consult with yourcolleagues in other departments/offices that may also offer distance education courses.
IF ABOVE INSTITUTION INFORMATION IS INCORRECT, PLEASE UPDATE DIRECTLY ON LABEL.
Name of Person Completing This Form: _________________________________________________________________
Title/Position: ______________________________________________________________________________________
Telephone Number: ___________________________________ E-mail: ______________________________________
THANK YOU. PLEASE KEEP A COPY OF THIS SURVEY FOR YOUR RECORDS.
PLEASE RETURN COMPLETED FORM TO: IF YOU HAVE ANY QUESTIONS, CONTACT:
Lewis (900442) Laurie Lewis at WestatWESTAT 800-937-8281, Ext. 8284 or 301-251-82841650 Research Boulevard Fax: 800-254-0984Rockville, Maryland 20850 E-mail: [email protected]
According to the Paperwork Reduction Act of 1995, no persons are required to respond to a collection of information unless it displays a validOMB control number. The valid OMB control number for this information collection is 1850-0733. The time required to complete thisinformation collection is estimated to average 30 minutes per response, including the time to review instructions, search existing dataresources, gather the data needed, and complete and review the information collection. If you have any comments concerning the accuracy ofthe time estimate or suggestions for improving this form, please write to: U.S. Department of Education, Washington, DC 20202-4651. If youhave any comments or concerns regarding the status of your individual submission of this form, write directly to: National Center for EducationStatistics, 555 New Jersey Avenue, NW, Washington, DC 20208.
PEQIS Form No. 9, 10/1998
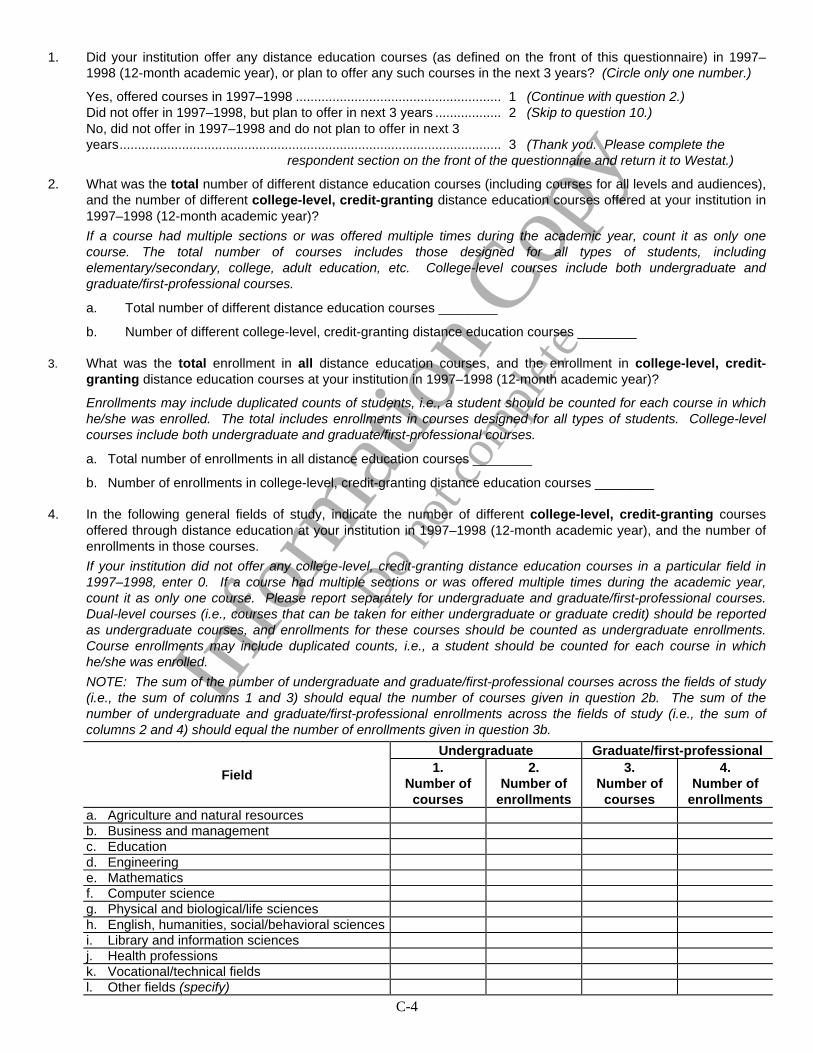
C-4
Info
rmat
ion
Copy
Do
not c
ompl
ete
1. Did your institution offer any distance education courses (as defined on the front of this questionnaire) in 1997–1998 (12-month academic year), or plan to offer any such courses in the next 3 years? (Circle only one number.)
Yes, offered courses in 1997–1998 ........................................................ 1 (Continue with question 2.)Did not offer in 1997–1998, but plan to offer in next 3 years .................. 2 (Skip to question 10.)No, did not offer in 1997–1998 and do not plan to offer in next 3years........................................................................................................ 3 (Thank you. Please complete the
respondent section on the front of the questionnaire and return it to Westat.)
2. What was the total number of different distance education courses (including courses for all levels and audiences),and the number of different college-level, credit-granting distance education courses offered at your institution in1997–1998 (12-month academic year)?
If a course had multiple sections or was offered multiple times during the academic year, count it as only onecourse. The total number of courses includes those designed for all types of students, includingelementary/secondary, college, adult education, etc. College-level courses include both undergraduate andgraduate/first-professional courses.
a. Total number of different distance education courses ________
b. Number of different college-level, credit-granting distance education courses ________
3. What was the total enrollment in all distance education courses, and the enrollment in college-level, credit-granting distance education courses at your institution in 1997–1998 (12-month academic year)?
Enrollments may include duplicated counts of students, i.e., a student should be counted for each course in whichhe/she was enrolled. The total includes enrollments in courses designed for all types of students. College-levelcourses include both undergraduate and graduate/first-professional courses.
a. Total number of enrollments in all distance education courses ________
b. Number of enrollments in college-level, credit-granting distance education courses ________
4. In the following general fields of study, indicate the number of different college-level, credit-granting coursesoffered through distance education at your institution in 1997–1998 (12-month academic year), and the number ofenrollments in those courses.
If your institution did not offer any college-level, credit-granting distance education courses in a particular field in1997–1998, enter 0. If a course had multiple sections or was offered multiple times during the academic year,count it as only one course. Please report separately for undergraduate and graduate/first-professional courses.Dual-level courses (i.e., courses that can be taken for either undergraduate or graduate credit) should be reportedas undergraduate courses, and enrollments for these courses should be counted as undergraduate enrollments.Course enrollments may include duplicated counts, i.e., a student should be counted for each course in whichhe/she was enrolled.
NOTE: The sum of the number of undergraduate and graduate/first-professional courses across the fields of study(i.e., the sum of columns 1 and 3) should equal the number of courses given in question 2b. The sum of thenumber of undergraduate and graduate/first-professional enrollments across the fields of study (i.e., the sum ofcolumns 2 and 4) should equal the number of enrollments given in question 3b.
Undergraduate Graduate/first-professional
Field 1.Number of
courses
2.Number of
enrollments
3.Number of
courses
4.Number of
enrollmentsa. Agriculture and natural resourcesb. Business and managementc. Educationd. Engineeringe. Mathematicsf. Computer scienceg. Physical and biological/life sciencesh. English, humanities, social/behavioral sciencesi. Library and information sciencesj. Health professionsk. Vocational/technical fieldsl. Other fields (specify)

C-5
Info
rmat
ion
Copy
Do
not c
ompl
ete
5. In academic year 1997–1998, did your institution have any college-level degree or certificate programs designed tobe completed totally through distance education? (Include only degree or certificate programs that are based oncredit-granting courses; include programs that may require a small amount of on-campus course or lab work,clinical work in hospitals, or similar arrangements, and baccalaureate degree completion programs.)
Yes .................. 1 (Continue with question 6.) No .................... 2 (Skip to question 7.)
6. How many different college-level degree or certificate programs designed to be completed totally through distanceeducation did your institution offer in 1997–1998 (12-month academic year)? (Include only degree or certificateprograms that are based on credit-granting courses; include programs that may require a small amount of on-campus course or lab work, clinical work in hospitals, or similar arrangements, and baccalaureate degreecompletion programs.)
Please report separately for undergraduate and graduate/first-professional programs, and for degree and certificateprograms. Report the total number of programs, and then provide a breakout of the total by field of study.
UndergraduateGraduate/first-professionalDistance education degree and certificate programs
Degree Certificate Degree Certificate
A. Total number of distance education degree and certificate programs basedon credit-granting courses
B. Field of study for credit-based degree and certificate programs:(Sum of a through m below must equal the totals given on line A.)a. Agriculture and natural resourcesb. Business and managementc. Educationd. Engineeringe. Mathematicsf. Computer scienceg. Physical and biological/life sciencesh. English, humanities, social and behavioral sciencesi. Library and information sciencesj. Health professionsk. Vocational/technical fieldsl. Liberal/general studiesm. Other (specify)
7. How do the tuition charges for college-level, credit-granting courses offered through distance education at yourinstitution compare to tuition charges for equivalent on-campus courses? (Circle only one number.)
Tuition charges are always higher for distance education courses than for on-campus courses .. 1Tuition charges are always lower for distance education courses than for on-campus courses.... 2Tuition charges are always the same for both distance education and on-campus courses ......... 3Tuition charges for distance education courses are sometimes the same as, and sometimes different than, tuition charges for on-campus courses................................................................. 4
When different, the tuition charges for distance education courses are: (Circle only one number.)
Always higher than for on-campus courses ............................................. 1Always lower than for on-campus courses............................................... 2Sometimes higher and sometimes lower than for on-campus courses ... 3
8. Does your institution add any special fees to college-level, credit-granting distance education courses (e.g., feesthat depend on delivery format or location) that are not added to on-campus courses? (Circle only one number.)
Yes, special fees are always added.............................. 1Yes, special fees are sometimes added ....................... 2No, special fees are not added...................................... 3

C-6
Info
rmat
ion
Copy
Do
not c
ompl
ete
9. Which types of technology did your institution use as a primary mode of instructional delivery for distanceeducation courses in 1997–1998 (12-month academic year)? Circle all the technologies that any distanceeducation course used as a primary mode of delivery. If a course used multiple technologies to deliver instruction,but one mode predominated, circle the predominant mode for the course.
a. Two-way video with two-way audio (i.e., two-way interactive video) ........................................................... 1
b. One-way video with two-way audio .............................................................................................................. 2
c. One-way live video ....................................................................................................................................... 3
d. One-way prerecorded video (including prerecorded videotapes provided to students, and televisionbroadcast and cable transmission using prerecorded video)....................................................................... 4
e. Two-way audio transmission (e.g., audio/phone conferencing)................................................................... 5
f. One-way audio transmission (including radio broadcast and prerecorded audiotapes providedto students)................................................................................................................................................... 6
g. Internet courses using synchronous (i.e., simultaneous or “real time”) computer-based instruction(e.g., interactive computer conferencing or Interactive Relay Chat) ............................................................ 7
h. Internet courses using asynchronous (i.e., not simultaneous) computer-based instruction (e.g., e-mail,listservs, and most World Wide Web-based courses) ................................................................................. 8
i. CD-ROM....................................................................................................................................................... 9
j. Multi-mode packages (i.e., a mix of technologies that cannot be assigned to a primary mode) ................. 10
(specify technologies used) ____________________________________________________________
k. Other technologies (specify) ___________________________________________________________ 11
10. In the next 3 years, what are your institution’s plans concerning the number of distance education courses that willbe offered using the following technologies as the primary mode of instructional delivery? If a course will usemultiple technologies to deliver instruction, but one mode will predominate, consider the course under thepredominant mode. (Circle one number on each line.)
Keep same Start or NoReduce number increase plans
a. Two-way video with two-way audio (i.e., two-way interactive video) 1 2 3 4b. One-way video with two-way audio ................................................... 1 2 3 4
c. One-way live video ............................................................................ 1 2 3 4
d. One-way prerecorded video (including prerecorded videotapesprovided to students, and television broadcast and cabletransmission using prerecorded video) ............................................. 1 2 3 4
e. Two-way audio transmission (e.g., audio/phone conferencing)........ 1 2 3 4
f. One-way audio transmission (including radio broadcast andprerecorded audiotapes provided to students) ................................. 1 2 3 4
g. Internet courses using synchronous (i.e., simultaneous or “realtime”) computer-based instruction (e.g., interactive computerconferencing or Interactive Relay Chat)............................................ 1 2 3 4
h. Internet courses using asynchronous (i.e., not simultaneous)computer-based instruction (e.g., e-mail, listservs, and mostWorld Wide Web-based courses) ..................................................... 1 2 3 4
i. CD-ROM............................................................................................ 1 2 3 4
j. Multi-mode packages (i.e., a mix of technologies that cannot beassigned to a primary mode)............................................................. 1 2 3 4
(specify technologies to be used)___________________________
k. Other technologies (specify) ______________________________ 1 2 3 4
Thank you. Please keep a copy for your records.