Digital Video Presentation and Student Performance: A Task ...
14
Kennesaw State University DigitalCommons@Kennesaw State University Faculty Publications 2010 Digital Video Presentation and Student Performance: A Task Technology Fit Perspective Arjan Raven Kennesaw State University, [email protected] Elke M. Leeds Kennesaw State University, [email protected] ChongWoo Park Gwinne College Follow this and additional works at: hps://digitalcommons.kennesaw.edu/facpubs Part of the Educational Psychology Commons is Article is brought to you for free and open access by DigitalCommons@Kennesaw State University. It has been accepted for inclusion in Faculty Publications by an authorized administrator of DigitalCommons@Kennesaw State University. For more information, please contact [email protected]. Recommended Citation Raven, Arjan, Elke Le, and Park Chong Woo. "Digital Video Presentation and Student Performance: A Task Technology Fit Perspective." International Journal of Information & Communication Technology Education 6.1 (2010): 17-29.
Transcript of Digital Video Presentation and Student Performance: A Task ...

Kennesaw State UniversityDigitalCommons@Kennesaw State University
Faculty Publications
2010
Digital Video Presentation and StudentPerformance: A Task Technology Fit PerspectiveArjan RavenKennesaw State University, [email protected]
Elke M. LeedsKennesaw State University, [email protected]
ChongWoo ParkGwinnett College
Follow this and additional works at: https://digitalcommons.kennesaw.edu/facpubs
Part of the Educational Psychology Commons
This Article is brought to you for free and open access by DigitalCommons@Kennesaw State University. It has been accepted for inclusion in FacultyPublications by an authorized administrator of DigitalCommons@Kennesaw State University. For more information, please [email protected].
Recommended CitationRaven, Arjan, Elke Le, and Park Chong Woo. "Digital Video Presentation and Student Performance: A Task Technology FitPerspective." International Journal of Information & Communication Technology Education 6.1 (2010): 17-29.

International Journal of Information and Communication Technology Education, 6(1), 17-29, January-March 2010 17
Copyright © 2010, IGI Global. Copying or distributing in print or electronic forms without written permission of IGI Globalis prohibited.
Keywords: Communication, Digital Video, Ease of Learning, Ease of Use, Oral Presentation, Public Speaking, Task Match, Task Technology Fit
introduCtion
In their 2006 study, Park and Raven proposed an adaptation of the traditional task-technology fit(TTF)model(Goodhue,1995;Goodhue&Thompson,1995).ParkandRavennotedthatthe TTF model, despite its promise, was not used much in IS research. Other models, such as the Technology Acceptance Model (Davis, Bagozzi,&Warshaw, 1992) aremuchmoreextensively used. They identified several rea-
sons why that might be the case. The original model had 12 dimensions of fit, but many of these dimensions seemed to not to be reflective of the fit concept. They redesigned the model, with 3 dimensions of fit that were derived from the work by Eason (1988): (1) TaskMatch(TM),EaseofUse(EOU),andEaseofLearning(EOL).Theyupdatedthemodelbyincluding well-tested measures for performance (measuredasusefulness).ParkandRaventestedthe revised model in the context of knowledge management systems, and confirmed that their revisions worked well in that context. In their
digital Video presentation and student performance:a task technology fit perspective
Arjan Raven, Kennesaw State University, USA
Elke Le, Kennesaw State University, USA
ChongWoo Park, Georgia Gwinnett College, USA
aBstraCtThis paper reports the results of a confirmatory study of a Task Technology Fit (TTF) model. Three dimensions of fit: Task Match, Ease of Use, and Ease of Learning, are applied in the context of digital video tools use for oral presentation in a classroom environment. Students completed a digital video presentation that acted as a substitute for an in-class oral presentation. An existing survey instrument was adapted, and administered to the students to examine the impact on presentation skill and fit to task. Results confirm the adaptation of the TTF model and show significant relationships between variables. The model can be used in other task/technol-ogy combinations. Additional findings suggest that when there is a significant fit between digital video tools (technology) and improvement of oral presentation skills (task), student performance also improves. Digital video can be a useful alternative to in-class presentation when the goal is to improve presentation skill.
DOI:10.4018/jicte.2010091102
IGI PUBLISHING
This paper appears in the publication, International Journal of Information and Communication Technology Education, Volume 6, Issue 1edited by Lawrence A. Tomei © 2010, IGI Global
701 E. Chocolate Avenue, Hershey PA 17033-1240, USATel: 717/533-8845; Fax 717/533-8661; URL-http://www.igi-global.com
ITJ 5566

18 International Journal of Information and Communication Technology Education, 6(1), 17-29, January-March 2010
Copyright © 2010, IGI Global. Copying or distributing in print or electronic forms without written permission of IGI Globalis prohibited.
discussion of possible future research they noted the need for replication of the study in other contexts.
This study seeks to provide such a replica-tion of the Park & Raven model, in a different context, with a different type of technology. Fit is examined between the task of creating a digital video presentation and the technological use of digital video tools. The use of a digital video(DV)presentationinacoursemanage-mentsystem(CMS)isexaminedforitsimpacton student presentation skill and fit to task. The level of fit is then compared to performance by students.
task, technology, fit and performance
Information systems success has been examined through a series of studies, and several theories havebeendeveloped(Park&Raven,2006).The theory that is of particular relevance here istasktechnologyfittheory(Goodhue,1995;Goodhue&Thompson,1995).OneofthekeyconcernsinInformationSystems(IS)researchis to more thoroughly understand the relation-ship between information systems and user performance. TTF theory indicates that when technology and task fit together well, perfor-mancewillbehigher(seeFigure1)(Goodhue,1995;Goodhue&Thompson,1995;Zigurs&Buckland,1998).
GoodhueandThompson(1995)measuredtask-technology fit with 8 factors: quality,locatability, authorization, compatibility, ease
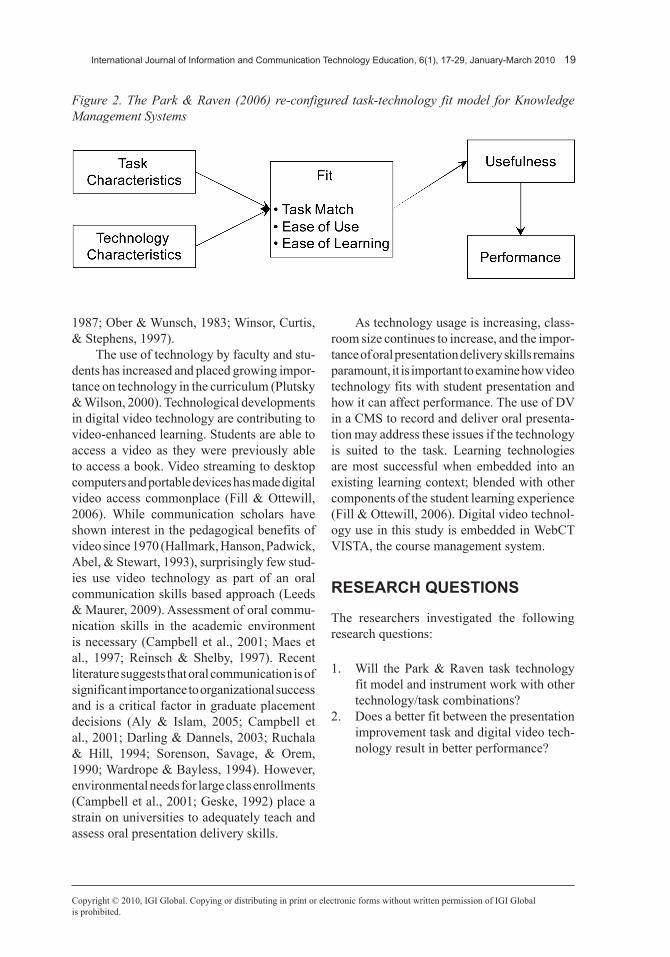
ofuse/training,productiontimeliness,systemsreliability, and relationship with users. A sur-vey containing between two and ten questions for each factor was used with responses on a seven point Likert scale, ranging from strongly disagree to strongly agree. Park and Raven (2006),intheirresearch,re-conceptualizedfit.They identified three aspects of fit: Task Match, Ease of Use, and Ease of Learning as shown in Figure 2. These dimensions were subsequently applied to digital video technology and student presentation task.
digital Video technology and student presentation task
Oral presentation ability is one of the seven most important oral communication skills re-quired by entry-level workers (Maes, Weldy, & Icenogle,1997).Oralpresentationisrequiredby most undergraduate business courses for workplace and career preparation (Campbell, Mothersbaugh,Brammer,&Taylor,2001).Itis increasingly recognized as an essential ele-ment in technical disciplines like engineering, biology, and mathematics (Darling & Dannels, 2003).Inatypicaluniversitysetting,coursesprovide feedback on relatively few oral pre-sentations because of time constraints and the pressures of larger class sizes (Campbell, et al., 2001).Technologymayprovideonesolutionfor higher education to transform educational processes(Leidner&Jarvenpaa,1995)andtobetter address the need for oral communication skills in a time-constrained environment (Ober,
Figure 1. The task-technology fit model adapted from Goodhue & Thompson (1995).
International Journal of Information and Communication Technology Education, 6(1), 17-29, January-March 2010 19
Copyright © 2010, IGI Global. Copying or distributing in print or electronic forms without written permission of IGI Globalis prohibited.
1987;Ober&Wunsch,1983;Winsor,Curtis,&Stephens,1997).
The use of technology by faculty and stu-dents has increased and placed growing impor-tance on technology in the curriculum (Plutsky &Wilson,2000).Technologicaldevelopmentsin digital video technology are contributing to video-enhanced learning. Students are able to access a video as they were previously able to access a book. Video streaming to desktop computers and portable devices has made digital video access commonplace (Fill & Ottewill, 2006). While communication scholars haveshown interest in the pedagogical benefits of videosince1970(Hallmark,Hanson,Padwick,Abel,&Stewart,1993),surprisinglyfewstud-ies use video technology as part of an oral communication skills based approach (Leeds &Maurer,2009).Assessmentoforalcommu-nication skills in the academic environment isnecessary(Campbelletal.,2001;Maesetal., 1997; Reinsch& Shelby, 1997). Recentliterature suggests that oral communication is of significant importance to organizational success and is a critical factor in graduate placement decisions (Aly & Islam, 2005; Campbell etal.,2001;Darling&Dannels,2003;Ruchala& Hill, 1994; Sorenson, Savage, & Orem,1990;Wardrope&Bayless,1994).However,environmental needs for large class enrollments (Campbelletal.,2001;Geske,1992)placeastrain on universities to adequately teach and assess oral presentation delivery skills.
As technology usage is increasing, class-room size continues to increase, and the impor-tance of oral presentation delivery skills remains paramount, it is important to examine how video technology fits with student presentation and how it can affect performance. The use of DV in a CMS to record and deliver oral presenta-tion may address these issues if the technology is suited to the task. Learning technologies are most successful when embedded into an existinglearningcontext;blendedwithothercomponents of the student learning experience (Fill&Ottewill,2006).Digitalvideotechnol-ogy use in this study is embedded in WebCT VISTA, the course management system.
researCh Questions
The researchers investigated the following research questions:
1. Will the Park & Raven task technology fit model and instrument work with other technology/taskcombinations?
2. Does a better fit between the presentation improvement task and digital video tech-nology result in better performance?
Figure 2. The Park & Raven (2006) re-configured task-technology fit model for Knowledge Management Systems

20 International Journal of Information and Communication Technology Education, 6(1), 17-29, January-March 2010
Copyright © 2010, IGI Global. Copying or distributing in print or electronic forms without written permission of IGI Globalis prohibited.
researCh model
task, technology
GoodhueandThompson(1995)definedtasksas“… the actions carried out by individuals in turn-inginputsintooutputs”(p.216).Theydefinedtechnology as “computer systems (hardware, software,anddata)andusersupportservices(training,helplines,etc.)providedtoassistusersin their tasks” (Goodhue & Thompson, 1995, p. 216).Finally,tasktechnologyfitwasdefinedas “the degree to which a technology assists an individual in performing his or her portfolio of tasks”(Goodhue&Thompson,1995,p.216).In this study, the task is to improve presenta-tion skill. The technology is the combination of digital video equipment and software, and the course management system.
Conceptualization of task technology fit
IS researchers have used user evaluations of systems as a surrogate for IS success. A user evaluation means an assessment is made by a user about certain qualities of information systems (Goodhue,1995). It isbasedon theassumption that users can evaluate a system service by comparing what they obtain with whattheyrequiretodotheirjob.Eason(1998)argued that this is a ‘match’ or ‘fit’ evaluation where functionality is matched against task requirements, and usability is matched against user characteristics.
Task match was defined as “the ability of system functionality to serve user task needs” (Eason,1988,p.191).Easeofuse(EOU)wasdefinedbyEason(1988)as“theusabilityofsystemoperatingprocedures”(p.191).Eason(1988)definedeaseoflearning(EOL)as“theadequacy of the user support methods provided for user learning” (p. 191). For each of theconstructs, Task Match, Ease of Use and Ease ofLearning,ParkandRaven(2006)developedmeasures for the context of knowledge manage-ment systems. The items used in their study
were adapted for the digital video context of this research. The appendix displays the items.
Performance was measured by Park and Raven(2006)asusefulness,aconstruct firstoperationalized by Rai et al. (2002). In thisstudy, two self-reported measures of perfor-mance have also been added. Usefulness was found to be directly affected by fit (Park and Raven,2006).AsshowninFigure2,useful-ness is expected to influence (self-reported)performance, rather than the other way around. Furthermore, usefulness is expected to have a mediating effect on the relationship between fit and performance.
researCh methods
sample
The fit between the task of creating a digital video presentation and the technological use of digital video tools was tested through the use of a purposive sample of two intact classes taught by one of the authors. Purposive sampling is nonprobability sampling where the investigator selects a subpopulation that is thought to be representative of the typical population (Single-ton&Straits,2005).Thisstudyfocusedonaparticular group of students at a static point in time. “These designs are often used when the experimental treatment is administered to intact groups, such as school classes, making random assignment of individual subjects impossible” (Singleton&Straits,2005,p.207).Asampleof 62 students was drawn from a population of 560 second year undergraduate business infor-mation systems course at a large southeastern state university in the fall of 2006.
digital Video technology presentation
The students in the sample completed a digital video presentation that acted as a substitute for an in-class oral presentation. Classroom lectures on oral presentation planning, preparation, and delivery were presented in class. Students were assigned related reading, discussion, and video

International Journal of Information and Communication Technology Education, 6(1), 17-29, January-March 2010 21
Copyright © 2010, IGI Global. Copying or distributing in print or electronic forms without written permission of IGI Globalis prohibited.
file analysis as part of their course work. They were placed into teams and asked to complete a twelve minute video presentation. Teams were trained on DV quality characteristics and DV editing software. Groups received trainingoncapturingfootageandeditingtape;handouts and instruction were provided. Film clip examples that demonstrated the adequate or inadequate use of lighting, the importance of a tripod for steady filming, and the problems associated with background noise interference were shown. The same mini-DV cameras, equip-ment, and editing software were used for each team. Apple Macintosh iMovie© digital video editing software was used for the creation of the DV files. QuickTime© player was required for viewing. Students identified an appropriate location and acquired the necessary equipment from the campus presentation technology department. They filmed the oral presentation in one continuous take. If students wished to re-tape, they were required to start again at the beginning of the presentation. Inserting or edit-ing footage was not permitted. Students then compressed video files and uploaded them to their associated course using the WebCT Vista course management system.
Students viewed the presentation through the CMS while faculty and independent study assessors evaluated student performance based on presentation and video quality char-acteristics. A preliminary study conducted by the researchers focused an investigation into public speaking and communication education literature to identify a set of delivery skills that are associated with successful oral presentation delivery(Leeds,Raven,&Brawley,2007).Fiveprimarytraitswereidentified:(1)eyecontactandtheabsenceofreading,(2)vocalvariety,(3)credibilityandconfidence,(4)absenceofnervousmannerisms,and(5)gesturesandthepurposeful use of the body. These traits incorpo-rated elements of oral communication delivery skill found in successful interactions.
survey instrument
Upon completion of the video presentation, surveys were distributed to students through WebCT Vista. Students received $10 in par-ticipant compensation and course bonus points equaling one-percent of their course grade for completing the survey. The survey instrument was adapted from items used in the Park and Raven(2006)study.Severalitemsweredroppedfrom the original instrument because they did not work in the digital video context, and most were rewritten to reflect the specific tasks and technologies of this study. The final survey consists of 4 demographic questions and 23 7-pointLikertscaleitems(1=verystronglydisagree, 2 = strongly disagree, 3 = disagree, 4=neutral,5=agree,6=stronglyagree,7=verystronglyagree).Thespecificconstructsand measures in the survey questionnaire are listed in the appendix.
analysis and results
partial least squares analysis
PartialLeastSquares(PLS)analysis(withSmartPLS©)wasusedastheprimaryanalysistoolinthis study. PLS is an extension of the multiple linear regression model. It is also referred to as path analysis with composites, or soft model-ing(Marcoulides&Saunders,2006).PLSisa method for constructing predictive models versus causative models. It is an advanced statistical method that is based on the linear transition from a large number of descriptors to a smaller number of latent variables. PLS computes optimal linear relationships between latent variables in an attempt to account for as much of the manifest factor variation as pos-sible(Tobias,2007).Itfirstestimatesloadingsof indicators on constructs and then iteratively estimates causal relationships among constructs (Fornell&Bookstein,1982).Inoneanalysis,anentire model such as the one shown in Figure 2 is analyzed.

22 International Journal of Information and Communication Technology Education, 6(1), 17-29, January-March 2010
Copyright © 2010, IGI Global. Copying or distributing in print or electronic forms without written permission of IGI Globalis prohibited.
PLS analysis was considered appropri-ate for this study because it places minimal demands on sample size and distributional as-sumptions(Chin,1998;Fornell&Bookstein,1982). PLS analysis is also appropriate fortesting theoretical models in the early stages ofdevelopment(Fornell&Bookstein,1982).This study is a confirmatory study of an initial attempt to develop a theoretical model of task-technology fit in the KMS adoption context. It tests the same model in a blended technology context, using digital video tools and a course management system.
measurement model
Before testing the structural model, the measure-ment model was established by examining the psychometric properties of the measures.
Convergent Validity
Convergent validity was assessed through standardized loadings for each factor model. For convergent validity, the shared variance between each item and its associated construct should exceed the error variance. This trans-latesintoaloadingof0.707orgreater.Table1displays the loadings, which are all larger than the0.707threshold.
Three measures were used to assess internal consistency of each of the constructs: Cron-bach’s alpha, composite reliability, and average varianceextracted(AVE).TheCronbach’salphaand composite reliability value are generally expectedtobe0.7orhigher,indicatingexten-siveevidenceofreliability.Valuesof0.80orhigher indicate exemplary evidence (Bearden, Netemeyer&Mobley,1993;Yi&Davis,2003).Atthesametime,ascorebetween0.60and0.70may also be acceptable for exploratory research (Hair,Andersonetal.,1998;Nunally,1967).Table 1 shows the Cronbach’s alpha, composite reliability, and average variance extracted values for each construct. Four constructs have an alphavalueof0.8orhigher.OnlyTechnologyCharacteristics has a low –but still acceptable -
valueat0.671.Compositereliabilityvaluesforallfiveconstructsare.8orhigher,indicatingexemplary composite reliability.
The third measure of construct reliabil-ity, average variance extracted, compares the amount of variance obtained from indicators with variance due to measurement error (Chin, 1998,p.321;Fornell&Larcker,1981).Ac-ceptable levels for average variance extracted are0.5orhigher(Chin,1998).Allconstructsmore than meet this criterion. Taken together, the three measures indicate that the constructs are very reliable.
discriminant Validity
To test for discriminant validity we investigated each indicator’s loading on its own construct, and its cross-loadings on all other constructs were calculated. The results, displayed in Table 2, show that each indicator has a higher loading with its intended construct than its cross-loading with any other construct. Each block of indica-tors loads higher for its intended construct than for indicators from other constructs, establishing discriminant validity.
structural model
Figure 3 shows the structural model as it was tested in our study. The relationships between constructs are measured through the path coef-ficients and their significance levels, and the explanatory power of the model is expressed as R² values. The path coefficients were com-puted, and bootstrapping with 500 re-samples was used to determine the t-values for each of therelationships.At-valueof2.58orgreaterindicates a significance level of 0.01. All four relationships were positive and significant at the 0.01 level. This further confirms the findings ofParkandRaven(2006).
The variance in the three dependent con-structs;Fit,Usefulness,andPerformance,wasexplained to varying degrees. The R² value of 0.33 for Fit means that 33% of the vari-ance is explained by Task Characteristics and Technology Characteristics. For Usefulness,

International Journal of Information and Communication Technology Education, 6(1), 17-29, January-March 2010 23
Copyright © 2010, IGI Global. Copying or distributing in print or electronic forms without written permission of IGI Globalis prohibited.
29% of the variation is explained by Fit, and Usefulness in turn explains 30% of the variance in Performance. In the Park and Raven study, 48%ofFitwasexplainedbyTaskCharacter-istics, Technology Characteristics, and Content Characteristics. The lower number in this study (33%) suggests that theremaybe additionalconstructs that would explain Fit.
disCussion and impliCations
The primary research question of this study asked if the TTF model would work with other technology/task combinations. The Park &Raven(2006)studysuggestedthreenewdimen-sions of fit to simplify the fit measurements.
Table 1. Construct analysis
Construct Item Standardized Loading
Cronbach’s Alpha
Composite Reliability
Average Variance Extracted
Fit Ease of Learning
EOL1 0.862 0.947 0.954 0.657
EOL2 0.871
EOL3 0.710
EOL4 0.674
Ease of Use
EOU1 0.873
EOU2 0.824
EOU3 0.845
EOU4 0.826
EOU5 0.756
Task Match
TM2 0.833
TM3 0.813
Performance Charac-teristics
PERFORM1 0.910 0.751 0.889 0.800
PERFORM2 0.879
Technology (System)Characteristics
SC2 0.775 0.671 0.815 0.594
SC3 0.776
SC7 0.762
Task Characteristics TC4 0.915 0.811 0.914 0.841
TC5 0.919
Usefulness USEFUL1 0.797 0.899 0.926 0.713
USEFUL2 0.812
USEFUL3 0.898
USEFUL4 0.887
USEFUL5 0.824

24 International Journal of Information and Communication Technology Education, 6(1), 17-29, January-March 2010
Copyright © 2010, IGI Global. Copying or distributing in print or electronic forms without written permission of IGI Globalis prohibited.
Table 2. Construct loadings and cross loadings
Construct Item 1 2 3 4 5
1. Fit 1-1. Ease of Learning (EOL)
EOL1 EOL2 EOL3
0.862 0.871 0.710
0.292 0.342 0.327
0.326 0.411 0.436
0.287 0.252 0.337
0.284 0.278 0.388
EOL4 0.674 0.283 0.456 0.203 0.285
1-2.EaseofUse(EOU) EOU1 EOU2 EOU3 EOU4 EOU5
0.873 0.824 0.845 0.826 0.756
0.499 0.336 0.393 0.296 0.264
0.441 0.294 0.553 0.374 0.328
0.392 0.344 0.295 0.252 0.348
0.626 0.543 0.514 0.316 0.294
1-3.TaskMatch(TM) TM2 TM3
0.833 0.813
0.344 0.309
0.432 0.330
0.381 0.373
0.603 0.449
2.Performance(PERFORM) PERFORM1 PERFROM2
0.318 0.451
0.910 0.879
0.299 0.339
0.560 0.466
0.521 0.454
3.Technology(System)Character-istics(SC)
SC2 SC3 SC7
0.278 0.368 0.461
0.071 0.123 0.515
0.775 0.776 0.762
0.020 0.024 0.412
0.142 0.156 0.592
4.TaskCharacteristics(TC) TC1 TC2
0.361 0.368
0.457 0.598
0.252 0.187
0.915 0.919
0.501 0.446
5.Usefulness(USEFUL) USEFUL1 USEFUL2 USEFUL3 USEFUL4 USEFUL5
0.323 0.544 0.435 0.402 0.547
0.455 0.423 0.514 0.443 0.469
0.383 0.487 0.316 0.318 0.326
0.341 0.508 0.442 0.406 0.458
0.797 0.812 0.898 0.887 0.824
Figure 3. The task-technology fit model showing the strength of relationship between con-structs

International Journal of Information and Communication Technology Education, 6(1), 17-29, January-March 2010 25
Copyright © 2010, IGI Global. Copying or distributing in print or electronic forms without written permission of IGI Globalis prohibited.
Furthermore, they updated and developed mea-surements for all constructs of the TTF model. This study re-confirmed the Park & Raven study in the context of digital video tool use in the classroom. There were significant relationships between all four variables. The measurements used by Park and Raven were also shown to be applicable in this context.
The secondary research question asked if the fit between the presentation improvement task and digital video technology would lead to better student performance. When task and technology fit together, and when there is a significant fit between digital video tools (tech-nology)andimprovementofpresentationskills(task),thestudentwillperformbetter(improvedpresentationskills).Thecomplexityofthetask,and the reliability of the digital video tools are closelyrelatedtohowwell(1)thetaskmatchedthework,(2)howeasyitwastolearnhowtousetheDVtools,and(3)howeasyitwastousethe DV tools. These three in turn were closely related to the perceived improvement of pre-sentation skills. Performance in the class does not only depend on how bright the student is, or how hard they work. If the technology and the task are not carefully matched then students won’t learn. The implication is that digital video can be a useful alternative to in-class presenta-tion when the goal is to improve presentation skills. The strong relationships between fit, usefulness and performance indicate that fit is indeed important for performance, and that the fit between the presentation improvement task and the digital video technology does lead to better student performance
limitations and future research
Any research study has limitations that derive from the need to focus, availability of data, and analysis methods used. As our study builds on theworkofParkandRaven(2006),sootherresearch can extend the findings of the work presented here. As the R-square values show, the variation in fit, usefulness, and performance is only partly explained (at levels of 33%, 29%, and 30% respectively. Other factors will likely
have impacted the variation in these constructs, and future research might identify for instance what else impacts student self-reported mea-sures of performance. The findings in this study confirmed the validity of the Park and Raven (2006)model in the contextofdigitalvideotechnology and oral presentation improvement. Thisinturnraisesthequestioniftherearetask/technology combination for which this model would not work. Because of the limitations in the sample size, it was not possible to look at the three constructs that together form fit. With more data, it would be possible to explore the individual relationships that task match, ease of learning and ease of use have with task, technology, and performance. This would give more detailed insights into fit.
referenCes
Aly,I.,&Islam,M.(2005).Factorsaffectingoralcommunication apprehension among business students: An empirical study. Journal of American Academy of Business, Cambridge, 6(2),98–103.
Bearden, W. O., Netemeyer, R. G., & Mobley, M. F.(1993).Handbook of marketing scales. Newbury Park, CA: Sage.
Campbell, K. S., Mothersbaugh, D. L., Brammer, C., & Taylor, T. (2001). Peer versus self assess-ment of oral business presentation performance. Business Communication Quarterly, 64(3),23–42.doi:10.1177/108056990106400303
Chin,W.W.(1998).Thepartialleastsquaresapproachto structural equation modeling. In G.A. Marcoulides (Ed.),Modern Methods for Business Research (pp. 295-336).Mahwah,NJ,USA:LawrenceErlbaumAssociates.
Darling,A.L.,&Dannels,D.P. (2003).Practic-ing engineers talk about the importance of talk: A report on the role of oral communication in the workplace. Communication Education, 52(1),1–16.doi:10.1080/03634520302457
Davis,F.D.,Bagozzi,R.P.,&Warshaw,P.R.(1989).User acceptance of computer technology: A compari-son of two theoretical models. Management Science, 35,982–1003.doi:10.1287/mnsc.35.8.982

26 International Journal of Information and Communication Technology Education, 6(1), 17-29, January-March 2010
Copyright © 2010, IGI Global. Copying or distributing in print or electronic forms without written permission of IGI Globalis prohibited.
DeLone,W.H.,&McLean,E.R.(1991).Informa-tion systems success: The quest for the dependent variable. Information Systems Research, 3(1),60–95.doi:10.1287/isre.3.1.60
DeLone,W.H.,&McLean,E.R.(2003).TheDe-Lone and McLean model of information systems success: A ten-year update. Journal of Management Information Systems, 19(4),9–30.
Eason,K.(1988).Information technology and orga-nizational change. Bristol, PA.: Taylor & Francis.
Falk,R.F.,&Miller,N.B. (1992).A primer for soft modeling, Akron, OH: The University of Akron Press.
Fill,K.,&Ottewill,R.(2006).Sinkorswim:takingadvantage of developments in video streaming. In-novations in Education and Teaching International, 43(4),397–408.doi:10.1080/14703290600974008
Fornell,C.,&Bookstein,F.L.(1982).Twostructuralequation models: LISREL and PLS applied to con-sumer exit-voice theory. JMR, Journal of Marketing Research, 19(4),440–452.doi:10.2307/3151718
Fornell,C.,&Larcker,D.F.(1981).Evaluatingstruc-tural equation models with unobservable variables and measurement error. JMR, Journal of Marketing Research, 18(1),39–50.doi:10.2307/3151312
Gefen,D.,Straub,D.W.,&Boudreau,M.C.(2000).Structural equation modeling and regression: Guide-lines for research practice. Communications of the Association for Information Systems, 4(7),1–30.
Geske,J.(1992).Overcomingthedrawbacksofthelarge lecture class. College Teaching, 40, 151.
Goodhue,D.L.(1995).Understandinguserevalua-tions of information systems. Management Science, 41(12),1827–1844.doi:10.1287/mnsc.41.12.1827
Goodhue, D. L. (1998). Development andmeasurement validity of a task-technology fit instrument for user evaluations of information systems. Decision Sciences, 29(1), 105–138.doi:10.1111/j.1540-5915.1998.tb01346.x
Goodhue,D.L.,&Thompson,R.L.(1995).Task-technology fit and individual performance. MIS Quarterly, 19,213–236.doi:10.2307/249689
Hair,J.F.,Anderson,R.E.,etal.(1998).Multivari-ate Data Analysis. Upper Saddle River, New Jersey, USA: Prentice Hall.
Hallmark, J. R., Hanson, T. L., Padwick, G., Abel, D., &Stewart,P.(1993).Communication apprehension remediation: The interaction effect of video self-observation and gender. (ReportNo. CS508383)Miami, FL: Annual Meeting of the Speech Commu-nication Association. (ERIC Document Reproduction ServiceNo.ED363902).
Leeds,E.,&Maurer,R.(2009).Usingdigitalvideotechnology to reduce communication apprehension in business education. INFORMS Transactions on Education, 10(1).
Leeds,E.,Raven,A.,&Brawley,B.(2007).Primarytraits of oral business presentation: translatable use for assessment in a virtual learning environment. College Teaching Methods & Styles Journal, 3(4),21.
Leedy,P.,&Ormrod,J.(2001).Practical research. Planning and design.(7thEd.)UpperSaddleRiver,NJ, USA: Merrill-Prentice Hall.
Leidner,D.E.,&Jarvenpaa,S.L.(1995).Theuseof information technology to enhance management school education: A theoretical view. MIS Quarterly, 19,265.doi:10.2307/249596
Maes,J.D.,Weldy,T.G.,&Icenogle,M.L.(1997).A managerial perspective: Oral communication competency is most important for business students. Journal of Business Communication, 34(67).
Marcoulides,G.,&Saunders,C. (2006). PLS:ASilver Bullet? MIS Quarterly, 30(2),iii–ix.
Ober,S.(1987).Thestatusofpostsecondarybusinesscommunicationinstruction--1986vs.1982.Journal of Business Communication, 24(49).
Ober,S.,&Wunsch,A.P.(1983).Thestatusofbusi-ness communication instruction in postsecondary institutions in the United States. Journal of Business Communication, 20(5).
Park,C.,&Raven,A.J.(2006).KnowledgeMan-agement Systems Success at the Individual Level: Task Technology Fit Perspective. In proceedings of the 37th annual meeting of the decision sciences institute(pp.30911-30916),SanAntonio,TX:Deci-sion Sciences Institute.
Plutsky,S.,&Wilson,B.(2000).Studytovalidateprerequisites in business communication for stu-dent success. Journal of Education for Business, 76(1),15.

International Journal of Information and Communication Technology Education, 6(1), 17-29, January-March 2010 27
Copyright © 2010, IGI Global. Copying or distributing in print or electronic forms without written permission of IGI Globalis prohibited.
Reinsch, N. L. Jr, & Shelby, A. N. (1997).What communication abilities do practitioners need? Evidence from MBA students. Busi-ness Communication Quarterly, 60(4), 7–29.doi:10.1177/108056999706000401
Ruchala,L.V.,&Hill,J.W.(1994).Reducingac-counting students’ oral communication apprehension: Empirical evidence. Journal of Accounting Educa-tion, 1(1),41–50.
Singleton,R.A., Jr.,&Straits,B.C. (2005).Ap-proaches to social research. New York, NY: Oxford University Press.
Sorenson,R.L.,Savage,G.T.,&Orem,E.(1990).Aprofile of communication faculty needs in business schools and colleges. Communication Education, 39(2),148–160.doi:10.1080/03634529009378797
Tobias,R.D.(1995).Anintroductiontopartialleastsquares regression. In SUGI Proceedings. Retrieved August1,2008fromhttp://support.sas.com/rnd/app/papers/pls.pdf
Wardrope,W. J., & Bayless,M. L. (1994). Oralcommunication skills instruction in business schools. Journal of Education for Business, 69(3),132–135.
Winsor, J. L., Curtis, D. B., & Stephens, R. D. (1997).Nationalpreferencesinbusinessandcom-munication education: A survey update. Journal of the Association for Communication Administration (JACA)(3),170-179.
Wold,H. (1982).Softmodeling:Thebasicdesignand some extensions. In K.G. Joreskog & H. Wold (Eds.),Systems under Indirect Observation 2. (pp. 1-54).North-Holland,Amsterdam.
Yi,M.Y.,&Davis,F.D.(2003).Developingandvali-dating an observational learning model of computer software training and skill acquisition. Information Systems Research, 14(2), 146–169. doi:10.1287/isre.14.2.146.16016
Zigurs, I., & Buckland, B. K. (1998). A theoryof task/technology fit and group support systemseffectiveness. MIS Quarterly, 22(3), 313–334.doi:10.2307/249668

28 International Journal of Information and Communication Technology Education, 6(1), 17-29, January-March 2010
Copyright © 2010, IGI Global. Copying or distributing in print or electronic forms without written permission of IGI Globalis prohibited.
appendix
Table 3. Constructs and measures
Construct Item ID Item
Ease of Learning
EOL1 Learning to use the digital video tools was easy for me.
EOL2 It was easy for me to become skillful at using the digital video tools.
EOL3 It was difficult to learn how to use the digital video tools for my assignment.
EOL4 I took a long time to learn to use the digital video tools for my assignment.
Ease of Use EOU1 The services provided by the digital video tools matched my requirements. I found it easy to get the digital video tools to do what I wanted them to do.
EOU2 My interaction with the digital video tools was clear and understandable.
EOU3 I found the digital video tools to be flexible to interact with.
EOU4 I found the digital video tools easy to use.
EOU5 The digital video tools were user friendly.
Task Match TM2 The functionality of the digital video tools served my needs very well.
TM3 The services provided by the digital video tools matched my requirements.
Performance Characteristics
PERFORM1 The quality of my work in the assignment has been excellent
PERFORM2 My effectiveness in the assignment has been excellent
Systems Char-acteristics
S C 2 ( r e -versed)
The digital video tools were subject to unexpected or inconvenient down times which made it harder to do my assignment.
SC3 (reversed)
The digital video tools were subject to frequent problems and crashes.
SC7 I would rate the overall quality of the digital video tools to be excellent..
Task Character-istics
TC4 TC5
I had to collaborate with others in my assignment. My assignment required frequent coordination with the efforts of others.
Usefulness USEFUL1 Using the digital video tools improved my performance in the assignment.
USEFUL2 Using the digital video tools in my assignment increased my productivity.
USEFUL3 Using the digital video tools enhanced my effectiveness in my assignment.
USEFUL4 Using the digital video tools made it easier to do my assignment.
USEFUL5 I found the digital video tools useful in my assignment.
Demographic Information
AGE What is your age?
GENDER What is your gender
RACE Which best describes your race or ethnic group?

International Journal of Information and Communication Technology Education, 6(1), 17-29, January-March 2010 29
Copyright © 2010, IGI Global. Copying or distributing in print or electronic forms without written permission of IGI Globalis prohibited.
Arjan Raven is an associate professor of management information systems. He received his PhD in business administration from the University of Southern California and additionally holds degrees in computer science from the University of Amsterdam and electrical engineering from the Utrecht School of Engineering. His current interests center around the fit of tasks and systems, and international development. Raven has published in the Journal of Organizational Computing and Electronic Commerce, the Data Base for Advances in Information Systems, the International Journal of Technology Management, and the Quarterly Review of Distance Educa-tion. Raven has consulted nationally and internationally with large companies in the areas of business process redesign and knowledge management.
Elke Leeds received the BBA degree from Loyola University of Chicago, the MBA from Kennesaw State University, and the PhD from Walden University in the management of information systems. She is currently an assistant professor of information systems (IS) in the Coles College of Busi-ness at Kennesaw State University. She is on the graduate faculty of the Coles MBA program, Executive MBA, and the Georgia Web MBA. She has published research papers in the Informs TransactionsonEducation(ITE),IEEETransactionsOnProfessionalCommunication,theInter-national Journal of e-Collaboration, and the International Journal of Applied Management and Technology. Her current research interests include technology acceptance and fit, ethics in IT, communication technology, and communication skills in executive and engineering education.
ChongWoo Park is an assistant professor of information technology at Georgia Gwinnett College in Lawrenceville, Georgia. He earned the BSc and MBA degrees from Korea University, the MSc degree from Syracuse University, and the PhD degree in computer information systems from the J. Mack Robinson College of Business at Georgia State University. Prior to his academic career, he was an IT consultant in Entrue Consulting Partners, the consulting division of LG CNS. His research interests include IT project management, technology adoption, knowledge management and systems, information seeking behavior, and IT use in education. His research has been pub-lished in journals including Decision Sciences, Journal of the Association for Information Systems, IEEE Transactions on Engineering Management, and International Journal of Information and Communications Technology Education, and presented at Academy of Management Meeting, Americas Conference on Information Systems, and Decision Sciences Institute Meeting.