Digital Statistics in South Africa 2017 - qwertydigital.co.za · DIGITAL STATISTICS IN SOUTH AFRICA...
22
THE DIGITAL LANDSCAPE IN SOUTH AFRICA 2017 A data driven look at South Africa’s relationship with digital.
-
Upload
trinhhuong -
Category
Documents
-
view
214 -
download
0
Transcript of Digital Statistics in South Africa 2017 - qwertydigital.co.za · DIGITAL STATISTICS IN SOUTH AFRICA...

THE DIGITAL LANDSCAPE IN SOUTH AFRICA 2017
A data driven look at South Africa’s relationship with digital.
Introduction
Digital in South Africa has always been an interesting and diverse discipline. We’ve seen the beginning (“Are you on Facebook yet?), we’ve worked through the adoption, and we’re building to maturation.
South Africa has a very unique relationship with Digital. We have very different market needs, and unique challenges with regards to affordability and accessibility. We can’t blindly follow the market leaders, such as the USA or Britain- our market is far too diverse! Instead, we need to analyse and acknowledge our local audiences.
This means knowing that over 75% of all website traffic in South Africa comes from mobile devices, and adapting your website to be device agnostic. Acknowledging that Social Media users have increased by 15%, but preparing for a potential 40 million new users.
This white paper serves to showcase the latest digital statistics in South Africa, with a focus on 4 main categories- Digital Growth, Digital Utilisation, Social Media, and Ecommerce.
Additional insights and recommendations follow, which should guide any brand or business looking to craft digital marketing or ecommerce success in South Africa.
DIGITAL STATISTICS IN SOUTH AFRICA 2017 2

Digital Statistics in South Africa
Table of Contents
1. ANNUAL DIGITAL GROWTH
An overview of the South African population, and the growth statistics over the last year.
2. DIGITAL PLATFORM UTILISATION
Social Media vs TV? We take note of how South African’s use Digital platforms, and what activities drive this consumption.
3. SOCIAL MEDIA
How many South African’s use Social Media, how often they use these platforms, and which platforms they hold dear.
4. E-COMMERCE
Do South African’s utilise e-commerce? We provide insight into how often they browse and buy, and the drop-off rates between.
DIGITAL STATISTICS IN SOUTH AFRICA 2017 3

4
ANNUAL DIGITAL GROWTH IN SOUTH AFRICA 2017
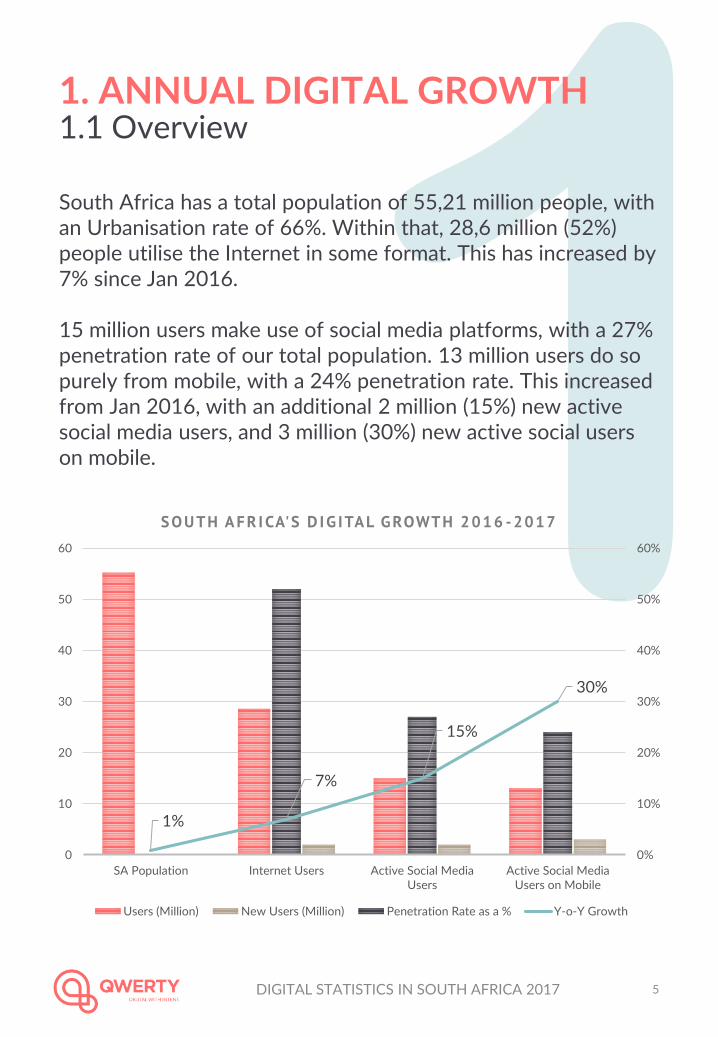
1. ANNUAL DIGITAL GROWTH1.1 Overview
South Africa has a total population of 55,21 million people, with an Urbanisation rate of 66%. Within that, 28,6 million (52%) people utilise the Internet in some format. This has increased by 7% since Jan 2016.
15 million users make use of social media platforms, with a 27% penetration rate of our total population. 13 million users do so purely from mobile, with a 24% penetration rate. This increased from Jan 2016, with an additional 2 million (15%) new active social media users, and 3 million (30%) new active social users on mobile.
1%
7%
15%
30%
0%
10%
20%
30%
40%
50%
60%
0
10
20
30
40
50
60
SA Population Internet Users Active Social MediaUsers
Active Social MediaUsers on Mobile
S O U T H A F R I CA'S D I G ITAL G ROWT H 2 0 1 6 - 2017
Users (Million) New Users (Million) Penetration Rate as a % Y-o-Y Growth
DIGITAL STATISTICS IN SOUTH AFRICA 2017 5
6
HOW DIGITAL IS UTILISED BY SOUTH AFRICAN’S 2017

DIGITAL STATISTICS IN SOUTH AFRICA 2017 7
17%
78%
5% 0,03%
-16%
4%3%
50%
-40%
-20%
0%
20%
40%
60%
80%
100%
Laptops & Desktops Mobile Phones Tablets Other Devices
S H A R E O F W E B T RA F F IC B Y D E V I C E 2 0 1 6 - 2017
Usage as a % % Growth 2016
South Africa, and Africa, rely heavily on Mobile phones. Not only do we have one of the highest mobile penetration rates in the world, but the mobile phone is often the only device available to use.
Mobile is responsible for over ¾ of all web traffic in South Africa, and as such, mobile first strategies must be your first focus. This means that a responsive website is an absolute must-have for any brand on digital. Additionally, brands must be focusing on content marketing that is designed and crafted for mobile platforms.
2. DIGITAL UTILISATION2.1 Traffic by Device

DIGITAL UTILISATION2.2 Media Consumption
DIGITAL STATISTICS IN SOUTH AFRICA 2017 8
It’s also important to note how South Africans consume content. When targeting or trying to get your brand in front of people, you need to ensure that you are meeting your audience where they are. The following showcases how much time an average South African will spend on various mediums of media.
8,02
3,032,54
2,17
0
1
2
3
4
5
6
7
8
9
Daily Internet Usage viaDesktop
Daily Internet Usage viamobile phone
Daily Social Media Usage-any device
Daily Television Viewingtime
S O U T H A F R I C A ' S C O N S U M P T I O N O F M E D I A 2 0 1 6- 2 0 1 7
Daily hours spent
As for brands, this data reflects how much of a typical South
African’s day is spent combined on digital platforms, at 14 hours
per day, with TV coming in last, at just over 2 hours. It is
important for both businesses and brands to understand that
their audience is no longer accessible through traditional
measures alone- there must be a component of new media,
such as Social networking, Mobile display ads, and even Search
Engine Marketing.

DIGITAL UTILISATION2.3 Weekly Activities by Device
DIGITAL STATISTICS IN SOUTH AFRICA 2017 9
Next, it’s important to recognise what our audiences are using the Internet for. The following graph gives greater insight into what platforms are mostly utilised by the South African population on a weekly basis, and what activities keep us coming back for more.
As the above graph shows, there are certain elementary activities that we, as South Africans, rely on.
With nearly 70% of our weekly activities spent on Social Media platforms alone, this again highlights how important social media marketing is. 41% of South African’s utilise Google or Search Engines, indicating that Search Engine Optimisation, and playing nicely with Google, will help you get seen by potential clients and customers. Thirdly, checking our Email comes in at 33% overall. This is an opportunity for both Email and Newsletter marketing, but also Gmail Sponsored Promotions (Ads that appear in a user’s Gmail account.)
21
55
31
5 8
7
7
6
2 2
5
5
4
1 1
0
10
20
30
40
50
60
70
80
Check Email Visit Social MediaPlatforms
Use Google Search for ProductInformation
Listening to Music
W E E K L Y O N L I N E A C T I V I T I E S B Y D E V I C E
Smartphone Desktop Tablet

10
SOCIAL MEDIA IN SOUTH AFRICA 2017

SOCIAL MEDIA3.1 Active Social Media Users
DIGITAL STATISTICS IN SOUTH AFRICA 2017 11
All the above graphs and data showcase how important social media is to the South African population. As our primary reason to visit the Internet, Social Media offers a multitude of opportunities for brands, if used correctly.
With over 15 million users in South Africa alone, it’s clear that Social Media offers our population many benefits. Whether it be entertainment, news, education, customer service, or even networking, Social Media is readily used at least once a day by over 40% of South African’s, predominantly through mobile phones.
15 000 000
13 000 000
22
23
24
25
26
27
28
12 000 000
13 000 000
14 000 000
15 000 000
16 000 000
Active Social Media Users Active Social Media Users on Mobile
ACT IV E S O C I A L M E D I A U S E R I N S O U T H A F R I CA 2 0 1 6 -
2 0 1 7
Users (Million) Penetration Rate as a %

SOCIAL MEDIA3.2 Most used Social Platforms
DIGITAL STATISTICS IN SOUTH AFRICA 2017 12
Of course, it’s also vital that we know which of these platforms our audiences use the most, so that we can tailor our marketing communication to those platforms. The below graph highlights the most loved platforms in SA, that includes both Social Media platforms, as well as the most utilised Chat Apps, Messengers or VOIP services
From the above, we can clearly see that Facebook is the most utilised, with YouTube following closely behind. Twitter sees adoption from just over 25% of our population, on par with Instagram.One of our core beliefs is that Facebook is still being massively under-utilised in South Africa, and we sincerely believe that every brand must at least look at using this platform. Not only does Facebook allow for Engagement and Content Pieces, but it is their advertising back-end that provides the most opportunity.
4947
45
3129
26 25 25 25
19
12 11
0
10
20
30
40
50
60
S O U T H A F R I C A N ' S M O S T L O V E D S O C I A L P L A T F O R M S A S A
P E R C E N T A G E 2 0 1 6 - 2 0 1 7

SOCIAL MEDIA3.2 Most used Social Platforms cont.
DIGITAL STATISTICS IN SOUTH AFRICA 2017 13
With YouTube’s massive following, there is clear indication that South African user’s rely on YouTube for the mass of video available.
Brands need to look at crafting more video content into their marketing plans. Note, these don’t have to be expensive, big budget productions- Nifty crafts short, specific pieces that are cost-effective, yet receive hundreds of thousands of views.
And B2B owners, rejoice! Nearly 30% of South African’s make use of the Professional Social Network, indicating that the platform provides a service- whether it be for finding a new job, checking out a potential employer, or even networking and sales, LinkedIn is not to be ignored.
A big opportunity for Brands is also that of Facebook Messenger, Facebook’s very own attempt at an all-encompassing messenger app. With their almost forced marketing of this app, over 30% of South African’s have and use FB Messenger. Facebook has incorporated some very smart functionalities for brands into the app too, including customised imagery, Sponsored Ads, and Chat Bot services.
FNB has begun relying heavily on FB Messenger, and incorporated
the platform into their overall Customer Service strategy

SOCIAL MEDIA3.3 Facebook’s South African Audience
DIGITAL STATISTICS IN SOUTH AFRICA 2017 14
Looking at Facebook, as the most highly utilised social platform, it’s essential that we understand who the audiences are. Demographic data, such as age and gender, give us greater insight into who our users are, and what they may be searching for.
500 000 2 200 000 2 400 000 1 100 000600 000 400 000
400 000
500 000 2 200 000 2 500 000 1 200 000 500 000 300 000 400 000
13-17 18-24 25-34 35-44 45-54 55-64 65+
F A C E B O O K ' S S O U T H A F R I C A N A U D I E N C E 2 0 1 6 - 2 0 1 7
Female Male
As we can see, the 18-24 and 25-34 age groups are by far the largest group, and most Facebook Pages, in our experience, reflect exactly this. Also note the higher numbers in the 45-65+ age groups- these users hold more disposable income, and frequently use Facebook.

15
E-COMMERCE IN SOUTH AFRICA 2017

E-Commerce4.1 E-Commerce Users
DIGITAL STATISTICS IN SOUTH AFRICA 2017 16
E-Commerce, the buying of products and services online, is a huge industry, with potential for immense growth. With an estimated global total spend of $1,9 trillion, or nearly 8% of the total Global retail spend, e-commerce is the great equaliser of our generation. The question is… how do South African’s use E-Commerce?
With more and more big brands, and independent stores, attempt at getting ecommerce right, e-commerce is set to bring about immense change in South Africa.
17 110 000
31%
0%
5%
10%
15%
20%
25%
30%
35%
0
2 000 000
4 000 000
6 000 000
8 000 000
10 000 000
12 000 000
14 000 000
16 000 000
18 000 000
Number of People Purchasing via E-Commerce
S O U T H A F R I CA'S E- CO M M ERCE U S E R S 2 0 1 6-2 017
Users (Million) Penetration Rate as a %

E-Commerce4.2 E-Commerce Revenues
DIGITAL STATISTICS IN SOUTH AFRICA 2017 17
$2 300 000 000,0
$136,0
Total Value of SA Ecommerce- Billion ($) Average Annual Ecommerce Revenue per User ($)
S O U T H A F R I CA'S E - CO M M ERCE R E V E N U E S 2 0 1 6 -20 17
Ecommerce Revenues
E-commerce- although still small in South Africa, is still a big budget industry, worth $2,3 Billion in South Africa annually. There are an estimated 17.1 Million users who utilise E-Commerce, which is roughly 31% of all our population. From this, each user spends an estimated $136 (R1 800.00) in a year on ecommerce purchases.

E-Commerce4.3 E-Commerce Activities
DIGITAL STATISTICS IN SOUTH AFRICA 2017 18
As we can see, nearly half of the of active South African audience takes a keen interest in available e-commerce. In essence, users not only search for products online, but they also tend to visit the ecommerce store. There is an estimated 17% drop-off rate between users visiting the site (45%), and purchasing (28%.)
This lets us know that e-commerce marketers should be paying close attention to the conversion rate of their adverts, and should be tracking these daily, with tweaks and custom audiences coming into play the further down the sales path that you go.
45% 45%
28%
21% 15%
0%
5%
10%
15%
20%
25%
30%
35%
40%
45%
50%
Search Online for aProduct
Visited an OnlineStore
Purchased a ProductOnline
Made an OnlinePurchase from
Desktop
Made an OnlinePurchase from
Mobile
E - C O M M E R C E A C T I V I T I E S O V E R 3 0 D A Y S 2 0 1 6 - 2 0 1 7
Monthly E-Commerce Activities

E-Commerce4.3 E-Commerce Activities cont.
DIGITAL STATISTICS IN SOUTH AFRICA 2017 19
With regards to e-commerce, most purchases are done via desktop computers or laptops- a big difference to the graphs above which shows us how vital mobile is. Most users tend to utilise bigger computers when purchasing from e-commerce stores, as it provides a more trustworthy experience, clearer details, and an easier purchasing path. This indicates that whilst every website you have MUST be mobile friendly, concentrate more on your desktop layout and user experience for your store.
Ultimately, this will change as users get better acquainted with purchasing from Mobile. As social platforms like Pinterest, Facebook and Twitter have begun rolling out “Buy” buttons on their platforms, it’s only a matter of time before users are purchasing from social sites, giving a greater sense of comfort around purchasing from mobile.

20
2017 / 2018 INSIGHTS AND TRENDS

Insights and Trends 5.1 Upcoming in 2017 and 2018
DIGITAL STATISTICS IN SOUTH AFRICA 2017 21
SOCIAL FOR SEARCHIt’s been shown that older generations use Search Engine Marketing when looking for brand and product information on the internet. Social Media is doing the same, but used by younger audiences. Start incorporating more products and the most searched for brand information within your social strategy. E-Commerce on Social is coming, so prepare your audiences now.
VIDEO IGNITES ACTIONVideo, coupled with advertising spend, can drive far more interest and action around your brand. This doesn’t necessarily mean a long video on YouTube, featuring your CEO. Instead, craft unique, cost-effective ads that have an emotional pull, and concentrate more on your subject matter. Or, make use of Live video features and stream your message to a community of active listeners.
DEVELOP YOUR ROIDo away with vanity metrics such as ‘Engagement’ and ‘Likes’, and focus on acquiring metrics that prove real-world business impact. This could include Action and Conversion rates, the number of clicks social has driven, or the visits that a product page receives. Work out your own ROI needs, and incorporate these into a Performance Management plan.
TRAIN YOUR AUDIENCES FOR ACTIONThere’s very little point in having a 50 000 strong community on social if they’re not doing anything. Start driving your audiences to other platforms, to take a survey, or browse for products, Make sure that your intentions are defined from a business sense, so that your audiences can follow and drive results related to your intention.

References
DIGITAL STATISTICS IN SOUTH AFRICA 2017 22
Statistical data in South Africa is never easy to find, and it takes the combined data from thousands of sources to produce a holistic, and accurate, representation. Thanks to the efforts and published data from the below sources. Browse these links for more digital statistics in South AfricaWe are SocialInvespHootsuite’s Social Media Toolkit
ABOUT QWERTY DIGITAL
Qwerty is a collective of specialists who craft meaningful work from purpose.
We’re devoted to an unwavering responsibility to quality work that performs. To continued applied thinking, with the collective resources of expertise and experience.
Stubborn about showing, and proving, results through measurement and ROI. Dedicated to authenticity and transparency, as the foundation to every client relationship. Visit our website www.qwertydigital.co.za
DIGITAL WITH INTENTPERFORMANCE THROUGH PURPOSE


![Provincial Profile 2004 - Statistics South AfricaProvincial Profile 2004: Limpopo / Statistics South Africa. Pretoria: Statistics South Africa, 2006 110p. [Report No. 00-91-09(2004)]](https://static.fdocuments.net/doc/165x107/60f89f16f49d1242b4591960/provincial-profile-2004-statistics-south-provincial-profile-2004-limpopo-statistics.jpg)