Development of OECD Guidelines for Micro Statistics on Household Wealth

Statistical release P0318
General Household Survey
2015
Embargoed until:2 June 2016
10:30 Enquiries: Forthcoming issue: Expected release date
User Information Services GHS 2016 May 2017 Tel.: (012) 310 8600

Statistics South Africa P0318
General Household Survey, 2015
ii
CONTENTS
LIST OF FIGURES ...................................................................................................................................................... vi
LIST OF TABLES ....................................................................................................................................................... vii
1. Introduction ...................................................................................................................................................... 1
2. Summary and key findings ............................................................................................................................... 1
3. Basic population statistics ................................................................................................................................ 7
4. Education ......................................................................................................................................................... 8
4.1 Introduction ...................................................................................................................................................... 8
4.2 Educational profile of learners aged 0–4 years ............................................................................................... 8
4.3 General attendance of individuals aged 5 years and older at educational institutions .................................... 9
4.4 School attendance ......................................................................................................................................... 13
4.5 Higher education institution attendance ......................................................................................................... 15
4.6 Educational attainment of persons aged 20 years and older ........................................................................ 17
5. Health ............................................................................................................................................................. 20
5.1 Health care provision and quality ................................................................................................................... 20
5.2 Medical aid coverage ..................................................................................................................................... 22
5.3 Teenage pregnancy ....................................................................................................................................... 24
6. Disability ......................................................................................................................................................... 24
7. Social security services .................................................................................................................................. 25
8. Religious affiliation and observance .............................................................................................................. 27
9. Housing .......................................................................................................................................................... 29
9.1 Housing types and ownership ........................................................................................................................ 29
9.2 State-subsidised housing ............................................................................................................................... 31
10. Household sources of energy ........................................................................................................................ 33
11. Water access and use ................................................................................................................................... 35
12. Sanitation and refuse removal ....................................................................................................................... 44
13. Telecommunications ...................................................................................................................................... 49
14. Transport ........................................................................................................................................................ 51
15. Environmental trends ..................................................................................................................................... 53
16. Household assets and sources of income ..................................................................................................... 55
17. Access to food ............................................................................................................................................... 59
18. Agriculture ...................................................................................................................................................... 61
19. Technical notes .............................................................................................................................................. 62
19.1 Methodology and fieldwork ............................................................................................................................ 62
19.2 The questionnaire .......................................................................................................................................... 63
19.3 Response rates .............................................................................................................................................. 64
19.4 Data revisions ................................................................................................................................................ 64
19.5 Limitations of the study .................................................................................................................................. 65
19.6 Sample design ............................................................................................................................................... 65
19.7 Allocating sample sizes to strata.................................................................................................................... 67
19.8 Weighting ...................................................................................................................................................... 69
19.9 Sampling and the interpretation of the data ................................................................................................... 69
19.10 Comparability with previous surveys ............................................................................................................. 70
19.11 Editing and imputation ................................................................................................................................... 71
19.12 Definitions of terms ........................................................................................................................................ 72
19.13 Classifications ................................................................................................................................................ 73

Statistics South Africa P0318
General Household Survey, 2015
iii
ADDENDUM TABLES
1. Population ...................................................................................................................................................... 74
1.1 By province, population group and sex, 2015 ................................................................................................ 74
1.2 By age group, population group and sex, 2015 ............................................................................................. 75
2. Education ....................................................................................................................................................... 76
2.1 Population aged 20 years and older, by highest level of education and province, 2015 .............................. 76
2.2 Population aged 20 years and older, by highest level of education, population group and sex, 2015.......... 78
2.3 Population aged 20 years and older, by highest level of education, age group and sex, 2015 .................... 80
2.4 Population aged 15 years and older with a level of education lower than Grade 7, by literacy skills and province, 2015 ............................................................................................................................................... 82
2.5 Population aged 15 years and older with a level of education lower than Grade 7, who have some, a lot of difficulty or are unable to do basic literacy activities by sex and province, 2015 .................................. 84
2.6 Population aged 15 years and older with a level of education lower than Grade 7, who have some, a lot of difficulty or are unable to do basic literacy activities, by population group and sex, 2015 ................... 86
2.7 Population aged 15 years and older with a level of education lower than Grade 7, by literacy skills and age group, 2015 ............................................................................................................................................. 88
3. Attendance at an educational institution ........................................................................................................ 90
3.1 Population attending and not attending an educational institution by population group and age group, 2015 ............................................................................................................................................................... 90
3.2 Population attending an educational institution, by type of institution, age group and sex, 2015 ................. 92
3.3 Population aged 5 years and older attending an educational institution, by type of institution and province, 2015 ............................................................................................................................................... 93
3.4 Population aged 5 years and older attending an educational institution, by type of institution, population group and sex, 2015..................................................................................................................... 94
3.5 Population aged 5 years and older attending an educational institution, by annual tuition fee, population group and sex, 2015..................................................................................................................... 95
3.6 Population aged 5 years and older attending an educational institution, by annual tuition fee and type of institution, 2015 .......................................................................................................................................... 96
3.7 Population aged 5 years and older attending an educational institution that benefited from reductions or partial bursaries, by type of institution, sex and province, 2015 ................................................................ 97
3.8 Population aged 5 years and older attending an educational institution, by the kind of problems they experience at the institution, and by province, 2015 ..................................................................................... 99
3.9 Population aged 5 years and older currently attending school by grade and by province, 2015 ................ 100
3.10 Population aged 0–4 years attending a day care centre, crèche, early childhood development centre (ECD) playgroup, nursery school or pre-primary school, by whether they attend or not, and by province, 2015 ............................................................................................................................................. 101
3.11 Population aged 0–4 years attending a day care centre, crèche, early childhood development centre (ECD) playgroup, nursery school or pre-primary school, by whether they attend these institutions, and by population group and sex, 2015 .............................................................................................................. 102
4. Medical aid coverage ................................................................................................................................... 103
4.1 Medical aid coverage, by province and population group, 2015 ................................................................. 103
4.2 Medical aid coverage, by population group and sex, 2015 ......................................................................... 105
4.3 Medical aid coverage, by age group, 2015 .................................................................................................. 106
5. Health ........................................................................................................................................................... 107
5.1 General health perception, by province, 2015 ............................................................................................. 107
5.2 People who were ill in the month prior to the interview and who consulted a health worker, by province, 2015 ............................................................................................................................................................. 108
5.3 People who were ill in the month prior to the interview and whether they consulted a health worker, by population group and sex, 2015................................................................................................................... 109
5.4 The household’s normal place of consultation by province, 2015 ............................................................... 110
5.5 The household’s normal place of consultation and whether at least one member is covered by medical aid, 2015 ...................................................................................................................................................... 111

Statistics South Africa P0318
General Household Survey, 2015
iv
5.6 The respondent’s level of satisfaction with the service received during their most recent visit, by kind of health facility used, 2015 ............................................................................................................................. 112
5.7 The respondent’s level of satisfaction with the service received during their most recent visit to a health facility, by population group and sex, 2015 ....................................................................................... 113
5.8 People who were sick/injured and who did not consult a health worker in the month prior to the interview, by the reason for not consulting, and by population group and sex, 2015 .................................. 114
5.9 Population suffering from chronic health conditions as diagnosed by a medical practitioner or nurse, by sex and province, 2015 ................................................................................................................................ 115
6. Disabilities .................................................................................................................................................... 118
6.1 Population aged 5 years and older that have some difficulty or are unable to do basic activities, by province, 2015 ............................................................................................................................................. 118
6.2 Population aged 5 years and older that have some difficulty, a lot of difficulty or are unable to do basic activities, by population group and sex, 2015 .............................................................................................. 120
6.3 Population aged 5 years and older that are using assistive devices, by sex and province, 2015 ............... 122
7. Social welfare ............................................................................................................................................... 124
7.1 Population that received social grants, relief assistance or social relief, by population group, sex and province, 2015 ............................................................................................................................................. 124
8. Dwellings and services ................................................................................................................................ 125
8.1 Type of dwelling, by number of rooms in the dwelling ................................................................................. 125
8.1.1 All population groups, 2015 ......................................................................................................................... 125
8.1.2 Black African population group, 2015 .......................................................................................................... 126
8.1.3 Other** population groups, 2015.................................................................................................................. 127
8.2 Type of dwelling of households, by province, 2015 ..................................................................................... 128
8.3 Type of dwelling of households, by main source of water, 2015 ................................................................. 129
8.4 Households by type of dwelling, by tenure status, 2015 ............................................................................. 131
8.5 Tenure status of households, by province, 2015 ......................................................................................... 132
8.6 Type of ownership of the dwellings of households, by population group and sex of the household head, 2015 ................................................................................................................................................... 133
8.7 Type of dwelling of households, by main source of energy ......................................................................... 134
8.7.1 For cooking, 2015 ........................................................................................................................................ 134
8.7.2 For heating, 2015 ......................................................................................................................................... 135
8.7.3 For lighting, 2015 ......................................................................................................................................... 136
9. Water services ............................................................................................................................................. 137
9.1 Main source of water for households, by province, 2015 ............................................................................ 137
9.2 Households by main source of water, by population group of the household head, 2015 .......................... 138
9.3 Households whose main source of water was supplied by the local municipality, by province, 2015 ........ 139
9.4 Households whose main source of water was supplied by the local municipality, by population group and sex of the household head, 2015 .......................................................................................................... 140
9.5 Households without water in the dwelling or on site, by the distance household members have to travel to reach the nearest water source, and population group of the household head, 2015 ............................ 141
9.6 Households’ perceptions of water quality, per province, 2015 .................................................................... 142
10. Communication ............................................................................................................................................ 143
10.1 Households’ ownership of a cellular phone, by population group and sex of the household head, 2015 ... 143
10.2 Households’ ownership of a cellular phone, by province, 2015 ................................................................... 144
10.3 Households with connection of a landline phone, by population group and sex of the household head, 2015 ............................................................................................................................................................. 145
10.4 Households’ ownership of a landline phone, by province, 2015 .................................................................. 146
11. Source of energy .......................................................................................................................................... 147
11.1 Electricity connection to the mains, by population group, sex of the household head and province, 2015 ............................................................................................................................................................. 147
11.2 Source of energy .......................................................................................................................................... 148
11.2 Main source of energy used by households, by province ............................................................................ 148
11.2.1 For cooking, 2015 ........................................................................................................................................ 148

Statistics South Africa P0318
General Household Survey, 2015
v
11.2.2 For heating, 2015 ......................................................................................................................................... 149
11.2.3 For lighting, 2015 ......................................................................................................................................... 150
11.3 Main source of energy used by households, by population group of the household head ......................... 151
11.3.1 For cooking, 2015 ........................................................................................................................................ 151
11.3.2 For heating, 2015 ......................................................................................................................................... 152
11.3.3 For lighting, 2015 ......................................................................................................................................... 153
12. Sanitation ..................................................................................................................................................... 154
12.1 Sanitation facility used by households, by province, 2015 .......................................................................... 154
12.2 Sanitation facility used by households, by population group of the household head, 2015 ........................ 155
12.3 Sanitation facility used by households, by type of dwelling, 2015 ............................................................... 156
13. Refuse removal ............................................................................................................................................ 158
13.1 Households who pay for their refuse removal, by type of refuse removal service and province, 2015 ...... 158
13.2 Type of refuse removal services used by households, by population group of the household head, 2015 ............................................................................................................................................................. 159
13.3 Households currently paying for the removal of refuse, by province, 2015 ................................................. 160
14. Transport ...................................................................................................................................................... 161
14.1 Number of trips made by household members per week using each of the following modes of transport, by province, 2015 ........................................................................................................................ 161
14.2 Distance travelled to get to the nearest minibus taxi/sedan taxi/bakkie taxi, bus and train, by population group of the household head, 2015 ............................................................................................................. 162
14.3 Money spent during the previous calendar week by households per transport mode, by the sex of the household head, 2015 ................................................................................................................................. 163
14.4 Time taken to get to the health facility that members of the household normally go to, by transport mode, 2015 .................................................................................................................................................. 164
15. Environment ................................................................................................................................................. 165
15.1 Environmental problems experienced in the community or neighbouring farms, by province, 2015 .......... 165
15.2 Environmental problems experienced in the community or neighbouring farms, by population group and sex of the household head, 2015 .......................................................................................................... 166
16. Income and expenditure .............................................................................................................................. 167
16.1 Sources of income for households, by province, 2015 ................................................................................ 167
16.2 Households’ sources of income, by population group and sex of the household head, 2015 .................... 168
16.3 Monthly household expenditure category, by province, 2015 ..................................................................... 169
16.4 Monthly household expenditure category, by population group and sex of the household head, 2015 ..... 170
17. Households assets, 2015 ............................................................................................................................. 171
17.1 Number of households owning a particular asset by province, 2015 .......................................................... 171
18. Agriculture .................................................................................................................................................... 173
18.1 Number of households involved in one or more agricultural production activity, by province, 2015 ........... 173
18.2 Number of households involved in one or more agricultural production activity, by population group and sex of the household head, 2015 .......................................................................................................... 174
18.3 Land used for crop production by province, 2015 ....................................................................................... 175
18.4 Land used for crop production by population group and sex of the household head, 2015 ........................ 176
18.5 The number of livestock the household has, per province, 2015 ................................................................ 177

Statistics South Africa P0318
General Household Survey, 2015
vi
LIST OF FIGURES
Figure 1: Type of educational institution attended by population 5─24 years, 2015 ............................................ 10 Figure 2: Percentage of persons aged 7 to 24 years who attended educational institutions by province,
2002 and 2015 ....................................................................................................................................... 10 Figure 3: Percentage of persons aged 7 to 24 years who attended educational institutions by Metropolitan
areas, 2015 ............................................................................................................................................ 11 Figure 4: Percentage distribution of main reasons given by persons aged 7 to 18 years for not attending an
educational institution, by sex, 2015 ...................................................................................................... 11 Figure 5: Percentage of those aged 5 years and older who attended schools and who do not pay tuition
fees, 2002─2015 .................................................................................................................................... 12 Figure 6: Percentage of persons who attended grade 10─ 12 in a public school by their access to text
books by quarter, 2014 and 2015 .......................................................................................................... 13 Figure 7: Percentage of learners attending public schools who benefited from the school nutrition
programme, 2010–2015 ......................................................................................................................... 14 Figure 8: Percentage of learners attending public schools who benefited from the school nutrition
programme by Metropolitan areas, 2015 ............................................................................................... 14 Figure 9: Percentage of learners who experienced corporal punishment at school by province, 2011─2015 ..... 15 Figure 10: Percentage of learners who experienced corporal punishment at school by Metropolitan area,
2011─2015 ............................................................................................................................................. 15 Figure 11: Percentage distributions of student participation rates for individuals aged 18 to 29 years by
population group, 2002 and 2015 .......................................................................................................... 16 Figure 12: Percentage distributions of student participation rates for individuals aged 18 to 29 years by
Metropolitan areas, 2015 ....................................................................................................................... 16 Figure 13: Percentage distribution of educational attainment for persons aged 20 years and older, 2002–
2015........................................................................................................................................................ 17 Figure 14: Percentage of persons aged 20 years and older with no formal schooling per province, 2002 and
2015........................................................................................................................................................ 18 Figure 15: Percentage of persons aged 20 years and older with no formal education or highest level of
education less than Grade 7 within each gender group, 2002–2015 .................................................... 19 Figure 16: Adult literacy rates for person aged 20 years and older by province, 2010–2015 ................................. 19 Figure 17: Adult literacy rates for person aged 20 years and older by Metropolitan Areas, 2015 .......................... 20 Figure 18: Percentage distribution of self-reported health status of individuals by sex and population group,
2015........................................................................................................................................................ 20 Figure 19: Percentage distribution of the type of health-care facility consulted first by the households when
members fall ill or get injured, 2004–2015 ............................................................................................. 21 Figure 20: Percentage of individuals who are members of medical aid schemes per province, 2010–2015 ......... 23 Figure 21: Percentage of individuals who are members of medical aid schemes per Metropolitan area, 2015 ..... 23 Figure 22: Percentage of individuals who are members of medical aid schemes by population group, 2015 ....... 24 Figure 23: Percentage of females aged 14–19 who were pregnant during the year preceding the survey,
2015........................................................................................................................................................ 24 Figure 24: Percentage of households and persons who have benefited from social grants, 2003–2015 .............. 26 Figure 25: Percentage of individuals and households benefiting from social grants per province, 2015 ............... 26 Figure 26: Percentage of individuals and households benefiting from social grants per metropolitan area,
2015........................................................................................................................................................ 27 Figure 27: Percentage distribution of religious observance by religious affiliation, 2015........................................ 28 Figure 28: Percentage distribution of dwelling ownership status for households living in formal dwellings,
2002–2015 ............................................................................................................................................. 29 Figure 29: Percentage of households that lived in formal, informal and traditional dwellings by province,
2015........................................................................................................................................................ 30 Figure 30: Percentage of households that lived in formal, informal and traditional dwellings by provincial
Metropolitan area, 2015 ......................................................................................................................... 30 Figure 31: Percentage of dwelling units with six rooms or more by population group of the household head,
2015........................................................................................................................................................ 31 Figure 32: Percentage of households that received a government housing subsidy by sex of the household
head, 2002–2015 ................................................................................................................................... 31 Figure 33: Provincial percentage of households that received housing subsidies .................................................. 32 Figure 34: Percentage of households that said that their ‘RDP’ or state-subsidised house had weak or very
weak walls and/or roof by province, 2015 .............................................................................................. 32 Figure 35: Percentage of households connected to the mains electricity supply by province, 2002─2015 ........... 33 Figure 36: Percentage distribution of main sources of energy used for cooking by year, 2002–2015 ................... 34 Figure 37: Percentage distribution of main sources of energy used for cooking by province, 2015 ....................... 34 Figure 38: Percentage of household rating the quality of electrical supply services as ‘good’, 2010─2015 .......... 35

Statistics South Africa P0318
General Household Survey, 2015
vii
Figure 39: Percentage of households that paid for electricity that reported having had electricity interruptions during the six months before the survey, 2015 ...................................................................................... 35
Figure 40: Percentage of households with access to piped or tap water in their dwellings, off-site or on-site by province, 2002–2015 ......................................................................................................................... 36
Figure 41: Percentage of households with access to piped or tap water in their dwellings, off-site or on-site by Metropolitan areas, 2015 ................................................................................................................... 36
Figure 42: Percentage of households rating the quality of water services provided by the municipality as good, and those that reported water interruptions, by province, 2015 ................................................... 39
Figure 43: Percentage of households rating the quality of water services provided by the municipality as good, and those that reported water interruptions, Metropolitan Areas, 2015 ....................................... 40
Figure 44: Percentage distribution of households that received municipal water and that reported water interruptions that lasted more than 2 days at a time by province, 2010–2015 ...................................... 40
Figure 45: Percentage distribution of households that received municipal water and that reported water interruptions that lasted more than 2 days at a time by province, 2010–2015 ...................................... 41
Figure 46: Percentage of households that have access to improved sanitation per province, 2002–2015 ............ 44 Figure 47: Percentage of households that have access to improved sanitation by Metropolitan areas, 2015 ....... 45 Figure 48: Percentage of households that have no toilet facility or that have been using bucket toilets per
province, 2002─2015 ............................................................................................................................. 45 Figure 49: Problems experienced by households that share sanitation facilities during the six months before
the survey, 2015 ..................................................................................................................................... 46 Figure 50: Percentage distribution of household refuse removal, 2002─2015 ....................................................... 47 Figure 51: Percentage distribution of household refuse removal by Metropolitan areas, 2015 .............................. 47 Figure 52: Percentage of households who have a functional landline and cellular telephone in their dwellings
by province, 2015 ................................................................................................................................... 49 Figure 53: Percentage of households who have a functional landline and cellular telephone in their dwellings
by Metropolitan areas, 2015 ................................................................................................................... 50 Figure 54: Percentage of households with access to the Internet at home, or for which at least one member
has access to or used the Internet by province, 2015 ........................................................................... 50 Figure 55: Percentage of households who made use of public transport during the week preceding the
survey by province, 2015 ....................................................................................................................... 53 Figure 56: Percentage of households who experience specific kinds of environmental problems, 2003–2015 ..... 54 Figure 57: Percentage of households who experience specific kinds of environmental problems, 2003–2015 ..... 55 Figure 58: Percentage distribution of households by selected assets owned, by geotype, 2015 ........................... 56 Figure 59: Percentage distribution of sources of household income by province, 2015 ......................................... 57 Figure 60: Percentage distribution of main source of household income by province, 2015 .................................. 58 Figure 61: Percentage distribution of main source of household income by province, 2015 .................................. 58 Figure 62: Vulnerability to hunger and access to food, 2002–2008; 2010–2015 .................................................... 59 Figure 63: Percentage of households experiencing food adequacy or inadequacy by province, 2015 .................. 60 Figure 64: Percentage of households experiencing food adequacy or inadequacy by province, 2015 .................. 60 Figure 65: Percentage of households involved in agricultural activities by province, 2015 .................................... 61 Figure 66: Percentage distribution of the main reasons for agricultural involvement by province, 2015 ................ 61 Figure 67: Distribution of primary sampling units by province, 2007 (old) Master Sample and the new Master
Sample (designed in 2013) .................................................................................................................... 66
LIST OF TABLES
Table 1: Population per province, 2002–2015 .......................................................................................................... 7 Table 2: Number of households per province, 2002–2015 ....................................................................................... 7 Table 3: Percentage of children aged 0─4 years using different child care arrangements by province, 2015 ........ 8 Table 4: Percentage of persons aged 5 years and older who are attending educational institutions by province
and type of institution attended, 2015 ......................................................................................................... 9 Table 5: Nature of the problems experienced by all learners who attended public schools per province, 2015 ... 12 Table 6: Level of satisfaction with public and private healthcare facilities, 2015.................................................... 22 Table 7: Medical aid coverage, 2002–2015 ............................................................................................................ 22 Table 8: Persons aged 5 years and older with disability by gender and province, 2015 ....................................... 25 Table 9: Percentage distribution of religious affiliation by province, 2015 .............................................................. 28 Table 10: Comparison of the main water source for drinking used by households, 2002–2015 .............................. 37 Table 11: Access to piped municipal water supplies, payment and service ratings for local municipalities,
2005–2015 ................................................................................................................................................ 38 Table 12: Perceptions of households regarding the quality of the water they drink per province, 2005–2015 ........ 42 Table 13: Households refuse removal by province and geotype, 2015 ................................................................... 48 Table 14: Households’ access to the Internet by place of access, geotype and province, 2015 ............................. 51 Table 15: Mode of transport used by household members to travel to school and work, 2015 ............................... 52

Statistics South Africa P0318
General Household Survey, 2015
viii
Table 16: Nature of agricultural production activities per province, 2015 ................................................................. 62 Table 17: A summary of the contents of the GHS 2015 questionnaire .................................................................... 63 Table 18: Response rates per province, GHS 2015 ................................................................................................. 64 Table 19: Comparison between the 2007 (old) Master Sample and the new Master Sample (designed in 2013) .. 66 Table 20: Most important differences between the questionnaires introduced in 2015 and those used during
preceding years ........................................................................................................................................ 70
Statistics South Africa P0318
General Household Survey, 2015
1
GENERAL HOUSEHOLD SURVEY 2015
1. Introduction
This statistical release presents a selection of key findings from the General Household Survey (GHS)
2015. The survey was conducted by Statistics South Africa (Stats SA) from January to December 2015.
Purpose
The GHS is an annual household survey conducted by Stats SA since 2002. The survey replaced the
October Household Survey (OHS) which was introduced in 1993 and was terminated in 1999. The survey
is an omnibus household-based instrument aimed at determining the progress of development in the
country. It measures, on a regular basis, the performance of programmes as well as the quality of service
delivery in a number of key service sectors in the country.
The GHS covers six broad areas, namely education, health and social development, housing, household
access to services and facilities, food security, and agriculture.
This report has three main objectives: firstly, to present the key findings of GHS 2015. Secondly, it provides
trends across a fourteen year period, i.e. since the GHS was introduced in 2002; and thirdly, it provides a
more in-depth analysis of selected service delivery issues. As with previous reports, this report will not
include tables with specific indicators measured, as these will be included in a more comprehensive
publication of development indicators, entitled Selected development indicators (P0318.2).
Survey scope
The target population of the survey consists of all private households in all nine provinces of South Africa
and residents in workers’ hostels. The survey does not cover other collective living quarters such as
students’ hostels, old-age homes, hospitals, prisons and military barracks, and is therefore only
representative of non-institutionalised and non-military persons or households in South Africa.
The findings of the GHS 2015 provide a critical assessment of the levels of development in the country as
well as the extent of service delivery and the quality of services in a number of key service sectors.
Amongst these are: education, health, disability, social security, religious affiliation and observance,
housing, energy, access to and use of water and sanitation, environment, refuse removal,
telecommunications, transport, household income, access to food, and agriculture. Some topic covered
such as religious affiliation and observance are totally new, whilst others, such as education, were
deepened by focusing on access to work- and textbooks. Below is an executive summary of finding of each
of the areas mentioned above.
2. Summary and key findings
Education
Research confirms that addressing the early childhood development needs of those aged 0–4 years pays
significant dividends. South Africa has, in this regard, made comprehensive early childhood development
(ECD) programmes a very important educational priority. The ECD programmes are offered at day-care
centres, crèches, playgroups, nursery schools and in pre-primary schools. At the time of the survey, 33% of
the 0–4-year-olds attended these kinds of institutions. Disparities are observed in terms of coverage by
province. Approximately 48,1% of South African children aged 0–4 years attended day-care or educational
facilities outside their homes. The highest attendance was reported in Free State (45,6%) and Gauteng
(44,9%). A much lower enrolment was, however, observed amongst children in KwaZulu-Natal (20,7%) and
Northern Cape (26,5%).
Statistics South Africa P0318
General Household Survey, 2015
2
Nationally, 33,2% of individuals aged 5 years and older attended an educational institution. Approximately
88% of South African individuals above the age of five years who attended educational institutions,
attended school, while a further 4,4% attended tertiary institutions. By comparison, only 2,5% of individuals
attended Technical Vocational Education and Training (TVET) colleges. Whilst the percentage in this broad
age group has not changed, at peak ages of 7–15 years, attendance is almost universal. Just over a fifth
(22,5%) of premature school leavers in this age group mentioned ‘a lack of money’ as the reason for not
studying, while 20,3% reportedly fell out due to poor academic performance. Although 9,4% of individuals
left their studies as a result of family commitments (i.e. getting married, minding children and pregnancy), it
is noticeable that a larger percentage of females than males offered this as a reason (18,1% compared to
0,4%). Whilst this observation is accurate, the data also suggest that the ‘No fee’ school system and other
funding initiatives are beginning to show improved results. The percentage of learners who reported that
they were exempted from paying tuition fees increased from 0,4% in 2002 to 64,6% in 2015. Provincially,
92,5% of learners in Limpopo and 79,1% of learners in Eastern Cape attended no-fee schools, compared
to 43% of learners in Western Cape and 41,6% of learners in Gauteng.
Learners’ access to textbooks improved during the year. While just over one-quarter (74,9%) had access to
textbooks in all their subjects at the end of quarter 1 (31 March 2015), almost nine-tenths (81,1%) had
access to textbooks in all their subjects at the end of the school year (quarter 4).
There were approximately 14 million learners at school in 2015. Approximately six per cent of them
attended private schools. Three-quarters (76,2%) of learners who attended public schools benefited from
school feeding schemes. Furthermore, 70% of learners walked to school, while 8% used private vehicles.
Generally, the percentage of learners who experienced corporal punishment at school in 2015 has
decreased nationally since 2011 and 11,3% of learners reportedly experienced corporal punishment at
school in 2015. Corporal punishment was more prevalent at schools in eThekhwini (13,2%) and Mangaung
(11,8%) whilst this sort of punishment was less likely to be found in Ekurhuleni (1,1%) and the City of Cape
Town (1,3%).
Approximately 710 139 students were enrolled at higher educational institutions during 2015. More than
two-thirds (68,5%) of these students were black African. However, proportionally this group is still under-
represented. Only 3,1% of black Africans aged 18 to 29 years were studying as opposed to 14,3% of
Indian/Asian individuals and 15,7% of the white population in this age group. Only 3,7% of the coloured
population was studying during 2015. High enrolment rates were witnessed in eThekwini (13,2%) and
Mangaung (12%) respectively.
Educational attainment outcomes continue to improve with improved access to educational facilities and
services. Among individuals aged 20 years and older, the percentage who attained Grade 12 as their
highest level of education increased from 21,9% in 2002 to 28,0% in 2015. Furthermore the percentage of
individuals with tertiary qualifications improved from 9,3% to 14,1%. The percentage of individuals without
any schooling decreased from 10,6% in 2002 to 5,1% in 2015. Although results show that there were
declines in percentages of persons who had no formal schooling in all the provinces over the period 2002
to 2015.
Whilst functional illiteracy declined from 27,3% to 15,4% between 2002 and 2015, improved access to
schooling has led to a significant decline in the percentage of functionally illiterate individuals in the 20–39
age group. Between 2002 and 2015, the prevalence of functional illiteracy in the age group 20–39 years
declined noticeably for both men (17,2% to 7,3%) and women (15,6% to 4,8%). Nationally, the percentage
of literate persons over the age of 20 years increased slightly from 91,9% in 2010 to 93,7% in 2015. The
adult literacy rate, however, lagged behind this average in provinces such as KwaZulu-Natal (92,4%),
Eastern Cape (90,7%), Mpumalanga (90,2%), North West (89,3%), Limpopo (89,2%) and in Northern Cape
(88%) of the population were literate.

Statistics South Africa P0318
General Household Survey, 2015
3
Health
Nearly seven in every ten (70,5%) households reported that they went to public clinics and hospitals as
their first point of access when households members fell ill or got injured. By comparison, a quarter 25,3%
of households indicated that they would go to private doctors, private clinics or hospitals. Most households
(92,8%) went to the nearest facility of its kind. Of those that preferred to travel further to access health
facilities, 18,9% presented long waiting periods as a reason for securing services beyond their normal
catchment areas. The study found that 81,1% of households that attended public health-care facilities were
either very satisfied or satisfied with the service they received compared to 97,7% of households that
attended private health-care facilities. A slightly larger percentage of households that attended public
facilities (6,1% as opposed to private facilities 0,5%) were very dissatisfied with the service they received.
Nearly a quarter (23,5%) of South African households had at least one member who belonged to a medical
aid scheme. However, a relatively small proportion 17,5% of the individuals in South Africa belonged to a
medical aid scheme in 2015.
Disability
Results showed that 5,1% of South Africans aged 5 years and older were classified as disabled in 2015.
Women (5,5%) were slightly more likely to be disabled than men (4,7%). North West (7,4%), Northern
Cape (7,1%) and Eastern Cape (6,8%) presented the highest prevalence of disability in the country.
Social security
The percentage of individuals that benefited from social grants consistently increased from 12,7% in 2003
to 30,1% in 2015. Simultaneously, the percentage of households that received at least one grant increased
from 29,9% to 45,5% in 2015. More than one-third of individuals in Eastern Cape (40,3%), Limpopo
(38,2%), Northern Cape (36,9%) and KwaZulu-Natal (36,8%) were grant beneficiaries, compared to 17,5%
in Gauteng and 22% in Western Cape. More than one-third of black African individuals (33,5%) received a
social grant, compared to 27% of coloured individuals, and 12% of Indian/Asian individuals. Only 6,3% of
the white population received grants.
Religious affiliation and observance
The vast majority (86,0%) of South Africans described their religious affiliation as ‘Christian’ while a further
5,2% said that they were not affiliated to any religion in particular. More than five per cent of individuals
subscribed to religions that were described as, ‘ancestral, tribal, animist or other traditional African
religions’. Muslims, who comprised 1,9% of the total, were predominantly found in Western Cape, Gauteng
and KwaZulu-Natal. Hindus comprised about 0,9% of the population of South Africa, however 3,3% of the
population of KwaZulu-Natal were Hindus.
Housing
Between 2002 and 2015, the percentage of households that lived in formal dwellings and whose dwellings
were fully owned increased from 52,9% to 53,8% while the percentage of partially owned dwellings
declined from 15,5% to 9,7%. About 13,6% of households had ‘other’ forms of tenure arrangements in
2015.
More than three-quarters (78,1%) of South African households lived in formal dwellings, followed by 14,1%
who lived in informal dwellings, and 6,9% in traditional dwellings. The highest concentration of households
in Limpopo (90,5%) lived in formal dwellings, followed by the households in Northern Cape (86,1%). The
highest percentage of informal dwellings were found in North West (22%) and Gauteng (21%).
At the time of the survey, 14,4% of South African households were living in ‘RDP’ or state-subsidised
dwellings. A higher percentage of female-headed (18%) than male-headed households (12%) received a
government housing subsidy. Some residents have, however, raised concerns about the quality of
subsidised houses and 14,2% said that the walls were weak or very weak while 13,8% regarded the
dwellings’ roofs as weak or very weak.

Statistics South Africa P0318
General Household Survey, 2015
4
Energy
The percentage of households connected to the electricity supply from the mains has increased
consistently from 77,1% in 2002 to 85,5% in 2015. Percentage of households that used electricity for
cooking increased from 58% in 2002 to 78,1% in 2015. The use of electricity as a source of energy for
cooking was highest in Free State (86,9%), Northern Cape (85,9%) and Western Cape (85,4%) and lowest
in more rural provinces such as Limpopo (60,1%), Eastern Cape (73,1%) and Mpumalanga (74,2%) where
alternative fuels such as wood are, perhaps, more accessible and affordable.
Water access and use
Although 89,4% of South African households had access to piped water in 2015, only 74,9% of Eastern
Cape households enjoyed such access. This situation does, however, represent a substantial improvement
from that of 2002 when only 56,3% of households in this province had access to piped water. There were
very high proportions of households in the City of Cape Town (99,5%), Mangaung (99%), Nelson Mandela
Bay (98,9%), the City of Johannesburg (98,5%) and Ekurhuleni (98,5%) that had access to water either in
their dwellings, off-site, or on-site.
Nationally, 62% of households rated the quality of water-related services they received as ‘good’.
Satisfaction has, however, been eroding steadily since 2005 when 76,4% of users rated the services as
good. An estimated 45,8% of households had access to piped water in their dwellings in 2015. A further
27% accessed water on site while 13,9% relied on communal taps and 2,7% relied on neighbours’ taps.
Although generally households’ access to water is improving, 4,4% of households still had to fetch water
from rivers, streams, stagnant water pools and dams, wells and springs in 2015. This is a decrease of more
than five percentage points from 9,5% of households that had to access water from these sources in 2002.
Sanitation
Nationally, the percentage of households with access to ‘RDP─standard’ sanitation increased from 62,3%
in 2002 to 80% in 2015. The majority of households in Western Cape (93,3%) and Gauteng (91%) had
access to adequate sanitation, while about half those in Limpopo (54%) and just below two-thirds of those
in Mpumalanga (65,8%) had adequate access. The majority of households in the City of Johannesburg
(96,9%) and Nelson Mandela Bay (94,6%) had access to RDP standard toilet facilities, while households in
the City of Tshwane (82,0%) and eThekwini (83,5%) were the least likely to have to RDP standard toilet
facilities. Despite the improved access to RDP-standard sanitation facilities, many households continue to
be without any proper sanitation facilities. Nationally, the percentage of households that continued to live
without proper sanitation facilities had been declining consistently between 2002 and 2015, decreasing
from 12,3% to 4,7% during this period.
About one-quarter of households expressed concern of poor lighting and inadequate hygiene, while 18,2%
felt that their physical safeties were threatened when using the toilet in shared facilities. One-fifth
complained that there was no water to wash their hands after they had used the toilet, and another 16,7%
pointed to long waiting times.
Refuse removal
The percentage of households for which refuse were removed at least once per week increased from
56,7% in 2002 to 63,5% in 2015. The percentage of households that had to rely on their own or on
communal rubbish dumps; or who had no facilities at all, decreased. Various modes of refuse removal are
closely aligned with particular geographic areas. Households in urban areas were much more likely to
receive some rubbish removal service than those in rural areas, and rural households were therefore much
more likely to rely on their own rubbish dumps. In 2015, 54% of South African households were paying for
the removal of their refuse. In addition to the 61,2% of households for whom refuse was removed on a
weekly basis by the municipality. The highest percentage of households for which refuse was removed at
least once per week was observed in the City of Johannesburg (95,3%) and Mangaung (92,4%).

Statistics South Africa P0318
General Household Survey, 2015
5
Telecommunications
The survey found that there was high access to telecommunications for households nationally, as only
3,5% of households did not have access to either landlines or cellular phones in 2015. By comparison,
85,5% of households had access to at least one cellular phone, while 10,9% of households had access to
both a landline and a cellular phone. Only 0,1% of households had only a landline. However access to
these means of communication differed by province. Households in historically rural provinces such as
Mpumalanga (94,4%) and Limpopo (94,1%) were very reliant on the more accessible cellular telephones
than landlines. By contrast, a combination of both cellular phones and landlines in households were most
prevalent in the more affluent provinces, namely Western Cape (26,2%) and Gauteng (14,1%).
Half of South African households (53,5%) had at least one member who used the Internet either at home,
workplace, place of study, or Internet cafés. More than half of households in Gauteng (65,7%) and Western
Cape (63,3%) had access to the Internet while only just over one-third of households in Limpopo (39,3%)
had access to the Internet.
Transport
Taxis were the most commonly used form of public/subsidised transport in South Africa as 38,1% of
households had at least one household member who used a minibus/sedan taxi or bakkie taxi during the
week preceding the survey. More than two-thirds (66,5%) of the individuals that attended an educational
institution walked to get there compared to less than one-third (20%) of those that went to work. Only 9,3%
of individuals travelling to school travelled by private car while a further 6,9% used taxis. Private vehicles
remained the most common source of transport for individuals travelling to work (33%), followed by taxis
(22,9%). Approximately 11,8% of the working population worked from home and therefore needed no
transport.
Environment
Waste removal problems and littering (39%) as well as land degradation and soil erosion (31,2%) continue
to be the two environmental problems that concerned the highest percentage of households. The
percentage of households that felt that there were problems with littering and waste removal in their areas
increased significantly since 2003 when this question was first included in the questionnaire. Then 28,8% of
households regarded this as a problem. In 2015, a lower percentage of households considered air pollution
as a problem (19,5%).
Household assets and income sources
Results showed that 29,8% of households owned at least one vehicle, and that about one-fifth (20,3%)
owned one or more computers. More than eight-tenths of households owned television sets (80,8%) and
electric stoves (84,9%), while more than one-third (33,8%) owned washing machines. While a large
percentage of rural households owned electric stoves (74,9%), televisions (69,8%) and refrigerators
(57,7%) their ownership of vehicles (13,9%), washing machines (13,8%) and computers (7,5%) were much
more limited. By contrast, three-quarters or more of metropolitan and urban households owned
refrigerators, televisions and electric stoves, while ownership of computers, vehicles and washing
machines was also more common.
Most households in South Africa continued to rely on incomes from salaries. Nationally, salaries (65,5%)
and grants (46,2%) were received by the highest percentages of households. Provincially, the largest
percentage of households that earned salaries were found in Western Cape (76,8%) and Gauteng (75%).
Grants were more prevalent than salaries as a source of income in Eastern Cape (59,8%) and Limpopo
(58,9%). Remittances as a source of income played an important role in most provinces, but especially in
Eastern Cape (24,4%), Limpopo (23,7%) and Mpumalanga (21,3%).
Statistics South Africa P0318
General Household Survey, 2015
6
Access to food
Although household access to food has improved since 2002, it has but remained static since 2011. The
Household Food Insecurity Access Scale which is aimed at determining households’ access to food
showed that the percentage of South African households with inadequate or severely inadequate access to
food decreased from 23,9% in 2010 to 22,6% in 2015. During this time, the percentage of individuals that
were at risk decreased from 28,6% to 26,4%. Between 2002 and 2015, the percentage of households that
experienced hunger decreased from 23,8% to 11,3% while the percentage of individuals who experienced
hunger decreased from 29,3% to 13,1%.
Agriculture
Less than a fifth of South African households (16,9%) were involved in agricultural production. Most crop
production took place in backyard gardens, and households involved in agricultural activities were mostly
engaged in the production of food. Food production consisted of grains (51,6%), fruit and vegetables
(50,8%), Livestock farming (34,3%) and poultry (33,7%). Only 12,1% of the households involved in
agriculture reported getting agricultural-related support from the government. Nationally, slightly more than
two per cent (2,1%) of the households reported receiving training and 6,8% received dipping/ livestock
vaccination services.
Pali Lehohla
Statistician-General

Statistics South Africa P0318
General Household Survey, 2015
7
3. Basic population statistics
The population figures in Table 1 are based on the mid-year population estimates that were generated by
applying modelled projections that incorporated the results of Census 2011 as well as the most recent
demographic information available at the time. The new estimates were first used with the GHS 2012 that
was released in 2013. To ensure comparability, historical data files (2002–2011) were also re-calibrated in
2012, based on the 2013 model. In order to maintain the comparability of population estimates used in the
GHS, the 2013 model will be used until a new projection, with new assumptions and input data, is
introduced into the GHS series. Please consult Statistical release P0302 for the most recent population
estimates.
Table 1 shows that the population of South Africa has increased from 45,8 million in 2002 to 54,4 million in
2015. In 2015, Gauteng was the most populous province, with more than 13 million residents, followed by
KwaZulu-Natal and Eastern Cape with respectively 10,6 million and 6,6 million residents. Northern Cape
remained the least populous province in the country.
Table 1: Population per province, 2002–2015
Province
Total population (Thousands)
2002 2004 2006 2007 2008 2009 2010 2011 2012 2013 2014 2015
WC 4 851 5 051 5 256 5 360 5 466 5 573 5 682 5 792 5 904 6 017 6 131 6 246
EC 6 290 6 343 6 400 6 431 6 460 6 491 6 522 6 554 6 586 6 620 6 656 6 693
NC 1 056 1 075 1 095 1 105 1 114 1 124 1 134 1 143 1 153 1 163 1 173 1 182
FS 2 724 2 726 2 729 2 732 2 735 2 737 2 740 2 744 2 749 2 753 2 758 2 763
KZN 9 326 9 517 9 715 9 816 9 918 10 023 10 129 10 237 10 346 10 457 10 571 10 688
NW 3 101 3 182 3 266 3 310 3 355 3 401 3 448 3 497 3 547 3 598 3 650 3 703
GP 10 048 10 501 10 965 11 202 11 446 11 694 11 946 12 202 12 464 12 728 12 996 13 268
MP 3 560 3 661 3 762 3 814 3 866 3 917 3 970 4 022 4 075 4 128 4 182 4 236
LP 4 852 4 964 5 081 5 141 5 201 5 262 5 325 5 388 5 452 5 518 5 585 5 654
RSA 45 809 47 020 48 270 48 910 49 561 50 223 50 896 51 580 52 275 52 982 53 701 54 432
Table 2: Number of households per province, 2002–2015
Province
Number of households (Thousands)
2002 2004 2006 2007 2008 2009 2010 2011 2012 2013 2014 2015
WC 1 198 1 269 1 348 1 389 1 432 1 477 1 524 1 571 1 619 1 669 1 720 1 775
EC 1 405 1 445 1 482 1 503 1 525 1 549 1 573 1 600 1 631 1 663 1 695 1 727
NC 231 242 254 261 268 275 282 289 296 304 312 320
FS 686 710 738 755 773 790 806 823 843 863 883 906
KZN 1 902 1 999 2 101 2 161 2 224 2 290 2 358 2 428 2 504 2 583 2 663 2 747
NW 837 878 926 952 980 1 010 1 040 1 071 1 105 1 140 1 177 1 215
GP 2 743 2 960 3 217 3 356 3 504 3 661 3 823 3 990 4 153 4 323 4 501 4 690
MP 774 825 882 914 947 981 1 015 1 051 1 088 1 127 1 168 1 211
LP 1 037 1 096 1 159 1 195 1 232 1 270 1 309 1 350 1 392 1 436 1 483 1 532
RSA 10 814 11 425 12 107 12 485 12 886 13 303 13 731 14 173 14 631 15 107 15 602 16 122
Table 2 outlines the estimated number of households to which the GHS data were benchmarked in each
province. Households estimates, developed using the United National headship ratio methodology, were
used to calibrate the household files. This model estimates that the number of households increased from
10,8 million in 2002 to 16,1 million in 2015. It is estimated that Gauteng had the largest number of
households, followed by KwaZulu-Natal, Western Cape and Eastern Cape. Northern Cape, the least
populous province, also had the least number of households.

Statistics South Africa P0318
General Household Survey, 2015
8
4. Education
4.1 Introduction
All South Africans have a right to basic education and the Bill of Rights obliges the government to
progressively make education available and accessible through reasonable measures. Human resources
constitute the ultimate basis for the wealth of a nation, and it is therefore vital that a country develops the
skills and knowledge of its residents to the greater benefit of all.
By tracking a number of core education and education-related indicators on an annual basis, particular
aspects of the circumstances of learners can be analysed. As noted earlier, the focus of this section is to
provide an overview of various aspects of the education profile of South Africans over the period 2002 to
2015. In this regard, the report will highlight important patterns and trends with respect to educational
attendance of persons aged 0–4 years, individuals currently attending schools and higher education
institutions, general attendance rates and educational achievements of individuals aged 20 years and
older.
4.2 Educational profile of learners aged 0–4 years
Policy decisions and investments by government in access to early childhood development (ECD)
provisioning has increased over time. It is unfortunately very difficult to measure the direct contribution of
the state towards ECD activities since a household based survey is unlikely to accurately identify the
suppliers of ECD services. That notwithstanding, access to ECD activities among children aged 0-4 has
overall increased over time.
Table 3: Percentage of children aged 0─4 years using different child care arrangements by province, 2015
Care arrangements for children aged 0-4 years
Province (Per cent)
WC EC NC FS KZN NW GP MP LP RSA
Grade R, Pre-school, nursery school, crèche, edu-care centre 36,5 30,5 26,5 45,6 20,7 29,9 44,9 27,3 38,6 33,0
Day mother 12,5 6,2 7,3 17,1 19,8 4,4 21,9 10,6 11,7 14,1
At home with parent or guardian 41,9 57,6 59,5 29,3 48,6 60,9 29,2 53,4 44,8 45,8
At home with another adult 7,5 4,8 4,8 7,2 9,3 2,8 3,5 7,3 4,0 5,9
At home with someone younger than 18 years 0,0 0,1 0,0 0,0 0,2 0,0 0,1 0,3 0,2 0,1
At somebody else’s dwelling 1,7 0,6 1,2 0,9 1,4 1,8 0,4 1,1 0,6 1,0
Other 0,0 0,2 0,9 0,0 0,0 0,2 0,1 0,0 0,2 0,1
Total 100,0 100,0 100,0 100,0 100,0 100,0 100,0 100,0 100,0 100,0
Table 3 summarises the attendance of young children aged 0–4 years at different types of ECD facilities or
care arrangements, and the extent to which children were exposed to stimulation activities across
provinces during 2015. Approximately 48,1% of South African children aged 0–4 years attended day-care
or educational facilities outside their homes. The highest edu-care centre attendance was reported in Free
State (45,6%) and Gauteng (44,9%). More than a quarter of children attended these facilities or centres in
Northern Cape (26,5%). Interestingly although KwaZulu-Natal and Eastern Cape in particular had very
higher populations, the parents or care givers of children aged 0 to 4 tended to prefer to keep the children
at home with a parent or guardian.
Statistics South Africa P0318
General Household Survey, 2015
9
On the whole, and in general for the country, 45,8% of children remained home with their parents or
guardians while another 5,9% were looked after by other adults. A larger percentage of children stayed at
home with their parents or other adults in North West (63,7%) and less so in Gauteng (32,7%).
4.3 General attendance of individuals aged 5 years and older at educational institutions
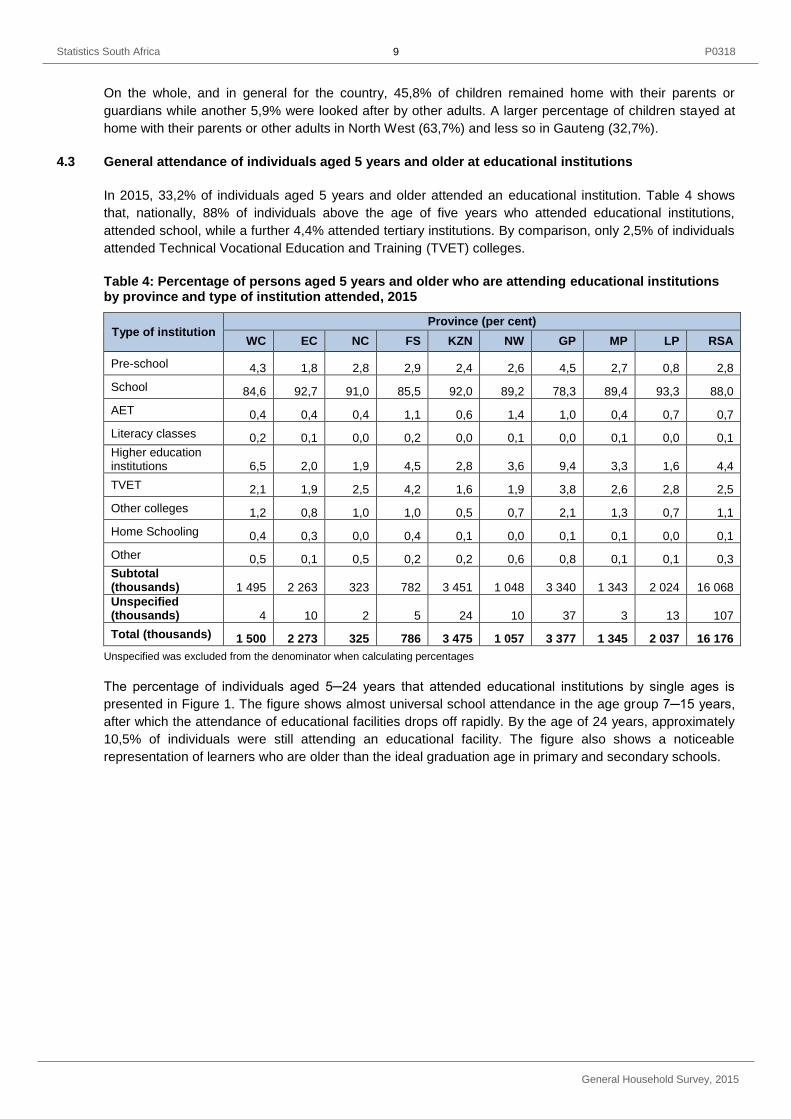
In 2015, 33,2% of individuals aged 5 years and older attended an educational institution. Table 4 shows
that, nationally, 88% of individuals above the age of five years who attended educational institutions,
attended school, while a further 4,4% attended tertiary institutions. By comparison, only 2,5% of individuals
attended Technical Vocational Education and Training (TVET) colleges.
Table 4: Percentage of persons aged 5 years and older who are attending educational institutions by province and type of institution attended, 2015
Type of institution Province (per cent)
WC EC NC FS KZN NW GP MP LP RSA
Pre-school 4,3 1,8 2,8 2,9 2,4 2,6 4,5 2,7 0,8 2,8
School 84,6 92,7 91,0 85,5 92,0 89,2 78,3 89,4 93,3 88,0
AET 0,4 0,4 0,4 1,1 0,6 1,4 1,0 0,4 0,7 0,7
Literacy classes 0,2 0,1 0,0 0,2 0,0 0,1 0,0 0,1 0,0 0,1
Higher education institutions 6,5 2,0 1,9 4,5 2,8 3,6 9,4 3,3 1,6 4,4
TVET 2,1 1,9 2,5 4,2 1,6 1,9 3,8 2,6 2,8 2,5
Other colleges 1,2 0,8 1,0 1,0 0,5 0,7 2,1 1,3 0,7 1,1
Home Schooling 0,4 0,3 0,0 0,4 0,1 0,0 0,1 0,1 0,0 0,1
Other 0,5 0,1 0,5 0,2 0,2 0,6 0,8 0,1 0,1 0,3
Subtotal (thousands) 1 495 2 263 323 782 3 451 1 048 3 340 1 343 2 024 16 068
Unspecified (thousands) 4 10 2 5 24 10 37 3 13 107
Total (thousands) 1 500 2 273 325 786 3 475 1 057 3 377 1 345 2 037 16 176
Unspecified was excluded from the denominator when calculating percentages
The percentage of individuals aged 5─24 years that attended educational institutions by single ages is
presented in Figure 1. The figure shows almost universal school attendance in the age group 7─15 years,
after which the attendance of educational facilities drops off rapidly. By the age of 24 years, approximately
10,5% of individuals were still attending an educational facility. The figure also shows a noticeable
representation of learners who are older than the ideal graduation age in primary and secondary schools.

Statistics South Africa P0318
General Household Survey, 2015
10
Figure 1 : Type of educational institution attended by population 5─24 years, 2015
The proportion of persons aged 7 to 24 who attended educational institutions remained relatively stable
between 2002 and 2015, increasing only slightly from 73,6% to 73,9% over this time. Enrolment rates
declined in four of the nine provinces over this period. The highest enrolment in 2015 was recorded in
Limpopo (80,4%), and the lowest in Western Cape (66,5%). This is presented in Figure 2. Figure 3 shows
the percentage of learners aged 7 to 24 years who attended educational institution by Metropolitan area.
The highest percentage was observed in Nelson Mandela Bay (78,5%), followed by Buffalo City (78,1%)
and Mangaung (77,2%).
Figure 2: Percentage of persons aged 7 to 24 years who attended educational institutions by province, 2002 and 2015

Statistics South Africa P0318
General Household Survey, 2015
11
Figure 3: Percentage of persons aged 7 to 24 years who attended educational institutions
by Metropolitan areas, 2015
The main reasons provided by males and females in the age group 7–18 years for not attending any
educational institutions are depicted in Figure 4. Nearly one-quarter (22,5%) of learners cited a lack of
money as the main reason for not attending an educational institution while 20,3% reportedly fell out due to
poor academic performance. Although 9,4% of individuals left their studies as a result of family
commitments (i.e. getting married, minding children and pregnancy), it is noticeable that females were
much more likely to offer these as reasons than males (18,1% compared to 0,4%). Approximately 9,1% of
individuals reported that education was useless. More than one per cent of households felt that the
distance to school, or difficulties they faced in getting to school were primary concerns.
Figure 4: Percentage distribution of main reasons given by persons aged 7 to 18 years for not attending an educational institution, by sex, 2015

Statistics South Africa P0318
General Household Survey, 2015
12
Although inadequate access to money to pay for fees remain a major hurdle for learners, Figure 5 shows
that attendance of no-fee schools have increased sharply over the past decade. The percentage of
learners aged 5 years and older who attended schools where no tuition fees were levied increased from
0,4% in 2002 to 64,6% in 2015. Provincially, 92,5% of learners in Limpopo and 79,1% of learners in
Eastern Cape attended no-fee schools, compared to 43% of learners in Western Cape and 41,6% of
learners in Gauteng. Some 19,4% of learners benefitted from fee reductions or partial bursaries in 2015.
Figure 5: Percentage of those aged 5 years and older who attended schools and who do not pay tuition fees, 2002─2015
Table 5 presents some problems experienced by learners at the public schools they were enrolled at during
the 2015 school year. Nationally, high fees (4,5%) and a lack of books (4,3%) were singled out as the most
important problems, followed by bad facilities (3,7%) and large classes (3,6%). Learners in Mpumalanga
(7,4%) and KwaZulu-Natal (5,9%) were most concerned about a lack of books. Learners in Free State were
least likely to complain about high fees (1,4%) while those in Western Cape (7,9%) were most likely to
complain about high fees.
Table 5: Nature of the problems experienced by all learners who attended public schools per province, 2015
Problems experienced in public school
Province (Per cent)
WC EC NC FS KZN NW GP MP LP SA
Lack of books 3,4 2,2 2,7 5,4 5,9 5,4 3,9 7,4 2,5 4,3
Fees too high 7,9 2,5 1,8 1,4 4,8 6,8 4,5 6,4 2,7 4,5
Classes too large 5,1 3,1 0,4 2,7 3,3 3,9 5,7 4,4 1,1 3,6
Facilities bad 4,8 5,0 0,6 5,0 4,5 4,6 2,0 5,2 1,2 3,7
Lack of teachers 2,5 7,5 1,4 1,8 1,8 5,4 1,7 1,5 1,1 2,8
Poor teaching 3,2 0,7 0,5 1,3 1,3 2,8 2,1 1,0 1,0 1,6
Teachers absent 2,6 1,3 0,9 1,4 1,5 1,9 2,2 2,6 0,8 1,7
Teachers striking 1,8 0,5 0,0 0,6 1,2 0,7 1,1 1,1 1,6 1,1
Figure 6 shows that learners’ access to textbooks generally improved slightly between 2014 and 2015. In
2014 the percentage of learners with access to textbooks increased consistently on a quarterly basis from
74% in quarter 1 to 80,4% in quarter 4. Access to textbooks was much more constrained in 2015. In 2015,

Statistics South Africa P0318
General Household Survey, 2015
13
only 74,9% of learners had access to textbooks in all their subjects in quarter 1. This increased to 81,1% in
quarter 4, slightly higher than the percentage of learners that had access to textbooks in all their subjects
during quarter 4 of 2014 (80,4%). It is, however, important to note that a smaller percentage of learners had
access to textbooks in most of their subjects in 2015 compared to 2014 except for the second quarter.
Figure 6: Percentage of persons who attended grade 10─12 in a public school by their access to text books by quarter, 2014 and 2015
4.4 School attendance
There were approximately 14,1 million learners at school in 2015. The largest percentage of these learners
attended schools in KwaZulu-Natal (22,5%) and (Gauteng (18,5%).
Information about the type of schools that these learners attended revealed that approximately six per cent
of learners attended private schools, but there were large variations between provinces as to this type of
school attendance. While 16,4% of learners in Gauteng and 5,3% of learners in Western Cape attended
private schools, only 3,5% of learners in Northern Cape and 3,1% of learners in Limpopo attended these
institutions.
Large variations were also observed in terms of transport used to travel to school. While nearly three-
quarters (70%) of learners walked to school, a further 8% used private vehicles. Another 5,1% travelled to
school by taxi or minibus taxi. The time it took the learners to get to school also formed part of the survey.
This information revealed that more than eighty per cent of learners (82,8%) needed 30 minutes or less to
get to school. In addition, it seemed that most learners (84,7%) preferred to attend the nearest institution of
its kind to their place of residence.
Figure 7 presents the percentage of individuals attending public schools and who benefited from a school
nutrition programme. Almost three-quarters (76,2% ) of learners who attended public schools benefited
from school feeding schemes. Learners in Limpopo (94,1%), Eastern Cape (89,2%), Mpumalanga (84,8%)
and Northern Cape (84,8%) were the most likely to benefit from this programme while learners in Gauteng
50,4% and Western Cape 55,1% were least likely to benefit from this type of programme. Large percentage
point increases of learners that benefitted from school feeding schemes between 2010 and 2015 are noted
in North West (14,4%) and Free State (13,4%). By comparison, the percentage of learners that attended
public schools and benefitted from feeding schemes increased by 2,1% percentage points in Western
Cape over the same period.
2014 2015 2014 2015 2014 2015 2014 2015
Quarter 1 Quarter 2 Quarter 3 Quarter 4
Do not know 0,5 0,3 0,4 0,2 0,2 0,3 0,0 0,2
None of his or her subject 2,9 1,3 1,2 0,9 1,6 0,8 0,3 0,6
Some of his or her subject 5,5 6,6 4,7 3,0 4,7 3,6 3,3 3,1
Most of his/her subject 17,1 16,9 15,7 17,0 16,3 15,4 16,1 15,0
All his/her subject 74,0 74,9 78,0 78,9 77,3 79,9 80,4 81,1
Pe
rce
nta
ge
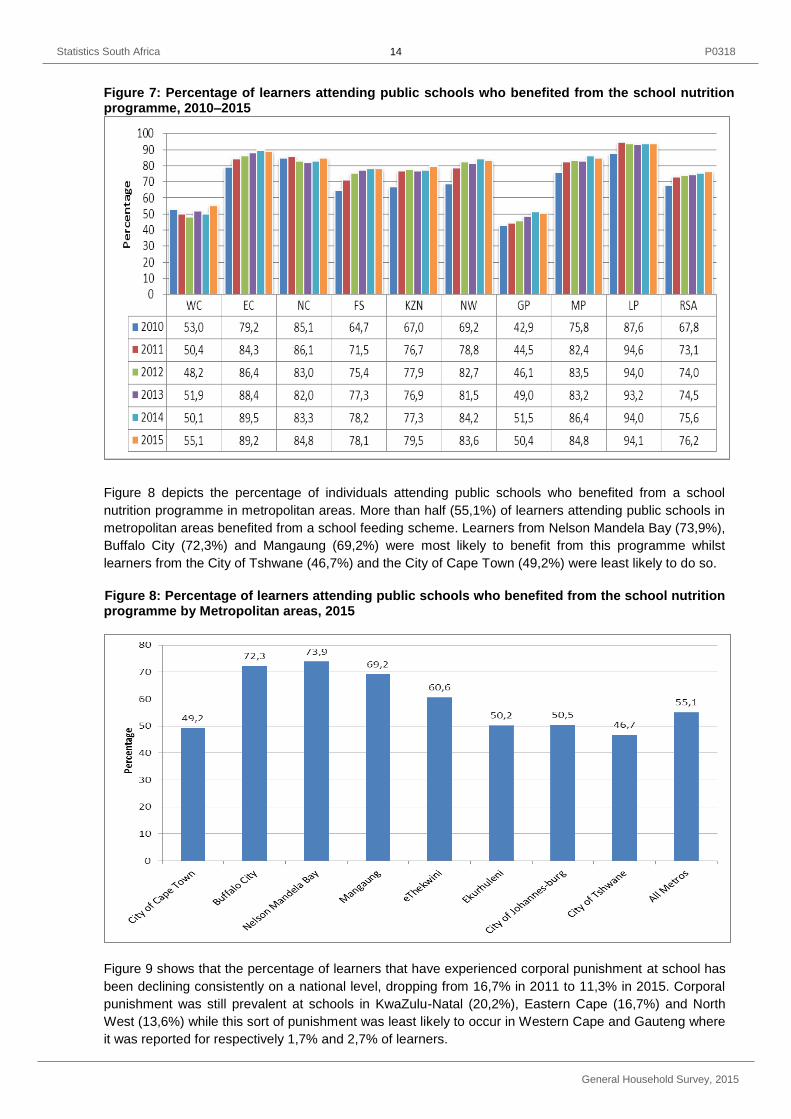
Statistics South Africa P0318
General Household Survey, 2015
14
Figure 7: Percentage of learners attending public schools who benefited from the school nutrition programme, 2010–2015
Figure 8 depicts the percentage of individuals attending public schools who benefited from a school
nutrition programme in metropolitan areas. More than half (55,1%) of learners attending public schools in
metropolitan areas benefited from a school feeding scheme. Learners from Nelson Mandela Bay (73,9%),
Buffalo City (72,3%) and Mangaung (69,2%) were most likely to benefit from this programme whilst
learners from the City of Tshwane (46,7%) and the City of Cape Town (49,2%) were least likely to do so.
Figure 8: Percentage of learners attending public schools who benefited from the school nutrition
programme by Metropolitan areas, 2015
Figure 9 shows that the percentage of learners that have experienced corporal punishment at school has
been declining consistently on a national level, dropping from 16,7% in 2011 to 11,3% in 2015. Corporal
punishment was still prevalent at schools in KwaZulu-Natal (20,2%), Eastern Cape (16,7%) and North
West (13,6%) while this sort of punishment was least likely to occur in Western Cape and Gauteng where
it was reported for respectively 1,7% and 2,7% of learners.

Statistics South Africa P0318
General Household Survey, 2015
15
Figure 9: Percentage of learners who experienced corporal punishment at school by province, 2011─2015
Figure 10 shows that corporal punishment was more prevalent at schools in eThekhwini (13,2%) and Mangaung (11,8%) whilst this sort of punishment was less likely to be found in Ekurhuleni (1,1%) and the City of Cape Town (1,3%). Figure 10: Percentage of learners who experienced corporal punishment at school by Metropolitan areas, 2015
4.5 Higher education institution attendance
The survey estimates that 710 139 students were enrolled at higher education institutions (universities and
universities of technology) in 2015. More than two-thirds (68,5%) of these students were black African,
while 18,2% were white; 7,2% were Indian/Asian and 6,2% were coloured.
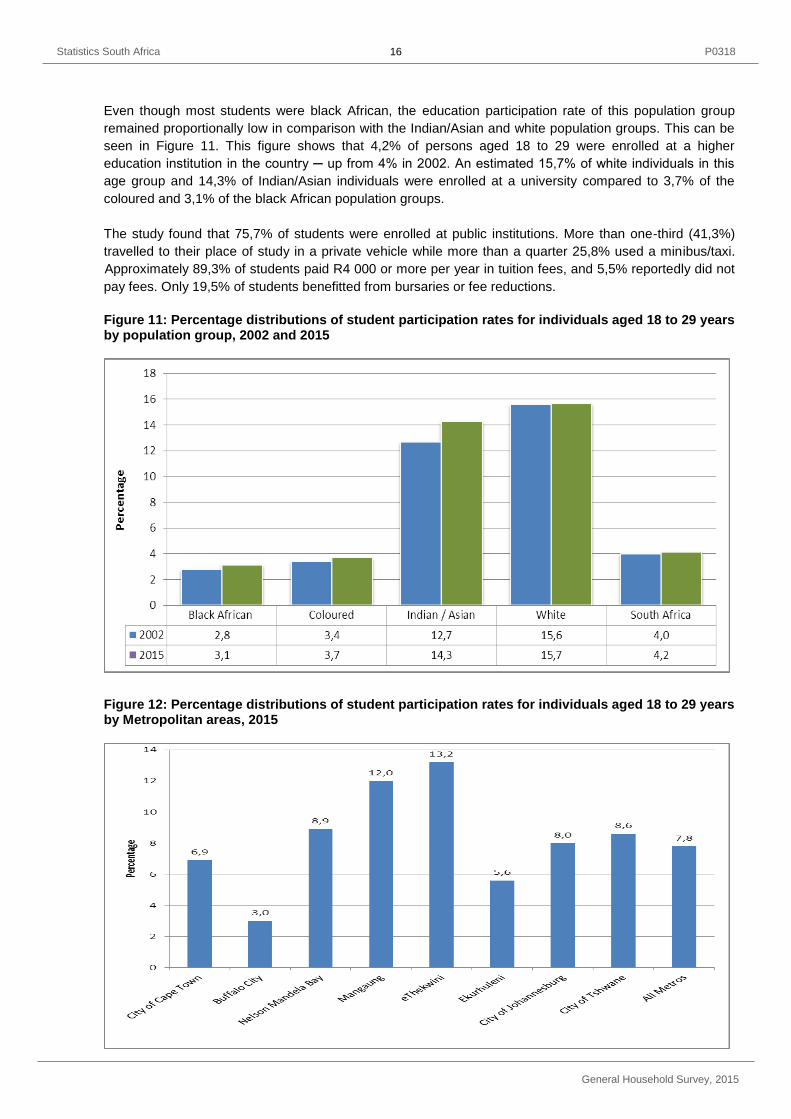
Statistics South Africa P0318
General Household Survey, 2015
16
Even though most students were black African, the education participation rate of this population group
remained proportionally low in comparison with the Indian/Asian and white population groups. This can be
seen in Figure 11. This figure shows that 4,2% of persons aged 18 to 29 were enrolled at a higher
education institution in the country ─ up from 4% in 2002. An estimated 15,7% of white individuals in this
age group and 14,3% of Indian/Asian individuals were enrolled at a university compared to 3,7% of the
coloured and 3,1% of the black African population groups.
The study found that 75,7% of students were enrolled at public institutions. More than one-third (41,3%)
travelled to their place of study in a private vehicle while more than a quarter 25,8% used a minibus/taxi.
Approximately 89,3% of students paid R4 000 or more per year in tuition fees, and 5,5% reportedly did not
pay fees. Only 19,5% of students benefitted from bursaries or fee reductions.
Figure 11: Percentage distributions of student participation rates for individuals aged 18 to 29 years by population group, 2002 and 2015
Figure 12: Percentage distributions of student participation rates for individuals aged 18 to 29 years by Metropolitan areas, 2015
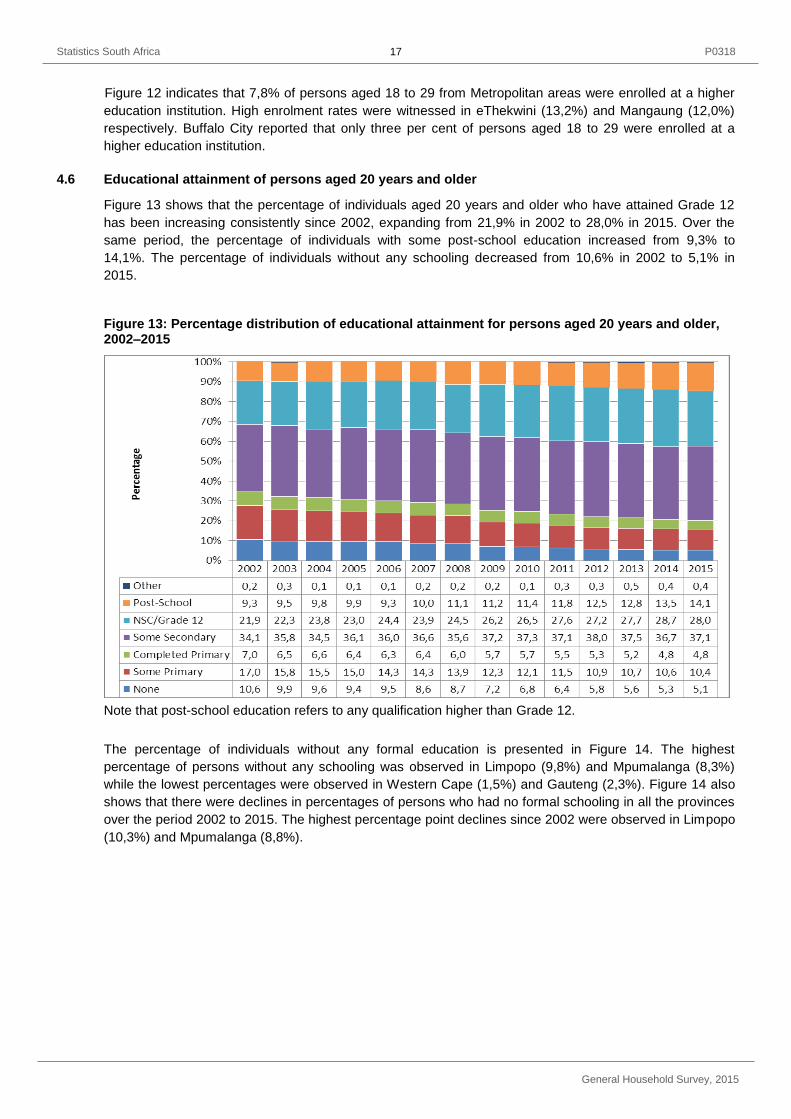
Statistics South Africa P0318
General Household Survey, 2015
17
Figure 12 indicates that 7,8% of persons aged 18 to 29 from Metropolitan areas were enrolled at a higher
education institution. High enrolment rates were witnessed in eThekwini (13,2%) and Mangaung (12,0%)
respectively. Buffalo City reported that only three per cent of persons aged 18 to 29 were enrolled at a
higher education institution.
4.6 Educational attainment of persons aged 20 years and older
Figure 13 shows that the percentage of individuals aged 20 years and older who have attained Grade 12
has been increasing consistently since 2002, expanding from 21,9% in 2002 to 28,0% in 2015. Over the
same period, the percentage of individuals with some post-school education increased from 9,3% to
14,1%. The percentage of individuals without any schooling decreased from 10,6% in 2002 to 5,1% in
2015.
Figure 13: Percentage distribution of educational attainment for persons aged 20 years and older, 2002–2015
Note that post-school education refers to any qualification higher than Grade 12.
The percentage of individuals without any formal education is presented in Figure 14. The highest
percentage of persons without any schooling was observed in Limpopo (9,8%) and Mpumalanga (8,3%)
while the lowest percentages were observed in Western Cape (1,5%) and Gauteng (2,3%). Figure 14 also
shows that there were declines in percentages of persons who had no formal schooling in all the provinces
over the period 2002 to 2015. The highest percentage point declines since 2002 were observed in Limpopo
(10,3%) and Mpumalanga (8,8%).

Statistics South Africa P0318
General Household Survey, 2015
18
Figure 14: Percentage of persons aged 20 years and older with no formal schooling per province, 2002 and 2015
The survey also investigated functional illiteracy among individuals aged 20 years and older. Functional
illiteracy refers to individuals who have either received no schooling or who have not completed Grade 7
yet. According to Figure 15, the percentage of individuals over the age of 20 years who could be regarded
as functionally illiterate has declined from 27,3% in 2002 to 15,4% in 2015.
Individuals over the age of 60 years have consistently remained most likely to be functionally illiterate,
followed by individuals in the age groups 40–59 and 20–39. Improved access to schooling has led to a
significant decline in the percentage of functionally illiterate individuals in the 20–39 age group. Between
2002 and 2015, the prevalence of functional illiteracy in the age group 20–39 years declined noticeably for
both men (17,2% to 7,3%) and women (15,6% to 4,8%).
With the exception of women in the age group 20–39, women remain more likely to be functionally illiterate
across all age groups. The difference between men and women has, however, declined significantly over
time. Whereas women over the age of 60 years were much more likely to be functionally illiterate than
males in 2015 (47,4% compared to 38,5%). However, the difference has declined in each successive age
group, to the point that women in the age group 20–39 were actually less likely to be functionally illiterate
than their male peers in 2015 (4,8% compared to 7,3%).
Literacy rates can be used as a key social indicator of development. A simple definition of literacy is the
ability to read and write in at least one language. The simplicity of this measure is, however, complicated by
the need to know what is read and written, and for what purpose and also how well it is done. Because it is
so difficult to measure literacy, the GHS has historically measured adult literacy rates based on an
individual’s functional literacy, e.g. whether they have completed at least Grade 7 or not. Since a specific
educational achievement is, however, not necessarily a good reflection of an individual’s literacy ability, a
question that directly measures literacy was introduced in 2009. The question requires respondents to
indicate whether they have 'no difficulty', 'some difficulty', 'a lot of difficulty' or are 'unable to' read
newspapers, magazines and books in at least one language; or write a letter in at least one language.

Statistics South Africa P0318
General Household Survey, 2015
19
Figure 15: Percentage of persons aged 20 years and older with no formal education or highest level of education less than Grade 7 (functional illiteracy) within each gender group, 2002–2015
Figure 16: Adult literacy rates for person aged 20 years and older by province, 2010–2015
Figure 16 shows that, nationally, the percentage of literate persons over the age of 20 years increased from
91,9% in 2010 to 93,7% in 2015. Provincially, 97,8% of individuals in Western Cape and 97,7% in Gauteng
were literate compared to 88,0% of individuals in Northern Cape. According to Figure 17, almost 99% of
persons aged 20 years and older were literate in the City of Cape Town, Nelson Mandela Bay and the City
of Johannesburg while the lowest literacy rates (94,8%) were recorded for Buffalo City.

Statistics South Africa P0318
General Household Survey, 2015
20
Figure 17: Adult literacy rates for person aged 20 years and older by Metropolitan areas, 2015
5. Health
5.1 Health care provision and quality
Figure 18 shows that the majority of South Africans perceived their health as either ‘good’ or ‘excellent’. A
larger percentage of males than females rated their health as ‘Excellent’ (33,1%) compared to females
(30,6%). Coloured individuals were most likely to rate their health as ‘Excellent’ and least likely to rate it as
‘poor’. With the exception of the coloured population group, the figure generally shows very little variation
between the self-perceived health assessments of different population groups.
Figure 18: Percentage distribution of self-reported health status of individuals by sex and
population group, 2015

Statistics South Africa P0318
General Household Survey, 2015
21
The type of health-care facility consulted first by households when household members fall ill or have
accidents is presented in Figure 19. The figure shows that about 70,5% of households said that they would
first go to public clinics or hospitals compared to 27,7% of households that said that they would first consult
a private doctor, or go to a private clinic or hospital. Only 0,5% of respondents said that they would first go
to a traditional healer. It is noticeable that the percentage of households that would go to public or private
facilities have remained relatively constant since 2004 when the question was first asked in the GHS. The
percentage of households that would first go to public clinics increased noticeably while those that
indicated that they would first go to public hospitals decreased. The large change in the percentage of
individuals who used private and public hospitals between 2008 and 2009 is due to a change in the
questions that were asked during the two years.
More than nine-tenths (92,8%) of all households used the nearest health facility of its kind. Those who did
not use the nearest facility generally travelled elsewhere because:
They preferred to use a private health institution (40,9%);
The waiting period was too long (18,9%);
Drugs that were needed were not available at their nearest facility (7,8%); or
Staff was rude/uncaring or turned patients away (5,6%).
Figure 19: Percentage distribution of the type of health-care facility consulted first by the
households when members fall ill or get injured, 2004–2015
Table 6 shows that the users of private healthcare facilities seemed to be more satisfied with those facilities
than users of public healthcare facilities across all provinces. Whereas 97,7% of users were satisfied with
private facilities (91,9% were very satisfied), only 81,1% of users of public healthcare facilities were
somewhat satisfied or very satisfied. Only 57,6% of individuals that used public healthcare facilities were
very satisfied. Of those that used private healthcare facilities, households in Limpopo were most likely to be
‘very satisfied’ (97%) followed by households in Mpumalanga (95,3%) and Western Cape (94,6%).
Households in Limpopo (73%) were most likely to be very satisfied with public healthcare facilities while
those in Western Cape (45,5%) were least likely to be very satisfied.
2004 2005 2006 2007 2008 2009 2010 2011 2012 2013 2014 2015
Other 0,7 0,3 0,1 0,3 0,0 0,6 0,5 0,5 0,4 0,5 0,5 0,5
Pharmacy 0,4 0,5 0,4 0,3 0,5 0,4 0,4 0,5 0,5 0,3 0,4 0,4
Traditional healer 0,2 0,6 0,4 0,3 0,3 0,2 0,2 0,1 0,2 0,1 0,5 0,5
Private doctor 20,6 22,0 20,9 20,9 17,3 25,4 24,9 24,7 23,9 24,2 24,6 23,5
Private Clinic 3,6 2,7 2,3 2,1 2,8 1,4 1,8 1,8 2,4 2,0 1,7 1,8
Private Hospital 5,2 4,6 4,5 5,7 6,0 2,3 2,4 2,0 2,7 2,7 2,6 2,4
Other Public Institution 0,2 0,2 0,6 0,3 0,5 0,4 0,3 0,3 0,3 0,3 0,5 0,5
Public Hospital 24,6 22,2 18,7 22,0 20,5 10,5 9,5 9,4 10,0 9,0 8,3 7,8
Public Clinic 44,5 47,1 52,1 48,0 52,1 58,9 60,2 60,8 59,6 60,9 61,0 62,7
0%10%20%30%40%50%60%70%80%90%
100%
Pe
rce
nta
ge
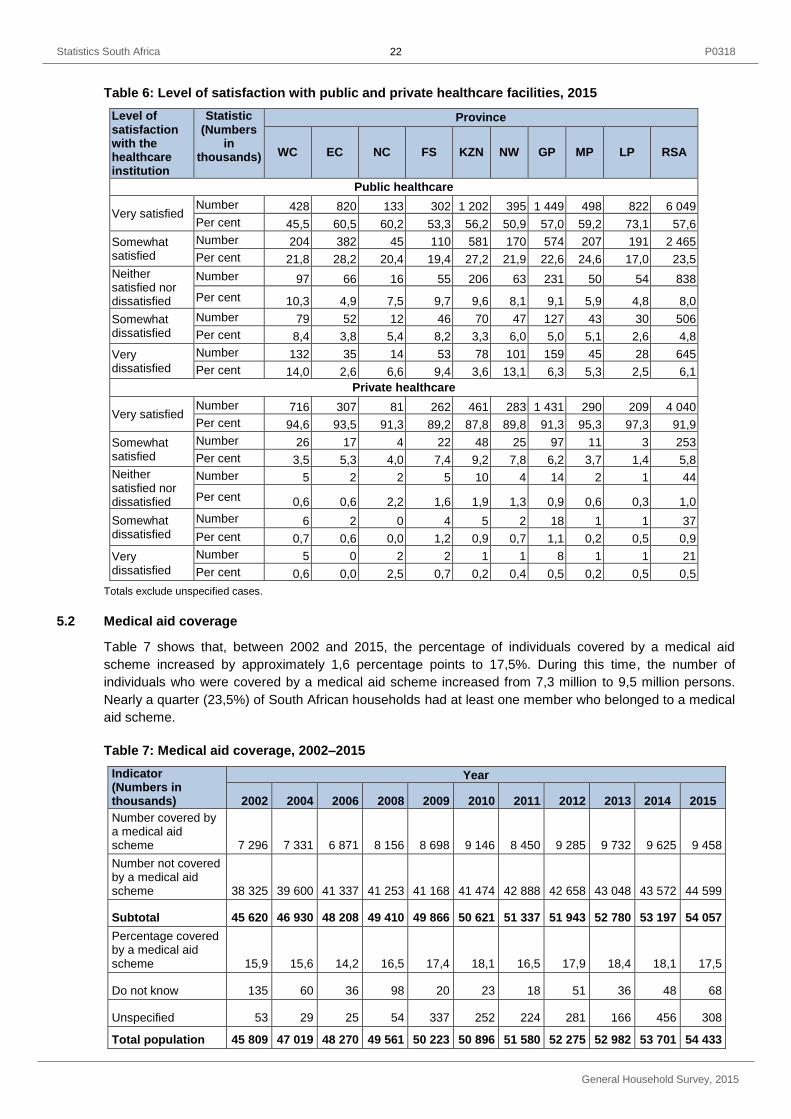
Statistics South Africa P0318
General Household Survey, 2015
22
Table 6: Level of satisfaction with public and private healthcare facilities, 2015
Level of satisfaction with the healthcare institution
Statistic (Numbers
in thousands)
Province
WC EC NC FS KZN NW GP MP LP RSA
Public healthcare
Very satisfied Number 428 820 133 302 1 202 395 1 449 498 822 6 049
Per cent 45,5 60,5 60,2 53,3 56,2 50,9 57,0 59,2 73,1 57,6
Somewhat satisfied
Number 204 382 45 110 581 170 574 207 191 2 465
Per cent 21,8 28,2 20,4 19,4 27,2 21,9 22,6 24,6 17,0 23,5
Neither satisfied nor dissatisfied
Number 97 66 16 55 206 63 231 50 54 838
Per cent 10,3 4,9 7,5 9,7 9,6 8,1 9,1 5,9 4,8 8,0
Somewhat dissatisfied
Number 79 52 12 46 70 47 127 43 30 506
Per cent 8,4 3,8 5,4 8,2 3,3 6,0 5,0 5,1 2,6 4,8
Very dissatisfied
Number 132 35 14 53 78 101 159 45 28 645
Per cent 14,0 2,6 6,6 9,4 3,6 13,1 6,3 5,3 2,5 6,1
Private healthcare
Very satisfied Number 716 307 81 262 461 283 1 431 290 209 4 040
Per cent 94,6 93,5 91,3 89,2 87,8 89,8 91,3 95,3 97,3 91,9
Somewhat satisfied
Number 26 17 4 22 48 25 97 11 3 253
Per cent 3,5 5,3 4,0 7,4 9,2 7,8 6,2 3,7 1,4 5,8
Neither satisfied nor dissatisfied
Number 5 2 2 5 10 4 14 2 1 44
Per cent 0,6 0,6 2,2 1,6 1,9 1,3 0,9 0,6 0,3 1,0
Somewhat dissatisfied
Number 6 2 0 4 5 2 18 1 1 37
Per cent 0,7 0,6 0,0 1,2 0,9 0,7 1,1 0,2 0,5 0,9
Very dissatisfied
Number 5 0 2 2 1 1 8 1 1 21
Per cent 0,6 0,0 2,5 0,7 0,2 0,4 0,5 0,2 0,5 0,5
Totals exclude unspecified cases.
5.2 Medical aid coverage
Table 7 shows that, between 2002 and 2015, the percentage of individuals covered by a medical aid
scheme increased by approximately 1,6 percentage points to 17,5%. During this time, the number of
individuals who were covered by a medical aid scheme increased from 7,3 million to 9,5 million persons.
Nearly a quarter (23,5%) of South African households had at least one member who belonged to a medical
aid scheme.
Table 7: Medical aid coverage, 2002–2015
Indicator (Numbers in thousands)
Year
2002 2004 2006 2008 2009 2010 2011 2012 2013 2014 2015
Number covered by a medical aid scheme 7 296 7 331 6 871 8 156 8 698 9 146 8 450 9 285 9 732 9 625 9 458
Number not covered by a medical aid scheme 38 325 39 600 41 337 41 253 41 168 41 474 42 888 42 658 43 048 43 572 44 599
Subtotal 45 620 46 930 48 208 49 410 49 866 50 621 51 337 51 943 52 780 53 197 54 057
Percentage covered by a medical aid scheme 15,9 15,6 14,2 16,5 17,4 18,1 16,5 17,9 18,4 18,1 17,5
Do not know 135 60 36 98 20 23 18 51 36 48 68
Unspecified 53 29 25 54 337 252 224 281 166 456 308
Total population 45 809 47 019 48 270 49 561 50 223 50 896 51 580 52 275 52 982 53 701 54 433

Statistics South Africa P0318
General Household Survey, 2015
23
Figure 20 shows that individuals were more likely to be covered by medical aid schemes in Gauteng 27,7% and Western Cape (24,2%) and least likely to be members of these schemes in Limpopo (8,5%) and Eastern Cape (10,7%). According to Figure 21 the individuals that were more likely to be covered by medical aid schemes were in the City of Tshwane (33%) and those least likely to be members of these schemes were found in eThekwini (19,2%). It should however be noted that the total for all metros (26,4%) exceeds the national average of 17,5%. Figure 20: Percentage of individuals who are members of medical aid schemes per province, 2011–2015
Figure 21: Percentage of individuals who are members of medical aid schemes per Metropolitan area, 2015
WC EC NC FS KZN NW GP MP LP RSA
2011 25,6 10,9 13,3 17,7 12,6 13,8 23,7 14,5 7,5 16,5
2012 25,2 10,9 18,9 18,1 12,3 14,1 29,0 14,5 8,0 17,9
2013 25,7 10,5 20,2 17,1 13,3 15,6 29,3 15,6 9,0 18,4
2014 26,3 10,5 19,8 17,9 12,8 14,8 28,2 14,9 8,6 18,1
2015 24,2 10,7 17,6 16,2 11,9 15,0 27,7 15,5 8,5 17,5
0
5
10
15
20
25
30
35
Pe
rce
nta
ge
28,0
24,622,6
24,8
19,2
27,926,2
33,0
26,4
0
5
10
15
20
25
30
35
Pe
rce
nta
ge

Statistics South Africa P0318
General Household Survey, 2015
24
Figure 22 shows that almost three-quarters (73,3%) of white individuals were members of a medical aid
scheme compared to 44,5% of Indian/Asian individuals while only a paltry 10,6% of black Africans had
such membership. It is still worth noting that the overall percentage of individuals covered by a medical
scheme in the whole country is still worringly low at 17,5%.
Figure 22: Percentage of individuals who are members of medical aid schemes by population group, 2015
5.3 Teenage pregnancy
The questionnaire enquired whether any females between the ages of 12 and 50 years were pregnant
during the 12 months before the survey. Figure 23 shows that 5,3% of females in the age group 14–19
years were pregnant during the 12 months before the survey. The prevalence of pregnancy increased with
age, rising from 0,6% for females aged 14 years, to 9,7% for females aged 19 years.
Figure 23: Percentage of females aged 14–19 who were pregnant during the year preceding the survey, 2015
6. Disability
The questions used for disability were developed by the Washington Group and were first introduced in the
2009 questionnaire. These questions require each person in the household to rate their ability level for a
range of activities such as seeing, hearing, walking a kilometre or climbing a flight of steps, remembering
10,6
19,3
44,5
73,3
17,5
0
10
20
30
40
50
60
70
80
Black African Coloured Indian/Asian White South Africa
Pe
rcan
tage
5,3
0,6
1,9
4,0
6,2
9,7 9,7
0
2
4
6
8
10
12
14-19 14 15 16 17 18 19
Pe
rce
nta
ge
Age

Statistics South Africa P0318
General Household Survey, 2015
25
and concentrating, self-care, and communicating in his/her most commonly used language, including sign
language. During the analysis, individuals who said that they had some difficulty with two or more of the
activities or had a lot of difficulty, or were unable to perform any one activity, were classified as disabled.
The analysis was only confined to individuals aged 5 years or older as children below the age of five years
may often be mistakenly categorised as being unable to walk, remember, communicate or care for
themselves when it may be due to their level of development rather than any innate disabilities they might
have. The findings are presented in Table 8.
Table 8: Persons aged 5 years and older with disability by gender and province, 2015
Indicator
Statistic
(number in
thousands)
Province
WC EC NC FS KZN NW GP MP LP RSA
Male Number 129 193 33 62 215 113 223 74 94 1 136
Per cent 4,7 6,9 6,7 5,1 4,7 6,8 3,6 4,0 4,0 4,7
Female Number 132 211 42 96 301 131 256 96 126 1 392
Per cent 4,5 6,7 7,6 7,4 6,0 7,9 4,2 4,9 4,7 5,5
Total Number 260 405 76 158 516 244 479 170 220 2 528
Per cent 4,6 6,8 7,1 6,3 5,4 7,4 3,9 4,5 4,4 5,1
Subtotal Number 5 690 5 957 1 063 2 510 9 552 3 306 12 210 3 768 5 007 49 061
Unspecified Number 11 11 1 4 31 14 62 20 15 170
Total Number 5 701 5 968 1 064 2 514 9 583 3 320 12 272 3 788 5 022 49 231
Using this classification system, 5,1% of South Africans aged 5 years and older were classified as disabled
in 2015. A larger percentage of women (5,5%) than men (4,7%) were classified as disabled. North West
(7,4%), Northern Cape (7,1%) and Eastern Cape (6,8%) presented the highest prevalence of disability in
the country. Since older populations are more likely to have a higher prevalence of disability, the lower
prevalence in Gauteng and Limpopo could be ascribed to the relatively youthful population that is often
associated with net in-migration in these provinces.
7. Social security services
The percentage of individuals that benefited from social grants consistently increased from 12,7% in 2003
to 30,1% in 2015. Concurrently, the percentage of households that received at least one grant increased
from 29,9% in 2003 to 45,5% in 2015. This is presented in Figure 24.
Figure 25 summarises the provincial distribution of individuals and households that benefited from social
grants in 2015. More than one-third of individuals in Eastern Cape (40,3%), Limpopo (38,2%), Northern
Cape (36,9%) and KwaZulu-Natal (36,8%) were grant beneficiaries, compared to 17,5% in Gauteng and
22% in Western Cape. Similarly, more than half of households in Northern Cape (59,9%), Eastern Cape
(59,2%), Limpopo (57,6%), KwaZulu-Natal (53,1%), Free State (52,4%) and Mpumalanga (51,3%) received
at least one form of grant compared to 30,8% of households in Gauteng and 37% of households in
Western Cape.
More than one-third of black African individuals (33,5%) received a social grant, compared to 27% of
coloured individuals, and 12% of Indian/Asian individuals. By comparison, only 6,3% of the white
population received grants. Caution should be exercised when analysing the statisticts on social grants as
these are generally dependant on individuals being the ones who have to actively apply for grants instead
of the government identifying them as needing such.

Statistics South Africa P0318
General Household Survey, 2015
26
Figure 24: Percentage of households and persons who have benefited from social grants, 2003–2015
Figure 25: Percentage of individuals and households benefiting from social grants per province, 2015

Statistics South Africa P0318
General Household Survey, 2015
27
Figure 26 demonstrates distribution of individuals and households that benefited from social grants by
metropolitan areas in 2015. More than one-third of households in all metros except the City of
Johannesburg (29,1%) were grant beneficiaries. Less than two in ten individuals in the City of
Johannesburg (16,8%), Ekurhuleni(17,3%), the City of Tshwane (17,4%) and Cape Town (19,1%)
benefited from social grants compared to 31,1% in Nelson Mandela Bay, 31% in Buffalo City, 27,9% in
eThekwini; and 27,3% in Mangaung.
Figure 26: Percentage of individuals and households benefiting from social grants per metropolitan area, 2015
8. Religious affiliation and observance
Table 9 shows that an estimated 86% of South Africans were affiliated to the Christian religion, while 5,4%
professed to following ancestral, tribal, animist or other traditional religions. An estimated 1,9% of the
population considered themselves Muslim while 5,2% did not follow any religion in particular. The latter
figure was particularly high in Limpopo (14,4%). Only 0,2% of individuals were estimated to be Jewish.
Individuals were most likely to be Christians in Northern Cape (98,4%), Free State (97,7%) and least likely
to be so in KwaZulu-Natal (78,5%) where 12,3% of individuals followed ancestral, tribal, animist or other
traditional African religions and 3,3% professed following ‘nothing in particular’. The highest concentrations
of Muslims were found in Western Cape (5,3%) and Gauteng (2,4%), while the highest percentage of
Hindus was found in KwaZulu-Natal (3,3%).

Statistics South Africa P0318
General Household Survey, 2015
28
Table 9: Percentage distribution of religious affiliation by province, 2015
Religious affiliation
Province (per cent)
WC EC NC FS KZN NW GP MP LP RSA
Christian 87,8 83,5 98,4 97,7 78,5 93,3 87,1 93,2 79,9 86,0
Muslim 5,3 0,4 0,9 0,6 2,0 1,5 2,4 0,8 0,9 1,9
Ancestral, tribal, animist or other traditional African religions 2,8 8,6 0,0 1,4 12,3 3,0 2,3 4,0 4,5 5,4
Hindu 0,4 0,1 0,0 0,0 3,3 0,1 0,8 0,1 0,0 0,9
Jewish 0,5 0,0 0,1 0,0 0,1 0,0 0,6 0,0 0,1 0,2
Other religion 0,7 0,2 0,3 0,1 0,5 0,1 0,6 0,4 0,2 0,4
Nothing in particular 2,6 7,2 0,3 0,1 3,3 2,1 6,3 1,5 14,4 5,2
Do not know 0,1 0,0 0,0 0,0 0,0 0,0 0,1 0,0 0,0 0,0
Total 100,0 100,0 100,0 100,0 100,0 100,0 100,0 100,0 100,0 100,0
Figure 27: Percentage distribution of religious observance by religious affiliation, 2015
Religious observance by religious affiliation is explored in Figure 27. Just over seven-tenths (75,6%) of
individuals that followed the Muslim faith attended religious services and ceremonies (excluding weddings
and funerals) at least once per week. By comparison, 52,5% of Christians and 36,6% of Hindus attended
services on a weekly basis. The most infrequent participation in services were noted for individuals that
said they followed ancestral, tribal, animist or other traditional African religions. Individuals affiliated to this
religion (16,7%) were most likely to never attend religious services followed by Muslims (8,4%) and Hindus
(6,6%).
Christian Muslim Hindu
Ancestral, tribal,animist or other
traditionalAfrican religions
Never 6,4 8,4 6,6 16,7
Seldom 8,7 9,4 4,9 21,0
Usually a few times a year 9,9 2,8 17,0 19,3
Usually at least once or twice permonth
22,5 3,9 35,0 16,5
Usually at least once per week 52,5 75,6 36,6 26,5
0%10%20%30%40%50%60%70%80%90%
100%
Pe
rce
nta
ge
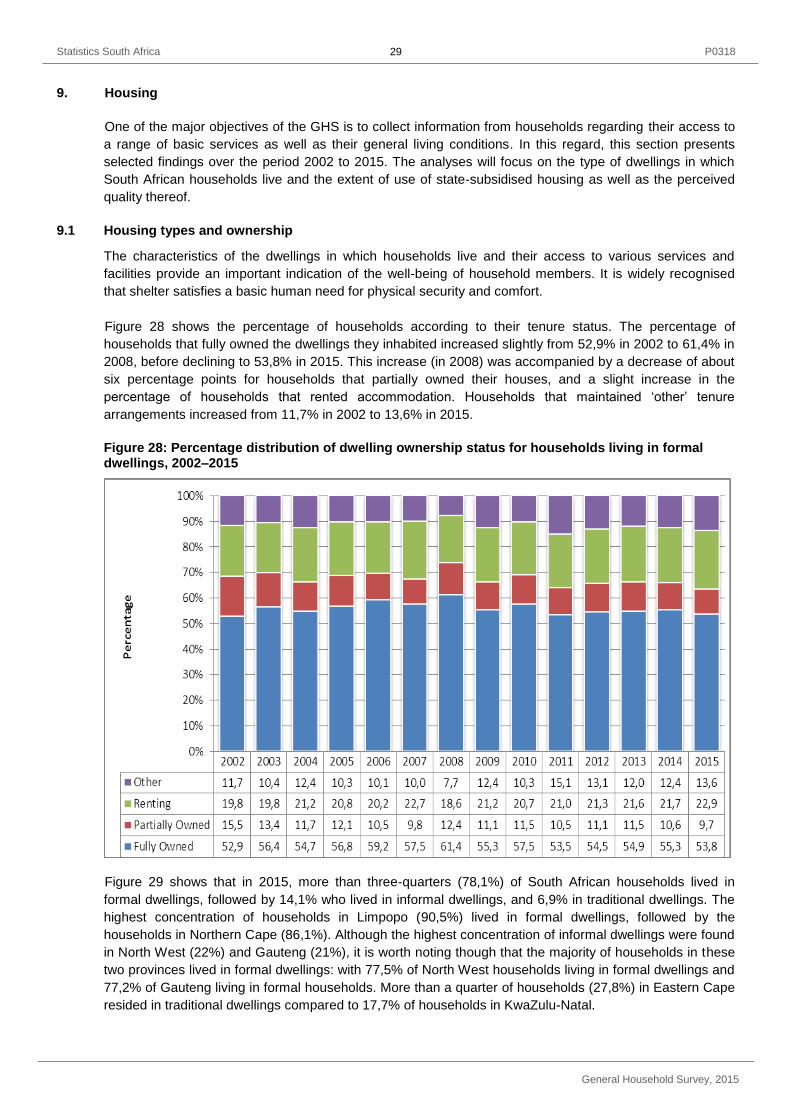
Statistics South Africa P0318
General Household Survey, 2015
29
9. Housing
One of the major objectives of the GHS is to collect information from households regarding their access to
a range of basic services as well as their general living conditions. In this regard, this section presents
selected findings over the period 2002 to 2015. The analyses will focus on the type of dwellings in which
South African households live and the extent of use of state-subsidised housing as well as the perceived
quality thereof.
9.1 Housing types and ownership
The characteristics of the dwellings in which households live and their access to various services and
facilities provide an important indication of the well-being of household members. It is widely recognised
that shelter satisfies a basic human need for physical security and comfort.
Figure 28 shows the percentage of households according to their tenure status. The percentage of
households that fully owned the dwellings they inhabited increased slightly from 52,9% in 2002 to 61,4% in
2008, before declining to 53,8% in 2015. This increase (in 2008) was accompanied by a decrease of about
six percentage points for households that partially owned their houses, and a slight increase in the
percentage of households that rented accommodation. Households that maintained ‘other’ tenure
arrangements increased from 11,7% in 2002 to 13,6% in 2015.
Figure 28: Percentage distribution of dwelling ownership status for households living in formal dwellings, 2002–2015
Figure 29 shows that in 2015, more than three-quarters (78,1%) of South African households lived in
formal dwellings, followed by 14,1% who lived in informal dwellings, and 6,9% in traditional dwellings. The
highest concentration of households in Limpopo (90,5%) lived in formal dwellings, followed by the
households in Northern Cape (86,1%). Although the highest concentration of informal dwellings were found
in North West (22%) and Gauteng (21%), it is worth noting though that the majority of households in these
two provinces lived in formal dwellings: with 77,5% of North West households living in formal dwellings and
77,2% of Gauteng living in formal households. More than a quarter of households (27,8%) in Eastern Cape
resided in traditional dwellings compared to 17,7% of households in KwaZulu-Natal.
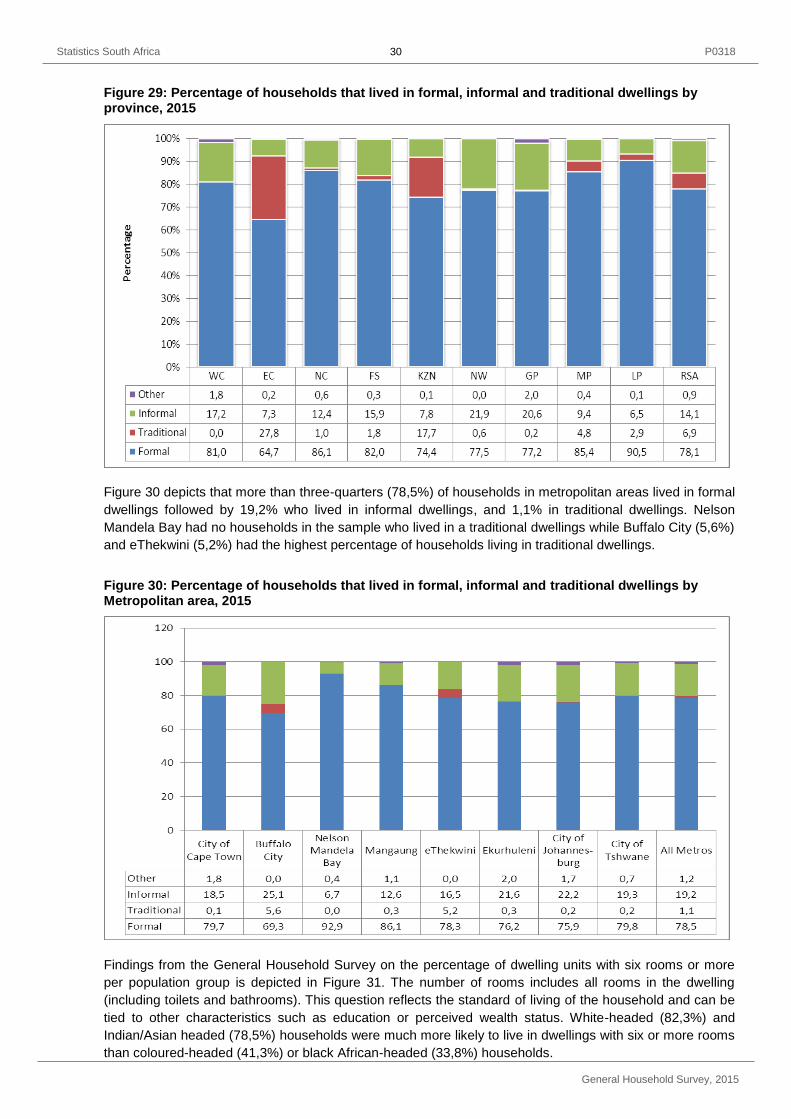
Statistics South Africa P0318
General Household Survey, 2015
30
Figure 29: Percentage of households that lived in formal, informal and traditional dwellings by province, 2015
Figure 30 depicts that more than three-quarters (78,5%) of households in metropolitan areas lived in formal
dwellings followed by 19,2% who lived in informal dwellings, and 1,1% in traditional dwellings. Nelson
Mandela Bay had no households in the sample who lived in a traditional dwellings while Buffalo City (5,6%)
and eThekwini (5,2%) had the highest percentage of households living in traditional dwellings.
Figure 30: Percentage of households that lived in formal, informal and traditional dwellings by Metropolitan area, 2015
Findings from the General Household Survey on the percentage of dwelling units with six rooms or more
per population group is depicted in Figure 31. The number of rooms includes all rooms in the dwelling
(including toilets and bathrooms). This question reflects the standard of living of the household and can be
tied to other characteristics such as education or perceived wealth status. White-headed (82,3%) and
Indian/Asian headed (78,5%) households were much more likely to live in dwellings with six or more rooms
than coloured-headed (41,3%) or black African-headed (33,8%) households.
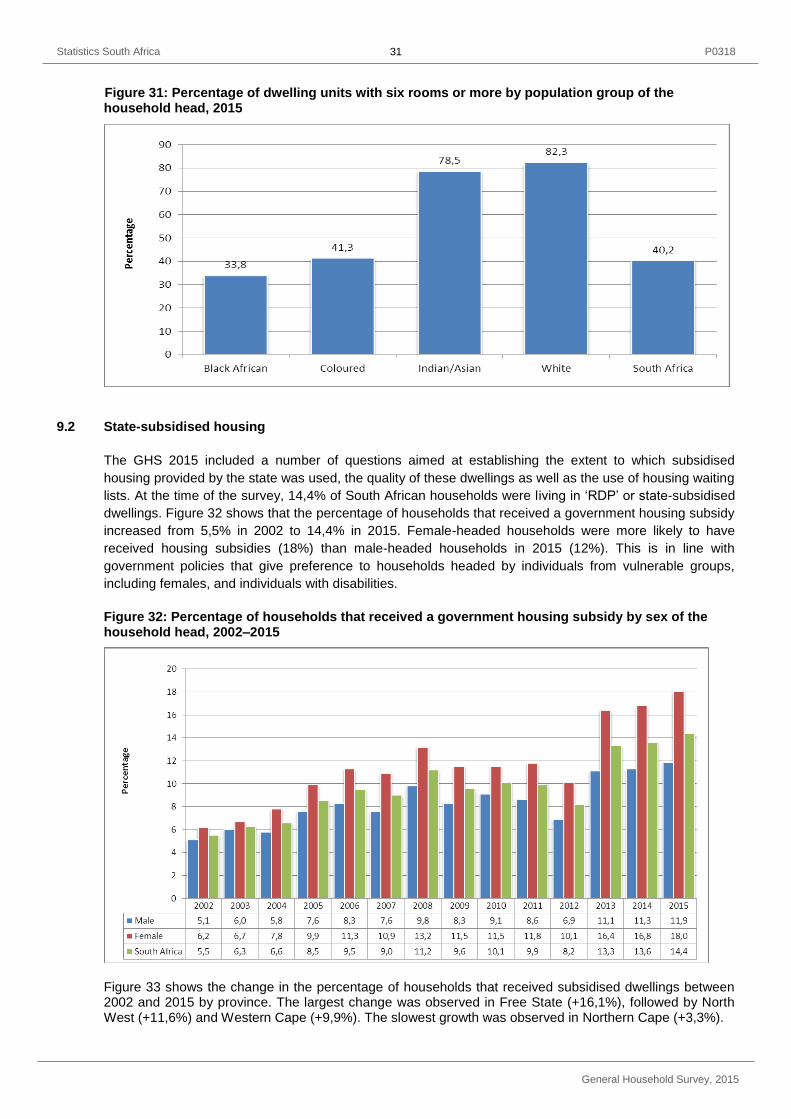
Statistics South Africa P0318
General Household Survey, 2015
31
Figure 31: Percentage of dwelling units with six rooms or more by population group of the household head, 2015
9.2 State-subsidised housing
The GHS 2015 included a number of questions aimed at establishing the extent to which subsidised
housing provided by the state was used, the quality of these dwellings as well as the use of housing waiting
lists. At the time of the survey, 14,4% of South African households were living in ‘RDP’ or state-subsidised
dwellings. Figure 32 shows that the percentage of households that received a government housing subsidy
increased from 5,5% in 2002 to 14,4% in 2015. Female-headed households were more likely to have
received housing subsidies (18%) than male-headed households in 2015 (12%). This is in line with
government policies that give preference to households headed by individuals from vulnerable groups,
including females, and individuals with disabilities.
Figure 32: Percentage of households that received a government housing subsidy by sex of the household head, 2002–2015
Figure 33 shows the change in the percentage of households that received subsidised dwellings between
2002 and 2015 by province. The largest change was observed in Free State (+16,1%), followed by North West (+11,6%) and Western Cape (+9,9%). The slowest growth was observed in Northern Cape (+3,3%).

Statistics South Africa P0318
General Household Survey, 2015
32
Figure 33: Provincial percentage change of households that received housing subsidies, 2002 and
2015
As a result of the concerns raised by community groups about the quality of state-provided housing, a
number of questions were included in the GHS questionnaires to facilitate an analysis of the extent of
problems experienced by households with the construction of these dwellings. Respondents were asked to
indicate whether the walls and roof of their dwellings were: very good, good, needed minor repairs, weak or
very weak. Figure 34 shows that 14,2% of households with subsidised dwellings reported weak or very
weak walls while 13,8% reported weak or very weak roofs. Responses vary across provinces. Households
in Eastern Cape, Western Cape and Northern Cape were least satisfied with the quality of walls and roofs,
while those in Limpopo complained least about walls (6,3%) and roofs (7,6%).
Figure 34: Percentage of households that said that their ‘RDP’ or state-subsidised house had weak
or very weak walls and/or roof by province, 2015

Statistics South Africa P0318
General Household Survey, 2015
33
10. Household sources of energy
The percentage of South African households that were connected to the mains electricity supply increased
from 77,1% in 2002 to 85,5% in 2015. This is presented in Figure 35. The largest increases (in percentage
points) were noted in Eastern Cape (+27 percentage points), Limpopo (+20,4 percentage points), KwaZulu-
Natal (+12,8 percentage points) and Mpumalanga (+11,9 percentage points). The percentage of
households with access to mains electricity increased by less than two percentage points in Western Cape
over this time, while the percentage of households with access to mains electricity actually declined by 3,9
percentage points between 2002 and 2015 in Gauteng. The decline noted in Gauteng is almost certainly
linked to the high influx of migrants and creation of informal dwellings. Households in Limpopo (92,9%) and
Northern Cape (92,4%) were most likely to have access to electricity, while those in KwaZulu-Natal (81,7%)
and Eastern Cape (82,3%) were least likely to have access.
The main sources of energy used by households for cooking during the period 2002 to 2015 are presented
in Figure 36. The figure shows that the percentage of households that used electricity for cooking increased
from 58% in 2002 to 78,1% in 2015. Concurrently, the use of paraffin and fire wood declined. The
percentage of households that used paraffin declined from 16,2% in 2002 to 5,4% in 2015, while the
percentage of households that used firewood decreased from 19,3% to 9,3%. The percentage of
households that used gas increased from 2,2% in 2002 to 3,5% in 2015.
Figure 35: Percentage of households connected to the mains electricity supply by province, 2002─2015
The main sources of energy used for cooking in 2015 by province are presented in Figure 37. The use of
electricity as a main source of energy for cooking was highest in Free State (86,9%), Northern Cape
(85,9%) and Western Cape (85,4%) and lowest in more rural provinces such as Limpopo (60%), Eastern
Cape (73%) and Mpumalanga (74%) where alternative fuels such as wood are, perhaps, more accessible
and affordable. More than one-tenth of households in Eastern Cape (10,1%) used paraffin as their main
source of energy for cooking compared to only 1,5% in Western Cape and Limpopo (1,9%). The use of
wood was particularly noticeable in Limpopo (35,0%), Mpumalanga (16%), KwaZulu-Natal (15,3%) and
Eastern Cape (11,1%). Less than one per cent of households usually used wood for cooking in Western
Cape and Gauteng (0,7% and 0,5% respectively). The use of gas was more common in Western Cape
(10%), Northern Cape (5,3%) and Eastern Cape (4,2%).

Statistics South Africa P0318
General Household Survey, 2015
34
Figure 36: Percentage distribution of main sources of energy used for cooking by year, 2002–2015
Figure 37: Percentage distribution of main sources of energy used for cooking by province, 2015
Figure 38 presents information on households that rated their electrical supply services as ‘good’. The
figure shows that households in Western Cape (73,3%), Limpopo (71,3%) and Mpumalanga (68,2%) rated
their electricity supply services as ‘good’, while only 46,4% of households in Eastern Cape and 50,6% of
households in Gauteng did likewise. The percentage of households in the country that rated electricity
supply as ‘good’ increased to 66,5% in 2014 before dropping to 60,2% in 2015.

Statistics South Africa P0318
General Household Survey, 2015
35
Figure 38: Percentage of household rating the quality of electrical supply services as ‘good’, 2010─2015
Figure 39 shows that 23,6% of households that paid for electricity, either through bills or buying pre-paid
electricity, reported that they had electrical interruptions in the six months before they were surveyed. The
prevalence of interruptions was highest in North West (60,6%), Mpumalanga (35,9%) and Gauteng
(33,9%). Limpopo (1,4%), Free State (5,6%) and KwaZulu-Natal (7,2%) reported the least interruptions.
Figure 39: Percentage of households that paid for electricity that reported having had electricity interruptions during the six months before the survey, 2013─2015
11. Water access and use
The proportion of households with access to piped or tap water in their dwellings, off-site or on-site by
province is presented in Figure 40. There were very high proportions of households in Western Cape
(99,2%), Gauteng (97,7%), Northern Cape (96,5%) and Free State (96,1%) that had access to water either
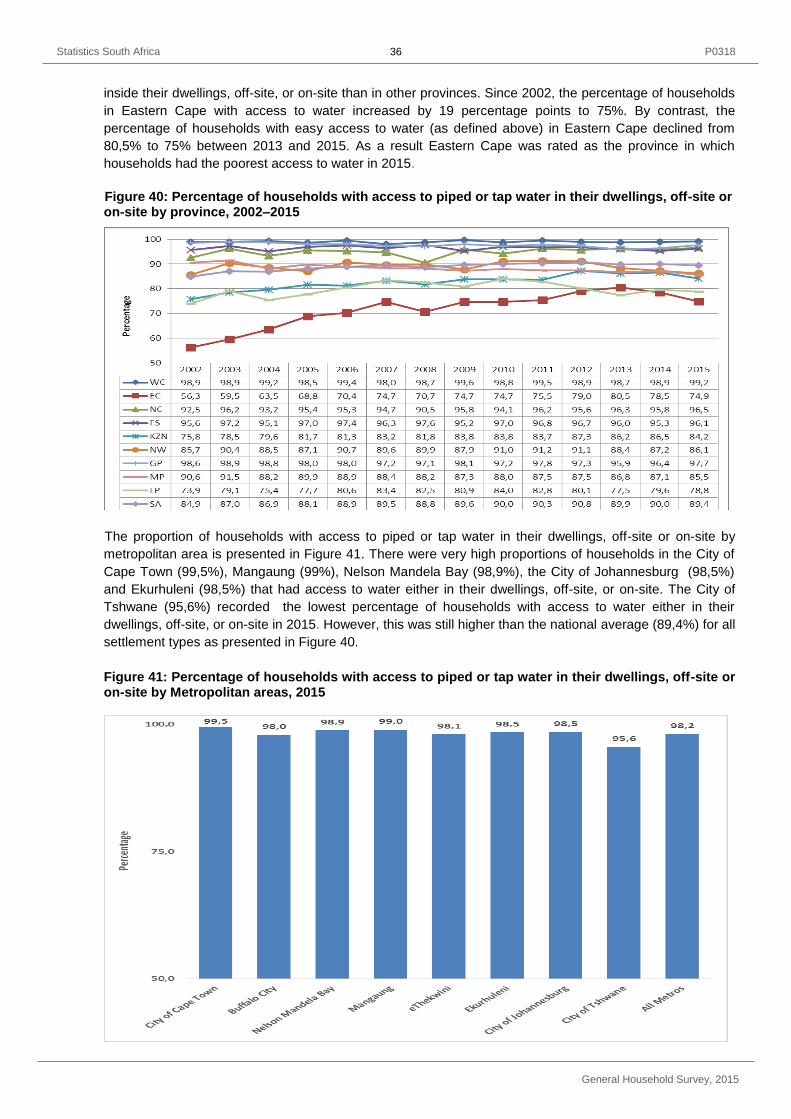
Statistics South Africa P0318
General Household Survey, 2015
36
inside their dwellings, off-site, or on-site than in other provinces. Since 2002, the percentage of households
in Eastern Cape with access to water increased by 19 percentage points to 75%. By contrast, the
percentage of households with easy access to water (as defined above) in Eastern Cape declined from
80,5% to 75% between 2013 and 2015. As a result Eastern Cape was rated as the province in which
households had the poorest access to water in 2015.
Figure 40: Percentage of households with access to piped or tap water in their dwellings, off-site or on-site by province, 2002–2015
The proportion of households with access to piped or tap water in their dwellings, off-site or on-site by
metropolitan area is presented in Figure 41. There were very high proportions of households in the City of
Cape Town (99,5%), Mangaung (99%), Nelson Mandela Bay (98,9%), the City of Johannesburg (98,5%)
and Ekurhuleni (98,5%) that had access to water either in their dwellings, off-site, or on-site. The City of
Tshwane (95,6%) recorded the lowest percentage of households with access to water either in their
dwellings, off-site, or on-site in 2015. However, this was still higher than the national average (89,4%) for all
settlement types as presented in Figure 40.
Figure 41: Percentage of households with access to piped or tap water in their dwellings, off-site or on-site by Metropolitan areas, 2015

Statistics South Africa P0318
General Household Survey, 2015
37
Table 10 presents a comparison of the main sources of drinking water used by households. An estimated
45,8% of households had access to piped water in their dwellings in 2015. A further 27% accessed water
on site while 14% relied on communal taps and 2,7% relied on neighbours’ taps. Although generally
households’ access to water improved, 4,4% of households still had to fetch water from rivers, streams,
stagnant water pools, dams, wells and springs in 2015. This is a decrease of more than five percentage
points from 9,5% of households that had to access water from these sources in 2002.
Table 10: Comparison of the main water source for drinking used by households, 2002–2015
Water source Statistic Year
2002 2004 2006 2007 2008 2009 2010 2011 2012 2013 2014 2015
Piped water in dwelling
Number 4 409 4 607 4 980 5 163 5 611 5 622 5 862 6 294 6 504 6 845 7 221 7 385
Percentage 40,8 40,4 41,2 41,6 43,7 42,3 42,7 44,4 44,5 45,3 46,3 45,8
Piped water on site
Number 3 009 3 367 3 681 3 838 3 501 3 743 4 019 4 106 4 055 4 051 4 213 4 354
Percentage 27,8 29,5 30,5 30,9 27,3 28,1 29,3 29 27,7 26,8 27,0 27,0
Borehole on site
Number 290 188 141 155 155 190 157 212 203 259 293 259
Percentage 2,7 1,6 1,2 1,3 1,2 1,4 1,1 1,5 1,4 1,7 1,9 1,6
Rainwater tank on site
Number 142 38 49 61 68 44 45 91 82 74 68 120
Percentage 1,3 0,3 0,4 0,5 0,5 0,3 0,3 0,6 0,6 0,5 0,4 0,7
Neighbour’s tap Number 60 260 250 265 336 358 346 388 424 388 426 431
Percentage 0,6 2,3 2,1 2,1 2,6 2,7 2,5 2,7 2,9 2,6 2,7 2,7
Public/ communal tap
Number 1 465 1 682 1 852 1 910 1 996 2 201 2 131 2 008 2 307 2 290 2 180 2 247
Percentage 13,6 14,7 15,3 15,4 15,6 16,5 15,5 14,2 15,8 15,2 14,0 13,9
Water-carrier/ tanker
Number 68 69 134 123 146 171 200 134 199 230 198 304
Percentage 0,6 0,6 1,1 1 1,1 1,3 1,5 0,9 1,4 1,5 1,3 1,9
Borehole off- site/ communal
Number 300 297 273 199 248 209 177 183 165 189 199 229
Percentage 2,8 2,6 2,3 1,6 1,9 1,6 1,3 1,3 1,1 1,3 1,3 1,4
Flowing water/ stream/river
Number 606 519 390 406 442 507 433 374 336 382 420 379
Percentage 5,6 4,5 3,2 3,3 3,4 3,8 3,2 2,6 2,3 2,5 2,7 2,4
Stagnant water/dam/ pool
Number 77 62 30 52 37 30 41 53 30 42 55 35
Percentage 0,7 0,5 0,2 0,4 0,3 0,2 0,3 0,4 0,2 0,3 0,4 0,2
Well Number 146 113 124 64 70 50 37 75 55 71 77 90
Percentage 1,3 1,0 1 0,5 0,5 0,4 0,3 0,5 0,4 0,5 0,5 0,6
Spring Number 208 196 158 146 188 119 208 172 191 143 148 186
Percentage 1,9 1,7 1,3 1,2 1,5 0,9 1,5 1,2 1,3 0,9 0,9 1,2
Other Number 28 17 24 26 32 59 75 82 70 143 105 103
Percentage 0,3 0,2 0,2 0,2 0,3 0,4 0,5 0,6 0,5 1,0 0,7 0,6
Subtotal Number 10 806 11 413 12 087 12 409 12 830 13 303 13 731 14 172 14 620 15 107 15 601 16 122
Percentage 100,0 100,0 100,0 100,0 100,0 100,0 100,0 100,0 100,0 100,0 100,0 100,0
Unspecified Number 8 12 20 76 55 0 0 1 11 0 0 0
Total Number 10 814 11 425 12 107 12 485 12 885 13 303 13 731 14 173 14 631 15 107 15 601 16 122
Table 11 confirms that the number and percentage of households with access to piped water had
increased since 2002, and that 13,6 million households had access to piped water in 2015 compared to 9,3
million in 2005. The increase in the percentage of households with access to water coincided with a decline
in the percentage of households who paid for the piped water they received. The proportion of households
who reported paying for water has been declining steadily over the past decade, dropping from 61,9% in
2005 to only 43,9% in 2015.

Statistics South Africa P0318
General Household Survey, 2015
38
Less than two-thirds (62,0%) of households rated the water services as ‘good’ in 2015. Although this is
slightly higher than the 60,1% recorded in 2012, it is much lower than the 76,4% approval rating reported in
2005. The percentage of users who rated water services as average increased from 15,8% in 2005 to
31,8% in 2009, before it eventually declined to 25,5% in 2015. The percentage of households that rated
water services as ‘poor’ increased from 7,8% in 2005 to 12,5% in 2015. This deterioration in levels of
satisfaction is mirrored by an increase over time in the percentage of households who feel that their water
is not clean, clear, does not taste or is free of bad smells.
Table 11: Access to piped municipal water supplies, payment and service ratings for local municipalities, 2005–2015
Access to piped water
Statistic Year
2005 2006 2007 2008 2009 2010 2011 2012 2013 2014 2015
Yes Number 9 369 9 254 9 976 9 619 11 100 11 724 11 932 12 372 12 858 13 231 13 603
Percentage 79,9 76,6 80,2 75,0 83,9 86,5 85,6 85,9 86,4 85,9 85,9
No Number 2 358 2 826 2 467 3 208 2 131 1 833 2 015 2 022 2 020 2 164 2 225
Percentage 20,1 23,4 19,8 25,0 16,1 13,5 14,4 14,1 13,6 14,1 14,1
Subtotal Number 11 727 12 080 12 443 12 827 13 231 13 557 13 947 14 394 14 878 15 395 15 828
Percentage 100,0 100,0 100,0 100,0 100,0 100,0 100,0 100,0 100,0 100,0 100,0
Unspecified/do not know
Number 26 27 42 59 72 173 227 237 228 207 58
Total Number 11 753 12 107 12 485 12 886 13 303 13 730 14 174 14 631 15 106 15 602 15 886
Pay for water
2005 2006 2007 2008 2009 2010 2011 2012 2013 2014 2015
Yes Number 5 794 5 991 6 375 6 417 5 471 5 483 5 601 5 586 5 720 5 742 5937
Percentage 61,9 65,0 64,2 67,3 49,3 46,8 47,2 45,3 44,5 43,7 43,9
No Number 3 569 3 221 3 560 3 113 5 616 6 220 6 266 6 745 7 124 7 404 7602
Percentage 38,1 35,0 35,8 32,7 50,7 53,2 52,8 54,7 55,5 56,3 56,1
Subtotal Number 9 363 9 212 9 935 9 530 11 087 11 703 11 867 12 331 12 844 13 146 11 950
Percentage 100,0 100,0 100,0 100,0 100,0 100,0 100,0 100,0 100,0 100,0 100,0
Unspecified Number 7 42 41 88 12 21 65 41 14 84 64
Total Number 9 370 9 254 9 976 9 618 11 099 11 724 11 932 12 372 12 858 13 230 12 014
Water services ratings
2005 2006 2007 2008 2009 2010 2011 2012 2013 2014 2015
Good Number 7 141 6 784 7 177 5 844 6 399 7 398 7 369 7 380 8 077 8 035 8 379
Percentage 76,4 73,5 72,1 61,1 58,0 63,6 62,1 60,1 63,2 61,4 62,0
Average Number 1 472 1 818 2 039 2 785 3 511 3 152 3 347 3 415 3 207 3 457 3 450
Percentage 15,8 19,7 20,5 29,1 31,8 27,1 28,2 27,8 25,1 26,4 25,5
Poor Number 730 634 734 939 1 127 1 089 1 159 1 490 1 488 1 592 1 688
Percentage 7,8 6,9 7,4 9,8 10,2 9,4 9,8 12,1 11,7 12,2 12,5
Subtotal Number 9 343 9 236 9 950 9 568 11 037 11 639 11 875 12 285 12 772 13 084 13 517
Percentage 100,0 100,0 100,0 100,0 100,0 100,0 100,0 100,0 100,0 100,0 100,0
Unspecified Number 27 18 25 51 63 85 57 87 86 146 86
Total Number 9 370 9 254 9 975 9 619 11 100 11 724 11 932 12 372 12 858 13 230 13 603
The totals used as the denominator to calculate percentages are excluded from unspecified responses. Levels of satisfaction with water services were not measured prior to 2005.
Figure 42 shows a comparison of the percentage of households that rated the water services they received
from municipalities as ‘good’ and the percentage that reported water interruptions. An inverse relationship
between the perceived quality of services and the number of interruptions seems to exist. The provinces
with the lowest percentage of households that reported interruptions with water services, namely Western

Statistics South Africa P0318
General Household Survey, 2015
39
Cape (3%) and Gauteng (6,6%), also reported the highest satisfaction with water delivery services (86,4%
for Western Cape, and 76,8% for Gauteng). Conversely, the provinces in which interruptions were more
frequent were less likely to rate water service delivery as ‘good’. Whereas 60,9% of households in Limpopo
and 59,4% of households in Mpumalanga reported having had interruptions, only 32,4% of households in
Limpopo and 40,2% of households in Mpumalanga rated water service delivery as ‘good’.
Figure 42: Percentage of households rating the quality of water services provided by the municipality as good, and those that reported water interruptions by province, 2015
Figure 43 shows a comparison of the percentage of households that rated the water services they received
from metropolitan municipalities as ‘good’ and the percentage that reported water interruptions. An inverse
relationship between the perceived quality of services and the number of interruptions seems to exist. The
metropolitan areas with the lowest percentage of households that reported interruptions with water services
were the City of Cape Town (3,6%) and Nelson Mandela Bay (5,9%). Nearly a third (31%) of households
living in Mangaung had problems with interruptions. The metropolitan areas that reported the highest
satisfaction with water delivery services were the City of Cape Town (87,8%), eThekwini (84,4%) and the
City of Johannesburg (79,6%).
WC EC NC FS KZN NW GP MP LP SA
Quality 86,4 49,4 51,6 51,1 57,5 40,2 76,8 40,2 32,4 62,0
Interruptions 3,1 37,8 36,1 26,1 30,7 50,8 6,6 59,4 60,9 25,4
0,0
10,0
20,0
30,0
40,0
50,0
60,0
70,0
80,0
90,0
100,0
Pe
rce
nta
ge

Statistics South Africa P0318
General Household Survey, 2015
40
Figure 43: Percentage of households rating the quality of water services provided by the municipality as good, and those that reported water interruptions by Metropolitan areas, 2015
The functionality of municipal water supply services measures the extent to which households that received
water from a municipality had reported, over the 12 months before the survey, interruptions that lasted
more than 2 days at a time, or more than 15 days in total during the whole period. Figure 44 shows that
households in Limpopo (60,9%) and Mpumalanga (59,4%) consistently reported the most interruptions,
while Western Cape (3,1%) and Gauteng (6,6%) experienced the least interruptions. More than one-
quarter (25,4%) of South African households reported some dysfunctional service with their water supply in
2015.
Figure 44: Percentage distribution of households that received municipal water and that reported water interruptions that lasted more than 2 days at a time by province, 2010–2015
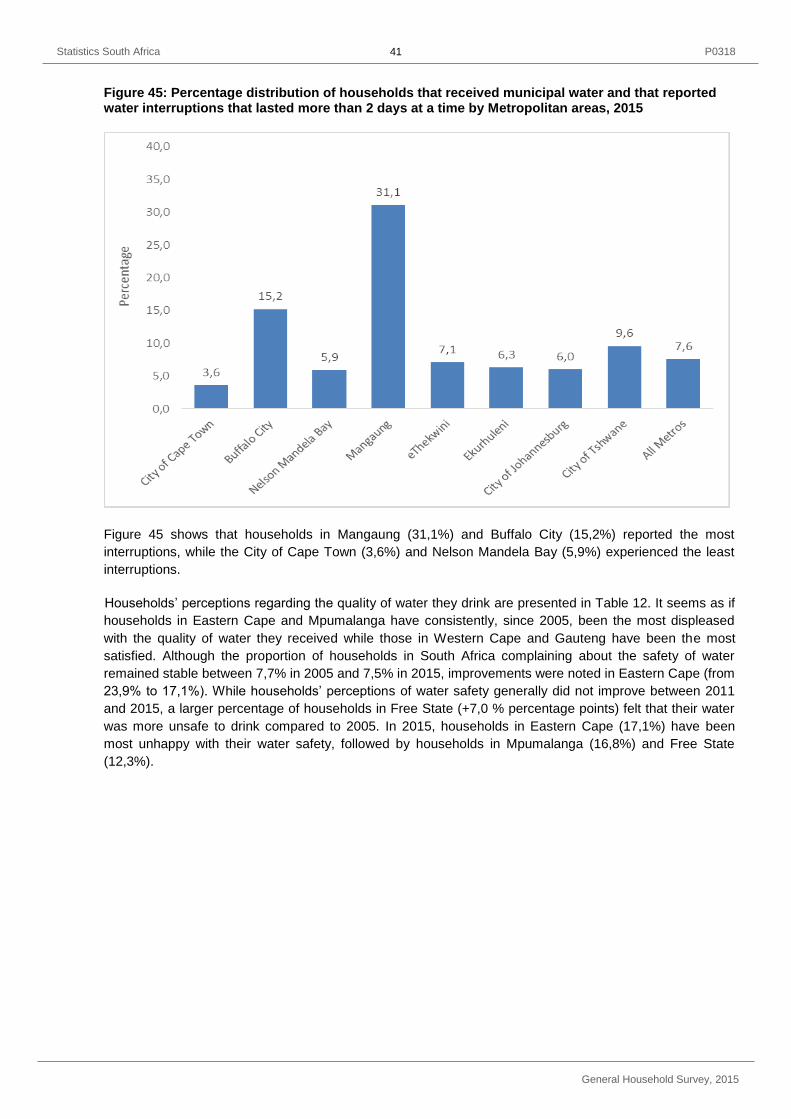
Statistics South Africa P0318
General Household Survey, 2015
41
Figure 45: Percentage distribution of households that received municipal water and that reported water interruptions that lasted more than 2 days at a time by Metropolitan areas, 2015
Figure 45 shows that households in Mangaung (31,1%) and Buffalo City (15,2%) reported the most
interruptions, while the City of Cape Town (3,6%) and Nelson Mandela Bay (5,9%) experienced the least
interruptions.
Households’ perceptions regarding the quality of water they drink are presented in Table 12. It seems as if
households in Eastern Cape and Mpumalanga have consistently, since 2005, been the most displeased
with the quality of water they received while those in Western Cape and Gauteng have been the most
satisfied. Although the proportion of households in South Africa complaining about the safety of water
remained stable between 7,7% in 2005 and 7,5% in 2015, improvements were noted in Eastern Cape (from
23,9% to 17,1%). While households’ perceptions of water safety generally did not improve between 2011
and 2015, a larger percentage of households in Free State (+7,0 % percentage points) felt that their water
was more unsafe to drink compared to 2005. In 2015, households in Eastern Cape (17,1%) have been
most unhappy with their water safety, followed by households in Mpumalanga (16,8%) and Free State
(12,3%).

Statistics South Africa P0318
General Household Survey, 2015
42
Table 12: Perceptions of households regarding the quality of the water they drink per province, 2005–2015
Year Perception
Statistic (numbers in thousands)
Province
WC EC NC FS KZN NW GP MP LP RSA
2005
Not safe to drink
Number 23 349 13 39 264 27 28 73 90 905
Percentage 1,8 23,9 5,3 5,3 12,9 3,0 0,9 8,6 8,0 7,7
Not clear
Number 32 335 16 49 254 45 45 93 91 959
Percentage 2,4 22,9 6,3 6,7 12,4 5,0 1,5 11,0 8,1 8,2
Not good in taste
Number 37 373 22 57 269 45 45 76 154 1 078
Percentage 2,9 25,5 8,8 7,9 13,1 5,0 1,5 8,9 13,7 9,2
Not free from bad smells
Number 44 312 14 46 272 79 46 74 96 983
Percentage 3,4 21,4 5,6 6,4 13,3 8,7 1,5 8,7 8,6 8,4
2006
Not safe to drink
Number 18 289 17 47 254 35 48 106 61 876
Percentage 1,3 19,6 6,6 6,5 12,1 3,8 1,5 12,1 5,3 7,3
Not clear
Number 32 285 20 55 247 37 60 135 59 931
Percentage 2,4 19,3 8,0 7,5 11,8 4,0 1,9 15,3 5,1 7,7
Not good in taste
Number 21 312 22 58 261 41 67 121 116 1 019
Percentage 1,6 21,1 8,8 7,8 12,4 4,5 2,1 13,7 10,0 8,4
Not free from bad smells
Number 39 256 14 49 249 46 74 114 61 903
Percentage 2,9 17,3 5,4 6,7 11,9 5,0 2,3 13,0 0,5 7,5
2007
Not safe to drink
Number 20 256 11 40 229 27 28 101 89 800
Percentage 1,4 17,1 4,3 5,3 10,6 2,9 0,8 11,1 7,5 6,4
Not clear
Number 30 231 12 48 228 56 31 106 84 826
Percentage 2,2 15,4 4,7 6,3 10,6 5,8 0,9 11,6 7,1 6,6
Not good in taste
Number 24 263 18 52 230 54 40 110 139 930
Percentage 1,8 17,5 6,8 6,9 10,7 5,7 1,2 12,1 11,7 7,5
Not free from bad smells
Number 33 221 10 46 229 51 25 108 86 807
Percentage 2,4 14,7 4,0 6,1 10,6 5,3 0,8 11,8 7,2 6,5
2009
Not safe to drink
Number 27 306 18 70 204 52 54 116 99 946
Percentage 1,9 19,8 6,4 8,8 8,9 5,2 1,5 11,9 7,8 7,1
Not clear
Number 35 313 19 69 228 52 50 145 90 1 002
Percentage 2,4 20,2 7,1 8,8 9,9 5,2 1,4 14,7 7,2 7,5
Not good in taste
Number 47 371 22 70 222 55 57 132 134 1 109
Percentage 3,2 24,0 8,0 8,8 9,7 5,5 1,6 13,5 10,6 8,3
Not free from bad smells
Number 74 296 12 42 243 44 37 102 87 937
Percentage 5,0 19,1 4,3 5,4 10,6 4,4 1,0 10,4 6,9 7,1

Statistics South Africa P0318
General Household Survey, 2015
43
Table 12: Perceptions of households regarding the quality of the water they drink per province, 2005–2015 (continued)
Year Perception
Statistic (numbers in thousands)
Province
WC EC NC FS KZN NW GP MP LP RSA
2010
Not safe to drink
Number 14 306 34 49 264 77 57 157 89 1 046
Percentage 0,9 19,6 12,2 6,1 11,3 7,4 1,5 15,5 6,8 7,7
Not clear
Number 22 335 42 69 222 82 64 166 83 1 084
Percentage 1,5 21,4 14,9 8,5 9,5 7,9 1,7 16,5 6,4 7,9
Not good in taste
Number 34 367 41 61 209 97 71 170 150 1 200
Percentage 2,2 23,5 14,6 7,6 8,9 9,3 1,9 16,8 11,6 8,8
Not free from bad smells
Number 25 250 32 54 201 69 89 137 74 932
Percentage 1,6 16 11,4 6,8 8,6 6,7 2,4 13,6 5,7 6,8
2011
Not safe to drink
Number 45 246 35 41 236 60 75 107 60 905
Percentage 2,9 15,5 12,0 5,0 9,9 5,6 2,0 10,2 4,5 6,4
Not clear
Number 51 241 40 53 221 72 88 109 59 936
Percentage 3,3 15,2 14,0 6,5 9,2 6,7 2,2 10,4 4,4 6,6
Not good in taste
Number 60 268 45 47 207 77 93 116 114 1026
Percentage 3,8 16,9 15,5 5,7 8,6 7,2 2,3 11,1 8,5 7,3
Not free from bad smells
Number 48 186 24 40 203 41 71 99 53 765
Percentage 3,1 11,8 8,3 4,8 8,4 3,8 1,8 9,5 4,0 5,4
2012
Not safe to drink
Number 46 238 24 127 191 50 115 156 72 1020
Percentage 2,9 14,7 8,2 15,1 7,7 4,6 2,8 14,4 5,2 7,0
Not clear
Number 62 243 35 138 177 74 114 141 69 1 052
Percentage 3,9 15,0 11,7 16,5 7,2 6,8 2,8 13,1 5,0 7,3
Not good in taste
Number 67 247 31 127 174 76 130 164 131 1 147
Percentage 4,2 15,3 10,6 15,2 7,0 6,9 3,2 15,2 9,5 7,9
Not free from bad smells
Number 54 182 21 127 226 54 98 126 65 954
Percentage 3,4 11,3 7,3 15,1 9,2 5,0 2,4 11,7 4,7 6,6
2013
Not safe to drink
Number 29 209 41 149 222 106 94 150 112 1 110
Percentage 1,7 12,6 13,5 17,3 8,6 9,3 2,2 13,3 7,8 7,4
Not clear
Number 44 204 46 173 210 130 115 157 109 1 189
Percentage 2,7 12,4 15,1 20,1 8,2 11,4 2,7 14,0 7,7 7,9
Not good in taste
Number 41 243 46 169 207 133 124 175 194 1 332
Percentage 2,5 14,7 15,1 19,7 8,1 11,7 2,9 15,6 13,5 8,9
Not free from bad smells
Number 28 125 33 156 203 107 104 135 150 1 043
Percentage 1,7 7,6 10,9 18,1 7,9 9,5 2,4 12,0 10,5 6,9
2014
Not safe to drink
Number 25 252 46 124 244 91 116 162 118 1 178
Percentage 1,4 14,9 14,8 14,2 9,2 7,8 2,6 14,1 8,0 7,6
Not clear
Number 32 238 50 156 233 113 136 143 125 1 227
Percentage 1,8 14,1 16,1 17,8 8,8 9,6 3,0 12,6 8,4 7,9
Not good in taste
Number 42 298 50 148 231 111 139 179 183 1 382
Percentage 2,5 17,7 16,1 17,0 8,7 9,5 3,1 15,7 12,4 8,9
Not free from bad smells
Number 28 145 39 139 222 90 131 117 123 1 034
Percentage 1,7 8,7 12,5 15,9 8,5 7,7 3,0 10,4 8,3 6,7

Statistics South Africa P0318
General Household Survey, 2015
44
Table 12: Perceptions of households regarding the quality of the water they drink per province, 2005–2015 (concluded)
Year Perception
Statistic (numbers in thousands)
Province
WC EC NC FS KZN NW GP MP LP RSA
2015
Not safe to drink
Number 29 295 33 111 250 109 90 200 86 1 205
Percentage 1,7 17,1 10,3 12,3 9,1 9,0 1,9 16,8 5,7 7,5
Not clear
Number 51 226 41 162 247 134 104 208 97 1 271
Percentage 2,9 13,1 12,8 17,9 9,0 11,1 2,2 17,4 6,4 7,9
Not good in taste
Number 50 334 36 120 253 136 106 212 166 1 413
Percentage 2,8 19,4 11,4 13,3 9,3 11,2 2,3 17,8 10,9 8,8
Not free from bad smells
Number 54 176 21 135 234 116 94 173 94 1 097
Percentage 3,1 10,3 6,7 14,9 8,5 9,6 2,0 14,5 6,2 6,8
The total used as the denominator to calculate percentages excluded unspecified responses on the quality of water. Perceptions related to water quality were not measured prior to 2005.
12. Sanitation and refuse removal
Environmental hygiene plays an essential role in the prevention of many diseases. It also impacts on the
natural environment and the preservation of important natural assets, such as water resources. Proper
sanitation is one of the key elements in improving environmental sanitation.
Figure 46 identifies the percentage of households per province that had access to RDP standard toilet
facilities, i.e. flush toilets connected to a public sewerage system or a septic tank, and a pit toilet with a
ventilation pipe. Nationally, the percentage of households with access to ‘RDP─standard’ sanitation
increased from 62,3% in 2002 to 80% in 2015. The majority of households in Western Cape (93,3%) and
Gauteng (91%) had access to adequate sanitation, while about half those in Limpopo (54%) and just below
two-thirds of those in Mpumalanga (65,8%) had adequate access. It is notable that access to adequate
sanitation grew most rapidly in Eastern Cape (+48,2 percentage points) between 2002 and 2015.
Figure 46: Percentage of households that have access to improved sanitation per province, 2002–
2015
Figure 47 identifies the percentage of households per metropolitan area that had access to RDP standard
toilet facilities, i.e. flush toilets connected to a public sewerage system or a septic tank, and a pit toilet with

Statistics South Africa P0318
General Household Survey, 2015
45
a ventilation pipe. The majority of households in the City of Johannesburg (96,9%) and Nelson Mandela
Bay (94,6%) had access to RDP standard toilet facilities, while households in the City of Tshwane (82,0%)
and eThekwini (83,5%) were the least likely to have to RDP standard toilet facilities.
Figure 47: Percentage of households that have access to improved sanitation by Metropolitan areas, 2015
Figure 48: Percentage of households that have no toilet facility or that have been using bucket toilets per province, 2002─2015

Statistics South Africa P0318
General Household Survey, 2015
46
Despite the improved access to RDP-standard sanitation facilities, many households continue to be without
any proper sanitation facilities. Figure 48 shows the percentage of households that either had no sanitation
facilities or that had to use bucket toilets. Nationally, the percentage of households that continued to live
without proper sanitation facilities had been declining consistently between 2002 and 2015, decreasing
from 12,3% to 4,7% during this period. The most rapid decline over this period was observed in Eastern
Cape (-29,1%), Limpopo (-13,8%), Free State (-11,0%) and Northern Cape (-9,9%).
A set of questions were introduced in GHS 2013 in order to assess the quality of the sanitation facilities to
which households had access to . Figure 49 outlines the extent to which households that share toilet
facilities, regardless of its modality, have experienced some of the issues raised in the questionnaire. About
one-quarter (24,7%) of households were concerned by poor lighting and inadequate hygiene (22,2%),
while 18,2% felt that their physical safety was threatened when using the toilet. About one-fifth (18,5%)
complained that there was no water to wash their hands after they had used the toilet, and another 16,7%
pointed to long waiting times. Only 10,3% of households complained that the toilets were not properly
enclosed. Only 4,8% of households complained that there were breakages in the municipal system and
7,5% of the household had blocked up toilets.
Figure 49: Problems experienced by households that share sanitation facilities during the six months before the survey, 2015
The proper disposal of household waste and refuse is important to maintain environmental hygiene of the
households’ neighbourhoods. Figure 50 shows that the percentage of households for which refuse was
removed at least once per week increased from 56,7% in 2002 to 64% in 2015, while the percentage of
households that had to rely on their own or communal rubbish dumps, or who had no facilities at all,
decreased over the same period.
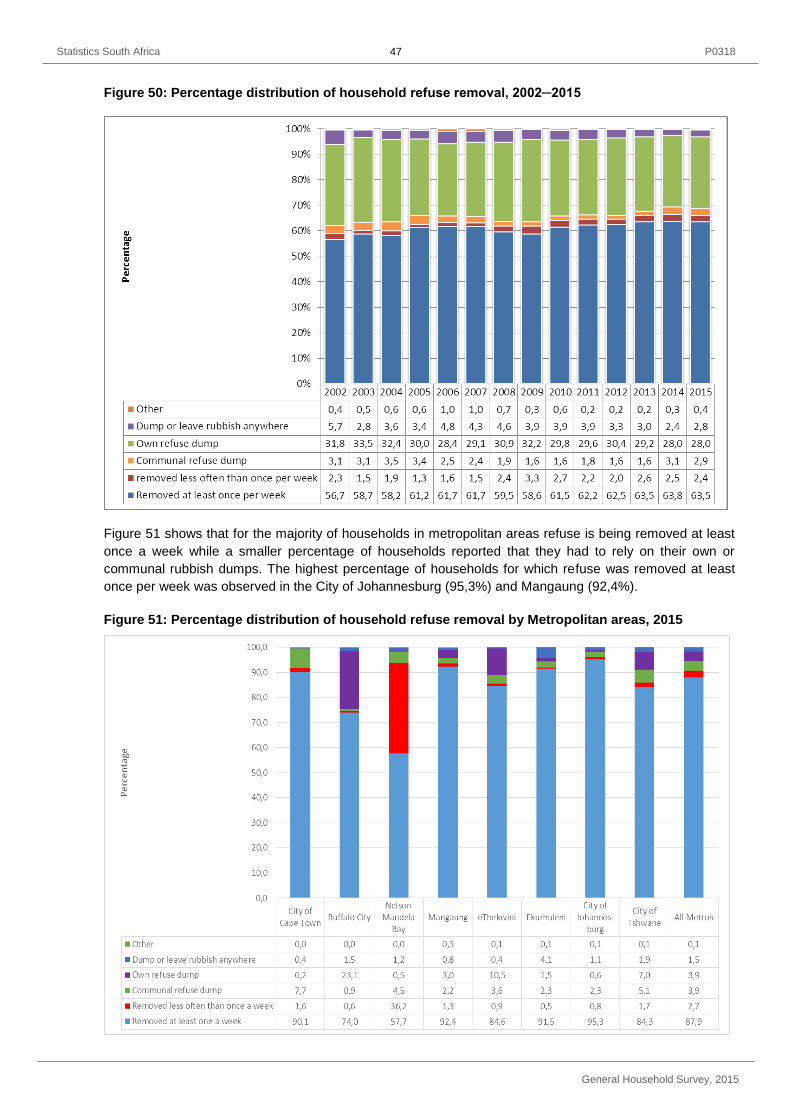
Statistics South Africa P0318
General Household Survey, 2015
47
Figure 50: Percentage distribution of household refuse removal, 2002─2015
Figure 51 shows that for the majority of households in metropolitan areas refuse is being removed at least
once a week while a smaller percentage of households reported that they had to rely on their own or
communal rubbish dumps. The highest percentage of households for which refuse was removed at least
once per week was observed in the City of Johannesburg (95,3%) and Mangaung (92,4%).
Figure 51: Percentage distribution of household refuse removal by Metropolitan areas, 2015

Statistics South Africa P0318
General Household Survey, 2015
48
The national figures, however, hide large discrepancies between particularly rural and urban areas, but
also between urban and metropolitan areas. Households in urban areas were much more likely to receive
some rubbish removal service than those in rural areas, and rural households were therefore much more
likely to rely on their own rubbish dumps. This information is presented in Table 13.
Table 13: Households refuse removal by province and geotype, 2015
Province Geotype
Removed at least once a
weak
Removed less often
than once a week
Communal refuse dump
Own refuse dump
Dump or leave
rubbish anywhere Other
Total
Western Cape
Rural 44,6 2,5 15,7 35,0 1,5 0,8 100,0
Urban 97,2 0,8 0,5 0,6 0,6 0,4 100,0
Metro 90,1 1,6 7,7 0,2 0,4 0,0 100,0
Total 89,6 1,4 6,1 2,2 0,5 0,2 100,0
Eastern Cape
Rural 0,4 0,4 0,7 92,8 1,9 3,8 100,0
Urban 64,0 5,7 1,4 26,2 0,9 1,8 100,0
Metro 64,3 21,7 3,0 9,6 1,3 0,0 100,0
Total 36,0 8,7 1,6 50,1 1,5 2,1 100,0
Northern Cape
Rural 17,1 2,3 3,8 61,6 8,1 7,1 100,0
Urban 86,2 3,0 1,6 5,3 2,6 1,3 100,0
Metro NA NA NA NA NA NA 0,0
Total 66,9 2,8 2,2 21,0 4,2 2,9 100,0
Free State
Rural 1,1 0,6 1,9 64,0 27,9 4,6 100,0
Urban 85,7 2,2 0,7 5,9 5,6 0,0 100,0
Metro 92,4 1,3 2,2 3,0 0,8 0,3 100,0
Total 75,9 1,7 1,3 13,1 7,3 0,7 100,0
KwaZulu-Natal
Rural 4,6 0,5 2,6 88,2 4,1 0,1 100,0
Urban 68,1 3,5 3,9 22,6 1,9 0,1 100,0
Metro 84,6 0,9 3,6 10,5 0,4 0,1 100,0
Total 49,5 1,3 3,3 43,6 2,2 0,1 100,0
North West
Rural 33,0 2,2 1,4 59,6 3,9 0,0 100,0
Urban 82,6 2,4 3,2 5,4 6,2 0,1 100,0
Metro NA NA NA NA NA NA 0,0
Total 57,1 2,3 2,3 33,3 5,0 0,1 100,0
Gauteng
Rural 34,5 10,6 18,0 34,6 2,3 0,0 100,0
Urban 89,9 3,9 1,3 1,9 2,8 0,3 100,0
Metro 91,1 0,9 3,1 2,6 2,3 0,1 100,0
Total 90,5 1,4 3,0 2,8 2,3 0,1 100,0
Mpumalanga
Rural 8,5 1,2 3,0 81,4 5,9 0,0 100,0
Urban 79,2 2,2 1,8 13,8 3,0 0,0 100,0
Metro NA NA NA NA NA NA 0,0
Total 39,5 1,6 2,5 51,8 4,7 0,0 100,0
Limpopo
Rural 4,8 0,5 1,1 89,9 3,1 0,6 100,0
Urban 75,1 8,7 3,3 9,6 3,3 0,0 100,0
Metro NA NA NA NA NA NA 0,0
Total 21,4 2,4 1,6 70,9 3,1 0,5 100,0
South Africa
Rural 9,6 1,0 2,2 81,7 4,4 1,1 100,0
Urban 81,2 3,4 2,0 10,0 3,1 0,4 100,0
Metro 87,9 2,7 3,9 3,9 1,5 0,1 100,0
Total 63,5 2,4 2,9 28,0 2,8 0,4 100,0
Table 13 shows that households in Gauteng (90,5%) and Western Cape (89,6%) were most likely to have
had their refuse removed at least once per week, while households in Limpopo (21,4%), Eastern Cape
(36,0%) and Mpumalanga (39,5%) were least likely to have had regular refuse removal. Various modes of

Statistics South Africa P0318
General Household Survey, 2015
49
refuse removal are closely aligned with particular geographic areas. Households in urban and metropolitan
areas were most likely to have had refuse removal services which are usually provided through local
municipalities, while rural areas mostly relied on their own refuse dumps. Nationally, more than nine-tenths
(86,1%) of households in rural areas discarded refuse themselves compared to only 13,3% of households
in urban, and 5,4% of households in metropolitan areas. The latter households were most likely to be in
informal settlement type areas. In 2015, 54% of South African households were paying for the removal of
their refuse. In addition to the 61,2% of households for whom refuse was removed on a weekly basis by the
municipality, the municipality less frequently removed refuse for a further 1,8% of households.
13. Telecommunications
Figure 52 summarises statistics collected on access to functional landlines and cellular phones within the
sampled dwelling units in 2015. Nationally, only 3,5% of households did not have access to either landlines
or cellular phones. Households without access to these communication media were most common in
Northern Cape (11,1%) and Eastern Cape (7,0%). Merely 0,1% of South African households used only
landlines. By comparison, 85,5% of South African households had the use of only cellular phones in their
dwellings/ households. The largest percentages were observed in Mpumalanga (94,4%), Limpopo
(94,1%), North West (89,5%) and Free State (89,0%). Western Cape had the lowest percentage of
households who had only cellular phones in their dwellings (69,2%) and this province also had the highest
percentage of households that were using only landlines (0,2%). The use of a combination of both cellular
phones and landlines in households was most prevalent in the more affluent provinces, namely Western
Cape (26,2%) and Gauteng (14,1%).
Figure 52: Percentage of households who have a functional landline and cellular telephone in their dwellings by province, 2015
Figure 53 shows that households without access to these communication media were most common in
Buffalo City (6,6%), Nelson Mandela Bay (5,9%) and Mangaung (3,6%). Merely 0,1% of South African
households living in metropolitan areas used only landlines, but as many as 81,1% of South African
households living in metropolitan areas used only cellular phones in their dwellings. The largest
percentages for cellular phones usage were observed in Mangaung (88,5%), Ekurhuleni (86,1%), and
Buffalo City (84,7%). The City of Cape Town (69,3%) had the lowest percentage of households who had
only cellular phones in their dwellings. The use of a combination of both cellular phones and landlines in
households was most prevalent in the City of Cape Town (28,3%) and eThekwini (17,6%).
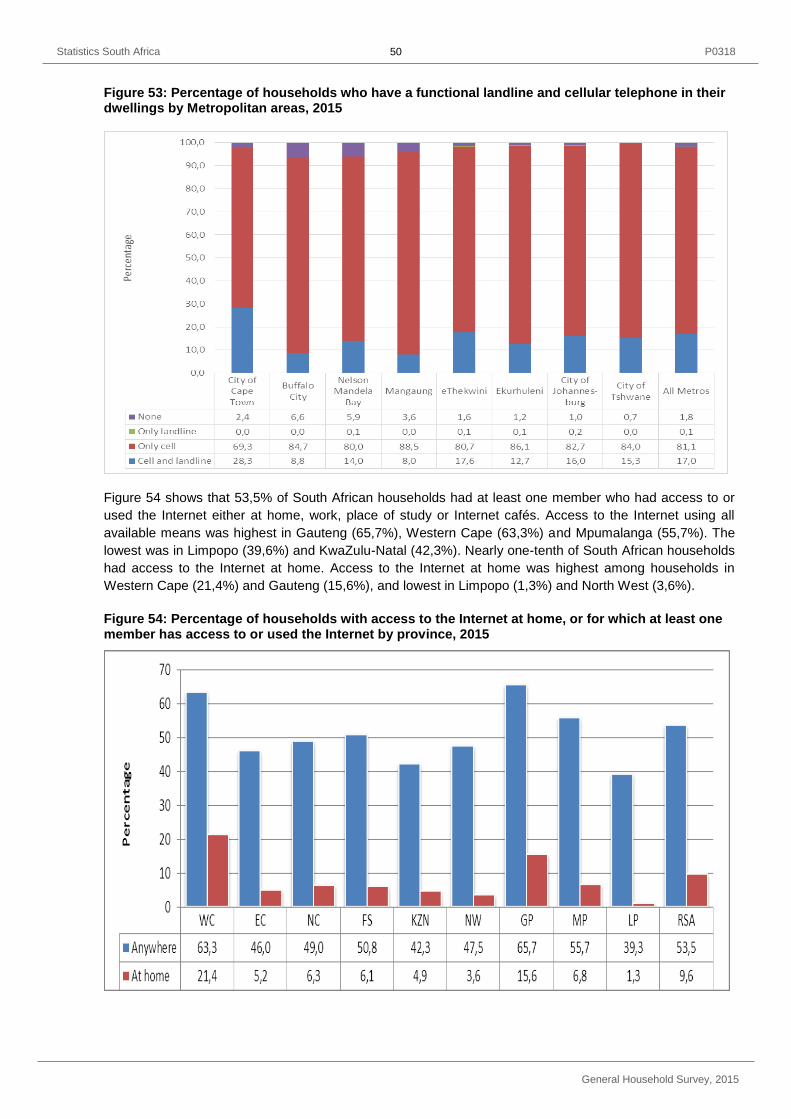
Statistics South Africa P0318
General Household Survey, 2015
50
Figure 53: Percentage of households who have a functional landline and cellular telephone in their dwellings by Metropolitan areas, 2015
Figure 54 shows that 53,5% of South African households had at least one member who had access to or
used the Internet either at home, work, place of study or Internet cafés. Access to the Internet using all
available means was highest in Gauteng (65,7%), Western Cape (63,3%) and Mpumalanga (55,7%). The
lowest was in Limpopo (39,6%) and KwaZulu-Natal (42,3%). Nearly one-tenth of South African households
had access to the Internet at home. Access to the Internet at home was highest among households in
Western Cape (21,4%) and Gauteng (15,6%), and lowest in Limpopo (1,3%) and North West (3,6%).
Figure 54: Percentage of households with access to the Internet at home, or for which at least one member has access to or used the Internet by province, 2015
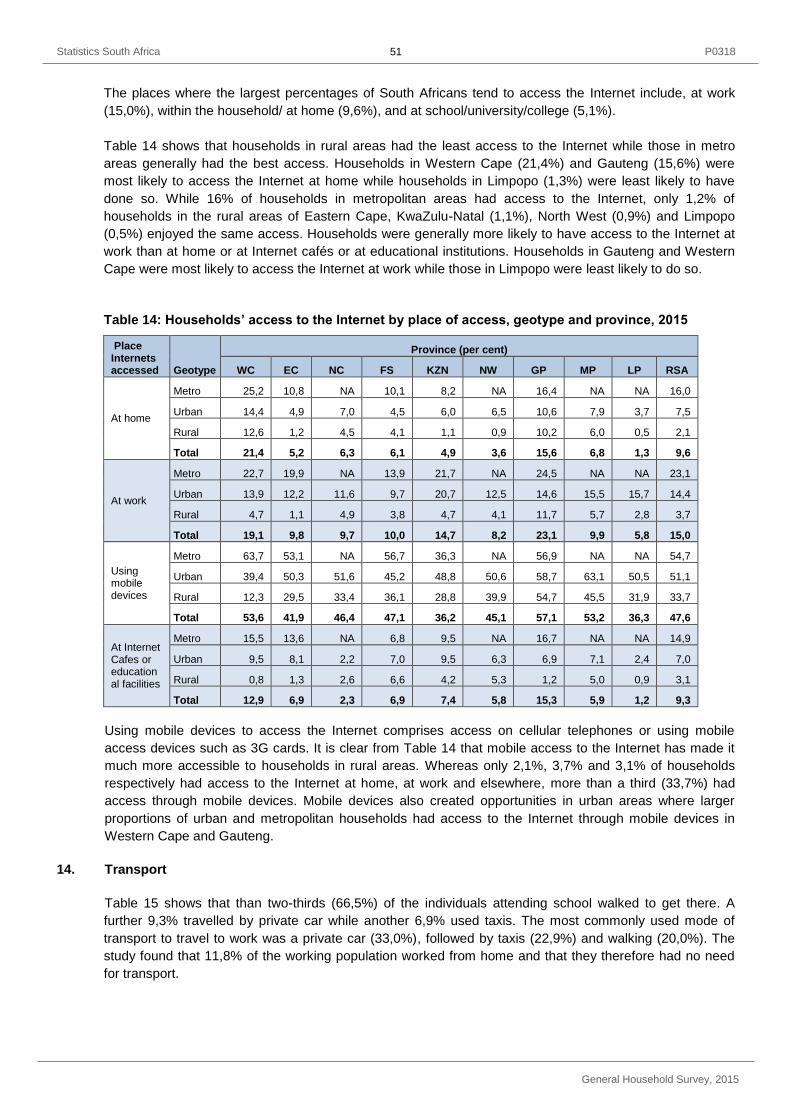
Statistics South Africa P0318
General Household Survey, 2015
51
The places where the largest percentages of South Africans tend to access the Internet include, at work
(15,0%), within the household/ at home (9,6%), and at school/university/college (5,1%).
Table 14 shows that households in rural areas had the least access to the Internet while those in metro
areas generally had the best access. Households in Western Cape (21,4%) and Gauteng (15,6%) were
most likely to access the Internet at home while households in Limpopo (1,3%) were least likely to have
done so. While 16% of households in metropolitan areas had access to the Internet, only 1,2% of
households in the rural areas of Eastern Cape, KwaZulu-Natal (1,1%), North West (0,9%) and Limpopo
(0,5%) enjoyed the same access. Households were generally more likely to have access to the Internet at
work than at home or at Internet cafés or at educational institutions. Households in Gauteng and Western
Cape were most likely to access the Internet at work while those in Limpopo were least likely to do so.
Table 14: Households’ access to the Internet by place of access, geotype and province, 2015
Place Internets accessed Geotype
Province (per cent)
WC EC NC FS KZN NW GP MP LP RSA
At home
Metro 25,2 10,8 NA 10,1 8,2 NA 16,4 NA NA 16,0
Urban 14,4 4,9 7,0 4,5 6,0 6,5 10,6 7,9 3,7 7,5
Rural 12,6 1,2 4,5 4,1 1,1 0,9 10,2 6,0 0,5 2,1
Total 21,4 5,2 6,3 6,1 4,9 3,6 15,6 6,8 1,3 9,6
At work
Metro 22,7 19,9 NA 13,9 21,7 NA 24,5 NA NA 23,1
Urban 13,9 12,2 11,6 9,7 20,7 12,5 14,6 15,5 15,7 14,4
Rural 4,7 1,1 4,9 3,8 4,7 4,1 11,7 5,7 2,8 3,7
Total 19,1 9,8 9,7 10,0 14,7 8,2 23,1 9,9 5,8 15,0
Using mobile devices
Metro 63,7 53,1 NA 56,7 36,3 NA 56,9 NA NA 54,7
Urban 39,4 50,3 51,6 45,2 48,8 50,6 58,7 63,1 50,5 51,1
Rural 12,3 29,5 33,4 36,1 28,8 39,9 54,7 45,5 31,9 33,7
Total 53,6 41,9 46,4 47,1 36,2 45,1 57,1 53,2 36,3 47,6
At Internet Cafes or educational facilities
Metro 15,5 13,6 NA 6,8 9,5 NA 16,7 NA NA 14,9
Urban 9,5 8,1 2,2 7,0 9,5 6,3 6,9 7,1 2,4 7,0
Rural 0,8 1,3 2,6 6,6 4,2 5,3 1,2 5,0 0,9 3,1
Total 12,9 6,9 2,3 6,9 7,4 5,8 15,3 5,9 1,2 9,3
Using mobile devices to access the Internet comprises access on cellular telephones or using mobile
access devices such as 3G cards. It is clear from Table 14 that mobile access to the Internet has made it
much more accessible to households in rural areas. Whereas only 2,1%, 3,7% and 3,1% of households
respectively had access to the Internet at home, at work and elsewhere, more than a third (33,7%) had
access through mobile devices. Mobile devices also created opportunities in urban areas where larger
proportions of urban and metropolitan households had access to the Internet through mobile devices in
Western Cape and Gauteng.
14. Transport
Table 15 shows that than two-thirds (66,5%) of the individuals attending school walked to get there. A
further 9,3% travelled by private car while another 6,9% used taxis. The most commonly used mode of
transport to travel to work was a private car (33,0%), followed by taxis (22,9%) and walking (20,0%). The
study found that 11,8% of the working population worked from home and that they therefore had no need
for transport.

Statistics South Africa P0318
General Household Survey, 2015
52
Table 15: Mode of transport used by household members to travel to school and work, 2015
Mode of transport Statistic
(Numbers in thousands)
Usual transport to
school
Usual transport to
work
Walking
Number 10 328 3 344
Percentage 66,5 20,0
Bicycle/motorcycle
Number 125 163
Percentage 0,8 0,97
Minibus taxi/sedan taxi/bakkie taxi
Number 1 076 3 846
Percentage 6,9 22,9
Bus
Number 563 927
Percentage 3,6 5,5
Train
Number 95 532
Percentage 0,6 3,2
Minibus/bus provided by institution/government and not paid for
Number 385 Na
Percentage 2,5 Na
Vehicle hired by a group of parents
Number 1 460 Na
Percentage 9,4 Na
Own car or other private vehicle
Number 1 449 5 529
Percentage 9,3 33,0
Lift club
Number Na 381
Percentage Na 2,3
None, studies/works from home
Number Na 1 975
Percentage Na 11,8
Other
Number 51 70
Percentage 0,3 0,4
Subtotal
Number 15 481 16 767
Percentage 100,0 100,0
Unspecified Number 235 213
Total Number 15 716 16 980
The transport questions focus primarily on the use of public and/or state-subsidised transport, the cost of
transport to households and the types of transport and time needed to travel to work, school and healthcare
facilities. Figure 55 shows that 38,1% of South African households had at least one household member
who used a minibus taxi/sedan taxi/bakkie taxi during the week preceding the survey. Provinces with the
highest levels of use of minibus taxis were: Gauteng (43,1%), North West (42,9%), Mpumalanga (42,8%)
and KwaZulu-Natal (37,7%). By comparison, only seven per cent of South African households used a bus
during the preceding week. It is notable that 17,5% of households in Mpumalanga used the bus. The use of
trains was most common in Western Cape (11,5%) and Gauteng (7,5%).

Statistics South Africa P0318
General Household Survey, 2015
53
Figure 55: Percentage of households who made use of public transport during the week preceding the survey by province, 2015
15. Environmental trends
The GHS includes a number of questions on the environment, the most important of which has been
included in the questionnaire from 2003 onwards, and which specifically asks households whether they
have experienced any of a list of environmental problems in the area where they live. Figure 56
summarises these responses between 2003 and 2015. The figure reveals that waste removal problems
and littering1 (39,0%) as well as land degradation and soil erosion (31,2%) were the two environmental
problems that concerned the highest percentage of households. Strikingly, the percentage of households
that considered land degradation and soil erosion a problem increased from 15,5% in 2003 to 34,4% in
2014 before dropping to 31,2% in 2015. The proportion of households that felt that there were problems
with littering and waste removal in their areas increased notably since 2003 when 28,8% of households
regarded this as a problem. The percentage of households that perceived water pollution as a problem has
fluctuated significantly before settling on 16,2% in 2015. Households that considered air pollution to be a
problem decreased from 22,8% in 2003 to 19,5% in 2015.
1The question related to waste removal/littering was asked slightly differently in 2009 in that the two categories were separated in 2009, whilst it was
combined as an option in the previous years. For the purposes of comparison they were grouped together again for 2009. This slight modification may also have contributed to the higher number of households concerned about waste removal/littering.

Statistics South Africa P0318
General Household Survey, 2015
54
Figure 56: Percentage of households who experience specific kinds of environmental problems, 2003–2015
Figure 57 reveals that waste removal problems and littering (34,7%) as well as air pollution (19,1%) were
the two environmental problems that concerned the highest percentage of households in metros. The
highest percentage of households that perceived waste removal problems and littering were observed in
Mangaung (45,6%) and Buffalo City (45,0%), while the lowest percentage was observed in Nelson
Mandela Bay(26,9%) and City of Cape Town (27,7%). The highest percentage of households that
perceived air pollution problems were observed in Buffalo City (32,3%) and Ekurhuleni(22,7%) while the
lowest percentage was observed in Nelson Mandela Bay (10,8%) and City of Cape Town (14,3%).
During the 12 months preceding the survey, 46,6% of households used pesticides in their dwellings and
12,7% used pesticides in their yards. A further 7,9% used herbicides in their yards or gardens. Most South
Africans are aware of the need to save resources.
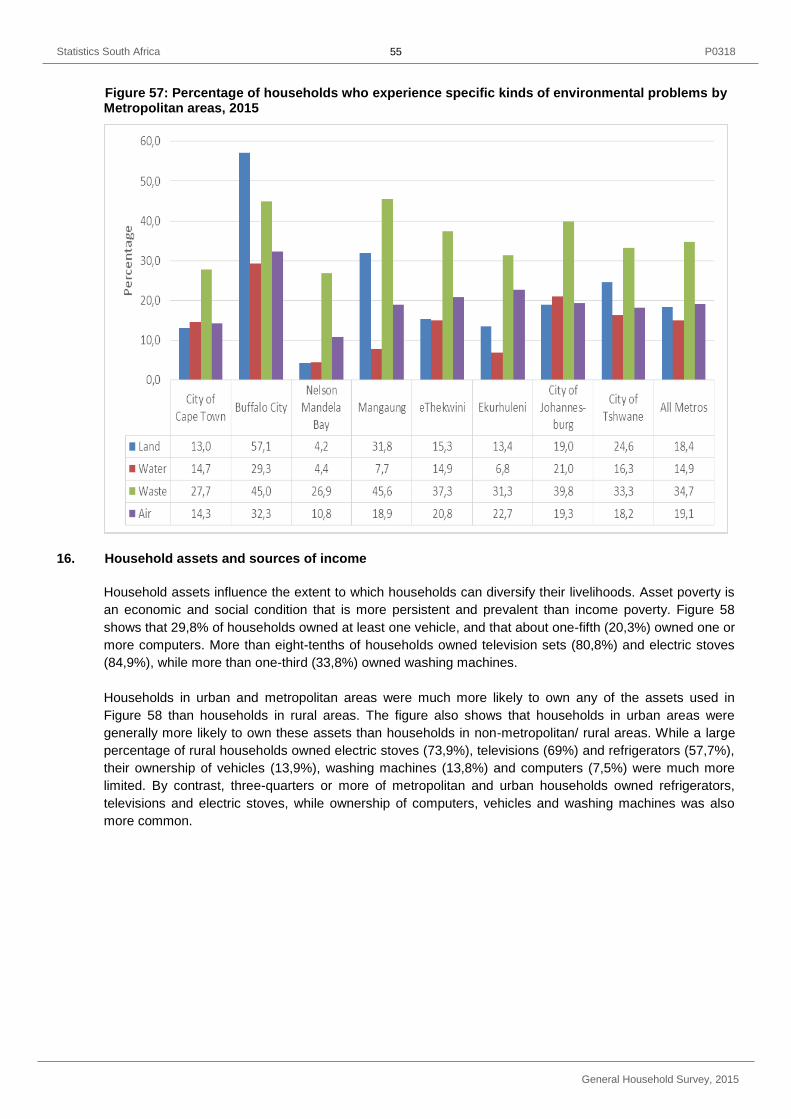
Statistics South Africa P0318
General Household Survey, 2015
55
Figure 57: Percentage of households who experience specific kinds of environmental problems by Metropolitan areas, 2015
16. Household assets and sources of income
Household assets influence the extent to which households can diversify their livelihoods. Asset poverty is
an economic and social condition that is more persistent and prevalent than income poverty. Figure 58
shows that 29,8% of households owned at least one vehicle, and that about one-fifth (20,3%) owned one or
more computers. More than eight-tenths of households owned television sets (80,8%) and electric stoves
(84,9%), while more than one-third (33,8%) owned washing machines.
Households in urban and metropolitan areas were much more likely to own any of the assets used in
Figure 58 than households in rural areas. The figure also shows that households in urban areas were
generally more likely to own these assets than households in non-metropolitan/ rural areas. While a large
percentage of rural households owned electric stoves (73,9%), televisions (69%) and refrigerators (57,7%),
their ownership of vehicles (13,9%), washing machines (13,8%) and computers (7,5%) were much more
limited. By contrast, three-quarters or more of metropolitan and urban households owned refrigerators,
televisions and electric stoves, while ownership of computers, vehicles and washing machines was also
more common.

Statistics South Africa P0318
General Household Survey, 2015
56
Figure 58: Percentage distribution of households by selected assets owned, by geotype, 2015
Figure 59 summarises the percentage of households according to the various sources of income reported
by households. Nationally, salaries (65,5%) and grants (46,2%) were reported as income sources by the
highest percentages of households. Provincially, the largest percentage of households that earned salaries
were found in Western Cape (76,8%) and Gauteng (75%). Grants were more prevalent than salaries as a
source of income in Eastern Cape (59,8%) and Limpopo (58,9%). Remittances as a source of income
played an important role in most provinces, but especially in Eastern Cape (24,4%), Limpopo (23,7%) and
Mpumalanga (21,3%).
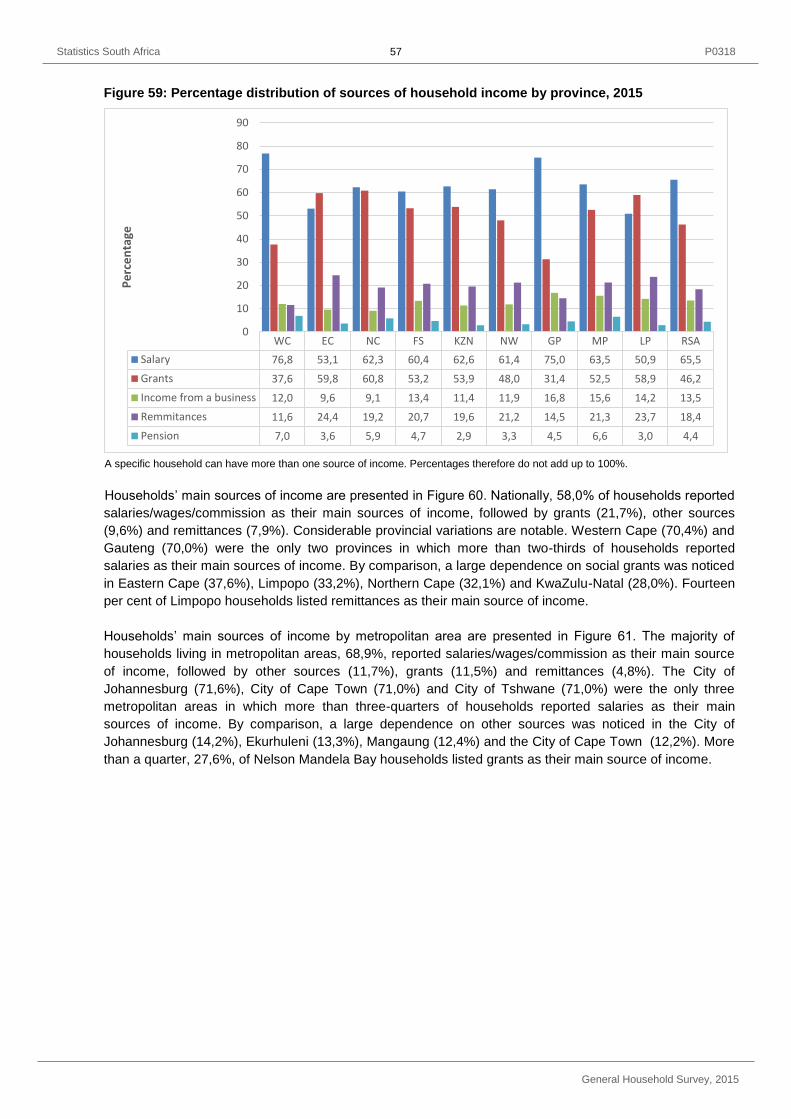
Statistics South Africa P0318
General Household Survey, 2015
57
Figure 59: Percentage distribution of sources of household income by province, 2015
A specific household can have more than one source of income. Percentages therefore do not add up to 100%.
Households’ main sources of income are presented in Figure 60. Nationally, 58,0% of households reported
salaries/wages/commission as their main sources of income, followed by grants (21,7%), other sources
(9,6%) and remittances (7,9%). Considerable provincial variations are notable. Western Cape (70,4%) and
Gauteng (70,0%) were the only two provinces in which more than two-thirds of households reported
salaries as their main sources of income. By comparison, a large dependence on social grants was noticed
in Eastern Cape (37,6%), Limpopo (33,2%), Northern Cape (32,1%) and KwaZulu-Natal (28,0%). Fourteen
per cent of Limpopo households listed remittances as their main source of income.
Households’ main sources of income by metropolitan area are presented in Figure 61. The majority of
households living in metropolitan areas, 68,9%, reported salaries/wages/commission as their main source
of income, followed by other sources (11,7%), grants (11,5%) and remittances (4,8%). The City of
Johannesburg (71,6%), City of Cape Town (71,0%) and City of Tshwane (71,0%) were the only three
metropolitan areas in which more than three-quarters of households reported salaries as their main
sources of income. By comparison, a large dependence on other sources was noticed in the City of
Johannesburg (14,2%), Ekurhuleni (13,3%), Mangaung (12,4%) and the City of Cape Town (12,2%). More
than a quarter, 27,6%, of Nelson Mandela Bay households listed grants as their main source of income.
WC EC NC FS KZN NW GP MP LP RSA
Salary 76,8 53,1 62,3 60,4 62,6 61,4 75,0 63,5 50,9 65,5
Grants 37,6 59,8 60,8 53,2 53,9 48,0 31,4 52,5 58,9 46,2
Income from a business 12,0 9,6 9,1 13,4 11,4 11,9 16,8 15,6 14,2 13,5
Remmitances 11,6 24,4 19,2 20,7 19,6 21,2 14,5 21,3 23,7 18,4
Pension 7,0 3,6 5,9 4,7 2,9 3,3 4,5 6,6 3,0 4,4
0
10
20
30
40
50
60
70
80
90P
erc
en
tage
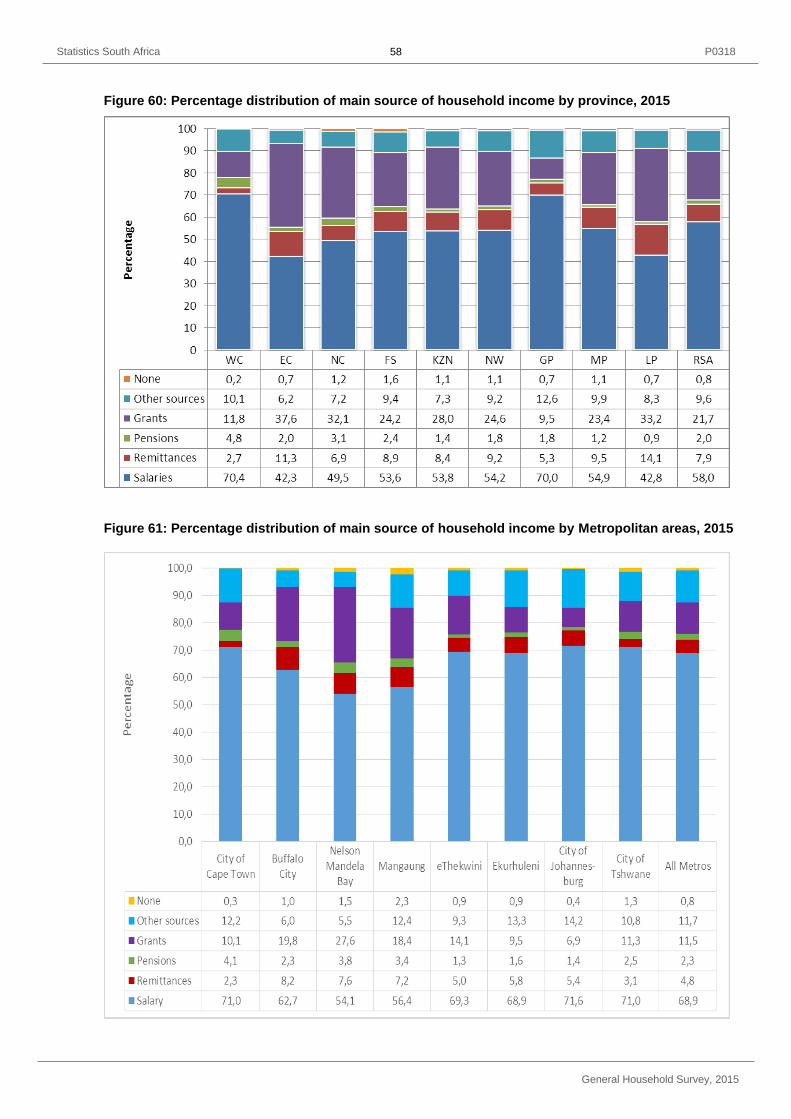
Statistics South Africa P0318
General Household Survey, 2015
58
Figure 60: Percentage distribution of main source of household income by province, 2015
Figure 61: Percentage distribution of main source of household income by Metropolitan areas, 2015

Statistics South Africa P0318
General Household Survey, 2015
59
17. Access to food
Between 2002 and 2008, the GHS has asked households to indicate whether, and how often adults and
children went hungry because there was not enough food in the household. The question was discontinued
in 2009 but reinstated in the 2010 questionnaire. Figure 62 shows that the percentage of persons that
experienced hunger decreased from 29,3% in 2002 to 13,7% in 2007, before rebounding slightly to 15,9%
in 2008. The percentage dropped to 13,1% in 2015. The percentage of households who were vulnerable to
hunger reflects the same pattern as persons. The percentage of households that were vulnerable to hunger
declined from 23,8% in 2002 to 11,3% in 2015, including a spell during which the percentage increased to
16% in 2008 before continuing its decline.
Since 2009, the GHS questionnaire has also included a set of questions based on the Household Food
Insecurity Access Scale (HFIAS) to determine households’ access to food. These questions aim to
measure households’ food access by asking households about modifications they made in their diet or
eating patterns during the previous month because of limited sources available where they can obtain food.
The index provides a slightly more sensitive measure of food access than the question on hunger. The
question used in 2009 was expanded in 2010 with the addition of a question on possible decreases in the
variety of foods consumed. The index seems to reflect a similar pattern, though it is slightly higher.
Figure 62 shows that the percentage of households that had limited access to food decreased from 23,9%
in 2010 to 22,6% in 2015. Simultaneously, the percentage of persons with more limited access to food
declined from 28,6% in 2010 to 26,4% in 2015.
Figure 62: Vulnerability to hunger and access to food, 2002–2015; 2010–2015

Statistics South Africa P0318
General Household Survey, 2015
60
Figure 63 shows that food access problems were the most common in North West where 39% of
households had inadequate or severely inadequate food access. Inadequate or severely inadequate
access to food were also observed in Mpumalanga (31,7%), Northern Cape (31,3%) and Eastern Cape
(28,4%).
Figure 63: Percentage of households experiencing food adequacy or inadequacy by province, 2015
Figure 64 shows that 17,7% of households living in metropolitan areas reported that they are experiencing
food access problems. Food access problems were most common in the City of Cape Town (31%), Nelson
Mandela Bay (28,9%) and Mangaung (25,5%).
Figure 64: Percentage of households experiencing food adequacy or inadequacy by Metropolitan areas, 2015

Statistics South Africa P0318
General Household Survey, 2015
61
18. Agriculture
Figure 65 shows that less than one-fifth of South African households (16,9%) were involved in agricultural
production activities during the reference period. Of these, 11,8% cultivated farmland while 91,3% created
backyard gardens.
Figure 65: Percentage of households involved in agricultural activities by province, 2015
It is clear from Figure 66 that, nationally, more than three-quarters (77,9%) of households that were
involved in agriculture were involved in an attempt to secure an additional source of food. Provincially,
93,2% of households in Limpopo, 84,5% of households in Eastern Cape and 77,6% of households in
Mpumalanga wanted to augment their existing sources of food. Half (50,8%) of households in Western
Cape used agriculture as a leisure activity. In Northern Cape, 19,5% of households attempted to create an
additional source of income through agriculture. It is noticeable that almost one-fifth (17,2%) of households
that were involved in agriculture in KwaZulu-Natal, reported that they did so to create a main source of
food. Since agriculture is not so common in Gauteng (see Figure 65) this finding might point to the fact that
many households that do engage in it do so as a last option.
Figure 66: Percentage distribution of the main reasons for agricultural involvement by province, 2015
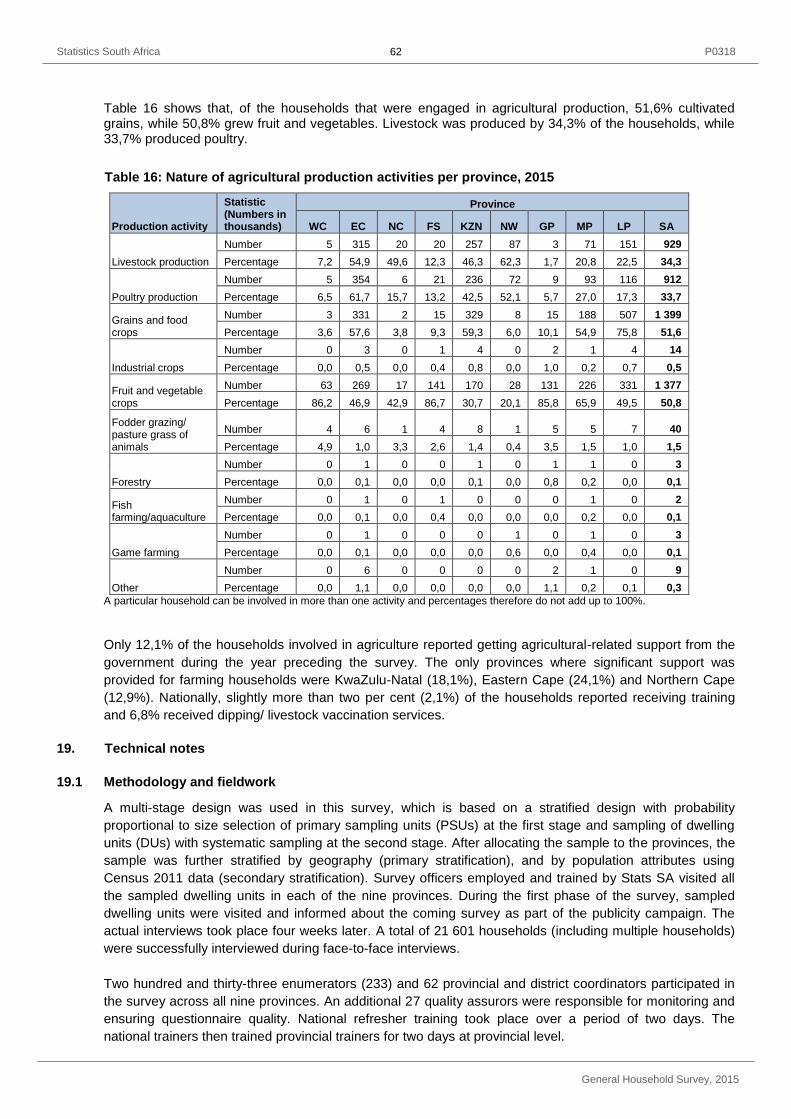
Statistics South Africa P0318
General Household Survey, 2015
62
Table 16 shows that, of the households that were engaged in agricultural production, 51,6% cultivated
grains, while 50,8% grew fruit and vegetables. Livestock was produced by 34,3% of the households, while 33,7% produced poultry.
Table 16: Nature of agricultural production activities per province, 2015
Production activity
Statistic (Numbers in thousands)
Province
WC EC NC FS KZN NW GP MP LP SA
Livestock production
Number 5 315 20 20 257 87 3 71 151 929
Percentage 7,2 54,9 49,6 12,3 46,3 62,3 1,7 20,8 22,5 34,3
Poultry production
Number 5 354 6 21 236 72 9 93 116 912
Percentage 6,5 61,7 15,7 13,2 42,5 52,1 5,7 27,0 17,3 33,7
Grains and food crops
Number 3 331 2 15 329 8 15 188 507 1 399
Percentage 3,6 57,6 3,8 9,3 59,3 6,0 10,1 54,9 75,8 51,6
Industrial crops
Number 0 3 0 1 4 0 2 1 4 14
Percentage 0,0 0,5 0,0 0,4 0,8 0,0 1,0 0,2 0,7 0,5
Fruit and vegetable crops
Number 63 269 17 141 170 28 131 226 331 1 377
Percentage 86,2 46,9 42,9 86,7 30,7 20,1 85,8 65,9 49,5 50,8
Fodder grazing/ pasture grass of animals
Number 4 6 1 4 8 1 5 5 7 40
Percentage 4,9 1,0 3,3 2,6 1,4 0,4 3,5 1,5 1,0 1,5
Forestry
Number 0 1 0 0 1 0 1 1 0 3
Percentage 0,0 0,1 0,0 0,0 0,1 0,0 0,8 0,2 0,0 0,1
Fish farming/aquaculture
Number 0 1 0 1 0 0 0 1 0 2
Percentage 0,0 0,1 0,0 0,4 0,0 0,0 0,0 0,2 0,0 0,1
Game farming
Number 0 1 0 0 0 1 0 1 0 3
Percentage 0,0 0,1 0,0 0,0 0,0 0,6 0,0 0,4 0,0 0,1
Other
Number 0 6 0 0 0 0 2 1 0 9
Percentage 0,0 1,1 0,0 0,0 0,0 0,0 1,1 0,2 0,1 0,3
A particular household can be involved in more than one activity and percentages therefore do not add up to 100%.
Only 12,1% of the households involved in agriculture reported getting agricultural-related support from the
government during the year preceding the survey. The only provinces where significant support was
provided for farming households were KwaZulu-Natal (18,1%), Eastern Cape (24,1%) and Northern Cape
(12,9%). Nationally, slightly more than two per cent (2,1%) of the households reported receiving training
and 6,8% received dipping/ livestock vaccination services.
19. Technical notes
19.1 Methodology and fieldwork
A multi-stage design was used in this survey, which is based on a stratified design with probability
proportional to size selection of primary sampling units (PSUs) at the first stage and sampling of dwelling
units (DUs) with systematic sampling at the second stage. After allocating the sample to the provinces, the
sample was further stratified by geography (primary stratification), and by population attributes using
Census 2011 data (secondary stratification). Survey officers employed and trained by Stats SA visited all
the sampled dwelling units in each of the nine provinces. During the first phase of the survey, sampled
dwelling units were visited and informed about the coming survey as part of the publicity campaign. The
actual interviews took place four weeks later. A total of 21 601 households (including multiple households)
were successfully interviewed during face-to-face interviews.
Two hundred and thirty-three enumerators (233) and 62 provincial and district coordinators participated in
the survey across all nine provinces. An additional 27 quality assurors were responsible for monitoring and
ensuring questionnaire quality. National refresher training took place over a period of two days. The
national trainers then trained provincial trainers for two days at provincial level.

Statistics South Africa P0318
General Household Survey, 2015
63
19.2 The questionnaire
Table 17 summarises the details of the questions included in the GHS questionnaire. The questions are
covered in 10 sections, each focusing on a particular aspect. Depending on the need for additional
information, the questionnaire is adapted on an annual basis. New sections may be introduced on a
specific topic for which information is needed or additional questions may be added to existing sections.
Likewise, questions that are no longer necessary may be removed.
Table 17: A summary of the contents of the GHS 2015 questionnaire
Section Number of questions Details of each section
Cover page Household information, response details, field staff information, result codes, etc.
Flap 7 Demographic information (name, sex, age, population group, etc.)
Section 1 41 Biographical information (education, health, disability, welfare)
Section 2 13 Health and general functioning
Section 3 6 Social grants and social relief
Section 4 16 Economic activities
Section 5 59 Household information (type of dwelling, ownership of dwelling, electricity, water and sanitation, environmental issues, services, transport, etc.)
Section 6 11 Communication, postal services and transport
Section 7 15 Health, welfare and food security
Section 8 29 Households Livelihoods (agriculture, household income sources and expenditure)
Section 9 7 Mortality in the last 12 months
Section 10 3 Questions to interviewers
All sections 207 Comprehensive coverage of living conditions and service delivery
The GHS questionnaire has undergone some revisions over time. These changes were primarily the result
of shifts in focus of government programmes over time. The 2002–2004 questionnaires were very similar.
Changes made to the GHS 2005 questionnaire included additional questions in the education section with
a total of 179 questions. Between 2006 and 2008, the questionnaire remained virtually unchanged. For
GHS 2009, extensive stakeholder consultation took place during which the questionnaire was reviewed to
be more in line with the monitoring and evaluation frameworks of the various government departments.
Particular sections that were modified substantially during the review were the sections on education, social
development, housing, agriculture, and food security.
Even though the number of sections and pages in the questionnaire remained the same, questions in the
GHS 2009 were increased from 166 to 185 between 2006 and 2008. Following the introduction of a
dedicated survey on Domestic Tourism, the section on tourism was dropped for GHS 2010. Due to a
further rotation of questions, particularly the addition of a module on mortality in 2014, the GHS 2015
questionnaire contained 207 questions.
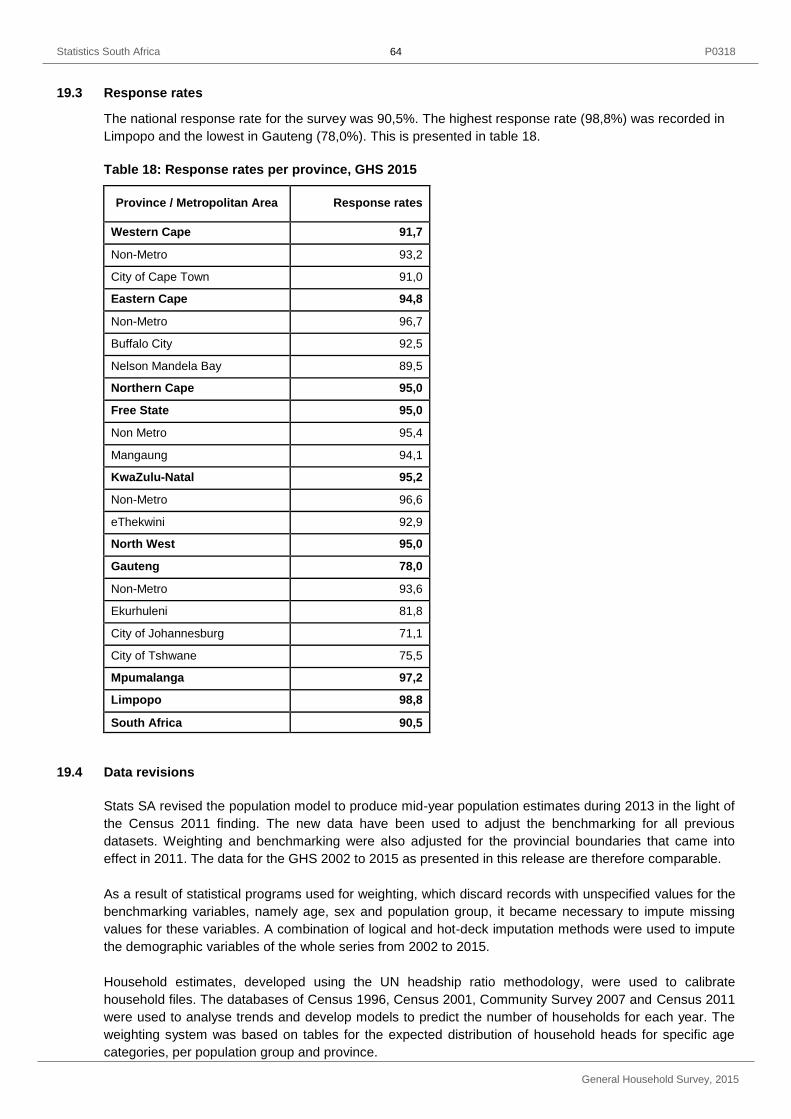
Statistics South Africa P0318
General Household Survey, 2015
64
19.3 Response rates
The national response rate for the survey was 90,5%. The highest response rate (98,8%) was recorded in
Limpopo and the lowest in Gauteng (78,0%). This is presented in table 18.
Table 18: Response rates per province, GHS 2015
Province / Metropolitan Area Response rates
Western Cape 91,7
Non-Metro 93,2
City of Cape Town 91,0
Eastern Cape 94,8
Non-Metro 96,7
Buffalo City 92,5
Nelson Mandela Bay 89,5
Northern Cape 95,0
Free State 95,0
Non Metro 95,4
Mangaung 94,1
KwaZulu-Natal 95,2
Non-Metro 96,6
eThekwini 92,9
North West 95,0
Gauteng 78,0
Non-Metro 93,6
Ekurhuleni 81,8
City of Johannesburg 71,1
City of Tshwane 75,5
Mpumalanga 97,2
Limpopo 98,8
South Africa 90,5
19.4 Data revisions
Stats SA revised the population model to produce mid-year population estimates during 2013 in the light of
the Census 2011 finding. The new data have been used to adjust the benchmarking for all previous
datasets. Weighting and benchmarking were also adjusted for the provincial boundaries that came into
effect in 2011. The data for the GHS 2002 to 2015 as presented in this release are therefore comparable.
As a result of statistical programs used for weighting, which discard records with unspecified values for the
benchmarking variables, namely age, sex and population group, it became necessary to impute missing
values for these variables. A combination of logical and hot-deck imputation methods were used to impute
the demographic variables of the whole series from 2002 to 2015.
Household estimates, developed using the UN headship ratio methodology, were used to calibrate
household files. The databases of Census 1996, Census 2001, Community Survey 2007 and Census 2011
were used to analyse trends and develop models to predict the number of households for each year. The
weighting system was based on tables for the expected distribution of household heads for specific age
categories, per population group and province.

Statistics South Africa P0318
General Household Survey, 2015
65
Missing values and unknown values were excluded from totals used as denominators for the calculation of
percentages, unless otherwise specified. Frequency values have been rounded off to the nearest
thousand. Population totals in all tables reflect the population and sub-populations as calculated with SAS
and rounded off. This will not always correspond exactly with the sum of the preceding rows because all
numbers are rounded off to the nearest thousand.
19.5 Limitations of the study
The questionnaires for the GHS series were revised extensively in 2009 and some questions might not be
exactly comparable to the data series before then. Please refer to Section 19.10 for more details about the
questions that are not comparable. Analysts and users of the data are also advised not to do a comparative
analysis over time before studying the questionnaires of the years concerned in detail, as there have also
been small modifications to options to a number of questions that are not highlighted in Section 19.10.
In addition to changes to the questions, the data collection period has also changed since 2002. Between
2002 and 2008 data were gathered during July. The data collection period was extended to 3 months (July
to September) between 2010 and 2012. As from 2013, the data collection period was extended to 12
months (January to December). Although the extension is not necessarily a limitation, it should be borne in
mind when using the data for comparative purposes.
19.6 Sample design
The General Household Survey (GHS) uses the Master Sample frame which has been developed as a
general-purpose household survey frame that can be used by all other Stats SA household-based surveys
having design requirements that are reasonably compatible with the GHS. The GHS 2015 collection was
based on the 2013 Master Sample. This Master Sample is based on information collected during the 2011
Census conducted by Stats SA. In preparation for Census 2011, the country was divided into 103 576
enumeration areas (EAs). The census EAs, together with the auxiliary information for the EAs, were used
as the frame units or building blocks for the formation of primary sampling units (PSUs) for the Master
Sample, since they covered the entire country and had other information that is crucial for stratification and
creation of PSUs. There are 3 324 primary sampling units (PSUs) in the Master Sample with an expected
sample of approximately 33 000 dwelling units (DUs). The number of PSUs in the current Master Sample
(3 324) reflect an 8,0% increase in the size of the Master Sample compared to the previous (2008) Master
Sample (which had 3 080 PSUs). The larger Master Sample of PSUs was selected to improve the precision
(smaller coefficients of variation, known as CVs) of the GHS estimates.
The Master Sample is designed to be representative at provincial level and within provinces at metro/non-
metro levels. Within the metros, the sample is further distributed by geographical type. The three
geography types are Urban, Tribal and Farms. This implies, for example, that within a metropolitan area,
the sample is representative of the different geography types that may exist within that metro.
The sample for the GHS is based on a stratified two-stage design with probability proportional to size (PPS)
sampling of PSUs in the first stage, and sampling of dwelling units (DUs) with systematic sampling in the
second stage.

Statistics South Africa P0318
General Household Survey, 2015
66
Table 19: Comparison between the 2007 (old) Master Sample and the new Master Sample (designed
in 2013)
2007 Master Sample (GHS 2008-2014)
2013 Master Sample (GHS 2015 onwards)
Design Two-stage stratified design Two-stage stratified design
Number of primary sampling units (PSUs)
3 080 PSUs 3 324 PSUs
Number of dwelling units (DUs)
Approximately 30 000 DUs Approximately 33 000 DUs
Stratification No stratification by geo-type within metros/non-metros
Stratification by geo-type within metros/non-metros
Geo-types 4 geo-types, namely urban formal, urban informal, tribal areas, and rural formal
3 geo-types, namely urban, traditional, and farms
Sample Sample representative at national, provincial and metro levels, but estimates only produced to provincial level
Sample representative at national, provincial and metro levels
Weights produced to publish estimates at metro level
There are a number of aspects in which the two Master Samples differ. The number of geo-types was
reduced from 4 to 3 while the new Master Sample allows for the publication of estimates at metro level.
Primary stratification occurred at provincial and metro/non-metro levels, for mining, and geography type,
while the secondary strata were created within the primary strata based on the demographic and socio-
economic characteristics of the population.
Figure 67: Distribution of primary sampling units by province, 2007 (old) Master Sample and the new Master Sample (designed in 2013)
148
192
244
244
300
440
348
536
872
180
264
268
288
324
364
384
464
544
-32
-72
-24
-44
-24
76
-36
72
328
0 200 400 600 800 1000
NC
FS
NW
MP
LP
EC
WC
KZN
GP
2007 2013 Change

Statistics South Africa P0318
General Household Survey, 2015
67
Given the change in the provincial distribution of the South African population between 2001 and 2011, the
Master Sample was accordingly adjusted. There was also an 8% increase in the sample size of the Master
Sample of PSUs to improve the precision of the GHS estimates. In particular, the sample sizes increased
most notably in Gauteng, Eastern Cape and KwaZulu-Natal.
19.7 Allocating sample sizes to strata2
The randomised PPS systematic sampling method is described below. This procedure was applied
independently within each design stratum.
Let be the total number of PSUs in the stratum, and the number of PSUs to be selected from the
stratum is denoted by . Also, let denote the size measure of the PSU within the stratum, where
Then, the method for selecting the sample of PSUs with the Randomised PPS
systematic sampling method can be described as follows:
Step 1: Randomise the PSUs within the stratum
The list of PSUs within the stratum can be randomised by generating uniform random between 0 and 1,
and then by sorting the PSUs in ascending or descending order of these random numbers. Once the
PSUs have been randomised, we can generate permanent sequence numbers for the PSUs.
Step 2: Define normalised measures of size for the PSUs
We denote by the measure of size (MOS) of PSU within the design stratum. Then, the measure of
size for the stratum is given by . We define the normalised size measure of PSU as
where is the total number of PSUs in the design stratum. Then, is
the relative size of the PSU in the stratum, and for all strata. It should be noted that the value
of , which is the selection probability of PSU must be less than one.
Step 3: Obtain inverse sampling rates (ISRs)
Let be the stratum inverse sampling rate (ISR). The stratum ISR is the same as the corresponding
provincial ISR because of the proportional allocation within the province. It should also be noted that the
proportional allocation within the province also results in a self-weighting design.
Then, the PSU inverse sampling rates (ISRs) are obtained as follows:
First, define N real numbers . It is easy to verify that .
Next, round the N real numbers to integer values such that each
2Source: Sample Selection and Rotation for the Redesigned South African Labour Force Survey by G. HussainChoudhry, 2007.
N
n ix i
....,,3,2,1 Ni n
N
N
ix i
N
i
ixX1 ip i
,,3,2,1; NiX
xp i
i N ip
i1
1
N
i
ip
ipn i
R
NiRpnZ ii ,,3,2,1; RnZ
N
i
i 1
NiZi ...,,3,2,1; NiRi ...,,3,2,1;

Statistics South Africa P0318
General Household Survey, 2015
68
is as close as possible to the corresponding value and the values add up to within the
stratum. In other words, the sum of the absolute differences between the and the corresponding
values is minimised subject to the constraint that the values add up to within the stratum. Drew,
Choudhry and Gray (1978) provide a simple algorithm to obtain the integer values as follows:
Let be the difference between the value and the sum , where is the integer
function, then values can be obtained by rounding up the values with the largest fraction parts,
and by rounding down the remaining of them. It should be noted that the integer sizes
are also the PSU inverse sampling rates (ISRs) for systematic sampling of dwelling
units.
Step 4: Obtain cumulative ISR values
We denote by the cumulative ISRs of the PSUs within the stratum. It should be noted
that the PSUs within the stratum have been sorted according to the sequence numbers that were assigned
after the randomisation. Then, the cumulative ISRs are defined as follows:
It should be noted that the value will be equal to , which is also the total number of systematic
samples of dwelling units that can be selected from the stratum.
Step 5: Generate an integer random number between and , and compute integers
as follows:
Step 6: Select PSUs out of the PSUs in the stratum with the labels (sequence numbers)
number such that:
iR iZ iR Rn
iR iZ
iR Rn
iR
""d Rn
N
i
iZS1
.
iR ""d iZ
dN
NiRi ...,,3,2,1;
NiCi ...,,3,2,1;
.,,3,2;
,
1
11
NjRCC
RC
jjj
NC Rn
r 1 R n
nrrr ,,, 21
.
.
.
.
.
1
1
23
12
1
Rrr
Rrr
Rrr
Rrr
rr
nn
ii
n N
niii .,..,, 21

Statistics South Africa P0318
General Household Survey, 2015
69
Then, the PSUs with the labels would get selected with probabilities proportional to size, and
the selection probability of the PSU will be given by .
19.8 Weighting 3
The sample weights were constructed in order to account for the following: the original selection
probabilities (design weights), adjustments for PSUs that were sub-sampled or segmented, excluded
population from the sampling frame, non-response, weight trimming, and benchmarking to known
population estimates from the Demographic Analysis Division within Stats SA.
The sampling weights for the data collected from the sampled households were constructed so that the
responses could be properly expanded to represent the entire civilian population of South Africa. The
design weights, which are the inverse sampling rate (ISR) for the province, are assigned to each of the
households in a province.
Mid-year population estimates produced by the Demographic Analysis Division were used for
benchmarking. The final survey weights were constructed using regression estimation to calibrate to
national level population estimates cross-classified by 5-year age groups, gender and race, and provincial
population estimates by broad age groups. The 5-year age groups are: 0–4, 5–9, 10–14, 55–59, 60–64;
and 65 and over. The provincial level age groups are 0–14, 15–34, 35–64; and 65 years and over. The
calibrated weights were constructed such that all persons in a household would have the same final weight.
The Statistics Canada software StatMx was used for constructing calibration weights. The population
controls at national and provincial level were used for the cells defined by cross-classification of Age by
Gender by Race. Records for which the age, population group or sex had item non-response could not be
weighted and were therefore excluded from the dataset. No additional imputation was done to retain these
records.
Household estimates that were developed using the UN headship ratio methodology were used to weight
household files. The databases of Census 1996, Census 2001, Community Survey 2007 Census 2011
were used to analyse trends and develop models to predict the number of households for each year. The
weighting system was based on tables for the expected distribution of household heads for specific age
categories, per population group and province.
19.9 Sampling and the interpretation of the data
Caution must be exercised when interpreting the results of the GHS at low levels of disaggregation. The
sample and reporting are based on the provincial boundaries as defined in 2011. These new boundaries
resulted in minor changes to the boundaries of some provinces, especially Gauteng, North West,
Mpumalanga, Limpopo and Eastern and Western Cape. In previous reports the sample was based on the
provincial boundaries as defined in 2006, and there will therefore be slight comparative differences in terms
of provincial boundary definitions.
3 Source: Sampling and Weighting System for the Redesigned South African Labour Force Survey, by G. HussainChoudhry, 2007.
.
.
.
1
21
11
22
11
nn ini
ii
ii
CrC
CrC
CrC
n niii .,..,, 21
i RRi
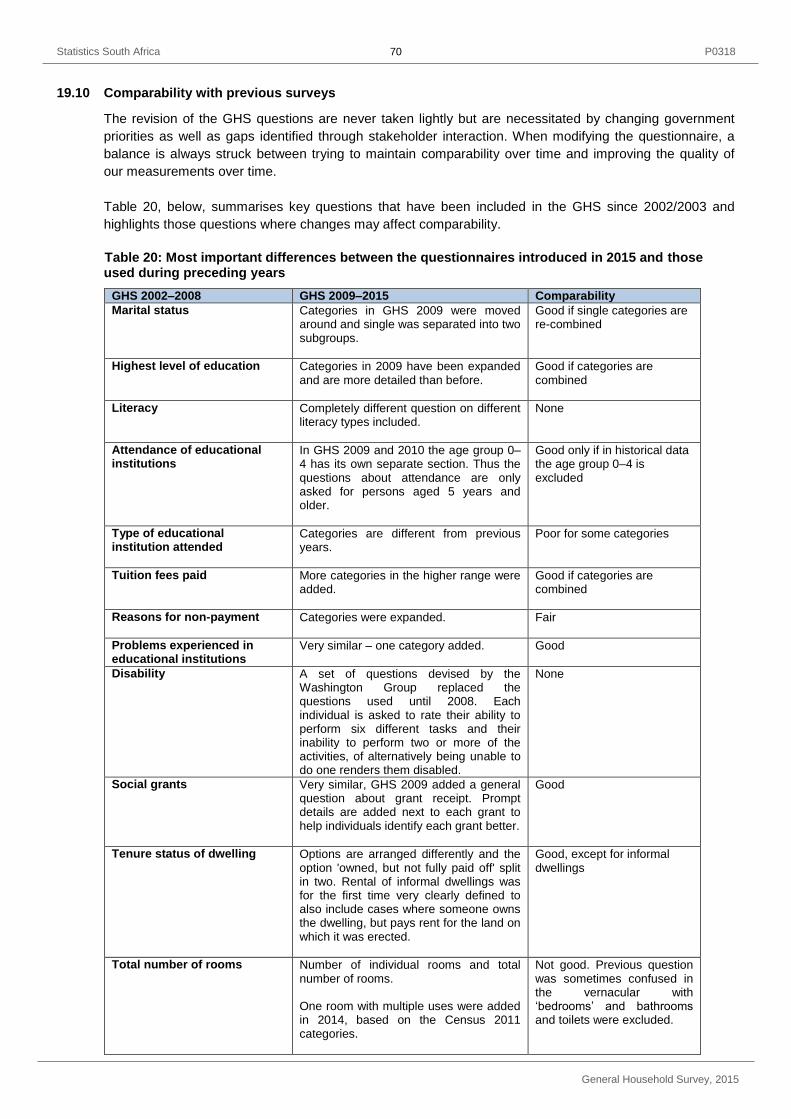
Statistics South Africa P0318
General Household Survey, 2015
70
19.10 Comparability with previous surveys
The revision of the GHS questions are never taken lightly but are necessitated by changing government
priorities as well as gaps identified through stakeholder interaction. When modifying the questionnaire, a
balance is always struck between trying to maintain comparability over time and improving the quality of
our measurements over time.
Table 20, below, summarises key questions that have been included in the GHS since 2002/2003 and
highlights those questions where changes may affect comparability.
Table 20: Most important differences between the questionnaires introduced in 2015 and those used during preceding years
GHS 2002–2008 GHS 2009–2015 Comparability
Marital status Categories in GHS 2009 were moved around and single was separated into two subgroups.
Good if single categories are re-combined
Highest level of education Categories in 2009 have been expanded and are more detailed than before.
Good if categories are combined
Literacy Completely different question on different literacy types included.
None
Attendance of educational institutions
In GHS 2009 and 2010 the age group 0–4 has its own separate section. Thus the questions about attendance are only asked for persons aged 5 years and older.
Good only if in historical data the age group 0–4 is excluded
Type of educational institution attended
Categories are different from previous years.
Poor for some categories
Tuition fees paid More categories in the higher range were added.
Good if categories are combined
Reasons for non-payment Categories were expanded.
Fair
Problems experienced in educational institutions
Very similar – one category added. Good
Disability A set of questions devised by the Washington Group replaced the questions used until 2008. Each individual is asked to rate their ability to perform six different tasks and their inability to perform two or more of the activities, of alternatively being unable to do one renders them disabled.
None
Social grants Very similar, GHS 2009 added a general question about grant receipt. Prompt details are added next to each grant to help individuals identify each grant better.
Good
Tenure status of dwelling Options are arranged differently and the option 'owned, but not fully paid off' split in two. Rental of informal dwellings was for the first time very clearly defined to also include cases where someone owns the dwelling, but pays rent for the land on which it was erected.
Good, except for informal dwellings
Total number of rooms Number of individual rooms and total number of rooms. One room with multiple uses were added in 2014, based on the Census 2011 categories.
Not good. Previous question was sometimes confused in the vernacular with ‘bedrooms’ and bathrooms and toilets were excluded.

Statistics South Africa P0318
General Household Survey, 2015
71
Table 20: Most important differences between the questionnaires introduced in 2015 and those used during preceding years (concluded)
GHS 2002–2008 GHS 2009–2015 Comparability
Use of pesticides/herbicides The options not applicable were added for households who do not have yards.
Fair provided that some editing can be done
Cellular phone Before 2009 the question was whether someone has access to a cellular phone; in 2009 the question asks whether it is available within the household.
None
Assessment of the quality of health services
Before 2009, the question was asked of individuals who were sick and who used a specific service. However, because of proxy respondents it was difficult to get an accurate assessment of levels of satisfaction with the service. In 2009 the question very specifically relates to the respondents' own experience during their most recent visit.
Not comparable
Agricultural production The question before was general and did not specifically prod the interviewer to include small-scale activities such as backyard food gardening etc. In 2009 all activities that relate to food production have to be included.
Not comparable
Sources of income Income from a business was never listed as a separate source of income and was often not recorded, or recorded under 'Other'. In 2009 this option was added to the list.
Fair
Monthly household expenditure
In 2009 the response categories were broken down into finer categories than before.
Good if categories are re-combined
19.11 Editing and imputation
Historically the GHS used a conservative and hands-off approach to editing. Manual editing, and little if any
imputation was done. The focus of the editing process was on clearing skip violations and ensuring that
each variable only contains valid values. Very few limits to valid values were set, and data were largely
released as they were received from the field.
With GHS 2009, Stats SA introduced an automated editing and imputation system that was continued for
GHSs 2010–2015. The challenge was to remain true, as much as possible, to the conservative approach
used prior to GHS 2009, and yet, at the same time, to develop a standard set of rules to be used during
editing which could be applied consistently across time. When testing for skip violations and doing
automated editing, the following general rules are applied in cases where one question follows the filter
question and the skip is violated:
If the filter question had a missing value, the filter is allocated the value that corresponds with the
subsequent question which had a valid value.
If the values of the filter question and subsequent question are inconsistent, the filter question’s value
is set to missing and imputed using either the hot-deck or nearest neighbour imputation techniques.
The imputed value is then once again tested against the skip rule. If the skip rule remains violated, the
question subsequent to the filter question is dealt with by either setting it to missing and imputing or, if
that fails, printing a message of edit failure for further investigation, decision-making and manual
editing.
Statistics South Africa P0318
General Household Survey, 2015
72
In cases where skip violations take place for questions where multiple questions follow the filter question,
the rules used are as follows:
If the filter question has a missing value, the filter is allocated the value that corresponds with the
value expected given the completion of the remainder of the question set.
If the filter question and the values of subsequent questions values were inconsistent, a counter is set
to see what proportion of the subsequent questions have been completed. If more than 50% of the
subsequent questions have been completed, the filter question’s value is modified to correspond with
the fact that the rest of the questions in the set were completed. If less than 50% of the subsequent
questions in the set were completed, the value of the filter question is set to missing and imputed
using either the hot-deck or nearest neighbour imputation techniques. The imputed value is then once
again tested against the skip rule. If the skip rule remains violated the questions in the set that follows
the filter question are set to missing.
When dealing with internal inconsistencies, as much as possible was done using logical imputation, i.e.
information from other questions is compared with the inconsistent information. If other evidence is found to
back up either of the two inconsistent viewpoints, the inconsistency is resolved accordingly. If the internal
consistency remains, the question subsequent to the filter question is dealt with by either setting it to
missing and imputing its value or printing a message of edit failure for further investigation, decision-making
and manual editing.
Two imputation techniques were used for imputing missing values: hot deck and nearest neighbour. In both
cases the already published code was used for imputation. The variable composition of hot decks is based
on a combination of the variables used for the Census (where appropriate), an analysis of odds ratios and
logistic regression models. Generally, as in the QLFS system, the GHS adds geographic variables such as
province, geography type, metro/non-metro, population group, etc. to further refine the decks. This was not
done for Census 2001 and it is assumed that the reason for this is the differences in deck size and position
for sample surveys as opposed to a multi-million record database.
The ‘No’ imputations assume that if the ‘Yes’/‘No’ question had to be completed and there is a missing
value next to any of the options, the response should have been ‘No’. Missing values are therefore
converted to the code for ‘No’, namely ‘2’. This is only done if there is some evidence that the questions
have been completed. Otherwise all remain missing. For questions for which each option represents a
question, no ‘No’ imputations were made.
19.12 Definitions of terms
A household is a group of persons who live together and provide themselves jointly with food and/or other
essentials for living, or a single person who lives alone.
Note: The persons basically occupy a common dwelling unit (or part of it) for at least four nights in
a week on average during the past four weeks prior to the survey interview, sharing resources as a
unit. Other explanatory phrases can be 'eating from the same pot' and 'cook and eat together'.
Persons who occupy the same dwelling unit but do not share food or other essentials, are regarded
as separate households. For example, people who share a dwelling unit, but buy food separately,
and generally provide for themselves separately, are regarded as separate households within the
same dwelling unit.
Conversely, a household may occupy more than one structure. If persons on a plot, stand or yard
eat together, but sleep in separate structures (e.g. a room at the back of the house for single young
male members of a family), all these persons should be regarded as one household.

Statistics South Africa P0318
General Household Survey, 2015
73
Multiple households occur when two or more households live in the same dwelling unit.
Note: If there are two or more households in the selected dwelling unit and they do not share
resources, all households are to be interviewed. The whole dwelling unit has been given one
chance of selection and all households located there were interviewed using separate
questionnaires.
Household head is the main decision-maker, or the person who owns or rents the dwelling, or the person
who is the main breadwinner.
Acting household head is any member of the household acting on behalf of the head of the household.
Formal dwelling refers to a structure built according to approved plans, i.e. house on a separate stand, flat
or apartment, townhouse, room in backyard, rooms or flatlet elsewhere.
Contrasted with informal dwelling and traditional dwelling.
Informal dwelling is a makeshift structure not erected according to approved architectural plans, for
example shacks or shanties in informal settlements or in backyards
Piped water in dwelling or onsite is piped water inside the household’s own dwelling or in their yard. It
excludes water from a neighbour’s tap or a public tap that is not on site.
Electricity for cooking, heating and/or lighting refers to electricity from the public supplier.
Free basic water is an amount of water determined by government that should be provided free to poor
households to meet basic needs, currently set at 6 kℓ per month per household within 200 metres from
each dwelling.
Hygienic toilet facility refers to flush toilet, chemical toilet or pit latrine with ventilation pipe.
Indigent households are households that qualify to receive some or all basic services for free because
they have no income or low income.
19.13 Classifications
UN disability
Concentrating and remembering are grouped together as one category. If an individual has ‘Some difficulty’
with two or more of the six categories, then they are disabled. If an individual has ‘A lot of difficulty’ or is
‘Unable to do’ for one or more category they are classified as disabled.
Severe disability
If an individual has ‘A lot of difficulty’ or is ‘Unable to do’ for one or more category they are classified as
severely disabled.
Water of RDP standard or higher
'Piped water in dwelling or in yard', and 'Water from a neighbour’s tap or public/communal tap' are also
included provided that the distance to the water source is less than 200 metres.

Statistics South Africa P0318
General Household Survey, 2015
74
1. Population
1.1 By province, population group and sex, 2015
Province
Thousands
Black African Coloured Indian/Asian White Total
Male Female Total Male Female Total Male Female Total Male Female Total Male Female Total
Western Cape 975 992 1 967 1 566 1 652 3 217 20 20 39 478 544 1 022 3 038 3 207 6 246
Eastern Cape 2 811 3 133 5 944 227 261 488 12 11 23 119 118 237 3 169 3 523 6 693
Northern Cape 303 335 638 217 238 455 2 * 2 41 46 87 563 619 1 182
Free State 1 175 1 244 2 419 38 37 75 4 2 6 118 145 263 1 335 1 428 2 763
KwaZulu-Natal 4 551 4 948 9 499 56 58 113 381 398 779 155 142 297 5 142 5 546 10 688
North West 1 694 1 711 3 406 27 33 60 20 15 34 98 104 203 1 840 1 863 3 703
Gauteng 5 261 5 047 10 308 204 204 408 217 211 429 1 042 1 081 2 123 6 725 6 543 13 268
Mpumalanga 1 929 2 025 3 955 7 5 12 10 4 14 124 132 256 2 070 2 166 4 236
Limpopo 2 627 2 881 5 509 11 22 33 24 15 38 40 35 74 2 701 2 953 5 654
South Africa 21 327 22 318 43 645 2 352 2 509 4 861 690 676 1 366 2 215 2 346 4 561 26 584 27 849 54 432
Due to rounding, numbers do not necessarily add up to totals. Values based on three or less unweighted cases are considered too small to provide accurate estimates, and values are therefore replaced by asterisks.

Statistics South Africa P0318
General Household Survey, 2015
75
1. Population
1.2 By age group, population group and sex, 2015
Age group
Thousands
Black African Coloured Indian/Asian White Total
Male Female Total Male Female Total Male Female Total Male Female Total Male Female Total
00-04 2 231 2 193 4 424 210 207 418 51 50 101 132 127 259 2 625 2 577 5 202
05-09 2 213 2 194 4 407 213 211 424 49 48 98 136 131 268 2 612 2 585 5 197
10-14 2 124 2 122 4 245 221 220 441 46 46 92 140 135 276 2 532 2 522 5 054
15-19 2 143 2 145 4 288 227 225 451 50 50 100 153 147 300 2 572 2 567 5 139
20-24 2 166 2 137 4 303 217 216 433 55 54 109 157 152 309 2 595 2 559 5 154
25-29 2 107 2 000 4 107 195 194 390 62 57 118 146 142 289 2 511 2 393 4 904
30-34 1 919 1 892 3 811 176 187 363 66 58 124 141 142 283 2 303 2 279 4 582
35-39 1 662 1 580 3 242 180 194 374 63 55 118 140 143 282 2 044 1 972 4 016
40-44 1 375 1 461 2 836 176 195 371 54 49 104 145 148 293 1 750 1 853 3 603
45-49 940 1 067 2 006 146 165 311 48 45 93 171 172 343 1 304 1 449 2 753
50-54 773 930 1 703 125 144 269 41 41 82 170 172 342 1 108 1 287 2 395
55-59 609 760 1 369 97 116 213 34 36 70 165 173 338 905 1 086 1 990
60-64 431 553 984 68 87 155 27 31 59 144 155 299 670 826 1 496
65-69 292 527 819 46 60 106 19 23 42 109 140 249 466 751 1 216
70-74 173 369 543 28 39 67 12 16 28 80 110 190 294 534 828
75+ 170 387 557 26 47 74 11 18 29 87 155 241 294 607 902
Total 21 327 22 318 43 645 2 352 2 509 4 861 690 676 1 366 2 215 2 346 4 561 26 584 27 849 54 432
Due to rounding, numbers do not necessarily add up to totals. Values based on three or less unweighted cases are considered too small to provide accurate estimates, and values are therefore replaced by asterisks.

Statistics South Africa P0318
General Household Survey, 2015
76
2. Education
2.1 Population aged 20 years and older, by highest level of education and province, 2015
Highest level of education
Thousands
Western Cape
Eastern Cape
Northern Cape
Free State
KwaZulu-Natal
North West Gauteng Mpumalanga Limpopo South Africa
None 61 229 58 60 411 162 209 208 312 1 711
Grade R/0 5 12 3 5 13 4 13 3 3 61
Grade 1/Sub A/Class 1 15 32 8 16 53 19 30 18 27 218
Grade 2/Sub B/Class 2 15 51 7 20 86 25 47 22 28 301
Grade 3/Standard 1/AET 1(KhaRiGude, Sanli) 32 74 15 31 123 41 52 34 55 457
Grade 4/Standard 2 73 108 18 52 153 67 100 51 73 695
Grade 5/Standard 3/AET 2 78 113 18 43 143 77 131 43 69 716
Grade 6/Standard 4 106 196 33 56 178 87 175 87 112 1 030
Grade 7/Standard 5/AET 3 227 239 46 89 267 128 304 127 172 1 600
Grade 8/Standard 6/Form 1 284 299 62 123 339 164 432 112 194 2 008
Grade 9/Standard 7/Form 2/AET 4 309 360 65 154 354 172 390 155 287 2 246
Grade 10/Standard 8/Form 3 506 444 90 226 629 295 954 279 403 3 826
Grade 11/Standard 9/Form 4 382 456 56 179 844 225 1 093 333 431 3 999
Grade 12/Standard 10/Form 5/Matric (No Exemption) 1 050 649 153 474 1 799 483 2 746 581 593 8 529
Grade 12/Standard 10/Form 5/Matric (Exemption *) 170 39 21 28 70 33 227 59 33 681
NTC 1/N1/NC (V) Level 2 1 2 * 4 3 * 12 3 14 39
NTC 2/N2/NC (V) Level 3 6 8 2 3 12 7 25 13 10 87
NTC 3/N3/NC (V)/Level 4 22 11 3 6 16 11 37 21 20 146
N4/NTC 4 10 4 2 2 17 13 34 15 13 110
N5/NTC 5 9 7 1 6 6 8 26 13 8 85
N6/NTC 6 10 7 3 6 9 10 57 15 10 127
Certificate with less than Grade 12/Std 10 10 10 2 6 6 3 23 9 15 83
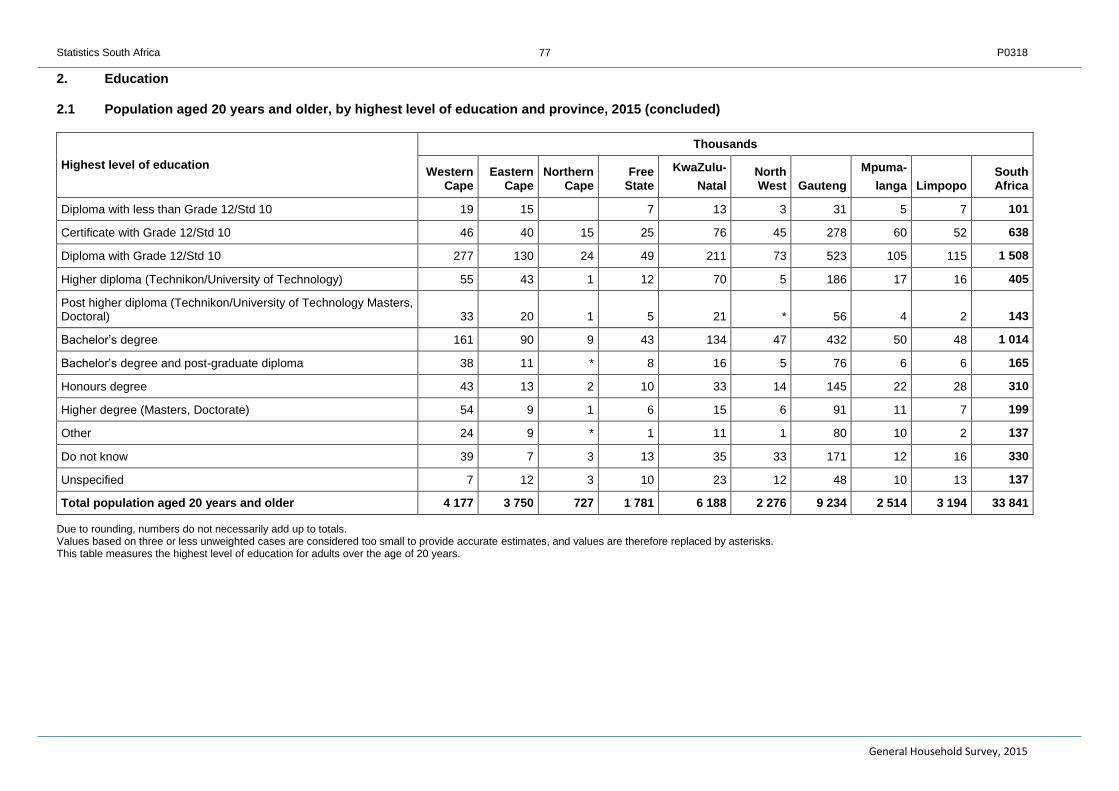
Statistics South Africa P0318
General Household Survey, 2015
77
2. Education 2.1 Population aged 20 years and older, by highest level of education and province, 2015 (concluded)
Highest level of education
Thousands
Western Cape
Eastern Cape
Northern Cape
Free State
KwaZulu-
Natal North West Gauteng
Mpuma-
langa Limpopo South Africa
Diploma with less than Grade 12/Std 10 19 15 7 13 3 31 5 7 101
Certificate with Grade 12/Std 10 46 40 15 25 76 45 278 60 52 638
Diploma with Grade 12/Std 10 277 130 24 49 211 73 523 105 115 1 508
Higher diploma (Technikon/University of Technology) 55 43 1 12 70 5 186 17 16 405
Post higher diploma (Technikon/University of Technology Masters, Doctoral) 33 20 1 5 21 * 56 4 2 143
Bachelor’s degree 161 90 9 43 134 47 432 50 48 1 014
Bachelor’s degree and post-graduate diploma 38 11 * 8 16 5 76 6 6 165
Honours degree 43 13 2 10 33 14 145 22 28 310
Higher degree (Masters, Doctorate) 54 9 1 6 15 6 91 11 7 199
Other 24 9 * 1 11 1 80 10 2 137
Do not know 39 7 3 13 35 33 171 12 16 330
Unspecified 7 12 3 10 23 12 48 10 13 137
Total population aged 20 years and older 4 177 3 750 727 1 781 6 188 2 276 9 234 2 514 3 194 33 841
Due to rounding, numbers do not necessarily add up to totals. Values based on three or less unweighted cases are considered too small to provide accurate estimates, and values are therefore replaced by asterisks. This table measures the highest level of education for adults over the age of 20 years.

Statistics South Africa P0318
General Household Survey, 2015
78
2. Education
2.2 Population aged 20 years and older, by highest level of education, population group and sex, 2015
Highest level of education
Thousands
Black African Coloured Indian/Asian White Total
Male Female Total Male Female Total Male Female Total Male Female Total Male Female Total
None 582 1 023 1 605 44 35 79 4 9 13 6 8 14 635 1 076 1 711
Grade R/0 25 26 51 4 3 8 2 * 2 * * * 31 30 61
Grade 1/Sub A/Class 1 96 106 201 8 5 13 1 * 1 * 3 3 105 113 218
Grade 2/Sub B/Class 2 123 160 282 6 8 14 * 2 2 * 2 2 129 173 301
Grade 3/Standard 1/AET 1(KhaRiGude, Sanli) 197 211 408 20 20 41 1 3 4 1 3 4 220 237 457
Grade 4/Standard 2 277 335 613 31 37 67 3 5 8 1 5 6 313 382 695
Grade 5/Standard 3/AET 2 312 303 615 41 46 86 4 5 8 2 5 7 358 358 716
Grade 6/Standard 4 429 468 897 52 59 111 2 11 13 2 6 8 485 545 1 030
Grade 7/Standard 5/AET 3 636 696 1 332 89 143 232 12 8 20 5 11 16 742 858 1 600
Grade 8/Standard 6/Form 1 776 853 1 629 118 159 277 18 28 46 26 30 56 939 1 070 2 008
Grade 9/Standard 7/Form 2/AET 4 971 919 1 890 136 153 289 13 8 21 25 21 46 1 145 1 101 2 246
Grade 10/Standard 8/Form 3 1 527 1 452 2 978 212 219 432 46 40 85 140 191 330 1 925 1 901 3 826
Grade 11/Standard 9/Form 4 1 690 1 929 3 619 116 131 247 28 23 50 40 43 83 1 873 2 126 3 999
Grade 12/Standard 10/Form 5/Matric (No Exemption) 3 120 3 124 6 244 359 403 762 196 179 376 513 633 1 147 4 189 4 340 8 529
Grade 12/Standard 10/Form 5/Matric (Exemption *) 192 186 379 41 39 80 17 31 47 79 97 176 329 353 681
NTC 1/N1/NC (V) Level 2 13 20 33 * 1 1 2 * 2 3 1 4 17 22 39
NTC 2/N2/NC (V) Level 3 31 34 66 2 1 3 3 * 3 13 3 16 49 38 87
NTC 3/N3/NC (V)/Level 4 51 49 100 6 3 9 2 * 2 32 3 35 90 56 146
N4/NTC 4 52 29 80 3 * 3 1 2 3 15 8 23 71 39 110
N5/NTC 5 31 33 65 3 3 7 1 1 2 12 * 12 47 38 85
N6/NTC 6 40 42 82 4 1 5 4 1 5 29 6 36 76 50 127
Certificate with less than Grade 12/Std 10 36 29 65 4 2 6 * * * 4 8 12 43 39 83

Statistics South Africa P0318
General Household Survey, 2015
79
2. Education
2.2 Population aged 20 years and older, by highest level of education, population group and sex, 2015 (concluded)
Highest level of education
Thousands
Black African Coloured Indian/Asian White Total
Male Female Total Male Female Total Male Female Total Male Female Total Male Female Total
Diploma with less than Grade 12/Std 10 25 35 59 4 5 10 1 6 7 8 17 25 39 63 101
Certificate with Grade 12/Std 10 220 287 507 13 25 38 5 9 14 38 40 79 277 361 638
Diploma with Grade 12/Std 10 391 531 922 71 65 135 30 33 63 187 200 387 679 829 1 508
Higher diploma (Technikon/University of Technology) 97 129 226 12 16 28 14 12 26 62 62 124 185 220 405
Post higher diploma (Technikon/University of Technology Masters, Doctoral) 28 36 63 3 8 11 7 4 11 26 31 57 64 79 143
Bachelor’s degree 250 272 522 30 24 53 41 28 69 180 190 370 500 514 1 014
Bachelor’s degree and post-graduate diploma 40 33 73 8 7 15 6 7 14 34 29 63 88 77 165
Honours degree 73 74 147 4 5 10 10 11 21 70 63 133 157 153 310
Higher degree (Masters, Doctorate) 24 30 54 4 5 8 8 9 16 75 46 121 110 89 199
Other 54 38 92 6 1 7 8 3 11 11 16 27 79 58 137
Do not know 155 116 271 22 11 33 4 3 7 5 13 18 186 143 330
Unspecified 53 55 107 5 3 8 * 3 3 10 9 19 68 69 137
Total population aged 20 years and older 12 616 13 664 26 280 1 480 1 646 3 127 493 482 975 1 654 1 804 3 459 16 243 17 597 33 841
Due to rounding, numbers do not necessarily add up to totals. Values based on three or less unweighted cases are considered too small to provide accurate estimates, and values are therefore replaced by asterisks.

Statistics South Africa P0318
General Household Survey, 2015
80
2. Education
2.3 Population aged 20 years and older, by highest level of education, age group and sex, 2015
Highest level of education
Thousands
20–24 25–34 35–44 45+ Total
Male Female Total Male Female Total Male Female Total Male Female Total Male Female Total
None 12 12 24 51 46 98 73 86 158 499 931 1 431 635 1 076 1 711
Grade R/0 4 4 8 6 8 14 4 7 11 17 11 27 31 30 61
Grade 1/Sub A/Class 1 7 5 12 15 8 24 24 18 42 59 82 141 105 113 218
Grade 2/Sub B/Class 2 6 4 10 17 12 29 23 24 47 84 131 215 129 173 301
Grade 3/Standard 1/AET 1(KhaRiGude, Sanli) 19 5 24 46 13 59 35 31 65 120 188 309 220 237 457
Grade 4/Standard 2 22 14 36 47 28 74 61 42 103 183 299 482 313 382 695
Grade 5/Standard 3/AET 2 24 15 39 65 40 105 73 56 128 197 247 444 358 358 716
Grade 6/Standard 4 51 28 79 106 66 172 95 88 183 233 362 595 485 545 1 030
Grade 7/Standard 5/AET 3 84 51 135 190 129 318 146 159 305 321 520 841 742 858 1 600
Grade 8/Standard 6/Form 1 129 87 216 209 197 406 175 199 374 426 586 1 012 939 1 070 2 008
Grade 9/Standard 7/Form 2/AET 4 290 214 504 359 340 700 228 243 471 267 303 570 1 145 1 101 2 246
Grade 10/Standard 8/Form 3 363 310 672 645 570 1 215 423 419 842 493 602 1 096 1 925 1 901 3 826
Grade 11/Standard 9/Form 4 418 452 870 705 816 1 521 505 532 1 037 244 327 571 1 873 2 126 3 999
Grade 12/Standard 10/Form 5/Matric (No Exemption) 793 932 1 724 1 470 1 434 2 904 1 101 1 077 2 178 826 897 1 722 4 189 4 340 8 529
Grade 12/Standard 10/Form 5/Matric (Exemption *) 108 127 234 96 96 191 59 61 120 67 69 136 329 353 681
NTC 1/N1/NC (V) Level 2 9 10 19 5 7 12 2 2 4 2 3 5 17 22 39
NTC 2/N2/NC (V) Level 3 10 14 24 14 13 27 15 7 23 10 3 13 49 38 87
NTC 3/N3/NC (V)/Level 4 15 10 25 22 21 43 19 16 35 34 9 43 90 56 146
N4/NTC 4 14 11 26 28 12 40 16 10 26 12 6 18 71 39 110
N5/NTC 5 10 8 18 18 16 34 13 11 23 7 3 9 47 38 85
N6/NTC 6 8 8 16 21 21 42 22 17 39 26 4 30 76 50 127
Certificate with less than Grade 12/Std 10 3 5 8 19 16 35 11 7 18 10 12 22 43 39 83

Statistics South Africa P0318
General Household Survey, 2015
81
2. Education
2.3 Population aged 20 years and older, by highest level of education, age group and sex, 2015 (concluded)
Highest level of education
Thousands
20–24 25–34 35–44 45+ Total
Male Female Total Male Female Total Male Female Total Male Female Total Male Female Total
Diploma with less than Grade 12/Std 10 2 3 4 16 16 33 6 15 21 14 29 43 39 63 101
Certificate with Grade 12/Std 10 40 47 88 103 145 248 76 98 174 57 71 128 277 361 638
Diploma with Grade 12/Std 10 54 79 133 194 231 425 197 235 432 235 283 518 679 829 1 508
Higher diploma (Technikon/University of Technology) 8 15 23 42 53 95 57 71 129 78 81 159 185 220 405
Post higher diploma (Technikon/University of Technology Masters, Doctoral) 1 5 7 24 19 43 15 22 37 24 32 56 64 79 143
Bachelor’s degree 40 49 89 129 148 277 135 136 272 196 180 376 500 514 1 014
Bachelor’s degree and post-graduate diploma 6 5 12 31 24 55 17 19 36 34 29 63 88 77 165
Honours degree 9 4 13 29 50 79 46 42 88 73 57 130 157 153 310
Higher degree (Masters, Doctorate) 2 2 4 13 30 43 33 22 56 62 35 98 110 89 199
Other 17 9 26 30 16 46 20 11 31 12 22 34 79 58 137
Do not know 7 4 11 31 17 48 51 29 80 97 94 191 186 143 330
Unspecified 12 11 24 17 14 31 18 11 29 21 32 54 68 69 137
Total population aged 20 years and older 2 595 2 559 5 154 4 813 4 673 9 486 3 794 3 825 7 620 5 040 6 541 11 581 16 243 17 597 33 841
Due to rounding, numbers do not necessarily add up to totals. Values based on three or less unweighted cases are considered too small to provide accurate estimates, and values are therefore replaced by asterisks.

Statistics South Africa P0318
General Household Survey, 2015
82
2. Education
2.4 Population aged 15 years and older with a level of education lower than Grade 7, by literacy skills and province, 2015
Literacy skills
Thousands
Western Cape
Eastern Cape
Northern Cape Free State
KwaZulu-Natal North West Gauteng Mpumalanga Limpopo
South Africa
Writing his/her name
No difficulty 354 651 126 235 903 361 669 340 439 4 077
Some difficulty 9 24 3 6 27 27 26 20 37 179
A lot of difficulty 3 20 3 7 59 12 16 27 80 226
Unable to do 41 219 42 50 241 116 71 104 166 1 050
Total 407 914 173 298 1 230 515 783 490 722 5 533
Reading
No difficulty 294 515 80 190 731 257 519 228 326 3 140
Some difficulty 40 71 14 22 92 38 88 43 73 481
A lot of difficulty 19 56 16 20 104 28 55 64 119 481
Unable to do 54 273 63 68 303 187 122 157 205 1 431
Total 407 915 173 299 1 231 510 784 492 723 5 535
Filling in a form
No difficulty 243 328 54 139 442 182 417 146 209 2 161
Some difficulty 55 111 11 25 102 39 95 56 80 573
A lot of difficulty 37 99 13 21 178 43 88 84 166 728
Unable to do 73 379 96 115 509 244 184 206 268 2 073
Total 407 917 173 299 1 232 506 784 492 723 5 535
Writing a letter
No difficulty 271 496 77 186 690 246 514 216 320 3 016
Some difficulty 44 76 9 21 93 29 65 43 70 451
A lot of difficulty 28 55 17 17 105 31 63 50 120 488
Unable to do 63 288 71 75 344 203 141 182 213 1 580
Total 407 916 173 299 1 232 509 784 491 723 5 534
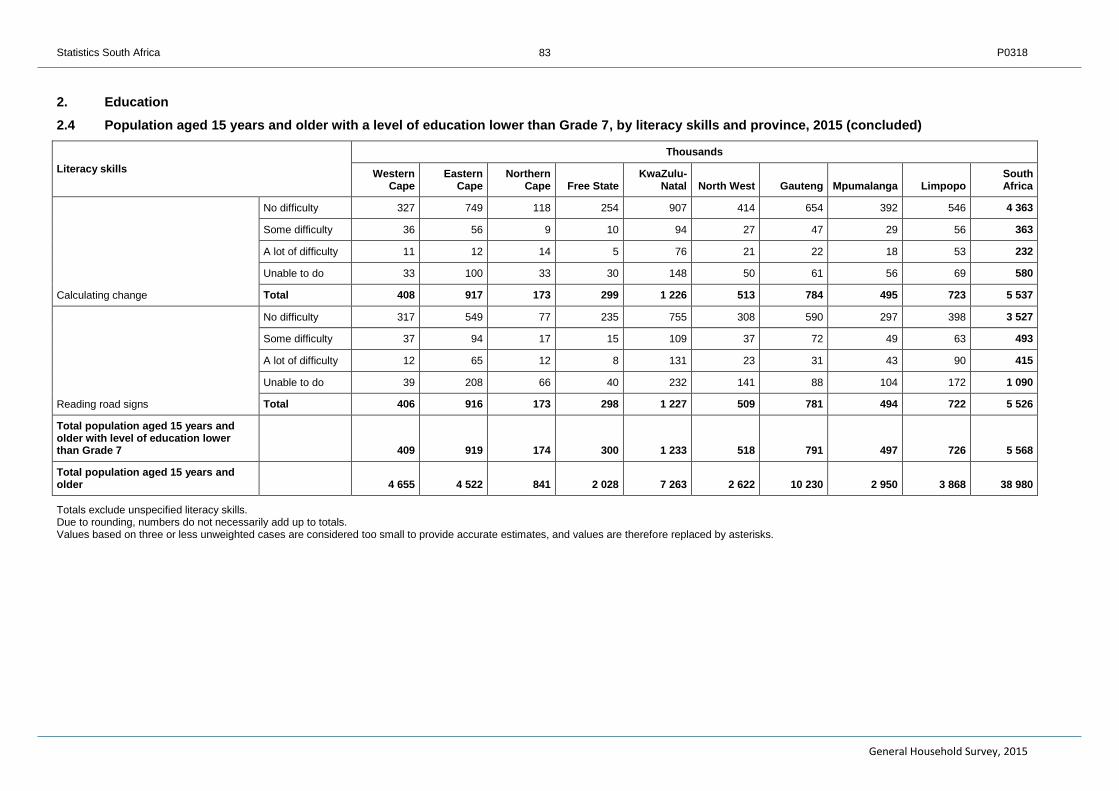
Statistics South Africa P0318
General Household Survey, 2015
83
2. Education
2.4 Population aged 15 years and older with a level of education lower than Grade 7, by literacy skills and province, 2015 (concluded)
Literacy skills
Thousands
Western Cape
Eastern Cape
Northern Cape Free State
KwaZulu-Natal North West Gauteng Mpumalanga Limpopo
South Africa
Calculating change
No difficulty 327 749 118 254 907 414 654 392 546 4 363
Some difficulty 36 56 9 10 94 27 47 29 56 363
A lot of difficulty 11 12 14 5 76 21 22 18 53 232
Unable to do 33 100 33 30 148 50 61 56 69 580
Total 408 917 173 299 1 226 513 784 495 723 5 537
Reading road signs
No difficulty 317 549 77 235 755 308 590 297 398 3 527
Some difficulty 37 94 17 15 109 37 72 49 63 493
A lot of difficulty 12 65 12 8 131 23 31 43 90 415
Unable to do 39 208 66 40 232 141 88 104 172 1 090
Total 406 916 173 298 1 227 509 781 494 722 5 526
Total population aged 15 years and older with level of education lower than Grade 7 409 919 174 300 1 233 518 791 497 726 5 568
Total population aged 15 years and older 4 655 4 522 841 2 028 7 263 2 622 10 230 2 950 3 868 38 980
Totals exclude unspecified literacy skills. Due to rounding, numbers do not necessarily add up to totals. Values based on three or less unweighted cases are considered too small to provide accurate estimates, and values are therefore replaced by asterisks.

Statistics South Africa P0318
General Household Survey, 2015
84
2. Education
2.5 Population aged 15 years and older with a level of education lower than Grade 7, who have some, a lot of difficulty or are unable to do basic literacy activities by sex and province, 2015
Literacy skills
Thousands
Western Cape
Eastern Cape
KwaZulu-Natal
Northern Cape
Free State
North West Gauteng
Mpuma-langa Limpopo
South Africa
Writing his/her name
Male 74 191 44 44 194 134 118 106 119 1 024
Female 61 229 53 69 348 129 151 170 284 1 494
Total 136 420 97 113 542 263 269 275 403 2 518
Reading
Male 64 174 42 41 178 130 118 98 116 962
Female 50 226 51 68 322 123 147 165 281 1 432
Total 114 400 93 109 500 254 265 263 397 2 394
Filling in a form
Male 89 274 56 66 303 167 169 147 169 1 441
Female 75 314 63 94 486 158 198 199 346 1 933
Total 164 588 119 160 790 325 367 346 514 3 374
Writing a letter
Male 74 191 44 44 194 134 118 106 119 1 024
Female 61 229 53 69 348 129 151 170 284 1 494
Total 136 420 97 113 542 263 269 275 403 2 518
Calculating/working out how much change he/she should receive
Male 42 79 26 15 103 51 59 35 45 454
Female 39 89 29 29 215 48 71 68 132 720
Total 80 168 56 44 318 98 130 103 177 1 174
Reading road signs
Male 44 156 43 22 147 96 80 59 85 732
Female 45 211 53 41 324 105 111 137 239 1 267
Total 88 367 96 63 471 201 191 197 324 1 999
Total population aged 15 years and older with level of education lower than Grade 7
Male 217 453 82 135 481 270 386 231 277 2 533
Female 191 466 92 165 752 248 405 267 449 3 035
Total 409 919 174 300 1 233 518 791 497 726 5 568

Statistics South Africa P0318
General Household Survey, 2015
85
2. Education
2.5 Population aged 15 years and older with a level of education lower than Grade 7, who have some, a lot of difficulty or are unable to do basic literacy activities by sex and province, 2015 (concluded)
Literacy skills
Thousands
Western Cape
Eastern Cape
KwaZulu-Natal
Northern Cape
Free State
North West Gauteng
Mpuma-langa Limpopo
South Africa
Total population aged 15 years and older
Male 2 217 2 071 398 966 3 426 1 300 5 201 1 420 1 816 18 815
Female 2 438 2 451 443 1 063 3 837 1 321 5 030 1 530 2 052 20 164
Total 4 655 4 522 841 2 028 7 263 2 622 10 230 2 950 3 868 38 980
Totals exclude unspecified literacy skills. Due to rounding, numbers do not necessarily add up to totals. Values based on three or less unweighted cases are considered too small to provide accurate estimates, and values are therefore replaced by asterisks.

Statistics South Africa P0318
General Household Survey, 2015
86
2. Education
2.6 Population aged 15 years and older with a level of education lower than Grade 7, who have some, a lot of difficulty or are unable to do basic literacy activities, by population group and sex, 2015
Literacy skills
Thousands
Black African Coloured Indian/Asian White Total
Writing his/her name
Male 467 39 5 3 514
Female 889 37 4 12 942
Total 1 357 76 9 15 1 456
Reading
Male 880 71 7 4 962
Female 1 340 67 7 18 1 432
Total 2 220 138 14 22 2 394
Filling in a form
Male 1 327 104 7 3 1 441
Female 1 809 93 10 21 1 933
Total 3 136 197 16 24 3 374
Writing a letter
Male 933 83 6 3 1 024
Female 1 387 82 8 18 1 494
Total 2 320 164 14 21 2 518
Calculating/working out how much change he/she should receive
Male 397 48 5 4 454
Female 659 45 3 13 720
Total 1 056 94 7 18 1 174
Reading road signs
Male 667 57 5 3 732
Female 1 187 61 4 14 1 267
Total 1 855 118 8 17 1 999

Statistics South Africa P0318
General Household Survey, 2015
87
2.6 Population aged 15 years and older with a level of education lower than Grade 7, who have some, a lot of difficulty or are unable to do basic literacy activities, by population group and sex, 2015 (concluded)
Literacy skills
Thousands
Black African Coloured
Indian/Asian White Total
Total population aged 15 years and older with level of education lower than Grade 7
Male 2 272 227 18 16 2 533
Female 2 741 219 37 38 3 035
Total 5 013 447 55 54 5 568
Total population aged 15 years and older
Male 14 758 1 707 543 1 807 18 815
Female 15 810 1 871 532 1 952 20 164
Total 30 568 3 578 1 075 3 759 38 980
Totals exclude unspecified literacy skills. Due to rounding, numbers do not necessarily add up to totals. Values based on three or less unweighted cases are considered too small to provide accurate estimates, and values are therefore replaced by asterisks.

Statistics South Africa P0318
General Household Survey, 2015
88
2. Education
2.7 Population aged 15 years and older with a level of education lower than Grade 7, by literacy skills and age group, 2015
Literacy skills Thousands
15–19 20–24 25–29 30–34 35–39 40–44 45–49 50–54 55+ Total
Writing his/her name
No difficulty 355 202 229 256 262 336 387 456 1 595 4 077
Some difficulty 5 3 8 6 8 8 14 23 103 179
A lot of difficulty 2 5 7 9 9 13 14 23 145 226
Unable to do 14 19 32 27 39 56 61 91 710 1 050
Total 376 229 277 297 317 413 476 594 2 554 5 533
Reading
No difficulty 326 166 195 205 200 268 302 345 1 133 3 140
Some difficulty 17 13 22 26 30 38 40 57 240 481
A lot of difficulty 14 18 15 22 24 30 43 54 262 481
Unable to do 21 31 46 43 66 79 92 136 916 1 431
Total 378 229 278 296 320 415 476 592 2 551 5 535
Filling in a form
No difficulty 227 120 153 137 144 194 200 238 747 2 161
Some difficulty 47 27 30 34 34 45 53 63 240 573
A lot of difficulty 41 24 22 49 40 55 74 89 335 728
Unable to do 61 57 72 76 102 120 149 203 1 231 2 073
Total 377 229 278 296 320 413 476 593 2 554 5 535
Writing a letter
No difficulty 312 160 189 191 193 258 294 331 1 088 3 016
Some difficulty 24 14 16 30 26 32 31 59 219 451
A lot of difficulty 17 16 21 27 28 32 40 57 250 488
Unable to do 25 37 52 47 72 92 111 147 998 1 580
Total 378 228 278 295 319 414 476 593 2 554 5 534
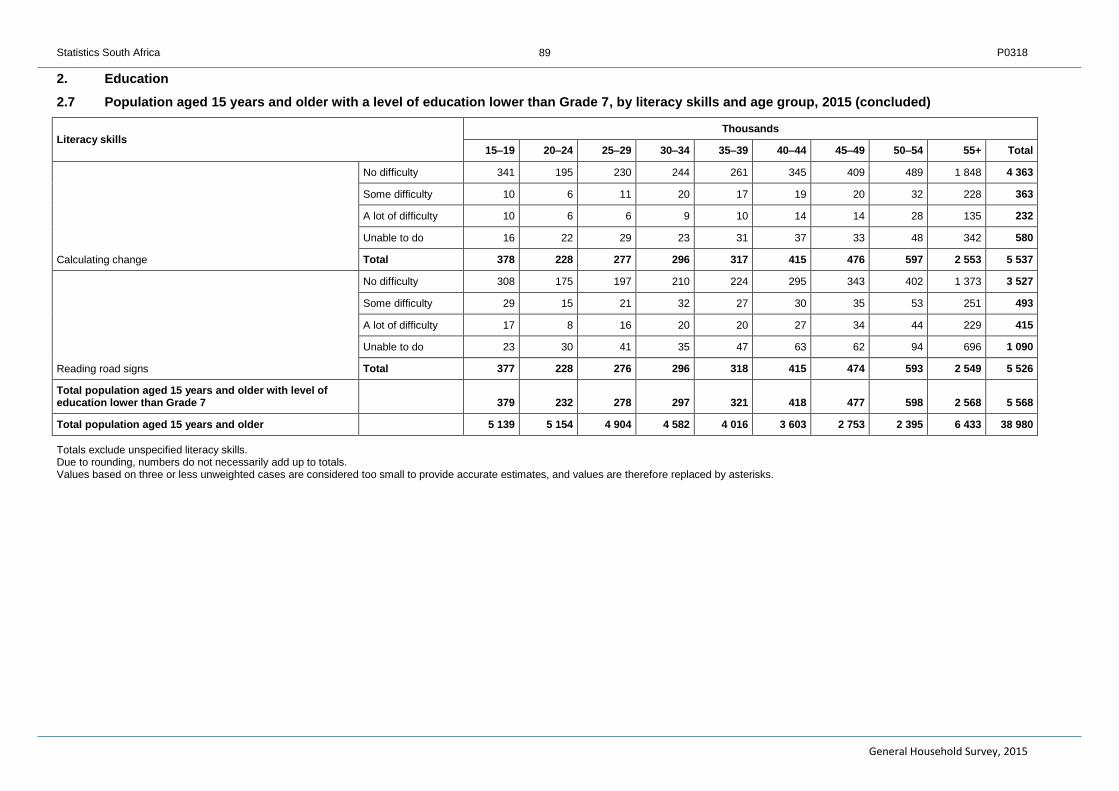
Statistics South Africa P0318
General Household Survey, 2015
89
2. Education
2.7 Population aged 15 years and older with a level of education lower than Grade 7, by literacy skills and age group, 2015 (concluded)
Literacy skills Thousands
15–19 20–24 25–29 30–34 35–39 40–44 45–49 50–54 55+ Total
Calculating change
No difficulty 341 195 230 244 261 345 409 489 1 848 4 363
Some difficulty 10 6 11 20 17 19 20 32 228 363
A lot of difficulty 10 6 6 9 10 14 14 28 135 232
Unable to do 16 22 29 23 31 37 33 48 342 580
Total 378 228 277 296 317 415 476 597 2 553 5 537
Reading road signs
No difficulty 308 175 197 210 224 295 343 402 1 373 3 527
Some difficulty 29 15 21 32 27 30 35 53 251 493
A lot of difficulty 17 8 16 20 20 27 34 44 229 415
Unable to do 23 30 41 35 47 63 62 94 696 1 090
Total 377 228 276 296 318 415 474 593 2 549 5 526
Total population aged 15 years and older with level of education lower than Grade 7 379 232 278 297 321 418 477 598 2 568 5 568
Total population aged 15 years and older 5 139 5 154 4 904 4 582 4 016 3 603 2 753 2 395 6 433 38 980
Totals exclude unspecified literacy skills. Due to rounding, numbers do not necessarily add up to totals. Values based on three or less unweighted cases are considered too small to provide accurate estimates, and values are therefore replaced by asterisks.
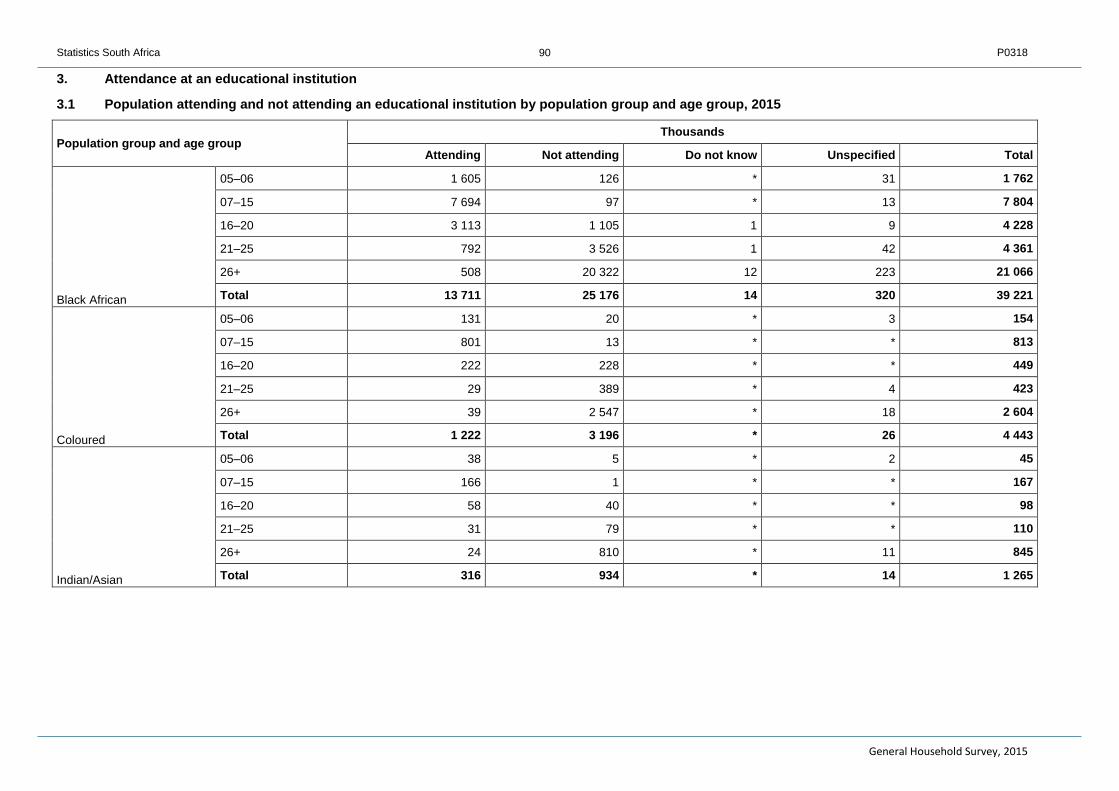
Statistics South Africa P0318
General Household Survey, 2015
90
3. Attendance at an educational institution
3.1 Population attending and not attending an educational institution by population group and age group, 2015
Population group and age group Thousands
Attending Not attending Do not know Unspecified Total
Black African
05–06 1 605 126 * 31 1 762
07–15 7 694 97 * 13 7 804
16–20 3 113 1 105 1 9 4 228
21–25 792 3 526 1 42 4 361
26+ 508 20 322 12 223 21 066
Total 13 711 25 176 14 320 39 221
Coloured
05–06 131 20 * 3 154
07–15 801 13 * * 813
16–20 222 228 * * 449
21–25 29 389 * 4 423
26+ 39 2 547 * 18 2 604
Total 1 222 3 196 * 26 4 443
Indian/Asian
05–06 38 5 * 2 45
07–15 166 1 * * 167
16–20 58 40 * * 98
21–25 31 79 * * 110
26+ 24 810 * 11 845
Total 316 934 * 14 1 265
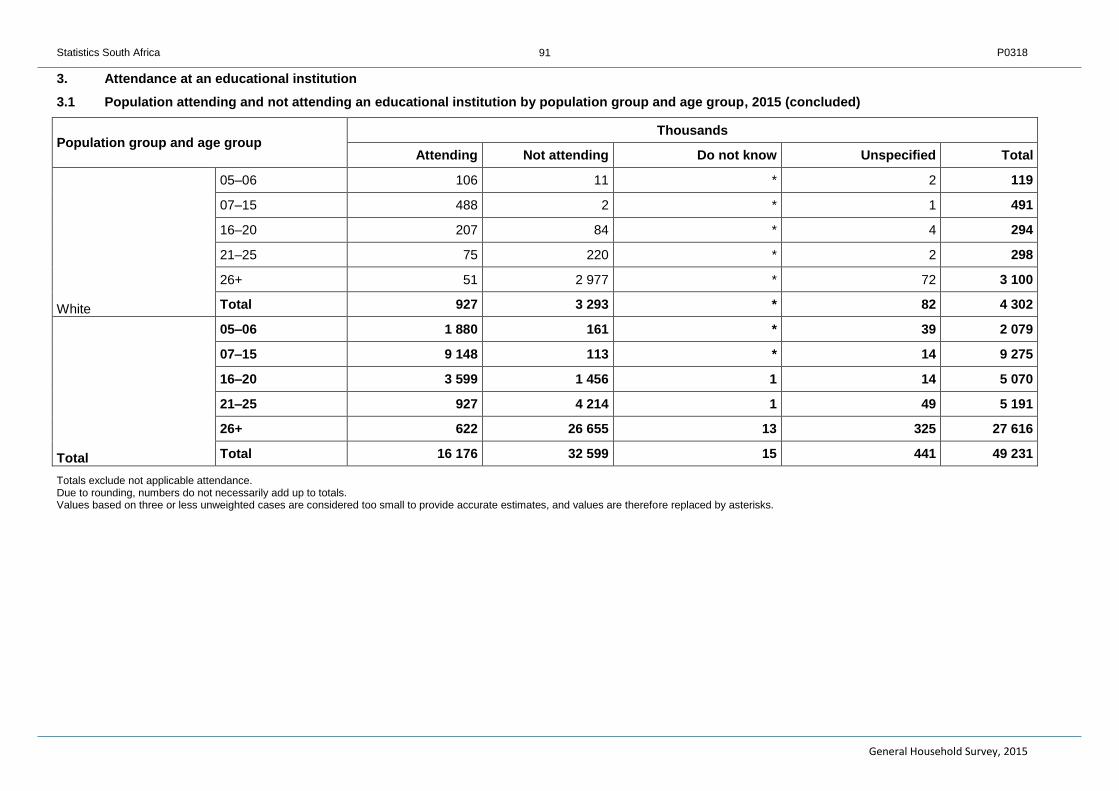
Statistics South Africa P0318
General Household Survey, 2015
91
3. Attendance at an educational institution
3.1 Population attending and not attending an educational institution by population group and age group, 2015 (concluded)
Population group and age group Thousands
Attending Not attending Do not know Unspecified Total
White
05–06 106 11 * 2 119
07–15 488 2 * 1 491
16–20 207 84 * 4 294
21–25 75 220 * 2 298
26+ 51 2 977 * 72 3 100
Total 927 3 293 * 82 4 302
Total
05–06 1 880 161 * 39 2 079
07–15 9 148 113 * 14 9 275
16–20 3 599 1 456 1 14 5 070
21–25 927 4 214 1 49 5 191
26+ 622 26 655 13 325 27 616
Total 16 176 32 599 15 441 49 231
Totals exclude not applicable attendance. Due to rounding, numbers do not necessarily add up to totals. Values based on three or less unweighted cases are considered too small to provide accurate estimates, and values are therefore replaced by asterisks.
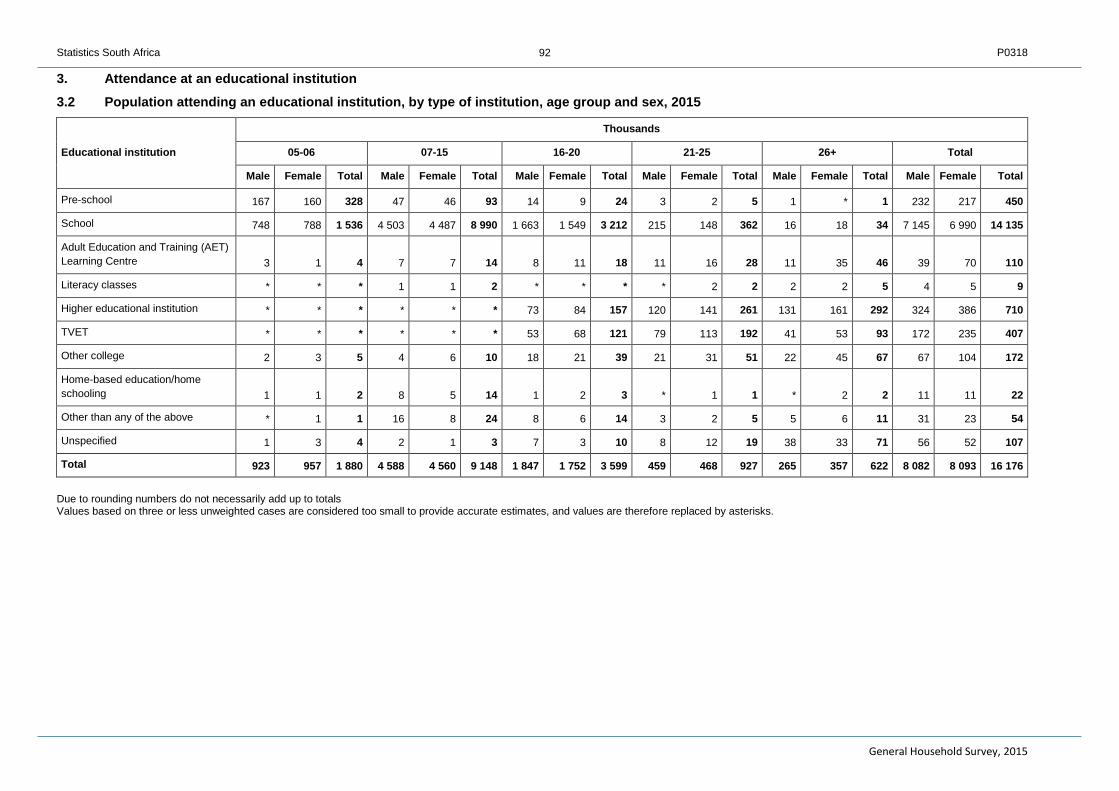
Statistics South Africa P0318
General Household Survey, 2015
92
3. Attendance at an educational institution
3.2 Population attending an educational institution, by type of institution, age group and sex, 2015
Educational institution
Thousands
05-06 07-15 16-20 21-25 26+ Total
Male Female Total Male Female Total Male Female Total Male Female Total Male Female Total Male Female Total
Pre-school 167 160 328 47 46 93 14 9 24 3 2 5 1 * 1 232 217 450
School 748 788 1 536 4 503 4 487 8 990 1 663 1 549 3 212 215 148 362 16 18 34 7 145 6 990 14 135
Adult Education and Training (AET)
Learning Centre 3 1 4 7 7 14 8 11 18 11 16 28 11 35 46 39 70 110
Literacy classes * * * 1 1 2 * * * * 2 2 2 2 5 4 5 9
Higher educational institution * * * * * * 73 84 157 120 141 261 131 161 292 324 386 710
TVET * * * * * * 53 68 121 79 113 192 41 53 93 172 235 407
Other college 2 3 5 4 6 10 18 21 39 21 31 51 22 45 67 67 104 172
Home-based education/home
schooling 1 1 2 8 5 14 1 2 3 * 1 1 * 2 2 11 11 22
Other than any of the above * 1 1 16 8 24 8 6 14 3 2 5 5 6 11 31 23 54
Unspecified 1 3 4 2 1 3 7 3 10 8 12 19 38 33 71 56 52 107
Total 923 957 1 880 4 588 4 560 9 148 1 847 1 752 3 599 459 468 927 265 357 622 8 082 8 093 16 176
Due to rounding numbers do not necessarily add up to totals Values based on three or less unweighted cases are considered too small to provide accurate estimates, and values are therefore replaced by asterisks.

Statistics South Africa P0318
General Household Survey, 2015
93
3. Attendance at an educational institution
3.3 Population aged 5 years and older attending an educational institution, by type of institution and province, 2015
Educational institution
Thousands
Western Cape
Eastern Cape
Northern Cape
Free State
KwaZulu-Natal
North West Gauteng Mpumalanga Limpopo
South Africa
Pre-school 64 41 9 23 84 27 149 36 17 450
School 1 264 2 098 294 668 3 174 934 2 615 1 200 1 887 14 135
Adult Education and Training (AET) Learning Centre 6 8 1 8 20 15 32 5 14 110
Literacy classes 2 1 * 2 1 1 * 2 * 9
Higher educational institution 97 46 6 35 97 38 315 44 33 710
TVET 31 44 8 33 54 20 127 35 57 407
Other college 18 18 3 8 16 7 70 18 13 172
Home-based education/home schooling 5 6 * 3 2 * 4 2 * 22
Other than any of the above 7 2 1 2 5 6 28 1 2 54
Unspecified 4 10 2 5 24 10 37 3 13 107
Total population 5 years and older attending educational institution 1 500 2 273 325 786 3 475 1 057 3 377 1 345 2 037 16 176
Due to rounding numbers do not necessarily add up to totals. Values based on three or less unweighted cases are considered too small to provide accurate estimates, and values are therefore replaced by asterisks.
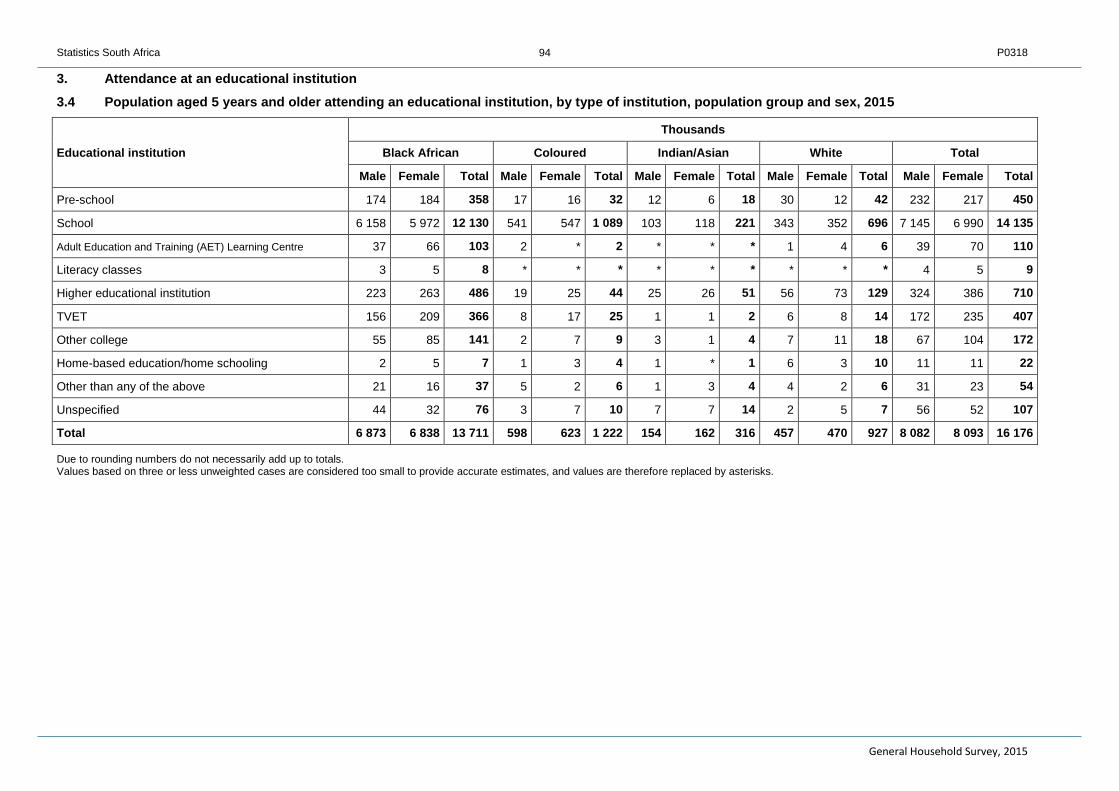
Statistics South Africa P0318
General Household Survey, 2015
94
3. Attendance at an educational institution
3.4 Population aged 5 years and older attending an educational institution, by type of institution, population group and sex, 2015
Educational institution
Thousands
Black African Coloured Indian/Asian White Total
Male Female Total Male Female Total Male Female Total Male Female Total Male Female Total
Pre-school 174 184 358 17 16 32 12 6 18 30 12 42 232 217 450
School 6 158 5 972 12 130 541 547 1 089 103 118 221 343 352 696 7 145 6 990 14 135
Adult Education and Training (AET) Learning Centre 37 66 103 2 * 2 * * * 1 4 6 39 70 110
Literacy classes 3 5 8 * * * * * * * * * 4 5 9
Higher educational institution 223 263 486 19 25 44 25 26 51 56 73 129 324 386 710
TVET 156 209 366 8 17 25 1 1 2 6 8 14 172 235 407
Other college 55 85 141 2 7 9 3 1 4 7 11 18 67 104 172
Home-based education/home schooling 2 5 7 1 3 4 1 * 1 6 3 10 11 11 22
Other than any of the above 21 16 37 5 2 6 1 3 4 4 2 6 31 23 54
Unspecified 44 32 76 3 7 10 7 7 14 2 5 7 56 52 107
Total 6 873 6 838 13 711 598 623 1 222 154 162 316 457 470 927 8 082 8 093 16 176
Due to rounding numbers do not necessarily add up to totals. Values based on three or less unweighted cases are considered too small to provide accurate estimates, and values are therefore replaced by asterisks.
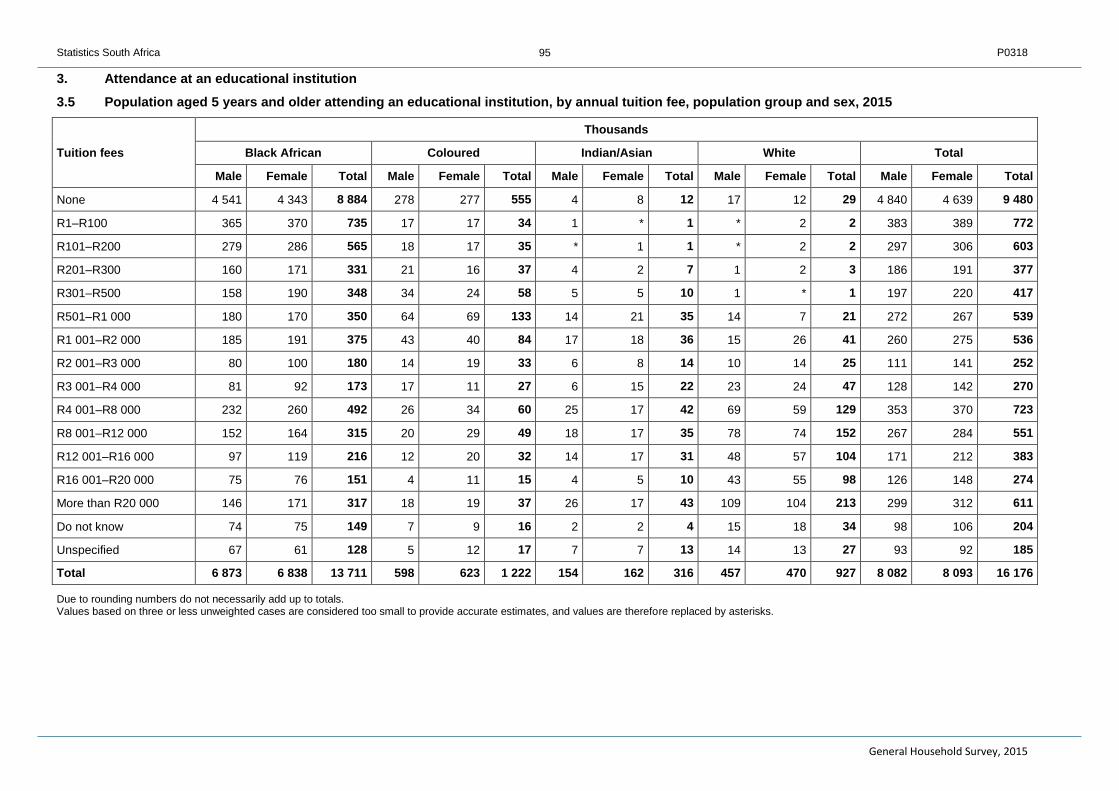
Statistics South Africa P0318
General Household Survey, 2015
95
3. Attendance at an educational institution
3.5 Population aged 5 years and older attending an educational institution, by annual tuition fee, population group and sex, 2015
Tuition fees
Thousands
Black African Coloured Indian/Asian White Total
Male Female Total Male Female Total Male Female Total Male Female Total Male Female Total
None 4 541 4 343 8 884 278 277 555 4 8 12 17 12 29 4 840 4 639 9 480
R1–R100 365 370 735 17 17 34 1 * 1 * 2 2 383 389 772
R101–R200 279 286 565 18 17 35 * 1 1 * 2 2 297 306 603
R201–R300 160 171 331 21 16 37 4 2 7 1 2 3 186 191 377
R301–R500 158 190 348 34 24 58 5 5 10 1 * 1 197 220 417
R501–R1 000 180 170 350 64 69 133 14 21 35 14 7 21 272 267 539
R1 001–R2 000 185 191 375 43 40 84 17 18 36 15 26 41 260 275 536
R2 001–R3 000 80 100 180 14 19 33 6 8 14 10 14 25 111 141 252
R3 001–R4 000 81 92 173 17 11 27 6 15 22 23 24 47 128 142 270
R4 001–R8 000 232 260 492 26 34 60 25 17 42 69 59 129 353 370 723
R8 001–R12 000 152 164 315 20 29 49 18 17 35 78 74 152 267 284 551
R12 001–R16 000 97 119 216 12 20 32 14 17 31 48 57 104 171 212 383
R16 001–R20 000 75 76 151 4 11 15 4 5 10 43 55 98 126 148 274
More than R20 000 146 171 317 18 19 37 26 17 43 109 104 213 299 312 611
Do not know 74 75 149 7 9 16 2 2 4 15 18 34 98 106 204
Unspecified 67 61 128 5 12 17 7 7 13 14 13 27 93 92 185
Total 6 873 6 838 13 711 598 623 1 222 154 162 316 457 470 927 8 082 8 093 16 176
Due to rounding numbers do not necessarily add up to totals. Values based on three or less unweighted cases are considered too small to provide accurate estimates, and values are therefore replaced by asterisks.

Statistics South Africa P0318
General Household Survey, 2015
96
3. Attendance at an educational institution
3.6 Population aged 5 years and older attending an educational institution, by annual tuition fee and type of institution, 2015
Tuition fees
Thousands
Pre-school School
Adult Education
and Training Learning
Centre Literacy classes
Higher Educational
Institution TVET Other
College
Home-based education/
home schooling
Other than any of the
above Unspecified
Total
None 125 9 106 69 4 38 86 30 1 19 1 9 480
R1–R100 11 753 5 * * 1 3 * * * 772
R101–R200 21 569 5 * * 3 2 1 2 * 603
R201–R300 15 349 5 1 2 3 3 * * * 377
R301–R500 27 373 5 * 1 6 3 * 1 * 417
R501–R1 000 34 484 6 * 1 9 2 * 3 * 539
R1 001–R2 000 59 423 2 * 7 33 6 3 3 * 536
R2 001–R3 000 26 186 1 * 8 24 6 * 1 * 252
R3 001–R4 000 19 210 * 2 14 18 3 * 3 * 270
R4 001–R8 000 35 521 4 * 50 72 35 2 3 1 723
R8 001–R12 000 23 377 3 * 80 43 18 * 1 6 551
R12 001–R16 000 19 228 2 * 95 24 14 * 1 1 383
R16 001–R20 000 8 128 1 * 100 22 14 2 * * 274
More than R20 000 17 258 * 1 268 31 27 * 6 3 611
Do not know 7 123 2 * 33 28 5 * 7 * 204
Unspecified 5 46 1 * 14 5 2 14 3 95 185
Total 450 14 135 110 9 710 407 172 22 54 107 16 176
Due to rounding numbers do not necessarily add up to totals. Values based on three or less unweighted cases are considered too small to provide accurate estimates, and values are therefore replaced by asterisks.

Statistics South Africa P0318
General Household Survey, 2015
97
3. Attendance at an educational institution
3.7 Population aged 5 years and older attending an educational institution that benefited from reductions or partial bursaries, by type of institution, sex and province, 2015
Educational institution
Thousands
Western Cape
Eastern Cape
Northern Cape Free State
KwaZulu-Natal
North West Gauteng Mpumalanga Limpopo
South Africa
Pre-school
Male 2 1 * 1 2 * 2 * * 8
Female * * * * 1 * 1 1 * 4
Total 2 1 * 2 3 * 3 1 * 11
School
Male 70 71 1 62 156 1 67 30 9 467
Female 63 61 2 69 149 2 57 28 7 439
Total 133 133 3 131 305 4 124 58 16 906
Adult Education and Training (AET) Learning Centre
Male * 1 * 1 * 1 1 * * 4
Female * * * * 2 1 1 * * 4
Total * 1 * 1 2 2 2 * * 8
Literacy classes
Male * * * 2 * * * * * 2
Female * * * * * * * * * *
Total * * * 2 * * * * * 2
Higher Educational Institution
Male 5 5 1 3 5 2 21 5 5 53
Female 12 9 1 2 14 3 29 3 3 77
Total 18 14 3 5 19 6 50 8 8 130
TVET
Male 4 4 * 3 4 2 15 6 7 45
Female 9 9 2 7 19 5 14 8 10 82
Total 12 12 2 10 22 7 28 14 17 126
Other College
Male 2 1 * 1 * 1 2 1 1 10
Female 2 2 * 1 5 * 4 4 * 18
Total 4 3 * 1 5 1 7 5 1 28
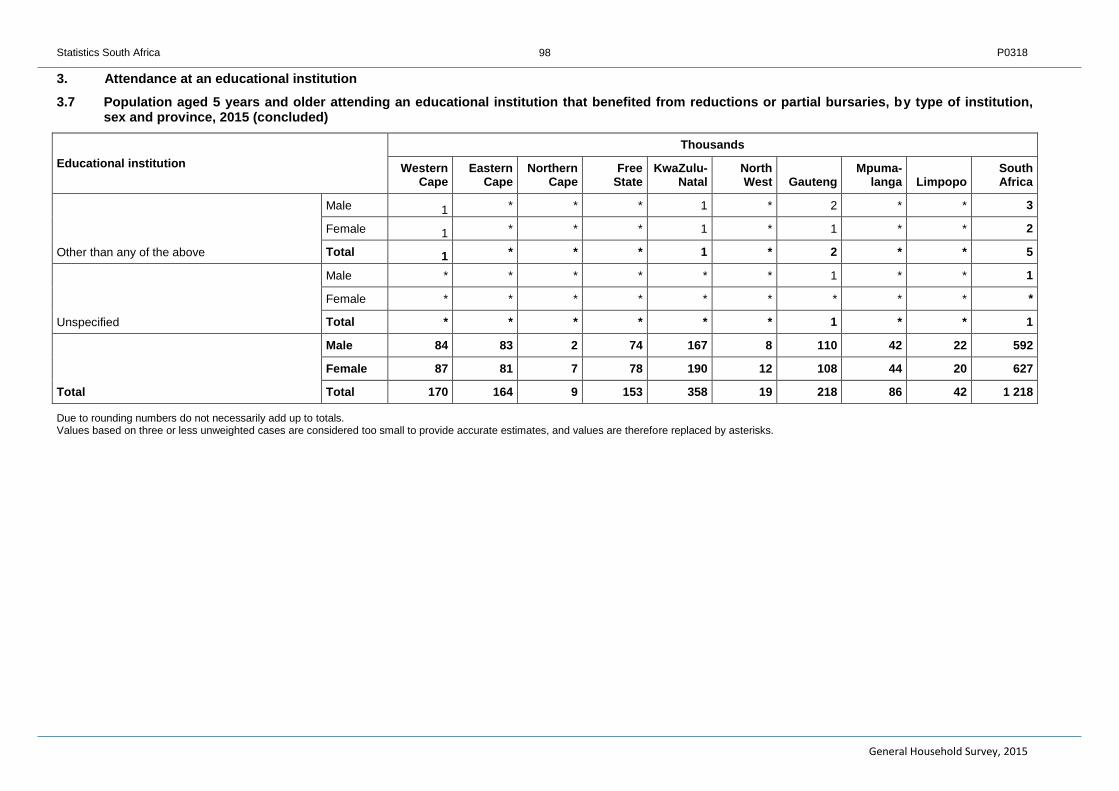
Statistics South Africa P0318
General Household Survey, 2015
98
3. Attendance at an educational institution
3.7 Population aged 5 years and older attending an educational institution that benefited from reductions or partial bursaries, by type of institution, sex and province, 2015 (concluded)
Educational institution
Thousands
Western Cape
Eastern Cape
Northern Cape
Free State
KwaZulu-Natal
North West Gauteng
Mpuma-langa Limpopo
South Africa
Other than any of the above
Male 1 * * * 1 * 2 * * 3
Female 1 * * * 1 * 1 * * 2
Total 1 * * * 1 * 2 * * 5
Unspecified
Male * * * * * * 1 * * 1
Female * * * * * * * * * *
Total * * * * * * 1 * * 1
Total
Male 84 83 2 74 167 8 110 42 22 592
Female 87 81 7 78 190 12 108 44 20 627
Total 170 164 9 153 358 19 218 86 42 1 218
Due to rounding numbers do not necessarily add up to totals. Values based on three or less unweighted cases are considered too small to provide accurate estimates, and values are therefore replaced by asterisks.
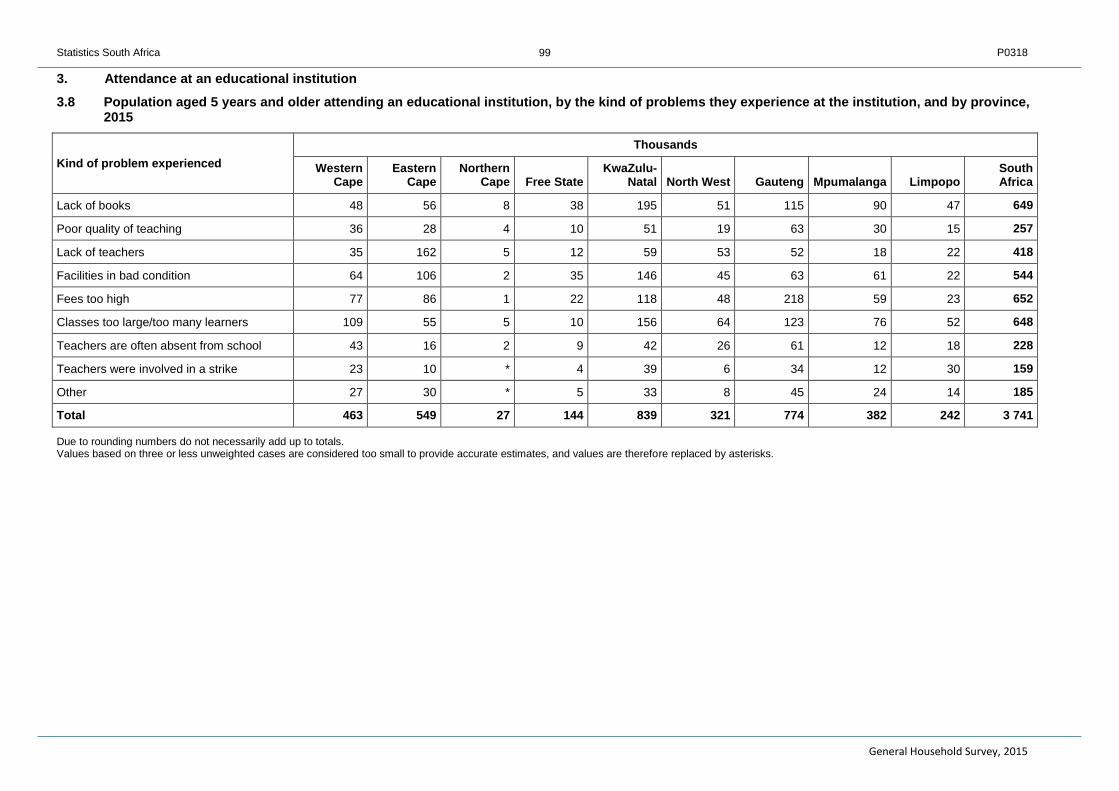
Statistics South Africa P0318
General Household Survey, 2015
99
3. Attendance at an educational institution
3.8 Population aged 5 years and older attending an educational institution, by the kind of problems they experience at the institution, and by province, 2015
Kind of problem experienced
Thousands
Western Cape
Eastern Cape
Northern Cape Free State
KwaZulu-Natal North West Gauteng Mpumalanga Limpopo
South Africa
Lack of books 48 56 8 38 195 51 115 90 47 649
Poor quality of teaching 36 28 4 10 51 19 63 30 15 257
Lack of teachers 35 162 5 12 59 53 52 18 22 418
Facilities in bad condition 64 106 2 35 146 45 63 61 22 544
Fees too high 77 86 1 22 118 48 218 59 23 652
Classes too large/too many learners 109 55 5 10 156 64 123 76 52 648
Teachers are often absent from school 43 16 2 9 42 26 61 12 18 228
Teachers were involved in a strike 23 10 * 4 39 6 34 12 30 159
Other 27 30 * 5 33 8 45 24 14 185
Total 463 549 27 144 839 321 774 382 242 3 741
Due to rounding numbers do not necessarily add up to totals. Values based on three or less unweighted cases are considered too small to provide accurate estimates, and values are therefore replaced by asterisks.

Statistics South Africa P0318
General Household Survey, 2015
100
3. Attendance at an educational institution
3.9 Population aged 5 years and older currently attending school by grade and by province, 2015
School grade
Thousands
Western Cape Eastern Cape
Northern Cape Free State
KwaZulu-Natal North West Gauteng Mpumalanga Limpopo South Africa
Grade R/0 63 122 19 35 122 52 109 41 94 657
Grade 1 109 201 22 51 275 84 237 103 140 1 222
Grade 2 113 163 23 57 282 73 220 111 141 1 184
Grade 3 105 175 21 51 248 87 221 96 125 1 129
Grade 4 123 175 25 54 263 86 198 84 132 1 140
Grade 5 106 167 28 57 251 78 199 98 122 1 106
Grade 6 97 147 22 54 241 69 193 81 116 1 019
Grade 7 108 159 27 44 218 64 188 82 141 1 031
Grade 8 87 162 27 46 240 77 202 93 135 1 070
Grade 9 107 160 24 58 235 58 174 108 159 1 082
Grade 10 90 196 19 67 271 85 235 119 243 1 324
Grade 11 81 151 21 50 269 60 221 97 193 1 142
Grade 12/Matric 60 108 14 39 235 56 169 78 129 887
NC (V) Level 2 (N1/NTC 1) * * * * 1 * 1 * 1 3
NC (V) Level 3 (N2/NTC 2) * * * * * * 1 * * 1
NC (V) Level 4 (N3/NTC 3) * * * * 1 * 1 1 * 3
Other 4 * * 3 3 2 8 * 2 23
Unspecified 12 11 2 4 19 3 39 7 14 110
Total 1 264 2 098 294 668 3 174 934 2 615 1 200 1 887 14 135
Due to rounding numbers do not necessarily add up to totals. Values based on three or less unweighted cases are considered too small to provide accurate estimates, and values are therefore replaced by asterisks.

Statistics South Africa P0318
General Household Survey, 2015
101
3. Attendance at an educational institution
3.10 Population aged 0–4 years attending a day care centre, crèche, early childhood development centre (ECD) playgroup, nursery school or pre-primary school, by whether they attend or not, and by province, 2015
Province Thousands
Attend Do not attend Total
Western Cape 191 349 540
Eastern Cape 206 504 710
Northern Cape 31 87 118
Free State 107 139 246
KwaZulu-Natal 210 865 1 074
North West 113 268 381
Gauteng 415 550 964
Mpumalanga 115 325 441
Limpopo 222 393 616
South Africa 1 609 3 481 5 090
Due to rounding numbers do not necessarily add up to totals. Values based on three or less unweighted cases are considered too small to provide accurate estimates, and values are therefore replaced by asterisks.

Statistics South Africa P0318
General Household Survey, 2015
102
3. Attendance at an educational institution
3.11 Population aged 0–4 years attending a day care centre, crèche, early childhood development centre (ECD) playgroup, nursery school or pre-primary school, by whether they attend these institutions, and by population group and sex, 2015
Population group and sex Thousands
Attend Do not attend Total
Black African
Male 672 1 507 2 179
Female 691 1 457 2 148
Total 1 363 2 964 4 327
Coloured
Male 54 152 207
Female 47 159 206
Total 101 311 413
Indian/Asian
Male 13 38 50
Female 12 38 50
Total 25 75 100
White
Male 51 75 127
Female 69 54 123
Total 120 130 250
Total
Male 790 1 772 2 562
Female 819 1 708 2 527
Total 1 609 3 481 5 090
Due to rounding numbers do not necessarily add up to totals. Values based on three or less unweighted cases are considered too small to provide accurate estimates, and values are therefore replaced by asterisks.

Statistics South Africa P0318
General Household Survey, 2015
103
4. Medical aid coverage
4.1 Medical aid coverage, by province and population group, 2015
Province
Thousands
Western Cape Eastern Cape
Northern Cape Free State
KwaZulu-Natal North West Gauteng Mpumalanga Limpopo South Africa
Covered Black African 176 392 94 271 672 399 1 724 478 395 4 601
Coloured 562 119 52 10 44 7 126 3 15 936
Indian/Asian 25 16 * 4 299 3 232 8 17 603
White 743 182 62 162 250 143 1 559 163 52 3 317
Total 1 506 709 208 447 1 264 551 3 641 651 480 9 458
Not Covered Black African 1 778 5 515 543 2 142 8 765 2 980 8 480 3 445 5 080 38 727
Coloured 2 650 369 402 65 70 54 277 8 18 3 912
Indian/Asian 15 7 2 3 476 31 190 6 21 752
White 276 55 25 101 44 56 542 88 22 1 208
Total 4 719 5 947 972 2 310 9 354 3 121 9 488 3 547 5 140 44 599
Do not know Black African * * * * 35 4 11 1 11 62
Coloured 4 * 1 * * * * * * 5
White * * * * * * 1 * * 1
Total 4 * 1 * 35 4 12 1 11 68
Unspecified Black African 13 37 1 6 27 23 94 31 23 254
Coloured 2 * 1 * * * 5 * * 8
Indian/Asian * * * * 5 * 6 * * 11
White 2 * * * 3 4 21 5 * 35
Total 16 37 2 6 35 27 126 36 23 308

Statistics South Africa P0318
General Household Survey, 2015
104
4. Medical aid coverage
4.1 Medical aid coverage, by province and population group, 2015 (concluded)
Province
Thousands
Western Cape Eastern Cape
Northern Cape Free State
KwaZulu-Natal North West Gauteng Mpumalanga Limpopo South Africa
Total
Black African 1 967 5 944 638 2 419 9 499 3 406 10 308 3 955 5 509 43 645
Coloured 3 217 488 455 75 113 60 408 12 33 4 861
Indian/Asian 39 23 2 6 779 34 429 14 38 1 366
White 1 022 237 87 263 297 203 2 123 256 74 4 561
Total 6 246 6 693 1 182 2 763 10 688 3 703 13 268 4 236 5 654 54 432
Due to rounding numbers do not necessarily add up to totals. Values based on three or less unweighted cases are considered too small to provide accurate estimates, and values are therefore replaced by asterisks.
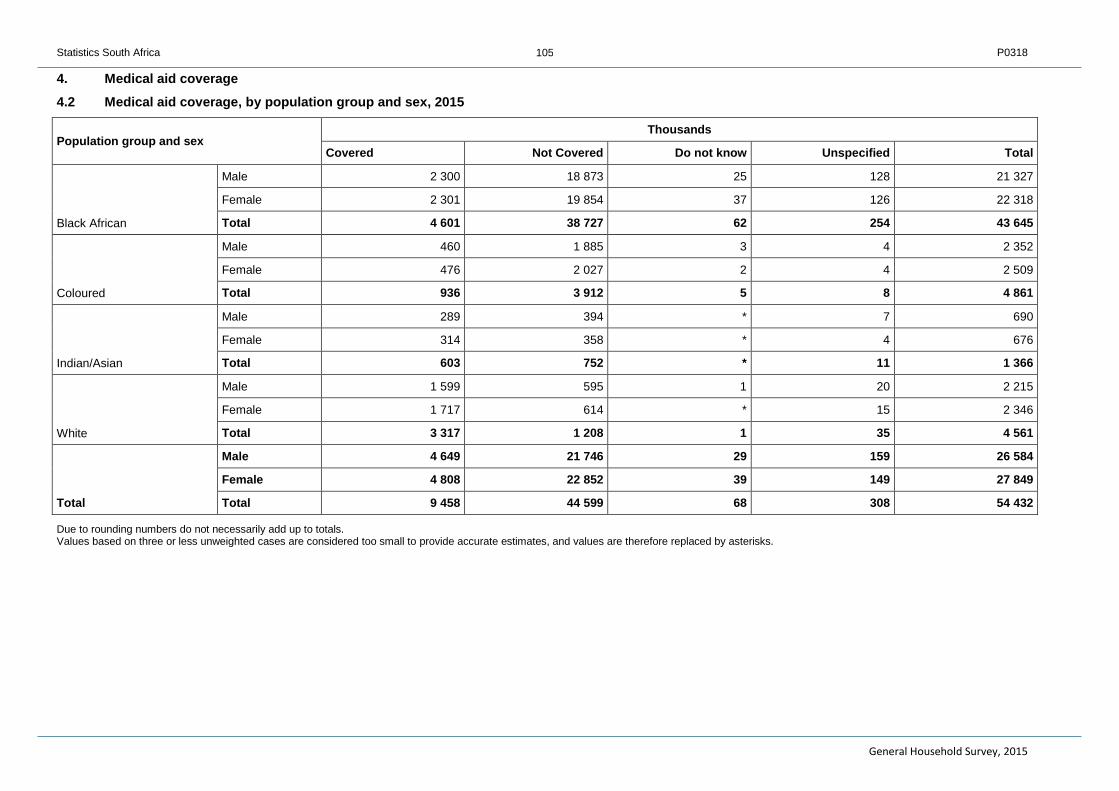
Statistics South Africa P0318
General Household Survey, 2015
105
4. Medical aid coverage
4.2 Medical aid coverage, by population group and sex, 2015
Population group and sex Thousands
Covered Not Covered Do not know Unspecified Total
Black African
Male 2 300 18 873 25 128 21 327
Female 2 301 19 854 37 126 22 318
Total 4 601 38 727 62 254 43 645
Coloured
Male 460 1 885 3 4 2 352
Female 476 2 027 2 4 2 509
Total 936 3 912 5 8 4 861
Indian/Asian
Male 289 394 * 7 690
Female 314 358 * 4 676
Total 603 752 * 11 1 366
White
Male 1 599 595 1 20 2 215
Female 1 717 614 * 15 2 346
Total 3 317 1 208 1 35 4 561
Total
Male 4 649 21 746 29 159 26 584
Female 4 808 22 852 39 149 27 849
Total 9 458 44 599 68 308 54 432
Due to rounding numbers do not necessarily add up to totals. Values based on three or less unweighted cases are considered too small to provide accurate estimates, and values are therefore replaced by asterisks.
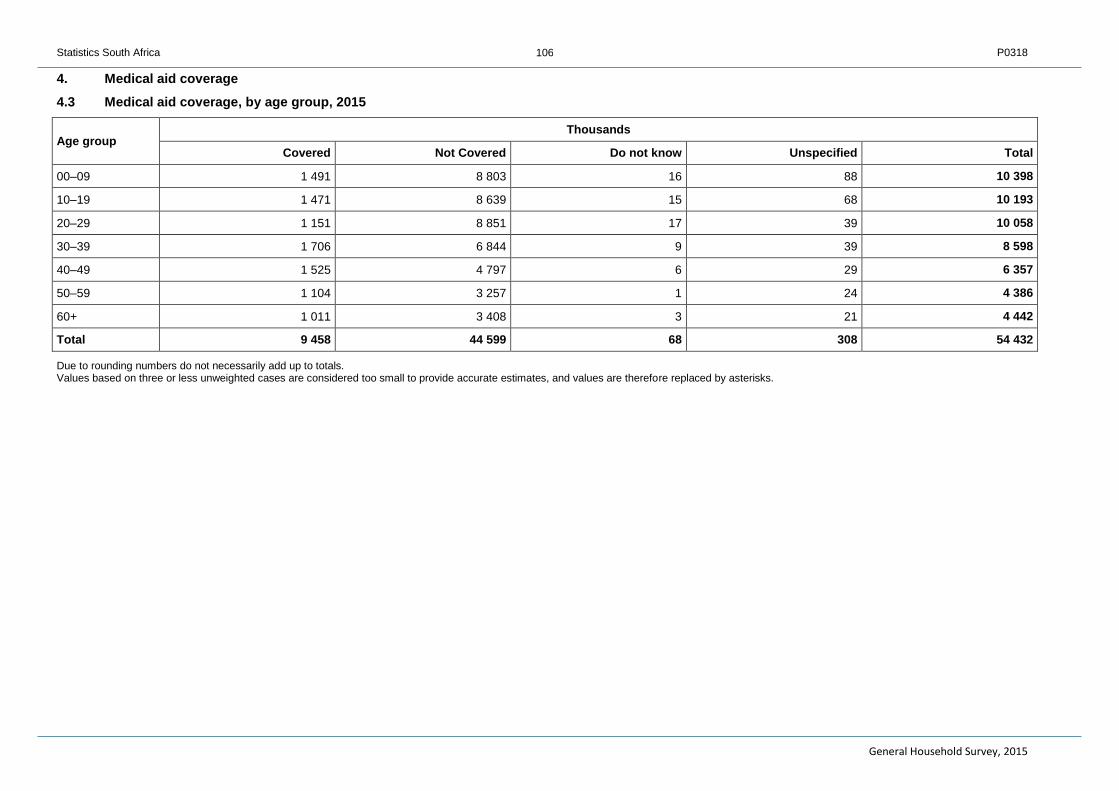
Statistics South Africa P0318
General Household Survey, 2015
106
4. Medical aid coverage
4.3 Medical aid coverage, by age group, 2015
Age group Thousands
Covered Not Covered Do not know Unspecified Total
00–09 1 491 8 803 16 88 10 398
10–19 1 471 8 639 15 68 10 193
20–29 1 151 8 851 17 39 10 058
30–39 1 706 6 844 9 39 8 598
40–49 1 525 4 797 6 29 6 357
50–59 1 104 3 257 1 24 4 386
60+ 1 011 3 408 3 21 4 442
Total 9 458 44 599 68 308 54 432
Due to rounding numbers do not necessarily add up to totals. Values based on three or less unweighted cases are considered too small to provide accurate estimates, and values are therefore replaced by asterisks.
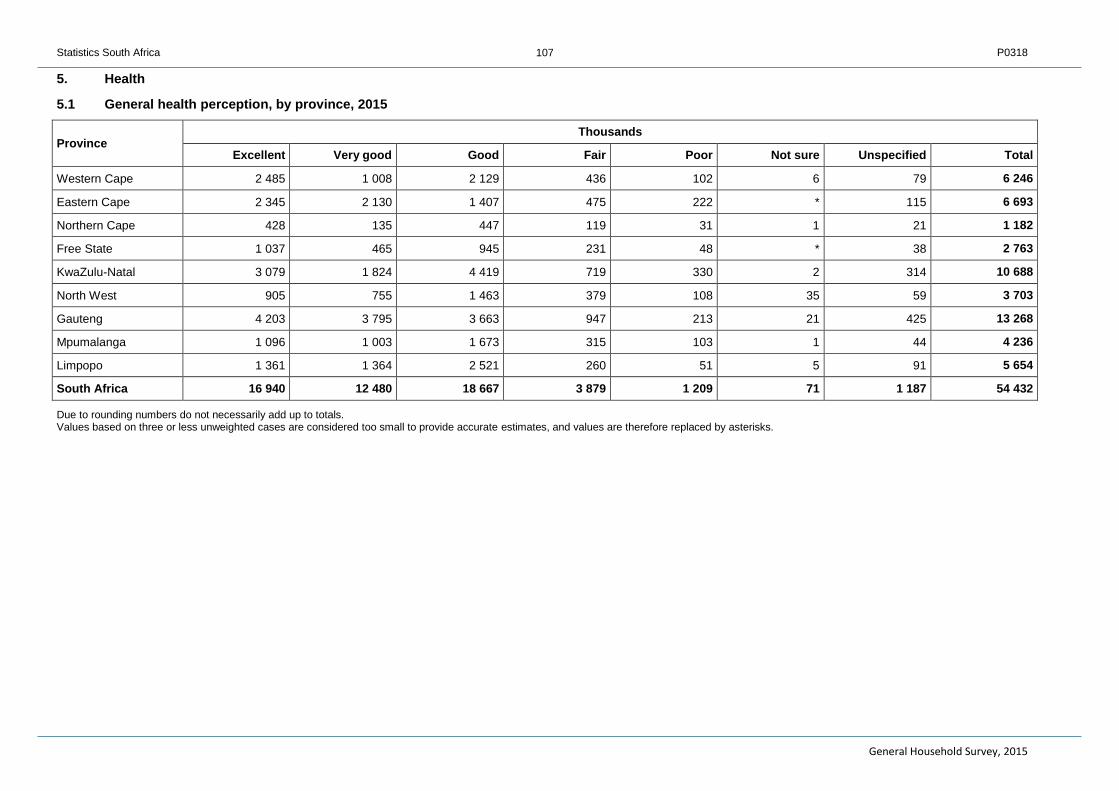
Statistics South Africa P0318
General Household Survey, 2015
107
5. Health
5.1 General health perception, by province, 2015
Province Thousands
Excellent Very good Good Fair Poor Not sure Unspecified Total
Western Cape 2 485 1 008 2 129 436 102 6 79 6 246
Eastern Cape 2 345 2 130 1 407 475 222 * 115 6 693
Northern Cape 428 135 447 119 31 1 21 1 182
Free State 1 037 465 945 231 48 * 38 2 763
KwaZulu-Natal 3 079 1 824 4 419 719 330 2 314 10 688
North West 905 755 1 463 379 108 35 59 3 703
Gauteng 4 203 3 795 3 663 947 213 21 425 13 268
Mpumalanga 1 096 1 003 1 673 315 103 1 44 4 236
Limpopo 1 361 1 364 2 521 260 51 5 91 5 654
South Africa 16 940 12 480 18 667 3 879 1 209 71 1 187 54 432
Due to rounding numbers do not necessarily add up to totals. Values based on three or less unweighted cases are considered too small to provide accurate estimates, and values are therefore replaced by asterisks.

Statistics South Africa P0318
General Household Survey, 2015
108
5. Health
5.2 People who were ill in the month prior to the interview and who consulted a health worker, by province, 2015
Province Thousands
Consulted Not consulted Do not know Not applicable Unspecified Total
Western Cape 361 212 * 5 651 22 6 246
Eastern Cape 524 170 * 5 976 23 6 693
Northern Cape 65 41 * 1 071 5 1 182
Free State 125 150 * 2 482 6 2 763
KwaZulu-Natal 561 249 * 9 847 30 10 688
North West 221 181 * 3 282 19 3 703
Gauteng 1 086 690 2 11 405 84 13 268
Mpumalanga 358 162 * 3 689 27 4 236
Limpopo 225 155 * 5 257 17 5 654
South Africa 3 526 2 011 2 48 660 233 54 432
Due to rounding numbers do not necessarily add up to totals. Values based on three or less unweighted cases are considered too small to provide accurate estimates, and values are therefore replaced by asterisks.

Statistics South Africa P0318
General Household Survey, 2015
109
5. Health
5.3 People who were ill in the month prior to the interview and whether they consulted a health worker, by population group and sex, 2015
Population group an sex Thousands
Consulted Not consulted Do not know Not applicable Unspecified Total
Black African
Male 1 164 748 * 19 325 90 21 327
Female 1 529 881 * 19 820 87 22 318
Total 2 693 1 629 * 39 145 177 43 645
Coloured
Male 140 80 * 2 124 8 2 352
Female 154 85 * 2 260 10 2 509
Total 294 165 * 4 384 17 4 861
Indian/Asian
Male 51 23 * 615 * 690
Female 61 23 * 590 1 676
Total 113 47 * 1 205 1 1 366
White
Male 185 90 2 1 920 19 2 215
Female 241 80 * 2 006 19 2 346
Total 426 170 2 3 926 38 4 561
Total
Male 1 541 941 2 23 984 116 26 584
Female 1 985 1 070 * 24 677 117 27 849
Total 3 526 2 011 2 48 660 233 54 432
Due to rounding numbers do not necessarily add up to totals. Values based on three or less unweighted cases are considered too small to provide accurate estimates, and values are therefore replaced by asterisks.
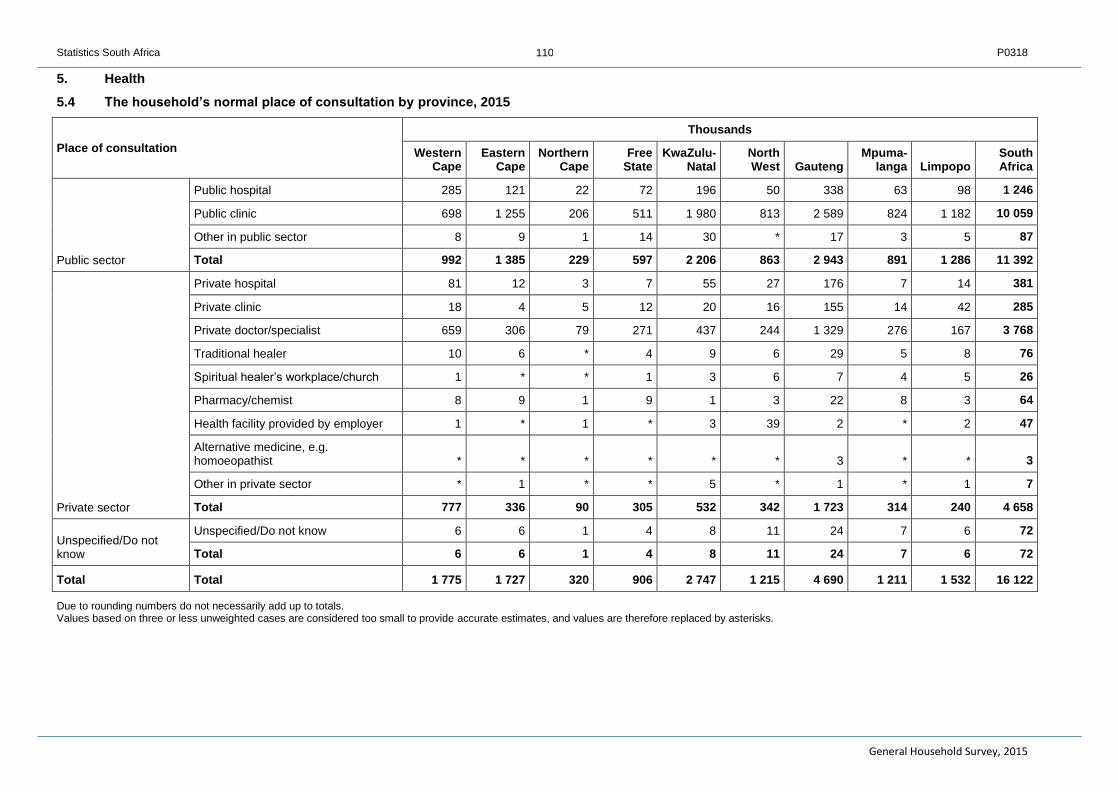
Statistics South Africa P0318
General Household Survey, 2015
110
5. Health
5.4 The household’s normal place of consultation by province, 2015
Place of consultation
Thousands
Western Cape
Eastern Cape
Northern Cape
Free State
KwaZulu-Natal
North West Gauteng
Mpuma-langa Limpopo
South Africa
Public sector
Public hospital 285 121 22 72 196 50 338 63 98 1 246
Public clinic 698 1 255 206 511 1 980 813 2 589 824 1 182 10 059
Other in public sector 8 9 1 14 30 * 17 3 5 87
Total 992 1 385 229 597 2 206 863 2 943 891 1 286 11 392
Private sector
Private hospital 81 12 3 7 55 27 176 7 14 381
Private clinic 18 4 5 12 20 16 155 14 42 285
Private doctor/specialist 659 306 79 271 437 244 1 329 276 167 3 768
Traditional healer 10 6 * 4 9 6 29 5 8 76
Spiritual healer’s workplace/church 1 * * 1 3 6 7 4 5 26
Pharmacy/chemist 8 9 1 9 1 3 22 8 3 64
Health facility provided by employer 1 * 1 * 3 39 2 * 2 47
Alternative medicine, e.g. homoeopathist * * * * * * 3 * * 3
Other in private sector * 1 * * 5 * 1 * 1 7
Total 777 336 90 305 532 342 1 723 314 240 4 658
Unspecified/Do not know
Unspecified/Do not know 6 6 1 4 8 11 24 7 6 72
Total 6 6 1 4 8 11 24 7 6 72
Total Total 1 775 1 727 320 906 2 747 1 215 4 690 1 211 1 532 16 122
Due to rounding numbers do not necessarily add up to totals. Values based on three or less unweighted cases are considered too small to provide accurate estimates, and values are therefore replaced by asterisks.

Statistics South Africa P0318
General Household Survey, 2015
111
5. Health
5.5 The household’s normal place of consultation and whether at least one member is covered by medical aid, 2015
Place of consultation Thousands
Covered Not Covered Unspecified Total
Public sector
Public hospital 139 1 103 4 1 246
Public clinic 555 9 485 19 10 059
Other in public sector 10 78 * 87
Total 704 10 666 23 11 392
Private sector
Private hospital 301 79 1 381
Private clinic 135 149 1 285
Private doctor/specialist 2 560 1 201 6 3 768
Traditional healer 5 71 * 76
Spiritual healer’s workplace/church 5 21 * 26
Pharmacy/chemist 11 52 * 64
Health facility provided by employer 32 15 * 47
Alternative medicine, e.g. homoeopathist 3 * * 3
Other in private sector * 7 * 7
Total 3 052 1 597 8 4 658
Unspecified/Do not know
Unspecified/Do not know 22 48 2 72
Total 22 48 2 72
Total Total 3 778 12 311 33 16 122
Due to rounding numbers do not necessarily add up to totals. Values based on three or less unweighted cases are considered too small to provide accurate estimates, and values are therefore replaced by asterisks.

Statistics South Africa P0318
General Household Survey, 2015
112
5. Health
5.6 The respondent’s level of satisfaction with the service received during their most recent visit, by kind of health facility used, 2015
Place of consultation
Thousands
Very satisfied
Somewhat satisfied
Neither satisfied nor dissatisfied
Somewhat dissatisfied
Very dissatisfied Unspecified Total
Public sector
Public hospital 665 249 56 52 82 12 1 117
Public clinic 5 308 2 181 762 440 549 75 9 315
Other in public sector 41 19 10 4 7 1 82
Total 6 014 2 449 828 496 638 87 10 513
Private sector
Private hospital 291 36 5 6 3 2 343
Private clinic 221 32 4 6 6 3 272
Private doctor/specialist 3 363 160 25 21 7 22 3 598
Traditional healer 35 13 7 2 5 1 62
Spiritual healer’s workplace/church 22 1 * * * 1 24
Pharmacy/chemist 46 7 2 * * 1 56
Health facility provided by employer 38 2 * 2 * * 42
Alternative medicine, e.g. homoeopathist 3 * * * * * 3
Other in private sector 5 * * 1 * * 6
Total 4 023 250 44 37 21 30 4 405
Unspecified/Do not know
Unspecified/Do not know 39 8 * 1 2 * 49
Total 39 8 * 1 2 * 49
Total number of households (RSA) 10 076 2 706 872 535 661 118 14 967
Due to rounding numbers do not necessarily add up to totals. Values based on three or less unweighted cases are considered too small to provide accurate estimates, and values are therefore replaced by asterisks.

Statistics South Africa P0318
General Household Survey, 2015
113
5. Health
5.7 The respondent’s level of satisfaction with the service received during their most recent visit to a health facility, by population group and sex, 2015
Population group and sex
Thousands
Very satisfied Somewhat
satisfied
Neither satisfied nor dissatisfied
Somewhat dissatisfied
Very dissatisfied Unspecified Total
Black African
Male 4 298 1 270 430 226 286 54 6 565
Female 3 385 1 150 340 213 261 43 5 394
Total 7 683 2 420 770 440 548 98 11 958
Coloured
Male 452 70 43 40 53 4 662
Female 284 66 36 24 39 2 451
Total 736 136 78 64 92 7 1 113
Indian/Asian
Male 192 38 9 7 6 1 253
Female 70 21 2 4 2 * 99
Total 262 59 10 11 9 1 352
White
Male 982 58 11 9 6 9 1 076
Female 413 32 2 11 6 4 469
Total 1 395 91 14 20 13 13 1 544
Total
Male 5 924 1 437 492 282 352 68 8 556
Female 4 152 1 269 380 252 309 49 6 412
Total 10 076 2 706 872 535 661 118 14 967
Due to rounding numbers do not necessarily add up to totals. Values based on three or less unweighted cases are considered too small to provide accurate estimates, and values are therefore replaced by asterisks.
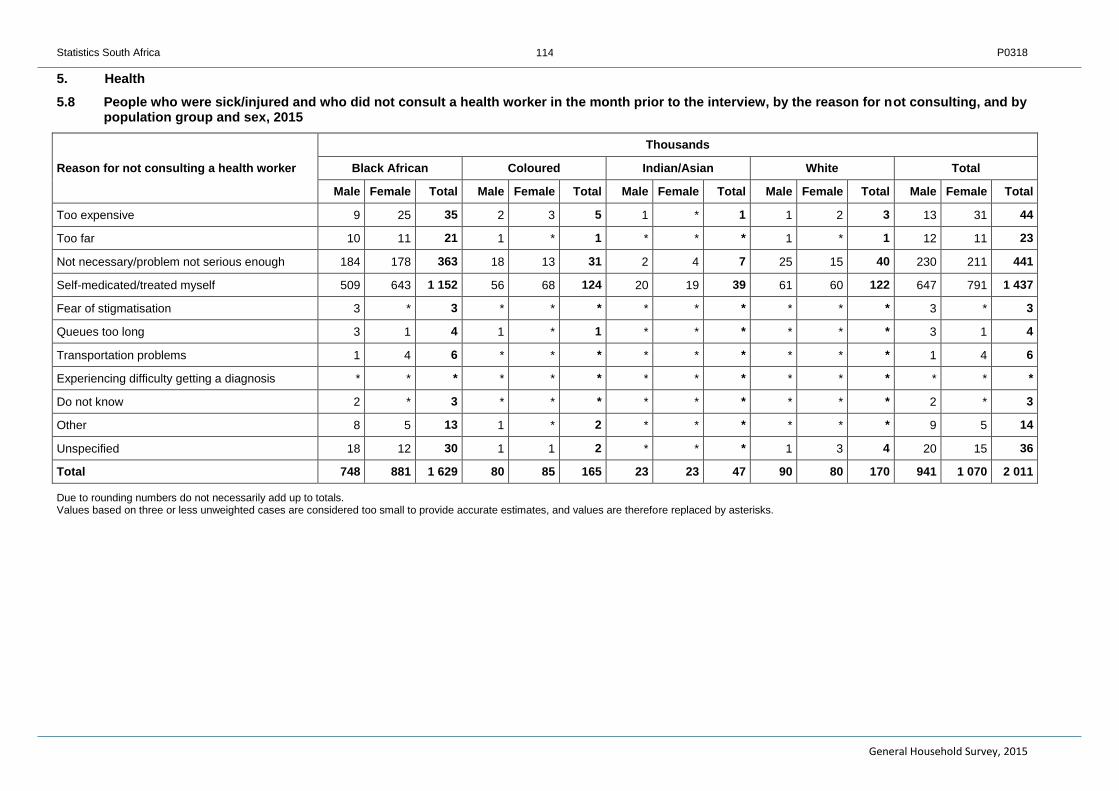
Statistics South Africa P0318
General Household Survey, 2015
114
5. Health
5.8 People who were sick/injured and who did not consult a health worker in the month prior to the interview, by the reason for not consulting, and by population group and sex, 2015
Reason for not consulting a health worker
Thousands
Black African Coloured Indian/Asian White Total
Male Female Total Male Female Total Male Female Total Male Female Total Male Female Total
Too expensive 9 25 35 2 3 5 1 * 1 1 2 3 13 31 44
Too far 10 11 21 1 * 1 * * * 1 * 1 12 11 23
Not necessary/problem not serious enough 184 178 363 18 13 31 2 4 7 25 15 40 230 211 441
Self-medicated/treated myself 509 643 1 152 56 68 124 20 19 39 61 60 122 647 791 1 437
Fear of stigmatisation 3 * 3 * * * * * * * * * 3 * 3
Queues too long 3 1 4 1 * 1 * * * * * * 3 1 4
Transportation problems 1 4 6 * * * * * * * * * 1 4 6
Experiencing difficulty getting a diagnosis * * * * * * * * * * * * * * *
Do not know 2 * 3 * * * * * * * * * 2 * 3
Other 8 5 13 1 * 2 * * * * * * 9 5 14
Unspecified 18 12 30 1 1 2 * * * 1 3 4 20 15 36
Total 748 881 1 629 80 85 165 23 23 47 90 80 170 941 1 070 2 011
Due to rounding numbers do not necessarily add up to totals. Values based on three or less unweighted cases are considered too small to provide accurate estimates, and values are therefore replaced by asterisks.
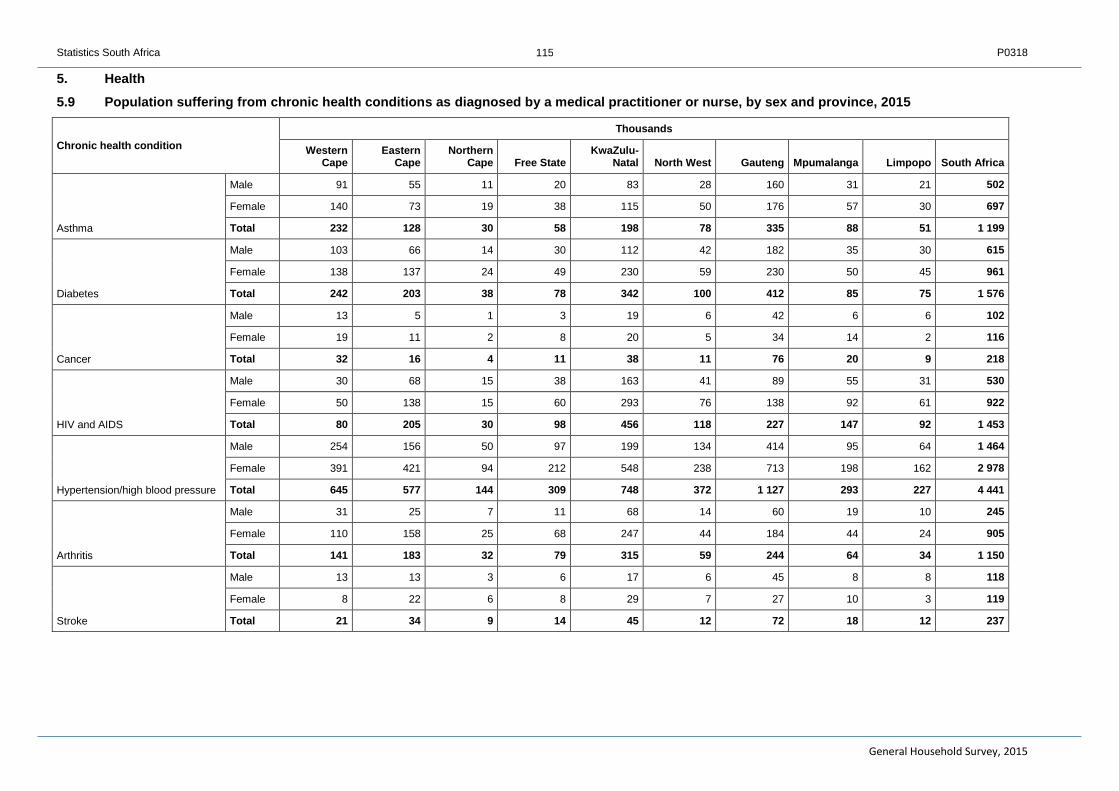
Statistics South Africa P0318
General Household Survey, 2015
115
5. Health
5.9 Population suffering from chronic health conditions as diagnosed by a medical practitioner or nurse, by sex and province, 2015
Chronic health condition
Thousands
Western Cape
Eastern Cape
Northern Cape Free State
KwaZulu-Natal North West Gauteng Mpumalanga Limpopo South Africa
Asthma
Male 91 55 11 20 83 28 160 31 21 502
Female 140 73 19 38 115 50 176 57 30 697
Total 232 128 30 58 198 78 335 88 51 1 199
Diabetes
Male 103 66 14 30 112 42 182 35 30 615
Female 138 137 24 49 230 59 230 50 45 961
Total 242 203 38 78 342 100 412 85 75 1 576
Cancer
Male 13 5 1 3 19 6 42 6 6 102
Female 19 11 2 8 20 5 34 14 2 116
Total 32 16 4 11 38 11 76 20 9 218
HIV and AIDS
Male 30 68 15 38 163 41 89 55 31 530
Female 50 138 15 60 293 76 138 92 61 922
Total 80 205 30 98 456 118 227 147 92 1 453
Hypertension/high blood pressure
Male 254 156 50 97 199 134 414 95 64 1 464
Female 391 421 94 212 548 238 713 198 162 2 978
Total 645 577 144 309 748 372 1 127 293 227 4 441
Arthritis
Male 31 25 7 11 68 14 60 19 10 245
Female 110 158 25 68 247 44 184 44 24 905
Total 141 183 32 79 315 59 244 64 34 1 150
Stroke
Male 13 13 3 6 17 6 45 8 8 118
Female 8 22 6 8 29 7 27 10 3 119
Total 21 34 9 14 45 12 72 18 12 237
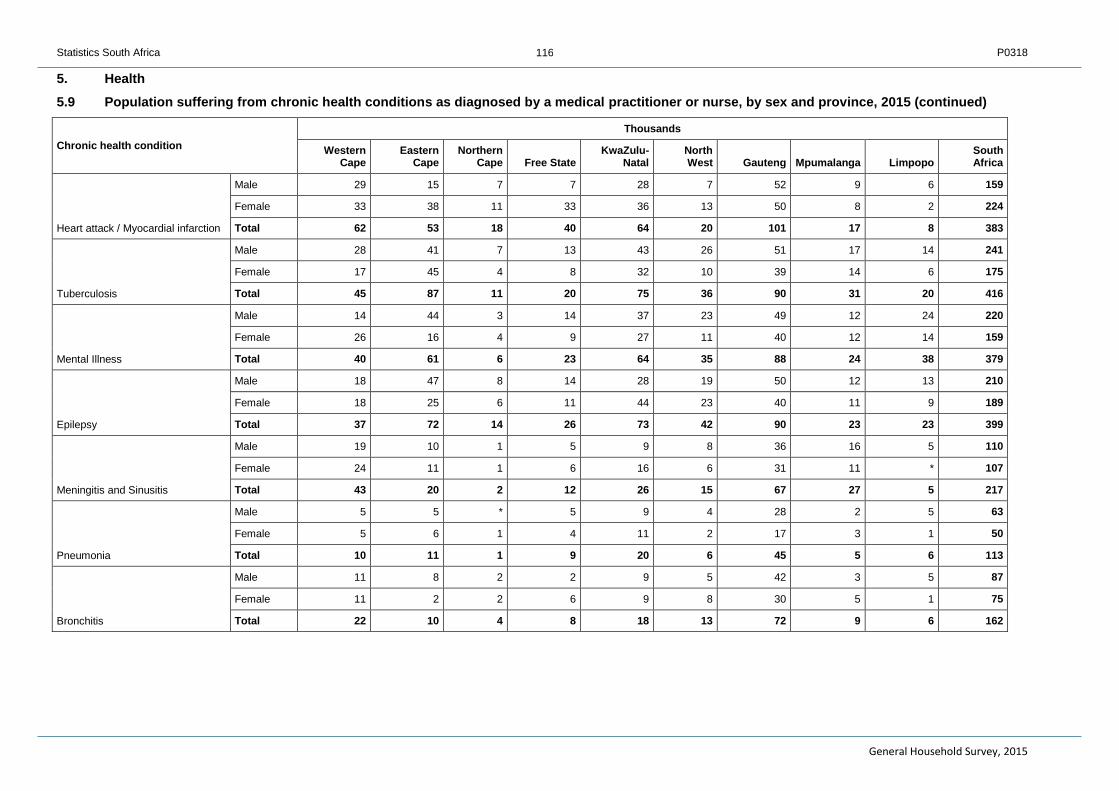
Statistics South Africa P0318
General Household Survey, 2015
116
5. Health
5.9 Population suffering from chronic health conditions as diagnosed by a medical practitioner or nurse, by sex and province, 2015 (continued)
Chronic health condition
Thousands
Western Cape
Eastern Cape
Northern Cape Free State
KwaZulu-Natal
North West Gauteng Mpumalanga Limpopo
South Africa
Heart attack / Myocardial infarction
Male 29 15 7 7 28 7 52 9 6 159
Female 33 38 11 33 36 13 50 8 2 224
Total 62 53 18 40 64 20 101 17 8 383
Tuberculosis
Male 28 41 7 13 43 26 51 17 14 241
Female 17 45 4 8 32 10 39 14 6 175
Total 45 87 11 20 75 36 90 31 20 416
Mental Illness
Male 14 44 3 14 37 23 49 12 24 220
Female 26 16 4 9 27 11 40 12 14 159
Total 40 61 6 23 64 35 88 24 38 379
Epilepsy
Male 18 47 8 14 28 19 50 12 13 210
Female 18 25 6 11 44 23 40 11 9 189
Total 37 72 14 26 73 42 90 23 23 399
Meningitis and Sinusitis
Male 19 10 1 5 9 8 36 16 5 110
Female 24 11 1 6 16 6 31 11 * 107
Total 43 20 2 12 26 15 67 27 5 217
Pneumonia
Male 5 5 * 5 9 4 28 2 5 63
Female 5 6 1 4 11 2 17 3 1 50
Total 10 11 1 9 20 6 45 5 6 113
Bronchitis
Male 11 8 2 2 9 5 42 3 5 87
Female 11 2 2 6 9 8 30 5 1 75
Total 22 10 4 8 18 13 72 9 6 162

Statistics South Africa P0318
General Household Survey, 2015
117
5. Health
5.9 Population suffering from chronic health conditions as diagnosed by a medical practitioner or nurse, by sex and province, 2015 (concluded)
Chronic health condition
Thousands
Western Cape
Eastern Cape
Northern Cape Free State
KwaZulu-Natal
North West Gauteng Mpumalanga Limpopo
South Africa
High Cholesterol
Male 68 8 5 7 20 13 91 14 4 229
Female 77 7 4 5 23 17 62 10 1 207
Total 145 16 9 12 43 30 153 24 5 436
Osteoporosis
Male 7 1 * 1 8 3 26 3 4 53
Female 18 2 2 4 10 4 33 3 * 74
Total 25 3 2 5 17 7 59 6 4 127
Other
Male 31 17 4 20 26 10 65 7 17 199
Female 46 40 11 22 33 12 92 14 10 281
Total 77 58 15 42 59 22 157 21 27 480
Total population
Male 3 038 3 169 563 1 335 5 142 1 840 6 725 2 070 2 701 26 584
Female 3 207 3 523 619 1 428 5 546 1 863 6 543 2 166 2 953 27 849
Total 6 246 6 693 1 182 2 763 10 688 3 703 13 268 4 236 5 654 54 432
Due to rounding numbers do not necessarily add up to totals. Values based on three or less unweighted cases are considered too small to provide accurate estimates, and values are therefore replaced by asterisks.
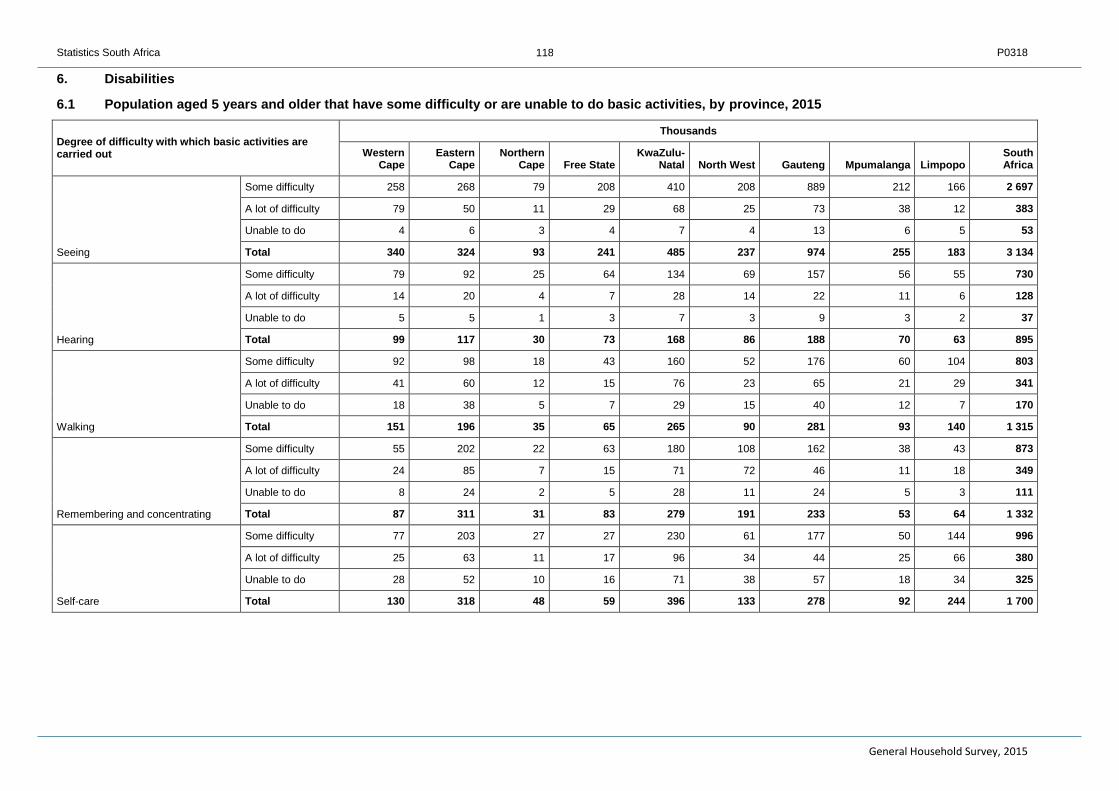
Statistics South Africa P0318
General Household Survey, 2015
118
6. Disabilities
6.1 Population aged 5 years and older that have some difficulty or are unable to do basic activities, by province, 2015
Degree of difficulty with which basic activities are carried out
Thousands
Western Cape
Eastern Cape
Northern Cape Free State
KwaZulu-Natal North West Gauteng Mpumalanga Limpopo
South Africa
Seeing
Some difficulty 258 268 79 208 410 208 889 212 166 2 697
A lot of difficulty 79 50 11 29 68 25 73 38 12 383
Unable to do 4 6 3 4 7 4 13 6 5 53
Total 340 324 93 241 485 237 974 255 183 3 134
Hearing
Some difficulty 79 92 25 64 134 69 157 56 55 730
A lot of difficulty 14 20 4 7 28 14 22 11 6 128
Unable to do 5 5 1 3 7 3 9 3 2 37
Total 99 117 30 73 168 86 188 70 63 895
Walking
Some difficulty 92 98 18 43 160 52 176 60 104 803
A lot of difficulty 41 60 12 15 76 23 65 21 29 341
Unable to do 18 38 5 7 29 15 40 12 7 170
Total 151 196 35 65 265 90 281 93 140 1 315
Remembering and concentrating
Some difficulty 55 202 22 63 180 108 162 38 43 873
A lot of difficulty 24 85 7 15 71 72 46 11 18 349
Unable to do 8 24 2 5 28 11 24 5 3 111
Total 87 311 31 83 279 191 233 53 64 1 332
Self-care
Some difficulty 77 203 27 27 230 61 177 50 144 996
A lot of difficulty 25 63 11 17 96 34 44 25 66 380
Unable to do 28 52 10 16 71 38 57 18 34 325
Total 130 318 48 59 396 133 278 92 244 1 700

Statistics South Africa P0318
General Household Survey, 2015
119
6. Disabilities
6.1 Population aged 5 years and older that have some difficulty or are unable to do basic activities, by province, 2015 (concluded)
Degree of difficulty with which basic activities are carried out
Thousands
Western Cape
Eastern Cape
Northern Cape Free State
KwaZulu-Natal North West Gauteng Mpumalanga Limpopo
South Africa
Communication
Some difficulty 24 40 7 4 71 5 50 6 20 227
A lot of difficulty 6 27 2 5 17 7 13 1 7 85
Unable to do 6 20 2 3 16 6 24 4 4 85
Total 36 87 11 13 103 17 88 11 31 397
Total aged 5 years and older 5 701 5 968 1 064 2 514 9 583 3 320 12 272 3 788 5 022 49 231
Totals exclude the ‘don’t know’ and ‘No difficulty’ options as well as unspecified. Values based on three or less unweighted cases are considered too small to provide accurate estimates, and values are therefore replaced by asterisks. Due to rounding, numbers do not necessarily add up to totals. Only individuals aged five years and older are used for this analysis as children below the age of five years are often mistakenly categorised as being unable to walk, remember, communicate or care for themselves when it is due to their level of development rather than any innate disabilities they might have. These issues are however actively addressed during training of fieldworkers.

Statistics South Africa P0318
General Household Survey, 2015
120
6. Disabilities
6.2 Population aged 5 years and older that have some difficulty, a lot of difficulty or are unable to do basic activities, by population group and sex, 2015
Degree of difficulty with which basic activities are carried out
Thousands
Black African Coloured Indian/Asian White Total
Male Female Total Male Female Total Male Female Total Male Female Total Male Female Total
Seeing
Some difficulty 1 223 756 1 979 128 89 216 42 29 71 230 200 431 1 622 1 075 2 697
A lot of difficulty 169 104 273 28 26 54 8 3 11 22 23 46 227 156 383
Unable to do 18 25 44 1 1 2 * 1 1 4 3 7 24 30 53
Total 1 410 886 2 295 157 115 272 49 33 83 257 226 483 1 872 1 261 3 134
Hearing
Some difficulty 347 208 555 39 26 65 8 9 17 42 51 93 436 294 730
A lot of difficulty 60 38 98 6 4 10 2 * 2 10 7 18 78 50 128
Unable to do 12 15 27 * 3 3 * 1 1 3 3 6 15 22 37
Total 419 261 680 45 33 78 10 10 20 55 62 117 529 366 895
Walking
Some difficulty 389 214 603 45 31 76 13 10 23 57 45 101 504 299 803
A lot of difficulty 155 98 252 18 19 36 2 4 6 26 21 46 200 141 341
Unable to do 61 62 123 8 10 18 2 1 3 18 9 26 89 82 170
Total 605 374 978 71 59 130 18 14 32 100 74 174 793 521 1 315
Remembering and concentrating
Some difficulty 403 327 730 29 25 54 12 12 24 32 32 64 477 395 873
A lot of difficulty 163 142 305 10 16 27 2 2 5 9 4 13 184 165 349
Unable to do 34 52 86 2 4 6 1 1 1 11 6 17 48 63 111
Total 600 521 1 122 42 45 87 15 15 30 52 42 94 709 623 1 332
Self-care
Some difficulty 454 411 866 30 40 70 9 10 19 25 16 41 519 477 996
A lot of difficulty 169 171 340 12 10 22 2 4 6 6 6 12 188 191 380
Unable to do 122 153 275 9 12 21 2 2 4 16 8 24 150 175 325
Total 745 735 1 481 51 62 113 13 16 29 47 30 77 857 843 1 700

Statistics South Africa P0318
General Household Survey, 2015
121
6. Disabilities
6.2 Population aged 5 years and older that have some difficulty, a lot of difficulty or are unable to do basic activities, by population group and sex, 2015 (concluded)
Degree of difficulty with which basic activities are carried out
Thousands
Black African Coloured Indian/Asian White Total
Male Female Total Male Female Total Male Female Total Male Female Total Male Female Total
Communication
Some difficulty 97 95 193 12 6 19 4 2 7 7 1 8 121 106 227
A lot of difficulty 32 43 75 2 3 5 * 1 1 3 2 5 38 48 85
Unable to do 28 39 67 3 3 6 * * * 9 3 12 40 45 85
Total 157 177 335 17 13 30 4 4 8 19 6 25 198 199 397
Total aged 5 years and older 20 125 19 096 39 221 2 302 2 142 4 443 626 639 1 265 2 219 2 083 4 302 25 271 23 959 49 231
Totals exclude the ‘don’t know’ and ‘No difficulty’ options as well as unspecified. Due to rounding, numbers do not necessarily add up to totals. Values based on three or less unweighted cases are considered too small to provide accurate estimates, and values are therefore replaced by asterisks. Only individuals aged five years or older are used for this analysis as children below the age of five years are often mistakenly categorised as being unable to walk, remember, communicate or care for themselves when it is due to their level of development rather than any innate disabilities they might have. These issues are however actively addressed during training of fieldworkers.
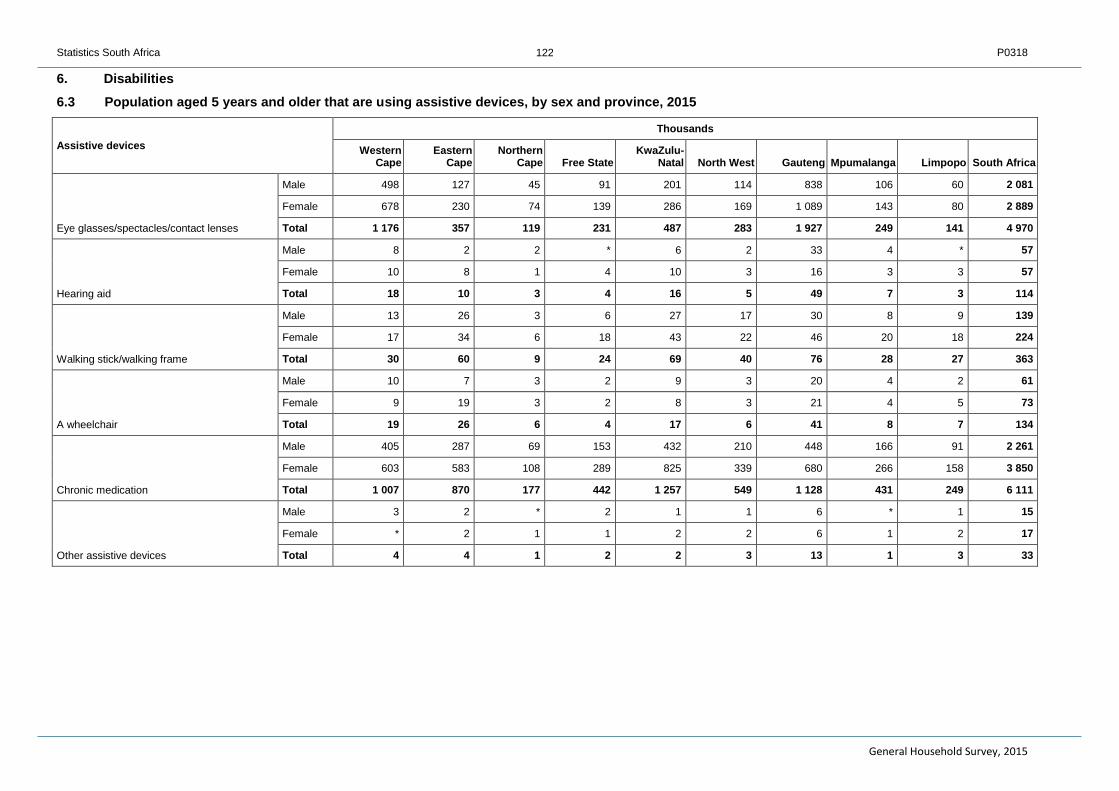
Statistics South Africa P0318
General Household Survey, 2015
122
6. Disabilities
6.3 Population aged 5 years and older that are using assistive devices, by sex and province, 2015
Assistive devices
Thousands
Western Cape
Eastern Cape
Northern Cape Free State
KwaZulu-Natal North West Gauteng Mpumalanga Limpopo South Africa
Eye glasses/spectacles/contact lenses
Male 498 127 45 91 201 114 838 106 60 2 081
Female 678 230 74 139 286 169 1 089 143 80 2 889
Total 1 176 357 119 231 487 283 1 927 249 141 4 970
Hearing aid
Male 8 2 2 * 6 2 33 4 * 57
Female 10 8 1 4 10 3 16 3 3 57
Total 18 10 3 4 16 5 49 7 3 114
Walking stick/walking frame
Male 13 26 3 6 27 17 30 8 9 139
Female 17 34 6 18 43 22 46 20 18 224
Total 30 60 9 24 69 40 76 28 27 363
A wheelchair
Male 10 7 3 2 9 3 20 4 2 61
Female 9 19 3 2 8 3 21 4 5 73
Total 19 26 6 4 17 6 41 8 7 134
Chronic medication
Male 405 287 69 153 432 210 448 166 91 2 261
Female 603 583 108 289 825 339 680 266 158 3 850
Total 1 007 870 177 442 1 257 549 1 128 431 249 6 111
Other assistive devices
Male 3 2 * 2 1 1 6 * 1 15
Female * 2 1 1 2 2 6 1 2 17
Total 4 4 1 2 2 3 13 1 3 33

Statistics South Africa P0318
General Household Survey, 2015
123
6. Disabilities
6.3 Population aged 5 years and older that are using assistive devices, by sex and province, 2015 (concluded)
Assistive devices
Thousands
Western Cape
Eastern Cape
Northern Cape Free State
KwaZulu-Natal North West Gauteng Mpumalanga Limpopo South Africa
Total aged 5 years and older
Male 2 756 2 808 503 1 208 4 587 1 652 6 234 1 837 2 375 23 959
Female 2 945 3 160 561 1 306 4 996 1 667 6 039 1 951 2 647 25 271
Total 5 701 5 968 1 064 2 514 9 583 3 320 12 272 3 788 5 022 49 231
Totals exclude the ‘don’t know’ and ‘No difficulty’ options as well as unspecified. Due to rounding, numbers do not necessarily add up to totals. Only individuals over the age of five years are used for this analysis as children below the age of five years are often mistakenly categorised as being unable to walk, remember, communicate or care for themselves when it is due to their level of development rather than any innate disabilities they might have. These issues are however actively addressed during training of fieldworkers. Values based on three or less unweighted cases are considered too small to provide accurate estimates, and values are therefore replaced by asterisks.
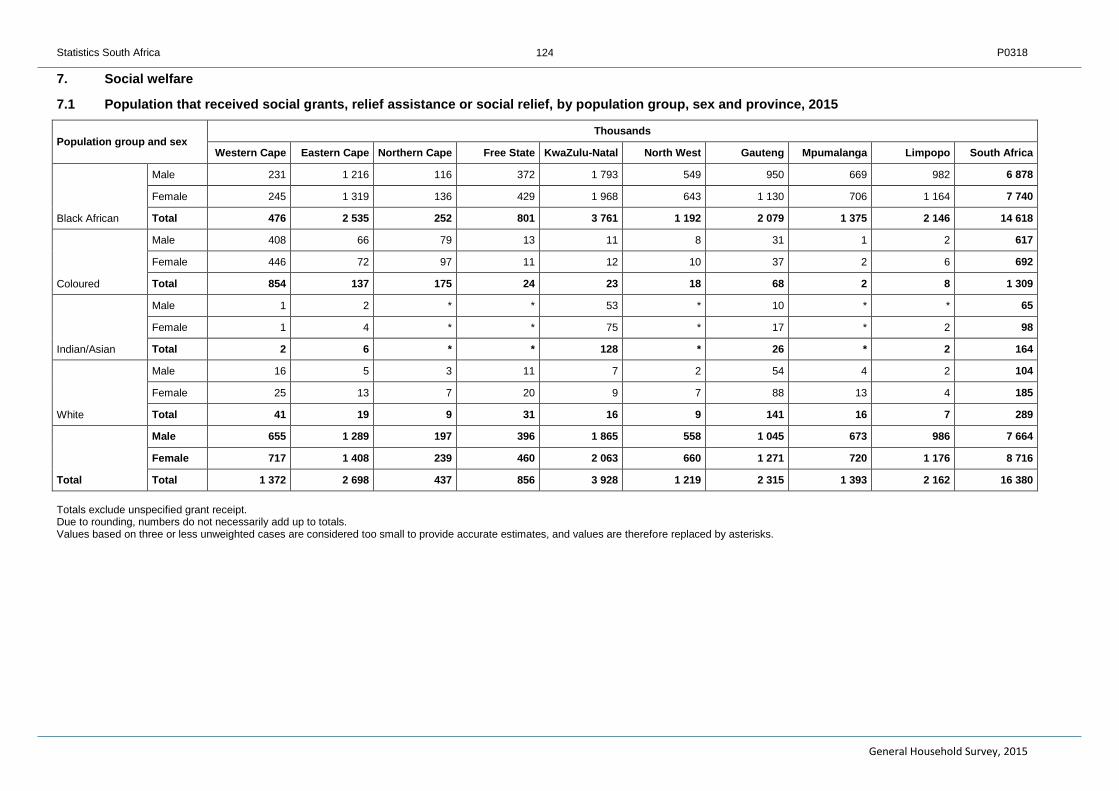
Statistics South Africa P0318
General Household Survey, 2015
124
7. Social welfare
7.1 Population that received social grants, relief assistance or social relief, by population group, sex and province, 2015
Population group and sex Thousands
Western Cape Eastern Cape Northern Cape Free State KwaZulu-Natal North West Gauteng Mpumalanga Limpopo South Africa
Black African
Male 231 1 216 116 372 1 793 549 950 669 982 6 878
Female 245 1 319 136 429 1 968 643 1 130 706 1 164 7 740
Total 476 2 535 252 801 3 761 1 192 2 079 1 375 2 146 14 618
Coloured
Male 408 66 79 13 11 8 31 1 2 617
Female 446 72 97 11 12 10 37 2 6 692
Total 854 137 175 24 23 18 68 2 8 1 309
Indian/Asian
Male 1 2 * * 53 * 10 * * 65
Female 1 4 * * 75 * 17 * 2 98
Total 2 6 * * 128 * 26 * 2 164
White
Male 16 5 3 11 7 2 54 4 2 104
Female 25 13 7 20 9 7 88 13 4 185
Total 41 19 9 31 16 9 141 16 7 289
Total
Male 655 1 289 197 396 1 865 558 1 045 673 986 7 664
Female 717 1 408 239 460 2 063 660 1 271 720 1 176 8 716
Total 1 372 2 698 437 856 3 928 1 219 2 315 1 393 2 162 16 380
Totals exclude unspecified grant receipt. Due to rounding, numbers do not necessarily add up to totals. Values based on three or less unweighted cases are considered too small to provide accurate estimates, and values are therefore replaced by asterisks.

Statistics South Africa P0318
General Household Survey, 2015
125
8. Dwellings and services
8.1 Type of dwelling, by number of rooms in the dwelling
8.1.1 All population groups, 2015
Due to rounding, numbers do not necessarily add up to totals. Values based on three or less unweighted cases are considered too small to provide accurate estimates, and values are therefore replaced by asterisks.
Type of dwelling Thousands
1–3 rooms 4–5 rooms 6+ rooms Unspecified Total
Dwelling/house or brick/concrete block structure on a separate stand or yard or on farm 1 413 3 161 5 584 19 10 177
Traditional dwelling/hut/structure made of traditional materials 378 358 368 2 1 106
Flat or apartment in a block of flats 179 324 134 2 640
Cluster house in complex 5 22 56 * 83
Town house (semi-detached house in complex) 13 92 150 3 259
Semi-detached house 39 115 91 * 245
Dwelling/house/flat/room in backyard 484 29 28 * 541
Informal dwelling/shack in backyard 813 29 5 2 849
Informal dwelling/shack not in backyard 1 200 190 37 1 1 428
Room/flatlet on a property or a larger dwelling servant quarters/granny flat 567 68 17 1 653
Caravan/tent 11 1 1 * 13
Other 108 16 5 1 129
Total 5 210 4 405 6 475 32 16 122

Statistics South Africa P0318
General Household Survey, 2015
126
8. Dwellings and services
8.1 Type of dwelling, by number of rooms in the dwelling
8.1.2 Black African population group, 2015
Type of dwelling Thousands
1–3 rooms 4–5 rooms 6+ rooms Unspecified Total
Dwelling/house or brick/concrete block structure on a separate stand or yard or on farm 1 316 2 755 3 814 12 7 897
Traditional dwelling/hut/structure made of traditional materials 376 358 366 2 1 101
Flat or apartment in a block of flats 164 178 47 1 390
Cluster house in complex 5 6 21 * 32
Town house (semi-detached house in complex) 8 33 51 3 95
Semi-detached house 19 35 19 * 73
Dwelling/house/flat/room in backyard 467 21 26 * 513
Informal dwelling/shack in backyard 774 21 2 2 799
Informal dwelling/shack not in backyard 1 171 182 32 1 1 385
Room/flatlet on a property or a larger dwelling servant quarters/granny flat 540 47 10 1 598
Caravan/tent 10 1 1 * 12
Other 88 11 3 1 103
Total 4 936 3 647 4 391 24 12 998
Due to rounding, numbers do not necessarily add up to totals. Values based on three or less unweighted cases are considered too small to provide accurate estimates, and values are therefore replaced by asterisks.

Statistics South Africa P0318
General Household Survey, 2015
127
8. Dwellings and services
8.1 Type of dwelling, by number of rooms in the dwelling
8.1.3 Other** population groups, 2015
Type of dwelling Thousands
1–3 rooms 4–5 rooms 6+ rooms Unspecified Total
Dwelling/house or brick/concrete block structure on a separate stand or yard or on farm 97 407 1 769 7 2 280
Traditional dwelling/hut/structure made of traditional materials 2 * 3 * 5
Flat or apartment in a block of flats 15 146 88 1 250
Cluster house in complex * 16 35 * 52
Town house (semi-detached house in complex) 6 59 98 * 164
Semi-detached house 20 80 72 * 172
Dwelling/house/flat/room in backyard 17 8 2 * 27
Informal dwelling/shack in backyard 39 8 3 * 50
Informal dwelling/shack not in backyard 29 8 6 * 43
Room/flatlet on a property or a larger dwelling servant quarters/granny flat 27 21 7 * 54
Caravan/tent 1 1 * * 2
Other 20 4 2 * 26
Total 274 758 2 085 8 3 124
Due to rounding, numbers do not necessarily add up to totals. Values based on three or less unweighted cases are considered too small to provide accurate estimates, and values are therefore replaced by asterisks. ** Other includes coloured, Asian/Indian and white.

Statistics South Africa P0318
General Household Survey, 2015
128
8. Dwellings and services
8.2 Type of dwelling of households, by province, 2015
Type of dwelling
Thousands
Western Cape
Eastern Cape
Northern Cape
Free State
KwaZulu-Natal
North West Gauteng
Mpuma-langa Limpopo
South Africa
Dwelling/house or brick/concrete block structure on a separate stand or yard or on farm 1 061 915 254 660 1 643 807 2 672 937 1 229 10 177
Traditional dwelling/hut/structure made of traditional materials 1 481 3 16 486 7 10 58 44 1 106
Flat or apartment in a block of flats 131 43 2 20 134 26 265 11 8 640
Cluster house in complex 11 2 * 1 13 8 47 1 1 83
Town house (semi-detached house in complex) 35 13 1 7 13 11 172 6 * 259
Semi-detached house 153 46 5 12 12 1 14 * 1 245
Dwelling/house/flat/room in backyard 15 15 3 21 45 47 337 19 39 541
Informal dwelling/shack in backyard 123 29 5 52 28 71 486 23 32 849
Informal dwelling/shack not in backyard 182 97 35 92 187 195 481 92 68 1 428
Room/flatlet on a property or a larger dwelling servant quarters/granny flat 30 85 11 21 182 43 112 60 109 653
Caravan/tent 1 * * 1 3 * 6 1 1 13
Other 30 3 2 2 1 * 88 4 * 129
Total 1 775 1 727 320 906 2 747 1 215 4 690 1 211 1 532 16 122
Due to rounding, numbers do not necessarily add up to totals. Values based on three or less unweighted cases are considered too small to provide accurate estimates, and values are therefore replaced by asterisks.

Statistics South Africa P0318
General Household Survey, 2015
129
8. Dwellings and services
8.3 Type of dwelling of households, by main source of water, 2015
Type of dwelling
Thousands
Piped (Tap) water in dwelling
Piped (Tap) water on site or in
yard Borehole
on site Rain-water
tank on site Neighbour's
tap Public
tap
Water-carrier/
Tanker
Borehole off site/
communal
Formal dwelling/house or brick/concrete block structure on a separate stand or yard or on farm 5 712 2 269 210 76 266 993 154 143
Traditional dwelling/hut/structure made of traditional materials 25 201 5 35 38 344 32 39
Flat or apartment in a block of flats 562 56 1 * 6 11 1 1
Cluster house in complex 78 2 * * * 1 1 1
Town house (semi-detached house in complex) 251 2 * * * 3 * *
Semi-detached house 224 19 * * * 2 1 *
Dwelling/house/flat/room in backyard 88 389 14 * 4 18 8 15
Informal dwelling/shack in backyard 91 627 4 * 23 79 15 4
Informal dwelling/shack not in backyard 75 433 13 2 82 718 69 11
Room/flatlet on a property or a larger dwelling servant quarters/granny flat 207 311 13 7 12 63 17 14
Caravan/tent 5 9 * * * * * *
Other 68 36 1 * 1 14 7 1
Total 7 385 4 354 259 120 431 2 247 304 229
Due to rounding, numbers do not necessarily add up to totals. Values based on three or less unweighted cases are considered too small to provide accurate estimates, and values are therefore replaced by asterisks.
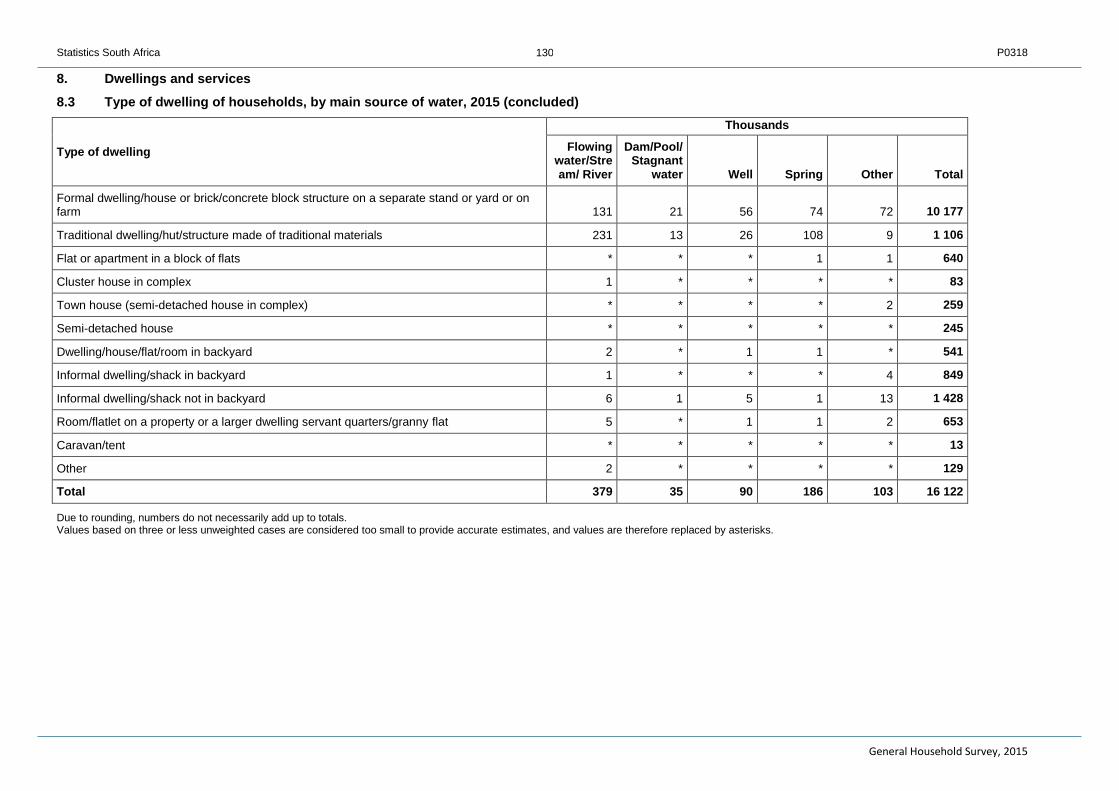
Statistics South Africa P0318
General Household Survey, 2015
130
8. Dwellings and services
8.3 Type of dwelling of households, by main source of water, 2015 (concluded)
Type of dwelling
Thousands
Flowing water/Stream/ River
Dam/Pool/ Stagnant
water Well Spring Other Total
Formal dwelling/house or brick/concrete block structure on a separate stand or yard or on farm 131 21 56 74 72 10 177
Traditional dwelling/hut/structure made of traditional materials 231 13 26 108 9 1 106
Flat or apartment in a block of flats * * * 1 1 640
Cluster house in complex 1 * * * * 83
Town house (semi-detached house in complex) * * * * 2 259
Semi-detached house * * * * * 245
Dwelling/house/flat/room in backyard 2 * 1 1 * 541
Informal dwelling/shack in backyard 1 * * * 4 849
Informal dwelling/shack not in backyard 6 1 5 1 13 1 428
Room/flatlet on a property or a larger dwelling servant quarters/granny flat 5 * 1 1 2 653
Caravan/tent * * * * * 13
Other 2 * * * * 129
Total 379 35 90 186 103 16 122
Due to rounding, numbers do not necessarily add up to totals. Values based on three or less unweighted cases are considered too small to provide accurate estimates, and values are therefore replaced by asterisks.

Statistics South Africa P0318
General Household Survey, 2015
131
8. Dwellings and services
8.4 Households by type of dwelling, by tenure status, 2015
Type of dwelling
Thousands
Rented Rented
from other
Owned, but not yet paid off to
bank /financial
institution
Owned, but not yet paid off to
private lender
Owned and fully paid off
Occupied rent-free Other
Do not know Total
Dwelling/house or brick/concrete block structure on a separate stand or yard or on farm 1 156 122 933 137 6 400 1 233 153 43 10 177
Traditional dwelling/hut/structure made of traditional materials 61 2 3 6 904 115 11 4 1 106
Flat or apartment in a block of flats 374 112 24 4 71 51 5 * 640
Cluster house in complex 29 2 20 6 24 3 * * 83
Town house (semi-detached house in complex) 101 27 57 7 56 5 4 1 259
Semi-detached house 46 16 24 3 122 28 5 1 245
Dwelling/house/flat/room in backyard 410 4 * 1 49 69 8 * 541
Informal dwelling/shack in backyard 591 4 1 3 99 142 6 4 849
Informal dwelling/shack not in backyard 260 6 2 3 746 376 34 1 1 428
Room/flatlet on a property or a larger dwelling servant quarters/granny flat 439 34 3 1 31 130 13 1 653
Caravan/tent 4 1 * * 1 8 * * 13
Other 46 15 * * 9 54 1 4 129
Total 3 519 344 1 067 170 8 510 2 213 240 58 16 122
Due to rounding, numbers do not necessarily add up to totals. Values based on three or less unweighted cases are considered too small to provide accurate estimates, and values are therefore replaced by asterisks.

Statistics South Africa P0318
General Household Survey, 2015
132
8. Dwellings and services
8.5 Tenure status of households, by province, 2015
Province
Thousands
Rented Rented from
other
Owned, but not yet paid off to bank/financial
institution
Owned, but not yet paid off
to private lender
Owned and fully paid off
Occupied rent-free Other Do not know Total
Western Cape 415 84 204 13 798 246 12 4 1 775
Eastern Cape 262 32 66 7 1 073 282 3 3 1 727
Northern Cape 45 5 10 3 205 50 2 * 320
Free State 175 14 37 13 471 180 14 1 906
KwaZulu-Natal 527 33 106 20 1 754 278 19 9 2 747
North West 257 31 35 4 770 107 6 4 1 215
Gauteng 1 443 115 531 93 1 496 815 163 35 4 690
Mpumalanga 180 11 55 10 816 123 14 1 1 211
Limpopo 214 20 23 6 1 127 133 7 1 1 532
South Africa 3 519 344 1 067 170 8 510 2 213 240 58 16 122
Due to rounding, numbers do not necessarily add up to totals. Values based on three or less unweighted cases are considered too small to provide accurate estimates, and values are therefore replaced by asterisks.

Statistics South Africa P0318
General Household Survey, 2015
133
8. Dwellings and services
8.6 Type of ownership of the dwellings of households, by population group and sex of the household head, 2015
Population group and sex
Thousands
Rented Rented from
other
Owned, but not yet paid off to bank/financial
institution
Owned, but not yet paid off to private lender
Owned and fully paid off
Occupied rent-free Other Do not know Total
Black African
Male 2 025 155 326 65 3 460 1 206 118 27 7 381
Female 816 63 132 35 3 699 765 89 17 5 617
Total 2 841 218 458 100 7 159 1 971 207 44 12 998
Coloured
Male 137 21 100 8 289 116 6 2 679
Female 61 37 27 5 254 67 3 2 457
Total 198 58 127 12 544 183 9 4 1 136
Indian/Asian
Male 60 3 62 4 123 10 1 4 268
Female 17 6 14 3 58 2 1 * 101
Total 77 9 77 7 181 12 2 4 369
White
Male 257 40 327 38 414 37 12 6 1 131
Female 146 19 78 13 213 10 9 * 489
Total 403 59 406 51 627 47 22 6 1 619
Total
Male 2 478 220 815 115 4 286 1 369 137 39 9 459
Female 1 041 125 252 55 4 224 844 103 19 6 663
Total 3 519 344 1 067 170 8 510 2 213 240 58 16 122
Due to rounding, numbers do not necessarily add up to totals. Values based on three or less unweighted cases are considered too small to provide accurate estimates, and values are therefore replaced by asterisks.

Statistics South Africa P0318
General Household Survey, 2015
134
8. Dwellings and services
8.7 Type of dwelling of households, by main source of energy
8.7.1 For cooking, 2015
Type of dwelling
Thousands
Electricity from
mains
Electricity from
generator Gas Paraffin Wood Coal Candles Animal
dung Solar
energy Other None Total
Dwelling/house or brick/concrete block structure on a separate stand or yard or on farm 8 592 41 388 154 906 49 12 4 18 4 9 10 177
Traditional dwelling/hut/structure made of traditional materials 513 3 20 105 442 10 * 8 2 1 1 1 106
Flat or apartment in a block of flats 593 11 21 8 3 * 1 * * 1 1 640
Cluster house in complex 76 * 4 * 3 * * * * * * 83
Town house (semi-detached house in complex) 245 1 9 * 1 * 1 * * * 1 259
Semi-detached house 224 * 19 1 * * * * 1 * 1 245
Dwelling/house/flat/room in backyard 390 95 8 8 19 1 3 * 1 13 2 541
Informal dwelling/shack in backyard 559 145 15 89 19 2 2 1 2 12 2 849
Informal dwelling/shack not in backyard 730 61 54 469 87 17 1 1 2 1 4 1 428
Room/flatlet on a property or a larger dwelling servant quarters/granny flat 556 32 11 29 25 * * * * * * 653
Caravan/tent 13 * * * * * * * * * 1 13
Other 106 6 11 2 * * * * 3 1 129
Total 12 597 394 560 867 1 505 80 20 14 27 36 23 16 122
Due to rounding, numbers do not necessarily add up to totals. Values based on three or less unweighted cases are considered too small to provide accurate estimates, and values are therefore replaced by asterisks.
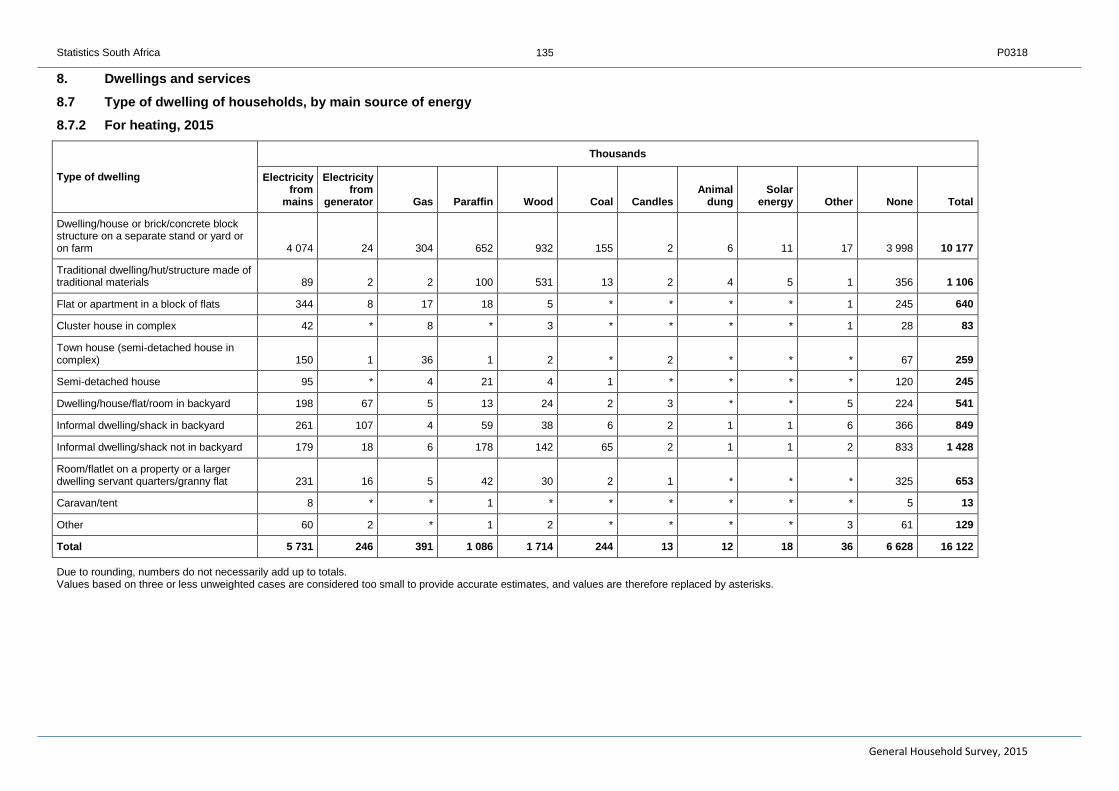
Statistics South Africa P0318
General Household Survey, 2015
135
8. Dwellings and services
8.7 Type of dwelling of households, by main source of energy
8.7.2 For heating, 2015
Type of dwelling
Thousands
Electricity from
mains
Electricity from
generator Gas Paraffin Wood Coal Candles Animal
dung Solar
energy Other None Total
Dwelling/house or brick/concrete block structure on a separate stand or yard or on farm 4 074 24 304 652 932 155 2 6 11 17 3 998 10 177
Traditional dwelling/hut/structure made of traditional materials 89 2 2 100 531 13 2 4 5 1 356 1 106
Flat or apartment in a block of flats 344 8 17 18 5 * * * * 1 245 640
Cluster house in complex 42 * 8 * 3 * * * * 1 28 83
Town house (semi-detached house in complex) 150 1 36 1 2 * 2 * * * 67 259
Semi-detached house 95 * 4 21 4 1 * * * * 120 245
Dwelling/house/flat/room in backyard 198 67 5 13 24 2 3 * * 5 224 541
Informal dwelling/shack in backyard 261 107 4 59 38 6 2 1 1 6 366 849
Informal dwelling/shack not in backyard 179 18 6 178 142 65 2 1 1 2 833 1 428
Room/flatlet on a property or a larger dwelling servant quarters/granny flat 231 16 5 42 30 2 1 * * * 325 653
Caravan/tent 8 * * 1 * * * * * * 5 13
Other 60 2 * 1 2 * * * * 3 61 129
Total 5 731 246 391 1 086 1 714 244 13 12 18 36 6 628 16 122
Due to rounding, numbers do not necessarily add up to totals. Values based on three or less unweighted cases are considered too small to provide accurate estimates, and values are therefore replaced by asterisks.

Statistics South Africa P0318
General Household Survey, 2015
136
8. Dwellings and services
8.7 Type of dwelling of households, by main source of energy
8.7.3 For lighting, 2015
Type of dwelling
Thousands
Electricity from mains
Electricity from
generator Gas Paraffin Wood Coal Candles Solar
energy Other None Total
Dwelling/house or brick/concrete block structure on a separate stand or yard or on farm 9 768 37 6 53 15 2 263 20 3 7 10 177
Traditional dwelling/hut/structure made of traditional materials 775 11 * 61 5 * 233 22 * * 1 106
Flat or apartment in a block of flats 611 9 * 3 * * 10 2 1 2 640
Cluster house in complex 82 * * * * * 1 * * * 83
Town house (semi-detached house in complex) 257 1 * * * * * * * * 259
Semi-detached house 244 * * * * * 1 * * * 245
Dwelling/house/flat/room in backyard 413 94 * 2 * * 17 1 13 1 541
Informal dwelling/shack in backyard 586 146 2 20 2 * 73 4 13 3 849
Informal dwelling/shack not in backyard 789 73 3 153 4 * 384 18 2 3 1 428
Room/flatlet on a property or a larger dwelling servant quarters/granny flat 585 32 * 6 * * 27 1 * 1 653
Caravan/tent 13 * * * * * 1 * * * 13
Other 116 6 * 3 * * * * 3 1 129
Total 14 239 410 11 302 26 2 1 009 68 36 17 16 122
Due to rounding, numbers do not necessarily add up to totals. Values based on three or less unweighted cases are considered too small to provide accurate estimates, and values are therefore replaced by asterisks.
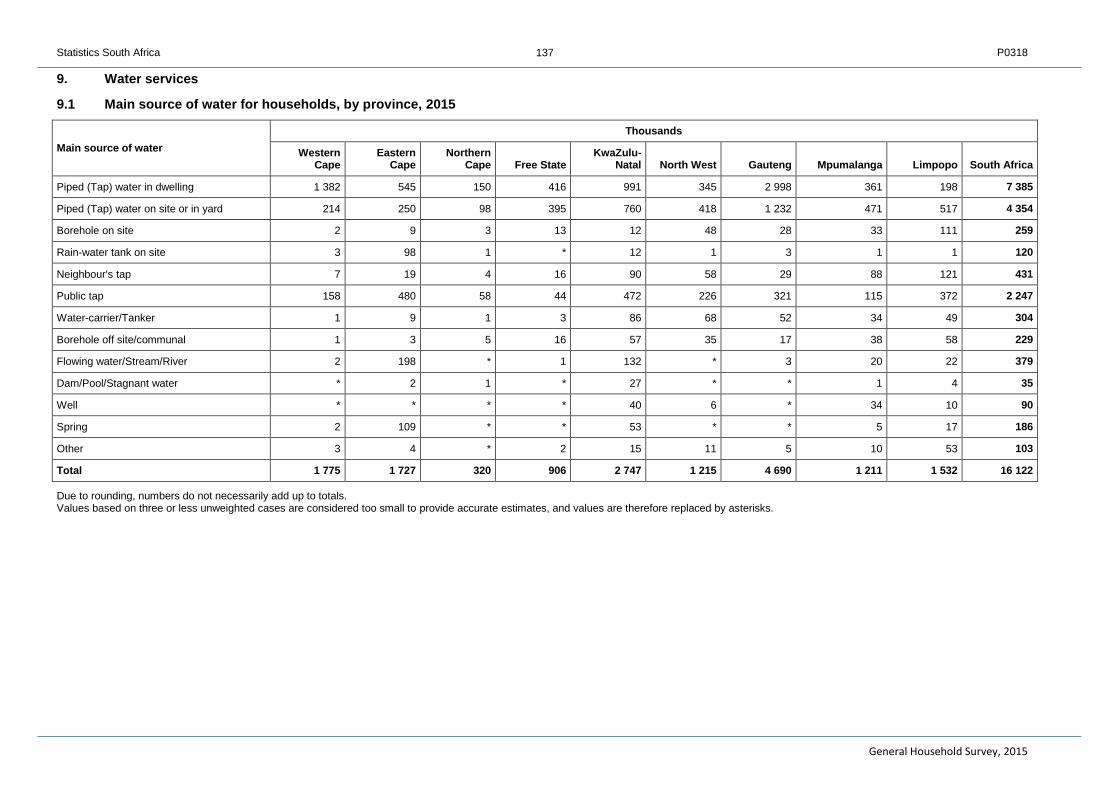
Statistics South Africa P0318
General Household Survey, 2015
137
9. Water services
9.1 Main source of water for households, by province, 2015
Main source of water
Thousands
Western Cape
Eastern Cape
Northern Cape Free State
KwaZulu-Natal North West Gauteng Mpumalanga Limpopo South Africa
Piped (Tap) water in dwelling 1 382 545 150 416 991 345 2 998 361 198 7 385
Piped (Tap) water on site or in yard 214 250 98 395 760 418 1 232 471 517 4 354
Borehole on site 2 9 3 13 12 48 28 33 111 259
Rain-water tank on site 3 98 1 * 12 1 3 1 1 120
Neighbour's tap 7 19 4 16 90 58 29 88 121 431
Public tap 158 480 58 44 472 226 321 115 372 2 247
Water-carrier/Tanker 1 9 1 3 86 68 52 34 49 304
Borehole off site/communal 1 3 5 16 57 35 17 38 58 229
Flowing water/Stream/River 2 198 * 1 132 * 3 20 22 379
Dam/Pool/Stagnant water * 2 1 * 27 * * 1 4 35
Well * * * * 40 6 * 34 10 90
Spring 2 109 * * 53 * * 5 17 186
Other 3 4 * 2 15 11 5 10 53 103
Total 1 775 1 727 320 906 2 747 1 215 4 690 1 211 1 532 16 122
Due to rounding, numbers do not necessarily add up to totals. Values based on three or less unweighted cases are considered too small to provide accurate estimates, and values are therefore replaced by asterisks.

Statistics South Africa P0318
General Household Survey, 2015
138
9. Water services
9.2 Households by main source of water, by population group of the household head, 2015
Main source of water Thousands
Black African Coloured Indian/Asian White Total
Piped (Tap) water in dwelling 4 548 943 350 1 544 7 385
Piped (Tap) water on site or in yard 4 189 145 11 10 4 354
Borehole on site 215 6 * 38 259
Rain-water tank on site 114 3 * 2 120
Neighbour's tap 423 5 2 1 431
Public tap 2 217 24 3 2 2 247
Water-carrier/Tanker 300 2 1 * 304
Borehole off site/communal 209 1 1 18 229
Flowing water/Stream/River 378 1 * * 379
Dam/Pool/Stagnant water 34 1 * * 35
Well 89 * * 1 90
Spring 184 * * 2 186
Other 97 3 1 2 103
Total 12 998 1 136 369 1 619 16 122
Due to rounding, numbers do not necessarily add up to totals. Values based on three or less unweighted cases are considered too small to provide accurate estimates, and values are therefore replaced by asterisks.

Statistics South Africa P0318
General Household Survey, 2015
139
9. Water services
9.3 Households whose main source of water was supplied by the local municipality, by province, 2015
Main source of water supplied by local municipality
Thousands
Western Cape
Eastern Cape
Northern Cape Free State KwaZulu-Natal North West Gauteng Mpumalanga Limpopo
South Africa
Yes 1 677 1 230 294 838 2 207 855 4 505 972 1 024 13 603
No 95 489 26 62 451 280 110 224 488 2 225
Do not know 1 1 * 2 82 73 52 9 15 235
Unspecified 1 7 1 3 7 7 23 6 5 58
Total 1 775 1 727 320 906 2 747 1 215 4 690 1 211 1 532 16 122
Due to rounding, numbers do not necessarily add up to totals. Values based on three or less unweighted cases are considered too small to provide accurate estimates, and values are therefore replaced by asterisks.

Statistics South Africa P0318
General Household Survey, 2015
140
9. Water services
9.4 Households whose main source of water was supplied by the local municipality, by population group and sex of the household head, 2015
Main source of water supplied by local municipality
Thousands
Black African Coloured Indian/Asian White Total
Male Female Total Male Female Total Male Female Total Male Female Total Male Female Total
Yes 6 136 4 551 10 688 612 441 1 052 261 101 362 1 038 463 1 501 8 047 5 556 13 603
No 1 075 957 2 031 64 16 80 2 * 2 87 25 112 1 228 997 2 225
Do not know 141 89 230 2 * 2 1 * 1 3 * 3 147 89 235
Unspecified 29 20 49 2 * 2 3 * 3 3 1 4 37 21 58
Total 7 381 5 617 12 998 679 457 1 136 268 101 369 1 131 489 1 619 9 459 6 663 16 122
Due to rounding, numbers do not necessarily add up to totals. Values based on three or less unweighted cases are considered too small to provide accurate estimates, and values are therefore replaced by asterisks.
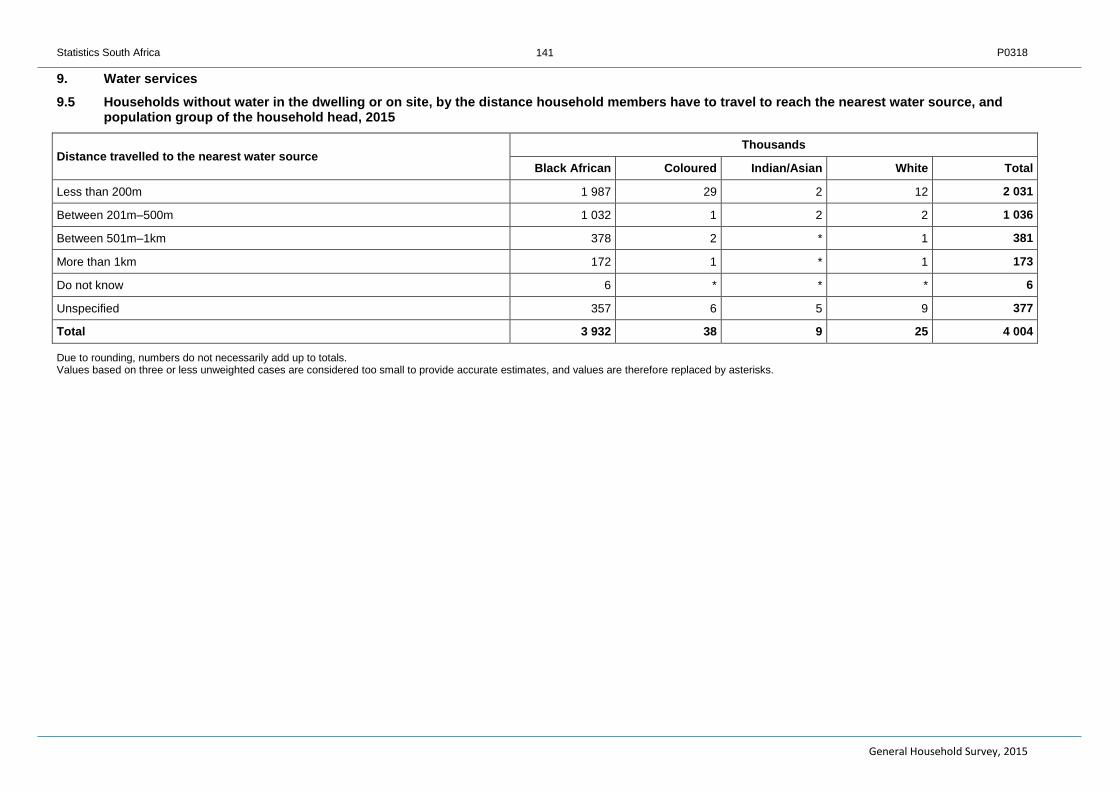
Statistics South Africa P0318
General Household Survey, 2015
141
9. Water services
9.5 Households without water in the dwelling or on site, by the distance household members have to travel to reach the nearest water source, and population group of the household head, 2015
Distance travelled to the nearest water source Thousands
Black African Coloured Indian/Asian White Total
Less than 200m 1 987 29 2 12 2 031
Between 201m–500m 1 032 1 2 2 1 036
Between 501m–1km 378 2 * 1 381
More than 1km 172 1 * 1 173
Do not know 6 * * * 6
Unspecified 357 6 5 9 377
Total 3 932 38 9 25 4 004
Due to rounding, numbers do not necessarily add up to totals. Values based on three or less unweighted cases are considered too small to provide accurate estimates, and values are therefore replaced by asterisks.

Statistics South Africa P0318
General Household Survey, 2015
142
9. Water services
9.6 Households’ perceptions of water quality, per province, 2015
Perceptions of water quality
Thousands
Western Cape
Eastern Cape
KwaZulu-Natal
Northern Cape Free State North West Gauteng Mpumalanga Limpopo South Africa
Safe to drink
Yes 1 745 1 427 286 791 2 488 1 102 4 570 996 1 439 14 845
No 29 295 33 111 250 109 90 200 86 1 205
Unspecified 1 5 1 3 8 4 29 15 7 72
Total 1 775 1 727 320 906 2 747 1 215 4 690 1 211 1 532 16 122
Clear
Yes 1 722 1 495 279 742 2 491 1 077 4 562 988 1 429 14 784
No 51 226 41 162 247 134 104 208 97 1 271
Unspecified 2 6 * 2 8 4 24 14 6 66
Total 1 775 1 727 320 906 2 747 1 215 4 690 1 211 1 532 16 122
Good in taste
Yes 1 723 1 386 284 785 2 483 1 077 4 564 981 1 360 14 643
No 50 334 36 120 253 136 106 212 166 1 413
Unspecified 2 8 * 1 10 2 20 17 7 66
Total 1 775 1 727 320 906 2 747 1 215 4 690 1 211 1 532 16 122
Free from bad smells
Yes 1 718 1 543 298 769 2 500 1 092 4 569 1 022 1 433 14 945
No 54 176 21 135 234 116 94 173 94 1 097
Unspecified 2 8 * 2 12 7 27 16 6 81
Total 1 775 1 727 320 906 2 747 1 215 4 690 1 211 1 532 16 122
Due to rounding, numbers do not necessarily add up to totals. Values based on three or less unweighted cases are considered too small to provide accurate estimates, and values are therefore replaced by asterisks.

Statistics South Africa P0318
General Household Survey, 2015
143
10. Communication
10.1 Households’ ownership of a cellular phone, by population group and sex of the household head, 2015
Population group and sex of household head Thousands
Yes No Unspecified Total
Black African
Male 7 091 283 7 7 381
Female 5 423 191 3 5 617
Total 12 514 474 9 12 998
Coloured
Male 628 51 1 679
Female 418 39 * 457
Total 1 045 90 1 1 136
Indian/Asian
Male 264 3 1 268
Female 98 3 * 101
Total 363 6 1 369
White
Male 1 128 3 * 1 131
Female 484 4 * 489
Total 1 612 7 * 1 619
Total
Male 9 110 340 8 9 459
Female 6 423 237 3 6 663
Total 15 534 577 11 16 122
Due to rounding, numbers do not necessarily add up to totals. Values based on three or less unweighted cases are considered too small to provide accurate estimates, and values are therefore replaced by asterisks.

Statistics South Africa P0318
General Household Survey, 2015
144
10. Communication
10.2 Households’ ownership of a cellular phone, by province, 2015
Cell phone Thousands
Western Cape Eastern Cape Northern Cape Free State KwaZulu-Natal North West Gauteng Mpumalanga Limpopo South Africa
Yes 1 692 1 605 284 859 2 661 1 155 4 609 1 185 1 484 15 534
No 81 121 36 46 85 60 76 24 48 577
Unspecified 1 1 * 1 1 1 5 2 1 11
Total 1 775 1 727 320 906 2 747 1 215 4 690 1 211 1 532 16 122
Due to rounding, numbers do not necessarily add up to totals. Values based on three or less unweighted cases are considered too small to provide accurate estimates, and values are therefore replaced by asterisks.

Statistics South Africa P0318
General Household Survey, 2015
145
10. Communication
10.3 Households with connection of a landline phone, by population group and sex of the household head, 2015
Population group and sex of household head Thousands
Yes No Unspecified Total
Black African
Male 327 6 987 67 7 381
Female 205 5 354 57 5 617
Total 532 12 341 124 12 998
Coloured
Male 133 543 3 679
Female 75 381 1 457
Total 209 924 3 1 136
Indian/Asian
Male 143 120 4 268
Female 50 51 * 101
Total 194 171 4 369
White
Male 591 536 4 1 131
Female 239 243 6 489
Total 830 779 10 1 619
Total
Male 1 194 8 187 78 9 459
Female 570 6 029 64 6 663
Total 1 764 14 215 142 16 122
Due to rounding, numbers do not necessarily add up to totals. Values based on three or less unweighted cases are considered too small to provide accurate estimates, and values are therefore replaced by asterisks.

Statistics South Africa P0318
General Household Survey, 2015
146
10. Communication
10.4 Households’ ownership of a landline phone, by province, 2015
Ownership of a landline phone
Thousands
Western Cape Eastern Cape
Northern Cape Free State
KwaZulu-Natal North West Gauteng Mpumalanga Limpopo South Africa
Yes 466 102 35 55 298 66 657 43 42 1 764
No 1 299 1 613 284 848 2 429 1 137 3 979 1 148 1 478 14 215
Unspecified 9 13 1 3 19 12 54 20 12 142
Total 1 775 1 727 320 906 2 747 1 215 4 690 1 211 1 532 16 122
Due to rounding, numbers do not necessarily add up to totals. Values based on three or less unweighted cases are considered too small to provide accurate estimates, and values are therefore replaced by asterisks.
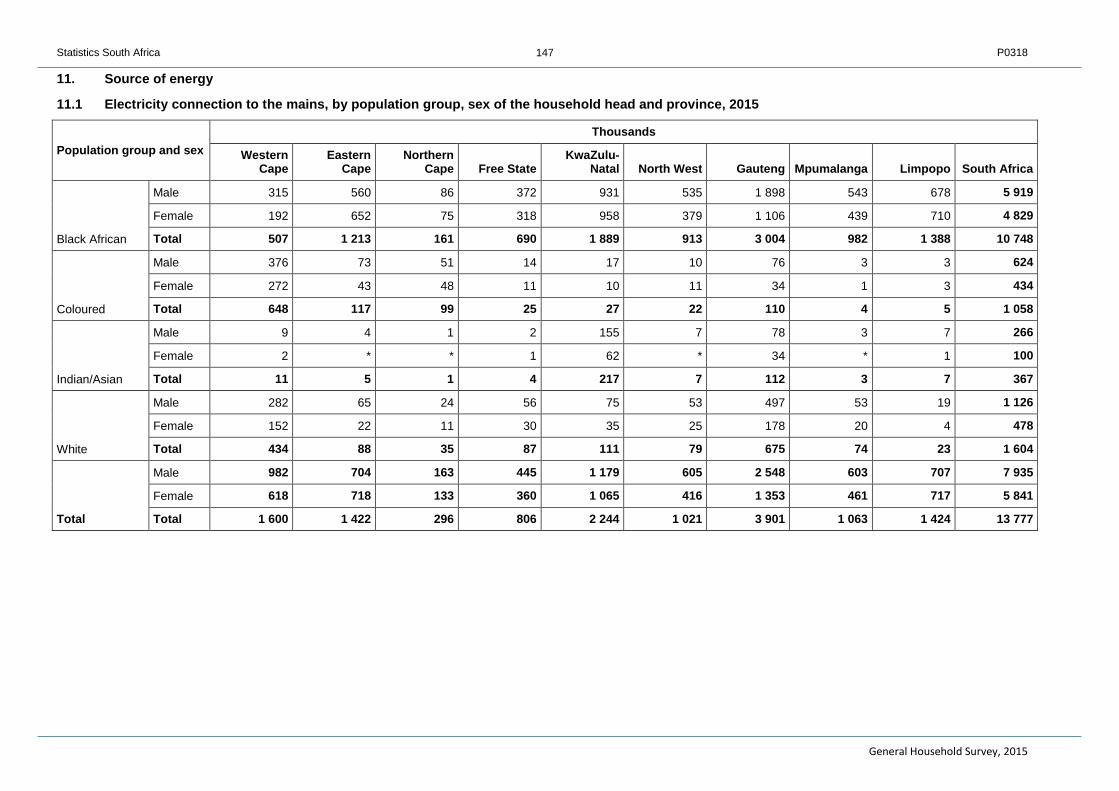
Statistics South Africa P0318
General Household Survey, 2015
147
11. Source of energy
11.1 Electricity connection to the mains, by population group, sex of the household head and province, 2015
Population group and sex
Thousands
Western Cape
Eastern Cape
Northern Cape Free State
KwaZulu-Natal North West Gauteng Mpumalanga Limpopo South Africa
Black African
Male 315 560 86 372 931 535 1 898 543 678 5 919
Female 192 652 75 318 958 379 1 106 439 710 4 829
Total 507 1 213 161 690 1 889 913 3 004 982 1 388 10 748
Coloured
Male 376 73 51 14 17 10 76 3 3 624
Female 272 43 48 11 10 11 34 1 3 434
Total 648 117 99 25 27 22 110 4 5 1 058
Indian/Asian
Male 9 4 1 2 155 7 78 3 7 266
Female 2 * * 1 62 * 34 * 1 100
Total 11 5 1 4 217 7 112 3 7 367
White
Male 282 65 24 56 75 53 497 53 19 1 126
Female 152 22 11 30 35 25 178 20 4 478
Total 434 88 35 87 111 79 675 74 23 1 604
Total
Male 982 704 163 445 1 179 605 2 548 603 707 7 935
Female 618 718 133 360 1 065 416 1 353 461 717 5 841
Total 1 600 1 422 296 806 2 244 1 021 3 901 1 063 1 424 13 777

Statistics South Africa P0318
General Household Survey, 2015
148
11.2 Source of energy
11.2 Main source of energy used by households, by province
11.2.1 For cooking, 2015
Energy for cooking
Thousands
Western Cape
Eastern Cape
Northern Cape Free State
KwaZulu-Natal North West Gauteng Mpumalanga Limpopo
South Africa
Electricity from mains 1 516 1 263 275 787 2 104 977 3 856 899 921 12 597
Electricity from generator 31 12 1 1 39 51 249 2 7 394
Gas 179 73 17 35 59 22 137 17 21 560
Paraffin 26 174 10 45 100 72 363 47 29 867
Wood 13 192 14 25 419 89 25 193 536 1 505
Coal 1 1 1 7 11 * 5 47 7 80
Candles 1 1 * 1 4 1 8 1 2 20
Animal dung * 9 * 2 1 1 * 1 * 14
Solar energy 2 2 1 1 5 * 5 2 8 27
Other * * * * 3 1 32 1 * 36
None 6 * 1 1 1 2 9 2 1 23
Total 1 775 1 727 320 906 2 747 1 215 4 690 1 211 1 532 16 122
Totals exclude households that did not specify electricity connections. Due to rounding, numbers do not necessarily add up to totals. Values based on three or less unweighted cases are considered too small to provide accurate estimates, and values are therefore replaced by asterisks.

Statistics South Africa P0318
General Household Survey, 2015
149
11. Source of energy
11.2 Main source of energy used by households, by province
11.2.2 For heating, 2015
Energy for heating
Thousands
Western Cape
Eastern Cape
Northern Cape Free State
KwaZulu-Natal North West Gauteng Mpumalanga Limpopo
South Africa
Electricity from mains 533 261 124 323 755 367 2 467 458 444 5 731
Electricity from generator 6 6 * * 6 31 197 1 * 246
Gas 56 30 7 44 15 7 205 23 4 391
Paraffin 159 529 10 207 28 17 127 4 6 1 086
Wood 83 381 53 83 447 105 101 152 309 1 714
Coal 2 2 1 22 16 4 100 93 5 244
Candles * 1 * 1 4 1 6 1 * 13
Animal dung * 4 1 2 4 1 * 1 * 12
Solar energy 1 3 1 1 5 * 5 1 3 18
Other 1 1 * 1 2 * 30 1 * 36
None 934 509 124 222 1 465 683 1 452 476 763 6 628
Total 1 775 1 727 320 906 2 747 1 215 4 690 1 211 1 532 16 122
Totals exclude households that did not specify electricity connections. Due to rounding, numbers do not necessarily add up to totals. Values based on three or less unweighted cases are considered too small to provide accurate estimates, and values are therefore replaced by asterisks.

Statistics South Africa P0318
General Household Survey, 2015
150
11. Source of energy
11.2 Main source of energy used by households, by province
11.2.3 For lighting, 2015
Energy for lighting
Thousands
Western Cape Eastern Cape Northern
Cape Free State KwaZulu-
Natal North West Gauteng Mpumalanga Limpopo South Africa
Electricity from mains 1 700 1 460 296 836 2 357 1 055 4 003 1 095 1 437 14 239
Electricity from generator 34 18 1 1 48 51 245 4 8 410
Gas 1 * * 1 5 1 2 * * 11
Paraffin 12 130 5 14 11 19 91 12 9 302
Wood * 3 1 1 10 1 5 1 5 26
Coal * * * * * * 1 1 * 2
Candles 22 93 14 47 298 86 286 96 66 1 009
Solar energy 4 22 2 5 12 1 16 1 3 68
Other * * * * 1 1 33 * 1 36
None 2 * * * 4 1 6 1 3 17
Total 1 775 1 727 320 906 2 747 1 215 4 690 1 211 1 532 16 122
Totals exclude households that did not specify electricity connections. Due to rounding, numbers do not necessarily add up to totals. Values based on three or less unweighted cases are considered too small to provide accurate estimates, and values are therefore replaced by asterisks.

Statistics South Africa P0318
General Household Survey, 2015
151
11. Source of energy
11.3 Main source of energy used by households, by population group of the household head
11.3.1 For cooking, 2015
Energy for cooking Thousands
Black African Coloured Indian/Asian White Total
Electricity from mains 9 838 1 011 342 1 406 12 597
Electricity from generator 362 16 * 15 394
Gas 280 74 19 188 560
Paraffin 856 9 1 1 867
Wood 1 483 18 2 2 1 505
Coal 78 2 * * 80
Candles 16 1 2 1 20
Animal dung 14 * * * 14
Solar energy 21 2 1 2 27
Other 36 * * * 36
None 14 3 1 5 23
Total 12 998 1 136 369 1 619 16 122
Totals exclude households that did not specify electricity connections. Due to rounding, numbers do not necessarily add up to totals. Values based on three or less unweighted cases are considered too small to provide accurate estimates, and values are therefore replaced by asterisks.

Statistics South Africa P0318
General Household Survey, 2015
152
11. Source of energy
11.3 Main source of energy used by households, by population group of the household head
11.3.2 For heating, 2015
Energy for heating Thousands
Black African Coloured Indian/Asian White Total
Electricity from mains 4 117 483 222 910 5 731
Electricity from generator 233 8 * 5 246
Gas 191 16 15 170 391
Paraffin 1 066 17 * 3 1 086
Wood 1 589 70 6 49 1 714
Coal 239 3 * 3 244
Candles 11 * 1 2 13
Animal dung 12 * * * 12
Solar energy 13 * * 5 18
Other 26 1 1 8 36
None 5 501 539 123 466 6 628
Total 12 998 1 136 369 1 619 16 122
Due to rounding, numbers do not necessarily add up to totals. Values based on three or less unweighted cases are considered too small to provide accurate estimates, and values are therefore replaced by asterisks.

Statistics South Africa P0318
General Household Survey, 2015
153
11. Source of energy
11.3 Main source of energy used by households, by population group of the household head
11.3.3 For lighting, 2015
Energy for lighting Thousands
Black African Coloured Indian/Asian White Total
Electricity from mains 11 188 1 085 365 1 602 14 239
Electricity from generator 382 17 * 11 410
Gas 10 * * 1 11
Paraffin 299 3 * 1 302
Wood 26 * * * 26
Coal 2 * * * 2
Candles 981 28 1 1 1 009
Solar energy 61 2 2 2 68
Other 36 * * * 36
None 14 1 1 1 17
Total 12 998 1 136 369 1 619 16 122
Due to rounding, numbers do not necessarily add up to totals. Values based on three or less unweighted cases are considered too small to provide accurate estimates, and values are therefore replaced by asterisks.

Statistics South Africa P0318
General Household Survey, 2015
154
12. Sanitation
12.1 Sanitation facility used by households, by province, 2015
Type of sanitation facility
Thousands
Western Cape
Eastern Cape
Northern Cape Free State
KwaZulu-Natal
North West Gauteng Mpumalanga Limpopo
South Africa
Flush toilet connected to a public sewerage system 1 591 703 210 642 1 164 484 4 083 459 305 9 641
Flush toilet connected to a septic tank 61 44 18 13 117 68 49 66 80 516
Chemical toilet 1 2 * * 14 1 25 1 1 45
Pit latrine/toilet with ventilation pipe 2 660 31 79 833 253 118 270 436 2 680
Pit latrine/toilet without ventilation pipe 5 173 36 111 465 322 288 343 600 2 343
Bucket toilet (collected by municipality) 57 9 5 17 7 2 46 * 1 144
Bucket toilet (emptied by household) 14 3 2 7 3 2 3 1 1 36
Ecological sanitation systems 14 1 1 1 1 2 4 6 1 30
None 28 120 16 33 119 78 25 61 100 580
Other 2 7 1 2 11 1 26 3 1 53
Unspecified 1 6 * 1 13 4 22 2 7 55
Total 1 775 1 727 320 906 2 747 1 215 4 690 1 211 1 532 16 122
Due to rounding, numbers do not necessarily add up to totals. Values based on three or less unweighted cases are considered too small to provide accurate estimates, and values are therefore replaced by asterisks.

Statistics South Africa P0318
General Household Survey, 2015
155
12. Sanitation
12.2 Sanitation facility used by households, by population group of the household head, 2015
Type of sanitation facility Thousands
Black African Coloured Indian/Asian White Total
Flush toilet connected to a public sewerage system 6 738 1 019 351 1 533 9 641
Flush toilet connected to a septic tank 376 53 7 79 516
Chemical toilet 43 1 * 1 45
Pit latrine/toilet with ventilation pipe 2 659 15 5 1 2 680
Pit latrine/toilet without ventilation pipe 2 325 14 3 1 2 343
Bucket toilet (collected by municipality) 139 4 * 1 144
Bucket toilet (emptied by household) 26 9 * 1 36
Ecological sanitation systems 22 5 * 3 30
None 566 14 * * 580
Other 51 1 1 1 53
Unspecified 51 2 2 * 55
Total 12 998 1 136 369 1 619 16 122
Due to rounding, numbers do not necessarily add up to totals. Values based on three or less unweighted cases are considered too small to provide accurate estimates, and values are therefore replaced by asterisks.

Statistics South Africa P0318
General Household Survey, 2015
156
12. Sanitation
12.3 Sanitation facility used by households, by type of dwelling, 2015
Type of sanitation facility
Thousands
Dwelling/house or brick/concrete
block structure on a separate
stand or yard or on farm
Traditional dwelling/
hut/structure made of
traditional materials
Flat or apartment in a block of flats
Cluster house in complex
Town house (semi-detached
house in complex)
Semi-detached house
Flush toilet connected to a public sewerage system 6 462 33 610 77 254 234
Flush toilet connected to a septic tank 359 4 6 1 2 11
Chemical toilet 9 9 * * * *
Pit latrine/toilet with ventilation pipe 1 608 697 8 2 1 *
Pit latrine/toilet without ventilation pipe 1 434 223 8 1 * *
Bucket toilet (collected by municipality) 19 * * 1 * *
Bucket toilet (emptied by household) 12 1 1 * * *
Ecological sanitation systems 13 * * * * *
None 220 132 5 1 * *
Other 15 1 * * * *
Unspecified 27 6 1 * 2 *
Total 10 177 1 106 640 83 259 245
Due to rounding, numbers do not necessarily add up to totals. Values based on three or less unweighted cases are considered too small to provide accurate estimates, and values are therefore replaced by asterisks.
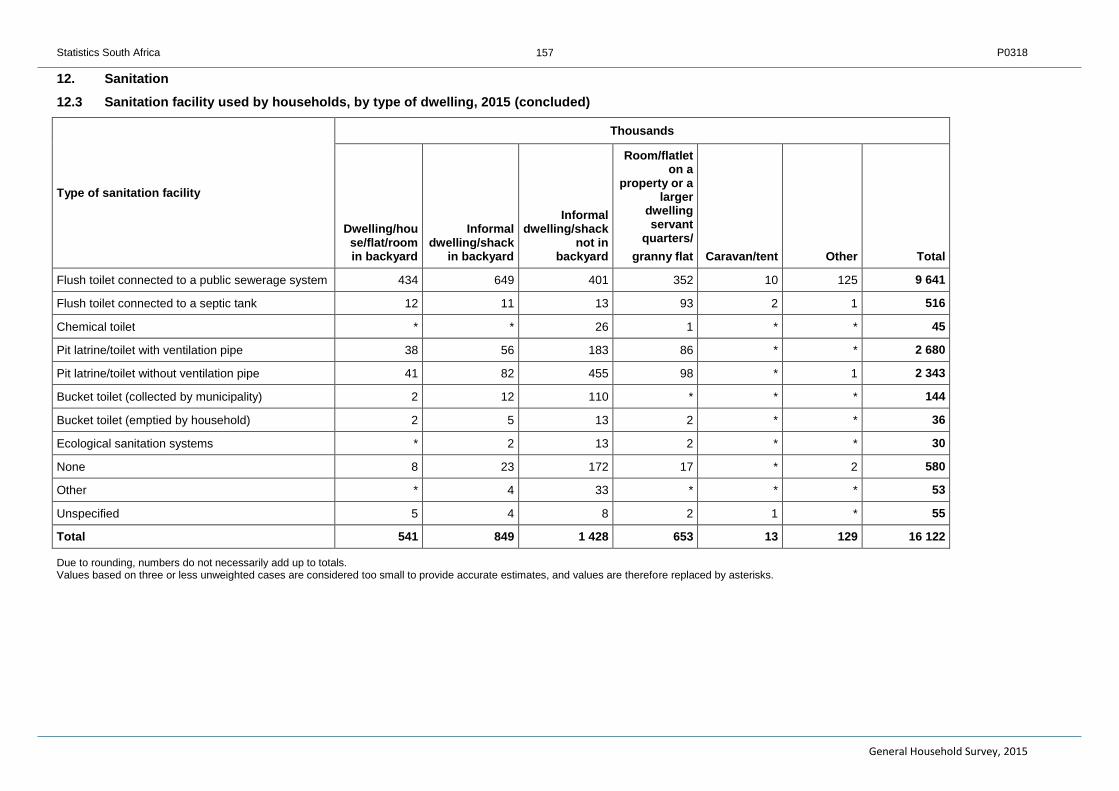
Statistics South Africa P0318
General Household Survey, 2015
157
12. Sanitation
12.3 Sanitation facility used by households, by type of dwelling, 2015 (concluded)
Type of sanitation facility
Thousands
Dwelling/house/flat/room in backyard
Informal dwelling/shack
in backyard
Informal dwelling/shack
not in backyard
Room/flatlet on a
property or a larger
dwelling servant
quarters/
granny flat Caravan/tent Other Total
Flush toilet connected to a public sewerage system 434 649 401 352 10 125 9 641
Flush toilet connected to a septic tank 12 11 13 93 2 1 516
Chemical toilet * * 26 1 * * 45
Pit latrine/toilet with ventilation pipe 38 56 183 86 * * 2 680
Pit latrine/toilet without ventilation pipe 41 82 455 98 * 1 2 343
Bucket toilet (collected by municipality) 2 12 110 * * * 144
Bucket toilet (emptied by household) 2 5 13 2 * * 36
Ecological sanitation systems * 2 13 2 * * 30
None 8 23 172 17 * 2 580
Other * 4 33 * * * 53
Unspecified 5 4 8 2 1 * 55
Total 541 849 1 428 653 13 129 16 122
Due to rounding, numbers do not necessarily add up to totals. Values based on three or less unweighted cases are considered too small to provide accurate estimates, and values are therefore replaced by asterisks.

Statistics South Africa P0318
General Household Survey, 2015
158
13. Refuse removal
13.1 Households who pay for their refuse removal, by type of refuse removal service and province, 2015
Refuse removal
Thousands
Western Cape
Eastern Cape
Northern Cape
Free State
KwaZulu-Natal
North West Gauteng
Mpuma-langa Limpopo
South Africa
Removed by local authority/private company at least once a week 1 072 335 134 295 703 257 2 357 307 160 5 620
Removed by local authority/private company less often than once a week 6 48 5 2 11 6 26 9 4 117
Removed by community members, contracted by the Municipality, at least once a week 3 * * * 36 12 60 3 20 133
Removed by community members, contracted by the Municipality, less often than once a week 3 3 * 1 3 * 7 * 11 28
Removed by community members at least once a week 4 * * * 1 1 3 1 5 16
Removed by community members less often than once a week * * * * * * * * * *
Communal refuse dump 1 * * 1 1 1 4 * * 7
Communal container * 2 * 2 3 4 4 * 3 19
Unspecified 5 5 2 1 11 9 23 6 3 64
Total 1 093 393 141 302 769 289 2 484 326 207 6 004
Due to rounding, numbers do not necessarily add up to totals. Values based on three or less unweighted cases are considered too small to provide accurate estimates, and values are therefore replaced by asterisks.

Statistics South Africa P0318
General Household Survey, 2015
159
13. Refuse removal
13.2 Type of refuse removal services used by households, by population group of the household head, 2015
Refuse removal Thousands
Black African Coloured Indian/Asian White South Africa
Removed by local authority/private company at least once a week 6 782 987 348 1 450 9 566
Removed by local authority/private company less often than once a week 238 27 2 20 288
Removed by community members, contracted by the Municipality, at least once a week 293 15 5 35 348
Removed by community members, contracted by the Municipality, less often than once a week 71 5 2 5 84
Removed by community members at least once a week 38 16 * 11 64
Removed by community members less often than once a week 4 1 * * 5
Communal refuse dump 224 11 1 11 247
Communal container 192 8 1 7 208
Own refuse dump 4 287 43 4 58 4 392
Dump or leave rubbish anywhere 433 4 * * 436
Other 57 7 * 3 67
Unspecified 380 13 6 18 418
Total 12 998 1 136 369 1 619 16 122
Due to rounding, numbers do not necessarily add up to totals. Values based on three or less unweighted cases are considered too small to provide accurate estimates, and values are therefore replaced by asterisks.

Statistics South Africa P0318
General Household Survey, 2015
160
13. Refuse removal
13.3 Households currently paying for the removal of refuse, by province, 2015
Pay for refuse removal
Thousands
Western Cape Eastern Cape
Northern Cape Free State
KwaZulu-Natal North West Gauteng Mpumalanga Limpopo South Africa
Yes 1 093 393 141 302 769 289 2 484 326 207 6 004
No 620 431 90 416 751 467 1 905 214 218 5 114
Do not know 11 2 2 2 23 5 63 1 * 108
Not applicable 50 902 86 186 1 203 454 238 670 1 107 4 896
Total 1 775 1 727 320 906 2 747 1 215 4 690 1 211 1 532 16 122
Due to rounding, numbers do not necessarily add up to totals. Values based on three or less unweighted cases are considered too small to provide accurate estimates, and values are therefore replaced by asterisks.
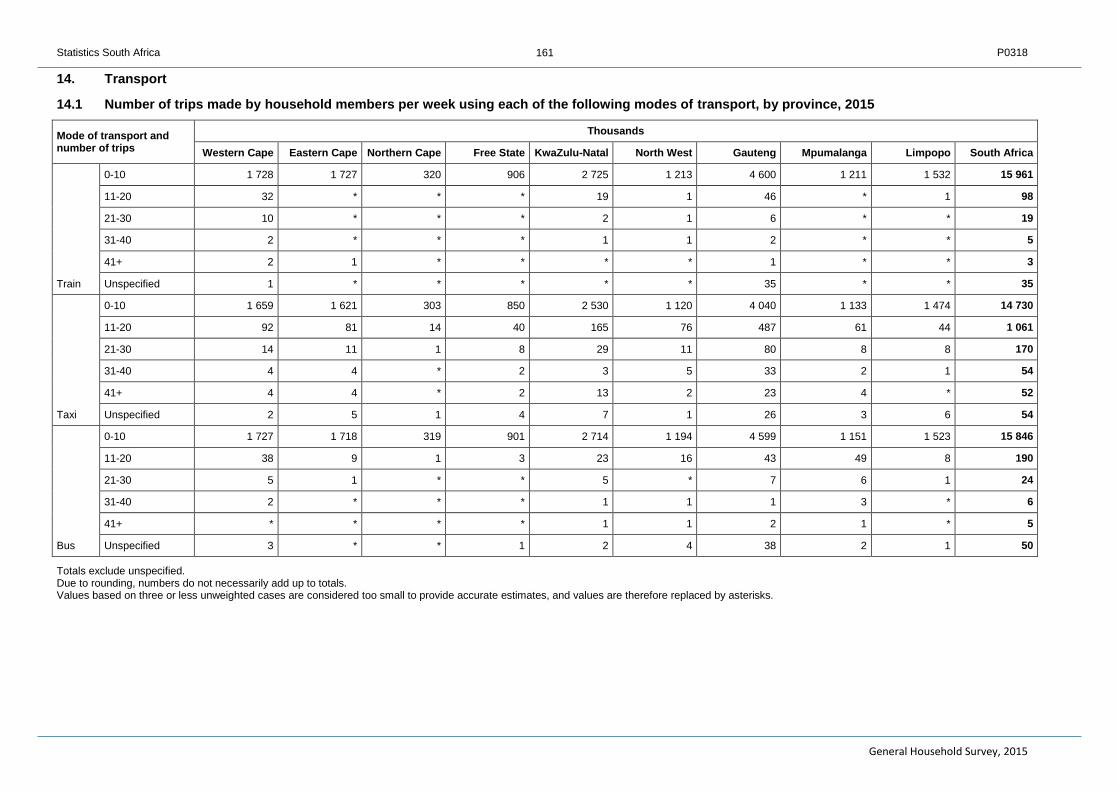
Statistics South Africa P0318
General Household Survey, 2015
161
14. Transport
14.1 Number of trips made by household members per week using each of the following modes of transport, by province, 2015
Mode of transport and number of trips
Thousands
Western Cape Eastern Cape Northern Cape Free State KwaZulu-Natal North West Gauteng Mpumalanga Limpopo South Africa
Train
0-10 1 728 1 727 320 906 2 725 1 213 4 600 1 211 1 532 15 961
11-20 32 * * * 19 1 46 * 1 98
21-30 10 * * * 2 1 6 * * 19
31-40 2 * * * 1 1 2 * * 5
41+ 2 1 * * * * 1 * * 3
Unspecified 1 * * * * * 35 * * 35
Taxi
0-10 1 659 1 621 303 850 2 530 1 120 4 040 1 133 1 474 14 730
11-20 92 81 14 40 165 76 487 61 44 1 061
21-30 14 11 1 8 29 11 80 8 8 170
31-40 4 4 * 2 3 5 33 2 1 54
41+ 4 4 * 2 13 2 23 4 * 52
Unspecified 2 5 1 4 7 1 26 3 6 54
Bus
0-10 1 727 1 718 319 901 2 714 1 194 4 599 1 151 1 523 15 846
11-20 38 9 1 3 23 16 43 49 8 190
21-30 5 1 * * 5 * 7 6 1 24
31-40 2 * * * 1 1 1 3 * 6
41+ * * * * 1 1 2 1 * 5
Unspecified 3 * * 1 2 4 38 2 1 50
Totals exclude unspecified. Due to rounding, numbers do not necessarily add up to totals. Values based on three or less unweighted cases are considered too small to provide accurate estimates, and values are therefore replaced by asterisks.

Statistics South Africa P0318
General Household Survey, 2015
162
14. Transport
14.2 Distance travelled to get to the nearest minibus taxi/sedan taxi/bakkie taxi, bus and train, by population group of the household head, 2015
Mode of transport Distance travelled
Thousands
Black African Coloured Indian/Asian White Total
Train
Less than 1km 209 29 5 * 242
Between 1km and 3km 127 22 5 * 154
More than 3km 72 16 6 * 94
Taxi
Less than 1km 4 516 235 17 38 4 806
Between 1km and 3km 563 41 5 5 615
More than 3km 80 10 1 * 90
Bus
Less than 1km 674 63 18 11 766
Between 1km and 3km 119 16 5 1 141
More than 3km 18 2 * 2 21
Totals exclude unspecified. Due to rounding, numbers do not necessarily add up to totals. Values based on three or less unweighted cases are considered too small to provide accurate estimates, and values are therefore replaced by asterisks.
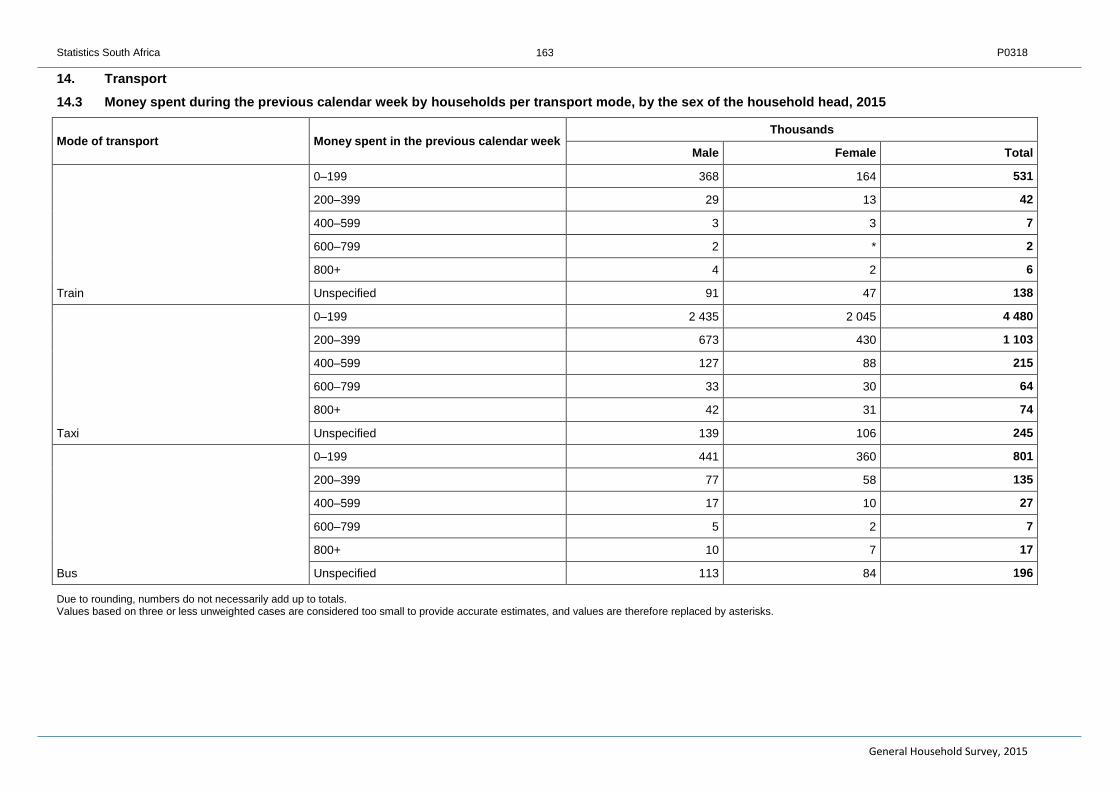
Statistics South Africa P0318
General Household Survey, 2015
163
14. Transport
14.3 Money spent during the previous calendar week by households per transport mode, by the sex of the household head, 2015
Mode of transport Money spent in the previous calendar week Thousands
Male Female Total
Train
0–199 368 164 531
200–399 29 13 42
400–599 3 3 7
600–799 2 * 2
800+ 4 2 6
Unspecified 91 47 138
Taxi
0–199 2 435 2 045 4 480
200–399 673 430 1 103
400–599 127 88 215
600–799 33 30 64
800+ 42 31 74
Unspecified 139 106 245
Bus
0–199 441 360 801
200–399 77 58 135
400–599 17 10 27
600–799 5 2 7
800+ 10 7 17
Unspecified 113 84 196
Due to rounding, numbers do not necessarily add up to totals. Values based on three or less unweighted cases are considered too small to provide accurate estimates, and values are therefore replaced by asterisks.

Statistics South Africa P0318
General Household Survey, 2015
164
14. Transport
14.4 Time taken to get to the health facility that members of the household normally go to, by transport mode, 2015
Mode of transport
Thousands
Time in minutes
Less than 15 minutes 15–29 minutes 30–89 minutes
90 minutes and more Do not know Unspecified Total
Walking 3 034 3 053 1 204 147 9 32 7 479
Minibus taxi/sedan taxi/bakkie taxi 1 146 2 264 859 85 12 26 4 393
Bus 18 75 60 10 * 3 166
Train 5 15 15 1 * * 36
Own transport 2 107 1 226 245 17 3 20 3 618
Bicycle/motorcycle 22 15 1 2 * 1 41
Other 68 94 71 9 * 2 245
Unspecified 50 32 10 1 1 51 144
Total 6 451 6 774 2 466 272 25 134 16 122
Due to rounding, numbers do not necessarily add up to totals. Values based on three or less unweighted cases are considered too small to provide accurate estimates, and values are therefore replaced by asterisks.

Statistics South Africa P0318
General Household Survey, 2015
165
15. Environment
15.1 Environmental problems experienced in the community or neighbouring farms, by province, 2015
Environmental problems experienced
Thousands
Western Cape
Eastern Cape
Northern Cape Free State
KwaZulu-Natal
North West Gauteng Mpumalanga Limpopo
South Africa
Littering 402 517 111 417 959 366 1 557 625 412 5 366
Irregular or no waste removal 116 281 94 368 673 309 668 740 305 3 553
Water pollution 194 342 42 188 557 179 713 198 179 2 591
Outdoor/indoor air pollution 199 739 84 453 664 571 969 790 516 4 984
Land degradation/over-utilisation of natural resources 267 233 45 189 286 189 965 188 333 2 695
Excessive noise/noise pollution 210 279 60 199 506 264 972 373 257 3 119
Other 25 4 3 6 11 3 84 2 8 145
Total number of household (RSA) 1 775 1 727 320 906 2 747 1 215 4 690 1 211 1 532 16 122
Households can experience more than one environmental problem Due to rounding, numbers do not necessarily add up to totals. Values based on three or less unweighted cases are considered too small to provide accurate estimates, and values are therefore replaced by asterisks.
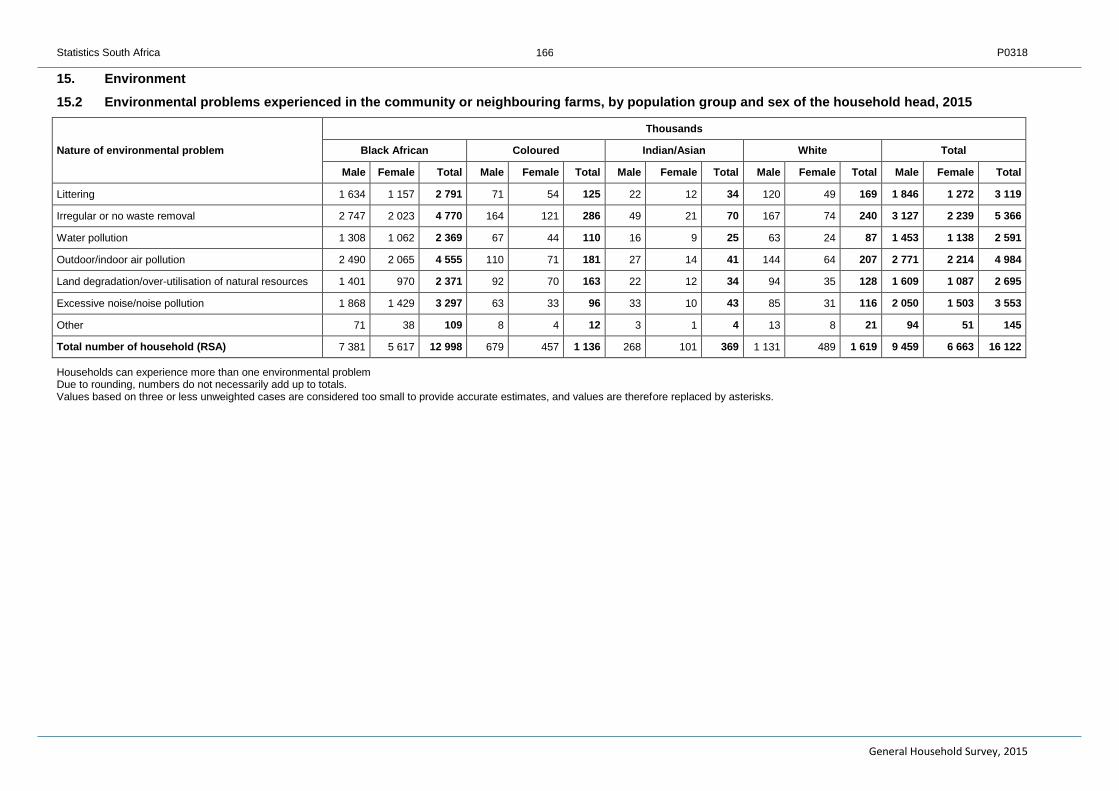
Statistics South Africa P0318
General Household Survey, 2015
166
15. Environment
15.2 Environmental problems experienced in the community or neighbouring farms, by population group and sex of the household head, 2015
Nature of environmental problem
Thousands
Black African Coloured Indian/Asian White Total
Male Female Total Male Female Total Male Female Total Male Female Total Male Female Total
Littering 1 634 1 157 2 791 71 54 125 22 12 34 120 49 169 1 846 1 272 3 119
Irregular or no waste removal 2 747 2 023 4 770 164 121 286 49 21 70 167 74 240 3 127 2 239 5 366
Water pollution 1 308 1 062 2 369 67 44 110 16 9 25 63 24 87 1 453 1 138 2 591
Outdoor/indoor air pollution 2 490 2 065 4 555 110 71 181 27 14 41 144 64 207 2 771 2 214 4 984
Land degradation/over-utilisation of natural resources 1 401 970 2 371 92 70 163 22 12 34 94 35 128 1 609 1 087 2 695
Excessive noise/noise pollution 1 868 1 429 3 297 63 33 96 33 10 43 85 31 116 2 050 1 503 3 553
Other 71 38 109 8 4 12 3 1 4 13 8 21 94 51 145
Total number of household (RSA) 7 381 5 617 12 998 679 457 1 136 268 101 369 1 131 489 1 619 9 459 6 663 16 122
Households can experience more than one environmental problem Due to rounding, numbers do not necessarily add up to totals. Values based on three or less unweighted cases are considered too small to provide accurate estimates, and values are therefore replaced by asterisks.

Statistics South Africa P0318
General Household Survey, 2015
167
16. Income and expenditure
16.1 Sources of income for households, by province, 2015
Sources of income
Thousands
Western Cape
Eastern Cape
Northern Cape Free State
KwaZulu-Natal
North West Gauteng Mpumalanga Limpopo
South Africa
Salaries/wages/commission 1 362 917 199 547 1 720 746 3 518 769 780 10 560
Income from a business 213 166 29 121 314 144 788 189 218 2 181
Grants 668 1 032 195 482 1 480 583 1 470 636 903 7 448
Pensions 123 63 19 43 79 40 212 79 46 704
Remittances 206 421 61 188 537 258 680 257 363 2 971
Sales of farm products and services 6 44 10 19 36 31 6 27 39 217
Other income e.g. rental income, interest 100 18 9 6 24 40 211 17 14 439
No income 4 11 4 14 29 13 32 13 10 130
Total number of household (RSA) 1 775 1 727 320 906 2 747 1 215 4 690 1 211 1 532 16 122 More than one source of income is possible per household. Due to rounding, numbers do not necessarily add up to totals. Values based on three or less unweighted cases are considered too small to provide accurate estimates, and values are therefore replaced by asterisks.

Statistics South Africa P0318
General Household Survey, 2015
168
16. Income and expenditure
16.2 Households’ sources of income, by population group and sex of the household head, 2015
Sources of income
Thousands
Black African Coloured Indian/Asian White Total
Male Female Total Male Female Total Male Female Total Male Female Total Male Female Total
Salaries/wages/commission 5 288 3 012 8 300 558 324 882 200 72 272 838 267 1 105 6 885 3 674 10 560
Income from a business 1 084 565 1 649 73 20 93 72 8 80 285 74 359 1 514 667 2 181
Grants 2 698 3 814 6 511 321 307 628 62 43 105 121 83 204 3 201 4 247 7 448
Pensions 198 171 369 29 23 52 8 5 13 160 110 270 395 309 704
Remittances 1 021 1 554 2 574 65 99 164 28 18 47 86 100 186 1 200 1 771 2 971
Sales of farm products and services 114 69 184 4 * 4 * * * 25 4 29 144 74 217
Other income e.g. rental income, interest 160 122 282 18 11 29 8 4 12 75 40 115 262 177 439
No income 96 29 124 2 1 3 * 1 1 1 * 1 99 30 130
Total number of household (RSA) 7 381 5 617 12 998 679 457 1 136 268 101 369 1 131 489 1 619 9 459 6 663 16 122
More than one source of income is possible per household. Due to rounding, numbers do not necessarily add up to totals. Values based on three or less unweighted cases are considered too small to provide accurate estimates, and values are therefore replaced by asterisks.

Statistics South Africa P0318
General Household Survey, 2015
169
16. Income and expenditure
16.3 Monthly household expenditure category, by province, 2015
Expenditure category
Thousands
Western Cape
Eastern Cape
Northern Cape Free State KwaZulu-Natal North West Gauteng Mpumalanga Limpopo
South Africa
R0 * 9 3 6 17 8 7 2 6 58
R1–R199 2 15 2 11 8 10 33 13 23 116
R200–R399 18 49 8 33 55 39 102 25 78 407
R400–R799 39 180 22 94 205 116 264 114 291 1 326
R800–R1 199 84 214 31 115 376 116 361 158 281 1 736
R1 200–R1 799 138 371 54 131 503 191 478 206 307 2 379
R1 800–R2 499 212 233 43 112 446 180 529 188 191 2 135
R2 500–R4 999 423 309 71 156 462 235 872 219 193 2 939
R5 000–R9 999 341 168 48 119 322 121 754 134 77 2 085
R10 000 or more 504 150 33 110 283 144 1 033 132 65 2 454
Do not know 5 2 1 9 39 49 191 6 6 308
Refuse 2 12 1 5 16 1 25 1 1 65
Unspecified 6 14 2 6 16 4 41 12 12 114
Total 1 775 1 727 320 906 2 747 1 215 4 690 1 211 1 532 16 122
Due to rounding, numbers do not necessarily add up to totals. Values based on three or less unweighted cases are considered too small to provide accurate estimates, and values are therefore replaced by asterisks.

Statistics South Africa P0318
General Household Survey, 2015
170
16. Income and expenditure
16.4 Monthly household expenditure category, by population group and sex of the household head, 2015
Expenditure category
Thousands
Black African Coloured Indian/Asian White Total
Male Female Total Male Female Total Male Female Total Male Female Total Male Female Total
R0 43 12 55 2 1 3 1 * 1 * * * 46 12 58
R1–R199 82 32 114 2 * 2 * * * * * * 84 32 116
R200–R399 247 149 396 3 7 10 1 * 1 1 * 1 252 156 407
R400–R799 699 588 1 286 10 19 30 3 1 4 5 1 6 716 609 1 326
R800–R1 199 817 828 1 645 29 37 65 6 8 14 8 4 12 859 876 1 736
R1 200–R1 799 1 052 1 169 2 221 61 55 116 5 7 12 8 21 29 1 126 1 252 2 379
R1 800–R2 499 998 936 1 934 76 66 142 15 8 23 18 19 37 1 107 1 028 2 135
R2 500–R4 999 1 495 990 2 484 165 118 283 38 21 58 55 58 113 1 752 1 187 2 939
R5 000–R9 999 969 476 1 444 154 98 252 51 26 77 187 124 311 1 361 724 2 085
R10 000 or more 758 300 1 058 163 52 215 130 26 156 784 241 1 025 1 835 619 2 454
Do not know 154 91 246 6 3 8 9 4 12 27 14 42 196 112 308
Refuse 17 3 20 5 * 5 4 1 5 32 3 35 59 7 65
Unspecified 50 45 95 3 2 4 6 * 6 7 2 9 66 48 114
Total 7 381 5 617 12 998 679 457 1 136 268 101 369 1 131 489 1 619 9 459 6 663 16 122
Due to rounding, numbers do not necessarily add up to totals. Numbers below 10 000 are too small to provide accurate estimates. Sensitive cells are indicated by an asterisk.

Statistics South Africa P0318
General Household Survey, 2015
171
17. Households assets, 2015
17.1 Number of households owning a particular asset by province, 2015
Sources of income
Thousands
Western Cape
Eastern Cape
Northern Cape Free State
KwaZulu-Natal North West Gauteng Mpumalanga Limpopo
South Africa
TV Set 1 607 1 196 264 761 2 027 948 4 018 961 1 176 12 959
Swimming pool 144 29 6 24 71 32 361 28 15 710
DVD player/ Blu ray player 1 209 755 167 509 1 235 537 2 900 627 827 8 766
Pay TV (M-Net/DSTV/Top TV) Subscription 741 384 126 309 777 334 2 000 468 502 5 641
Air conditioner (Excluding fans) 162 32 28 49 160 38 289 42 55 854
Computer/Desktop/Laptop 608 169 61 146 291 205 1 383 205 177 3 245
Vacuum cleaner/Floor polisher 497 89 41 98 172 80 794 90 37 1 898
Dish washing machine 240 39 15 50 103 46 461 39 30 1 023
Washing machine 1 070 385 169 282 386 389 2 096 376 259 5 414
Tumble dryer 301 53 22 62 170 82 480 105 65 1 340
Deep freezer - free standing 581 179 114 172 469 225 876 295 365 3 275
Refrigerator or combined fridge freezer 1 509 1 055 238 711 1 857 822 3 620 870 945 11 627
Electric stove 1 665 1 369 286 797 2 193 1 021 4 093 1 016 1 174 13 614
Microwave oven 1 338 824 189 588 1 209 555 3 088 569 514 8 873
Built-in kitchen sink 1 243 432 102 354 782 265 2 317 375 180 6 051
Home security service 334 96 20 75 254 68 913 82 51 1 894

Statistics South Africa P0318
General Household Survey, 2015
172
17. Households assets, 2015
17.1 Number of households owning a particular asset by province, 2015 (concluded)
Sources of income
Thousands
Western Cape
Eastern Cape
Northern Cape Free State
KwaZulu-Natal North West Gauteng Mpumalanga Limpopo
South Africa
Home theatre system 278 144 40 167 377 230 1 261 182 129 2 809
Geyser 865 254 70 178 553 200 1 909 206 128 4 363
Solar hot water geyser 21 2 7 11 20 11 71 12 8 163
Solar electrical panel 86 47 17 40 61 12 231 27 12 533
Total households 1 775 1 727 320 906 2 747 1 215 4 690 1 211 1 532 16 122
Due to rounding, numbers do not necessarily add up to totals. Numbers below 10 000 are too small to provide accurate estimates. Sensitive cells are indicated by an asterisk.
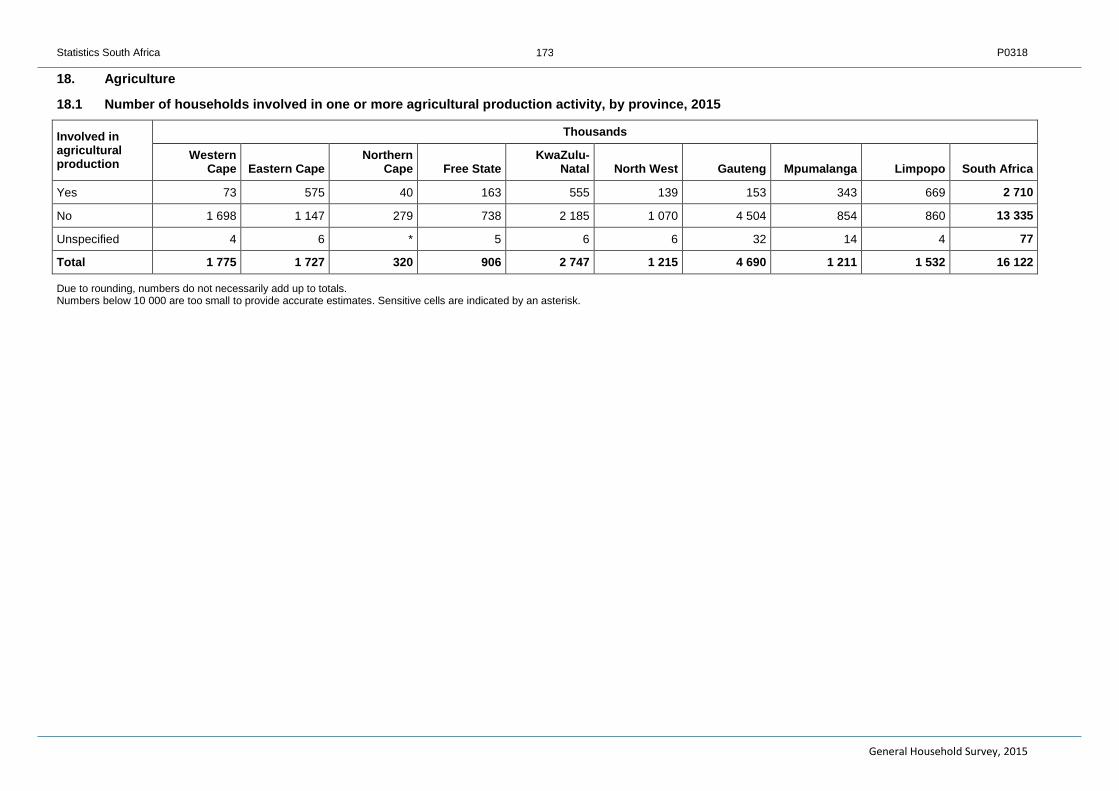
Statistics South Africa P0318
General Household Survey, 2015
173
18. Agriculture
18.1 Number of households involved in one or more agricultural production activity, by province, 2015
Involved in agricultural production
Thousands
Western Cape Eastern Cape
Northern Cape Free State
KwaZulu-Natal North West Gauteng Mpumalanga Limpopo South Africa
Yes 73 575 40 163 555 139 153 343 669 2 710
No 1 698 1 147 279 738 2 185 1 070 4 504 854 860 13 335
Unspecified 4 6 * 5 6 6 32 14 4 77
Total 1 775 1 727 320 906 2 747 1 215 4 690 1 211 1 532 16 122
Due to rounding, numbers do not necessarily add up to totals. Numbers below 10 000 are too small to provide accurate estimates. Sensitive cells are indicated by an asterisk.

Statistics South Africa P0318
General Household Survey, 2015
174
18. Agriculture
18.2 Number of households involved in one or more agricultural production activity, by population group and sex of the household head, 2015
Involved in agricultural production
Thousands
Black African Coloured Indian/Asian White Total
Male Female Total Male Female Total Male Female Total Male Female Total Male Female Total
Yes 1 136 1 365 2 501 37 19 56 13 5 18 104 30 135 1 291 1 419 2 710
No 6 212 4 219 10 431 641 438 1 079 252 96 349 1 021 456 1 477 8 126 5 209 13 335
Unspecified 33 32 65 1 * 1 2 * 2 6 2 8 42 35 77
Total 7 381 5 617 12 998 679 457 1 136 268 101 369 1 131 489 1 619 9 459 6 663 16 122
Due to rounding, numbers do not necessarily add up to totals. Numbers below 10 000 are too small to provide accurate estimates Sensitive. cells are indicated by an asterisk.

Statistics South Africa P0318
General Household Survey, 2015
175
18. Agriculture
18.3 Land used for crop production by province, 2015
Tenure status
Thousands
Western Cape
Eastern Cape
Northern Cape Free State
KwaZulu-Natal North West Gauteng Mpumalanga Limpopo
South Africa
Owns the land 53 130 16 137 217 30 98 253 444 1 378
Rents the land 8 * * 4 5 1 6 1 1 26
Sharecropping 1 1 * * 5 * 1 1 2 11
Tribal authority * 289 * * 156 * * 11 125 581
State land * 3 * * 7 * 3 4 2 19
Other 1 1 1 2 4 1 4 3 1 19
Do not know 1 1 1 * 1 * 7 * 3 13
Not engaged in crop plantation 1 705 1 283 300 754 2 328 1 177 4 516 908 943 13 915
Unspecified 7 19 1 9 22 6 55 30 12 161
Total 1 775 1 727 320 906 2 747 1 215 4 690 1 211 1 532 16 122
Due to rounding, numbers do not necessarily add up to totals.
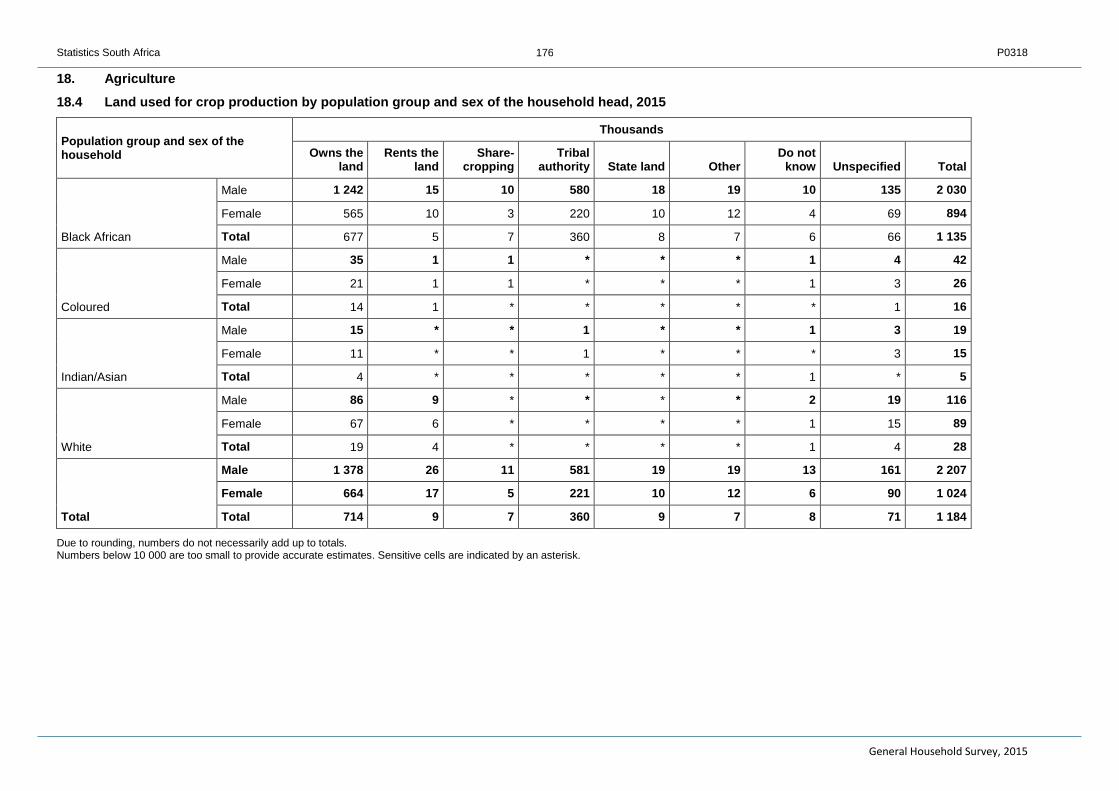
Statistics South Africa P0318
General Household Survey, 2015
176
18. Agriculture
18.4 Land used for crop production by population group and sex of the household head, 2015
Population group and sex of the household
Thousands
Owns the land
Rents the land
Share-cropping
Tribal authority State land Other
Do not know Unspecified Total
Black African
Male 1 242 15 10 580 18 19 10 135 2 030
Female 565 10 3 220 10 12 4 69 894
Total 677 5 7 360 8 7 6 66 1 135
Coloured
Male 35 1 1 * * * 1 4 42
Female 21 1 1 * * * 1 3 26
Total 14 1 * * * * * 1 16
Indian/Asian
Male 15 * * 1 * * 1 3 19
Female 11 * * 1 * * * 3 15
Total 4 * * * * * 1 * 5
White
Male 86 9 * * * * 2 19 116
Female 67 6 * * * * 1 15 89
Total 19 4 * * * * 1 4 28
Total
Male 1 378 26 11 581 19 19 13 161 2 207
Female 664 17 5 221 10 12 6 90 1 024
Total 714 9 7 360 9 7 8 71 1 184
Due to rounding, numbers do not necessarily add up to totals. Numbers below 10 000 are too small to provide accurate estimates. Sensitive cells are indicated by an asterisk.

Statistics South Africa P0318
General Household Survey, 2015
177
18. Agriculture
18.5 The number of livestock the household has, per province, 2015
Number of livestock
Thousand
Western Cape
Eastern Cape
Northern Cape
Free State
KwaZulu-Natal
North West Gauteng Mpumalanga Limpopo South Africa
Cattle
0 2 117 10 5 64 41 2 19 72 332
0-10 * 125 4 7 124 31 * 35 57 381
11-100 2 41 2 4 57 20 * 15 15 156
100+ 1 2 1 1 1 4 1 1 1 13
Unspecified 6 142 7 18 106 22 8 66 82 457
Total 10 428 23 36 352 118 11 136 226 1 340
Sheep
0 * 154 8 7 195 70 2 59 131 625
0-10 * 46 3 1 23 9 1 5 8 97
11-100 1 71 2 3 6 12 * 2 5 102
100+ 4 6 4 5 1 2 * 2 * 22
Unspecified 6 151 6 20 127 24 9 69 83 495
Total 10 428 23 36 352 118 11 136 226 1 340
Goats
0 3 126 6 11 78 48 2 39 59 371
0-10 * 86 7 1 122 24 1 24 70 335
11-100 * 79 4 1 45 24 * 7 16 175
100+ * * 1 2 1 * * * * 4
Unspecified 7 137 6 21 107 22 9 65 82 455
Total 10 428 23 36 352 118 11 136 226 1 340

Statistics South Africa P0318
General Household Survey, 2015
178
18.5 The number of livestock the household has, per province, 2015 (concluded)
Number of livestock
Thousand
Western Cape
Eastern Cape
Northern Cape
Free State
KwaZulu-Natal
North West Gauteng Mpumalanga Limpopo South Africa
Pigs
0 3 186 14 11 199 90 2 61 130 698
0-10 * 127 1 3 21 4 * 6 12 173
11-100 * 4 * * 3 * * 1 1 9
100+ 1 * * 1 1 * * * * 4
Unspecified 6 110 8 21 127 24 9 68 83 455
Total 10 428 23 36 352 118 11 136 226 1 340
Due to rounding, numbers do not necessarily add up to totals. Numbers below 10 000 are too small to provide accurate estimates. Sensitive cells are indicated by an asterisk.

Statistics South Africa P0318
General Household Survey, 2015
179
GENERAL INFORMATION Stats SA publishes approximately 300 different statistical releases each year. It is not economically viable to produce them in more than one of South Africa's eleven official languages. Since the releases are used extensively, not only locally but also by international economic and social-scientific communities, Stats SA releases are published in English only. Stats SA has copyright on this publication. Users may apply the information as they wish, provided that they acknowledge Stats SA as the source of the basic data wherever they process, apply, utilise, publish or distribute the data; and also that they specify that the relevant application and analysis (where applicable) result from their own processing of the data. Advance release calendar An advance release calendar is disseminated on www.statssa.gov.za Stats SA products A complete set of Stats SA publications is available at the Stats SA Library and the following libraries: National Library of South Africa, Pretoria Division National Library of South Africa, Cape Town Division Natal Society Library, Pietermaritzburg Library of Parliament, Cape Town Bloemfontein Public Library Johannesburg Public Library Eastern Cape Library Services, King William’s Town Central Regional Library, Polokwane Central Reference Library, Nelspruit Central Reference Collection, Kimberley Central Reference Library, Mmabatho Stats SA also provides a subscription service. Electronic services A large range of data are available via on-line services, diskette and computer printouts. For more details about our electronic data services, contact (012) 310 8600. You can visit us on the internet at: www.statssa.gov.za Enquiries User information services Telephone number: (012) 310 8600 Email address: [email protected] Technical enquiries: Isabel Schmidt
Telephone number: (012) 310 6249 Email address: [email protected]
Postal address Private Bag X44, Pretoria, 0001
Produced by Stats SA