
Differential expression of microRNA501-5p affects the ... · Differential expression of...
14
Differential expression of microRNA501-5p affects the aggressiveness of clear cell renal carcinoma Alessandra Mangolini a , Anna Bonon b , Stefano Volinia c , Giovanni Lanza d , Roberto Gambari e , Paolo Pinton a , Gian Rosario Russo f , Laura del Senno b , Lucio Dell’Atti f , Gianluca Aguiari b,⇑ a Department of Morphology, Surgery and Experimental Medicine, Section of Pathology, Oncology and Experimental Biology, University of Ferrara, Via Fossato di Mortara 64/b, 44121 Ferrara, Italy b Department of Biomedical and Specialty Surgical Sciences, Section of Biochemistry, Molecular Biology and Medical Genetics, University of Ferrara, Via Fossato di Mortara 74, 44121 Ferrara, Italy c Department of Morphology, Surgery and Experimental Medicine, Section of Anatomy and Histology, University of Ferrara, Via Fossato di Mortara 64/b, 44121 Ferrara, Italy d Department of Morphology, Surgery and Experimental Medicine, Section of Pathological Anatomy and Biomolecular Diagnostic, Azienda Ospedaliero Universitaria, Via Aldo Moro 8, 44124 Ferrara, Italy e Department of Life Sciences and Biotechnologies, Section of Molecular Biology, University of Ferrara, Via Fossato di Mortara 74, 44121 Ferrara, Italy f Unit of Urology, St. Anna Hospital, Via Aldo Moro 8, 44124 Ferrara, Italy article info Article history: Received 30 June 2014 Revised 9 October 2014 Accepted 28 October 2014 Keywords: MicroRNA501-5p mTOR signaling p53 Apoptosis Cell survival abstract Renal cell carcinoma is a common neoplasia of the adult kidney that accounts for about 3% of adult malignancies. Clear cell renal carcinoma is the most frequent subtype of kidney cancer and 20–40% of patients develop metastases. The absence of appropriate biomarkers complicates diagnosis and prognosis of this disease. In this regard, small noncoding RNAs (microRNAs), which are mutated in several neoplastic diseases including kidney carcinoma, may be optimal candidates as biomarkers for diagnosis and prognosis of this kind of cancer. Here we show that patients with clear cell kidney carcinoma that express low levels of miR501-5p exhibited a good prognosis compared with patients with unchanged or high levels of this microRNA. Consistently, in kidney carcinoma cells the down- regulation of miR501-5p induced an increased caspase-3 activity, p53 expression as well as decreased mTOR activation, leading to stimulation of the apoptotic pathway. Conversely, miR501- 5p upregulation enhanced the activity of mTOR and promoted both cell proliferation and survival. These biological processes occurred through p53 inactivation by proteasome degradation in a mech- anism involving MDM2-mediated p53 ubiquitination. Our results support a role for miR501-5p in balancing apoptosis and cell survival in clear cell renal carcinoma. In particular, the downregulation of microRNA501-5p promotes a good prognosis, while its upregulation contributes to a poor prog- nosis, in particular, if associated with p53 and MDM2 overexpression and mTOR activation. Thus, the expression of miR501-5p is a possible biomarker for the prognosis of clear cell renal carcinoma. Ó 2014 The Authors. Published by Elsevier B.V. on behalf of the Federation of European Biochemical Societies. This is an open access article under the CC BY-NC-ND license (http://creativecommons.org/licenses/by-nc-nd/3.0/). 1. Introduction Renal cell carcinoma (RCC), the most common kidney malig- nancy with the highest mortality rate of urinary cancers, shows an incidence of 2–4% in the USA population that is steadily rising in the last decades [9,33]. Clear cell renal carcinoma (ccRCC) accounts for about 70% of RCC cases and, approximately one third of these patients commonly develop metastases [10]. Tumor recur- rence manifestations are mainly due to the absence of adjuvant therapy in clinical routine, because RCC is both chemotherapy and radiotherapy resistant [31]. Moreover, the lack of specific prognostic biomarkers prevents the development of specific ther- apy. Thus, the discovery of new biomarkers for the prediction of early metastasis development after nephrectomy could be useful for the clinic and therapeutic follow up of RCC patients [31,35]. Currently, an innovative approach for molecular characterization of tumors is based on the analysis of microRNAs expression [31]. MicroRNAs (miRs) are a class of short non-coding RNAs that regulate gene expression at post-transcriptional level by mRNA http://dx.doi.org/10.1016/j.fob.2014.10.016 2211-5463/Ó 2014 The Authors. Published by Elsevier B.V. on behalf of the Federation of European Biochemical Societies. This is an open access article under the CC BY-NC-ND license (http://creativecommons.org/licenses/by-nc-nd/3.0/). Abbreviations: ccRCC, clear cell renal cell carcinoma; MDM2, mouse double minute 2 homolog; mTOR, mammalian target of rapamycin; pRCC, papillary renal cell carcinoma ⇑ Corresponding author. Tel.: +39 0532974460; fax: +39 0532974484. E-mail address: [email protected] (G. Aguiari). FEBS Open Bio 4 (2014) 952–965 journal homepage: www.elsevier.com/locate/febsopenbio
Transcript of Differential expression of microRNA501-5p affects the ... · Differential expression of...

FEBS Open Bio 4 (2014) 952–965
journal homepage: www.elsevier .com/locate / febsopenbio
Differential expression of microRNA501-5p affects the aggressivenessof clear cell renal carcinoma
http://dx.doi.org/10.1016/j.fob.2014.10.0162211-5463/� 2014 The Authors. Published by Elsevier B.V. on behalf of the Federation of European Biochemical Societies.This is an open access article under the CC BY-NC-ND license (http://creativecommons.org/licenses/by-nc-nd/3.0/).
Abbreviations: ccRCC, clear cell renal cell carcinoma; MDM2, mouse doubleminute 2 homolog; mTOR, mammalian target of rapamycin; pRCC, papillary renalcell carcinoma⇑ Corresponding author. Tel.: +39 0532974460; fax: +39 0532974484.
E-mail address: [email protected] (G. Aguiari).
Alessandra Mangolini a, Anna Bonon b, Stefano Volinia c, Giovanni Lanza d, Roberto Gambari e, Paolo Pinton a,Gian Rosario Russo f, Laura del Senno b, Lucio Dell’Atti f, Gianluca Aguiari b,⇑a Department of Morphology, Surgery and Experimental Medicine, Section of Pathology, Oncology and Experimental Biology, University of Ferrara, Via Fossato di Mortara 64/b,44121 Ferrara, Italyb Department of Biomedical and Specialty Surgical Sciences, Section of Biochemistry, Molecular Biology and Medical Genetics, University of Ferrara, Via Fossato di Mortara 74, 44121Ferrara, Italyc Department of Morphology, Surgery and Experimental Medicine, Section of Anatomy and Histology, University of Ferrara, Via Fossato di Mortara 64/b, 44121 Ferrara, Italyd Department of Morphology, Surgery and Experimental Medicine, Section of Pathological Anatomy and Biomolecular Diagnostic, Azienda Ospedaliero Universitaria, Via Aldo Moro8, 44124 Ferrara, Italye Department of Life Sciences and Biotechnologies, Section of Molecular Biology, University of Ferrara, Via Fossato di Mortara 74, 44121 Ferrara, Italyf Unit of Urology, St. Anna Hospital, Via Aldo Moro 8, 44124 Ferrara, Italy
a r t i c l e i n f o a b s t r a c t
Article history:Received 30 June 2014Revised 9 October 2014Accepted 28 October 2014
Keywords:MicroRNA501-5pmTOR signalingp53ApoptosisCell survival
Renal cell carcinoma is a common neoplasia of the adult kidney that accounts for about 3% of adultmalignancies. Clear cell renal carcinoma is the most frequent subtype of kidney cancer and 20–40%of patients develop metastases. The absence of appropriate biomarkers complicates diagnosis andprognosis of this disease. In this regard, small noncoding RNAs (microRNAs), which are mutatedin several neoplastic diseases including kidney carcinoma, may be optimal candidates as biomarkersfor diagnosis and prognosis of this kind of cancer. Here we show that patients with clear cell kidneycarcinoma that express low levels of miR501-5p exhibited a good prognosis compared with patientswith unchanged or high levels of this microRNA. Consistently, in kidney carcinoma cells the down-regulation of miR501-5p induced an increased caspase-3 activity, p53 expression as well asdecreased mTOR activation, leading to stimulation of the apoptotic pathway. Conversely, miR501-5p upregulation enhanced the activity of mTOR and promoted both cell proliferation and survival.These biological processes occurred through p53 inactivation by proteasome degradation in a mech-anism involving MDM2-mediated p53 ubiquitination. Our results support a role for miR501-5p inbalancing apoptosis and cell survival in clear cell renal carcinoma. In particular, the downregulationof microRNA501-5p promotes a good prognosis, while its upregulation contributes to a poor prog-nosis, in particular, if associated with p53 and MDM2 overexpression and mTOR activation. Thus, theexpression of miR501-5p is a possible biomarker for the prognosis of clear cell renal carcinoma.� 2014 The Authors. Published by Elsevier B.V. on behalf of the Federation of European Biochemical Societies. This
is an open access article under the CC BY-NC-ND license (http://creativecommons.org/licenses/by-nc-nd/3.0/).
1. Introduction
Renal cell carcinoma (RCC), the most common kidney malig-nancy with the highest mortality rate of urinary cancers, showsan incidence of 2–4% in the USA population that is steadily risingin the last decades [9,33]. Clear cell renal carcinoma (ccRCC)accounts for about 70% of RCC cases and, approximately one third
of these patients commonly develop metastases [10]. Tumor recur-rence manifestations are mainly due to the absence of adjuvanttherapy in clinical routine, because RCC is both chemotherapyand radiotherapy resistant [31]. Moreover, the lack of specificprognostic biomarkers prevents the development of specific ther-apy. Thus, the discovery of new biomarkers for the prediction ofearly metastasis development after nephrectomy could be usefulfor the clinic and therapeutic follow up of RCC patients [31,35].Currently, an innovative approach for molecular characterizationof tumors is based on the analysis of microRNAs expression [31].MicroRNAs (miRs) are a class of short non-coding RNAs thatregulate gene expression at post-transcriptional level by mRNA
A. Mangolini et al. / FEBS Open Bio 4 (2014) 952–965 953
degradation or translational inhibition [31]. Recently, miRs havebeen reported as potential biomarkers for RCC, because they areable to improve the identification of tumor subtypes [29]. Forinstance, the overexpression of miR-32 is associated with poor out-come of RCC patients [29]. However, in other studies the analysis ofcirculating serum levels of miR-26a-2⁄, miR-191, miR-337-3p andmiR-378 is unlikely to provide helpful diagnostic/prognostic infor-mation in RCC patients [16]. Therefore, the current role of miRs asbiomarkers in renal carcinoma is still obscure and deserves furtherinvestigation.
In the RCC pathogenesis it is known that mTOR, a protein kinaseessential for cell growth, has an important role, because increasedmTORC1 activation by the HIF2a pathway is particularly associ-ated to renal cancer progression [14]. Moreover, genetic mutationsthat enhance mTOR signaling cause increased incidence of meta-static events [19]. Consistently, inhibitors of mTOR have shownto improve survival in poor-prognosis advanced RCC [19,15].Therefore, also mTOR signaling should be carefully investigatedin kidney tumors.
The findings here reported show that low expression level of aspecific miR, the miR501-5p, does not affect tumor grading, but isassociated with a good prognosis in ccRCC patients. Moreover, thedownregulation of miR501-5p induces apoptosis through p53 acti-vation and mTOR inhibition. Consistently, the overexpression ofmiR501-5p in kidney carcinoma KJ29 cells stimulates cell growthand survival by activation of mTOR kinase and inhibition of p53via MDM2-associated ubiquitination. The good prognosis in ccRCCpatients associated with lower expression of miR501-5p makesthis miR a candidate biomarker for clear cell renal carcinoma.
2. Material and methods
2.1. Reagents
Media and plastic material for cell culture were purchased fromEuroClone (Italy). Rabbit polyclonal anti-mTOR, anti-P-mTOR, andanti-Ubiquitin antibodies were obtained from Cell Signaling Tech-nologies (EuroClone, Italy). Anti-p53, anti-MDM2 and anti-b-Actinwere acquired from Santa Cruz Technologies (Italy). Enhancedchemiluminescent substrates for western blotting and HRP-conju-gated goat anti-rabbit and anti-mouse antibodies were purchasedfrom EuroClone (Italy). Rapamycin was obtained from Sigma–Aldrich (Italy). AntagomiR anti-microRNA501-5p was purchasedby Ambion (Life Technologies, Italy), while the recombinant plas-mid (PL501) expressing both hsa-miR501-5p and green fluores-cence protein (GFP) sequences was produced by OriGeneTechnologies (Tema Ricerca, Italy).
2.2. Collection of sample tissues and kidney cell lines
Renal fresh frozen normal and tumor kidney tissues were col-lected after surgical resection by the Urology Unit of Sant’AnnaHospital, Ferrara. Paraffin-embedded tissues derived from normalparenchyma as well as from kidney renal carcinoma were obtainedfrom Pathological Anatomy of Ferrara University (Italy). 4/5 humannormal as well as 9.7 and 9.12 ADPKD cystic kidney epithelial cellswere produced by other laboratories [20], while KJ29 non papillarykidney cancer cells were established and characterized in our lab-oratory [5]. Cytogenetic analysis of KJ29 cells showed 50 chromo-somes including rearrangements of chromosomes 1 and 3. Theantigenic phenotype is characterized by co-expression of cytoker-atin and vimentin as well as the expression of urothelium differen-tiation markers, with low levels of class II and the absence of class IMHC antigens. The cell line which is highly tumorigenic in athymicmice displays expression of erbB-2, c-met and Ha-ras oncogenes
[5]. Caki-2 cells were kindly provided from Dr. Gagliano (Univer-sity of Milan, Italy). The study protocol was in line with the 1975Declaration of Helsinki.
2.3. Analysis of microRNA expression by microarray technology
This analysis was performed as described by Negrini et al. [24].Briefly, after total RNA isolation from cells by TRIZOL reagent (Invit-rogen SRL, Italy) as already described [21], RNAs were hybridized onan Agilent Human miRNA microarray (G4470B, Agilent Technolo-gies), which consists of 60-mer DNA probes synthesized in situand contains 15,000 features specific for 723 human miRNAs. Micro-array results were analyzed using the GeneSpring GX software (Agi-lent Technologies). Differentially expressed miRNA were selected ashaving a 1.5-fold expression difference between control cells (4/5)and ADPKD cystic cells (9.7 and 9.12). P values <0.05 calculated byAnova test was considered statistically significant. Differentiallyexpressed miRNAs were used for cluster analysis of samples, usingthe Pearson correlation as a measure of similarity.
2.4. RNA extraction, cDNA synthesis and RT-PCR analysis
From fresh frozen tissues and cell pellets, total RNA wasextracted by TRIZOL method. RNA extraction from paraffin-embed-ded tissues was performed by the RecoverAll Total Nucleic AcidIsolation Kit (Ambion, Italy). Four slices from 20 lm in size weretreated with 1 mL of xylene 100% and heated for 3 min a 50 �C tomelt the paraffin, and the solution was centrifuged at 12000�gfor 2 min. After xylene discharge, the pellet was washed twice with1 mL 100% ethanol and dried in a centrifugal vacuum at 40 �C for20 min. Next, RNA from samples were obtained following the man-ufacturer’s protocol. Synthesis of cDNA was performed by the Taq-Man MicroRNA Reverse Transcription Kit (Applied Biosystems,Italy), using RNU6B and hsa-miR501-5p specific primers. Real Timequantitative PCR was carried out by TaqMan method using the ABIPrism 7700 Sequencer Detector system (Applied Biosystems, Italy).The small nuclear U6B was used as endogenous control (referencegene) for the normalization of samples, while the expression levelof microRNA501-5p between normal parenchyma and cancer tis-sue was calculated by delta-delta Ct method as previouslydescribed [4].
2.5. Cell transfection
The transfection of cells with 30 nM of antagomiR sequences,specific for microRNA501-5p or with 0.75 lg/mL of PL501 was per-formed by the TurboFect Transfection Reagent (Fermentas, Italy).200,000, 30,000 or 5000 cells/well were plated in 6-, 24- or 96-wellplates respectively, for 24 h in DMEM/F12 medium supplementedwith 10% FBS. Next, cells were transiently transfected in DMEM/F12 medium supplemented with 0.4% BSA for at least 6 h followingthe manufacturer’s method. After transfection cells were culturedfor 24 h in DMEM/F12 medium in presence of 0.4% BSA for theanalysis of apoptosis or for 24, 48 and 72 h in 1% FBS for the eval-uation of cell growth.
2.6. Analysis of cell cycle, proliferation and survival
For cell cycle analysis, 200,000 cells/well were plated in six wellplates, starved for 24 h in medium with 0.4% BSA, transfected witha specific antagomiR and cultured for additional 24 h in mediumcontaining 1% FBS. Then, cells were collected, centrifuged, washedin PBS, stained with a propidium iodide solution and analyzed byflow cytometry using the FACSCalibur Becton Dickinson Immuno-cytometry System [1]. For cell proliferation analysis, 5000 cells/well were plated in 96 well plates, starved for 24 h in DMEM/F12
954 A. Mangolini et al. / FEBS Open Bio 4 (2014) 952–965
0.4% BSA and transfected with PL501 or with an irrelevant plasmidas described above. Cells were cultured for further 24, 48 and 72 hin DMEM/F12 1% FBS in presence or absence of rapamycin(500 nM), and the proliferation was calculated by direct cell count-ing after trypan blue staining, using a Burker chamber [3]. Cell sur-vival was measured by the CellTiter cell proliferation assay(Promega, Italy), a method based on the quantitation of a coloredcompound released by cells in culture medium. Color intensity,directly proportional to the living cells, was detected by a platereader recording the absorbance at 490 nm [8].
2.7. Western blotting and p53-ubiquitination analysis
Fresh tissues were lysed in 1% Triton X-100 solution containinga cocktail of protease inhibitors and processed for immunoblots asdescribed previously [2]. Quantitative phosphorylation and proteinlevels were calculated as the ratio between phosphorylated andun-phosphorylated protein, and among the protein of interestand b-Actin, respectively [3]. For detection of p53 conjugated withendogenous ubiquitin, transfected cells (1 � 106) were lysed in TBSbuffer (50 mM Tris, pH 8.0, 150 mM NaCl) containing 1% SDS,1 mM DTT and protease inhibitor cocktail enriched with protea-some and ubiquitin peptidase inhibitors MG132 (10 lm) and N-ethylmaleimide (10 mM), respectively. Next, protein lysate wasboiled and diluted 10 times in TBS with protease inhibitors, andp53 was immunoprecipitated with a monoclonal anti-p53 anti-body (Santa Cruz, Italy). After washing, immunoprecipitates wereanalyzed by western blotting with both monoclonal anti-p53 andpolyclonal anti-Ubiquitin antibodies [26].
2.8. Apoptosis detection
Apoptosis was evaluated by Hoechst and caspase-3 assay meth-ods. For apoptotic nuclei detection, 200,000 cells were plated on24 mm coverslips, starved 24 h in DMEM/F12 0.4% BSA and trans-fected. After transfection, cells were fixed, permeabilized, andstained with Hoechst 33,258 (10 mg/mL) in the dark [8]. Imageswere acquired at 40� magnification through a Zeiss Axiovert 200fluorescence microscope, equipped with a back-illuminated CCDcamera (Roper Scientific, Tucson, USA). Caspase-3 activity wasevaluated using EnzChek� caspase-3 Assay Kit (Invitrogen, Italy).After transfection, cells were cultured with DMEM/F12 0.4% BSAfor 24 h, lysed for 30 min and centrifuged according with the man-ufacturer’s instructions. 50 lL aliquots of supernatant were incu-bated with 50 lL of 2� substrate working solution containing5 mM Z-DEVD-R110 and fluorescence was measured every minutefor 90 min at 520 nm by the fluorimeter VICTOR3 1420 MultilabelCounter (PerkinElmer, Italy). Values were normalized to the pro-tein content detected by Bradford method [8].
2.9. Cell imaging
For GFP detection, cells were seeded on 24 mm coverslips,transfected with PL501 and washed three times with PBS bufferbefore GFP recording. GFP fluorescence signal was captured by afluorescence microscope as described above. For immunofluores-cence analysis, cells were cultured on 24 mm coverslips inDMEM/F12 0.4% BSA for 24 h and transfected with antagomiR.After transfection, cells were fixed in 0.4% formalin, washed twicein PBS buffer and permeabilized in a PBS solution containing 0.2%Triton X-100. Then, cells were washed twice with PBS buffer andincubated with an anti-p53 monoclonal antibody solution. Afterwashing, cells were treated with a secondary anti-mouse rhoda-mine-conjugated antibody and washed three times in PBS buffer[4]. Immunofluorescent p53 protein and DAPI-stained nuclei weredetected by a fluorescence microscope as previously described.
2.10. Statistical analysis
Analysis of data was performed using Student’s t test (unpairedanalysis). Patients survival was measured by Kaplan–Meier estima-tor and by multivariate analysis with Cox regression. Statisticalanalysis of microarray data was performed by Anova test. Differ-ences are considered significant at a value of p < 0.05. All dataare reported as mean ± SD (standard deviation) of at least threeindependent experiments.
3. Results
3.1. miR501-5p expression in kidney carcinomas
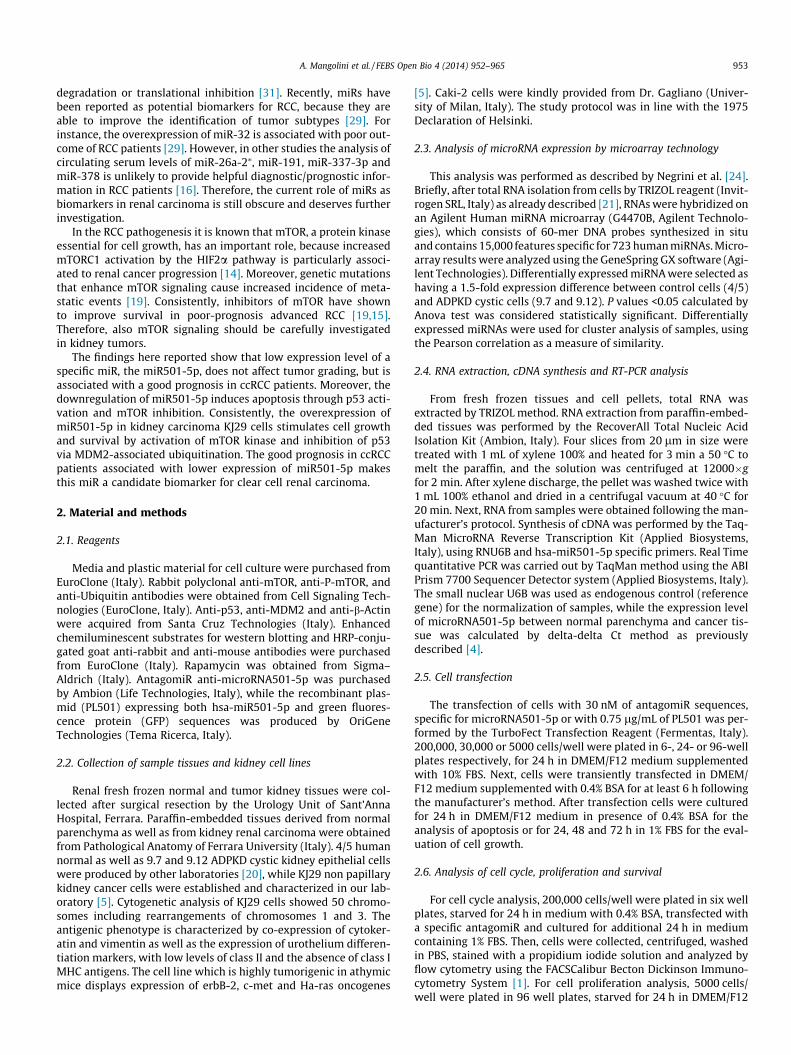
Microarray data performed in 4/5 normal renal epithelial cellsas well as in 9.7 and 9.12 cystic kidney cell lines [20] derived frompatients with autosomal dominant polycystic kidney disease(ADPKD), an hyperproliferative pathology, showed statistically sig-nificant changes in the expression of six different microRNAs(Fig. 1A). In particular the expression of microRNA501-5p wasfound 3 times higher in 9.7 and 9.12 cystic cells than in 4/5 controlcells (Table in Fig. 1A). By Real Time RT-PCR analysis, an overallhigher expression of miR501-5p was also observed in 63 clear cellkidney carcinoma tissues compared with their paired normal renalparenchyma (Fig. 1B), while the other miRNAs did not show signif-icant changes (data not shown). On the contrary, in 19 papillarykidney carcinoma tissues the expression of this miR was markedlylower than in normal tissue (Fig. 1C). As shown in Fig. 1D, ccRCCsamples showed a variable distribution of miR501-5p expressionthat could be associated with age, because this correlation is veryclose to significance. No association between miR-501-5p expres-sion and tumor grade was observed (Fig. 1E). Based on this variabledistribution, a possible link between miR501-5p expression andpatient outcome in ccRCC subjects was then investigated. Followup analysis (at least 5 years) in 45 ccRCC samples (Table 1) showedthat patients with low expression of this miR (<1; tumor vs normaltissue) exhibited a good prognosis. Conversely, 66% of patientswith higher levels of miR501-5p (P1; tumor vs normal tissue)showed a significant higher probability of developing metastasesthan subjects with low expression of this miR; (miR501-5p expres-sion was 5.34 ± 7.31 in metastatic samples vs 1.73 ± 2.47 in not-metastatic ccRCC patients; n = 45, p < 0.05). This finding was alsoconfirmed by Kaplan–Meier plot that indicates a significant lowerfrequency of metastases for patients which express low levels ofmicroRNA501-5p compared with subjects with high expressionof this microRNA (Fig. 1F). However, Kaplan–Meier chart did notshow significant association with the overall survival (data notshown). In addition, a multivariable Cox regression analysis wasperformed on ccRCC patients stratified for age in two groups(<65 years (n = 10) defined ‘‘young’’ and >65 (n = 27) called‘‘old’’). This analysis indicates that expression of miR501-5pshowed a significant and independent association with time tometastasis (HR 1.103; 95%CI 1.004–1.211, p < 0.05).
These data suggest a possible role of miR501-5p in the develop-ment of clear cell renal carcinoma.
3.2. The upregulation of miR501-5p stimulates cell growth andsurvival
Since TSC1, an inhibitor component of mTOR complex [37], is atarget of miR501-5p (Table 2), the upregulation of this miR shouldactivate the mTOR kinase. To confirm this assumption, we haveoverexpressed the miR501-5p in two different kidney carcinomacell lines (KJ29 and Caki-2), by transfection with a plasmid(PL501) containing specific miR501-5p sequences. In basal condi-tions (Fig. 2A), miR501-5p levels were higher in KJ29 cells than
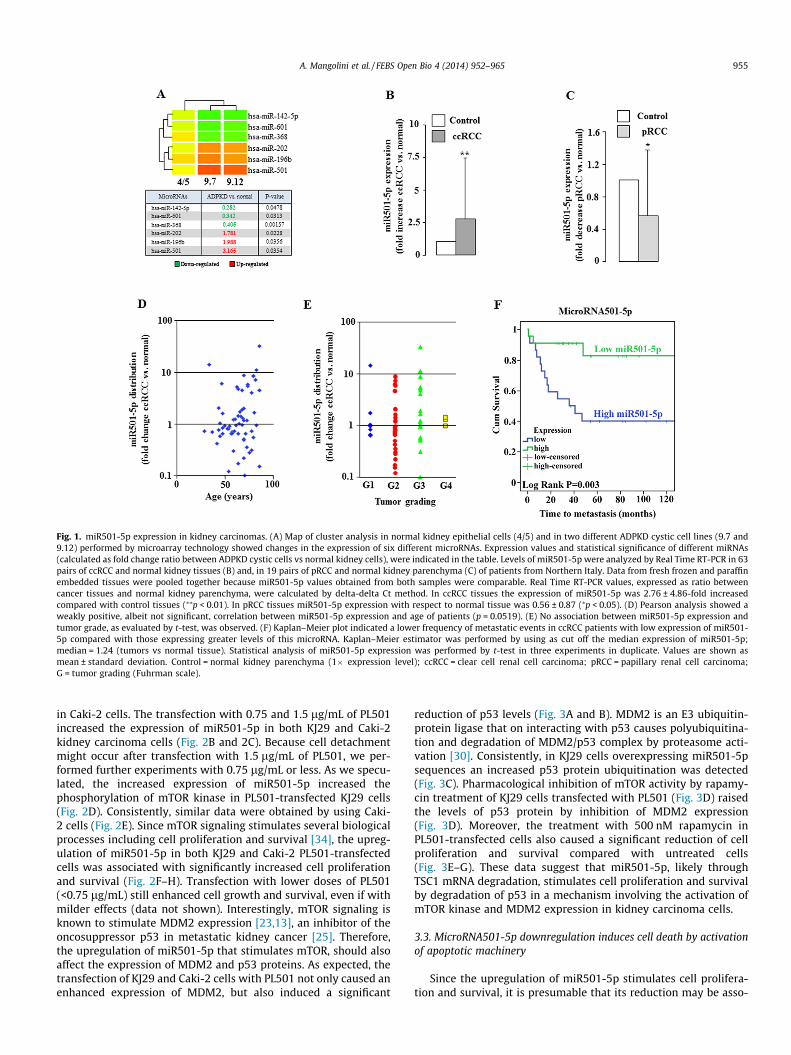
Fig. 1. miR501-5p expression in kidney carcinomas. (A) Map of cluster analysis in normal kidney epithelial cells (4/5) and in two different ADPKD cystic cell lines (9.7 and9.12) performed by microarray technology showed changes in the expression of six different microRNAs. Expression values and statistical significance of different miRNAs(calculated as fold change ratio between ADPKD cystic cells vs normal kidney cells), were indicated in the table. Levels of miR501-5p were analyzed by Real Time RT-PCR in 63pairs of ccRCC and normal kidney tissues (B) and, in 19 pairs of pRCC and normal kidney parenchyma (C) of patients from Northern Italy. Data from fresh frozen and paraffinembedded tissues were pooled together because miR501-5p values obtained from both samples were comparable. Real Time RT-PCR values, expressed as ratio betweencancer tissues and normal kidney parenchyma, were calculated by delta-delta Ct method. In ccRCC tissues the expression of miR501-5p was 2.76 ± 4.86-fold increasedcompared with control tissues (⁄⁄p < 0.01). In pRCC tissues miR501-5p expression with respect to normal tissue was 0.56 ± 0.87 (⁄p < 0.05). (D) Pearson analysis showed aweakly positive, albeit not significant, correlation between miR501-5p expression and age of patients (p = 0.0519). (E) No association between miR501-5p expression andtumor grade, as evaluated by t-test, was observed. (F) Kaplan–Meier plot indicated a lower frequency of metastatic events in ccRCC patients with low expression of miR501-5p compared with those expressing greater levels of this microRNA. Kaplan–Meier estimator was performed by using as cut off the median expression of miR501-5p;median = 1.24 (tumors vs normal tissue). Statistical analysis of miR501-5p expression was performed by t-test in three experiments in duplicate. Values are shown asmean ± standard deviation. Control = normal kidney parenchyma (1� expression level); ccRCC = clear cell renal cell carcinoma; pRCC = papillary renal cell carcinoma;G = tumor grading (Fuhrman scale).
A. Mangolini et al. / FEBS Open Bio 4 (2014) 952–965 955
in Caki-2 cells. The transfection with 0.75 and 1.5 lg/mL of PL501increased the expression of miR501-5p in both KJ29 and Caki-2kidney carcinoma cells (Fig. 2B and 2C). Because cell detachmentmight occur after transfection with 1.5 lg/mL of PL501, we per-formed further experiments with 0.75 lg/mL or less. As we specu-lated, the increased expression of miR501-5p increased thephosphorylation of mTOR kinase in PL501-transfected KJ29 cells(Fig. 2D). Consistently, similar data were obtained by using Caki-2 cells (Fig. 2E). Since mTOR signaling stimulates several biologicalprocesses including cell proliferation and survival [34], the upreg-ulation of miR501-5p in both KJ29 and Caki-2 PL501-transfectedcells was associated with significantly increased cell proliferationand survival (Fig. 2F–H). Transfection with lower doses of PL501(<0.75 lg/mL) still enhanced cell growth and survival, even if withmilder effects (data not shown). Interestingly, mTOR signaling isknown to stimulate MDM2 expression [23,13], an inhibitor of theoncosuppressor p53 in metastatic kidney cancer [25]. Therefore,the upregulation of miR501-5p that stimulates mTOR, should alsoaffect the expression of MDM2 and p53 proteins. As expected, thetransfection of KJ29 and Caki-2 cells with PL501 not only caused anenhanced expression of MDM2, but also induced a significant
reduction of p53 levels (Fig. 3A and B). MDM2 is an E3 ubiquitin-protein ligase that on interacting with p53 causes polyubiquitina-tion and degradation of MDM2/p53 complex by proteasome acti-vation [30]. Consistently, in KJ29 cells overexpressing miR501-5psequences an increased p53 protein ubiquitination was detected(Fig. 3C). Pharmacological inhibition of mTOR activity by rapamy-cin treatment of KJ29 cells transfected with PL501 (Fig. 3D) raisedthe levels of p53 protein by inhibition of MDM2 expression(Fig. 3D). Moreover, the treatment with 500 nM rapamycin inPL501-transfected cells also caused a significant reduction of cellproliferation and survival compared with untreated cells(Fig. 3E–G). These data suggest that miR501-5p, likely throughTSC1 mRNA degradation, stimulates cell proliferation and survivalby degradation of p53 in a mechanism involving the activation ofmTOR kinase and MDM2 expression in kidney carcinoma cells.
3.3. MicroRNA501-5p downregulation induces cell death by activationof apoptotic machinery
Since the upregulation of miR501-5p stimulates cell prolifera-tion and survival, it is presumable that its reduction may be asso-
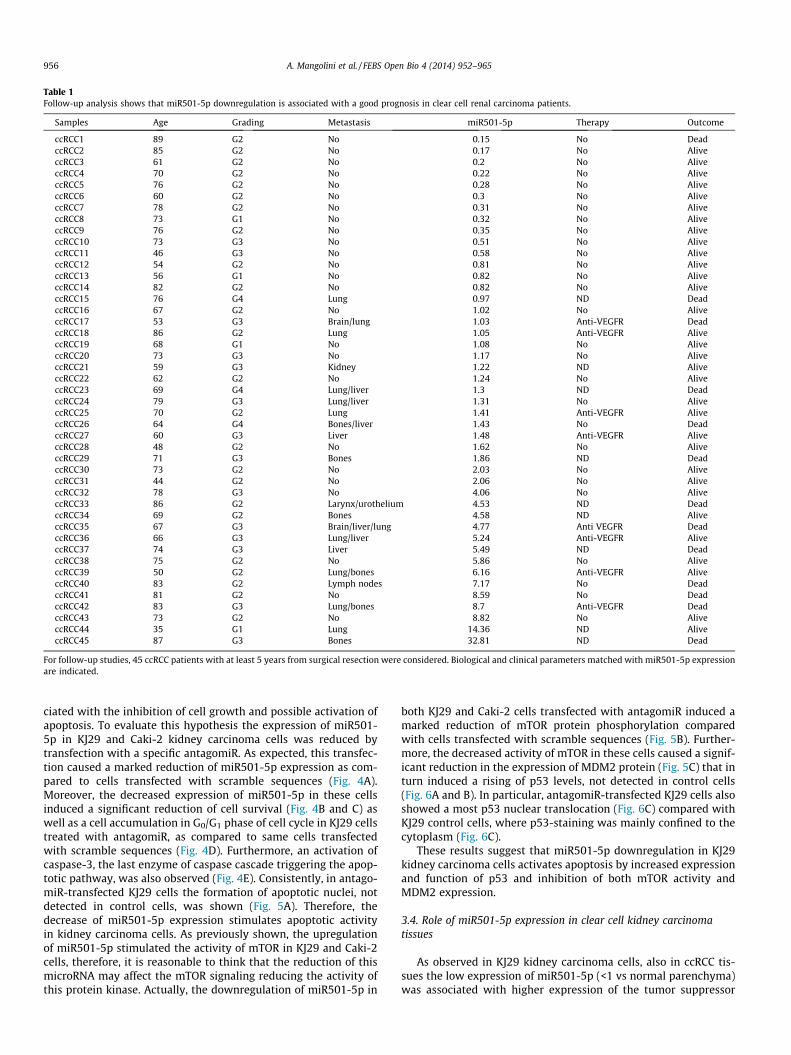
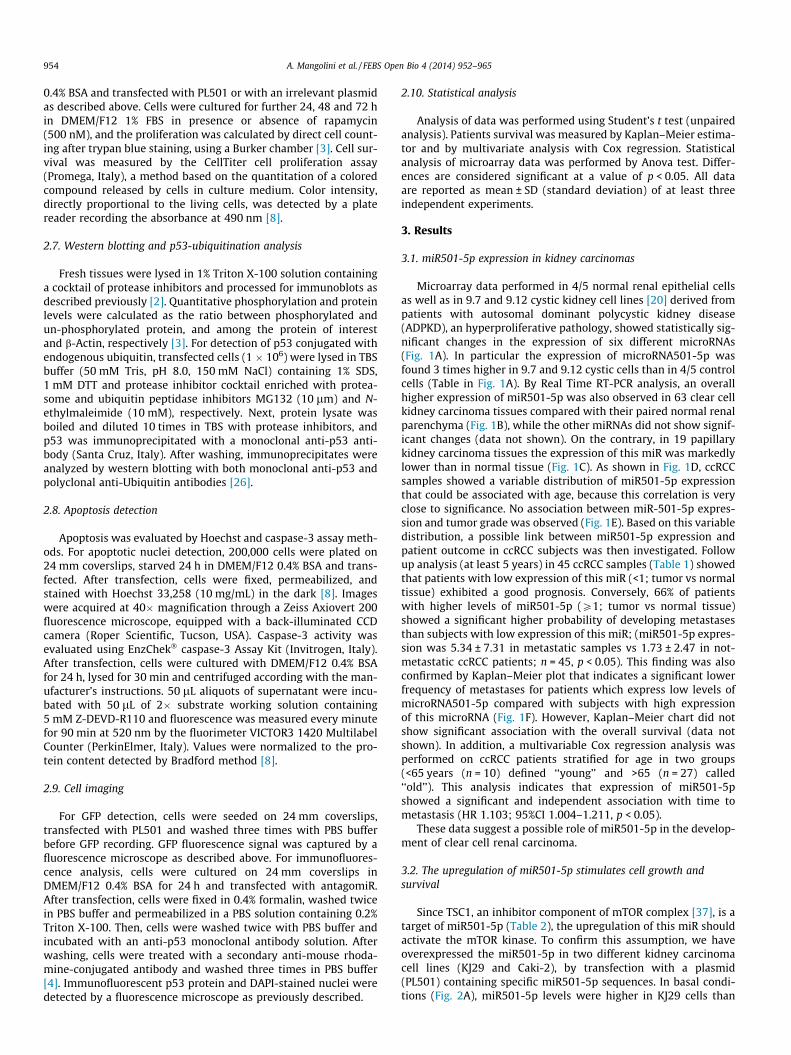
Table 1Follow-up analysis shows that miR501-5p downregulation is associated with a good prognosis in clear cell renal carcinoma patients.
Samples Age Grading Metastasis miR501-5p Therapy Outcome
ccRCC1 89 G2 No 0.15 No DeadccRCC2 85 G2 No 0.17 No AliveccRCC3 61 G2 No 0.2 No AliveccRCC4 70 G2 No 0.22 No AliveccRCC5 76 G2 No 0.28 No AliveccRCC6 60 G2 No 0.3 No AliveccRCC7 78 G2 No 0.31 No AliveccRCC8 73 G1 No 0.32 No AliveccRCC9 76 G2 No 0.35 No AliveccRCC10 73 G3 No 0.51 No AliveccRCC11 46 G3 No 0.58 No AliveccRCC12 54 G2 No 0.81 No AliveccRCC13 56 G1 No 0.82 No AliveccRCC14 82 G2 No 0.82 No AliveccRCC15 76 G4 Lung 0.97 ND DeadccRCC16 67 G2 No 1.02 No AliveccRCC17 53 G3 Brain/lung 1.03 Anti-VEGFR DeadccRCC18 86 G2 Lung 1.05 Anti-VEGFR AliveccRCC19 68 G1 No 1.08 No AliveccRCC20 73 G3 No 1.17 No AliveccRCC21 59 G3 Kidney 1.22 ND AliveccRCC22 62 G2 No 1.24 No AliveccRCC23 69 G4 Lung/liver 1.3 ND DeadccRCC24 79 G3 Lung/liver 1.31 No AliveccRCC25 70 G2 Lung 1.41 Anti-VEGFR AliveccRCC26 64 G4 Bones/liver 1.43 No DeadccRCC27 60 G3 Liver 1.48 Anti-VEGFR AliveccRCC28 48 G2 No 1.62 No AliveccRCC29 71 G3 Bones 1.86 ND DeadccRCC30 73 G2 No 2.03 No AliveccRCC31 44 G2 No 2.06 No AliveccRCC32 78 G3 No 4.06 No AliveccRCC33 86 G2 Larynx/urothelium 4.53 ND DeadccRCC34 69 G2 Bones 4.58 ND AliveccRCC35 67 G3 Brain/liver/lung 4.77 Anti VEGFR DeadccRCC36 66 G3 Lung/liver 5.24 Anti-VEGFR AliveccRCC37 74 G3 Liver 5.49 ND DeadccRCC38 75 G2 No 5.86 No AliveccRCC39 50 G2 Lung/bones 6.16 Anti-VEGFR AliveccRCC40 83 G2 Lymph nodes 7.17 No DeadccRCC41 81 G2 No 8.59 No DeadccRCC42 83 G3 Lung/bones 8.7 Anti-VEGFR DeadccRCC43 73 G2 No 8.82 No AliveccRCC44 35 G1 Lung 14.36 ND AliveccRCC45 87 G3 Bones 32.81 ND Dead
For follow-up studies, 45 ccRCC patients with at least 5 years from surgical resection were considered. Biological and clinical parameters matched with miR501-5p expressionare indicated.
956 A. Mangolini et al. / FEBS Open Bio 4 (2014) 952–965
ciated with the inhibition of cell growth and possible activation ofapoptosis. To evaluate this hypothesis the expression of miR501-5p in KJ29 and Caki-2 kidney carcinoma cells was reduced bytransfection with a specific antagomiR. As expected, this transfec-tion caused a marked reduction of miR501-5p expression as com-pared to cells transfected with scramble sequences (Fig. 4A).Moreover, the decreased expression of miR501-5p in these cellsinduced a significant reduction of cell survival (Fig. 4B and C) aswell as a cell accumulation in G0/G1 phase of cell cycle in KJ29 cellstreated with antagomiR, as compared to same cells transfectedwith scramble sequences (Fig. 4D). Furthermore, an activation ofcaspase-3, the last enzyme of caspase cascade triggering the apop-totic pathway, was also observed (Fig. 4E). Consistently, in antago-miR-transfected KJ29 cells the formation of apoptotic nuclei, notdetected in control cells, was shown (Fig. 5A). Therefore, thedecrease of miR501-5p expression stimulates apoptotic activityin kidney carcinoma cells. As previously shown, the upregulationof miR501-5p stimulated the activity of mTOR in KJ29 and Caki-2cells, therefore, it is reasonable to think that the reduction of thismicroRNA may affect the mTOR signaling reducing the activity ofthis protein kinase. Actually, the downregulation of miR501-5p in
both KJ29 and Caki-2 cells transfected with antagomiR induced amarked reduction of mTOR protein phosphorylation comparedwith cells transfected with scramble sequences (Fig. 5B). Further-more, the decreased activity of mTOR in these cells caused a signif-icant reduction in the expression of MDM2 protein (Fig. 5C) that inturn induced a rising of p53 levels, not detected in control cells(Fig. 6A and B). In particular, antagomiR-transfected KJ29 cells alsoshowed a most p53 nuclear translocation (Fig. 6C) compared withKJ29 control cells, where p53-staining was mainly confined to thecytoplasm (Fig. 6C).
These results suggest that miR501-5p downregulation in KJ29kidney carcinoma cells activates apoptosis by increased expressionand function of p53 and inhibition of both mTOR activity andMDM2 expression.
3.4. Role of miR501-5p expression in clear cell kidney carcinomatissues
As observed in KJ29 kidney carcinoma cells, also in ccRCC tis-sues the low expression of miR501-5p (<1 vs normal parenchyma)was associated with higher expression of the tumor suppressor
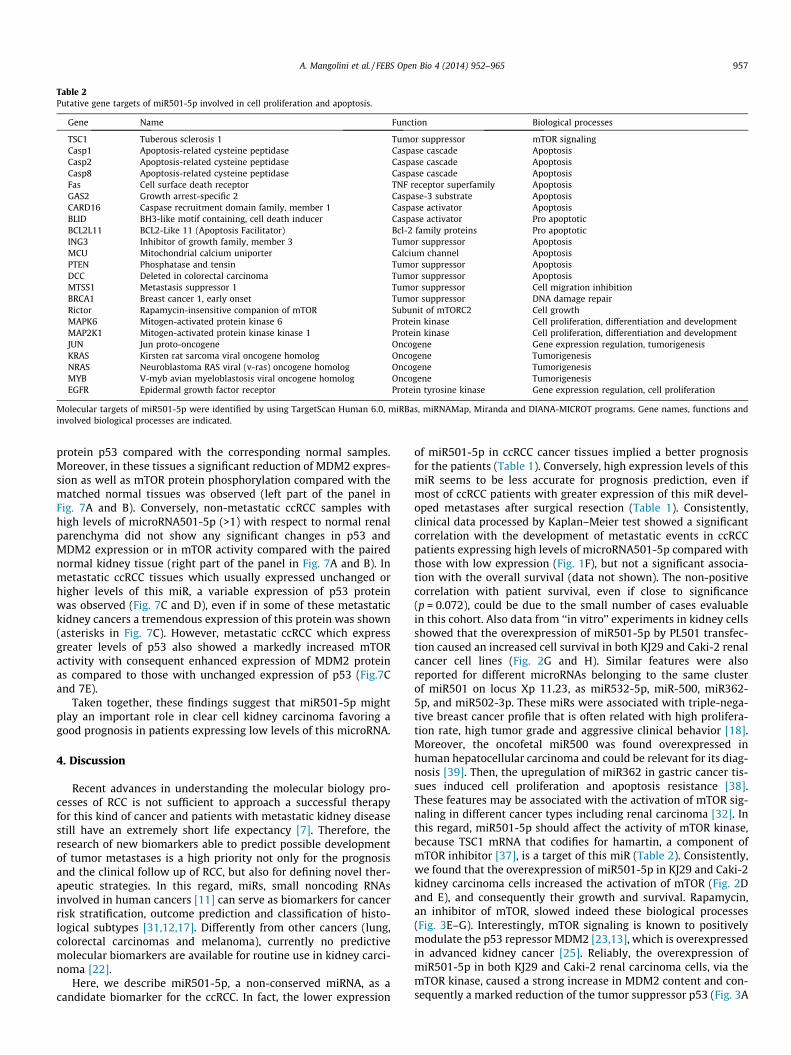
Table 2Putative gene targets of miR501-5p involved in cell proliferation and apoptosis.
Gene Name Function Biological processes
TSC1 Tuberous sclerosis 1 Tumor suppressor mTOR signalingCasp1 Apoptosis-related cysteine peptidase Caspase cascade ApoptosisCasp2 Apoptosis-related cysteine peptidase Caspase cascade ApoptosisCasp8 Apoptosis-related cysteine peptidase Caspase cascade ApoptosisFas Cell surface death receptor TNF receptor superfamily ApoptosisGAS2 Growth arrest-specific 2 Caspase-3 substrate ApoptosisCARD16 Caspase recruitment domain family, member 1 Caspase activator ApoptosisBLID BH3-like motif containing, cell death inducer Caspase activator Pro apoptoticBCL2L11 BCL2-Like 11 (Apoptosis Facilitator) Bcl-2 family proteins Pro apoptoticING3 Inhibitor of growth family, member 3 Tumor suppressor ApoptosisMCU Mitochondrial calcium uniporter Calcium channel ApoptosisPTEN Phosphatase and tensin Tumor suppressor ApoptosisDCC Deleted in colorectal carcinoma Tumor suppressor ApoptosisMTSS1 Metastasis suppressor 1 Tumor suppressor Cell migration inhibitionBRCA1 Breast cancer 1, early onset Tumor suppressor DNA damage repairRictor Rapamycin-insensitive companion of mTOR Subunit of mTORC2 Cell growthMAPK6 Mitogen-activated protein kinase 6 Protein kinase Cell proliferation, differentiation and developmentMAP2K1 Mitogen-activated protein kinase kinase 1 Protein kinase Cell proliferation, differentiation and developmentJUN Jun proto-oncogene Oncogene Gene expression regulation, tumorigenesisKRAS Kirsten rat sarcoma viral oncogene homolog Oncogene TumorigenesisNRAS Neuroblastoma RAS viral (v-ras) oncogene homolog Oncogene TumorigenesisMYB V-myb avian myeloblastosis viral oncogene homolog Oncogene TumorigenesisEGFR Epidermal growth factor receptor Protein tyrosine kinase Gene expression regulation, cell proliferation
Molecular targets of miR501-5p were identified by using TargetScan Human 6.0, miRBas, miRNAMap, Miranda and DIANA-MICROT programs. Gene names, functions andinvolved biological processes are indicated.
A. Mangolini et al. / FEBS Open Bio 4 (2014) 952–965 957
protein p53 compared with the corresponding normal samples.Moreover, in these tissues a significant reduction of MDM2 expres-sion as well as mTOR protein phosphorylation compared with thematched normal tissues was observed (left part of the panel inFig. 7A and B). Conversely, non-metastatic ccRCC samples withhigh levels of microRNA501-5p (>1) with respect to normal renalparenchyma did not show any significant changes in p53 andMDM2 expression or in mTOR activity compared with the pairednormal kidney tissue (right part of the panel in Fig. 7A and B). Inmetastatic ccRCC tissues which usually expressed unchanged orhigher levels of this miR, a variable expression of p53 proteinwas observed (Fig. 7C and D), even if in some of these metastatickidney cancers a tremendous expression of this protein was shown(asterisks in Fig. 7C). However, metastatic ccRCC which expressgreater levels of p53 also showed a markedly increased mTORactivity with consequent enhanced expression of MDM2 proteinas compared to those with unchanged expression of p53 (Fig.7Cand 7E).
Taken together, these findings suggest that miR501-5p mightplay an important role in clear cell kidney carcinoma favoring agood prognosis in patients expressing low levels of this microRNA.
4. Discussion
Recent advances in understanding the molecular biology pro-cesses of RCC is not sufficient to approach a successful therapyfor this kind of cancer and patients with metastatic kidney diseasestill have an extremely short life expectancy [7]. Therefore, theresearch of new biomarkers able to predict possible developmentof tumor metastases is a high priority not only for the prognosisand the clinical follow up of RCC, but also for defining novel ther-apeutic strategies. In this regard, miRs, small noncoding RNAsinvolved in human cancers [11] can serve as biomarkers for cancerrisk stratification, outcome prediction and classification of histo-logical subtypes [31,12,17]. Differently from other cancers (lung,colorectal carcinomas and melanoma), currently no predictivemolecular biomarkers are available for routine use in kidney carci-noma [22].
Here, we describe miR501-5p, a non-conserved miRNA, as acandidate biomarker for the ccRCC. In fact, the lower expression
of miR501-5p in ccRCC cancer tissues implied a better prognosisfor the patients (Table 1). Conversely, high expression levels of thismiR seems to be less accurate for prognosis prediction, even ifmost of ccRCC patients with greater expression of this miR devel-oped metastases after surgical resection (Table 1). Consistently,clinical data processed by Kaplan–Meier test showed a significantcorrelation with the development of metastatic events in ccRCCpatients expressing high levels of microRNA501-5p compared withthose with low expression (Fig. 1F), but not a significant associa-tion with the overall survival (data not shown). The non-positivecorrelation with patient survival, even if close to significance(p = 0.072), could be due to the small number of cases evaluablein this cohort. Also data from ‘‘in vitro’’ experiments in kidney cellsshowed that the overexpression of miR501-5p by PL501 transfec-tion caused an increased cell survival in both KJ29 and Caki-2 renalcancer cell lines (Fig. 2G and H). Similar features were alsoreported for different microRNAs belonging to the same clusterof miR501 on locus Xp 11.23, as miR532-5p, miR-500, miR362-5p, and miR502-3p. These miRs were associated with triple-nega-tive breast cancer profile that is often related with high prolifera-tion rate, high tumor grade and aggressive clinical behavior [18].Moreover, the oncofetal miR500 was found overexpressed inhuman hepatocellular carcinoma and could be relevant for its diag-nosis [39]. Then, the upregulation of miR362 in gastric cancer tis-sues induced cell proliferation and apoptosis resistance [38].These features may be associated with the activation of mTOR sig-naling in different cancer types including renal carcinoma [32]. Inthis regard, miR501-5p should affect the activity of mTOR kinase,because TSC1 mRNA that codifies for hamartin, a component ofmTOR inhibitor [37], is a target of this miR (Table 2). Consistently,we found that the overexpression of miR501-5p in KJ29 and Caki-2kidney carcinoma cells increased the activation of mTOR (Fig. 2Dand E), and consequently their growth and survival. Rapamycin,an inhibitor of mTOR, slowed indeed these biological processes(Fig. 3E–G). Interestingly, mTOR signaling is known to positivelymodulate the p53 repressor MDM2 [23,13], which is overexpressedin advanced kidney cancer [25]. Reliably, the overexpression ofmiR501-5p in both KJ29 and Caki-2 renal carcinoma cells, via themTOR kinase, caused a strong increase in MDM2 content and con-sequently a marked reduction of the tumor suppressor p53 (Fig. 3A
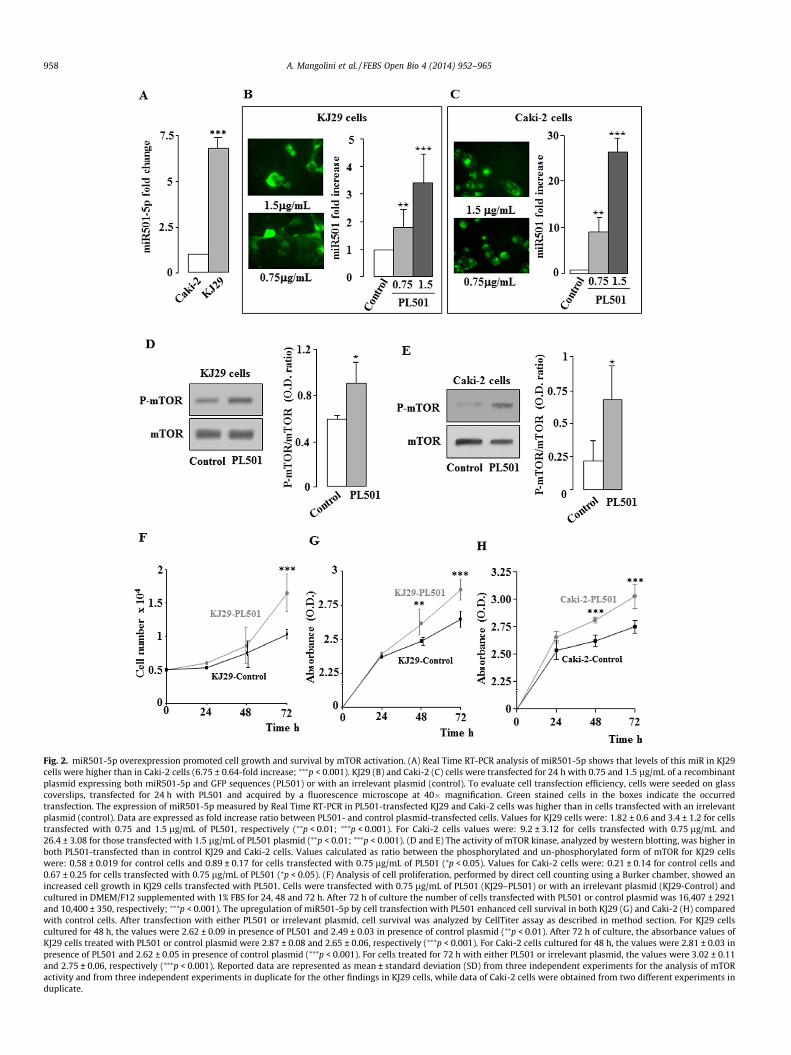
Fig. 2. miR501-5p overexpression promoted cell growth and survival by mTOR activation. (A) Real Time RT-PCR analysis of miR501-5p shows that levels of this miR in KJ29cells were higher than in Caki-2 cells (6.75 ± 0.64-fold increase; ⁄⁄⁄p < 0.001). KJ29 (B) and Caki-2 (C) cells were transfected for 24 h with 0.75 and 1.5 lg/mL of a recombinantplasmid expressing both miR501-5p and GFP sequences (PL501) or with an irrelevant plasmid (control). To evaluate cell transfection efficiency, cells were seeded on glasscoverslips, transfected for 24 h with PL501 and acquired by a fluorescence microscope at 40� magnification. Green stained cells in the boxes indicate the occurredtransfection. The expression of miR501-5p measured by Real Time RT-PCR in PL501-transfected KJ29 and Caki-2 cells was higher than in cells transfected with an irrelevantplasmid (control). Data are expressed as fold increase ratio between PL501- and control plasmid-transfected cells. Values for KJ29 cells were: 1.82 ± 0.6 and 3.4 ± 1.2 for cellstransfected with 0.75 and 1.5 lg/mL of PL501, respectively (⁄⁄p < 0.01; ⁄⁄⁄p < 0.001). For Caki-2 cells values were: 9.2 ± 3.12 for cells transfected with 0.75 lg/mL and26.4 ± 3.08 for those transfected with 1.5 lg/mL of PL501 plasmid (⁄⁄p < 0.01; ⁄⁄⁄p < 0.001). (D and E) The activity of mTOR kinase, analyzed by western blotting, was higher inboth PL501-transfected than in control KJ29 and Caki-2 cells. Values calculated as ratio between the phosphorylated and un-phosphorylated form of mTOR for KJ29 cellswere: 0.58 ± 0.019 for control cells and 0.89 ± 0.17 for cells transfected with 0.75 lg/mL of PL501 (⁄p < 0.05). Values for Caki-2 cells were: 0.21 ± 0.14 for control cells and0.67 ± 0.25 for cells transfected with 0.75 lg/mL of PL501 (⁄p < 0.05). (F) Analysis of cell proliferation, performed by direct cell counting using a Burker chamber, showed anincreased cell growth in KJ29 cells transfected with PL501. Cells were transfected with 0.75 lg/mL of PL501 (KJ29–PL501) or with an irrelevant plasmid (KJ29-Control) andcultured in DMEM/F12 supplemented with 1% FBS for 24, 48 and 72 h. After 72 h of culture the number of cells transfected with PL501 or control plasmid was 16,407 ± 2921and 10,400 ± 350, respectively; ⁄⁄⁄p < 0.001). The upregulation of miR501-5p by cell transfection with PL501 enhanced cell survival in both KJ29 (G) and Caki-2 (H) comparedwith control cells. After transfection with either PL501 or irrelevant plasmid, cell survival was analyzed by CellTiter assay as described in method section. For KJ29 cellscultured for 48 h, the values were 2.62 ± 0.09 in presence of PL501 and 2.49 ± 0.03 in presence of control plasmid (⁄⁄p < 0.01). After 72 h of culture, the absorbance values ofKJ29 cells treated with PL501 or control plasmid were 2.87 ± 0.08 and 2.65 ± 0.06, respectively (⁄⁄⁄p < 0.001). For Caki-2 cells cultured for 48 h, the values were 2.81 ± 0.03 inpresence of PL501 and 2.62 ± 0.05 in presence of control plasmid (⁄⁄⁄p < 0.001). For cells treated for 72 h with either PL501 or irrelevant plasmid, the values were 3.02 ± 0.11and 2.75 ± 0.06, respectively (⁄⁄⁄p < 0.001). Reported data are represented as mean ± standard deviation (SD) from three independent experiments for the analysis of mTORactivity and from three independent experiments in duplicate for the other findings in KJ29 cells, while data of Caki-2 cells were obtained from two different experiments induplicate.
958 A. Mangolini et al. / FEBS Open Bio 4 (2014) 952–965
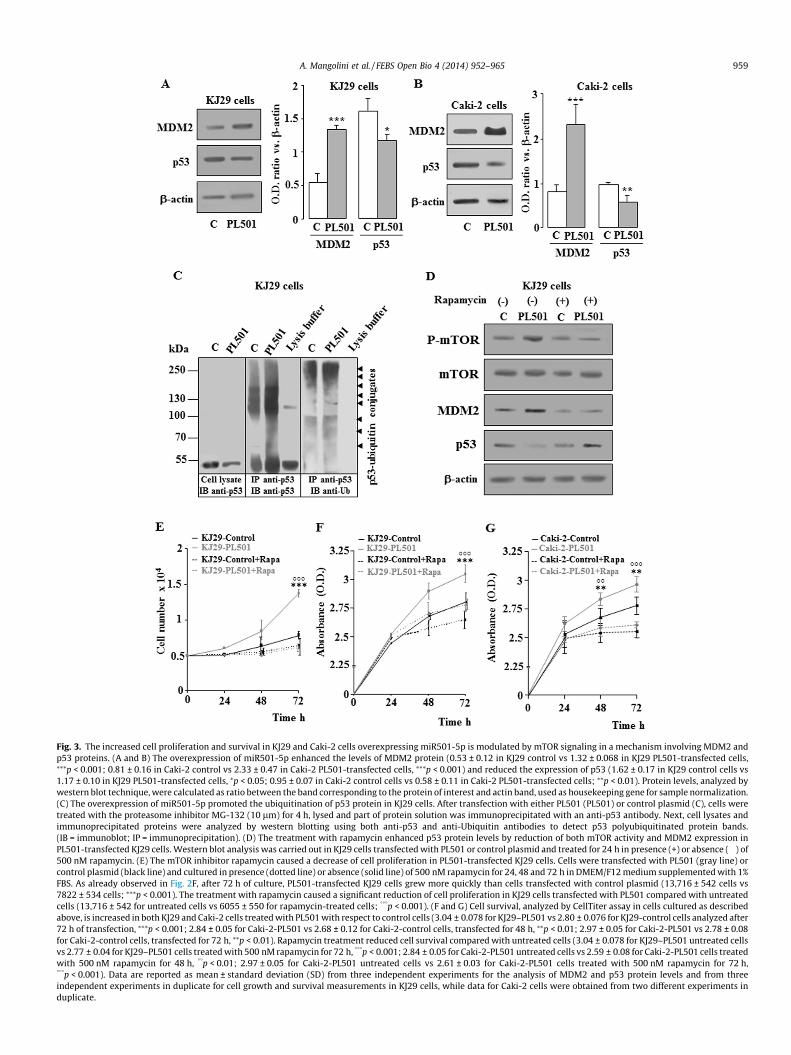
Fig. 3. The increased cell proliferation and survival in KJ29 and Caki-2 cells overexpressing miR501-5p is modulated by mTOR signaling in a mechanism involving MDM2 andp53 proteins. (A and B) The overexpression of miR501-5p enhanced the levels of MDM2 protein (0.53 ± 0.12 in KJ29 control vs 1.32 ± 0.068 in KJ29 PL501-transfected cells,⁄⁄⁄p < 0.001; 0.81 ± 0.16 in Caki-2 control vs 2.33 ± 0.47 in Caki-2 PL501-transfected cells, ⁄⁄⁄p < 0.001) and reduced the expression of p53 (1.62 ± 0.17 in KJ29 control cells vs1.17 ± 0.10 in KJ29 PL501-transfected cells, ⁄p < 0.05; 0.95 ± 0.07 in Caki-2 control cells vs 0.58 ± 0.11 in Caki-2 PL501-transfected cells; ⁄⁄p < 0.01). Protein levels, analyzed bywestern blot technique, were calculated as ratio between the band corresponding to the protein of interest and actin band, used as housekeeping gene for sample normalization.(C) The overexpression of miR501-5p promoted the ubiquitination of p53 protein in KJ29 cells. After transfection with either PL501 (PL501) or control plasmid (C), cells weretreated with the proteasome inhibitor MG-132 (10 lm) for 4 h, lysed and part of protein solution was immunoprecipitated with an anti-p53 antibody. Next, cell lysates andimmunoprecipitated proteins were analyzed by western blotting using both anti-p53 and anti-Ubiquitin antibodies to detect p53 polyubiquitinated protein bands.(IB = immunoblot; IP = immunoprecipitation). (D) The treatment with rapamycin enhanced p53 protein levels by reduction of both mTOR activity and MDM2 expression inPL501-transfected KJ29 cells. Western blot analysis was carried out in KJ29 cells transfected with PL501 or control plasmid and treated for 24 h in presence (+) or absence (�) of500 nM rapamycin. (E) The mTOR inhibitor rapamycin caused a decrease of cell proliferation in PL501-transfected KJ29 cells. Cells were transfected with PL501 (gray line) orcontrol plasmid (black line) and cultured in presence (dotted line) or absence (solid line) of 500 nM rapamycin for 24, 48 and 72 h in DMEM/F12 medium supplemented with 1%FBS. As already observed in Fig. 2F, after 72 h of culture, PL501-transfected KJ29 cells grew more quickly than cells transfected with control plasmid (13,716 ± 542 cells vs7822 ± 534 cells; ⁄⁄⁄p < 0.001). The treatment with rapamycin caused a significant reduction of cell proliferation in KJ29 cells transfected with PL501 compared with untreatedcells (13,716 ± 542 for untreated cells vs 6055 ± 550 for rapamycin-treated cells; ���p < 0.001). (F and G) Cell survival, analyzed by CellTiter assay in cells cultured as describedabove, is increased in both KJ29 and Caki-2 cells treated with PL501 with respect to control cells (3.04 ± 0.078 for KJ29–PL501 vs 2.80 ± 0.076 for KJ29-control cells analyzed after72 h of transfection, ⁄⁄⁄p < 0.001; 2.84 ± 0.05 for Caki-2-PL501 vs 2.68 ± 0.12 for Caki-2-control cells, transfected for 48 h, ⁄⁄p < 0.01; 2.97 ± 0.05 for Caki-2-PL501 vs 2.78 ± 0.08for Caki-2-control cells, transfected for 72 h, ⁄⁄p < 0.01). Rapamycin treatment reduced cell survival compared with untreated cells (3.04 ± 0.078 for KJ29–PL501 untreated cellsvs 2.77 ± 0.04 for KJ29–PL501 cells treated with 500 nM rapamycin for 72 h, ���p < 0.001; 2.84 ± 0.05 for Caki-2-PL501 untreated cells vs 2.59 ± 0.08 for Caki-2-PL501 cells treatedwith 500 nM rapamycin for 48 h, ��p < 0.01; 2.97 ± 0.05 for Caki-2-PL501 untreated cells vs 2.61 ± 0.03 for Caki-2-PL501 cells treated with 500 nM rapamycin for 72 h,���p < 0.001). Data are reported as mean ± standard deviation (SD) from three independent experiments for the analysis of MDM2 and p53 protein levels and from threeindependent experiments in duplicate for cell growth and survival measurements in KJ29 cells, while data for Caki-2 cells were obtained from two different experiments induplicate.
A. Mangolini et al. / FEBS Open Bio 4 (2014) 952–965 959
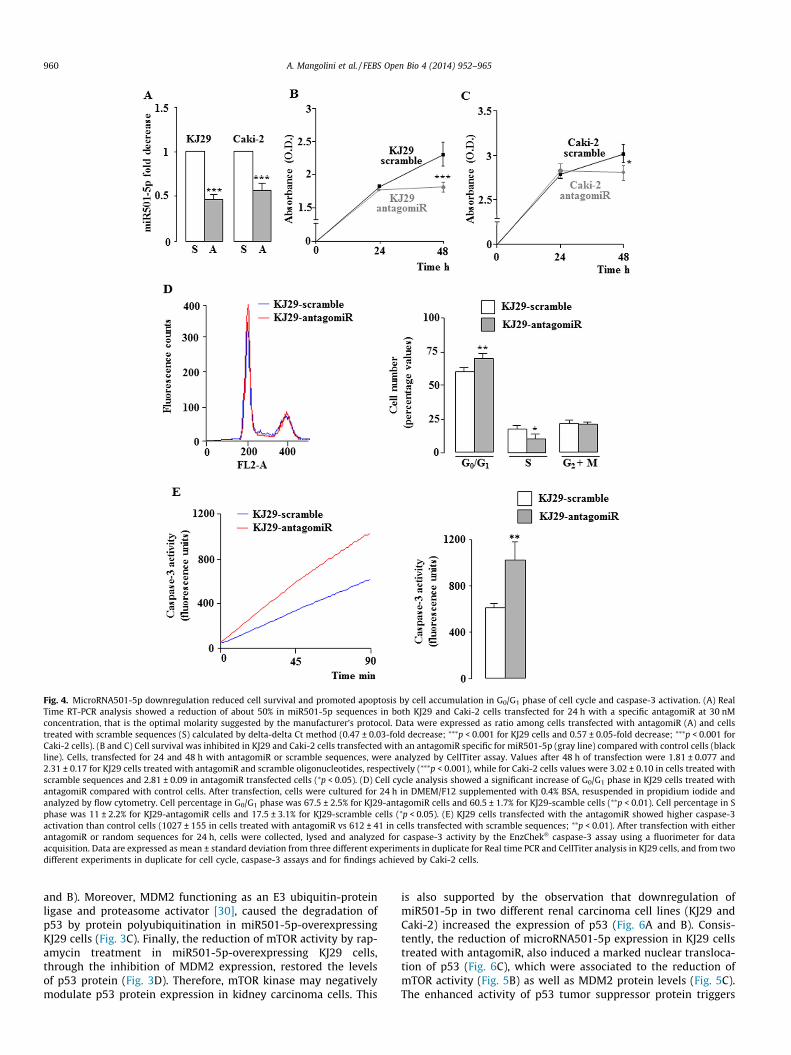
Fig. 4. MicroRNA501-5p downregulation reduced cell survival and promoted apoptosis by cell accumulation in G0/G1 phase of cell cycle and caspase-3 activation. (A) RealTime RT-PCR analysis showed a reduction of about 50% in miR501-5p sequences in both KJ29 and Caki-2 cells transfected for 24 h with a specific antagomiR at 30 nMconcentration, that is the optimal molarity suggested by the manufacturer’s protocol. Data were expressed as ratio among cells transfected with antagomiR (A) and cellstreated with scramble sequences (S) calculated by delta-delta Ct method (0.47 ± 0.03-fold decrease; ⁄⁄⁄p < 0.001 for KJ29 cells and 0.57 ± 0.05-fold decrease; ⁄⁄⁄p < 0.001 forCaki-2 cells). (B and C) Cell survival was inhibited in KJ29 and Caki-2 cells transfected with an antagomiR specific for miR501-5p (gray line) compared with control cells (blackline). Cells, transfected for 24 and 48 h with antagomiR or scramble sequences, were analyzed by CellTiter assay. Values after 48 h of transfection were 1.81 ± 0.077 and2.31 ± 0.17 for KJ29 cells treated with antagomiR and scramble oligonucleotides, respectively (⁄⁄⁄p < 0.001), while for Caki-2 cells values were 3.02 ± 0.10 in cells treated withscramble sequences and 2.81 ± 0.09 in antagomiR transfected cells (⁄p < 0.05). (D) Cell cycle analysis showed a significant increase of G0/G1 phase in KJ29 cells treated withantagomiR compared with control cells. After transfection, cells were cultured for 24 h in DMEM/F12 supplemented with 0.4% BSA, resuspended in propidium iodide andanalyzed by flow cytometry. Cell percentage in G0/G1 phase was 67.5 ± 2.5% for KJ29-antagomiR cells and 60.5 ± 1.7% for KJ29-scamble cells (⁄⁄p < 0.01). Cell percentage in Sphase was 11 ± 2.2% for KJ29-antagomiR cells and 17.5 ± 3.1% for KJ29-scramble cells (⁄p < 0.05). (E) KJ29 cells transfected with the antagomiR showed higher caspase-3activation than control cells (1027 ± 155 in cells treated with antagomiR vs 612 ± 41 in cells transfected with scramble sequences; ⁄⁄p < 0.01). After transfection with eitherantagomiR or random sequences for 24 h, cells were collected, lysed and analyzed for caspase-3 activity by the EnzChek� caspase-3 assay using a fluorimeter for dataacquisition. Data are expressed as mean ± standard deviation from three different experiments in duplicate for Real time PCR and CellTiter analysis in KJ29 cells, and from twodifferent experiments in duplicate for cell cycle, caspase-3 assays and for findings achieved by Caki-2 cells.
960 A. Mangolini et al. / FEBS Open Bio 4 (2014) 952–965
and B). Moreover, MDM2 functioning as an E3 ubiquitin-proteinligase and proteasome activator [30], caused the degradation ofp53 by protein polyubiquitination in miR501-5p-overexpressingKJ29 cells (Fig. 3C). Finally, the reduction of mTOR activity by rap-amycin treatment in miR501-5p-overexpressing KJ29 cells,through the inhibition of MDM2 expression, restored the levelsof p53 protein (Fig. 3D). Therefore, mTOR kinase may negativelymodulate p53 protein expression in kidney carcinoma cells. This
is also supported by the observation that downregulation ofmiR501-5p in two different renal carcinoma cell lines (KJ29 andCaki-2) increased the expression of p53 (Fig. 6A and B). Consis-tently, the reduction of microRNA501-5p expression in KJ29 cellstreated with antagomiR, also induced a marked nuclear transloca-tion of p53 (Fig. 6C), which were associated to the reduction ofmTOR activity (Fig. 5B) as well as MDM2 protein levels (Fig. 5C).The enhanced activity of p53 tumor suppressor protein triggers
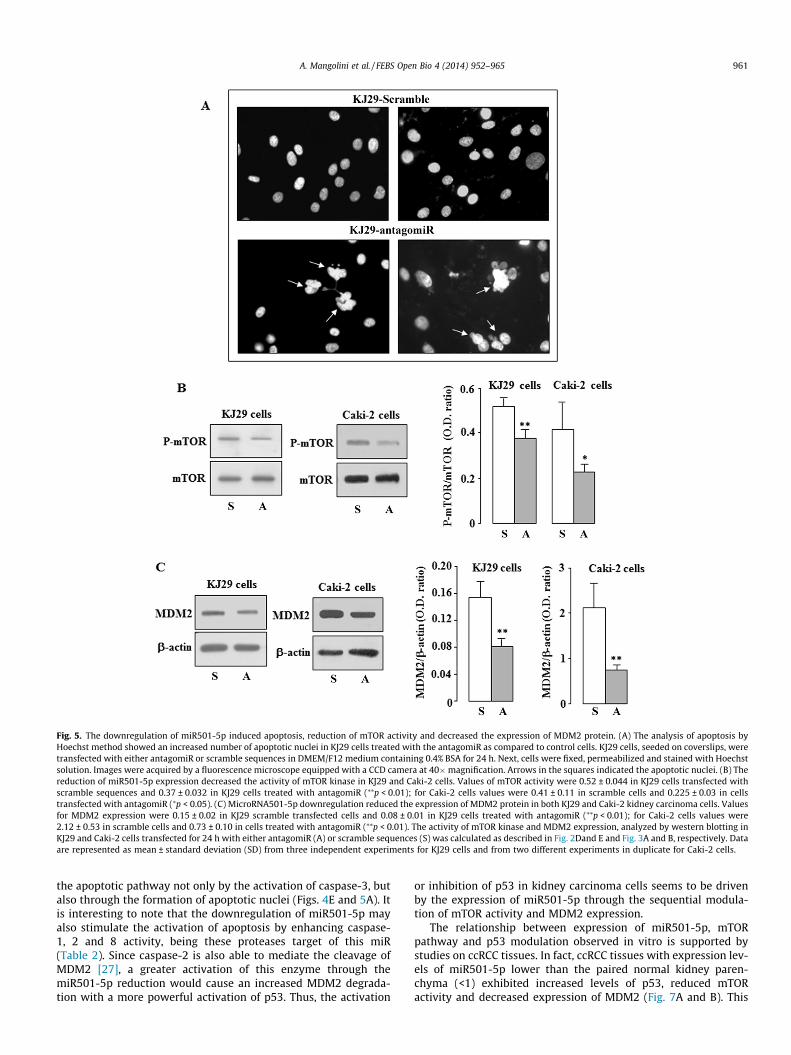
Fig. 5. The downregulation of miR501-5p induced apoptosis, reduction of mTOR activity and decreased the expression of MDM2 protein. (A) The analysis of apoptosis byHoechst method showed an increased number of apoptotic nuclei in KJ29 cells treated with the antagomiR as compared to control cells. KJ29 cells, seeded on coverslips, weretransfected with either antagomiR or scramble sequences in DMEM/F12 medium containing 0.4% BSA for 24 h. Next, cells were fixed, permeabilized and stained with Hoechstsolution. Images were acquired by a fluorescence microscope equipped with a CCD camera at 40�magnification. Arrows in the squares indicated the apoptotic nuclei. (B) Thereduction of miR501-5p expression decreased the activity of mTOR kinase in KJ29 and Caki-2 cells. Values of mTOR activity were 0.52 ± 0.044 in KJ29 cells transfected withscramble sequences and 0.37 ± 0.032 in KJ29 cells treated with antagomiR (⁄⁄p < 0.01); for Caki-2 cells values were 0.41 ± 0.11 in scramble cells and 0.225 ± 0.03 in cellstransfected with antagomiR (⁄p < 0.05). (C) MicroRNA501-5p downregulation reduced the expression of MDM2 protein in both KJ29 and Caki-2 kidney carcinoma cells. Valuesfor MDM2 expression were 0.15 ± 0.02 in KJ29 scramble transfected cells and 0.08 ± 0.01 in KJ29 cells treated with antagomiR (⁄⁄p < 0.01); for Caki-2 cells values were2.12 ± 0.53 in scramble cells and 0.73 ± 0.10 in cells treated with antagomiR (⁄⁄p < 0.01). The activity of mTOR kinase and MDM2 expression, analyzed by western blotting inKJ29 and Caki-2 cells transfected for 24 h with either antagomiR (A) or scramble sequences (S) was calculated as described in Fig. 2Dand E and Fig. 3A and B, respectively. Dataare represented as mean ± standard deviation (SD) from three independent experiments for KJ29 cells and from two different experiments in duplicate for Caki-2 cells.
A. Mangolini et al. / FEBS Open Bio 4 (2014) 952–965 961
the apoptotic pathway not only by the activation of caspase-3, butalso through the formation of apoptotic nuclei (Figs. 4E and 5A). Itis interesting to note that the downregulation of miR501-5p mayalso stimulate the activation of apoptosis by enhancing caspase-1, 2 and 8 activity, being these proteases target of this miR(Table 2). Since caspase-2 is also able to mediate the cleavage ofMDM2 [27], a greater activation of this enzyme through themiR501-5p reduction would cause an increased MDM2 degrada-tion with a more powerful activation of p53. Thus, the activation
or inhibition of p53 in kidney carcinoma cells seems to be drivenby the expression of miR501-5p through the sequential modula-tion of mTOR activity and MDM2 expression.
The relationship between expression of miR501-5p, mTORpathway and p53 modulation observed in vitro is supported bystudies on ccRCC tissues. In fact, ccRCC tissues with expression lev-els of miR501-5p lower than the paired normal kidney paren-chyma (<1) exhibited increased levels of p53, reduced mTORactivity and decreased expression of MDM2 (Fig. 7A and B). This

Fig. 6. The reduction of miR501-5p enhanced both expression and function of tumor suppressor p53. (A and B) KJ29 and Caki-2 cells transfected with the antagomiR (A)showed higher expression of p53 protein than cells treated with scramble sequences (S). Values were: 0.255 ± 0.08 for KJ29 control cells and 0.789 ± 0.07 for the same cellstransfected with antagomiR (⁄⁄p < 0.01). For Caki-2 cells values were 1.5 ± 0.70 for control cells and 3.66 ± 0.47 for cells transfected with the antagomiR (⁄⁄p < 0.01). Proteinlevels were calculated as described in Fig. 3A and B. (C) The analysis of p53 by immunofluorescence in KJ29-antagomiR cells highlight a greater nuclear translocation of p53than in KJ29 control cells. Cells, seeded on 10 mm coverslips and transfected with either antagomiR or random sequences, were fixed, permeabilized and treated with an anti-p53 monoclonal antibody. After several washes, cells were treated with a secondary antibody conjugated with rhodamine. Nuclei were marked with Dapi and images wereacquired at 40�magnification by a fluorescence microscope equipped with a CCD camera. Arrows show the immunopositive nuclei. Data are represented as mean ± standarddeviation (SD) from three independent experiments in KJ29 cells and from two different experiments in duplicate for Caki-2 cells.
962 A. Mangolini et al. / FEBS Open Bio 4 (2014) 952–965
molecular mechanism could support the good prognosis observedin ccRCC patients with low levels of miR501-5p. However, asshown in Fig. 7A (right part), 7B and 7C, the upregulation of thismiR in ccRCC tissues not always affected mTOR activity neitherthe expression of MDM2 and p53 proteins. Nevertheless, this find-ing could be consistent with the lower informativeness on progno-sis prediction observed in patients with high levels of this miRNA,the most of which, anyway, may develop metastases (Table 1 andFig. 1F). Thus, differently from ‘‘in vitro’’ models, in ccRCC tissueswith higher expression of microRNA501-5p other mechanismsable to modulate mTOR signaling could be involved. It is possiblethat in these tissues, which are not protected by apoptosis any-more, the disease may adversely progress in case of somatic
mutations that activate oncogenic signals or inhibit tumor sup-pressor proteins. In these patients, other biomarkers such as p53expression should be taken into account because the role of thistumor suppressor protein in advanced kidney carcinoma is cur-rently discussed, being often associated with a poor prognosis[40]. In fact, in some advanced ccRCC tissues a tremendous overex-pression of p53 oncosuppressor protein was shown (samples iden-tified by asterisk in Fig. 7C). But, differently from other cancers, fewsomatic p53 mutations in ccRCC were reported [36], suggestingthat the inactivation of p53 might be due to other factors. Actually,in metastatic ccRCC tissues the overexpression of p53 is associatedwith an increased level of MDM2 protein that should induce p53degradation [36,25]. Also the present findings show that advanced
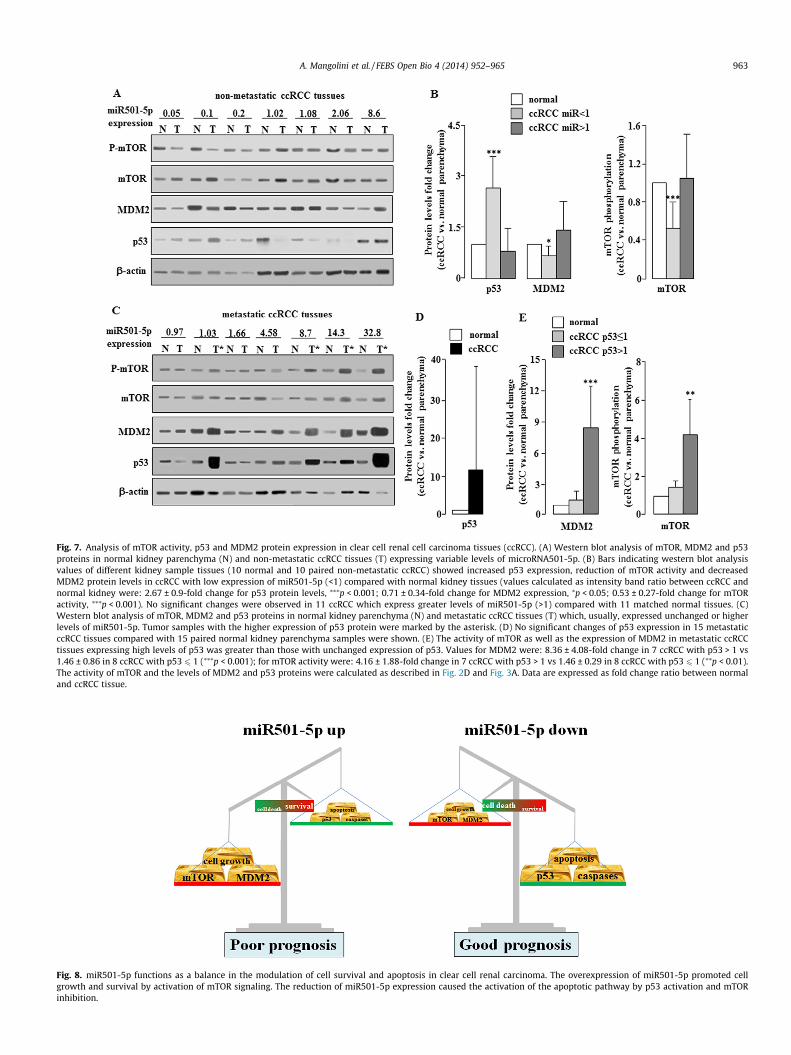
Fig. 7. Analysis of mTOR activity, p53 and MDM2 protein expression in clear cell renal cell carcinoma tissues (ccRCC). (A) Western blot analysis of mTOR, MDM2 and p53proteins in normal kidney parenchyma (N) and non-metastatic ccRCC tissues (T) expressing variable levels of microRNA501-5p. (B) Bars indicating western blot analysisvalues of different kidney sample tissues (10 normal and 10 paired non-metastatic ccRCC) showed increased p53 expression, reduction of mTOR activity and decreasedMDM2 protein levels in ccRCC with low expression of miR501-5p (<1) compared with normal kidney tissues (values calculated as intensity band ratio between ccRCC andnormal kidney were: 2.67 ± 0.9-fold change for p53 protein levels, ⁄⁄⁄p < 0.001; 0.71 ± 0.34-fold change for MDM2 expression, ⁄p < 0.05; 0.53 ± 0.27-fold change for mTORactivity, ⁄⁄⁄p < 0.001). No significant changes were observed in 11 ccRCC which express greater levels of miR501-5p (>1) compared with 11 matched normal tissues. (C)Western blot analysis of mTOR, MDM2 and p53 proteins in normal kidney parenchyma (N) and metastatic ccRCC tissues (T) which, usually, expressed unchanged or higherlevels of miR501-5p. Tumor samples with the higher expression of p53 protein were marked by the asterisk. (D) No significant changes of p53 expression in 15 metastaticccRCC tissues compared with 15 paired normal kidney parenchyma samples were shown. (E) The activity of mTOR as well as the expression of MDM2 in metastatic ccRCCtissues expressing high levels of p53 was greater than those with unchanged expression of p53. Values for MDM2 were: 8.36 ± 4.08-fold change in 7 ccRCC with p53 > 1 vs1.46 ± 0.86 in 8 ccRCC with p53 6 1 (⁄⁄⁄p < 0.001); for mTOR activity were: 4.16 ± 1.88-fold change in 7 ccRCC with p53 > 1 vs 1.46 ± 0.29 in 8 ccRCC with p53 6 1 (⁄⁄p < 0.01).The activity of mTOR and the levels of MDM2 and p53 proteins were calculated as described in Fig. 2D and Fig. 3A. Data are expressed as fold change ratio between normaland ccRCC tissue.
Fig. 8. miR501-5p functions as a balance in the modulation of cell survival and apoptosis in clear cell renal carcinoma. The overexpression of miR501-5p promoted cellgrowth and survival by activation of mTOR signaling. The reduction of miR501-5p expression caused the activation of the apoptotic pathway by p53 activation and mTORinhibition.
A. Mangolini et al. / FEBS Open Bio 4 (2014) 952–965 963
964 A. Mangolini et al. / FEBS Open Bio 4 (2014) 952–965
ccRCC tissues overexpressing p53 showed higher MDM2 levels aswell as mTOR phosphorylation compared with ccRCC tissues withlower or unchanged p53 expression (samples marked with asteriskin Fig. 7C and E). The enhancement of mTOR signaling may be asso-ciated with unfavorable progression of kidney cancer [28] and, thetreatment with mTOR inhibitors might improve the survival inpatients with metastatic kidney carcinoma [6,15], as also observedin our data (Fig. 3C–E). Therefore, as suggested in other studies,these factors could be considered as candidate biomarkers usefulto detect poor prognosis for ccRCC patients [40,28,25].
In conclusion, we can speculate that miR501-5p may have a roleof balance among apoptosis and cell survival in kidney cancer cells(Fig. 8). If expressed at low levels, miR501-5p could be considereda new biomarker associated with good prognosis for ccRCC, justbecause the expression of MDM2 remains low while p53 expres-sion and apoptosis are stimulated. Conversely, the overexpressionof this miR caused cell growth and survival that could exposeccRCC patients to development of metastasis and its informative-ness on tumor prognosis becomes inaccurate. In this case, othermarkers, like mTOR-associated elements which are involved inadvanced ccRCC, should be taken in account as important tool forpoor prognosis detection in ccRCC patients. Finally, the findingshere reported suggest that ccRCC patients who express high levelsof miR501-5p could be treated with specific miR501-5p antago-nists as new therapeutic approach for the treatment of ccRCC.
Acknowledgements
We greatly thank: Prof. Harris of Mayo Clinic (Rochester, USA)who kindly provided us human normal (4/5) and cystic (9.7 and9.12) kidney epithelial cells; Prof. Gavioli, Dept. of Life Sciencesand Biotechnologies, University of Ferrara (Ferrara, Italy) for assis-tance in ubiquitin detection experiments; Dr Marco Galasso, Dept.of Morphology, Surgery and Experimental Medicine, University ofFerrara (Ferrara, Italy) for Kaplan–Meier and Cox regression analy-sis; Roberta Gafà and Roberto Mazzoni, Department of Morphol-ogy, Surgery and Experimental Medicine, for the collection ofparaffin embedded tissues. Finally, we greatly thank Prof. NicolettaGalliano, Dept. of Biomedical sciences for the health, University ofMilan (Milan, Italy) for providing ccRCC Caki-2 cells. This work wassupported by Italian Ministry of Health (Ricerca Finalizzata 2011-2012) grant no. GR-2011-02346964.
References
[1] Aguiari, G., Piva, R., Manzati, E., Mazzoni, E., Augello, G., Chiari, E., Moretti, S.,Neri, L.M. and del Senno, L. (1998) K562 erythroid and HL60 macrophagedifferentiation downregulates polycystin, a large membrane-associatedprotein. Exp. Cell Res. 244, 259–267.
[2] Aguiari, G., Campanella, M., Manzati, E., Pinton, P., Banzi, M., Moretti, S., Piva,R., Rizzuto, R. and del Senno, L. (2003) Expression of polycystin 1 C-terminalfragment enhances the ATP-induced Ca2+ release in human kidney cells.Biochem. Biophys. Res. Commun. 301, 657–664.
[3] Aguiari, G., Varani, K., Bogo, M., Mangolini, A., Vincenzi, F., Durante, C., Gessi, S.,Sacchetto, V., Catizone, L., Harris, P., Rizzuto, R., Borea, P.A. and Del Senno, L.(2009) Deficiency of polycystic kidney disease-1 gene (PKD1) expressionincreases A(3) adenosine receptors in human renal cells: implications forcAMP-dependent signalling and proliferation of PKD1-mutated cystic cells.Biochim. Biophys. Acta 1792, 531–540.
[4] Aguiari, G., Bizzarri, F., Bonon, A., Mangolini, A., Magri, E., Pedriali, M., Querzoli,P., Somlo, S., Harris, P.C., Catizone, L. and Del Senno, L. (2012) Polycystin-1regulates amphiregulin expression through CREB and AP1 signalling:implications in ADPKD cell proliferation. J. Mol. Med. (Berl.) 90, 1267–1282.
[5] Barletta, C., Bartolazzi, A., Cimino Reale, G., Gambari, R., Nastruzzi, C., Barbieri,R., Del Senno, L., Castagnoli, A. and Natali, P.G. (1995) Cytogenetic, molecularand phenotypic characterization of the newly established renal carcinoma cellline KJ29. Evidence of translocations for chromosomes 1 and 3. Anticancer Res.15, 2129–2136.
[6] Belibi, F.A. and Edelstein, C.L. (2010) Metastatic renal cancer: what role foreverolimus? Clin. Med. Rev. Oncol. 2, 4.
[7] Berg, W.J., Divgi, C.R., Nanus, D.M. and Motzer, R.J. (2000) Novel investigativeapproaches for advanced renal cell carcinoma. Semin. Oncol. 27, 234–239.
[8] Bonon, A., Mangolini, A., Pinton, P., Del Senno, L. and Aguiari, G. (2013)Berberine slows cell growth in autosomal dominant polycystic kidney diseasecells. Biochem. Biophys. Res. Commun. 441, 668–674.
[9] Cairns, P. (2010) Renal cell carcinoma. Cancer Biomark. 9, 461–473.[10] Dey, N., Das, F., Ghosh-Choudhury, N., Mandal, C.C., Parekh, D.J., Block, K.,
Kasinath, B.S., Abboud, H.E. and Choudhury, G.G. (2012) MicroRNA-21 governsTORC1 activation in renal cancer cell proliferation and invasion. PLoS One 7,e37366.
[11] Di Leva, G. and Croce, C.M. (2010) Roles of small RNAs in tumor formation.Trends Mol. Med. 16, 257–267.
[12] Di Leva, G. and Croce, C.M. (2013) miRNA profiling of cancer. Curr. Opin.Genet. Dev. 23, 3–11.
[13] Du, W., Yi, Y., Zhang, H., Bergholz, J., Wu, J., Ying, H., Zhang, Y. and Xiao, Z.X.(2013) Rapamycin inhibits IGF-1-mediated up-regulation of MDM2 andsensitizes cancer cells to chemotherapy. PLoS One 8, e63179.
[14] Elorza, A., Soro-Arnáiz, I., Meléndez-Rodríguez, F., Rodríguez-Vaello, V.,Marsboom, G., de Cárcer, G., Acosta-Iborra, B., Albacete-Albacete, L.,Ordóñez, A., Serrano-Oviedo, L., Giménez-Bachs, J.M., Vara-Vega, A., Salinas,A., Sánchez-Prieto, R., Martín del Río, R., Sánchez-Madrid, F., Malumbres, M.,Landázuri, M.O. and Aragonés, J. (2012) HIF2a acts as an mTORC1 activatorthrough the amino acid carrier SLC7A5. Mol. Cell 48, 681–691.
[15] Haddad, H. and Rini, B.I. (2012) Current treatment considerations inmetastatic renal cell carcinoma. Curr. Treat. Options Oncol. 13, 212–229.
[16] Hauser, S., Wulfken, L.M., Holdenrieder, S., Moritz, R., Ohlmann, C.H., Jung, V.,Becker, F., Herrmann, E., Walgenbach-Brünagel, G., von Ruecker, A., Müller,S.C. and Ellinger, J. (2012) Analysis of serum microRNAs (miR-26a-2⁄, miR-191, miR-337-3p and miR-378) as potential biomarkers in renal cellcarcinoma. Cancer Epidemiol. 36, 391–394.
[17] Henrique, R., Luís, A.S. and Jerónimo, C. (2012) The epigenetics of renal celltumors: from biology to biomarkers. Front. Genet. 30 (3), 94.
[18] Janssen, E.A., Slewa, A., Gudlaugsson, E., Jonsdottir, K., Skaland, I., Søiland, H.and Baak, J.P. (2010) Biologic profiling of lymph node negative breast cancersby means of microRNA expression. Mod. Pathol. 23, 1567–1576.
[19] Lieberthal, W. and Levine, J.S. (2009) The role of the mammalian target ofrapamycin (mTOR) in renal disease. J. Am. Soc. Nephrol. 20, 2493–2502.
[20] Loghman-Adham, M., Nauli, S.M., Soto, C.E., Kariuki, B. and Zhou, J. (2003)Immortalized epithelial cells from human autosomal polycystic kidney cysts.Am. J. Physiol. Renal Physiol. 285, F397–F412.
[21] Mangolini, A., Bogo, M., Durante, C., Borgatti, M., Gambari, R., Harris, P.C.,Rizzuto, R., Pinton, P., Aguiari, G. and del Senno, L. (2010) NF-kappaBactivation is required for apoptosis in fibrocystin/polyductin-depletedkidney epithelial cells. Apoptosis 15, 94–104.
[22] Moch, H., Srigley, J., Delahunt, B., Montironi, R., Egevad, L. and Tan, P.H. (2014)Biomarkers in renal cancer. Virchows Arch. 464, 359–365.
[23] Moumen, A., Patané, S., Porras, A., Dono, R. and Maina, F. (2007) Met acts onMdm2 via mTOR to signal cell survival during development. Development134, 1443–1451.
[24] Negrini, M., Cutrona, G., Bassi, C., Fabris, S., Zagatti, B., Colombo, M., Ferracin,M., D’Abundo, L., Saccenti, E., Matis, S., Lionetti, M., Agnelli, L., Gentile, M.,Recchia, A.G., Bossio, S., Reverberi, D., Rigolin, G., Calin, G.A., Sabbioni, S.,Russo, G., Tassone, P., Morabito, F., Ferrarini, M. and Neri, A. (2014)microRNAome expression in chronic lymphocytic leukemia: comparisonwith normal B-cell subsets and correlations with prognostic and clinicalparameters. Clin. Cancer Res. 20, 4141–4153.
[25] Noon, A.P., Polanski, R., El-Fert, A.Y., Kalirai, H., Shawki, H., Campbell, F.,Dodson, A., Eccles, R.M., Lloyd, B.H., Sibson, D.R., Coupland, S.E., Lake, S.L.,Parsons, K., Vlatkovic, N. and Boyd, M.T. (2012) Combined p53 and MDM2biomarker analysis shows a unique pattern of expression associated with poorprognosis in patients with renal cell carcinoma undergoing radicalnephrectomy. BJU Int. 109, 1250–1257.
[26] Okamoto, K., Taya, Y. and Nakagama, H. (2009) Mdmx enhances p53ubiquitination by altering the substrate preference of the Mdm2 ubiquitinligase. FEBS Lett. 583, 2710–2714.
[27] Oliver, T.G., Meylan, E., Chang, G.P., Xue, W., Burke, J.R., Humpton, T.J.,Hubbard, D., Bhutkar, A. and Jacks, T. (2011) Caspase-2-mediated cleavage ofMdm2 creates a p53-induced positive feedback loop. Mol. Cell 43, 57–71.
[28] Pantuck, A.J., Seligson, D.B., Klatte, T., Yu, H., Leppert, J.T., Moore, L., O’Toole, T.,Gibbons, J., Belldegrun, A.S. and Figlin, R.A. (2007) Prognostic relevance of themTOR pathway in renal cell carcinoma: implications for molecular patientselection for targeted therapy. Cancer 109, 2257–2267.
[29] Petillo, D., Kort, E.J., Anema, J., Furge, K.A., Yang, X.J. and Teh, B.T. (2009)MicroRNA profiling of human kidney cancer subtypes. Int. J. Oncol. 35, 109–114.
[30] Ranaweera, R.S. and Yang, X. (2013) Auto-ubiquitination of Mdm2 enhancesits substrate ubiquitin ligase activity. J. Biol. Chem. 288, 18939–18946.
[31] Redova, M., Svoboda, M. and Slaby, O. (2011) MicroRNAs and their target genenetworks in renal cell carcinoma. Biochem. Biophys. Res. Commun. 405, 153–156.
[32] Robb, V.A., Karbowniczek, M., Klein-Szanto, A.J. and Henske, E.P. (2007)Activation of the mTOR signaling pathway in renal clear cell carcinoma. J. Urol.177, 346–352.
[33] Siegel, R., Ma, J., Zou, Z. and Jemal, A. (2014) Cancer statistics, 2014. CA CancerJ. Clin. 64, 9–29.
[34] Sun, S.Y. (2013) mTOR kinase inhibitors as potential cancer therapeutic drugs.Cancer Lett. 340, 1–8.

A. Mangolini et al. / FEBS Open Bio 4 (2014) 952–965 965
[35] Vasudev, N.S., Selby, P.J. and Banks, R.E. (2012) Renal cancer biomarkers: thepromise of personalized care. BMC Med. 10, 112.
[36] Warburton, H.E., Brady, M., Vlatkovic, N., Linehan, W.M., Parsons, K. and Boyd,M.T. (2005) p53 regulation and function in renal cell carcinoma. Cancer Res.65, 6498–6503.
[37] Weston, M.C., Chen, H. and Swann, J.W. (2014) Loss of mTOR repressors Tsc1or Pten has divergent effects on excitatory and inhibitory synaptictransmission in single hippocampal neuron cultures. Front. Mol. Neurosci. 7, 1.
[38] Xia, J.T., Chen, L.Z., Jian, W.H., Wang, K.B., Yang, Y.Z., He, W.L., He, Y.L., Chen, D.and Li, W. (2014) MicroRNA-362 induces cell proliferation and apoptosis
resistance in gastric cancer by activation of NF-jB signaling. J. Transl. Med. 12,33.
[39] Yamamoto, Y., Kosaka, N., Tanaka, M., Koizumi, F., Kanai, Y., Mizutani, T.,Murakami, Y., Kuroda, M., Miyajima, A., Kato, T. and Ochiya, T. (2009)MicroRNA-500 as a potential diagnostic marker for hepatocellular carcinoma.Biomarkers 14, 529–538.
[40] Zigeuner, R., Ratschek, M., Rehak, P., Schips, L. and Langner, C. (2004) Value ofp53 as a prognostic marker in histologic subtypes of renal cell carcinoma: asystematic analysis of primary and metastatic tumor tissue. Urology 63, 651–655.