D.HAMMOUDI - Sinoe Medical Association TMsinoemedicalassociation.org/AP2/ekgquiz.pdf ·...
82
Ekg Ekg practice practice D.HAMMOUDI.MD
Transcript of D.HAMMOUDI - Sinoe Medical Association TMsinoemedicalassociation.org/AP2/ekgquiz.pdf ·...

EkgEkg practicepracticeD.HAMMOUDI.MD

Anatomy Revisited
n RCA (Right Coronary Artery)
n Right ventricle
n Inferior wall of LV
n Posterior wall of LV (75%)
n SA Node (60%)
n AV Node (>80%)
n LCA (Left Coronary Artery)
n Septal wall of LV
n Anterior wall of LV
n Inferior wall of LV
n Posterior wall of LV (10%)


Interpretation of ECGInterpretation of ECG
Normal heart rhythm has consistent R-R interval.
Mild variations due to breathing alsonormal.

Interpretation of ECGInterpretation of ECG
Normal SinusRhythm
Rate: 60-100b/min
Rhythm: regular
P waves:upright in leadsI, II, aVF
PR interval: <.20 s
QRS: < .10 s


ECG Time & VoltageECG Time & Voltage
ECG machines can run at 50 or 25mm/sec.
Major grid lines are 5 mm apart, atstandard 25 mm/s, 5 mm correspondsto .20 seconds.
Minor lines are 1 mm apart, at standard25 mm/s, 1 mm corresponds to .04seconds.
Voltage is measured on vertical axis.
Standard calibration is 0.1 mV per mmof deflection.

TO REMEMBERTO REMEMBER
Normal adult 12-lead ECG
The diagnosis of the normalelectrocardiogram is made by excluding anyrecognised abnormality. It's description istherefore quite lengthy. normal sinusrhythm
◦ each P wave is followed by a QRS
◦ P waves normal for the subject
◦ P wave rate 60 - 100 bpm with <10%variation
rate <60 = sinus bradycardia
rate >100 = sinus tachycardia
variation >10% = sinus arrhythmia

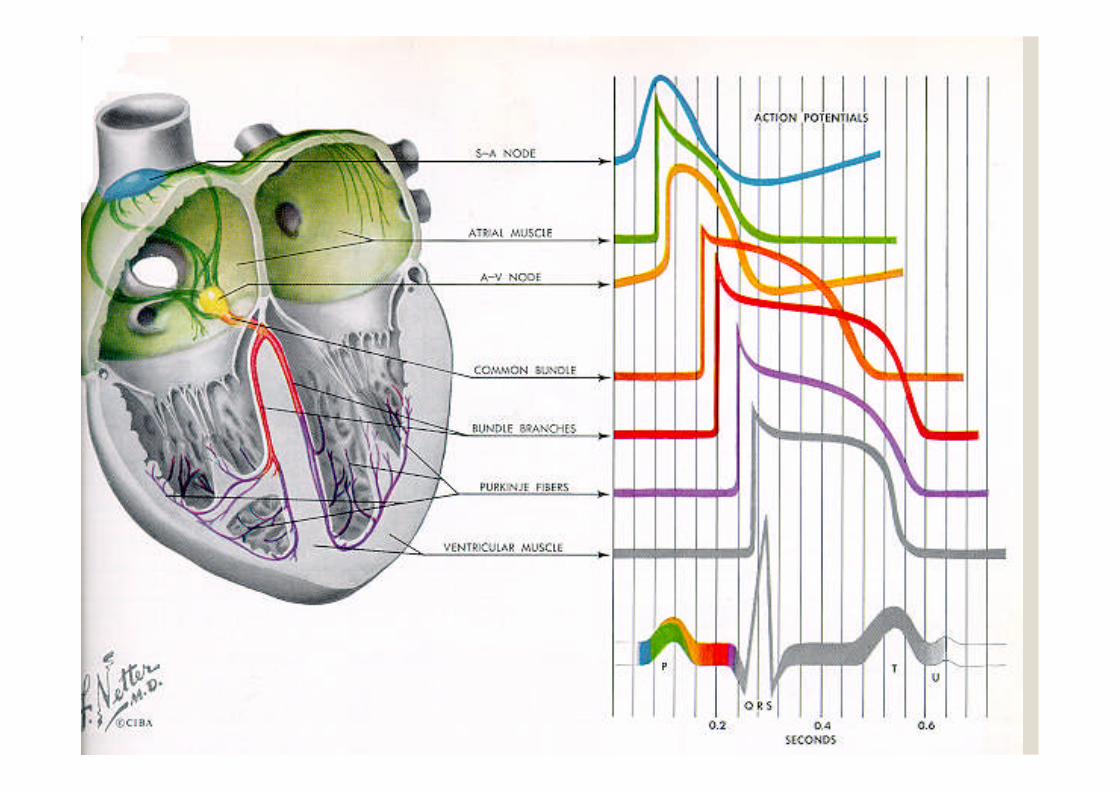
ElectrophysiologyElectrophysiology

Cardiac Current FlowCardiac Current Flow

Cardiac Current FlowCardiac Current Flow

normal P waves height < 2.5 mm inlead II
width < 0.11 s in lead II
normal PR interval 0.12 to 0.20 s (3 -5 small squares)◦ for short PR segment consider Wolff-Parkinson-White syndrome or Lown-Ganong-Levine syndrome (other causes -Duchenne muscular dystrophy, type IIglycogen storage disease (Pompe's),HOCM)
◦ for long PR interval see first degree heartblock

normal QRS complex < 0.12 s duration (3 small squares)normal QRS complex < 0.12 s duration (3 small squares)
◦ for abnormally wide QRS consider right or left bundle branchblock, ventricular rhythm, hyperkalaemia, etc.
no pathological Q waves
no evidence of left or right ventricular hypertrophy
normal QT interval Calculate the corrected QT interval (QTc) bydividing the QT interval by the square root of the preceeding R - Rinterval. Normal = 0.42 s.Normal = 0.42 s.
Causes of long QT interval
◦ myocardial infarction, myocarditis, diffuse myocardial disease
◦ hypocalcaemia, hypothyrodism
◦ subarachnoid haemorrhage, intracerebral haemorrhage
◦ drugs (e.g. sotalol, amiodarone)
◦ hereditary

normal ST segmentnormal ST segment
◦ no elevation or depression
causes of elevation include acute MI (e.g. anterior, inferior), leftbundle branch block, normal variants (e.g. athletic heart, Edeikenpattern, high-take off), acute pericarditis
causes of depression include myocardial ischaemia, digoxin effect,ventricular hypertrophy, acute posterior MI, pulmonary embolus, leftbundle branch block
normal T wavenormal T wave
causes of tall T waves include hyperkalaemia, hyperacute myocardialinfarction and left bundle branch block
causes of small, flattened or inverted T waves are numerous andinclude ischaemia, age, race, hyperventilation, anxiety, drinking icedwater, LVH, drugs (e.g. digoxin), pericarditis, PE, intraventricularconduction delay (e.g. RBBB)and electrolyte disturbance.
normal U wave

NormalNormalEKGEKG A positive wave form (QRS
mainly above the baseline)results from the wave ofdepolarization moving towardsthe positive end of the lead.◦ e.g.
A negative waveform (QRSmainly below the baseline) iswhen a wave of depolarizationis moving away from thepositive electrode (towards thenegative end of the lead).
EKG paper has 1 millimetersmall squares - so height anddepth of wave is measured inmillimeters.
10 mm = 1.0 mVolt Horizontal axis is time.
◦ 0.04 seconds for 1 mm(1 small box).
◦ 0.2 seconds for 1 large box = 5small boxes = 5 x .04 seconds.
Positive QRS in Lead I.Negative QRS in Lead aVR.R wave = 7-8 mm high in Lead I = 7-8mV.QRS wave = 0.06 seconds long in Lead I.
P
QRS
T
0.2sec
0.5mV
7.0mV
0.06sec

What these intervals represents ?
• P wave • PR interval - • QRS Complex – • ST Segment - • T Wave - • U Wave - • RR Interval -

Intervals • P wave - atrial depolarization • PR interval - time from sinoatrial node (S-A) to
atrioventricular node (A-Vnode) • QRS Complex – ventricular depolarization • ST Segment - beginning of ventricular
repolarization • T Wave - later stages of ventricular repolarization • U Wave - final component of ventricular
repolarization • RR Interval - represents the time for one
complete cardiac cycle

Lead Placement
V1 =
V2 =
V3 =
V4 =
V5 =
V6 =

Lead Placement
V1 = 4th intercostal space, right border ofsternum
V2 = 4th intercostal space, left border ofsternum
V3 = midway between V2 and V4
V4 = 5th intercostal space, midclavicular line
V5 = anteroaxillary line at level of V4
V6 = midaxillary line at level of V4 and V5

EKG LeadsEKG Leads
The standard EKG has 12 leads:WHAT THEY

EKG LeadsEKG Leads
The standard EKG has 12leads:
3 Standard Limb Leads
3 Augmented LimbLeads
6 Precordial Leads
The axis of a particular lead represents theThe axis of a particular lead represents theviewpoint from which it looks at the heart.viewpoint from which it looks at the heart.
A. 0.12sec
B. 0.16sec
C. 0.20sec
D. 0.28sec
E. 0.50sec
What is the PR interval in this ECG?

You measure PR from the beginning of P to thebeginning of QRS.The normal PR interval is 0.12 - 0.20 sec, or120 to 200 ms.1st degree AV block is defined by PR intervalsgreater than 200 ms.

A.0.34sec &no
B.0.34sec &yes
C. 0.40sec &no
D.0.40sec &yes
E. 0.48sec &maybe
What is the QT interval of this ECG, and is it normal for this heart rate?

bThe QT interval is from the beginning of QRS to the end of the Twave.
In this case it is between 8 and 9 small boxes long (~0.34 sec.).
The upper limit of the QT is 0.40 sec @ 70 bpm. For every 10bpm above 70, subtract 0.02 sec. Add 0.02 sec for every 10 bpmbelow 70.
This ECG has a heart rate of about 80, so the upper limit ofnormal is 0.38 sec.
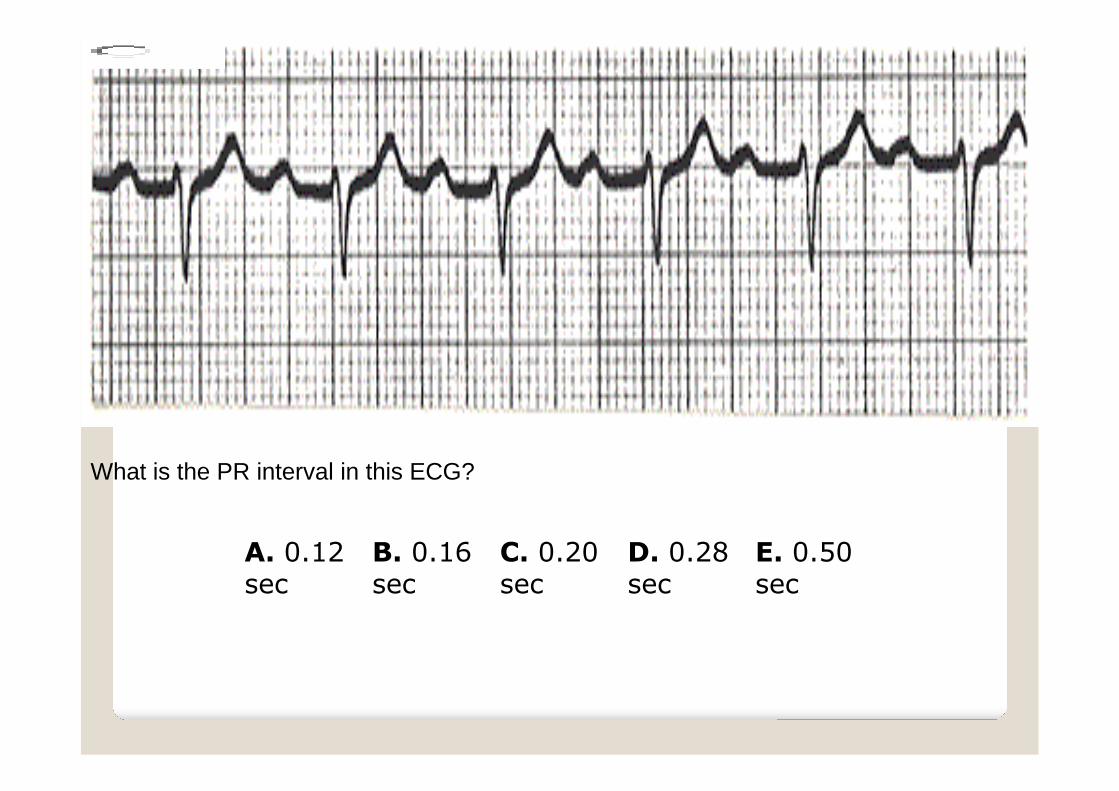
A. 0.08 sec B. 0.12 sec C. 0.22 sec D. 0.28 sec E. 80 msec
What is the PR interval of this ECG?

cPR is from the beginning of P to the beginning of QRS.This PR is slightly prolonged.

A. 0.04sec
B. 0.08sec
C. 0.12 sec D. 0.14sec
E. 0.16 sec
What is the QRS duration seen here?
BMeasure from the beginning to the end of the QRS complex.

A. 0.34sec
B. 0.40sec
C. 0.44sec
D. 0.48sec
E. 0.20sec

The correct answer is A.
Measure from the beginning of the QRS complex to the end of the Twave.

A. 50bpm
B. 65bpm
C. 75bpm
D. 90bpm
E. 100bpm

The correct answer is D.
Each QRS complex is separated by about 3 1/2big boxes. Thus the rate is between 100 and 75,or about 90 bpm.


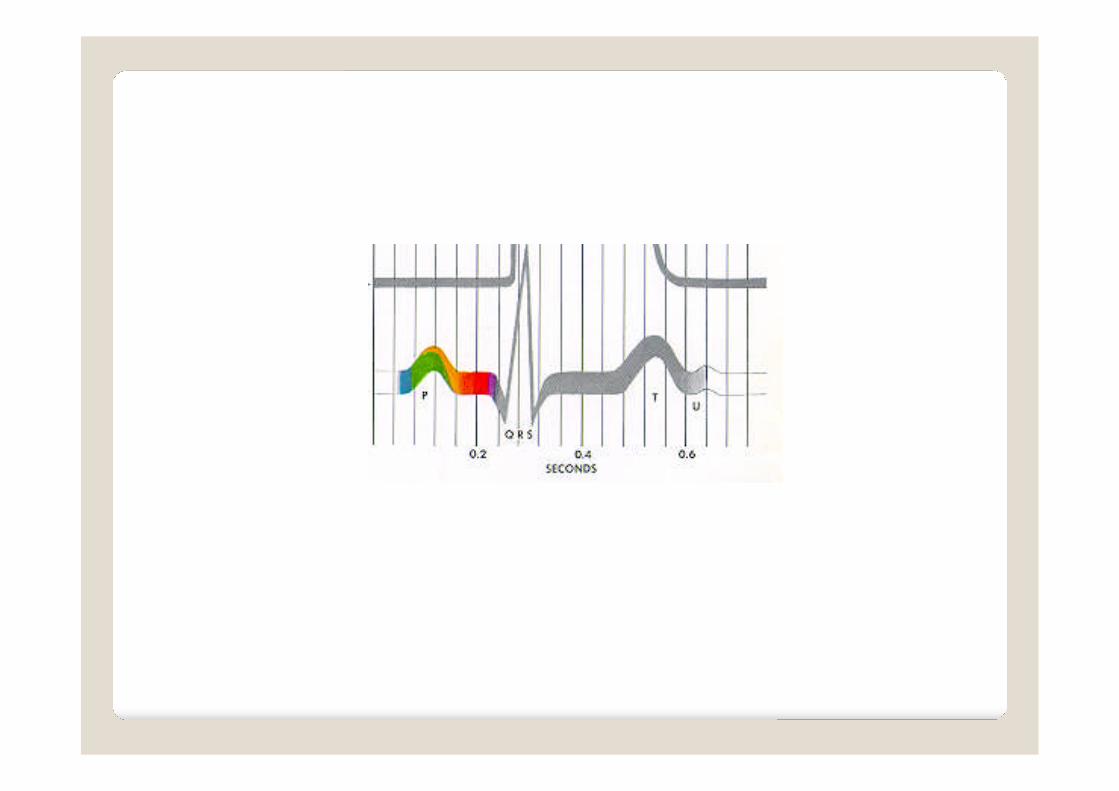
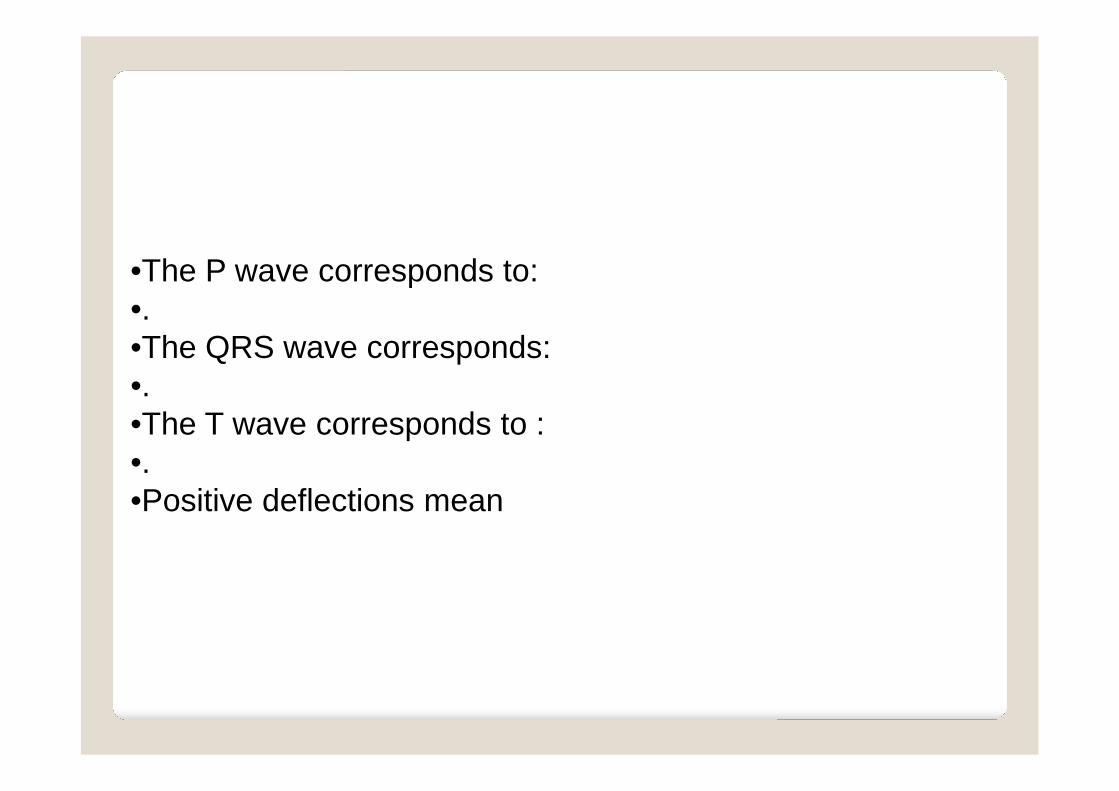
•The P wave corresponds to:•.•The QRS wave corresponds:•.•The T wave corresponds to :•.•Positive deflections mean

•The P wave corresponds to atrial depolarization.•The QRS wave corresponds to ventricular depolarization.•The T wave corresponds to ventricular repolarization.•Atrial repolarization is usually not seen as it is masked inthe QRS wave.•Positive deflections mean electrical energy is travelingtoward the lead being examined

• Inherent Rates
– SA:
– AV:
– Ventricles:
• Normal PRI:
• Normal QRS:
• Normal QTc:

• Inherent Rates
– SA: 60 to 100
– AV: 40 to 60
– Ventricles: 20 to 40
• Normal PRI: 0.12 to 0.20
– 3 to 5 small boxes
• Normal QRS: < 0.12
– Less than 3 small boxes
• Normal QTc: 0.35 to 0.45
– QT < 1/2 RR; QTc = QT /sqrt(RR)

A higher pacemaker site will, normally, overdrive suppress the lower sites.SA > AV > Ventricles.So a rate of 40 could be parasympathetic drive or loss of the SA node; the p-waves will answer this question.A short PR interval is usually do to an accessory pathway, such as in WolffParkinson White syndrome.A long PR interval is associated with AV conduction (heart) blocks.A narrow QRS means fast conduction through the ventricles, such assuperventricular tachycardia (SVT).A wide QRS is seen if the ventricles act as the pacemaker or if an electricalpacemaker is pacing the ventricles.Other things that widen a QRS are bundle branch blocks (BBB) andventricular tachycardia with or without pulse.Abnormal QT interval (QTc) may be congenital, electrolyte imbalances, ordue to drugs.Abnormal QTc has a risk of ventricular arrhythmias (e.g. Torsade).The QT interval should be less than 1/2 the RR interval (easier to determinethan QTc).

•Septal leads are•Anterior leads•Lateral leads

•Septal leads are V1 and V2•Anterior leads V3 and V4•Lateral leads V5 and V6•Basically…V1 and V2 are “right sided” and V5and V6 are “left sided”•Remembering this should help with axisrotation, hypertrophy, and BBBs.

LIMB LEAD III:Left arm -> left leg
CHEST LEADS V1-V6LIMB LEAD II:Right arm -> left leg
LIMB LEAD I:Right arm -> left arm
Rhythm strip
LIMB LEADaVR: right arm
LIMB LEADaVL: left arm
LIMB LEADaVF: left leg (foot)
Rhythm and RateAre there P waves?Are they regular?Does every one precede a QRS?Is the PR interval constant?What is the PR interval?The PR interval should be between 120 and 240 msec (3 to 6 small squares)
Ventricular rate [many ways to do it find yours]Count the number of R waves over 15 large squares (3 seconds) and multiply by 20.To be slightly more accurate count the number of R waves over 30 large squares (6 seconds)and multiply by 10.

Axis: Leads I, II, IIIAxis: Leads I, II, III

Normal is -30 to +90 or, in some books, 0 to +90
Lead I +: 0 degrees, Lead II +: 60 degrees, Lead III +: 120degrees
It may be helpful to draw this diagram out a few times so you’resure you can recreate it.

Determining Axis: An ExampleDetermining Axis: An Example
The QRS complexes are reachingtoward eachother, so Right axis.Right axis goes from +90 toRight axis goes from +90 to+180, so we should be in that+180, so we should be in thatrangerange.Now, which lead is the mostisoelectric? Meaning, the Q wavematches the height of the S wave.aVR most isoelectric, so our actualaxis is perpendicular to aVR. Use thediagram on the previous slide.aVR is at +30 degrees, so +30 + +90= +120+120 (Lead III) is perpendicular toaVR. So our axis is Right +120.Leads V3 and V4 appear to be themost isoslectric precordial leads, sothere is no obvious rotation in thehorizontal plane

Normal Sinus RhythmNormal Sinus Rhythm

Sinus BradycardiaSinus Bradycardia

Sinus TachycardiaSinus Tachycardia
*
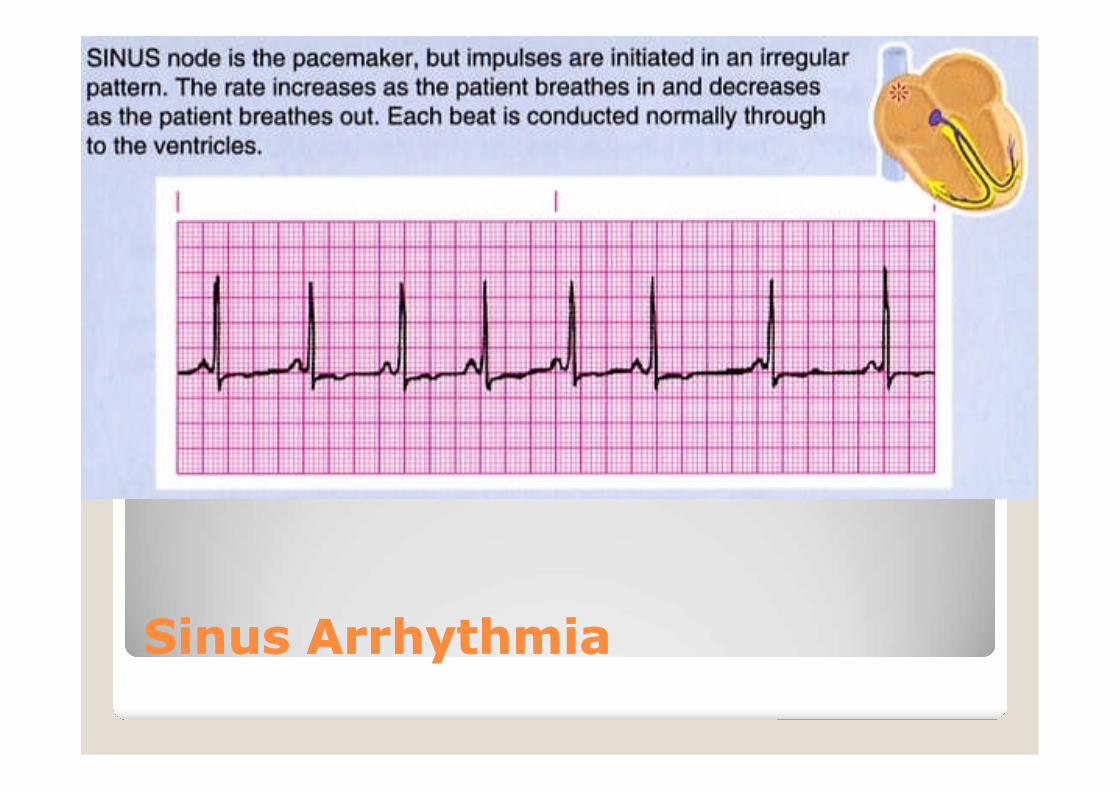
Sinus ArrhythmiaSinus Arrhythmia

PrematurePremature AtrialAtrial ContractionContraction
Premature atrial contraction acronym is PAC; sort of a misnomer as this is a premature atrialdepolarization.Some also call this a premature atrial beat (PAB), but again electrical depolarization does notalways mean mechanical contraction.Here there is a focus other than the SA node that is firing, which causes a QRS.What is they underlying rate? 7*10 using 6-second. Or, 75 using 4 big boxes per QRS.The PAC is the third QRS; you can see there is only about 1 big box between the 2nd and 3rd QRS.Usually the abnormal focus will cause a p-wave the looks different from the other p-waves (the SAnode p-waves).Here the aberrant atrial depolarization appears as a peaked p-wave in comparison.


What do you think?
a
b

A: normalB: sinus tachycardia
a
b

a
b
What do you think?

a
b
A: normalB:sinus bradycardia


Atrial Flutter
Normal
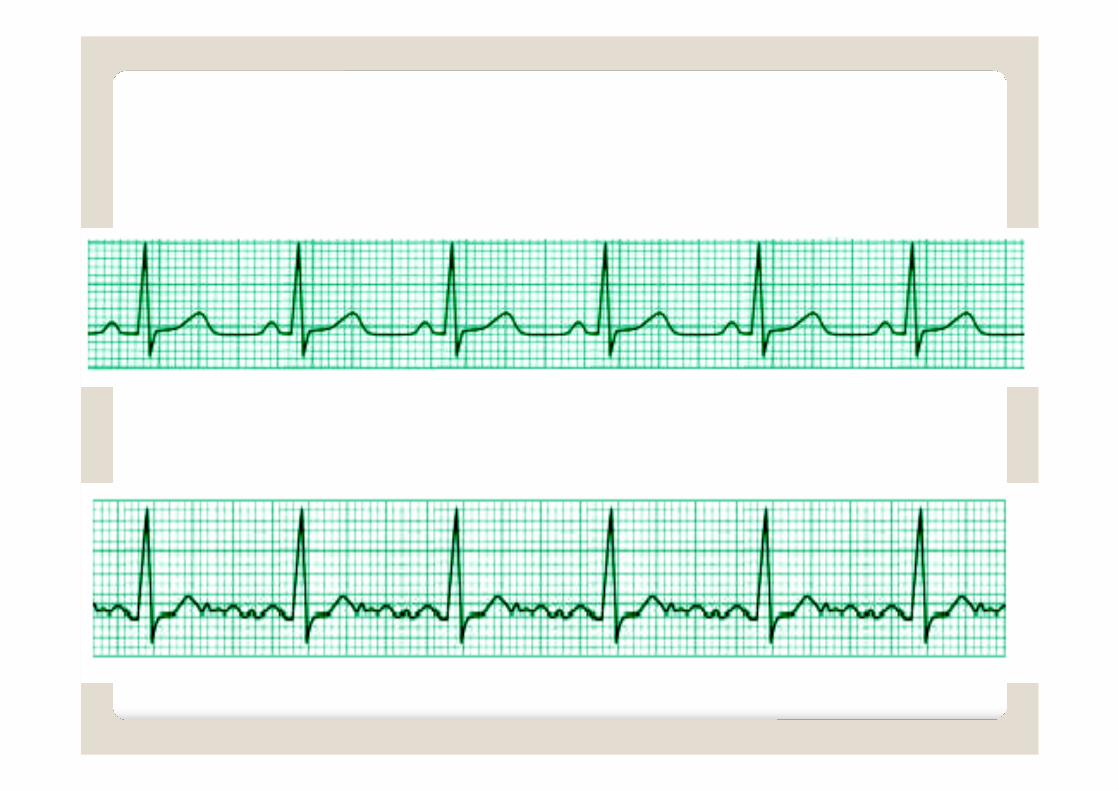

Atrial Fibrillation
Normal


Normal
Ventricular Tachycardia (VT)


Anatomic GroupsAnatomic Groups(Septum)(Septum)

Anatomic GroupsAnatomic Groups(Anterior Wall)(Anterior Wall)

Anatomic GroupsAnatomic Groups(Lateral Wall)(Lateral Wall)

Anatomic GroupsAnatomic Groups(Inferior Wall)(Inferior Wall)

Anatomic GroupsAnatomic Groups(Summary)(Summary)

Myocardial InfarctionMyocardial Infarction
Significant Q wave = Necrosis
ST elevation = Injury
T wave inversion = Ischemia

MI LocationMI Location

Myocardial involvement EKG leadsAnterior V2, V3, V4 (at least 2)Anteroseptal V1, V2, V3 (+V4)Anterolateral V4, V5, V6 (+V3, +V2)Extensive AnteriorV1 through V6 (all)Lateral V5, V6 (+I, +aVL)High lateral I, aVLInferior II, III, aVF (at least2)Inferolateral as above, +V6 (+V5)Posterior V1, V2 (*recip.changes)Inferoposterolateral Combine above 3 itemsRight Ventricular V4R, +V3R and/orV5R

ST Segment ElevationST Segment Elevation
ELEVATION◦ Electrolytes◦ Left bundle branch block◦ Early repolarization◦ Ventricular hypertrophy◦ Aneurysm◦ Treatment (pericardiocentesis)◦ Injury (acute MI, contusion)◦ Osborne waves (hypothermia)◦ Nonocclusive vasospasm
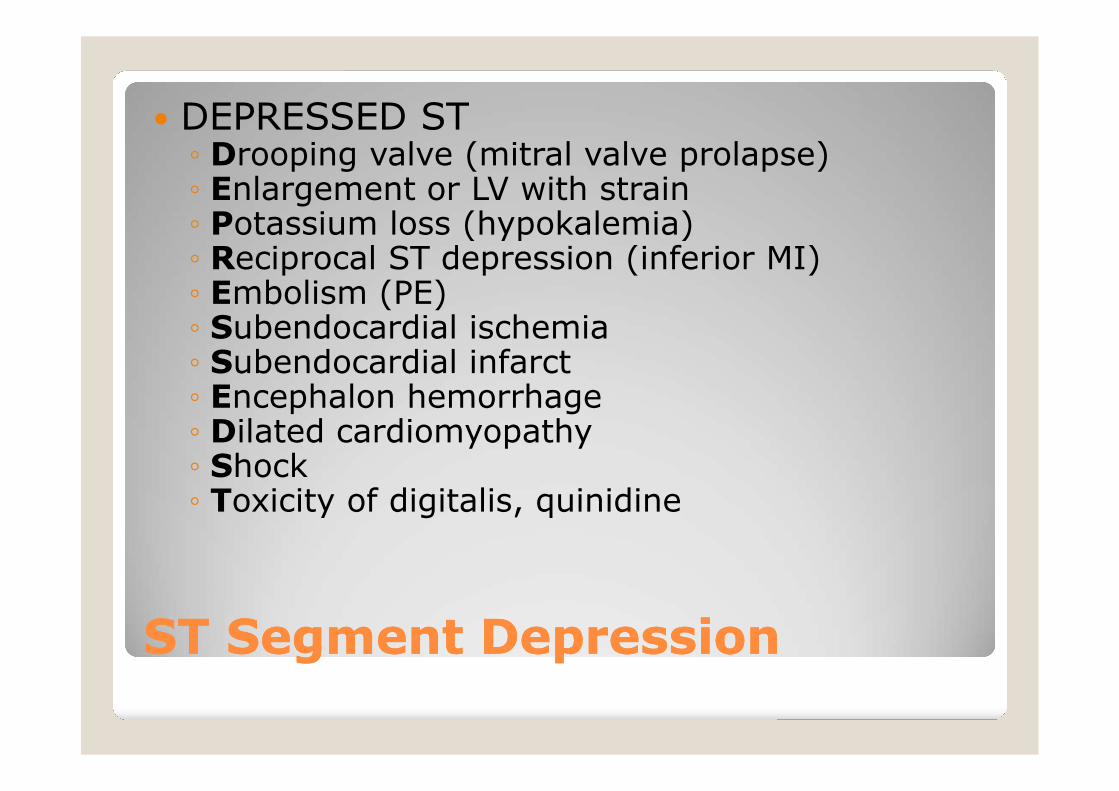
ST Segment DepressionST Segment Depression
DEPRESSED ST◦ Drooping valve (mitral valve prolapse)◦ Enlargement or LV with strain◦ Potassium loss (hypokalemia)◦ Reciprocal ST depression (inferior MI)◦ Embolism (PE)◦ Subendocardial ischemia◦ Subendocardial infarct◦ Encephalon hemorrhage◦ Dilated cardiomyopathy◦ Shock◦ Toxicity of digitalis, quinidine

Electrolytes & DrugsElectrolytes & Drugs
Hyperkalemia◦ High K+
◦ Peaked T
Hypokalemia◦ Low K+
◦ Flat T, U Wave

http://library.med.utah.edu/kw/ecg/tests/index.html
http://library.med.utah.edu/kw/ecg/tests/quiz2/index.html