
DG_Retail_Wireless
184
Retail Wireless Networks Validated Reference Design Version 3.3 Solution Guide
-
Upload
salahelmrabet -
Category
Documents
-
view
4.242 -
download
23
Transcript of DG_Retail_Wireless

Retail Wireless Networks Validated Reference Design
Version 3.3
Sol
utio
n G
uid
e

Copyright
© 2008 Aruba Networks, Inc. AirWave®, Aruba Networks®, Aruba Mobility Management System®, Bluescanner, For Wireless That Works®, Mobile Edge Architecture®, People Move. Networks Must Follow®, RFProtect, The All Wireless Workplace Is Now Open For Business, Green Island, and The Mobile Edge Company® are trademarks of Aruba Networks, Inc. All rights reserved. All other trademarks are the property of their respective owners.
Open Source Code
Certain Aruba products include Open Source software code developed by third parties, including software code subject to the GNU General Public License (“GPL”), GNU Lesser General Public License (“LGPL”), or other Open Source Licenses. The Open Source code used can be found at this site:
http://www.arubanetworks.com/open_source
Legal Notice
The use of Aruba Networks, Inc. switching platforms and software, by all individuals or corporations, to terminate other vendors' VPN client devices constitutes complete acceptance of liability by that individual or corporation for this action and indemnifies, in full, Aruba Networks, Inc. from any and all legal actions that might be taken against it with respect to infringement of copyright on behalf of those vendors.
Warranty
This hardware product is protected by the standard Aruba warranty of one year parts/labor. For more information, refer to the ARUBACARE SERVICE AND SUPPORT TERMS AND CONDITIONS.
Altering this device (such as painting it) voids the warranty.
www.arubanetworks.com
1344 Crossman Avenue Sunnyvale, California 94089
Phone: 408.227.4500 Fax 408.227.4550
Retail Wireless Networks Validated Reference Design | Solution Guide December 2008

Retail Wireless Networks Validated Reference Design | Solution Guide
ContentsChapter 1 Introduction 9About Aruba Networks 9
Aruba Reference Architectures 9
Reference Documents 10
Wireless Retail Applications 10
Technical Challenges for Retailers 11Security and PCI Compliance 11Reliability 11Interference from Non-802.11 Devices 12
Business Challenges for Retailers 12Improving Operations 12The Store of the Future 12
The Shift to 802.11n 12
Value Proposition for Retailers 13
Contacting Aruba Networks 14
Chapter 2 Wireless LAN Lifecycle 15The WLAN Lifecycle 15
Chapter 3 Defining WLAN Requirements for Retailers 19Step 1 - Choose a PCI Compliance Category 19
Category 1: PCI Monitoring 19Category 2: Wireless IDS 19Category 3: Wireless LAN with IDS and Role-Based Access Control 20Start Small, Grow As Needed 21Aruba Solution and PCI Compliance Requirements: Quick Reference 21
Step 2 - Inventory Wireless Applications and Devices 22Summary of Common Wireless Retail Applications 22
Mobile Point of Sale (POS) 22Inventory Management 22Price Changes and Auditing 22Customer Service Kiosks 23Wireless Voice Communication 23Guest Internet Access 23Wireless Video 23
Application Inventory Worksheet 24Device Inventory Worksheet 24
Step 3 - Quantify Facility Coverage Requirements 25Store Facility Types and Locations 25Hardened Environment Types and Locations 26
Step 4 - Itemize SSID Configuration Requirements 27User Authentication Modes and Device Types 28Summary of Voice and QoS Design Choices 29
Mapping Inventory Worksheets to the Design Process 30
Contents | 3

Chapter 4 RF Site Surveys 31RF Site Survey Objectives 31
Theoretical vs. Actual RF Propagation 31Coverage vs. Capacity 322.4 GHz vs. 5 GHz 33
Site Survey Varieties 35What Kinds of Surveys are There? 35Which Survey is Right for Me? 36What Process Do I Follow to Perform a Site Survey? 37
Virtual Survey Methodology 37Passive Survey Methodology 38Active Survey Methodology 39Spectrum Clearing Survey Methodology 42
Non-RF Site Survey Tasks 44
Chapter 5 Physical and Logical Network Design 45
Aruba WLAN Physical Architecture for Retail 45Physical Architecture 45
Data Center 47Warehouse/Distribution Center 47Large Footprint Store 47Small Footprint Store 47
Required Equipment 48Access Points 49Local Controllers 49Master Controllers 50AirWave Appliance 52
Required Licenses 52Warehouses and DCs 52Large Footprint Stores 52Small Footprint Stores (Remote AP) 53Master Controllers in Data Center 53AirWave Appliance 54
Regulatory Compliance for International Deployments 54Access Point Compliance 54Controller Compliance 55Recommendations for International Deployments 56
Aruba WLAN Logical Architecture for Retail 57Aruba’s Overlay Architecture 57
Warehouse/Distribution Center Logical Design 58Large Footprint Store Logical Design 59Small Footprint Store Logical Design 60Data Center Logical Design 61
Remote AP Deployment Considerations 62Remote AP Forwarding Modes 62Remote AP Operating Modes 63
AP/AM Data and Control Tunnels 64AP Tunnels 64AM Tunnels 65
Redundancy 65Master Controller Redundancy 65Local Controller Redundancy 66
VLAN Design 67Do Not Make Aruba the Default Router 69Do Not Use Special VLANs 69
4 | Contents Retail Wireless Networks Validated Reference Design | Solution Guide

Chapter 6 RF Design 71RF Challenges in Retail 71
RF Design Strategy for Legacy APs 72Coverage vs. Capacity 72Client Density 73RF Redundancy 74Legacy AP Design Summary 74
RF Design Strategy for Thin APs 74Thin AP Architectures 74Principal Factors Affecting Thin AP Density 75AP Density Planes 76Bandwidth Plane 77
Bandwidth vs. Throughput 78Converting SNR to Data Rate 79Matching Client and AP Power 80Effect of Matching Client Power on Required AP Density 81Adjusting for Absorption and Losses 81
Client Plane 82RF Redundancy Plane 82
Roaming and Cell Overlap 83How to Compute AP Counts 84
Choosing Between 802.11a/b/g and 802.11n APs 85Benefits of 802.11n 85Limitations of 802.11n for Retailers 85802.11n Drivers for Retailers 85
Choosing Between Dedicated and Hybrid Mode Air Monitors 86Benefits of Dedicated Air Monitors 86
Security Benefits 86RF Management and Troubleshooting Benefits 87Client Performance Benefits 87
How to Compute AM Counts 87
Automating AP and AM Calculations with Aruba RF Plan 87Creating an AP Model 88Creating an AM Model 89Initial Placement of APs and AMs 90
Antenna Placement Strategies for Retailers 90Side Coverage vs. Overhead Coverage with Omnidirectional Antennas 90
Side Coverage 91Overhead Coverage 91Choosing Between Side and Overhead Coverage 92
Side Coverage with Directional Antennas 93Effect of Gain on Vertical Beamwidth 93Harmful Side Effects of High-Gain Directional Antennas 95Harmful Side Effects of Wide Horizontal Beamwidth Antennas 95
Coverage Reliability Planning 95Signal Propagation Inside of Retail Facilities 95Signal Propagation Outside of Retail Facilities 96Variability of Goods 97AP Placement Strategy for Warehouses (Overhead Coverage) 98AP Placement Strategy for Warehouses (Side Coverage) 99AP Placement for Large Footprint Stores 100AP Placement for Critical Coverage Areas 101
Retail Deployment Scenario Examples 102Large Footprint Store (Low Shelving) 102Small Footprint Store (Low Shelving) 103Warehouse (High Shelving) 104
Retail Wireless Networks Validated Reference Design | Solution Guide Contents | 5
Chapter 7 Authentication and Security 105PCI Compliance Requirements 105
What Are the Differences between PCI DSS v1.1 and v1.2? 106PCI Requirements for Wireless LANs: Quick Reference 107Role-Based Access Control 107Wireless Perimeter Firewall 108
Wireless Intrusion Detection System Operation and Design 109Typical WIDS Design for Retail Organizations 109
WIDS Design for Compliance Category 1 109WIDS Design for Compliance Categories 2 and 3 109
Detection of Rogue APs 109Classification of Rogue APs 110Containment of Rogue APs 111
Wireless Containment 111Wired Containment 111
SSIDs, VLANs, and Role Derivation for Secure WLANs 112SSIDs 112VLANs 113Role Derivation 113
Secure Authentication Methods 113Authentication Methods for Pre-Shared Key Devices 114
Complying with the WEP Phase-Out Requirement 115Authenticating with 802.1x 116Authenticating with Captive Portal 118
Configuring Roles for Different Users 118Secure Role for Mobile Data Terminals 118Voice Handset Role 119Guest Access Role 119
Putting It All Together: Building an Authentication Design 120What Is A Profile? 120Aggregating Profiles into a Complete Configuration 122Planning AAA and SSID Profiles for Retail 123Example 802.1x Profile Configuration for Retail 124
Basic Setup 124Create Security Profiles 124Create WLAN Profiles 124
Best Practices for Wireless LAN Profiles 125Authentication Servers and Server Groups 125AAA Fast Connect 125User Role Assignment 125SSID Configuration 125Virtual APs 125
Chapter 8 QoS Design for Voice and Data Devices 127WLAN Infrastructure Design 127
Band Selection 127Adaptive Radio Management 128Separate SSIDs For Voice Clients 129Authentication and Encryption 129
Virtual AP Design 130VLAN Settings 130 Battery Life – Delivery Traffic Indicator Map Settings and UAPSD 130Max-Retries 130Max Transmit Failures 130Scanning, Probe Requests, and Beacons 130
6 | Contents Retail Wireless Networks Validated Reference Design | Solution Guide

End-to-End QoS Design 131Wired QoS Recommendations 131Wireless QoS Recommendations 132
Capacity Planning 132
Roaming and Mobility 133Layer 2 (VLAN) Mobility 133Layer 3 (IP) Mobility 135
Chapter 9 Deployment Methodologies 137Aruba Deployment Process for Retailers 137
Step 1 – Install Test Store 137Step 2 – Deploy Data Center 137Step 3 – Activate Staging Center 138Step 4 – Install Pilot Sites 138Step 5 – Mass Produce RF Plans 139Step 6 – Execute Full Deployment 139
Recommended Deployment Methodologies 140Local Deployment 140Multi-City Deployment with Preprovisioned APs 141Multi-City Deployment with Postprovisioned APs 141
Preprovisioning Methodology 142Staging the Controllers 142Staging the APs 143Store Installation 143
Postprovisioning Methodology 143Staging the Controllers 144Store Installation 144Provisioning the APs 144
Site Validation and Documentation Considerations 144Controller Validation 144Cabling and AP Validation 145RF Validation 145Client Device Validation 145As-Built Documentation Recommendations 145
Post-Deployment PCI Reassessment 146
Chapter 10 Operations and Management 147Remote Management 147
Planning and Location Services 149Managing Legacy and New APs 150PCI Reporting 151Role-Based Management 153Scalability 154Trend Reporting 155Diverse WAN Environments 156
Appendix A RF Concepts and Terminology 157RF Concepts and Mathematics 157
RF Power 157Frequency 157Antenna Gain and Pattern 158Free-Space RF Propagation 158Noise 159Signal-to-Noise Ratio (SNR) 159Receive Sensitivity 159
Retail Wireless Networks Validated Reference Design | Solution Guide Contents | 7

Link Budget Analysis 160Target Data Rates, Client Bandwidth, and Required SNR 161Calculating Cell Size and Coverage Approximation 163
Comparing Dipole and Downtilt Antennas 164Case Study 165
Understanding Tradeoffs of Narrow Vertical Beamwidth Antennas 167Effect of Increased Antenna Gain on Vertical Beamwidth 168Effect of Mechanical Downtilt 169Effect of Vertical Beamwidth on Horizontal Coverage 171Conclusions 172
Understanding Differences between 900 MHz and 2.4 GHz/5 GHz Systems 172
Summary of Differences 172Impact on System Design 173
Appendix B Client Device Interoperability Matrix 175Tested Devices 175
Security Modes Test Plan 176
Mobility Performance Test Plan 177
Appendix C Worksheets 179
8 | Contents Retail Wireless Networks Validated Reference Design | Solution Guide
Retail Wireless Networks Validated Reference Design | Solution Guide
Chapter 1Introduction
This Retail Wireless Networks Validated Reference Design (VRD) will enable you to plan a successful Aruba deployment for common retail facility types including large footprint stores, small footprint stores, warehouses, distribution centers (DCs), and fulfillment centers (FCs). You will also learn how to plan for and successfully provide wireless coverage in common types of hardened areas including cold storage and outdoor yards.
About Aruba NetworksAruba delivers secure enterprise networks wherever users work or roam. Our mobility solutions bring the network to you — reliably, securely, and cost-effectively — whether you're working in a sales area, stock room, warehouse, or corporate office. Aruba 802.11n WLANs reduce the need for wired ports, lower operating costs. Remote Access Point technology brings the network to branch offices, home offices, or temporary locations with plug-and-play simplicity - all of the heavy lifting stays at the data center. For retailers with legacy wireless LANs, our AirWave multi-vendor management tool supports WLAN devices from 16 manufacturers, allowing you to seamlessly manage old and net networks from a single console.
Aruba Reference ArchitecturesAn Aruba VRD packages network designs, deployment methodologies, configuration procedures, and detailed descriptions of product functionality, serving as a reference model for common customer deployment scenarios. Each Aruba VRD is based on best practices derived from large-scale customer deployments. VRD designs are then constructed in a lab environment and thoroughly tested by Aruba engineers. By using these proven designs, our customers are able to rapidly deploy Aruba solutions in production with the assurance that they will perform and scale as expected.
This Retail Wireless Networks VRD provides a best practice architecture for a retailer deploying a centrally managed secure WLAN with wireless intrusion detection capability to hundreds or thousands of facilities. This guide provides an overview of Aruba enterprise secure wireless LAN (WLAN) products that help merchants maintain PCI compliance, reduce costs, improve operations, and enhance the customer experience.
Introduction | 9

Reference DocumentsThe following reference documents provide an in-depth review of the key products described in this guide.
Wireless Retail ApplicationsWLANs play a strategic role in a wide variety of business-critical retail applications. These applications include:
Inventory Management. Use WLAN-enabled barcode scanners to track inventory in real time, following an item from delivery at the loading dock to its placement on the sales floor.
Price Changes and Auditing. Use a combination of printers and WLAN-enabled mobile barcode-scanning terminals to quickly and accurately perform price checks, price updates, and then print new labels on the floor without requiring additional personnel or printers.
Customer Service. Establish self-help kiosks so that customers can quickly verify pricing or find merchandise without waiting for a store associate.
Mobile Point-of-Sale (POS). Use handheld computers, scanners, and printers with integrated credit card readers for line-busting during high-volume sales periods.
Voice Communication. Take advantage of secure, interference-free voice to improve communication between managers and floor staff.
Guest Internet Access. Retailers are increasingly offering guest Internet access as an enticement to keep customers in the store longer. This also provides Internet connectivity for on-site vendors.
Wireless Video. Mix WLANs and mesh networks with IP cameras for security surveillance without the cost of installing new coaxial cables.
Mesh Networking. Use mesh networks as a low-cost solution to connect to satellite locations. Common examples include onsite fuel stations, guardhouses, and warehouses. Mesh networks also enable temporary outdoor merchandising sales in parking lot areas.
Document Title Version
ArubaOS User Guide 3.3.1
ArubaOS CLI Guide 3.3.1
ArubaOS Release Note 3.3.1
ArubaOS Quick Start Guide 3.3.1
AMP QuickStart Guide 6.0
AMP User Guide 6.0
AMP Release Notes 6.0
Aruba RF Plan User Guide 3.0
Designed for Speed: 802.11n Theory & Practice October, 2007
10 | Introduction Retail Wireless Networks Validated Reference Design | Solution Guide

Technical Challenges for RetailersThis section outlines security, compliance, reliability, and interference challenges that retailers face when using wireless networks.
Security and PCI ComplianceThe PCI standards council has defined mandatory security guidelines in the form of the PCI Data Security Standard (DSS). All organizations that accept credit and debit cards must meet these security requirements. The strict wireless LAN security requirements in the DSS directly affect firewalls, authentication and encryption methods, and monitoring and management systems, and may require costly and complex upgrades to existing networks.
Under the new PCI DSS v1.2 standard, wireless security controls must be implemented, or expensive fines will be levied against non-compliant merchants. On the positive side, compliant merchants enjoy access to bank-offered incentives. These penalties and incentives vary by payment card brand, but often include one or more of the following:
Monthly non-compliance fines for out-of-compliance merchants. This fine is levied on the payment processor that provides payment terminals and payment processing to merchants; however, it has always been passed on to non-compliant merchants. The fines are set on a case-by-case basis. In December 20061, Visa said that it would levy a $25,000/month penalty on every non-compliant merchant. Visa USA alone had levied $4.6 million in penalties in 2006, up from $3.4 million in 2005.
Safe harbor for PCI-compliant merchants in the event of a breach. Any merchant that loses cardholder data due to a breach and is PCI-compliant at the time, is exempt from charges relating to credit and debit card replacements. Replacement credit and debit card numbers cost on the average $80-$320 per number.
Access to lower interchange per transaction rates for PCI-compliant merchants. Merchants can qualify for lower per-transaction card brand fees only if they are PCI-compliant.
In addition to the obvious security benefits, establishing and maintaining PCI compliance confers additional business benefits. Security breaches have a negative impact on merchant brand names and consumer loyalty. In light of the real threat of consumer identity theft, the onus of safeguarding this information is on the merchants who accept credit and debit cards for the services and products they provide.
As an organization, Aruba Networks participates in the PCI Security Standards Council (PCI SSC), and supplies wireless LANs and secure mobility solutions that leading merchants rely upon to comply with PCI standards.
ReliabilityRetailers must make sure that their WLANs deliver consistent coverage throughout their facilities, operate without dropping sessions, and run with virtually no down time. Wireless networks should operate as a service with defined objectives for availability and performance.
Reliability encompasses both the RF domain and the network infrastructure domain. Good RF design results in predictable communication between wireless devices and the WLAN infrastructure. Careful network engineering is also required to deploy wireless controllers and thin access points (APs) that work together as a system over existing IP networks. Controller clustering, AP redundancy systems, and load balancing are integral to modern wireless architectures.
1. http://www.corporate.visa.com/md/nr/press667.jsp
Retail Wireless Networks Validated Reference Design | Solution Guide Introduction | 11

Interference from Non-802.11 DevicesOlder wireless systems sometimes used frequency-hopping spread spectrum (FHSS) technology in the 2.4 GHz band. Some newer electronic shelf labeling systems are also based on FHSS radios. FHSS systems use a different radio technology compared to current 802.11a/b/g/n access points. The two technologies are not compatible with one another and can create significant interference when both types of systems are operating in the same area. To avoid this problem, retailers should phase out FHSS wireless devices in favor of a faster and more secure WLAN technology.
Business Challenges for RetailersIn addition to technical challenges, retailers continually strive to manage costs, while choosing innovative investments that will drive revenue for the future.
Improving OperationsThe retail industry runs on smaller gross profit margins than many other industries, and managers are on a never-ending quest to decrease costs. WLANs offer a means to reduce network deployment costs and operating expenses. The Aruba centralized WLAN architecture automates management of both local and remote store networks, reducing the burden on IT organizations. The Aruba WLAN also provides a single multipurpose platform that supports business-critical data, voice, and video applications, and interoperates with legacy core networking and security infrastructure to substantially reduce future capital expenses.
The Store of the FutureAn Aruba WLAN supports new types of applications that enhance the customer experience, increase customer loyalty, and enable new merchandising techniques. Mobile POS, in-store video programming, and guest Internet access are just some of the applications that you can take advantage of with a reliable wireless infrastructure.
The Shift to 802.11nMultiple generations of wireless LAN technology are on the market today, and the most recent is the high-speed 802.11n Draft 2.0 implementation. 802.11n was developed by the IEEE 802.11 working group and defines the base technical requirements for all 802.11n products. The “Draft” designation will be removed when standards ratification is complete. The advanced features and high-speed performance of 802.11n devices have attracted the attention of merchants. Many are already considering or deploying 802.11n devices that have been certified interoperable by the Wi-Fi Alliance.
802.11n technology benefits include:
More uniform and reliable coverage in the presence of multipath interference. Multipath interference is a common side-effect of operating indoor wireless networks. The multiple-input, multiple-output (MIMO) technology incorporated into 802.11n is very effective at reducing the effects of multipath interference.
Improved range and a larger coverage zone. The use of multiple-antenna MIMO technology on both the AP and the client significantly improves wireless range and coverage.
Increased data rates. 802.11n can support data rates of 100-200 Mbps that compare very favorably with 100BaseT Ethernet.
Increased capacity, improved range, and more uniform coverage can lower installation and maintenance costs and result in a more reliable network. In some cases, fewer 802.11n APs may be needed to cover the same area that previously needed more 802.11a/b/g APs. Consequently the 802.11n network may consume fewer LAN edge switch ports while supporting higher bandwidth applications such as streaming video, that were previously supported only on wired LANs.
12 | Introduction Retail Wireless Networks Validated Reference Design | Solution Guide

Value Proposition for RetailersThe Aruba network architecture centralizes access control, authentication, and encryption at a network controller, thereby simplifying network management, and boosting security. Key benefits of this secure architecture include:
Integrated security compliant with PCI DSS Version 1.2. International Computer Security Association (ICSA) certified firewall and available wireless intrusion prevention system supports both wireless and non-wireless deployments for network breach protection. The firewall also makes it possible to isolate legacy WEP devices, permitting these devices to remain in service even in PCI DSS v1.2-compliant networks.
Aruba Adaptive Radio Management (ARM). ARM automatically adjusts network and client operating conditions to deliver optimum performance in a dynamically changing RF environment. Over-the-air and over-the-wire prioritization of latency-sensitive packets enables data, voice, and video applications to co-exist and function at peak performance.
Scalability. The Aruba solution supports installations of almost any size. Remote AP technology delivers the a secure and reliable networking environment to remote sites by centrally monitoring, diagnosing, and maintaining them from primary or back-up data centers. The Aruba WLAN can also be integrated with third-party help desk systems to solve end-user issues.
The AirWave Wireless Management Suite. You can manage wireless networks containing hardware from more than 16 vendors with the AirWave Wireless Management Suite. This allows you to continue to manage legacy devices and networks from a single console even as newer networks are deployed.
Retail Wireless Networks Validated Reference Design | Solution Guide Introduction | 13

Contacting Aruba Networks
Web Site Support
Main Site http://www.arubanetworks.com
Support Site https://support.arubanetworks.com
Software Licensing Site https://licensing.arubanetworks.com/login.php
Wireless Security Incident Response Team (WSIRT)
http://www.arubanetworks.com/support/wsirt.php
Support Emails
Americas and APAC [email protected]
EMEA [email protected]
WSIRT Email Please email details of any security problem found in an Aruba product.
Telephone Support
Aruba Corporate +1 (408) 227-4500
FAX +1 (408) 227-4550
Support
United States 800-WI-FI-LAN (800-943-4526)
Universal Free Phone Service Number (UIFN): Australia, Canada, China, France, Germany, Hong Kong, Ireland, Israel, Japan, Korea, Singapore, South Africa, Taiwan, and the UK.
+800-4WIFI-LAN (+800-49434-526)
All Other Countries +1 (408) 754-1200
14 | Introduction Retail Wireless Networks Validated Reference Design | Solution Guide

Retail Wireless Networks Validated Reference Design | Solution Guide
Chapter 2Wireless LAN Lifecycle
The retail industry was one of the first to adopt and deploy enterprise WLAN technology on a wide scale. Early generations of WLANs used autonomous or “fat” access points (APs) with Frequency-Hopping Spread Spectrum (FHSS) or Direct Sequence Spread Spectrum (DSSS) radios. Later generations used 802.11b technology, and more recent generations were based on 802.11a/b/g. Retailers operate a diverse mix of clients on these networks, including Voice over Wi-Fi (VoFi) and radio frequency identification (RFID). In many ways, the retail industry pioneered the use of WLANs and is doing so again today with the rollout of 802.11n technology.
Today, retailers need both robust connectivity and stringent security against network breaches that can put sensitive business and payment card data at risk. Retailers also need to support and manage hundreds or thousands of remote sites. The advent of state-of-the-art centralized WLAN controller-based architectures and thin APs address these requirements, and help retailers enjoy greater cost efficiencies and improved in-store customer experiences.
The WLAN LifecycleThe lifecycle of an enterprise WLAN typically moves through four distinct phases over a period of 4 to 5 years. The organization of this guide’s contents follows this lifecycle, beginning with the Define phase and moving sequentially through the Design, Deploy, and Operate phases.
Figure 1 WLAN Lifecycle
Ret
ail_
110
Define
Deploy
Design
Operate
Wireless LAN Lifecycle | 15

Each new evolution of the WLAN lifecycle begins by defining the objectives, requirements, and constraints facing the retailer. The Define phase also includes pre-deployment site surveys.
The requirements definition process addresses the broad WLAN project-level, infrastructure-level, and application-level drivers and dependencies. Common examples (explored in depth in Chapter 3, “Defining WLAN Requirements for Retailers” ) include:
Mobile client applications and use cases
Client device types
Store facility types, locations, and RF coverage zones
Hardened environment types and locations
User authentication modes and device types
Summary of voice and QoS design choices
Quantification of key design or scale parameters
Financial, technical, and scheduling design constraints.
Pre-deployment site surveys provide vital engineering data during the RF design portion of the Design phase. The site survey process has changed significantly over the years to accommodate centralized WLAN controller-based architectures that use densely-deployed, centrally-managed, or “thin,” APs. Chapter 4, “RF Site Surveys” provides guidance on how to use targeted site surveys to assess whether pre-existing RF plans and cabling plants can successfully be reused with thin APs.
Centralized controller-based WLAN architectures offer significant security, self-healing, performance, and flexibility advantages. They also offer vital automation features that greatly reduce the workload for shorthanded merchant IT organizations. These capabilities require new types of design and architectural decisions that are not compatible with legacy “fat” AP design.
Aruba recommends splitting the Design phase for an enterprise WLAN into the following parts, each of which is described in a separate chapter in this guide:
Logical and Physical Network Design. In a thin AP architecture, controllers and APs work together as a system that is overlaid on the existing wired LAN and WAN infrastructure. The retailer must choose where to physically locate controllers and APs within that infrastructure, determine how the WLAN will communicate logically at layer 2 and layer 3, determine how to set up controller redundancy, perform capacity planning for controllers and WAN links, and make sure that AP radios comply with local laws. For more information, see Chapter 5, “Physical and Logical Network Design” .
RF Design. RF design must address the number of required APs, the optimal AP locations, and distance limits in the WLAN. Typical retail distribution center (DC), fulfillment center (FC), dock environments, and stores have high ceilings, high shelving with variable RF-absorption properties, moving equipment and personnel, and legacy transmission systems (such as FHSS APs) that must coexist. Finally, 802.11n technology poses new RF design challenges and opportunities.
Aruba leads the industry in developing specialized antenna designs and placement strategies to provide a consistent experience for both indoor and outdoor wireless users. For more information, see Chapter 6, “RF Design” .
Authentication and Security Design. Security and PCI compliance is driving many retailers to invest in a new generation of controller-based WLAN equipment. Older generations of wireless equipment have been repeatedly compromised. Other potentially at-risk situations include large workforces with shared wireless devices that do not use individual login credentials. To meet the new requirements, the retailer must determine how to integrate the WLAN controller with the existing Authentication, Authorization, and Accounting (AAA) infrastructure. The retailer must also decide how to detect, classify, and potentially contain unauthorized or ‘rogue’ devices in the airspace. For more information, see Chapter 7, “Authentication and Security” .
16 | Wireless LAN Lifecycle Retail Wireless Networks Validated Reference Design | Solution Guide

Voice, Video, and QoS Design. Merchants have used voice and video for years, despite the serious quality and performance issues. Now, Aruba centralized WLAN technology can address retailer needs with significant improvements in call quality and reliability. Some voice features require architecture planning, as described in Chapter 8, “QoS Design for Voice and Data Devices” .
Retailers face deployment challenges when they are required to migrate technology and refresh software. Hundreds or thousands of locations must be installed, typically in narrow nighttime time windows, by technicians with limited IT skills, and at the lowest possible cost. Project management and logistics excellence are required.
Aruba controllers and APs offer system administrators a set of provisioning features specifically designed to enable retailers to successfully undertake rollouts with tens of thousands of APs. These features allow Aruba to offer three different deployment methodology options for retailers. The choice of methodology is driven by the number of locations, geography, and availability of VPN access to each site. See Chapter 9, “Deployment Methodologies” to determine the best methodology for your organization. Site-specific deployment and certification procedures are covered in that chapter.
To reduce the workload of network administrators who must manage far-flung equipment and respond promptly to alerts and notifications, the Aruba controller-based architecture provides automated dynamic RF management of channel and power settings, blacklisting of rogue devices, and network-awareness of individual user sessions and roaming states.
Rapid resolution of WLAN user issues is a basic function of any retail support desk. Support personnel must obtain actionable information about the health of specific client device connections in order to resolve problems. Long-term trending is necessary for accurate capacity planning.
Automation is a key requirement for merchants because their IT organizations must support large numbers of distribution centers (DCs), fulfillment centers (FCs), and stores with very limited personnel. New PCI, SOX, and related compliance requirements impose reporting burdens that further tax retailers human resources. The AirWave Wireless Management Suite offers powerful centralized reporting, management, and forensic tools that enable retailers to support tens of thousands of AP locations. See Chapter 10, “Operations and Management” for a discussion of AirWave Wireless Management Suite capabilities.
Retail Wireless Networks Validated Reference Design | Solution Guide Wireless LAN Lifecycle | 17

18 | Wireless LAN Lifecycle Retail Wireless Networks Validated Reference Design | Solution Guide

Retail Wireless Networks Validated Reference Design | Solution Guide
Chapter 3Defining WLAN Requirements for Retailers
This chapter presents the structured four-step process used by retail organizations to define the fundamental requirements that drive the design of an Aruba WLAN solution. The information gathered in this process helps you prepare to design the technology infrastructure to support your desired applications, throughput needs, encryption modes, user authentication types and reporting levels.
Step 1 - Choose a PCI Compliance CategoryAruba offers three levels of wireless LAN security to attain and maintain PCI compliance. The levels differ in terms of the security capabilities provided, how they overlay on top of existing networks, and cost. Chapter 7, “Authentication and Security” provides a detailed introduction to the PCI DSS v1.2 standard and how to map its requirements to your organization.
Category 1: PCI Monitoring
The PCI monitoring option entails installing the AirWave Wireless Management Suite (AWMS) in the headquarters (HQ) or data center, so that all remote locations and stores can be monitored in compliance with PCI requirements. Designed to assist you in inventorying, monitoring, and managing multi-vendor wireless networks, AWMS represents the most cost-effective approach to addressing applications in which legacy wireless networks are already in place. No hardware or software is required at any remote location.
The PCI monitoring option enables merchants to outfit existing networks with wireless monitoring capabilities without replacing or re-architecting existing equipment.
Category 2: Wireless IDS
Server at HQ monitors all locations No dedicated sensor hardware required Monitors for and reports rogues reports
AirWave Wireless Management
Server and Controller at HQ Sensors in stores scan RF No change to existing LAN or WLAN Monitors for rogues, attacks & reports Prevents rogues & attacks
Controller Sensor
AirWave Wireless Management
Defining WLAN Requirements for Retailers | 19

The Wireless Intrusion Detection System (WIDS) option requires dedicated air monitoring sensors to be installed in all remote locations. The sensor scans all the wireless channels and forwards captured traffic to an Aruba Multi-Service Mobility Controller in the headquarters or data center for analysis. The controller compares wired and wireless traffic, identifies and locates any rogue devices or attacks originating from outside the building, and automatically blocks the rogue devices and attacks. The number of sensors required varies with the size of each facility. Chapter 6, “RF Design” explains how to compute the required number of sensors.
As with the Category 1 solution, AirWave with WIDS enables merchants to add additional wireless security capabilities to existing networks without replacing or re-architecting those existing wired and wireless networks.
Category 3: Wireless LAN with IDS and Role-Based Access Control
The wireless LAN with WIDS and role-based access control option integrates intrusion detection functionality with the advantages of a centralized wireless LAN, built-in stateful firewall, and AirWave monitoring. Aruba controllers in the data center and remote locations are managed centrally through the AirWave Management Platform, which aggregates all wireless network information and provides PCI compliance reports.
The integrated Aruba WLAN provides all of the security controls necessary to meet wireless-specific PCI requirements, offers controls for some wired LAN requirements, and includes controls that go beyond PCI requirements to help prevent breaches. Competing solutions require three to four times the amount of hardware and software to provide comparable functionality.
Aruba access points (APs) are multiple-function devices. They provide secure wireless LAN coverage for data, voice, and video applications. In addition, they can function as a wireless IPS sensor, a wireless mesh node, and a remote access VPN client. Aruba APs, installed in each remote location or store, send all traffic to a centralized controller in the HQ or data center via an encrypted tunnel.
Air monitoring sensors can be deployed in either dedicated or hybrid mode. Dedicated air monitors provide the highest level of security by continuously monitoring and responding to threats. Hybrid-mode APs perform monitoring on a part-time basis in between serving client requests. Chapter 6, “RF Design” provides detailed guidance on choosing between these modes.
The central controller aggregates all traffic which is then inspected via role-based stateful firewall segmentation to confirm compliance with security policies, encryption/decryption requirements, and wireless intrusion detection and prevention services. Firewall segmentation can isolate and protect vulnerable legacy WEP or WPA-PSK devices.
The Category 3 solution should appeal to merchants who need to replace existing legacy wireless LANs in order to comply with security, management, and application requirements. The bulk of this Validated
Server and Controller at HQ Dedicated or Hybrid mode APs
as sensors APs added as necessary for
coverage Stateful firewall segmentation Monitors for rogues, attacks,
reports Protects legacy (WEP-only)
clients
Controller
Hybrid APs
AirWave Wireless Management
20 | Defining WLAN Requirements for Retailers Retail Wireless Networks Validated Reference Design | Solution Guide

Reference Design (VRD) details the design and deployment of a Category 3 solution for retail customers.
Start Small, Grow As NeededThe categories of solutions previously described address different security needs. Merchants can easily migrate to a higher category and thereby leverage existing investments by simply adding the additional devices and/or software required by the higher category. Merchants can affordably enable all or a subset of the capabilities. For example, an Aruba IDS sensor can later be converted into an access point via software download over the network.
Aruba Solution and PCI Compliance Requirements: Quick Reference
PCI Monitoring Wireless IDS Aruba WLAN
Requirements For Category 1: No WLAN
11.1: Wireless IDS
Additional Requirements For Category 2: No Cardholder Data Over WLAN
1.1.2: Inventory WLAN
1.2.3: Firewall WLAN
2.1.1: Do Not Use Defaults
2.2: Standard Configuration
4.1.1: No WEP
6.1: Updated Patches
9.1.3: Physical AP Security
Additional Requirements For Category 3: Cardholder Data Over WLAN
7.2: Role-based Control
10: Monitor Access
Additional Requirements For Wired LAN Security
5.2: Anti-virus Enforcement
8.3: Secure Remote Access
8.5.6: Time-based Control
9.1.2: Secure Public Ports
Retail Wireless Networks Validated Reference Design | Solution Guide Defining WLAN Requirements for Retailers | 21
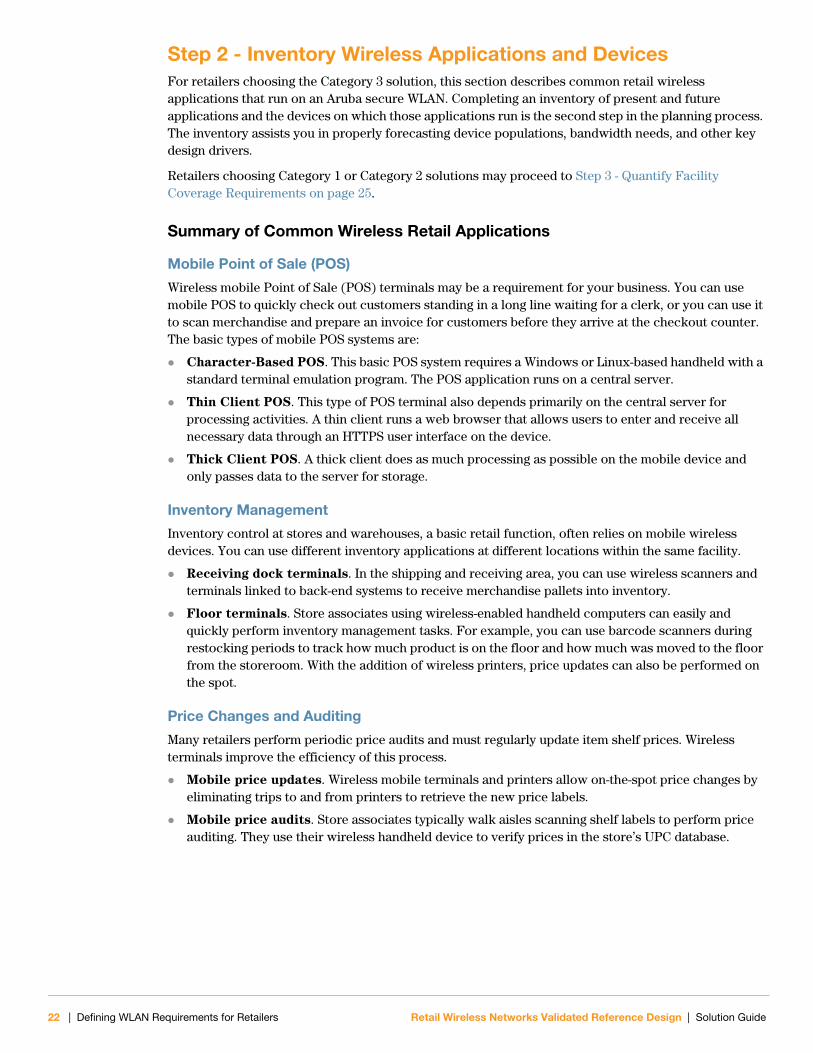
Step 2 - Inventory Wireless Applications and DevicesFor retailers choosing the Category 3 solution, this section describes common retail wireless applications that run on an Aruba secure WLAN. Completing an inventory of present and future applications and the devices on which those applications run is the second step in the planning process. The inventory assists you in properly forecasting device populations, bandwidth needs, and other key design drivers.
Retailers choosing Category 1 or Category 2 solutions may proceed to Step 3 - Quantify Facility Coverage Requirements on page 25.
Summary of Common Wireless Retail Applications
Mobile Point of Sale (POS)
Wireless mobile Point of Sale (POS) terminals may be a requirement for your business. You can use mobile POS to quickly check out customers standing in a long line waiting for a clerk, or you can use it to scan merchandise and prepare an invoice for customers before they arrive at the checkout counter. The basic types of mobile POS systems are:
Character-Based POS. This basic POS system requires a Windows or Linux-based handheld with a standard terminal emulation program. The POS application runs on a central server.
Thin Client POS. This type of POS terminal also depends primarily on the central server for processing activities. A thin client runs a web browser that allows users to enter and receive all necessary data through an HTTPS user interface on the device.
Thick Client POS. A thick client does as much processing as possible on the mobile device and only passes data to the server for storage.
Inventory Management
Inventory control at stores and warehouses, a basic retail function, often relies on mobile wireless devices. You can use different inventory applications at different locations within the same facility.
Receiving dock terminals. In the shipping and receiving area, you can use wireless scanners and terminals linked to back-end systems to receive merchandise pallets into inventory.
Floor terminals. Store associates using wireless-enabled handheld computers can easily and quickly perform inventory management tasks. For example, you can use barcode scanners during restocking periods to track how much product is on the floor and how much was moved to the floor from the storeroom. With the addition of wireless printers, price updates can also be performed on the spot.
Price Changes and Auditing
Many retailers perform periodic price audits and must regularly update item shelf prices. Wireless terminals improve the efficiency of this process.
Mobile price updates. Wireless mobile terminals and printers allow on-the-spot price changes by eliminating trips to and from printers to retrieve the new price labels.
Mobile price audits. Store associates typically walk aisles scanning shelf labels to perform price auditing. They use their wireless handheld device to verify prices in the store’s UPC database.
22 | Defining WLAN Requirements for Retailers Retail Wireless Networks Validated Reference Design | Solution Guide

Customer Service Kiosks
Customer service is a critical priority for every retailer. Some retailers use the following wireless-enabled technologies to improve the customer experience.
Price verification kiosks. These have become very popular with retailers and tech-savvy customers to conveniently look up prices. Wireless kiosks can be moved as needed.
Self-help kiosks. You can place these around a store, giving customers touch-screen access to store directories, inventory information for nearby stores in a chain, current sales, and product information. Some retailers have augmented these self-help kiosks with a “get help” button to page an associate to the customer’s location.
Wireless Voice Communication
Unlike two-way radios or walkie-talkies, a wireless LAN enables secure voice communications free from interference, with superior voice quality, and with encryption to prevent eavesdropping.
Voice handsets. 802.11 voice devices include rugged purpose-built handsets used to page team members or to communicate with the warehouse and locate stock in inventory without leaving the customer.
Converged personal digital assistants (PDAs). Voice can be combined with data applications on converged PDA scanning terminals. These devices are often Windows Mobile-based, and may have a Bluetooth or headset interface to support hands-free operation.
Guest Internet Access
An increasing number of customers enjoy the use of guest Internet access in the retail environment, either free or paid. This access attracts customers to the store and builds loyalty. Guest access also benefits vendor representatives visiting the store to do store business.
The Aruba built-in captive portal functionality allows retail customers to implement a range of security levels, from completely open (following a brief registration process), to password-restricted, to fee-based services.
Some retailers offering guest Internet access choose to contract with outside service providers to install and manage the service.
Wireless Video
Retailers have long-term investments in video surveillance equipment and cabling infrastructure. New in-store video marketing programs and new security technologies are driving some retailers to redesign their video plants. The challenge is how to deliver more in-store video without having to install more cable.
Video surveillance. Wireless IP video surveillance solutions allow retailers to monitor people and assets in real-time, while enabling easy addition of camera locations.
In-store video programming. Wireless LANs link LCD television monitors to a central server for in-store video programming. This technology allows the placement of screens conveniently throughout the store for customer viewing.
Retail Wireless Networks Validated Reference Design | Solution Guide Defining WLAN Requirements for Retailers | 23

Application Inventory WorksheetComplete a worksheet that captures all current and future wireless application use. You can use the example application summary listed below as a tool to facilitate meetings between IT, store managers, warehouse managers, and executive management.
For each application identified, note the facilities in which it is used and on which device types. Be sure to capture anticipated future devices as well as current devices. Estimate the average number of users in each facility type today, as well as several years into the future. Finally, assign every application a minimum 802.11 performance criteria, either a minimum data rate or a minimum signal-to-noise ratio (SNR). This information will be used to complete the Physical/Logical Design in Chapter 5, “Physical and Logical Network Design” and the RF Design in Chapter 6, “RF Design” .
Device Inventory WorksheetIdentify all of the specific client device makes and models used in all facility types. In particular, be sure to capture any device limitations such as radio type, radio transmit power, and strongest authentication capability. Also, capture the best firmware level to make sure that all devices are current. Include all devices currently in use, as well as any devices under active consideration for purchase.
Construct a table similar to the example below to capture these items. This information will be used to complete the RF Design in Chapter 6, “RF Design” and the Authentication/Security Design in Chapter 7, “Authentication and Security” .
Table 1 Application Inventory Worksheet Example
#Application Description
Facility Type(s)Deployed
(from Table 3)
Device Type(s) Used
(from Table 2)
Users per Facility(Average)
Minimum 802.11 Performance Requirement
Current Future Data Rate SNR
1 Warehouse Management System
DCs A, B 80 120 2 Mbps —
2 Mobile POS System Retail Stores – US & Canada (all size bands)
B 10 20 2 Mbps —
3 In-Store Voice Retail Stores – US (Size band 3 & 4)
C 15 30 — 20
4 Sales Floor Inventory Management
Retail Stores – USA & Canada (size band 4)
D 15 25 2 Mbps —
5 Gift Registry Application
Retail Stores – USA (size band 4)
E 5 15 24 Mbps —
Table 2 Device Inventory Worksheet Example
# Make ModelOperating
System
Strongest Authentication
Mode
Best Firmware
Level
802.11 Radio Type
MaximumOutputPower
A Intermec CK31 Win CE .NET WPA2/802.1x 4.20 b/g 17 dBm
B Symbol 9090G Windows Mobile
WPA2/802.1x 5.1.70 a/b/g 20 dBm
C Vocollect Talkman T5 Proprietary Voice
WPA-PSK 4.20 b only 12 dBm
D Symbol 6846 MS-DOS WEP — b only 20 dBm
E Xybernaut Atigo
S310LX Windows XP WPA2/802.1x 5.0 a/b/g 20 dBm
24 | Defining WLAN Requirements for Retailers Retail Wireless Networks Validated Reference Design | Solution Guide

Step 3 - Quantify Facility Coverage RequirementsTo generate the equipment bill of materials for any of the three PCI compliance categories, you need to know the number, size, and type of facilities that will be covered. Be sure to include areas requiring special treatment, such as freezers or outdoor yards during this step. Later, you will use this information to estimate the amount of equipment required for each of the three PCI Compliance Categories:
Category 1: Number of legacy APs to be monitored
Category 2: Number of Air Monitors and Controllers
Category 3: Number of APs, Air Monitors, and Controllers
This information is used to construct the logical and physical architecture in Chapter 5, “Physical and Logical Network Design” and the RF Design in Chapter 6, “RF Design” . The equipment requirements for the various PCI categories can also be combined with facility counts in order to estimate the labor required to deploy the solution.
Store Facility Types and LocationsRetailer facility types fall roughly into these categories:
Warehouses, Fulfillment Centers, and Distribution Centers
Large footprint stores
Small footprint stores
For each facility type, answer the following questions:
How many of each type of facility exist?
What is the average square footage of each facility type?
What is the maximum ceiling height for each facility type?
Have you obtained a current digital floor plan for each facility address?
In how many separate country/regulatory domains does this type exist?
Will a controller be installed at the location?
What is the redundancy requirement for the location?
What is the min/max WAN backhaul link speed for each type?
What WAN technologies (for example, frame relay, point-to-point, and VSAT) are in use for each type?
What is the associated WAN link latency for each link type?
Some merchants have wide variation in the square footage of their stores. In this case, Aruba recommends dividing the store population into size “bands” that correspond to the number of APs that are expected to be installed in each store. For example, if the AP density selected in Chapter 6, “RF Design” is 7,500 square feet, you would create a table with the following information:
Band 1: 0 – 7,500 square feet (1 AP)
Band 2: 7,500 – 15,000 square feet (2 APs)
Band 3: 15,000 – 22,500 square feet (3 APs)
Band 4: 22,500 – 30,000 square feet (4 APs)
Retail Wireless Networks Validated Reference Design | Solution Guide Defining WLAN Requirements for Retailers | 25
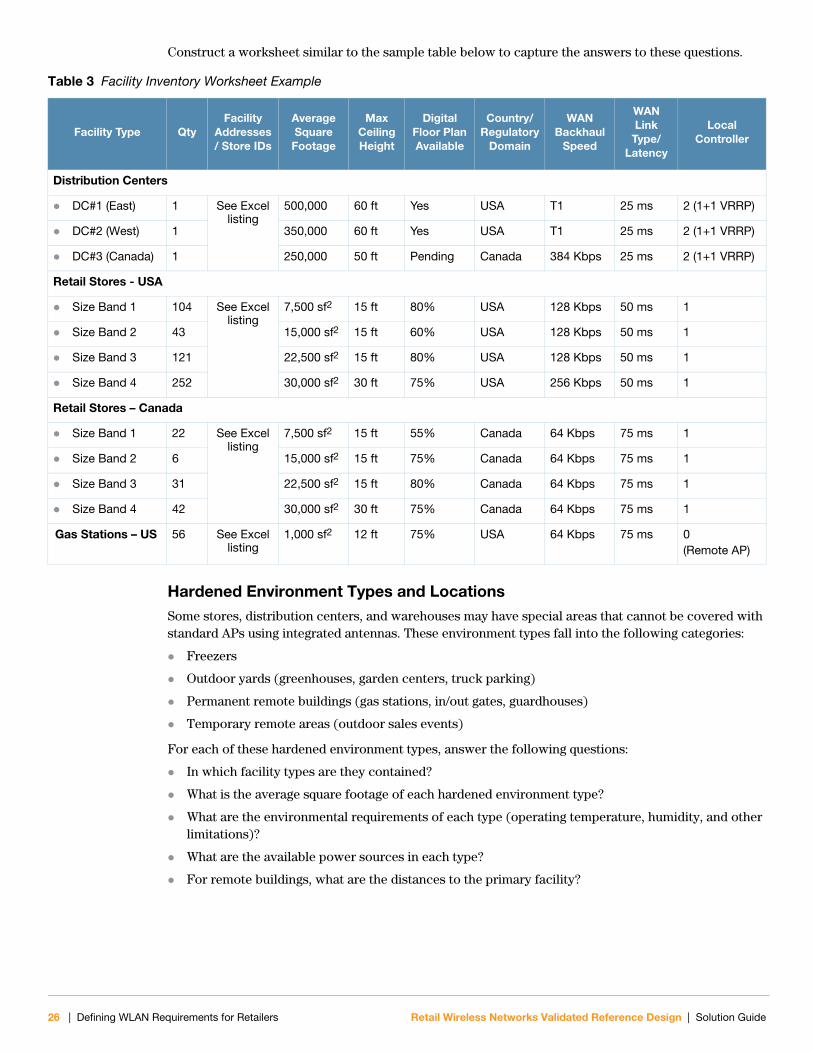
Construct a worksheet similar to the sample table below to capture the answers to these questions.
Hardened Environment Types and LocationsSome stores, distribution centers, and warehouses may have special areas that cannot be covered with standard APs using integrated antennas. These environment types fall into the following categories:
Freezers
Outdoor yards (greenhouses, garden centers, truck parking)
Permanent remote buildings (gas stations, in/out gates, guardhouses)
Temporary remote areas (outdoor sales events)
For each of these hardened environment types, answer the following questions:
In which facility types are they contained?
What is the average square footage of each hardened environment type?
What are the environmental requirements of each type (operating temperature, humidity, and other limitations)?
What are the available power sources in each type?
For remote buildings, what are the distances to the primary facility?
Table 3 Facility Inventory Worksheet Example
Facility Type QtyFacility
Addresses / Store IDs
Average SquareFootage
Max Ceiling Height
Digital Floor Plan Available
Country/Regulatory
Domain
WANBackhaul
Speed
WANLink
Type/ Latency
Local Controller
Distribution Centers
DC#1 (East) 1 See Excel listing
500,000 60 ft Yes USA T1 25 ms 2 (1+1 VRRP)
DC#2 (West) 1 350,000 60 ft Yes USA T1 25 ms 2 (1+1 VRRP)
DC#3 (Canada) 1 250,000 50 ft Pending Canada 384 Kbps 25 ms 2 (1+1 VRRP)
Retail Stores - USA
Size Band 1 104 See Excel listing
7,500 sf2 15 ft 80% USA 128 Kbps 50 ms 1
Size Band 2 43 15,000 sf2 15 ft 60% USA 128 Kbps 50 ms 1
Size Band 3 121 22,500 sf2 15 ft 80% USA 128 Kbps 50 ms 1
Size Band 4 252 30,000 sf2 30 ft 75% USA 256 Kbps 50 ms 1
Retail Stores – Canada
Size Band 1 22 See Excel listing
7,500 sf2 15 ft 55% Canada 64 Kbps 75 ms 1
Size Band 2 6 15,000 sf2 15 ft 75% Canada 64 Kbps 75 ms 1
Size Band 3 31 22,500 sf2 15 ft 80% Canada 64 Kbps 75 ms 1
Size Band 4 42 30,000 sf2 30 ft 75% Canada 64 Kbps 75 ms 1
Gas Stations – US 56 See Excel listing
1,000 sf2 12 ft 75% USA 64 Kbps 75 ms 0(Remote AP)
26 | Defining WLAN Requirements for Retailers Retail Wireless Networks Validated Reference Design | Solution Guide

Use the worksheet format shown in Table 4 with a row for every hardened area in each facility type. Use multiple rows if several hardened areas exist in the same facility.
Step 4 - Itemize SSID Configuration RequirementsAll thin APs have the ability to broadcast multiple virtual service set identifiers (SSIDs) from a single physical AP. Each SSID may have different encryption, quality of service (QoS) and battery assist settings. This feature enables the WLAN infrastructure to support the many different generations of mobile devices that may be in use at each retail facility.
In addition, Aruba is the only WLAN vendor to offer an International Computer Security Association (ICSA) certified firewall built into the controller, enabling each user to be assigned to a predefined “role” with specific permissions enforced on a per-packet basis. In Chapter 7, “Authentication and Security” , you will learn how to complete the Authentication and Security design for each SSID. In Chapter 8, “QoS Design for Voice and Data Devices” , you will learn how to implement QoS requirements for voice or other devices with time-sensitive traffic requirements.
Table 4 Hardened Environment Inventory Example
Facility TypeHardened Area
Type(s) Per Location
Hardened Area
Count(s) Per
Location
Average Square
Footage
Thermal Limits (Min or Max)
AP Model2.4GHz
Antenna Model & Mount
5 GHz Antenna Model & Mount
AP Backhaul Method
Distribution Centers
DC#1 (East) Freezer 4 50,000 sf2 -5ºF AP70 (Outside)
ANT-84 (Inside Wall)
— PoE
DC#1 (East) Guardhouse 1 150 sf2 — AP85 ANT-13B (Ceiling)
ANT-89 (Mast)
Mesh
DC#2 (West) Freezer 2 35,000 sf2 -5ºF AP70 (Outside)
ANT-84(Inside Wall)
— PoE
DC#2 (West) Guardhouse 1 150 sf2 — AP85 ANT-13B(Ceiling)
ANT-89(Mast)
Mesh
DC#3 (Canada) Freezer 2 25,000 sf2 -5ºF AP70 (Outside)
ANT-84 (Inside Wall)
— PoE
Retail Stores - USA
Size Band 3 Cooler 1 3,000 sf2 +32ºF AP65 Bleed OK Bleed OK PoE
Size Band 4 Cooler 2 5,000 sf2 +32ºF AP65 Bleed OK Bleed OK PoE
Size Band 4 Garden Store 1 5,000 sf2 +110ºF AP85 ANT-80D ANT-86D PoE
Retail Stores – Canada
Size Band 4 Cooler 1 4,000 sf2 +32ºF AP65 Bleed OK Bleed OK PoE
Retail Wireless Networks Validated Reference Design | Solution Guide Defining WLAN Requirements for Retailers | 27
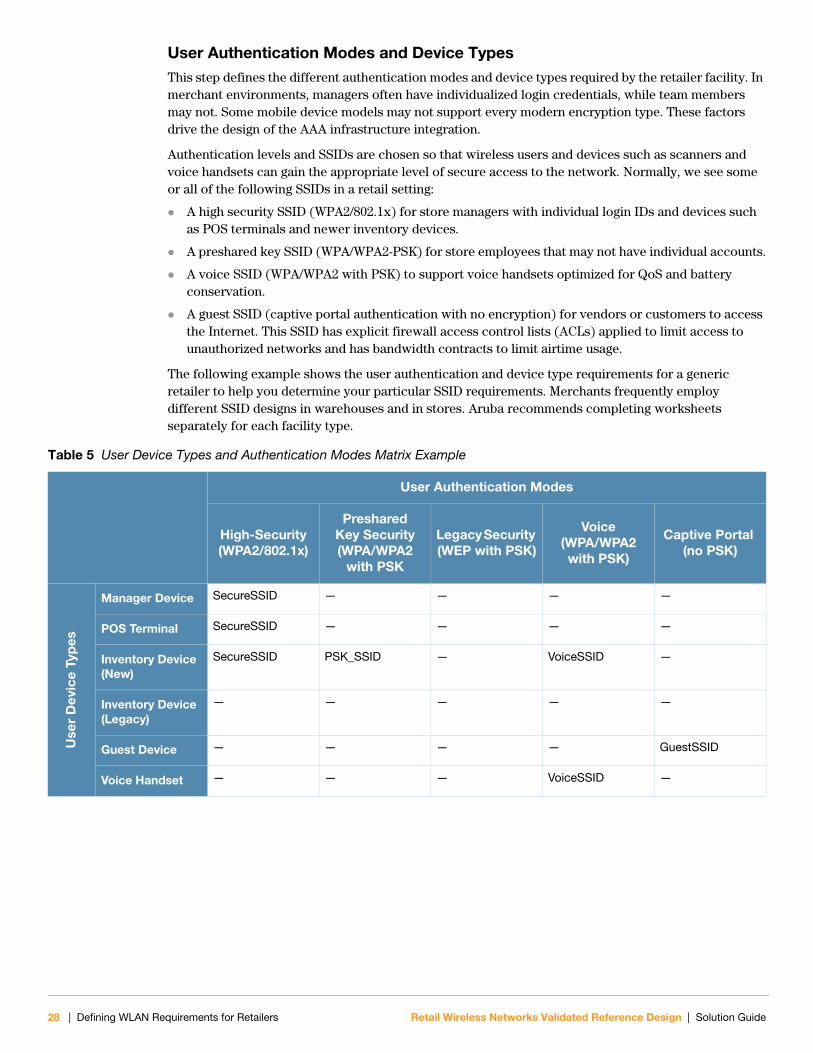
User Authentication Modes and Device TypesThis step defines the different authentication modes and device types required by the retailer facility. In merchant environments, managers often have individualized login credentials, while team members may not. Some mobile device models may not support every modern encryption type. These factors drive the design of the AAA infrastructure integration.
Authentication levels and SSIDs are chosen so that wireless users and devices such as scanners and voice handsets can gain the appropriate level of secure access to the network. Normally, we see some or all of the following SSIDs in a retail setting:
A high security SSID (WPA2/802.1x) for store managers with individual login IDs and devices such as POS terminals and newer inventory devices.
A preshared key SSID (WPA/WPA2-PSK) for store employees that may not have individual accounts.
A voice SSID (WPA/WPA2 with PSK) to support voice handsets optimized for QoS and battery conservation.
A guest SSID (captive portal authentication with no encryption) for vendors or customers to access the Internet. This SSID has explicit firewall access control lists (ACLs) applied to limit access to unauthorized networks and has bandwidth contracts to limit airtime usage.
The following example shows the user authentication and device type requirements for a generic retailer to help you determine your particular SSID requirements. Merchants frequently employ different SSID designs in warehouses and in stores. Aruba recommends completing worksheets separately for each facility type.
Table 5 User Device Types and Authentication Modes Matrix Example
User Authentication Modes
High-Security (WPA2/802.1x)
PresharedKey Security (WPA/WPA2
with PSK
Legacy Security (WEP with PSK)
Voice (WPA/WPA2 with PSK)
Captive Portal (no PSK)
Use
r D
evic
e Ty
pes
Manager Device SecureSSID — — — —
POS Terminal SecureSSID — — — —
Inventory Device (New)
SecureSSID PSK_SSID — VoiceSSID —
Inventory Device (Legacy)
— — — — —
Guest Device — — — — GuestSSID
Voice Handset — — — VoiceSSID —
28 | Defining WLAN Requirements for Retailers Retail Wireless Networks Validated Reference Design | Solution Guide

Summary of Voice and QoS Design ChoicesOptimizing handset configuration is vital to providing a high level of service to users in each store or warehouse. In an Aruba WLAN, the controller can be set up for specific device QoS levels. Use the worksheet below to record this information for use in your deployment.
Table 6 QoS Settings Inventory for Vocollect Talkman T5 Example
QoS Configuration
Handset Capability(see Table 2)
Controller Configuration Handset Configuration
Des
ign
Par
amet
ers
Band Selection 802.11b only Enable band steering to maximize bandwidth by shifting other data devices to 5 GHz
Set basic rates to 1 and 2Mbps. Set supported rates to 1, 2,
5.5 and 11Mbps
Default (no action)
Adaptive Radio Management
30mW (15dBm) Enable ARM Set min_TX_power to 12 dBm Set max_TX_power to 18 dBm
Default (no action)
Separate SSIDs Preferred DTIM = 10 Enable separate SSID for device Set DTIM = 10
Default (no action)
Authentication WPA-PSK Configure SSID for WPA-PSK Configure handsets for WPA-PSK
VLAN Settings No special requirements Use /24 subnets to restrict broadcast domain
Default (no action)
Battery Life UAPSD not supported WMM not supported
Default (no action) Default (no action)
RF Management No special requirements Set max-retries =2 Set max_TX_fail retries = 25
for SSID Enable infrastructure response
to probe requests (default) Do not hide SSID (default)
Set max-retries = 2
Capacity Planning 802.11b only Limit devices per AP to maximum of 12
Default (no action)
Retail Wireless Networks Validated Reference Design | Solution Guide Defining WLAN Requirements for Retailers | 29

Mapping Inventory Worksheets to the Design ProcessEach of the worksheets presented in the requirements definition phase records information used in one or more of the design chapters later in this VRD. Most of these design steps cannot be completed without having this data available to the wireless designer.
Figure 2 Inventory Worksheets and the Design Process
The basic flow of this guide is shown in the diagram. The selection of a PCI Compliance Category drives which inventory worksheets need to be completed. Each worksheet links to specific aspects of the WLAN design, such as Logical and Physical Network Design, or RF Design. Once the WLAN design is complete, the program management team that is responsible for the deployment can assemble the processes and plans needed for successful rollout.
Ret
ail_
143
Table 3Facility
Inventory
Table 1ApplicationInventory
Table 2Client Device
Inventory
Table 6QoS Setting
Inventory
Table 5AuthenticationMode Matrix
Table 4Hardened
EnvironmentInventory
Chapter 5Logical & Physical
InfrastructureDesign
Chapter 6RF Design
Chapter 4RF SiteSurveys
PCIMonitoring
WirelessIDS
Overlay
Category #1
Category #2
Category #3Secure WLAN +Wireless IDS +PCI Monitoring
ChoosePCI Compliance
Category
Chapter 10Operations &Management
Design
Chapter 9DeploymentProcesses &Project Plan
Chapter 7WLAN
Authentication &Security Design
Chapter 8Voice & QoS
Design
30 | Defining WLAN Requirements for Retailers Retail Wireless Networks Validated Reference Design | Solution Guide

Retail Wireless Networks Validated Reference Design | Solution Guide
Chapter 4RF Site Surveys
With the retailer’s business and technical requirements identified, we can proceed to the RF Site Survey part of the Design Phase. This step presents two key challenges for a retailer. First, the traditional site survey methodology changes considerably when moving to a thin access point (AP) architecture. Second, retailers operate facilities that require specialized RF design, but have very limited operating and capital budgets to finance technology migrations. Labor and lift costs create a powerful financial incentive to try to reuse AP locations and cabling from the previous
generation of equipment. Sometimes this reuse is appropriate, but often it is not.
This chapter addresses both of these challenges. We begin by providing a clear understanding of how the site survey process changes with a controller-based WLAN architecture and the minimum site survey data that is needed for the Design Phase. Then we explain the technical and business tradeoffs involved in reusing pre-existing cable plants, and provide clear guidance on how to apply this knowledge to your organization. In Chapter 6, “RF Design” , we will use the information gathered by site surveys to complete a full RF design.
RF Site Survey ObjectivesWe begin by explaining the basic purpose of an RF site survey, and then we discuss the differences between traditional “coverage” surveys and newer “capacity” surveys.
Theoretical vs. Actual RF PropagationThe simple goal of an RF site survey is to accurately determine how many APs are required to provide a targeted minimum data rate in a given area. The survey also helps to identify where to place the APs to enable optimum performance. While this can be modeled in a virtual site survey, RF behavior is sometimes difficult to accurately predict. APs radiate RF energy in all directions, so the area covered by an AP using an omnidirectional antenna is a circle. The height of the vertical coverage pattern varies with the gain of the AP antenna. Lower gain antennas cover a taller vertical area and are used in buildings with higher ceilings.
Figure 3 Theoretical RF Propagation CharacteristicsR
etai
l_11
2
11 111
11
11 66
6
RF Site Surveys | 31

RF coverage in the actual world differs significantly from theoretical RF coverage, due to environmental conditions like obstructions and interference.
Figure 4 Realistic RF Propagation Characteristics
The purpose of a site survey is to provide a factual understanding of the RF propagation environment in a given facility to enable professional engineers to select optimal locations for the wireless APs. During the survey, factors such as which applications will be supported by the wireless network are also taken into consideration.
Coverage vs. CapacityFor most of the nearly 20 years that retailers have been deploying wireless technology, APs were very expensive. As a result, it was vital to get as much distance from each AP as possible to save money. This practice is called a “coverage” model, in which APs are spaced widely apart to provide maximum coverage from each one. In a coverage model, the average data rate delivered at ground level by the wireless network can be very low (on the order of 1-2 Mbps at the cell edges) because those rates travel the farthest. This model worked well in the past because older client devices required relatively low bandwidth for simple data applications.
Figure 5 Coverage and Capacity
Ret
ail_
122
1 6 11 1 6 11
1 6 11 1 6 11
1 611 1 611
1 6 11 1 6 11
1 611 1 611
Channel 1 Channel 6 Channel 11
Channel 11 Channel 1 Channel 6
Channel 1 Channel 6 Channel 11
Capacity Design with 54 Mbps Cell EdgeCoverage Design with 1 Mbps Cell Edge
32 | RF Site Surveys Retail Wireless Networks Validated Reference Design | Solution Guide

Today, much has changed. Retailers depend on voice handsets for low-cost communication inside their stores and distribution centers. They want to deliver wireless video streams to in-store displays and to backhaul IP-based security video to storage servers. The number of data-only devices has increased to support the array of applications listed in Chapter 3, “Defining WLAN Requirements for Retailers” . DOS-based terminal applications are giving way to both thin clients and thick clients running on full-featured Windows operating systems. These devices need a wireless network that can support large numbers of devices at much higher data rates than required in the past for simple scanner and data applications.
Controller-based WLAN systems, such as those offered by Aruba Networks, were designed to automate the management of large numbers of APs. By moving the intelligence into the controller, the APs become “thin” and are not required to be anything more than secure, network-attached radios. This reduces their cost and makes dense deployment possible. Whereas a coverage model might use one AP to serve 25,000-50,000 square feet and provide at best 1Mbps data rate, modern 802.11a/b/g/n thin APs typically serve smaller areas (2,500-10,000 square feet) and provide up to 300 Mbps data rates in each cell.
This model is known as a “capacity” or “dense” WLAN architecture model.
2.4 GHz vs. 5 GHzWhether you are using a coverage or capacity approach, the rules for AP spacing are different for 900 MHz, 2.4 GHz, and 5 GHz frequency radios. As the frequency increases, the coverage distance of a signal decreases, assuming the same output power. On average, for any given data rate, 2.4 GHz signals travel twice as far as 5 GHz signals. This means that many more APs are required in 5 GHz to provide a level of service comparable to that of a 2.4 GHz system.
This is particularly important for retail customers to understand because of the strong desire to reuse existing cable plant to reduce deployment cost. Many retailers’ wireless networks were designed using a coverage strategy for the 2.4 GHz frequency. In some cases, the 2.4 GHz APs are already reusing an RF plan developed for a previous generation of 900 MHz equipment. However, retailers today are extremely interested in 5 GHz for either 802.11a or 802.11n service. In spite of the higher density requirement, the 5 GHz spectrum has many more channels and generally less usage than the 2.4 GHz airspace, which is shared with Bluetooth headsets, frequency-hopping (FH) devices, APs in neighboring stores, and wireless hotspots for customers. By moving to 5 GHz, retailers will obtain a significant increase in the quality and reliability of voice and data communications in exchange for deploying a higher density of APs.
Retail Wireless Networks Validated Reference Design | Solution Guide RF Site Surveys | 33

Figure 6 Cell Radius Varies with Data Rate and Transmission Frequency
When more than one frequency band will be used, such as both 5 GHz and 2.4 GHz, retailers should make sure that each facility is RF planned for a 5 GHz AP density. In general, this means that each non-overlapping AP serves no more than 10,000 square feet. Cell overlap of 25-50% is strongly recommended to enhance roaming and RF redundancy, and is discussed in Chapter 6, “RF Design” . If the existing APs were designed with 5 GHz in mind, the existing AP locations may be suitable. This practice is not common, however. Attempting to deploy 802.11a/n at 5 GHz using an AP density for 2.4 GHz will not be successful.
In addition, higher frequencies have more difficulty penetrating walls, shelving, freezers, containers, and other typical obstructions in a retail setting. Denser product types reduce signal strength more than less dense products. For example, a palette of milk or butter will obstruct more signal than a palette of light bulbs. Therefore, in certain facility types it is still a best practice to perform traditional “active” RF testing to measure how far signals travel at the desired frequencies.
Ret
ail_
129
802.11b/g(2.4 GHz)
802.11a(5 GHz)
6 Mbps
9 Mbps
12 Mbps
18 Mbps
24 Mbps36 Mbps
48 Mbps54 Mbps
48 Mbps
36 Mbps
24 Mbps
18 Mbps
5.5 Mbps
2 Mbps
1 Mbps
54 Mbps
6
4 = SNR
8
10
12
16
2120
6SNR = 4
8
10
12
162021
34 | RF Site Surveys Retail Wireless Networks Validated Reference Design | Solution Guide

Site Survey Varieties”Site survey” is an umbrella term that means different things to different people. Consulting firms and wireless integrators that provide engineering services generally offer four different types of RF site surveys. This section addresses the following questions:
What kinds of surveys are there?
Which survey is right for me?
What process do I follow to perform a site survey?
What Kinds of Surveys are There?The following table describes the basic types of site surveys.
Table 7 Types of Site Surveys
Virtual Survey Passive Survey Active SurveySpectrum Clearing Survey
Description Uses customer-supplied building drawings in JPG, PDF, or DWG format to place APs.
Involves passive data collection of the ambient RF environment to validate coverage or identify interference.
Involves active testing of real APs throughout a facility (indoor or outdoor) to determine the actual AP coverage footprint and throughput levels.
Same as Active Survey, but also includes a spectrum analysis (using a portable or handheld spectrum analyzer) at each active test location to locate and measure interference sources.
Location Remote Onsite Onsite Onsite
Deliverables Marked-up JPG file indicating AP locations and controller location codes.
Site bill of materials
Heat maps of existing 2.4 GHz and 5 GHz RF environment.
Marked-up JPG file showing AP locations.
Summary narrative analysis.
Heat maps of test APs with actual measured coverage.
Marked-up JPG file showing AP locations.
Detailed data analysis.
Same as Active Survey but including 2.4 GHz and 5 GHz noise and interference sources, locations and duty cycles.
Cost Low Moderate High Highest
Retail Wireless Networks Validated Reference Design | Solution Guide RF Site Surveys | 35

Which Survey is Right for Me?Aruba recommends that retailers use the following decision tree to determine what site survey types are required for their facilities, and whether existing cable plant and AP locations are suitable for the performance requirements of the new Aruba network.
Figure 7 Site Survey Decision Tree
Ret
ail_
114
Is Facility Typeexperiencing RF trouble
reports?
Were currentRF Plan & AP Locations
designed for 5 GHz?
Is 5 GHzband required duringuseful life of network?
Reuse of APLocations maybe possible.
Conduct PassiveSurvey to validateexisting RF Plan
performance.
Existing AP Locationswill not meetrequirement.
Conduct SpectrumClearing Survey to
identify interferers andremediation plan.
Existing AP Locationswill not meetrequirement.
Complete VirtualSurvey of Facility Typefor 5 GHz using Aruba
Retail RF DesignBest Practices.
Yes
Yes
Yes
No
No
No
36 | RF Site Surveys Retail Wireless Networks Validated Reference Design | Solution Guide

What Process Do I Follow to Perform a Site Survey? Each of the four types of site surveys has its own process and equipment requirements. A general overview of each type follows.
Virtual Survey Methodology
Follow these steps to perform a virtual site survey:
1. Obtain a current electronic floor plan of the facility.
2. Use either Aruba RF Plan or AirWave Visual RF to automatically create suggested AP layouts in two dimensions using a handful of input variables.
3. Use the design rules presented in Chapter 6, “RF Design” to position APs appropriately for each facility type (an onsite visit to the facility is not required).
Figure 8 Indoor Virtual Surveys with Aruba RF Plan and AirWave VisualRF
Retail Wireless Networks Validated Reference Design | Solution Guide RF Site Surveys | 37

For outdoor deployments, you can use the Aruba Outdoor RF Coverage Planner, available through your Aruba systems engineer, to model antenna coverage in 3D space using integration with Google Earth. This planner supports the entire line of Aruba APs and antennas.
Figure 9 Outdoor Virtual Survey with Aruba Outdoor RF Coverage Planner
Passive Survey Methodology
The typical wireless passive survey methodology utilizes professional survey software utilities from companies such as AirMagnet and Ekahau to measure existing signal propagation within the designated coverage areas. Due to the many varieties of building structures, designs, and materials that can impact the RF signal, the survey tool will effectively capture the “actual” RF signals originating from the APs. Aruba recommends using passive surveys to confirm coverage after each facility is completed.
Figure 10 Passive Survey with Ekahau Site Survey Professional Version 4.4
38 | RF Site Surveys Retail Wireless Networks Validated Reference Design | Solution Guide

To perform a passive survey:
1. Obtain the current electronic floor plan of the facility.
2. Using the site survey software application, walk through the coverage area and sample the RF path every few feet.
3. Analyze the data to produce heat maps of the existing coverage and to look for sources of external interference.
4. Ensure that coverage exceeds the minimum targeted needs for the facility.
5. Have an experienced WLAN engineer assess the passive survey data to validate the choice of AP locations.
Active Survey Methodology
The purpose of an active AP survey is to use temporary test APs to help determine the best placement of the APs and the AP density necessary for a given building construction.
Follow these steps for each test area:
1. Obtain the current electronic floor plan of the facility, and mark the locations at which active tests are to be performed.
2. Install a Remote AP license on an Aruba test controller.
3. Provision an Aruba AP as a Remote AP in Backup forwarding mode. This will allow the AP to transmit test data without being connected to a controller.
4. Mount the AP to a portable tripod, speaker mount, or other stable platform.
5. Position the AP at a test location, connect it to a power source and ensure that it boots up.
6. Using a professional site survey application, complete a passive survey of the area immediately surrounding the test AP.
7. Repeat steps 5 and 6 for all identified test locations.
8. Have an experienced WLAN engineer analyze the active survey data to determine the proper AP density for the coverage area.
Retail Wireless Networks Validated Reference Design | Solution Guide RF Site Surveys | 39

Site survey software makes hundreds of RF measurements throughout each active test, which are then visualized by superimposing their values in color over the relevant facility map. The images below are sample heat maps at 2.4 GHz and 5 GHz generated with AirMagnet during a post-installation survey in the grocery store depicted in Figure 8 on page 37. In this case, five APs were set up in the locations shown in Figure 8. Because voice communications are being used, the customer requirement is for 48 Mbps cell edge data rate (equivalent to a signal-to-noise ratio [SNR] of 20 dBm or -65 dBm minimum signal strength in the 2.4 GHz and 5 GHz bands). Using a -65 dBm display filter, areas falling below this threshold will appear gray and areas that exceed it are in color. Because almost the entire floor is in color at 2.4 GHz, the survey shows that coverage meets the requirement in that band.
Figure 11 2.4 GHz Active Survey with AirMagnet Survey 6.0
40 | RF Site Surveys Retail Wireless Networks Validated Reference Design | Solution Guide

However, in the 5 GHz band, a gray area appears in the middle of the store, indicating that higher AP density is required. This is due in part to Free Space Path Loss (FSPL) which increases with frequency, so radio signals in the 5 GHz band travel approximately half as far as 2.4 GHz signals, at the same power level. In addition, this part of the grocery store contains freezers, which significantly attenuate the signal. This is an excellent example of how the AP density that is appropriate for 2.4 GHz is inappropriate for 5 GHz.
Figure 12 5 GHz Active Survey with AirMagnet Survey 6.0
Freezer section RSSIdoes not meet -67dBm requirement
in 5 GHz
Retail Wireless Networks Validated Reference Design | Solution Guide RF Site Surveys | 41

Spectrum Clearing Survey Methodology
By its very nature, the unlicensed 2.4 GHz and 5 GHz spectrum is shared by a multitude of devices creating interference for one another. This can result in poor 802.11 network performance. Common examples of such devices include APs in neighboring stores or warehouses, cordless phones, analog and digital video cameras, Bluetooth devices, and microwave ovens in break areas. When designing a wireless network, it is important to understand the overall RF environment typical of the facility type where the network will be deployed in order to mitigate any interference problems. Spectrum clearing refers to the use of a portable spectrum analyzer to discover and pinpoint interference sources prior to network deployment.
Figure 13 2.4 GHz Spectrum Analyzer Display
The spectrum clearing process involves the following steps:
1. Configure the spectrum analyzer to record peak, average, and maximum hold traces for both the 2.4 GHz and the 5 GHz bands. If supported, also enable a swept spectrogram for both bands. If the analyzer includes both omni and directional antennas, begin by using the omni antenna.
2. Walk a carefully planned route for each selected location looking for active devices (an active device is any electrical equipment that broadcasts or radiates in the same frequency bands as the proposed Aruba network).
3. If strong interfering signals are observed, pause in that location and record a spectrum trace for 60-90 seconds.
42 | RF Site Surveys Retail Wireless Networks Validated Reference Design | Solution Guide
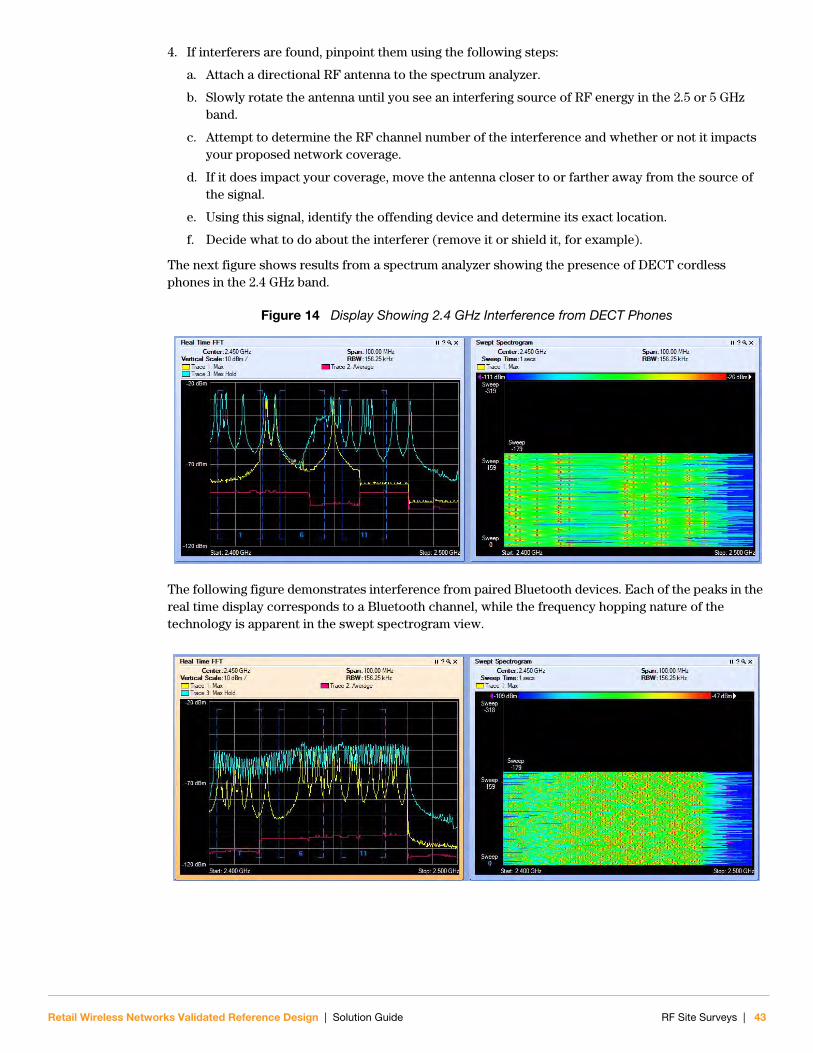
4. If interferers are found, pinpoint them using the following steps:
a. Attach a directional RF antenna to the spectrum analyzer.
b. Slowly rotate the antenna until you see an interfering source of RF energy in the 2.5 or 5 GHz band.
c. Attempt to determine the RF channel number of the interference and whether or not it impacts your proposed network coverage.
d. If it does impact your coverage, move the antenna closer to or farther away from the source of the signal.
e. Using this signal, identify the offending device and determine its exact location.
f. Decide what to do about the interferer (remove it or shield it, for example).
The next figure shows results from a spectrum analyzer showing the presence of DECT cordless phones in the 2.4 GHz band.
Figure 14 Display Showing 2.4 GHz Interference from DECT Phones
The following figure demonstrates interference from paired Bluetooth devices. Each of the peaks in the real time display corresponds to a Bluetooth channel, while the frequency hopping nature of the technology is apparent in the swept spectrogram view.
Retail Wireless Networks Validated Reference Design | Solution Guide RF Site Surveys | 43
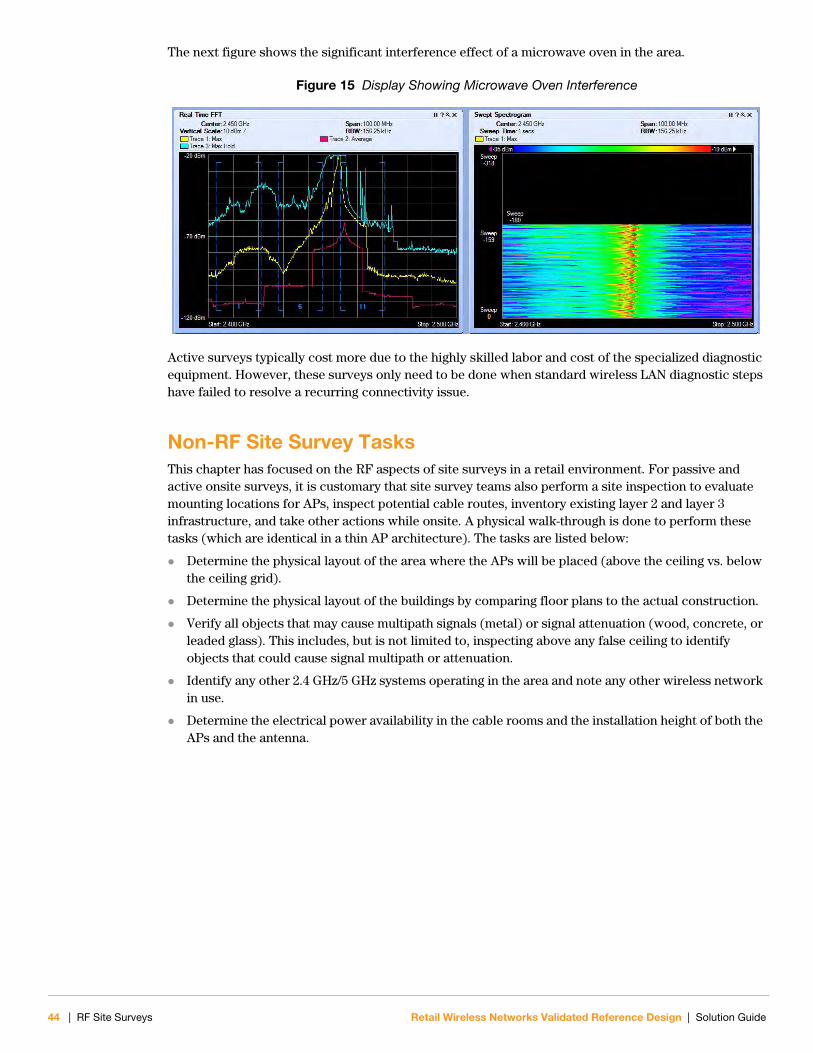
The next figure shows the significant interference effect of a microwave oven in the area.
Figure 15 Display Showing Microwave Oven Interference
Active surveys typically cost more due to the highly skilled labor and cost of the specialized diagnostic equipment. However, these surveys only need to be done when standard wireless LAN diagnostic steps have failed to resolve a recurring connectivity issue.
Non-RF Site Survey TasksThis chapter has focused on the RF aspects of site surveys in a retail environment. For passive and active onsite surveys, it is customary that site survey teams also perform a site inspection to evaluate mounting locations for APs, inspect potential cable routes, inventory existing layer 2 and layer 3 infrastructure, and take other actions while onsite. A physical walk-through is done to perform these tasks (which are identical in a thin AP architecture). The tasks are listed below:
Determine the physical layout of the area where the APs will be placed (above the ceiling vs. below the ceiling grid).
Determine the physical layout of the buildings by comparing floor plans to the actual construction.
Verify all objects that may cause multipath signals (metal) or signal attenuation (wood, concrete, or leaded glass). This includes, but is not limited to, inspecting above any false ceiling to identify objects that could cause signal multipath or attenuation.
Identify any other 2.4 GHz/5 GHz systems operating in the area and note any other wireless network in use.
Determine the electrical power availability in the cable rooms and the installation height of both the APs and the antenna.
44 | RF Site Surveys Retail Wireless Networks Validated Reference Design | Solution Guide
Retail Wireless Networks Validated Reference Design | Solution Guide
Chapter 5Physical and Logical Network Design
Aruba user-centric enterprise wireless networks are designed to support large numbers of users at large numbers of sites with mission-critical applications. To enable IT network architects to successfully plan deployments, Aruba has developed a WLAN Validated Reference Design that leverages the experience of several thousand customer deployments, peer review by Aruba engineers, and extensive laboratory performance testing. This reference design leverages and extends the familiar wired core/distribution/access model in order to deploy an Aruba WLAN
as an overlay.
A complete Aruba wireless VRD typically consists of four major design elements:
Logical and physical network design
RF design
Authentication and security design
Quality of Service (QoS) design
In this chapter, we discuss the first design element, logical and physical network design. This element encompasses the number and location of Aruba controllers, the layer 2 and layer 3 design for how access point (AP) tunnels traverse the network, the layer 2 and layer 3 design for the VLANs that are offered to various secure user roles, redundancy, and regulatory compliance for international networks.
The logical and physical network design has a significant impact on the choice of deployment methodology, staging and installation processes, and site validation methods. Aruba recommends the general architecture shown in this chapter as a best practice for retailers. It presents the optimal combination of cost savings, performance, and reliability.
Aruba WLAN Physical Architecture for RetailRetail organizations typically operate many remote sites that do not have a local IT staff. It is common for these locations to have private trusted or untrusted WAN connectivity to a central data center. There may or may not be WAN link diversity, depending on the facility type. Warehouses and distribution centers (DCs) often operate around the clock, seven days a week, and thus require high availability. Stores may employ varying redundancy solutions, depending on their size, geography, and whether a local in-store processor exists.
Physical ArchitectureThe diagram on the next page shows the physical architecture reference design that is recommended by Aruba and spans all major merchant environments:
Warehouse/distribution center
Large footprint store (controller present in store)
Small footprint store (Remote AP via wired WAN link)
Small footprint store (Remote AP via 3G wireless WAN link)
Physical and Logical Network Design | 45

Each type of branch office communicates to a corporate data center, as shown in Figure 16. The small stores without local controllers home to the DMZ.
Figure 16 Aruba WLAN Retail Physical Architecture
The key components of the retail physical architecture are:
Master Controllers. Two Aruba controllers located at the data center are configured to use master redundancy. Each controller has redundant gigabit Ethernet links into the data center distribution switches, and shares a Virtual Router Redundancy Protocol (VRRP) address.
Local Controllers. Local controllers are installed at each site that has more than four APs. In the distribution center or warehouse, two local controllers run in active-active redundancy, with two VRRP addresses shared between them. The large footprint store uses a single (non-redundant) local controller.
Access Points. Dual radio APs are densely deployed throughout the retail space, providing high bandwidth access across the 2.4 GHz and 5 GHz bands. Dense deployment uses a microcell architecture to cover an area using overlapping APs at relatively low transmit power. This design strategy enables Adaptive Radio Management (ARM) to detect and close coverage holes in the event of an AP failure by increasing power on neighboring APs. Smaller cells also help facilitate proper load balancing of voice over WLAN callers.
Air Monitors. Air monitoring functionality is available with a hybrid AP or with a dedicated air monitor (AM). A hybrid AP performs the functions of an AP and AM simultaneously. If dedicated
Ret
ail_
101
Airmonitor
Localactive
Localactive
Local 3 GWirelessRemote
AP
Private WAN(Trusted) Public WAN
(Untrusted)
3G Wireless Carrier(Untrusted)
Distribution Centeror Warehouse
(1+1 Redundancy)Small
FootprintStore
(Remote AP)
Small FootprintStore
Hybrid Mode(with ACLs)
Large Footprint Store(N:1 Redundancy)
Masterstandby
Data CenterDMZ for
Remote AP ControllersMasteractive
Firewall
Local active
Local active
POS
AirWaveWireless
ManagementSuite
File
RADIUSPBX
46 | Physical and Logical Network Design Retail Wireless Networks Validated Reference Design | Solution Guide

AMs are used, a ratio of one AM for every four APs deployed is recommended. AMs handle many of the IDS-related duties for the network, and will assist in drawing accurate heat maps displaying graphical RF data. Aruba considers dedicated AMs to be a security best practice because they provide full time surveillance of the air.
AirWave Wireless Management Suite. The AirWave console provides a single user interface that enables administrators, help desk staff, security analysts, and other IT staff to have full visibility into and control over the wireless network and users. For more information, see Chapter 10, “Operations and Management” .
Data Center
Because data centers are mission critical and support facilities that run three shifts, Aruba recommends deploying two master controllers that provide full 1+1 redundancy. Aruba recommends a master controller pair in an active-standby configuration in the data center. In the retail VRD, the master controllers do not terminate APs except under failover scenarios or unless remote APs are used for small footprint stores. These controllers are sized to provide N:1 redundancy for a selected number of store APs that are likely to need continuous service during scheduled maintenance windows of store controllers. The AirWave appliances are also located in the data center.
Warehouse/Distribution Center
In a warehouse or distribution center, Aruba recommends using two mobility controllers in a 1+1 redundancy configuration to assure full local redundancy. The controllers may be configured as either masters or locals depending on whether the retailer’s IT staff wishes to permit discrete configuration at the facility level.
Each AP and AM receives power from and can reach either controller through existing Power over Ethernet (PoE) switches. In the event of a controller failure, the APs and AMs will failover automatically to the surviving controller.
Large Footprint Store
For most large footprint stores, a single controller is sufficient to handle the APs and AMs. For these deployments, the data center manages wireless redundancy across the WAN instead of placing a redundant controller onsite. You should configure additional on-demand backup connectivity in the event of a primary WAN link failure.
This configuration provides N:1 redundancy, with the controllers in the data center protecting the controller located at the store. In the event of a store controller failure, the store APs and AMs connect directly to one of the controllers in the data center.
Small Footprint Store
Small footprint stores with four or fewer APs do not require a controller at the store. This is called the Remote AP configuration. In this configuration, the APs and AMs at the store communicate directly to one of the data center controllers over the private WAN. In the event of a WAN failure, APs configured for Bridge forwarding mode can continue to function normally and provide local bridging for in-store traffic until WAN service is restored. The Remote AP will continue to retry its connection to the data center. The Aruba remote AP license is required to enable this functionality.
Most retail facility types map into these architectures, with each customer adjusting details of redundancy and capacity to suit their specific business requirements.
Retail Wireless Networks Validated Reference Design | Solution Guide Physical and Logical Network Design | 47

Required EquipmentTo adapt the general physical design shown in Figure 16 for your organization, you must make a series of hardware selections. Aruba recommends that you work up from the AP level to the local controller and then to the master controller. Follow this decision tree as you work through the process.
Figure 17 Equipment Decision Tree
Ret
ail_
153
MultipleMasters
required?
SelectAP Model(s)
SelectAP Model(s)
SelectAP Model(s)
SelectExternalAntennaModel(s)
SelectExternalAntenna
(if required)
SizeAP Countwith VirtualRF Survey
SizeAP Countwith VirtualRF Survey
SizeAP Countwith VirtualRF Survey
Assign all Localsto separate
Master/Local clusters
MultiplyAP Countby Small
Store Count
SelectWarehouse/DC
Local Controllersequal to 150% ofAP Count (each)
SelectStore Local Controller
equal to 150% ofAP Count
TotalAP Counts and Local
Controller Countsserved by each Master
SelectMaster Controller Model
equal to 150% ofTotal APs & Locals
served by each Data Center
SelectAirwave Server Appliance
equal to 150% ofAll APs & Controllers
Multiply WarehouseCount by AP and Local
Controller Count =
Total APs & Locals
Multiply Large StoreCount by AP and Local
Controller Count =
Total APs & Locals
SelectRAP Local Controllersequal to 150% of Total
AP Count (each)
Warehouses/DCs(1+1 Redundancy)
Large Footprint Stores(N:1 Redundancy)
Small Footprint Stores(Remote AP)
48 | Physical and Logical Network Design Retail Wireless Networks Validated Reference Design | Solution Guide
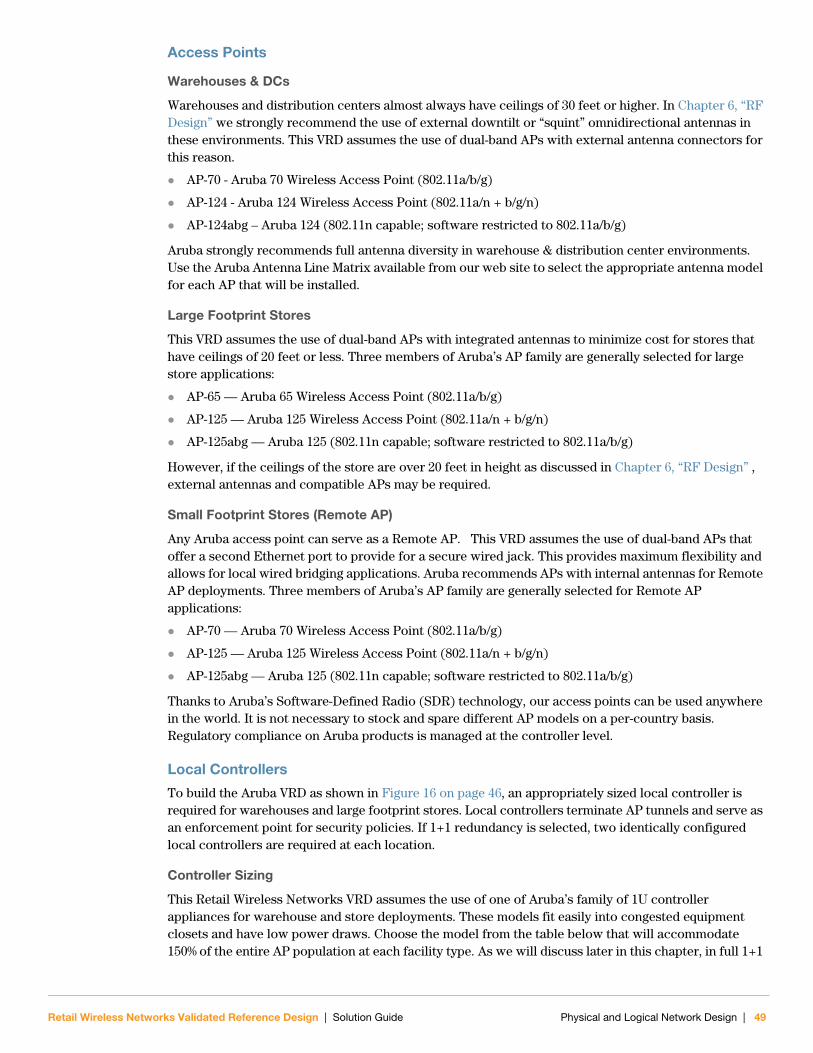
Access Points
Warehouses & DCs
Warehouses and distribution centers almost always have ceilings of 30 feet or higher. In Chapter 6, “RF Design” we strongly recommend the use of external downtilt or “squint” omnidirectional antennas in these environments. This VRD assumes the use of dual-band APs with external antenna connectors for this reason.
AP-70 - Aruba 70 Wireless Access Point (802.11a/b/g)
AP-124 - Aruba 124 Wireless Access Point (802.11a/n + b/g/n)
AP-124abg – Aruba 124 (802.11n capable; software restricted to 802.11a/b/g)
Aruba strongly recommends full antenna diversity in warehouse & distribution center environments. Use the Aruba Antenna Line Matrix available from our web site to select the appropriate antenna model for each AP that will be installed.
Large Footprint Stores
This VRD assumes the use of dual-band APs with integrated antennas to minimize cost for stores that have ceilings of 20 feet or less. Three members of Aruba’s AP family are generally selected for large store applications:
AP-65 — Aruba 65 Wireless Access Point (802.11a/b/g)
AP-125 — Aruba 125 Wireless Access Point (802.11a/n + b/g/n)
AP-125abg — Aruba 125 (802.11n capable; software restricted to 802.11a/b/g)
However, if the ceilings of the store are over 20 feet in height as discussed in Chapter 6, “RF Design” , external antennas and compatible APs may be required.
Small Footprint Stores (Remote AP)
Any Aruba access point can serve as a Remote AP. This VRD assumes the use of dual-band APs that offer a second Ethernet port to provide for a secure wired jack. This provides maximum flexibility and allows for local wired bridging applications. Aruba recommends APs with internal antennas for Remote AP deployments. Three members of Aruba’s AP family are generally selected for Remote AP applications:
AP-70 — Aruba 70 Wireless Access Point (802.11a/b/g)
AP-125 — Aruba 125 Wireless Access Point (802.11a/n + b/g/n)
AP-125abg — Aruba 125 (802.11n capable; software restricted to 802.11a/b/g)
Thanks to Aruba’s Software-Defined Radio (SDR) technology, our access points can be used anywhere in the world. It is not necessary to stock and spare different AP models on a per-country basis. Regulatory compliance on Aruba products is managed at the controller level.
Local Controllers
To build the Aruba VRD as shown in Figure 16 on page 46, an appropriately sized local controller is required for warehouses and large footprint stores. Local controllers terminate AP tunnels and serve as an enforcement point for security policies. If 1+1 redundancy is selected, two identically configured local controllers are required at each location.
Controller Sizing
This Retail Wireless Networks VRD assumes the use of one of Aruba’s family of 1U controller appliances for warehouse and store deployments. These models fit easily into congested equipment closets and have low power draws. Choose the model from the table below that will accommodate 150% of the entire AP population at each facility type. As we will discuss later in this chapter, in full 1+1
Retail Wireless Networks Validated Reference Design | Solution Guide Physical and Logical Network Design | 49

redundancy deployments, each controller must be capable of assuming the entire load of APs in the facility.
For customers that do not currently have PoE available, three of the models in the table include 802.3af PoE support. They are the MC-804 (4 ports), MC-800 (8 ports), and MC-2400 (24 PoE ports).
For large Remote AP deployments, the VRD assumes the use of either the SC-256-C2 or M3-series controller blade in an A6000-series chassis with redundant 400W power supplies. Two identically configured chassis are installed in the DMZ in a 1+1 redundancy model. Up to 4 M3 blades can be installed in a single chassis to serve even larger numbers of stores.
A quantity of the appropriate SFP and/or XFP modules may also be required; Aruba offers a complete line of modules on its price list.
International Regulatory Compliance
The United States and Israel restrict the Aruba controller to managing only APs that are located within those countries. When ordering Aruba controller SKUs, be careful to order the appropriate country SKU for the location where the controller will be installed. For additional information, see the Regulatory Compliance section later in this chapter or consult your Aruba representative.
Master Controllers
Master controllers offload network management, wireless IDS (WIDS), and RF decision making from the local controllers. This VRD assumes either the SC-256-C2 or M3-series controller blade in its 6000-series chassis with redundant 400W power supplies.
Table 8 Mobility Controller Product Line Matrix
Features MC-200MC-800
MC-2400MMC-3000 Series
MC-804 MC-800 MMC-3200 MMC-3400 MMC-3600
Max number of campus-connected APs per controller
6 4 16 48 32 64 128
Max number of Remote APs per controller
6 4 16 48 128 256 512
Max number of users per controller
100 256 255 768 512 1,024 2,048
MAC Addresses 4,096 4,096 4,096 4,096 64,000 64,00 64,000
Table 9 Controller Specifications
Features MMC-6000MMC-6000 Supervisor Card
SC-256-C2 M3
Max number of campus-connected APs per controller 2,048 256 512
Max number of Remote APs per controller 8,192 256 2,048
Max number of users per controller 32,768 4,096 8,192
MAC Addresses 256,000 64,000 64,000
50 | Physical and Logical Network Design Retail Wireless Networks Validated Reference Design | Solution Guide

Controller Sizing
The proper size of a master controller is determined by both the number of local controllers it manages as well as the number of APs managed by all of the downstream locals. Even though AP tunnels do not terminate on the Master, each AP transmits WIDS and RF telemetry directly to the Master. Aruba has thoroughly tested all of its controller models in a master role supporting various AP and local controller loads.
The local controller and AP limits from these tables can be combined in a matrix. Use the table below to select the appropriate controller model for your deployment. Use the same model for both the active master and the standby master.
Very large deployments that require multiple M3 blades should be divided into clusters of locals, each with its own Master. Use one M3 blade configured as the active master for each cluster, with a second M3 blade configured as a Standby Master. Up to four active masters or standby masters can be installed in a single A6000 chassis. Aruba does not recommend collocating active and standby masters in the same chassis.
Table 10 Maximum Number of Locals per Master Controller Model
Master Maximum Locals
M3 Blade 700
MMC-3600 500
Supervisor II Blade 450
MMC-3400 400
MMC-3200 250
Table 11 Maximum Number of APs and Users per Master Controller Model
Master Maximum APs Maximum Users
M3 Blade/MMC-3600 4,500 15,000
Supervisor II Blade 3,000 10,000
MMC-3400 2,250 7,500
MMC-3200 1,500 4,500
Table 12 Master Controller Sizing by AP Count
Store Count(Local Controller Count = Store Count)
50 100 150 250 400 500 700 1000
AP
s P
er S
tore
5 MMC-3200 MMC-3200 MMC-3200 MMC-3200 MMC-3400 MMC-3600 1xM3 2xM3
10 MMC-3200 MMC-3200 MMC-3200 MMC-3600 MMC-3600 2xM3 2xM3 3xM3
15 MMC-3200 MMC-3200 MMC-3400 MMC-3600 1xM3 2xM3 2xM3 4xM3
20 MMC-3200 MMC-3400 MMC-3600 2xM3 2xM3 3xM3 3xM3 5xM3
25 MMC-3200 MMC-3600 MMC-3600 2xM3 3xM3 3xM3 4xM3 6xM3
Retail Wireless Networks Validated Reference Design | Solution Guide Physical and Logical Network Design | 51

International Regulatory Compliance
Country code restrictions for Aruba chassis-based controllers are enforced at the chassis level, rather than the blade level. The available chassis SKUs are as follows (the blade remains the same):
6000-400-US — Aruba 6000 Base System, SPoE Power, US Restricted Regulatory Domain
6000-400-IL — Aruba 6000 Base System, SPoE Power, Israel Restricted Regulatory Domain
6000-400 — Aruba 6000 Base System, SPoE Power, Unrestricted Regulatory Domain
AirWave Appliance
AirWave offers two different hardware appliance models. They are sized based on the number of APs and controllers being managed. For large deployments, you purchase and deploy multiple AirWave appliances, and the software will automatically cluster the controllers together and distribute the processing workload appropriately. The SKUs are: AWMS-HW-ENT, AirWave Server Appliance for managing up to 2,500 devices AWMS-HW-PRO, AirWave Server Appliance for managing up to 1,000 devices
Required LicensesAruba offers a family of software licenses that run on its purpose-built, high-performance controllers. Both the master and local controllers must have the same types of licenses installed on them; however, the size of the licenses varies depending on the role played by the controller. Depending on the license, either AP count or user count may be used as a licensing metric. To ensure sufficient extra capacity at all times, Aruba recommends purchasing licenses equal to 150% of the applicable metric.
Warehouses and DCs
To build this Aruba VRD, the following licenses are required on each of the local controllers in a warehouse or DC, assuming that there are no more than 128 Aruba APs and 256 individual users being managed. For larger or smaller AP or user counts, simply purchase the appropriate license. Your Aruba representative can assist in selecting the proper license sizes.
LIC-128-AP Access Point License (128 APs)
LIC-WIP-128 Wireless Intrusion Protection Module License (128 AP Support)
LIC-PEF-256 Policy Enforcement Firewall Module License (256 Users)
For voice deployments, Aruba strongly recommends purchasing:
LIC-VOC-256 Voice Services Module License (256 Users)
Large Footprint Stores
Large footprint stores typically have many fewer access points and wireless client devices than at a warehouse. This VRD assumes a local controller licensed for 32 APs and 64 client devices. The following license SKUs may be adjusted upwards or downwards to better fit your specific facilities:
LIC-32-AP Access Point License (32 APs)
LIC-WIP-32 Wireless Intrusion Protection Module License (32 AP Support)
LIC-PEF-64 Policy Enforcement Firewall Module License (64 Users)
For voice deployments, Aruba strongly recommends purchasing:
LIC-VOC-64 Voice Services Module License (64 Users)
N O T E
All controllers in a Master/Local cluster must run the same version of software.
52 | Physical and Logical Network Design Retail Wireless Networks Validated Reference Design | Solution Guide

Small Footprint Stores (Remote AP)
Small footprint stores with fewer than 4 APs do not require a local controller. Instead, the AP tunnels cross an untrusted WAN and terminate on large local controllers located in the retailer’s DMZ. In the VRD, we assume two locals are deployed in an active/active redundancy configuration similar to the warehouse design. Both local controllers must have Remote AP licenses to provide IPSec encryption and split-tunnel features.
Each DMZ local controller requires the following licenses, assuming 512 Aruba Remote APs being managed, with an M3-series controller acting as a backup to a second M3 blade:
LIC-512-RAP Remote Access Point License (512 Remote APs)
LIC-WIP-512 Wireless Intrusion Protection Module License (512 AP Support)
LIC-PEF-1024 Policy Enforcement Firewall Module License (1024 Users)
The DMZ local controllers do not require AP licenses if they are only terminating Remote APs. The ratio of PEF users to Remote APs is 2:1 and is determined by the number of devices accessing the network through each Remote AP.
Each Remote AP terminating on a DMZ local counts as one (1) Remote AP License, while each SSID on each radio plus each wired port in use counts as one (1) tunnel against the total Concurrent Tunnel capacity of the local controller. Concurrent Tunnel capacity is indicated on the datasheet for each Aruba controller.
Master Controllers in Data Center
Both the Active and Standby Master Controllers require the same licensed modules that are installed on the Local Controllers they manage. However, the size of these licenses depends on whether the masters will ever terminate APs.
Deployments utilizing 1+1 redundancy between collocated local controllers using the active/active method will never terminate APs on the master controllers. Remote AP deployments with DMZ-based locals, and warehouse/DC or large store environments are good examples. In this case, choose the smallest available license size for each module on the master. This is true even for M3-series blades managing large numbers of local controllers. The following license example assumes that the masters are not acting as a backup for any local controller:
LIC-WIP-8 Wireless Intrusion Protection Module License (8 AP Support)
LIC-PEF-64 Policy Enforcement Firewall Module License (64 Users)
LIC-16-AP Access Point License (16 Access Points)
LIC-1-RAP Remote Access Point License (1 Remote Access Point)
If the N:1 redundancy method is used, the Active Master Controller will periodically terminate APs. This can occur during change windows when local controller maintenance is performed, or in an outage situation. In this case, the size of the licenses on the master controllers should be 150% of the largest number of APs that will ever be expected to fail to the master simultaneously, or the largest license supported on that model, whichever is less.
N O T E
A single MMC-6000 chassis in the DMZ can support four M3-series blades for a total of 2,048 Remote APs.
Retail Wireless Networks Validated Reference Design | Solution Guide Physical and Logical Network Design | 53

AirWave Appliance
The AirWave Wireless Management Suite is licensed using the same sizing criteria as the hardware appliance:
AWMS-ENT, AirWave Wireless Management Suite Software for a single server with no limit on processor cores. Recommended for managing up to 2500 devices such as controllers, wireless access points, switches, and so on.
AWMS-PRO, AirWave Wireless Management Suite Software for a single server with up to four processor cores. Recommended for managing up to 1000 devices such as controllers, wireless access points, or switches.
Both SKUs include the full selection of AirWave modules, including the AirWave Management Platform (AMP), Visualization and mapping software module (Visual RF), and RAPIDS (Rogue detection software).
Regulatory Compliance for International DeploymentsThis section provides guidance on how to design international Aruba deployments that meet each country’s wireless spectrum regulatory rules. In addition, certain Aruba controller models are prohibited from being shipped to or operated in other countries.
Access Point Compliance
All Aruba APs must be assigned proper country codes to comply with local regulatory requirements. AP radios must comply with specific limits on channel use and transmit power established by regulatory bodies in the countries where they are installed. This requirement is accomplished through the AP Group feature. Each Aruba AP is assigned to one AP Group. The AP Group is assigned a country code that determines the regulatory rules applied to the AP radio, including the 802.11 wireless transmission spectrum. Most countries impose penalties and sanctions for operators of wireless networks with devices set to improper transmission spectrums.
Aruba uses Software-Defined Radio (SDR) technology that enables you to use any access point model in any country that has granted approval. Aruba APs are approved for operations in more than 100 countries. There is no need to keep different AP models for different countries because the country code can be changed as needed and is enforced by the Aruba controller.
54 | Physical and Logical Network Design Retail Wireless Networks Validated Reference Design | Solution Guide

Controller Compliance
When ordering an Aruba controller, customers specify a geographic region: United States, Israel, or Rest of World (ROW).
Aruba controllers sold in the United States or Israel are physically restricted from managing APs in other regulatory domains; administrators cannot assign another regulatory domain to the APs that terminate at these controllers. However, a ROW controller can properly manage APs from any unrestricted country and enforce the correct regulatory radio rules.
For example, a US-based controller may not terminate or manage APs based in Canada or Mexico, nor can it failover using VRRP to a non-US controller. But a ROW controller may failover to an identically configured ROW controller for redundancy purposes.
Figure 18 United States controllers cannot manage Remote APs in other countries
arun_071
Italy_AP_group
Spain_AP_group
FRG_AP_group
UK_AP_group
France_AP_group
ROWcontroller
Rest-Of-World controllermanaging APs in
multiple regional domains
USAcontroller
Region-specific country code
Retail Wireless Networks Validated Reference Design | Solution Guide Physical and Logical Network Design | 55

A single Aruba ROW controller can manage APs in France, Germany, Italy, and Spain as long as the APs in each country are properly assigned to separate AP Groups. Each AP Group must be assigned an RF Management Profile with the correct country code corresponding to the physical location of the APs.
Figure 19 Rest of World (ROW) controller
Recommendations for International Deployments
Use this checklist to make sure that your Aruba design complies with the host country laws and regulations:
1. Review all controllers participating in VRRP clusters to verify that all models have identical country SKUs.
2. Review all APs terminating on US-based controllers and make sure that they are all in the US.
3. Review all APs terminating on Israel-based controllers and make sure that they are all in Israel.
4. Make lists of all APs by country to create Regulatory Domain profiles.
5. Purchase any additional controllers necessary to achieve regulatory compliance.
arun_070
Italy_AP_group
Spain_AP_group
FRG_AP_group
UK_AP_group
France_AP_group
ROWcontroller
Rest-Of-World controllermanaging APs in
multiple regional domains
56 | Physical and Logical Network Design Retail Wireless Networks Validated Reference Design | Solution Guide

Aruba WLAN Logical Architecture for RetailThis section describes the validated reference logical architecture for a distributed Aruba wireless LAN for merchants with hundreds or thousands of sites. As with the physical architecture, each type of facility communicates to a corporate data center. However, due to the significant differences in the designs for warehouses, large footprint stores, and small footprint stores, we will consider the logical designs for each separately.
Aruba’s Overlay ArchitectureA reference wired network architecture that defines “core,” “distribution,” and “access” elements has become well established among IT network professionals. These elements form the building blocks of large scale, highly-available networks. Vendor validation of their products against this conceptual reference architecture provides IT organizations with assurance that products will perform and interoperate as expected.
From a logical perspective, the Aruba Retail Wireless Networks VRD introduces three new layers that overlay on to the familiar core/distribution/access framework:
Management. The management layer provides a distributed control plane for the Aruba WLAN that spans the physical geography of the wired network. It consists of redundant master controllers and the AirWave system. Critical functions provided by the management layer controllers include layer 3 client mobility across Aggregation layer controllers, and failover redundancy. Typically, larger networks, such as campus systems, also offload ARM and IDS processing from the aggregation layer to the management layer.
Aggregation. The aggregation layer is the interconnect point where wireless traffic is aggregated and enters or exits the wired network. It consists of local controllers using 1+1 or N:1 redundancy. Secure encrypted generic route encapsulation (GRE) tunnels from APs at the network access layer terminate on controllers at the aggregation layer. This provides a logical point for enforcement of roles and policies, and is where the ArubaOS implements PCI compliance with respect to firewall segmentation and role-based access control. Aggregation layer controllers allow user traffic to stay close to associated servers; there is no need to tunnel user traffic all the way to the management layer.
Network Access. The network access layer consists of APs: single or dual-band, 802.11a/b/g or n, indoor or outdoor. You can connect them using wired switch ports, secure mesh, or Remote AP.
The management, aggregation, and network access layers overlay the core, distribution, and access infrastructure in a seamless, secure, and high-performance manner. Figure 20 on page 58 shows the management, aggregation, and network access logical architecture for a warehouse or distribution center.
Retail Wireless Networks Validated Reference Design | Solution Guide Physical and Logical Network Design | 57

Warehouse/Distribution Center Logical Design
The following diagram shows the logical architecture for a warehouse or distribution center for normal operation.
Figure 20 Aruba WLAN Logical Architecture (Warehouse/Distribution Center)
The diagram shows several APs in the network access layer connected by GRE tunnels to redundant Active local controllers in the aggregation layer. The dedicated air monitor continuously scans all of the legal channels within its regulatory domain and coordinates channel and power settings on all APs through the mobility controller.
The controllers in the aggregation layer communicate control messages through tunnels to an active/standby master controller pair in the management plane. 802.1x authentication, logging, DHCP/DNS service, and management console operation are also provided in the data center. Redundancy design for warehouses is discussed later in this section.
Ret
ail_
107
Air Monitor
Control
Data
Localactive
Localactive
Masterstandby
Data Center
MasteractiveManagement
Aggregation
NetworkAccess
Distribution Center or Warehouse
AirWave WirelessManagement Suite POS
File
RADIUSPBX
58 | Physical and Logical Network Design Retail Wireless Networks Validated Reference Design | Solution Guide

Large Footprint Store Logical Design
The following diagram shows the logical architecture for a large footprint store for normal operation and in an outage condition.
Figure 21 Aruba WLAN Logical Architecture (Large Footprint Store)
During normal operation, the AP tunnels terminate on the Active local controller in the store, while AMs transmit RF and WIDS telemetry data directly to the active master in the data center. The active local controller securely exchanges control information with the active master controller in the data center as necessary.
The N:1 redundancy model is most cost-effective for large stores. If the store local controller fails, the APs are configured to automatically build new tunnels directly to the active master in the data center, as shown at the right side of the network access layer in the diagram. After the store local controller comes back online, the APs can revert to it automatically using VRRP pre-emption. In this case, tunneling operation resumes as shown at the left side of the network access layer.
Ret
ail_
104
Masterstandby
Data Center
Masteractive
Con
trol
Data
Data
Large Footprint StoreNormal Operation
Local Local
Large Footprint StoreController Outage
ARM
+ WIP Telem
etry
ARM
+ WIP Telem
etry
Management
Aggregation
NetworkAccess
Retail Wireless Networks Validated Reference Design | Solution Guide Physical and Logical Network Design | 59

Small Footprint Store Logical Design
The following diagram shows the logical architecture for a small footprint store for normal operation and in an outage condition. This is a remote AP configuration, because the APs at the remote location do not connect to an onsite controller. Remote AP solutions involve configuring a standard thin AP to provide a customer-defined level of service to the user by tunneling securely back to the DMZ in the data center over a WAN. The WAN can be either be a private network such as a frame relay or Multi Protocol Label Switching (MPLS) network, a public network such as a commercial broadband Internet service, or public “third generation” (3G) wireless broadband service.
Figure 22 Aruba WLAN Logical Architecture (Small Footprint Store)
As shown in the diagram, the aggregation layer is now located at the DMZ instead of at the store location. This is because in a small footprint store there are no controllers at the store locations, so the APs in the network access layer tunnel directly to the active local controller in the DMZ.
Ret
ail_
105
AirWave WirelessManagement Suite
Control
Localactive
Localactive
Masterstandby
Data Center
Masteractive
Retrying
Small Footprint Store (Remote AP)Normal Operation
Small Footprint Store (Remote AP)WAN Link Failure
Data
NetworkAccess
Aggregation
DMZ
Management
??
60 | Physical and Logical Network Design Retail Wireless Networks Validated Reference Design | Solution Guide

If the WAN connection is lost, the AP/AMs constantly attempt to rebuild the connection without interrupting local WLAN connectivity.
Data Center Logical Design
How the controllers are deployed depends on a number of factors, principally, identifying the destination of user traffic. In most retailer applications, master controllers reside in the data center and local controllers are located at the branch offices.
In an Aruba network employing a master/local design (such as shown in Figure 23), all configuration is performed on the master, and then pushed down to the locals. All user troubleshooting, RF planning, and real-time RF visualization take place on the master or in AirWave. The master also controls ARM decisions for all local controllers and is responsible for radio power and channel settings at the network access layer.
Figure 23 Aruba Master/Local Design
The master is also responsible for processing wireless intrusion detection system events and presenting the event and the corresponding wireless vulnerability and exploit (WVE) identifier. The master is also responsible for handling location services correlation algorithms that compute the position of clients as well as rogue APs using signal strength measurements from APs in the network.
If the master becomes unreachable, the network will continue to operate as expected, but without the ability to perform operations such as configuration, heat map analysis, or location services, until connection to the master controller is restored.
AirWave WirelessManagement Suite
Masterstandby
Data Center
Masteractive
WebFile
RADIUSPBX
Ret
ail_
154
_120
RA
P Ly
nn
N O T E
Unless Remote APs are in use, APs should never terminate on the master controller during normal operation; they should only terminate on local controllers.
N O T E
While the master controller is needed to perform configuration and reporting, it is not a single point of failure in the network.
Retail Wireless Networks Validated Reference Design | Solution Guide Physical and Logical Network Design | 61

Remote AP Deployment Considerations
Remote AP Forwarding Modes
APs can be configured for the following functionality:
Tunnel. The Remote AP is set up to forward all traffic to the DMZ controller within an IPSec tunnel. All traffic is encrypted and decrypted at the controller and user-based firewall roles are enforced at the DMZ.
Split Tunnel. When the AP is configured to perform split tunneling, the AP performs decryption of wireless traffic and bridges traffic locally when it is bound for a non-corporate address, and re-encrypts the session using IPSec from the remote AP to the controller. The Internet connection is protected with the same stateful firewall available on the mobility controllers to protect the user from inbound traffic.
Ret
ail_
155
VoiceSSID
CorporateSSID
CorporateSSID
VoiceSSID
GuestSSID
Remote Location
Firewall /NAT-T
Internet
Websites
IPSecTunnel
Corporate HQ
Remote AP(no firewall)
Websites
Internet Traffic
Remote AP(with firewall)
Ret
ail_
156
VoiceSSID
CorporateSSID
CorporateSSID
VoiceSSID
GuestSSID
Remote Location
Firewall /NAT-T
Internet
Websites
Internet Traffic(Split Tunnel)
IPSecTunnel
Corporate HQIPSec/AES-CCM Encrypted Control Channel
62 | Physical and Logical Network Design Retail Wireless Networks Validated Reference Design | Solution Guide

Direct Bridge. All WLAN traffic is locally bridged at the AP to allow access to local devices on the LAN, such as printers and local servers. This functionality allows continued service to users at branch offices in the absence of connectivity to the data center.
Remote AP Operating Modes
Each SSID on a remote AP has both a forwarding mode and an operating mode. The operating mode governs AP availability when the controller is not reachable, with a corresponding impact on the authentication types supported. For tunnel and split-tunnel mode, the standard operating mode applies. For bridge mode, the network engineer has a selection of three different operating modes from which to choose. These are summarized in the following table.
Ret
ail_
142
arun_096
CorporateSSID(PSK)
Firewall /NAT-T
Internet
Corporate HQ
VoiceSSID(PSK)
Remote Location
IPSec/AES-CCM Encrypted Control Channel
Remote AP(Bridge Mode)
LocalServer
LocalPBX
LocalPrinter
Standard Persistent Backup Always
Description Classic Aruba thin AP operation
Provides SSID continuity during temporary controller outages
Provides a backup SSID for local access only when controller is unreachable
Provides an SSID that is always available for local access
Available Forwarding Modes
Tunnel Split-Tunnel Bridge Mode
Bridge Mode Bridge Mode Bridge Mode
ESSID Availability Up only when controller is reachable
Must reach controller to come up; stays up if connectivity is temporarily disrupted.
Up only when controller cannot be reached
Always up when the AP is up, regardless of controller accessibility.
Authentication Modes Supported
802.1x supported 802.1x supported PSK ESSID only PSK ESSID only
SSID Configuration Obtained from controller Obtained from controller Stored in AP flash memory
Stored in AP flash memory
Retail Wireless Networks Validated Reference Design | Solution Guide Physical and Logical Network Design | 63
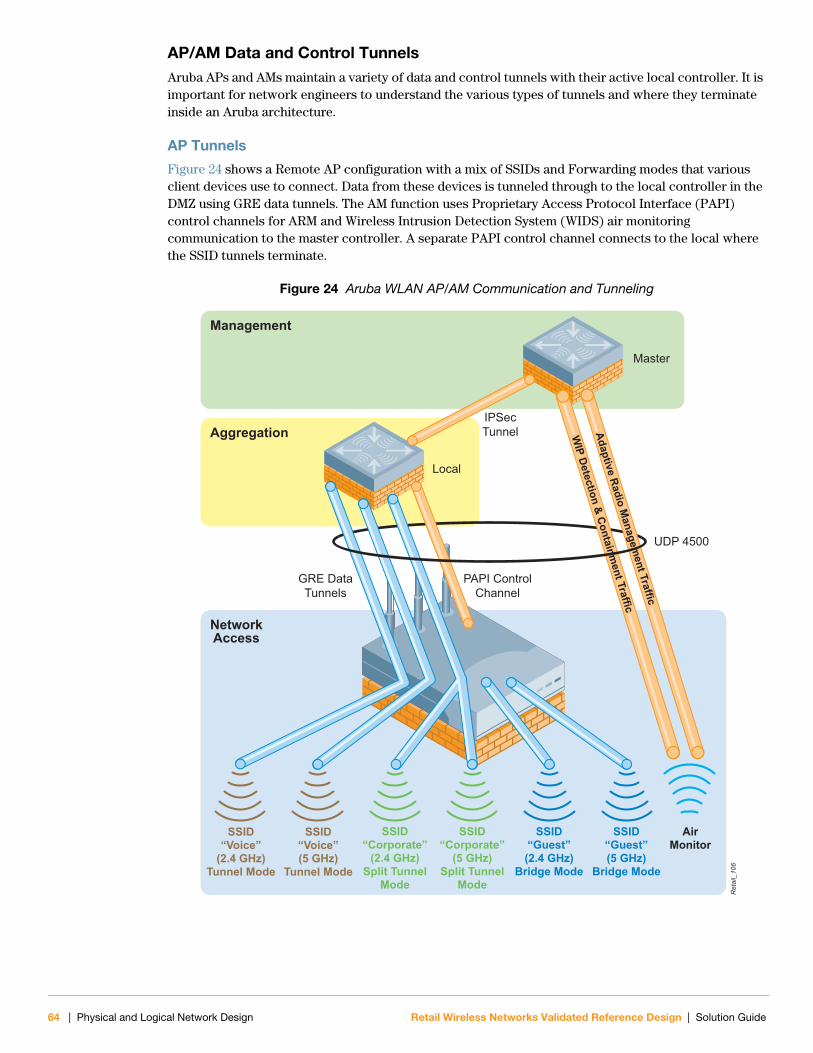
AP/AM Data and Control TunnelsAruba APs and AMs maintain a variety of data and control tunnels with their active local controller. It is important for network engineers to understand the various types of tunnels and where they terminate inside an Aruba architecture.
AP Tunnels
Figure 24 shows a Remote AP configuration with a mix of SSIDs and Forwarding modes that various client devices use to connect. Data from these devices is tunneled through to the local controller in the DMZ using GRE data tunnels. The AM function uses Proprietary Access Protocol Interface (PAPI) control channels for ARM and Wireless Intrusion Detection System (WIDS) air monitoring communication to the master controller. A separate PAPI control channel connects to the local where the SSID tunnels terminate.
Figure 24 Aruba WLAN AP/AM Communication and Tunneling
Ret
ail_
106
Master
Local
GRE DataTunnels
PAPI ControlChannel
UDP 4500
IPSecTunnel
SSID“Corporate”
(2.4 GHz)Split Tunnel
Mode
SSID“Corporate”
(5 GHz)Split Tunnel
Mode
SSID“Voice”
(2.4 GHz)Tunnel Mode
SSID“Voice”(5 GHz)
Tunnel Mode
SSID“Guest”(2.4 GHz)
Bridge Mode
SSID“Guest”(5 GHz)
Bridge Mode
AirMonitor
WIP Detection & Containm
ent Traffic
Adaptive Radio Managem
ent Traffic
Management
NetworkAccess
Aggregation
64 | Physical and Logical Network Design Retail Wireless Networks Validated Reference Design | Solution Guide

The number of tunnels that the AP constructs depends on the forwarding mode on each SSID.
Tunnel mode: One GRE tunnel per SSID per radio
Split-Tunnel mode: All Split-Tunnel SSIDs are multiplexed onto a single GRE tunnel after the decrypt/encrypt process
Bridge mode: No GRE tunnel. PAPI control channel only.
Each GRE tunnel and each PAPI control channel has a separate heartbeat mechanism used to assess the health of the AP connection. The control overhead is approximately 1 Kbps per tunnel/channel. Be sure to factor this in when planning for Remote AP deployments over slow speed or high-latency links.
AM Tunnels
APs are typically deployed in a “hybrid” configuration where they perform AM services in addition to serving clients. For increased security, dedicated air monitors are recommended as a best practice. Remote AP deployments with only one Remote AP at each location must use hybrid mode.
In either case, the air monitor process running on the AP constructs two PAPI control tunnels directly back to the Active master controller. One control tunnel is used for telemetry used by the Aruba ARM system to select the clearest radio channel for each AP. The second PAPI tunnel transmits information used by the Aruba WIDS to guard against wireless threats.
Redundancy
Master Controller Redundancy
To achieve high availability of the master controller, use the master redundancy method. In this scenario, two controllers are used at the management layer, with one controller configured as an active master and one configured as a standby master, as shown in the following figure.
Figure 25 Master Controller Redundancy
The two controllers will synchronize databases and RF planning diagrams, and will run a VRRP instance between them accessed by a Virtual IP (VIP) address. This is the address given to APs attempting to discover a mobility controller, and is the address used for network administration.
One mobility controller is always the active master controller, and the other one is always the standby master controller. Users managing the system will always log into the active master. Enabling preemption is not recommended on this setup. This configuration is known as “active-standby” redundancy.
N O T E
Split-Tunnel and Bridge mode are only available for Remote APs. All campus-connected APs with onsite local controllers use Tunnel mode.
Ret
ail_
043
StandbyMaster
VRRPKeepalives
Periodic DatabaseSynchronizationGRE
ActiveMaster
PAPI Keepalives
Retail Wireless Networks Validated Reference Design | Solution Guide Physical and Logical Network Design | 65

In the Aruba VRD, the recommended network attachment method is to have each controller configured in a full mesh with redundant links to separate data center distribution switches.
Local Controller Redundancy
Local controllers at the aggregation layer also use VRRP instances for redundancy, but in a different model than the master controllers at the management layer. In this case, the controllers operate in “active-active” redundancy as shown in the previous diagram.
Figure 26 Active-Active Redundancy (Normal Operation)
Using this model, two local controllers terminate APs on two separate VRRP virtual IP (VIP) addresses. Each mobility controller is the active local controller for one VIP address and the standby local controller for the other VIP address. The controllers each terminate 50% of their AP load. The APs are configured in two different AP groups, each with a different VIP as the LMS IP address.
N O T E
A standby master cannot be used to terminate GRE tunnels from APs. If an active master fails, the standby will assume its current load.
Ret
ail_
044
Air monitor
Keepalives
Active VIPStandby VIP
Local
Active VIPStandby VIP
Local
66 | Physical and Logical Network Design Retail Wireless Networks Validated Reference Design | Solution Guide
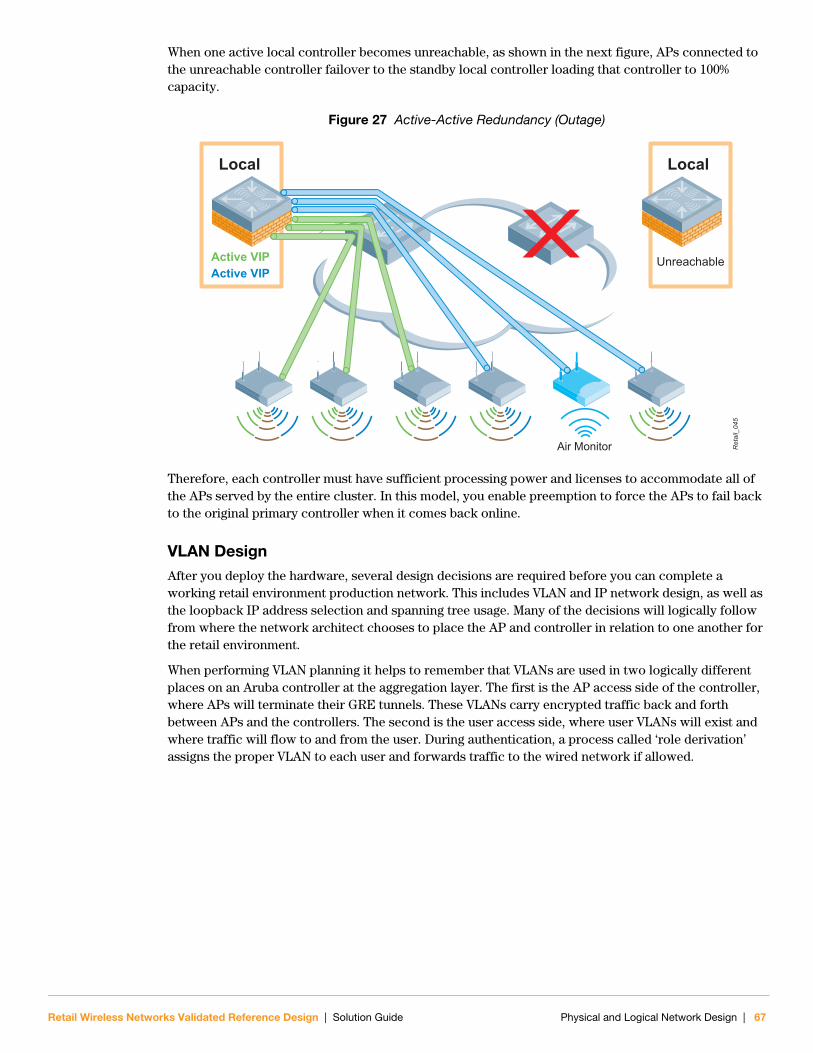
When one active local controller becomes unreachable, as shown in the next figure, APs connected to the unreachable controller failover to the standby local controller loading that controller to 100% capacity.
Figure 27 Active-Active Redundancy (Outage)
Therefore, each controller must have sufficient processing power and licenses to accommodate all of the APs served by the entire cluster. In this model, you enable preemption to force the APs to fail back to the original primary controller when it comes back online.
VLAN DesignAfter you deploy the hardware, several design decisions are required before you can complete a working retail environment production network. This includes VLAN and IP network design, as well as the loopback IP address selection and spanning tree usage. Many of the decisions will logically follow from where the network architect chooses to place the AP and controller in relation to one another for the retail environment.
When performing VLAN planning it helps to remember that VLANs are used in two logically different places on an Aruba controller at the aggregation layer. The first is the AP access side of the controller, where APs will terminate their GRE tunnels. These VLANs carry encrypted traffic back and forth between APs and the controllers. The second is the user access side, where user VLANs will exist and where traffic will flow to and from the user. During authentication, a process called ‘role derivation’ assigns the proper VLAN to each user and forwards traffic to the wired network if allowed.
Ret
ail_
045
Air Monitor
Local
Active VIPActive VIP
Local
Unreachable
Retail Wireless Networks Validated Reference Design | Solution Guide Physical and Logical Network Design | 67
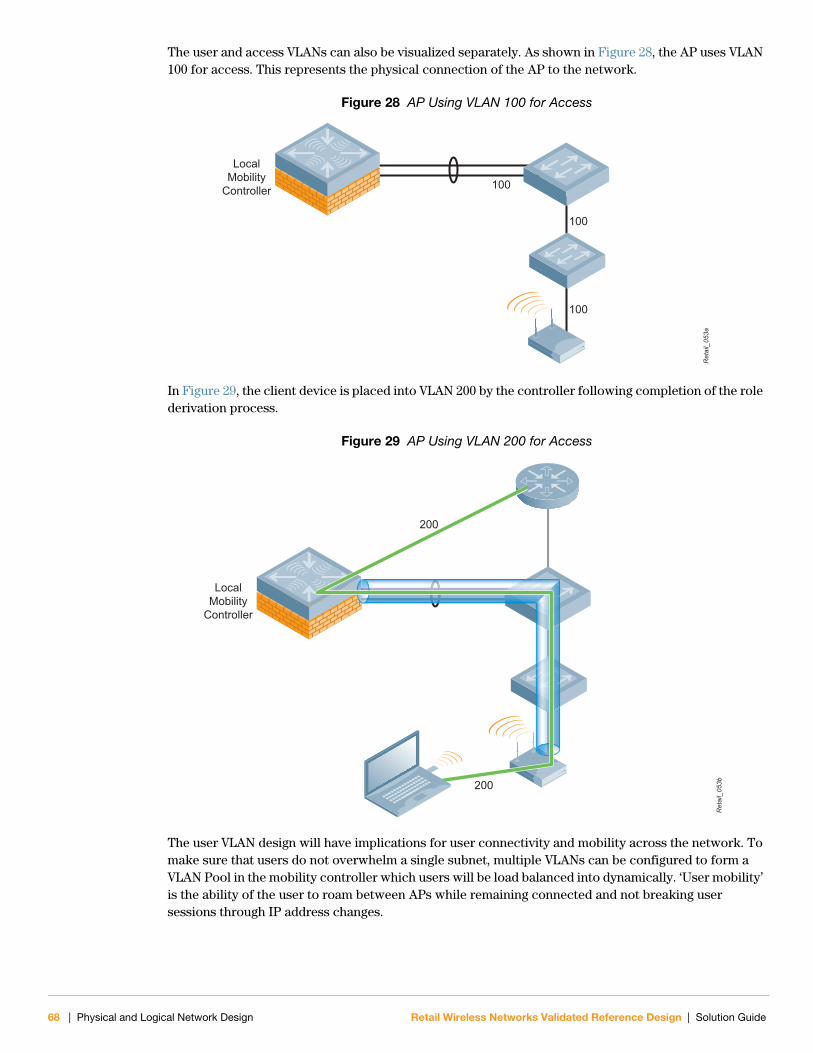
The user and access VLANs can also be visualized separately. As shown in Figure 28, the AP uses VLAN 100 for access. This represents the physical connection of the AP to the network.
Figure 28 AP Using VLAN 100 for Access
In Figure 29, the client device is placed into VLAN 200 by the controller following completion of the role derivation process.
Figure 29 AP Using VLAN 200 for Access
The user VLAN design will have implications for user connectivity and mobility across the network. To make sure that users do not overwhelm a single subnet, multiple VLANs can be configured to form a VLAN Pool in the mobility controller which users will be load balanced into dynamically. ‘User mobility’ is the ability of the user to roam between APs while remaining connected and not breaking user sessions through IP address changes.
Ret
ail_
053a
LocalMobility
Controller
100
100
100
Ret
ail_
053b
LocalMobility
Controller
200
200
68 | Physical and Logical Network Design Retail Wireless Networks Validated Reference Design | Solution Guide

Do Not Make Aruba the Default RouterThe mobility controller is a layer 3 switch that does not run routing protocols and should not be the default router for the VLANs on the network. The existing routers should remain the default gateways, with the mobility controller as a layer 2 switched solution extending from the distribution layer.
Do Not Use Special VLANsThe use of special VLANs created specifically for AP deployment is not necessary or recommended. No user traffic can enter the wired network except through the controller on which it terminates and only after undergoing deep-packet inspection by the ArubaOS stateful firewall. As a result, there is no security risk to the network by putting APs on existing VLANs. In addition, for the WIDS to operate properly, the air monitors need to see both the wireless and wired side of the network to properly classify rogue APs. When placed on isolated AP VLANs, the WIDS system cannot correlate wired and wireless traffic. It will not be able to definitively classify rogue APs, nor will it be able to automatically contain them.
Retail Wireless Networks Validated Reference Design | Solution Guide Physical and Logical Network Design | 69

70 | Physical and Logical Network Design Retail Wireless Networks Validated Reference Design | Solution Guide

Retail Wireless Networks Validated Reference Design | Solution Guide
Chapter 6RF Design
Properly designed Radio Frequency (RF) coverage is one of the most critical success factors in a wireless deployment. Many merchants report inconsistent performance of their thick access point (AP) based wireless systems, despite considerable investments in manual site surveys and powerful antennas. While it is very true that retail facilities present special RF challenges, excellent performance can be achieved by combining proper RF design with thin APs that are managed by wireless controllers as an integrated system.
This chapter brings together scientific knowledge and practical deployment experience to enable retail customers to design a high performance WLAN for any type of facility. Having designed and installed numerous WLANs for retail organizations, Aruba Networks has significant experience with RF coverage strategies. In this chapter, we explain why traditional RF designs sometimes underperform in relation to expectations, and we present a novel design strategy that yields consistently better results.
RF Challenges in RetailDesigning and deploying a WLAN in retail stores, warehouses, and distribution centers requires the wireless designer to address the following types of challenges:
Cost of conducting manual site surveys for every one of a retailer’s locations is often prohibitive
Desire to reuse network cabling to control cost, limiting radio density and locations
Real-time character-based applications that are intolerant of network delays
Older client devices with a wide range of operating systems, radios, and antennas
Long, narrow aisles obstructed by people and moving equipment
High racking and shelving that obstructs line-of-sight (LOS) between adjacent aisles
Tall ceilings that reduce effectiveness of standard antennas at ground level
Constantly changing product mix that alters ambient RF properties
Dense concentrations of products such as lumber or liquids that absorb RF
Heavy dependence on hands-free voice communication
Moving vehicles with permanently attached data terminals
Presence of “legacy” frequency-hopping radios in the 802.11 frequency band
Unusual sources of electromagnetic interference
Hardened areas that require coverage inside, such as freezers
Outdoor coverage requirements of trailer yards and remote buildings
To overcome these challenges, wireless integrators have developed a common “toolkit” of RF design tactics over the years. These tactics include:
Installing additional APs in persistent trouble spots
Employing antenna diversity
Using external antennas on mobile clients
Mounting high-gain antennas indoors on walls to cover long aisles
Mounting high-gain antennas outdoors on rooftops to cover yard areas
Covering the same area with both horizontally and vertically polarized antennas
RF Design | 71

Switching from vertically-polarized antennas to horizontally-polarized antennas
Modifying AP and client radio parameters such as power levels or data rates
Modifying network parameters such as TCP retry limits
Installing TCP “middleware” on clients to protect against network dropouts
When an RF trouble spot is identified, one or more of these techniques will be tried until client device performance is stabilized in that area. However, this much design complexity and non-standard configuration can itself cause problems. Some of these techniques--such as the use of high-gain antennas, or simultaneous cross-polarity coverage--can cause more problems than they solve. And some of these techniques are based more on “conventional wisdom” than actual science.
This chapter presents a simpler, proven RF deployment strategy for retail developed by Aruba’s RF and microwave engineers. We begin with a review of RF design strategy for both legacy and thin AP architectures. Next, we consider computing proper AP density and placement strategies for APs. Finally, we review how to adapt RF designs for specific retail facility types and provide examples.
For those wishing a deeper understanding of the science behind the recommendations of this chapter, Appendix A, “RF Concepts and Terminology” contains a discussion on RF physics and mathematics.
RF Design Strategy for Legacy APsRF design for controller-based WLAN systems is different from RF design for legacy or “thick” APs. Legacy AP systems were often built in a “bottom up” fashion one AP at a time using the Active Survey process. By contrast, controller-based WLANs typically employ much greater AP densities and use a “top down” design process. To best understand the two approaches, it is useful to review how RF design has historically been done for legacy APs.
Coverage vs. CapacityIn Chapter 4, “RF Site Surveys” , we explored the evolution of RF planning from “coverage” designs to “capacity” designs. The goal of a coverage design is to minimize network cost by using as few APs as possible to provide basic service in a target area. In a coverage design, the radius of each radio cell is typically the distance to the point where the lowest data rate of 1Mbps can no longer be heard. If cell overlap is used, only the lowest data rates of 1Mbps or 2 Mbps will overlap between cells. The AP density is said to be sparse. This method was preferred when APs were very expensive.
As APs have become more affordable and client bandwidth needs have increased, wireless engineers have introduced capacity designs. The goal of a capacity, or dense, design is to make sure that a uniform minimum data rate (or, alternatively, a uniform minimum signal-to-noise ratio) exists throughout a target area. This data rate or signal-to-noise ratio (SNR) criterion defines the cell edge, and the cell radius is the distance between the AP and this point.
Of course, lower data rates for that AP extend well beyond this cell edge, but client devices are configured to roam if the data rate falls below the specified minimum. This reduces or shapes the effective cell size even though the AP may be heard further away. Cell size may also be shaped on the infrastructure side by eliminating low data rates such as 1 Mbps and 2 Mbps from the AP, which has the effect of shrinking cell size to align better with the designer’s objective. Cell overlap of unwanted data rates and SNR values is inherent in such a design; however, overlap of high-data rate cells is at the discretion of the wireless designer.
Channel planning becomes very important in a capacity design because of the significantly increased overlap of data rates below the minimum value. APs that are spaced too close together suffer from increased co-channel interference. This can be easily seen in Figure 5 on page 32.
Regardless of whether a coverage or capacity model was used, wireless engineers manually selected the channels and power settings to assign to each thick AP. A labor-intensive active survey was
72 | RF Design Retail Wireless Networks Validated Reference Design | Solution Guide

generally conducted to make these choices. Once configured in the AP, these values were static for the life of the system.
Client DensityEvery AP can support a limited number of clients simultaneously. The limit varies based on the type of associated clients and the characteristics of their data flows. In general, an AP can support fewer voice clients than data clients due to the precise timing requirements imposed by voice protocols. The limit varies from moment to moment based on the actual mix of clients currently transmitting.
Legacy APs did not support any type of admission control mechanism. This refers to the ability to actually control the number of clients that associate to a given AP. As a result, overall performance for all clients would suffer as more devices associated the same AP and attempted to utilize the same channel. If the legacy AP also had a hard limit, clients beyond that limit would be denied service.
Figure 30 Fully Subscribed AP Unable to Admit Clients
The lack of admission control on legacy APs was not usually seen as a problem for two reasons:
Wireless device populations were relatively limited and so the total client capacity ceiling of the APs was rarely exceeded.
Autonomous APs are not capable of shifting load to neighboring APs so there was no point to having such a feature.
As a result, wireless designers rarely considered client density in legacy AP deployments. Some retailers did encounter problems with AP oversubscription in specific areas. The only available solution with Legacy APs is to place another AP in the general area on another channel. However, this solution often increased overall co-channel interference by upsetting the carefully planned static channel plan.
Ret
ail_
123
Retail Wireless Networks Validated Reference Design | Solution Guide RF Design | 73

RF RedundancyRF Redundancy refers to the ability of a wireless LAN to continue to provide service throughout a target area in the event of an AP failure, temporary obstruction of LOS, or presence of narrowband interference. As with client density, this topic was of limited relevance with thick APs that were not able to cooperate with one another and thereby detect the failure of other radios. In the event that an AP failed or was obstructed, a coverage hole would exist until it could be repaired or the blockage removed.
Figure 31 Failed AP Creating a Coverage Hole
Legacy AP Design SummaryLegacy APs have employed RF designs that were generally static to provide service to limited numbers of clients. The number of APs was driven by the choice of a coverage or capacity strategy. RF plans were developed from the bottom up, one AP at a time, often using an active survey process. Finally, such designs had limited ability to respond to adverse events such as oversubscription, failure, or blockage of individual APs. Retailers have long wished that RF design had less art and more science to it. Until recently, this was the best achievable result.
RF Design Strategy for Thin APsThe explosion of bandwidth-hungry mobile devices across virtually every type of industry has fundamentally changed the way that most companies look at wireless systems. Instead of a simple static choice between coverage and capacity, customers now expect their WLANs to respond fluidly and seamlessly to changing demands. Service Level Agreements (SLAs) are now expected to accompany WLANs. These SLAs include explicit uptime and availability requirements that necessitate load-balancing and self-healing capabilities to be met. Outdoor coverage has to work as well as indoor coverage. Achieving these objectives requires not only new technologies, but also a new RF design strategy to take advantage of the new technologies.
Thin AP ArchitecturesThe wireless industry has responded to these needs by developing intelligent controller-based WLAN systems and thin APs that work together as a system to manage performance and respond to RF problems in real time. Thin APs are essentially just network-attached radios that are managed by an appliance in a secure environment with high-speed wired network connectivity. This is the same strategy used by cellular telephone operators to provide reliable voice and data services over wide areas. In Chapter 5, “Physical and Logical Network Design” , we considered the design of applicable physical and logical thin AP architectures that are used by retailers.
Ret
ail_
124
Channel 11
Channel 11
Channel 11
Channel 6
Channel 6
Channel 6
Channel 1anne
74 | RF Design Retail Wireless Networks Validated Reference Design | Solution Guide

Thin AP architectures are self-aware. They are designed as a system in a top-down manner. From an RF design perspective, this means that traditional and labor-intensive RF design methods such as setting up test APs to measure coverage are no longer needed because the system can dynamically adjust itself to changing loads and RF conditions. Instead, RF design for thin APs is about ensuring that the radio density is sufficient so that the controller has the tools it needs to make good decisions and act on them. Coverage designs are not compatible with these requirements; every WLAN is assumed to be a capacity design.
Principal Factors Affecting Thin AP DensityFor all of the thin APs in a given region of three-dimensional (3D) space under its control, a wireless LAN controller manages service levels for three types of RF-related variables on a continuous basis:
1. Managing bandwidth to meet a uniform minimum data rate or SNR target
2. Managing clients to hold peak device loads below a per-AP target maximum
3. Managing redundancy to ensure uninterrupted minimum RF signal coverage
While all three of these factors are interrelated, the AP density required to maintain each one within expected tolerances is unique. The number of APs needed to achieve a target bandwidth can be higher or lower than the number of APs needed to serve a particular client population size. The greater of these two AP densities is then increased by an overlap factor to assure RF redundancy. For each wireless coverage zone, there is a minimum AP density that allows all three service levels to be successfully met by a wireless controller. For example:
A retailer that equips every employee with a voice device and a mobile data device running a character-based application may not require high bandwidth density, but does have a high client density requirement.
A retailer that uses a data-intensive client/server inventory application on a mobile scanning terminal but has no other wireless devices may not require high client density but does need a high bandwidth density.
A distribution center may have low bandwidth and client density requirements but must have high redundancy density to protect against AP failure or obstruction.
Customers purchase WLAN controllers with the expectation that they will automatically balance and enforce each of the bandwidth, client, and redundancy density objectives simultaneously. Each controller must have enough APs to work within the coverage area to successfully achieve the goals set by the wireless designer.
Therefore, the proper AP density for a thin AP deployment is determined by computing the bandwidth, client and redundancy density for a given coverage zone and selecting the larger of the three values. This process is repeated for multi-zone deployments. Aruba offers planning tools such as RF Plan and AirWave VisualRF that automate this process.
Retail Wireless Networks Validated Reference Design | Solution Guide RF Design | 75

AP Density PlanesBandwidth, client, and redundancy density may be thought of as logical RF planes or layers that are managed by the WLAN controller in real time, using a single physical pool of thin APs for a given coverage area. This is concept depicted in Figure 32.
As we have seen, each of the three planes requires a minimum AP density to achieve a target service level. Using this conceptual approach provides the wireless engineer with a clear way to describe and compute these densities. RF planes may also interact with one another, such as when increased client demand reduces overall bandwidth, or when a failed AP temporarily reduces client capacity in that area.
Figure 32 Logical AP Density Planes – Single Zone
A coverage zone can be an entire facility, or a single facility may be subdivided into multiple zones to accommodate different requirements in each one. The Gartner Group refers to these zones as microenvironments1. For example, a room full of charging cradles for mobile scanners in a distribution center may require a higher client peak objective than the rest of the DC.
Figure 33 Logical AP Density Planes – Multiple Zones
To accommodate these variations, the Aruba RF planning methodology for thin AP systems begins by dividing facilities into separate zones based on bandwidth, client, and redundancy density differences.
1. WLAN Microenvironments Address Different Application Needs in Enterprises, Gartner Group, October 2008
Ret
ail_
125
Redundancy Plane
Client Plane
Bandwidth Plane
Ret
ail_
126
Zone A Zone B Zone C
76 | RF Design Retail Wireless Networks Validated Reference Design | Solution Guide

Bandwidth PlaneThe bandwidth plane is engineered so that a targeted minimum data rate is available throughout the coverage zone. The Aruba WLAN controller dynamically adjusts RF settings to provide the minimum data rate with the available installed APs. To achieve this objective, controllers must select the optimal channel and power settings for each AP and radio on an ongoing basis as ambient RF conditions change. For dual-radio APs, the controller does this for both 2.4 GHz and 5 GHz frequency bands, ensuring that the maximum designed capacity of each band is available at all times.
Figure 34 Sample Dense Deployment with 9 Aruba AP125 Access Points
Figure 34 shows a hypothetical dense dual-band radio 802.11a/g/n AP125 deployment with overlapping high data-rate cells (e.g., 54 Mbps edge rate in 2.4 GHz and 300 Mbps edge rate in 5 GHz). To create roughly equal physical cell sizes for the two radios, the WLAN controller reduces the transmit power of the 2.4 GHz radio by 6dB (roughly 75%). This compensates for the higher free space path loss in the 5 GHz band.
In an Aruba WLAN, all of the APs that service each coverage zone work together as a system to maximize the performance of the client devices. Aruba Adaptive Radio Management (ARM) 2.0 technology automatically load balances clients between nearby APs. ARM 2.0 is capable of “band steering”, which forces 5 GHz-capable clients to the higher frequency band with its greater number of channels and lower interference levels.
For planning purposes, wireless designers generally assume that the targeted minimum data rate is distributed uniformly throughout each cell. For real-world cell sizes and edge data rates to match a virtual RF survey, the noise floor must be low enough to allow sufficient SNR to overcome the co-channel interference present from other APs on the same channel nearby.
Ret
ail_
128
1 6 11
1 6 11
11 1 6
36 44 149
165 40 44
149 36 40
Uniform 354 Mbps coverage zone
2.4 GHz (802.11b/g)
54 Mbps Cell Edge
300 Mbps Cell Edge
5 GHz (802.11a/n)
Retail Wireless Networks Validated Reference Design | Solution Guide RF Design | 77

With these assumptions, it is easy to compute the radius of the typical cell edge and resulting area of coverage of a single cell for commonly used minimum data rates and output power values. In Appendix A, “RF Concepts and Terminology” we show how to compute the cell radii for various data rates and SNRs.
Bandwidth vs. Throughput
The 802.11 physical layer operates at half-duplex because only one station may transmit on a wireless channel at the same time. 802.11 data rates such as 54 Mbps or 300 Mbps refer to one-way, “raw” physical layer bandwidth. No consideration is given for latency from an application perspective and no consideration is given for transmission “overhead”. In addition, such data rates represent single client to single AP speeds under best-case conditions; actual client bandwidth will be lower under real-world conditions and client counts.
By contrast, application performance is heavily dependent on round-trip, full-duplex network performance. Even applications that have asymmetric traffic profiles, such as video cameras, must still employ delivery guarantee mechanisms which require acknowledgements, windowing, and sequencing at upper layers of the protocol stack. Latency in all layers and in any network element can significantly reduce performance.
As a result, application developers typically express their network requirements in terms of throughput. Throughput is defined as the effective data transfer rate at the application layer, and can be measured as an average or a peak.
Therefore, we need a mechanism to convert between the bandwidth values that will be used for WLAN design and the throughput values that must be guaranteed to applications. The simplest and most conservative technique is the following formula:
802.11a/b/g Throughput = Bandwidth * 0.40
802.11n Throughput = Bandwidth * 0.50
In other words, 54 Mbps of half-duplex bandwidth provides 22 Mbps of full-duplex throughput. This is a well-known conversion among wireless designers, and is suitable for most purposes.
N O T E
5 GHz values should always be used for area computations because of the reduced signal range. This makes sure that the RF design will work well in either band and will future-proof the RF Plan against cabling costs for future 802.11n deployments.
Table 13 Cell Radius and Area for Top 5 Data Rates at 20 dBm Output Power
Cell Edge SNRCell Edge Radius Cell Area
2.4 GHz 5 GHz 2.4 GHz 5 GHz
54 Mbps 21 149 ft. 63 ft. 69,478 sq. ft2 12,400 sq. ft2
48 Mbps 20 163 ft. 69 ft. 83,531 sq. ft2 14,909 sq. ft2
36 Mbps 16 236 ft. 100 ft. 174,520 sq. ft2 31,148 sq. ft2
24 Mbps 12 341 ft. 144 ft. 364,625 sq. ft2 65,078 sq. ft2
18 Mbps 9 449 ft. 190 ft. 633,645 sq. ft2 113,093 sq. ft2
78 | RF Design Retail Wireless Networks Validated Reference Design | Solution Guide

Bandwidth Capacity Example
In the example in Figure 34 on page 77, there are nine dual band 802.11a/b/g/n APs that use a cell edge data rate of 300 Mbps/54 Mbps, for a total of 3.186 Gbps of total physical-layer bandwidth. A similar design using 802.11a/b/g APs with 54 Mbps per radio would offer a total bandwidth capacity of 972 Mbps in the same coverage area. A wireless designer who is choosing between 802.11a/b/g APs and 802.11n APs can quickly determine the available peak bandwidth capacity by constructing a table similar to Table 14.
The table shows the projected bandwidth and throughput available per area and per user, assuming that each AP covers 3600 square feet and there are 200 total users.
Converting SNR to Data Rate
Some common devices in retail facilities require the wireless engineer to target a minimum Received Signal Strength Indication (RSSI) or SNR at the edge of each cell, instead of a specific data rate. Voice over Wi-Fi handsets are the most common devices that use this criterion, but some handheld data terminals also recommend uniform SNR as a best practice. A minimum RSSI value of -65 dBm (equivalent to SNR of 20 dB with a noise floor of -85 dBm) is typical for such devices.
In reality, these are two different ways of saying exactly the same thing. The 802.11 standard establishes minimum SNR values required in order to properly decode each data rate. The minimum SNR values for specific modulations (data rates) are shown in Table 15. A minimum of about 4 dB SNR (± 2 dB depending on the design) is required for any reliable 802.11 communication (at 1 Mbps or 6 Mbps).
Using this table, we can easily convert minimum SNR criteria into bandwidth. This allows the wireless designer to minimize the number of units that are being worked with. Aruba recommends converting each device whose manufacturer stipulates minimum performance criteria in terms of RSSI or SNR,
Table 14 Sample Comparison of Per-Client Bandwidth in Two Virtual Surveys
802.11a/b/g 802.11n
AP (Cell) Count 9 9
Radios Per AP 2 2
Target Cell Edge Rate – 5 GHz 54 Mbps 300 Mbps
Target Cell Edge Rate – 2.4 GHz 54 Mbps 54 Mbps
Total Aggregate Bandwidth 972 Mbps 3,186 Mbps
Total Square Footage 32,400 sq. ft. 32,400 sq. ft
Total Users 200 200
Avg. Bandwidth per User 4.8 Mbps/user 16.0 Mbps/user
Avg. Throughput per User 2.4 Mbps/user 8.0 Mbps/user
Table 15 Typical minimum required SNR for proper detection of 802.11 rates
DSSS Rates OFDM Rates
Rate (Mbps) 1 2 5.5 11 6 9 12 18 24 36 48 54
SNR (dB) 4 6 8 10 4 5 7 9 12 16 20 21
Signal Level (dBm) -81 -79 -77 -75 -81 -80 -78 -76 -73 -69 -65 -64
Retail Wireless Networks Validated Reference Design | Solution Guide RF Design | 79

into the equivalent data rate. This conversion provides for maximum convenience and consistency during the planning process.
The equivalence between data rate and SNR can be visualized in Figure 4 in Chapter 4, “RF Site Surveys” . The actual distance, or radius, from the AP to each data rate/SNR boundary will vary with the EIRP of the AP, the receive sensitivity of the client, and the radio frequency being used.
Matching Client and AP Power
Wireless communication is not one-way, but rather requires a solid round-trip connection with equal performance both to and from each client device. Professional wireless designers routinely conduct surveys measuring the RSSI or SNR value at various distances from an AP with a given power setting. This measures exactly one-half of the roundtrip. However, many wireless designers do not explicitly consider the available power, or signal strength, from the client back to the AP. Aruba has found AP-client power mismatches to be a primary cause of many client device connectivity problems.
The reason this is a problem is that client devices typically operate at lower transmitter power levels than APs. The Aruba AP85 is capable of 23 dBm output power at the antenna interface which is considerably higher than the typical client power output. Contrast this with all but the latest models of voice handsets and “ruggedized” mobile terminals which are limited to 12 dBm power output plus a low(~3 dB) antenna gain. The worst combination is high power APs with low power clients. A symptom of this problem is having “5 bars” on the client device, but still having a a poor connection. The client can hear the AP but the AP cannot hear the client. This condition is illustrated in Figure 35.
Figure 35 Mismatched Client and AP Power Output
When considering the floor-to-ceiling shelving commonly used indoors at retail facilities, or the large outdoor yard environments that often surround them, it is tempting to think in terms of maximizing power. But high-power APs will not achieve the desired result unless the transmit power at the antenna port is relatively equalized, as shown in Figure 36.
Figure 36 AP Power Output Matched to Least Capable Client Device
Ret
ail_
130
20 dBm Output
20 dBmOutput
12 dBmOutput
Reta
il_13
1
12 dBm Output
20 dBmOutput
12 dBmOutput
80 | RF Design Retail Wireless Networks Validated Reference Design | Solution Guide

Effect of Matching Client Power on Required AP Density
When reduced-power client devices are present in a coverage zone, higher AP density is required. The effect of lowering AP output power to match the least capable client is to shrink the effective cell size for all data rates on each AP. More APs are therefore needed to achieve the minimum data rate.
The first step in determining how many APs are required to achieve a uniform target data rate in a given zone is to look up the cell area corresponding to the least capable client device operating inside that zone. By dividing the cell areas of the Top 5 data rates into the size of the zone, we obtain the number of APs required to provide non-overlapping coverage for each rate at various output power levels.
Wireless engineers who are used to active surveys can quickly confirm these values by modifying their survey process. Active site surveys can easily be adjusted to account for client/AP power mismatches. The important thing is to survey using the transmit power of the least capable client device rather than the full available power of the AP, which may be significantly higher. The wireless engineer can choose one of these two methods:
1. Reduce transmit power (TX) on the AP to match the expected maximum client transmit power
2. Monitor the RSSI of the client as reported on the controller during the survey, instead of looking solely at the received AP RSSI at the client device (a type of “reverse survey”)
Adjusting for Absorption and Losses
In general, it is not recommended to target data rates below 18 Mbps (9 dB SNR) in indoor environments. One reason for this is that the reliability of predicted coverage is reduced with increasing distance, and designing for 18 Mbps (9 dB SNR) translates to a 6 dB design margin above the minimum SNR where loss of coverage could occur. Designing data rates above 18 Mbps further increases margin and performance for applications that may need higher bandwidth or environments with more users per AP.
For example, in a typical store environment, there are many aisles with shelves in between. Each time the RF signals must transition between the open areas and shelving not only introduces loss, but also uncertainty with respect to the effects. The RF effects of the contents of the shelf are not always exactly known, and may vary from day to day depending on the level of stock or types of products in stock. Thus, reliable long term RF planning requires reducing uncertainty where possible, which means accepting some over-design since under-design is usually unacceptable in WLAN deployment.
Table 16 5.8 GHz Cell Radius and Area for Various Data Rates and Output Power Valuesa
a. Assumes 3dBi passive gain on each radio, 6dB design margin, and path loss exponent equal to 2.5.
Cell Edge Radius Cell Area
14 dBmOutput
17 dBmOutput
20 dBmOutput
14 dBmOutput
17 dBmOutput
20 dBmOutput
54 Mbps 36 ft. 48 ft. 63 ft. 4,106 ft2 7,136 ft2 12,400 ft2
48 Mbps 40 ft. 52 ft. 69 ft. 4,937 ft2 8,579 ft2 14,909 ft
36 Mbps 57 ft. 76 ft. 100 ft. 10,314 ft2 17,924 ft2 31,148 ft2
24 Mbps 83 ft. 109 ft. 144 ft. 21,549 ft2 37,448 ft2 65,078 ft2
18 Mbps 109 ft. 144 ft. 190 ft. 37,448 ft2 65,078 ft2 113,093 ft2
Retail Wireless Networks Validated Reference Design | Solution Guide RF Design | 81

Client PlaneAruba WLAN controllers perform load balancing to spread client density peaks across multiple APs. APs generally have different maximum client capacities for different traffic types, such as voice and data flows. Planning values for Aruba APs are shown in Table 22 on page 133 in Chapter 8, “QoS Design for Voice and Data Devices” .
Client capacity is generally expressed as a minimum number of client devices per AP per band. If band steering is in use, the client capacity value is simply the sum of the individual capacities of the two bands.
Client capacity was rarely a factor in legacy AP designs for the reasons discussed earlier in this section. However, this is rapidly changing due to the increasing numbers and varieties of 802.11-enabled devices in many workplaces. For example:
A retailer that previously equipped every employee with a mobile scanning terminal and subsequently adds a voice device for every employee has now doubled the client capacity requirement for the facility.
A retailer that adds a belt-mounted wireless mobile printer to an employee that also carries a mobile data terminal has similarly doubled the client demand. With a voice device, the client demand is tripled.
It is also common to have variable client capacities in different microenvironments within a single facility. Here are common examples:
Mobile terminal charging stations that may accommodate dozens or hundreds of devices may expect to conduct data upload or download, or firmware updates during the charging cycle. This requires higher client capacity in the area with the charging stations.
Outdoor yard environments with mobile vehicle-mounted WLAN clients typically have higher client capacity requirements in garage areas where vehicles park between shifts or over breaks.
Auditoriums, break rooms, and large conference rooms require above-average client capacities in order to support temporary concentrations of workers using devices in the space.
RF Redundancy PlaneThe RF redundancy goal for a coverage zone is typically expressed as an overlap percentage. It is measured as the percentage of the cell edge radius that is common between one or more APs. Cells with 0% overlap will fail to meet the minimum data rate target in the event of an AP failure. Cells with 100% overlap will maintain the minimum target data rate even if an AP fails. The cell radius used to compute the overlap corresponds to the distance from the AP to the edge of minimum target data rate.
Figure 37 Sample Overlap Percentages
Coverage hole detection and mitigation is a key feature of controller-based WLAN systems. Today, this primarily involves adjusting AP power levels to compensate for AP failures. In the future, with the ratification of the 802.11k standard that enables APs and clients to exchange information on RF
Ret
ail_
145
Target Cell Edge Data Rate
0% Overlap 50% Overlap 100% Overlap
r rr
82 | RF Design Retail Wireless Networks Validated Reference Design | Solution Guide

conditions, controllers will be able to improve the experience of individual client devices based on their locally reported conditions.
A dense deployment that uses 18 Mbps or higher edge data rates will always have overlapping coverage of rates below the target minimum, even if the overlap percentage at the higher designed rate is 0%. However, we do not want to depend on this overlap because the entire point of setting a minimum data rate objective is to deliver a consistent bandwidth throughout the coverage zone. Therefore, a related best practice is to configure both the Aruba infrastructure and the client devices to roam whenever they hit the edge of the target cell radius. Attempting to use unwanted lower rates for redundancy would result in inconsistent roaming performance.
Roaming and Cell Overlap
Overlap is also required for smooth roaming of the kinds of mobile devices that are common in retail stores and warehouses. The cells must overlap so that there is no loss of coverage when a wireless client roams from one cell into the next.
Figure 38 Overlapping AP Cells
For this reason, Aruba recommends a minimum cell overlap of 25% for all coverage zones even if no RF redundancy is required.
Retail deployments always benefit from increased overlap for another reason: Due to the potential for new obstructions to appear in a changing environment, (such as forklifts, new stacks of goods, or changes in the density of goods stored) it is always recommended that a client be able to reach at least 2 APs from any location in the coverage area. This deployment is beneficial because if the path from one AP is obstructed for some reason, the client will not lose coverage because it can associate to another AP.
Ret
ail_
146
AP 1Channel A
AP 2Channel B
AP 3Channel A
Associatedto AP 1
Handoverto AP 2
Handoverto AP 3
Retail Wireless Networks Validated Reference Design | Solution Guide RF Design | 83

How to Compute AP CountsTo determine how many APs are needed to cover a given zone, the wireless designer must choose an objective for each of the three AP Density Planes:
Bandwidth plane: Minimum cell edge data rate and AP transmit power
Client plane: Maximum number of active client devices
Redundancy plane: Cell overlap percentage
With these values in hand, the basic procedure is shown in the following flowchart. Aruba recommends that wireless engineers utilize the Aruba RF Plan tool, which automates the entire AP computing process.
Figure 39 Computing AP Counts
To compute the required number of APs, follow these three steps:
1. Use the data rate and AP transmit power to look up the relevant non-overlapping cell area. Divide into the size of the coverage zone to obtain the AP count for the density plane.
2. Use the client count and the AP subscription table to look up the required number of APs for the client plane.
3. Add 100% to the overlap percentage and multiply by the larger of step 1 or step 2.
Ret
ail_
147
EstimateArea of Zone
Match AP toClient Power
LookupCell Areafor TargetData Rate
Multiply LargerValue by DesiredOverlap Factor
AP Countper Zone
Repeat for each zone
LookupMax ClientsPer Channel
EstimateClient
Populationin Zone
Divide Coverage Areainto Discreet Zones
Divide Client Population byPer-Channel Limit =
AP Count for Client Load
Divide Zone Size byNon-Overlapping Cell Area =
AP Count for Data Rate
84 | RF Design Retail Wireless Networks Validated Reference Design | Solution Guide
You will need to complete Table 1, Table 2, and Table 3 in Chapter 3, “Defining WLAN Requirements for Retailers” to proceed with this process for all of the coverage zones. The data in those tables is required to complete the methodology.
Choosing Between 802.11a/b/g and 802.11n APsThe 802.11n standard heralds a new world for enterprise wireless networks. 802.11n brings higher data rates, longer range, and more reliable coverage than previous Wi-Fi technology; it represents a significant upgrade in performance. Not only will 802.11n change what you can expect from a wireless LAN, it will change how you think about wireless technology. For example, obstructed RF paths between client and AP may outperform paths with clear LOS. This is because 802.11n takes advantage of signal reflections in the radio path meaning performance can improve in obstructed environments.
Benefits of 802.11n802.11n includes a number of complex technological advances which are explored in detail in the Aruba whitepaper, Designed for Speed: Network Infrastructure in an 802.11n World. These advances can be summarized as follows:
Increased capacity. 802.11n enables increased data rates, improving the usable data throughput of a cell from perhaps 15-20 Mbps with 802.11a/g to 100-200 Mbps. Given that this capacity will be spread over a number of simultaneous users, performance should match or exceed that of a wired 100 Mbps Ethernet connection.
Improved range. 802.11n supports increased range through multiple-input, multiple-output (MIMO) techniques which involve using multiple antennas (or ‘antenna chains’) on the AP and the client.
More uniform ‘reliable’ coverage. Coverage in Wi-Fi networks is notoriously spotty due to multipath interference and LOS obstructions. A user may have a good signal at some point, but moving the client device a short distance, stepping in front of it, or even opening a door across the room can significantly affect the signal strength. The MIMO technology in 802.11n is extremely effective in reducing the effects of multipath nulls and obstructed RF paths.
Limitations of 802.11n for RetailersThe migration to 802.11n does pose some challenges, however. Most of the benefits will only be realized when 802.11n-capable clients are used with similar infrastructure, as even a few legacy (802.11a/b/g) clients in the cell will drastically reduce overall performance compared to a uniform greenfield 802.11n network. For many retailers, the cost of refreshing wireless devices means that it may be several years until significant 802.11n client populations exist in their facilities.
Another cost issue for retailers is switch upgrades. For best performance, LAN edge switch ports and cabling to the APs will require an upgrade to gigabit Ethernet and the new 802.3at Power over Ethernet (PoE) standard.
Finally, 802.11n APs will initially be more expensive than existing equipment, although we expect the cost will decrease over time.
802.11n Drivers for RetailersDespite the limitations, retailers planning a thin AP migration have expressed significant interest in 802.11n. There are two primary motivating factors for this interest:
Future Cost Avoidance. The labor, lift, and parts cost to pull cable and install APs in every one of a retailer’s facilities can easily cost more than the hardware itself. Rather than make “two trips to the ceiling,” it may be more cost effective to purchase 802.11n APs today.
Retail Wireless Networks Validated Reference Design | Solution Guide RF Design | 85

Wireless Intrusion Prevention of 802.11n Devices. 802.11a/b/g air monitors are not capable of decoding 802.11n traffic payloads. Retailers want to be protected against the possibility of 802.11n rogue APs being installed in their facilities.
Aruba has simplified this decision by introducing a family of 802.11n-ready APs–the AP124abg and AP125abg. These are fully compliant 802.11n Draft 2.0 APs that are software restricted to provide only 802.11a/b/g service. Costing less than a full 802.11n AP, this solution makes it possible for retailers that wish to deploy 802.11n in the future to install the hardware today. Using the Aruba software-defined radio technology, the retailer can purchase 802.11n licenses when ready to do so, without having to physically touch the APs.
Choosing Between Dedicated and Hybrid Mode Air MonitorsAruba customers commonly ask “Do I need dedicated air monitors in an Aruba deployment, or can I get by with just APs?”
The answer depends on two factors. First, the PCI Compliance Category selected during the Define phase in Chapter 3, “Defining WLAN Requirements for Retailers” . If the Aruba deployment is a pure WIPS overlay onto an existing WLAN infrastructure from another vendor (Category 2), then only dedicated AMs are required and no APs are deployed.
The second factor is a risk assessment of the limits of hybrid mode AMs for the particular retail environment. This assessment comes into play if you are installing an Aruba secure WLAN infrastructure (Category 3).
Benefits of Dedicated Air MonitorsAll Aruba APs can be configured as either a dedicated AM that constantly scans the RF spectrum, or as a device that provides both AP and AM functions simultaneously (a hybrid mode or scanning AP).
An AP automatically provides monitoring on its configured channel. For example, an AP servicing clients on channel 1 provides full monitoring on channel 1. If set to perform off-channel scanning, the AP periodically spends limited time intervals scanning other channels in the band. The scanning period must be less than the 100 ms beacon frequency. These periods occur by default every 10 seconds on an Aruba system, but can be configured to occur more often at the cost of reduced client performance.
Some performance impact is unavoidable with off-channel scanning. Multi-vendor lab testing recently found that when using scanning APs for both client service and off-channel monitoring, a throughput drop of up to 16% was possible when APs were required to spend significant time off-channel.
Are dedicated air monitors necessary? Although Aruba leaves this choice up to the customer, we highly recommend their use. Dedicated AMs provide a number of security-related enhancements over scanning APs. The following sections detail some of the benefits of monitoring with dedicated devices.
Security Benefits
802.11n classification and containment: 802.11a/b/g APs cannot detect or contain 802.11n AP traffic. For this reason, retailers are strongly encouraged to deploy dedicated AMs that are 802.11n compatible, even if the APs are 802.11a/b/g only.
Faster rogue AP classification and containment: Enhanced security monitoring enables faster response to these security breaches by performing the following functions:
Classification. Rogue classification is the ability to determine whether a rogue AP is connected to the wired network, and, if so, where it is connected. The longer the AP or AM can spend on a channel sampling data, the more accurate the classification algorithm will be and the more accurate and timely the results will be. Scanning APs that are servicing clients can also classify rogue APs, but they are much slower because they must dedicate time to the clients.
86 | RF Design Retail Wireless Networks Validated Reference Design | Solution Guide

Containment. After it detects and classifies a rogue AP, an Aruba controller can automatically disable it using a low-bandwidth wired and wireless denial of service (DoS) attack. For the wireless DoS attack, the transmitting device must be on the same channel as the rogue AP and must stay on that channel to continue the containment action. While a scanning AP can go off-channel to perform rogue AP containment, throughput can be severely impacted if the rogue is on a different channel than the local. Dedicated air monitors provide a more effective way to perform rogue AP containment without negatively impacting the performance of the wireless network.
Ad-hoc network detection and containment. Ad-hoc networks typically generate much less traffic than rogue APs. For this reason, there is a low probability that a scanning AP will find an ad-hoc network during its brief scan interval. With dedicated AMs, ad-hoc networks are quickly detected and disabled.
RF Management and Troubleshooting Benefits
Packet capture, or sniffing, enables network managers to troubleshoot the network. An AP can perform packet capture on its configured channel, but performing this function on another channel adversely affects client service. A dedicated AM solves this problem because it can capture traffic on any channel.
Statistics monitoring is another valuable troubleshooting tool. Aruba devices collect a wealth of statistical information about the RF environment, such as interference levels, number of devices, top talkers, frame retry rates, RSSI, devices out of range, and frame type/size distribution. APs provide this functionality for their own channels and offer a limited view of what is happening on other channels. Dedicated AMs scan channels with a much longer dwell time and provide a more accurate picture of what is happening on each channel.
Client Performance Benefits
Client performance is affected when APs go off channel to scan; voice clients are particularly sensitive. Aruba traffic-aware scanning can cancel or defer off-channel scanning. However, while this improves client performance, it also reduces the security monitoring time. With dedicated AMs, the network can maximize both security and performance without having to choose between the two.
How to Compute AM CountsFor planning purposes, Aruba recommends a ratio of 1 dedicated air monitor for every 4 APs. Each AM can hear traffic within a 20,000-25,000 square foot area (80-90 foot cell radius) in a typical environment. Position the AMs to cover the target area without gaps. For larger facilities, Aruba recommends covering target areas with multiple sensors using a 25% cell overlap factor. The Aruba RF Plan tool can help visualize AM coverage.
Automating AP and AM Calculations with Aruba RF PlanRF Plan is a three-dimensional wireless pre-deployment modeling tool that enables wireless engineers to design a WLAN for any retail facility. The tool reduces design labor by automating the RF design process. RF Plan models can also be imported directly into Aruba controller, reducing deployment labor requirements during provisioning of the network.
RF Plan allows you to determine AP quantities and placement based on your specified capacity requirements. Using this tool, you can design new wireless network areas, such as stores and warehouses, and enter settings to provision and connect APs and/or AMs within the areas.
Retail Wireless Networks Validated Reference Design | Solution Guide RF Design | 87

Creating an AP ModelRF Plan can import AutoCAD drawings and either JPG or PNG image formats. With these, you can replicate physical site layouts and apply them against AP and/or AM coverage parameters. RF Plan uses this data to compute the most effective quantities and positions for the wireless equipment throughout the installation site.
After you load the floor plan, use the AP modeling page to enter the information necessary to determine the number and placement of APs in your buildings to provide the required radio capacity. Three planning models are supported: coverage, capacity, and custom. The capacity model corresponds to the RF planning methodology presented in this Validated Reference Design (VRD). The capacity model determines the number of APs on the basis of total number of users, ratio of users to APs, and data rates specified by the wireless engineer. A typical dialog box with these parameters is shown in Figure 40. RF Plan automatically calculates the number of APs required based on the information provided.
Figure 40 AP Modeling Screen from RF Plan with Input Model Parameters
Key parameters include:
The desired 802.11b/g and 802.11a rate defines the target minimum cell edge data rate within the WLAN coverage area. The higher the speed, the smaller the coverage area and the more APs required.
Overlap Factor: Amount of signal area overlap allowable when the APs are operating, as one of the following settings:
100% (low) – Best for buildings that contain large open spaces, such as stores with low shelving.
88 | RF Design Retail Wireless Networks Validated Reference Design | Solution Guide

150% (medium) – Best for common store and warehouse environments with high shelving containing typical dry goods.
200% (high) – Best for hardened-area deployments with poor RF coverage characteristics including freezer areas, buildings with thick brick or concrete walls, or excess RF noise.
Creating an AM ModelIf dedicated AMs will be used, the AM Modeling page allows you to enter the information necessary to determine the number and placement of AMs in your buildings. You may also explicitly specify the number of AMs you wish to deploy. Two radio buttons on the page allow you to choose the model by which the number of AMs is determined.
Use the Coverage model to configure the AMs in your WLAN based on desired WLAN coverage. RF Plan calculates the number of AMs required based on the information you provide.
Use the Custom model to manually specify the number of AMs you wish to deploy.
Figure 41 Creating an AM Model
Aruba recommends that retailers use the Coverage model and select the lowest 5 GHz Monitor Rate.
N O T E
RF Plan adds 100% to the overlap factor discussed under RF Redundancy earlier in this chapter.
Retail Wireless Networks Validated Reference Design | Solution Guide RF Design | 89

Initial Placement of APs and AMsOnce the AP and AM models have been defined, the floor plan must be initialized. Selecting this menu option causes RF Plan to place suggested APs or AMs on the floor plan map, in preparation for determining the optimum location for each device.
RF Plan automatically completes an initial placement of APs, but does not take into account walls, building materials, metal obstacles, RF noise, or high user density. Based on your building layout, the wireless designer can manually adjust APs to the best locations to provide necessary coverage. Use the rules provided in this chapter to obtain optimal RF performance in retail stores, warehouses, and distribution centers.
After the equipment (such as APs, AMs, or controllers) is physically installed, the floor plans can be uploaded from RF Plan to the ArubaOS WebUI for use in AP provisioning and monitoring the live network. RF Plans that have been loaded into an Aruba controller can also be automatically imported into AirWave.
Antenna Placement Strategies for RetailersHaving selected the appropriate AP density for each of the facility types requiring coverage, the retail wireless engineer must next choose the proper antenna and proper placement strategy for the deployment. The importance of getting this step right cannot be overstated; making a good choice here will help establish a successful deployment, whereas a sub-optimal choice will guarantee ongoing user complaints.
Side Coverage vs. Overhead Coverage with Omnidirectional AntennasTraditional RF planning techniques that were developed primarily for indoor, carpeted office environments do not provide any information about vertical considerations. Only horizontal coverage or range is generally taken into account when recommending AP locations and antennas. However, vertical characteristics are critical in retail deployments for two reasons:
1. To make sure that AP coverage is designed to reach the clients vertically.
2. To understand AP-to-AP interference issues to facilitate the operation of the Aruba ARM service.
Aruba has developed 3D tools to visualize the vertical as well as horizontal characteristics of its antennas and APs. We have also introduced terminology to help explain these concepts, such as side coverage and overhead coverage.
90 | RF Design Retail Wireless Networks Validated Reference Design | Solution Guide
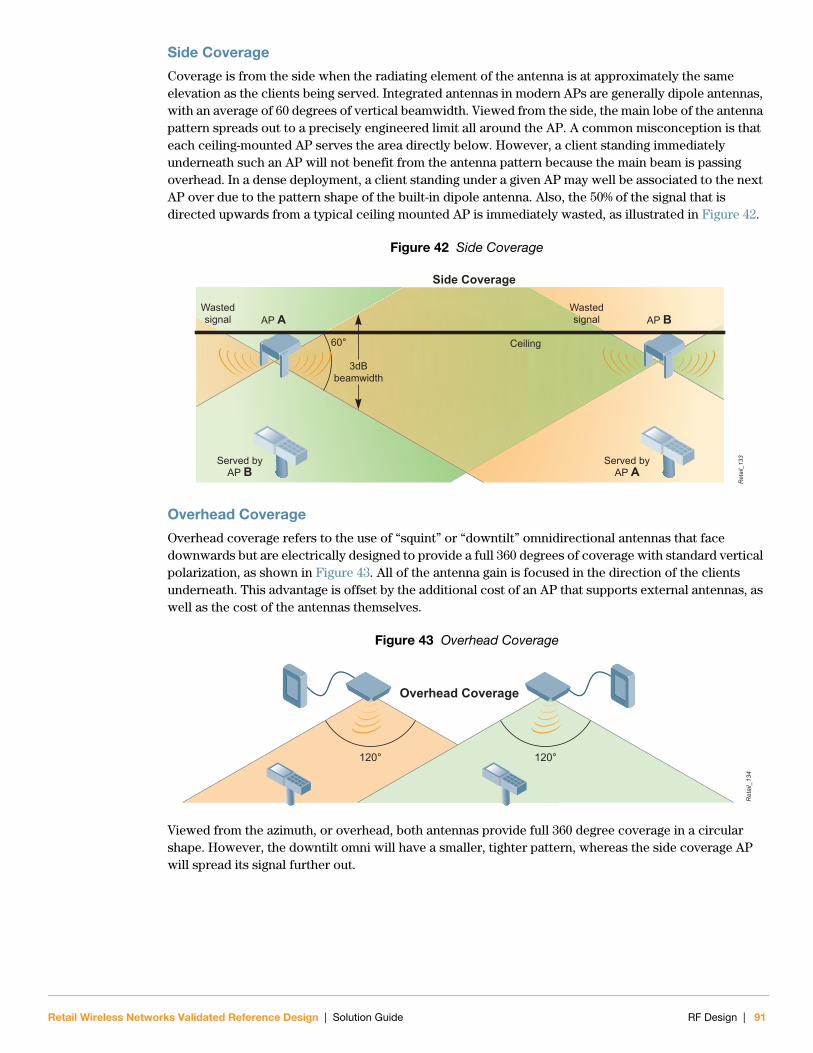
Side Coverage
Coverage is from the side when the radiating element of the antenna is at approximately the same elevation as the clients being served. Integrated antennas in modern APs are generally dipole antennas, with an average of 60 degrees of vertical beamwidth. Viewed from the side, the main lobe of the antenna pattern spreads out to a precisely engineered limit all around the AP. A common misconception is that each ceiling-mounted AP serves the area directly below. However, a client standing immediately underneath such an AP will not benefit from the antenna pattern because the main beam is passing overhead. In a dense deployment, a client standing under a given AP may well be associated to the next AP over due to the pattern shape of the built-in dipole antenna. Also, the 50% of the signal that is directed upwards from a typical ceiling mounted AP is immediately wasted, as illustrated in Figure 42.
Figure 42 Side Coverage
Overhead Coverage
Overhead coverage refers to the use of “squint” or “downtilt” omnidirectional antennas that face downwards but are electrically designed to provide a full 360 degrees of coverage with standard vertical polarization, as shown in Figure 43. All of the antenna gain is focused in the direction of the clients underneath. This advantage is offset by the additional cost of an AP that supports external antennas, as well as the cost of the antennas themselves.
Figure 43 Overhead Coverage
Viewed from the azimuth, or overhead, both antennas provide full 360 degree coverage in a circular shape. However, the downtilt omni will have a smaller, tighter pattern, whereas the side coverage AP will spread its signal further out.
Ret
ail_
133Served by
AP BServed by
AP A
Wastedsignal
Wastedsignal
Ceiling
Side Coverage
AP A AP B
60°
3dBbeamwidth
Ret
ail_
134
Overhead Coverage
120° 120°
Retail Wireless Networks Validated Reference Design | Solution Guide RF Design | 91

Choosing Between Side and Overhead Coverage
Side coverage from built-in antennas is recommended as the best and lowest-cost solution for APs mounted at up to 20 feet of ceiling height. In a standard dense deployment, the APs work together to provide complete, overlapping coverage of the target area.
Between 20 and 30 feet, Aruba recommends side coverage only if the line of sight to the AP is obstructed no more than 40% from a client device at ground level. In general, this means that the height of the shelving can be no taller than 50% of the ceiling height. Retail stores or warehouses with shelving that rises nearly to the ceiling would not be good candidates for side coverage at this mounting height.
Figure 44 Effect of Relative AP and Shelving Height on Signal Absorption
Ret
ail_
151
14 ft-20 dB
-20 dB
-20 dB
-20 dB
-20 dB
-20 dB
-20 dB
18 ft
Main AntennaLobe
30°
8 ft
4 ft18 ft
26 ft
Low Shelving Scenario
High Shelving Scenario
92 | RF Design Retail Wireless Networks Validated Reference Design | Solution Guide

For ceilings higher than 30 feet, Aruba strongly recommends the use of external downtilt or squint omni antennas. The reason for this is illustrated in the preceding diagram. For a standard 60 degree vertical beamwidth dipole antenna, the -3 dB point where the main lobe intersects the ground moves out 17 feet from the AP for every additional 10 feet of mounting height.
Figure 45 Effect of Increasing AP Height on Main Lobe Reaching Ground Level
In summary, for steep down angles and mounting heights over about 20 feet in warehouse or container facilities, the low-gain squint omnidirectional antenna is ideal:
Low-gain limits range to a predictable area around each AP and reduces AP-to-AP interference
Low-gain reduces client density per AP by employing more, smaller cells
Antenna pattern provides users at ground level with a higher signal than APs see to each other
Adaptive radio management functionality is improved for auto-calibration of the RF network and automation of ongoing operations.
A more detailed look at the RF properties of standard omni antennas and squint/downtilt omni antennas may be found in Appendix A, “RF Concepts and Terminology”.
Side Coverage with Directional AntennasDirectional antennas are used to focus the antenna pattern in both the horizontal and vertical planes. These antennas are particularly useful for long range bridging and outdoor applications, but there are some cases in indoor retail environments where directional antennas have advantages.
Effect of Gain on Vertical Beamwidth
Directional antennas achieve higher gain by focusing their pattern into an increasingly tighter region of 3D space. For example, a 90-degree directional antenna with higher gain will have a tighter vertical pattern than a lower gain antenna with the same 90-degree horizontal antenna pattern. In a typical retail environment the vertical pattern can be very important to reliable coverage. Figure 46 shows a
Ret
ail_
135
60°
90°30°
26 ft43 ft
60 ft
15 ft
25 ft
35 ft
35 ftsin(30°)
= 70 ft=
= 50 ft=
= 30 ft=
25 ftsin(30°)
15 ftsin(30°)
Retail Wireless Networks Validated Reference Design | Solution Guide RF Design | 93

comparison of a higher gain 13 dBi directional antenna and a lower gain 5 dBi antenna that has a wider vertical beamwidth. Both antennas are modeled at a 30 foot height. (Note that these illustrations do not factor attenuation due to obstructions in the environment, such as shelving.)
Figure 46 Wall-Mounted Antennas: Frozen Warehouse 3D Elevation View
The 3D view shows the difference in vertical coverage clearly. The use of the high-gain antenna results in substantially less vertical coverage, which is a problem especially close-in to the antenna as the signal does not yet reach the floor. When viewed from the overhead, or azimuth, perspective, we can see that very little of the main lobe of the high-gain antenna reaches the ground. The darker areas do not contact the ground, with the coverage hole of the higher-gain antenna extending nearly 25% of the way down the aisle.
Figure 47 Wall-Mounted Antennas: Frozen Warehouse 3D Azimuth View
94 | RF Design Retail Wireless Networks Validated Reference Design | Solution Guide

In general, for indoor environments, including warehouses, antennas with gains over 7 dBi have the potential to cause issues due to their narrow vertical beamwidth and resulting limited coverage due to the tightly focused antenna pattern. In most cases, the use of lower gain antennas results in more predictable and reliable coverage and avoids creating coverage holes such as the one shown in Figure 47.
Harmful Side Effects of High-Gain Directional Antennas
An important side effect of increasing the EIRP of APs in environments with significant sources of RF reflection, such as warehouses, is that the amount of multipath distortion also increases in direct proportion to the EIRP. This is a particular problem for facilities that handle containers, due to the corrugated shape of the container sides. The length of the corrugations is very close to the wavelengths of 2.4 GHz/5 GHz signals, which can significantly increase the distortion effect (as compared to simple flat reflective surfaces). This is also true on the client side. Reducing the EIRP on either side reduces the amount of multipath distortion created by the environment.
Harmful Side Effects of Wide Horizontal Beamwidth Antennas
Aruba ARM technology makes dynamic power and channel decisions based on the RSSI of neighboring APs. When mounting several APs along a wall in a warehouse environment to provide coverage down the aisles, do not select directional antennas that have horizontal beamwidths greater than 60 degrees. This assures that the AP-to-AP signal strength is reduced and minimizes the signal lost to absorption on the left and the right of each AP.
Coverage Reliability PlanningIn practice, a radio signal may encounter many objects in its transmission path, and the signal undergoes additional attenuation depending on the absorption characteristics of the objects. There are many types of objects, including fixed, mobile, and transient objects that absorb RF energy and cause RF attenuation. Similar to the free-space propagation loss, higher frequencies attenuate much faster than lower frequencies. Therefore, 5 GHz RF signals experience higher attenuation than 2.4 GHz RF signals.
Signal Propagation Inside of Retail Facilities
Signal propagation is a particular challenge in distribution centers, warehouses, and large footprint stores that have racking or shelving systems that extend almost to ceiling height. RF signal loss can vary from aisle to aisle, and from day to day due to differences in the goods stored inside the building.
The following table shows the loss (or attenuation in dB) introduced by various goods stored in retail environments. Most of the attenuation numbers are shown as a range, as the actual value depends on the exact frequency on transmission, and the thickness as well as the specific type of material used. Moreover, the numbers measured at different locations do not always agree, as the measurement conditions may be different. Liquid or food products with significant water content are a particular source of RF loss.
Table 17 Attenuation of Common Retail Goods
2.4 GHz
Dry Goods 10–20 dB
Wet/Frozen Goods 20–30 dB
Freezer Walls 20 dB
Retail Wireless Networks Validated Reference Design | Solution Guide RF Design | 95

The following heat map shows the effect of shelving on signal propagation in a typical big-box retail store. The radio signal continues strongly down the aisle where the AP is located, while we see a rapid fall-off of actual measured RSSI due to attenuation between the aisles.
Figure 48 Elliptical Cell Effect of RSSI Falloff Due to Dry Goods Attenuation
In a high-shelving environment, the normal circular AP cell shape essentially becomes elliptical. This effect can be seen using Aruba 3D antenna modeling tools. In the following example, APs have been placed at alternating sides of every other aisle, one-third of the way down. The cell edge isocontour is computed using a loss value of 20 dB for each aisle and an SNR target of 15 dB.
Signal Propagation Outside of Retail Facilities
In a similar manner, the materials used to construct retail facilities also produce variable loss in RF signals. The attenuation numbers for concrete walls are somewhat controversial. This is because there are different types of concrete materials in use in different parts of the world, and the thickness and coating of each type differs depending on whether it is used in floors or in interior or exterior walls. Brick walls usually have attenuation at the lower end of the range shown in Table 18.
Table 18 Attenuation of Common Building Materials
2.4 GHz 5 GHz
Interior drywall 3-4 dB 3-5 dB
Cubicle wall 2-5 dB 4-9 dB
Wood door (Hollow - Solid) 3-4 dB 6-7 dB
Brick/Concrete wall 6-18 dB 10-30 dB
Glass/Window (not tinted) 2-3 dB 6-8 dB
Double-pane coated glass 13 dB 20 dB
Steel/Fire exit door 13-19 dB 25-32 dB
Attenuation creates elliptical
cell shape
AP location
Rapid signal falloff between
aisles
Heat Map of Single AP in High-Shelving Store
RF Model of Staggered Elliptical Cells
96 | RF Design Retail Wireless Networks Validated Reference Design | Solution Guide

In outdoor areas, trees can have significant impact on RF propagation. The attenuation caused by trees varies significantly depending on the shape and thickness of the foliage. The rule of thumb is about 1.2 dB of attenuation per meter for 5 GHz and about 0.5 dB per meter for 2.4 GHz. However, rain, snow, and fog attenuation outdoors is very small for frequencies under 10 GHz. The rain attenuation at 5 GHz is barely noticeable (< 1 dB per kilometer).
Variability of Goods
Inventories change on a daily basis, and store layouts or merchandising plans may vary on a weekly, monthly, or seasonal basis. The attenuation between an AP and the same client in the same spot may change as a result. For this reason, Aruba strongly recommends that retail customers plan for a minimum bandwidth capacity of 18 Mbps (e.g., SNR >=9 dB). This permits some variability in the loss (absorption) characteristics of the goods stored.
In addition, uncertainty in RF models increases with each obstruction between an AP and a client. Every row of goods causes a discontinuity in a wireless signal that varies with the construction of the shelving and the goods currently stored on it. Each discontinuity increases the risk in the RF design, as illustrated in Figure 49:
Figure 49 Signal Loss Across Aisles Varies with Stored Goods
Both the north and south ends of the above aisles have an average RF loss per aisle of 18.75 dB. However, differences in the order of the stacking of the goods causes more rapid loss at the south ends of the aisles, resulting in an unusable signal after aisle #2. By contrast, the north end of the row does not lose coverage until aisle #4. Therefore, using average loss values to make general coverage predictions is inherently risky when planning RF coverage in retail facilities. Each stack of goods is more appropriately viewed as a discontinuity that adds uncertainty and risk during the planning process for any coverage “across” the direction of the aisles. Thus, the more coverage “across” aisles is relied upon, the more risky the design will be for coverage reliability if the goods stored vary in density from day to day.
Ret
ail_
152
Average Loss perAisle of 18.75dB
-10dB -15dB -20dB -30dB
-10dB -30dB -20dB -15dB
SignalLost
SignalLost
North
South
Retail Wireless Networks Validated Reference Design | Solution Guide RF Design | 97

AP Placement Strategy for Warehouses (Overhead Coverage)
Aruba strongly recommends the use of overhead coverage with the following design choices in floor to ceiling shelving environments:
For dry goods, assume reliable coverage can be provided by the next aisle over, but not more than 1 aisle. This allows up to approximately 20 dB loss in goods stored without reduction in coverage reliability.
Use downtilt squint omnidirectional antennas when ceilings are above 20 ft (standard low-gain / integrated omnis such as AP65 and AP70 are acceptable for lower heights).
Mount APs one-third of the way down the aisle, placed from alternating ends.
An example using these design rules can be visualized as shown in Figure 50.
Figure 50 Overhead Coverage Example in a Warehouse
This design strategy provides overlapping coverage through goods on the shelving from adjacent row APs. Adjustments can be made when shelving is not floor to ceiling and clear LOS is available to more than 1 row over.
150 foot minimum separation between every fourth AP
AP in every other row approximately one-third from alternating end of aisle
98 | RF Design Retail Wireless Networks Validated Reference Design | Solution Guide

AP Placement Strategy for Warehouses (Side Coverage)
Overhead coverage provides more reliable RF coverage in retail facilities as compared with side coverage. However, overhead coverage is not practical in certain areas, such as freezers.
Cold and frozen storage warehouses pose a special challenge to the wireless designer for several reasons. First, the RF attenuation of frozen items is higher than for dry goods. Second, the available mounting locations are extremely limited and typically include just the walls. Third, APs may not function at the temperatures in use, requiring the radio equipment to be located outside the freezer with costly penetrations to run antennas inside.
In this case, choose one of the following to cover such environments:
Use low-gain, wide-vertical beamwidth antennas, such as 60 degree sector antennas, when wall mounting is desired over ceiling mount APs.
Place one AP-antenna pair at the end of alternating aisles, with a region of overlap in the center.
For cold or frozen storage, every row requires one AP with clear line of sight to the antenna. Typically, cold or frozen loss is too high (30 dB) to assume reliable coverage across aisles for the distances required.
This design strategy is depicted in the diagram of a storage freezer in Figure 51. Forty APs have been placed, half on each end of the freezer. 60-degree horizontal beamwidth antennas have been selected to minimize reflections and AP-to-AP interference.
Figure 51 Side Coverage Example in a Freezer
Retail Wireless Networks Validated Reference Design | Solution Guide RF Design | 99

AP Placement for Large Footprint Stores
In general, Aruba recommends the following best practices when placing APs for a retail store deployment:
DO maximize LOS opportunities from corners wherever possible. If the AP budget allows it, we recommend having one AP in opposite corners of a store to create LOS down all four sides of the store.
Figure 52 Use Opposite Corners to Obtain RF Line-of-Sight on Store Perimeter
DO place interior APs 10-15 feet down from the endcap, or one-third of the way down the aisle, whichever is less. This placement provides smoother RSSI gradients in the center of the store and avoids areas of weaker signal at the end of a long aisle.
Figure 53 Use Interior APs to Provide Uniform SNR in Center of Store
Ret
ail_
136
DO DO NOT
Ret
ail_
137
DO DO NOT
100 | RF Design Retail Wireless Networks Validated Reference Design | Solution Guide

DO NOT base coverage strategy on diagonal coverage across rows. Instead, follow the natural aisle pattern of the store, using a mix of corner and interior APs to create uniform RSSI to handheld clients. Signal attenuation on diagonals is higher.
Figure 54 Use the Natural Pattern of the Store and Minimize Aisle Crossings
DO NOT put an AP above a shelf to straddle two aisles. Place APs in the center of aisles wherever possible to create a clear LOS to clients.
AP Placement for Critical Coverage Areas
In addition, most retail stores contain certain areas that must have explicit LOS coverage. For planning purposes, these are called critical coverage areas. Always start the RF plan by placing these APs first, before proceeding with general coverage for the rest of the store. After the critical coverage area APs have been selected, it becomes much easier to decide how to lay out the rest of the store.
Common critical coverage areas in retail stores include:
Receiving office
Use case – This is the receiving office, where scanners are often used by store personnel to process shipments.
How to Cover – AP #1 in every store should have direct LOS to the receiving office.
Stockroom and freezer entrances
Use case – Goods are commonly stored along the walls in a stockroom. In stores that handle cold or frozen merchandise, the freezers often open into the stockroom. Store employees with handheld scanners must have reliable performance when scanning items stored in these areas. For design safety, consider the stockroom as RF-isolated from the sales floor area. For example, in grocery stores, stockrooms are separated by a continuous line of coolers, freezers, and working spaces such as the meat department.
How to cover - For freezers, bleed coverage is usually acceptable, as scanning will only occur when the doors are open. However, stockroom APs should be placed to maximize LOS to the freezer entrances to the maximum extent possible.
Refrigerated and frozen food aisles
Use case – Store employees with handheld scanners require consistent device response at any height (crouching, standing) inside coolers or with freezer doors open and guns inside the freezer. Attenuation between freezer aisles is significantly higher than in dry goods areas.
How to cover – One AP must always be placed in the frozen food section, approximately 10-15 feet in from the endcap.
Ret
ail_
138
DO DO NOT
Retail Wireless Networks Validated Reference Design | Solution Guide RF Design | 101

Retail Deployment Scenario ExamplesArmed with the appropriate AP densities and an understanding of antenna placement strategies, it is time to apply them to common retail environments.
Large Footprint Store (Low Shelving)The following is an RF Plan for a large footprint store typical of the grocery industry that incorporates several of the design guidelines discussed previously. This store is 56,000 square feet and requires 8 APs. It has a separate receiving area in the back with a large stockroom. It also has freezers, coolers, and other hardened areas that obstruct RF signal. The APs are numbered in the order they were placed.
Figure 55 Sample RF Plan for a Large Footprint Store
Successfully planning a retail store requires finding the right balance among numerous variables. To simplify the process, always start with the Critical Coverage areas. Once these are handled, the strategy for the rest of the store quickly becomes obvious.
Ret
ail_
158
1 2
3
4
57
6
8
AP #2 coversStockroom nearFreezer Doors
Last AP (#8) incorner oppositeAP #3
AP #1 withLOS toReceivingOffice andStockroom
Interior APs15’ in fromendcaps onalternatingends
Anchoredfrom FrozenAisle AP
AP #3 givesLOS intoBakery, plusdown ends
AP #4 inFrozen Aisle(also withLOS to Deli)
Avoid Wi-FiHotspot on Ch. 6
102 | RF Design Retail Wireless Networks Validated Reference Design | Solution Guide

Small Footprint Store (Low Shelving)A small retail store or a convenience store will often have the following characteristics:
Low ceilings
Relatively small sales floor area, with good LOS throughout store
Small stockroom in the back
May or may not have a separate receiving area.
Coverage in a small store will be achieved with a low number of APs, usually with integrated antennas. Typically these APs can be placed anywhere near the center of the sales floor and coverage will be adequate. Here are placement rules for stores requiring up to two APs.
AP #1. Place near center of stockroom
Should have clear LOS to receiving area if there is a separate entrance
AP #2. Place in center of store
Should have maximum clear LOS possible down aisles of store
For stores large enough to require up to 4 APs:
AP #3. Place one-third of the way between the upper right and lower left corner of store
AP #4. Place two-thirds of the way between AP #3 and AP #4
In all cases, the APs on the sales floor should have maximum clear LOS possible down store aisles. Figure 56 shows a sample RF plan for a small footprint store.
Figure 56 Sample RF Plan for a Small Footprint Store
Ret
ail_
159
1
2
Retail Wireless Networks Validated Reference Design | Solution Guide RF Design | 103

Warehouse (High Shelving)This example highlights a typical dry goods storage warehouse. The design choices would be equally valid in any facility with high ceilings that also has shelving or racking that extends nearly all the way up. The sample facility is 400x1400 feet, and contains 33 APs. The AP model has external antenna ports, and an Aruba downtilt omni is mounted next to each AP.
Figure 57 Outdoor 3D Model of Sample Warehouse
Figure 58 Sample RF Plan for a Warehouse
104 | RF Design Retail Wireless Networks Validated Reference Design | Solution Guide

Retail Wireless Networks Validated Reference Design | Solution Guide
Chapter 7Authentication and Security
This section introduces and explains the following topics:
PCI compliance. PCI compliance ensures secure credit card transactions and controls fraud. This is extremely important for any retailers that accept credit cards.
Wireless Intrusion Detection System (WIDS) operation. A WIDS is a PCI requirement. This section also explains how the Aruba system detects and contains rogue APs.
Service Set Identifier (SSID) selection. Use an SSID to identify an access point (AP) and its associated network. Different SSIDs are associated with different levels of network access privilege.
Authentication and encryption methods. Authentication verifies that user credentials are correct, and encryption prevents listeners from capturing data sent through the airwaves.
Roles. Roles determine how your wireless network is set up for mobile data terminal, voice handset, and guest access roles.
This section assumes that Table 2 and Table 5 from Chapter 3, “Defining WLAN Requirements for Retailers” have been completed.
PCI Compliance RequirementsThe PCI Data Security Standard (DSS) consolidates the varied security requirements of the different credit card brands. The first iteration of the standard, PCI DSS v1.0 went into effect in January, 2005. On January 1, 2007, a new revision called PCI DSS v1.1 was put in place, replacing PCI DSS v1.0 and the VISA CISP standard. PCI DSS v1.1 includes new requirements that reflect recent changes in the security landscape, and that offer alternatives in the form of merchant “compensating controls” to make compliance more practical.
On October 1, 2008, the PCI council released a second update to the PCI standard called PCI DSS v1.2. The new standard supersedes v1.1 starting January 1, 2009, and all new audits conducted after this date must adhere to the PCI DSS v1.2 specification. PCI DSS v1.2 clarifies v1.1 requirements that were previously open to interpretation. The new standard also updates requirements based on what the industry has learned about security breaches in the intervening years since v1.1 was issued.
The PCI DSS defines six primary goals, 12 major requirements, and over 200 sub-requirements. The following table summarizes the goals and requirements.
Table 19 PCI Compliance Requirements
Goal Requirements
Build and Maintain a Secure Network
Requirement 1: Install and maintain a firewall configuration to protect cardholder data.
Requirement 2: Do not use vendor-supplied defaults for system passwords and other security parameters.
Protect Cardholder Data Requirement 3: Protect stored cardholder data. Requirement 4: Encrypt the transmission of cardholder data across open,
public networks.
Maintain a Vulnerability Management Program
Requirement 5: Use and regularly update anti-virus software. Requirement 6: Develop and maintain secure systems and applications.
Authentication and Security | 105

You can download the complete PCI DSS v1.2 standard from this web URL: https://www.pcisecuritystandards.org/security_standards/download.html?id=pci_dss_v1-2.pdf
What Are the Differences between PCI DSS v1.1 and v1.2?PCI DSS v1.2 includes clarifying modifications to several requirements that more precisely explain the controls that need to be implemented. Wireless LAN security is one of the topics that was modified. The following excerpt summarizes the updated wireless LAN security objective:
“If wireless technology is used to store, process, or transmit cardholder data (for example,
point-of-sale transactions, “line-busting”), or if a wireless local area network (LAN) is
connected to or part of the cardholder data environment (for example, not clearly separated by
a firewall), the PCI DSS requirements and testing procedures for wireless environments apply
and must be performed as well…”
PCI DSS v1.2 compliance necessitates using firewalls, encryption, authentication, and wireless LAN intrusion detection (IDS) for all wireless LANs. Some of these safeguards are also required even if the wireless LAN is not used to transmit cardholder data. The wireless LAN requirements that were modified as a part of PCI DSS v1.2 include explicit firewall wireless LAN configuration, elimination of WEP, and the use of wireless IDS:
1. Firewall wireless LAN. Requirement 1.2.3 states that a perimeter firewall must be used between any wireless LANs and networks that transmit cardholder data. The term “firewall” is defined to include “stateful inspection” or “dynamic packet filtering.”
2. WEP is forbidden. Requirement 4.1.1 prohibits WEP security starting March 31, 2009 for all new wireless LANs, and starting June 30, 2010 for all existing wireless LANs. This requirement applies to all wireless LANs transmitting or otherwise associated with cardholder data.
3. Wireless IDS is mandatory. Requirement 11.1 states that all stores, warehouses, and offices that have credit and debit card processing systems must be analyzed or scanned for unauthorized wireless devices. Wireless IDS systems are now an approved alternative to quarterly handheld wireless analyses.
We will look at these requirements in detail later in this chapter. A summary of all differences between PCI DSS v1.1 and v1.2 is available at https://www.pcisecuritystandards.org/pdfs/pci_dss_summary_of_changes_v1-2.pdf.
Implement Strong Access Control Measures
Requirement 7: Restrict access to cardholder data by business need-to-know.
Requirement 8: Assign a unique ID to each person with computer access. Requirement 9: Restrict physical access to cardholder data.
Regularly Monitor and Test Networks
Requirement 10: Track and monitor all access to network resources and cardholder data.
Requirement 11: Regularly test security systems and processes.
Maintain an Information Security Policy
Requirement 12: Maintain a policy that addresses information security.
Table 19 PCI Compliance Requirements (Continued)
Goal Requirements
106 | Authentication and Security Retail Wireless Networks Validated Reference Design | Solution Guide

PCI Requirements for Wireless LANs: Quick ReferencePCI requirements specific to wireless LANs have been sorted into three levels of implementation in the following illustration. These requirements correspond to the three PCI Compliance Categories introduced in Chapter 3, “Defining WLAN Requirements for Retailers” . Each category has a different risk profile and a distinct level of mandatory security controls. The PCI DSS v1.2 requirements that apply to merchants in each of the three categories are shown in Figure 59.
Figure 59 PCI Risk Profiles and Compliance Categories
In Chapter 3, “Defining WLAN Requirements for Retailers” , Aruba-based solutions to fully meet each of the three compliance categories were introduced:
Category 1 – Centralized wireless IDS monitoring with AirWave
Category 2 – Distributed wireless IDS using Aruba Air Monitors and Controllers
Category 3 – Secure WLAN with wireless IDS and role-based access control
Organizations that choose PCI compliance category 3 will deploy a secure Aruba thin AP solution at selected facilities. The solution must comply with requirement 7.2 regarding role-based access control, and requirement 1.2.3 having to do with wireless perimeter firewalls.
Role-Based Access ControlRequirement 7.2: Establish an access control system for systems components with multiple users
that restricts access based on a user’s need to know, and is set to “deny all” unless specifically
allowed.
This requirement addresses the recommended security practice of “principle of least privilege”, that restricts access to data, systems, and networks based on a user’s identity. Aruba enforces the principle of least privilege by identifying users or devices, placing them into separated roles, and permitting or denying access to network resources or protocols based on those roles. As described earlier, this capability allows a Point of Sale (POS) terminal to be treated differently than a manager on a laptop, a
Ret
ail_
118
Category 1
Risk Profile
Level of Security Required
Low High
Low High
No Wireless LANsIn Use
Category 2
Wireless LANs In Use,No Cardholder Data Are
Transmitted OverWireless
Category 3
Wireless LANs In Use,Cardholder Data Are
Transmitted OverWireless
7.2:10:
Role-Based AccessMonitor Access
11.1: Wireless IDS
1.1.2:1.2.3:2.1.1:2.2:4.1.1:6.1:9.1.3:
Inventory WLANsFirewall WirelessDon’t Use DefaultsStandard Config.No WEPUpdate PatchesPhysical Security
11.1: Wireless IDS
1.1.2:1.2.3:2.1.1:2.2:4.1.1:6.1:9.1.3:
Inventory WLANsFirewall WirelessDon’t Use DefaultsStandard Config.No WEPUpdate PatchesPhysical Security
11.1: Wireless IDS
Retail Wireless Networks Validated Reference Design | Solution Guide Authentication and Security | 107

public kiosk, or an employee on a shared-use terminal. Aruba logically separates all traffic and permits access only to the level specifically granted by the administrator based on business needs.
Aruba wireless LANs also integrate with existing user databases to look up and enforce access privileges on managed devices. For unmanaged devices, the Aruba wireless LAN pushes a captive portal Web page to identify the user and restrict access for specified users, locations and time. We will look at this in some detail in SSIDs, VLANs, and Role Derivation for Secure WLANs on page 112.
For administrative and IT access to wireless LAN equipment, AirWave Wireless Management Suite (AWMS) offers flexible, role-based administrative access so the level of access available to each IT administrator correlates to job function, (e.g., read-write privileges for network engineers or read-only privileges for the help desk).
Wireless Perimeter FirewallRequirement 1.2.3: Install perimeter firewalls between any wireless networks and the cardholder
data environment, and configure these firewalls to deny or control (if such traffic is necessary for
business purposes) any traffic from the wireless environment into the cardholder data environment.
This requirement mandates the installation and maintenance of a firewall to prevent unauthorized access and hacker attacks originating from a wireless network and targeting the network carrying cardholder data.
Aruba is the only wireless vendor to integrate an ICSA-certified stateful firewall into its wireless LAN, ensuring that parameters such as security, suitability for a task, default configuration, and logging/audit trails have been validated. The firewall meets PCI DSS requirements for stateful inspection (as specified in requirement 1.3.6).
The default posture of an Aruba firewall is to deny all traffic from the wireless network. Firewall rules to permit traffic are applied on a “role” basis, with each user and device on the network mapped to a specific role. Roles identify the purpose, access rights, quality of service (QoS), bandwidth limits, time-of-day, and location restrictions assigned to a device or user. Examples of roles include:
POS device in a retail store that must send credit and debit card data, inventory status, and price updates, and for which the Aruba role-based firewall restricts sources and destinations of specific protocols;
Store manager on a laptop who may require access to in-store or corporate database servers and general Internet access, but does not have access to cardholder data systems;
PC-based kiosk for use by the general public that is allowed internal and external web browsing, but is denied all other network access;
Clerk logged on to a shared workstation with privileges necessary to do his or her job, but no access to the Internet or central servers or databases in which cardholder data are stored;
Inventory tracking barcode scanner that is allowed to send and receive bar code data, but does not access corporate databases, including credit card data.
Configuring Roles for Different Users on page 118 describes how this is done in an Aruba infrastructure. The role of a user or device is typically determined through authentication. Authentication through a secure method such as Wi-Fi Protected Access (WPA2) is preferred, but MAC address authentication may be used for less capable devices. Once the role of a user or device is assigned, the corresponding firewall policies are applied to all network traffic to and from the wireless device. The firewall policies are tightly bound to the user’s identity and authentication state to prevent man-in-the-middle and spoofing attacks. The user state information is also coupled with Aruba wireless IDS to provide integrated protection against a host of wireless attacks.
108 | Authentication and Security Retail Wireless Networks Validated Reference Design | Solution Guide

Wireless Intrusion Detection System Operation and DesignThis section discusses the operation of the Aruba wireless intrusion detection system (WIDS) and how it meets the requirements for a PCI-compliant WIDS configuration for retail environments.
Typical WIDS Design for Retail OrganizationsWireless IDS is a requirement of all three PCI DSS v1.2 risk profiles and compliance categories.
Requirement 11.1: Test for the presence of wireless APs by using a wireless analyzer at least
quarterly or deploying a wireless IDS/IPS to identify all wireless devices in use.
Requirement 11 states that regular tests and evaluations of systems must be conducted to make sure that new vulnerabilities are not present. As a sub-requirement, 11.1 mandates periodic monitoring of wireless networks and devices in order to detect the presence of unauthorized wireless networks or devices that open a back door to the card holder data environment. Two approaches to meeting this requirement are described:
1. Using a handheld wireless analyzer to survey every location (stores and warehouses) to inventory all devices in use;
2. Using a wireless IDS system to scan every location automatically and create an inventory of all devices in use.
WIDS Design for Compliance Category 1
Category 1 compliance may be achieved using a central management system instead of deploying sensors at each retail location. The AWMS offers a user session report that provides a complete list of every device and user (by username, MAC address, SSID, etc.) that connects to an Aruba wireless LAN or a third party wireless LAN within a given period. The AWMS new user report lists any new devices (those that were not previously detected) that have connected to the network within a specified period. In addition, the AWMS RAPIDS rogue AP detection module analyzes both wired and wireless networks and raises an alert upon detecting any unknown, unauthorized APs on the network.
WIDS Design for Compliance Categories 2 and 3
Categories 2 and 3 require dedicated or hybrid mode air monitors to be installed at all retail locations. These AMs need only perform detection and classification; whether to take action to contain rogues is up to the retailer to decide. The number of air monitors per location was determined in Chapter 6, “RF Design” .
Detection of Rogue APsBefore an AP can be classified as a rogue and consequently contained, the AP must first be detected, along with any stations that associate to it, and the wired devices with which it attempts to communicate. Detection is the key to all rogue AP functionality.
To detect wireless devices, both APs and air monitors (AMs) scan the air looking for new devices and keep tabs on existing devices. How APs and AMs scan is quite different.
Dedicated AMs always scan. They scan every possible channel in order, even channels outside of the allowed regulatory domain. They scan each channel for one second. This setting is not configurable. This is long enough to easily see a one-second periodic ping from a client device each time a channel is scanned. AMs will remain on a channel to contain a rogue AP for up to 32 seconds at a time.
Unlike AMs, hybrid-mode or scanning APs only scan the channels within the regulatory domain. This means that an AP will never detect a wireless device that is operating on an illegal channel. Because it is possible to carry APs across international borders and even configure an illegal channel on some APs, you should keep this in mind when deploying APs without any AMs.
Retail Wireless Networks Validated Reference Design | Solution Guide Authentication and Security | 109
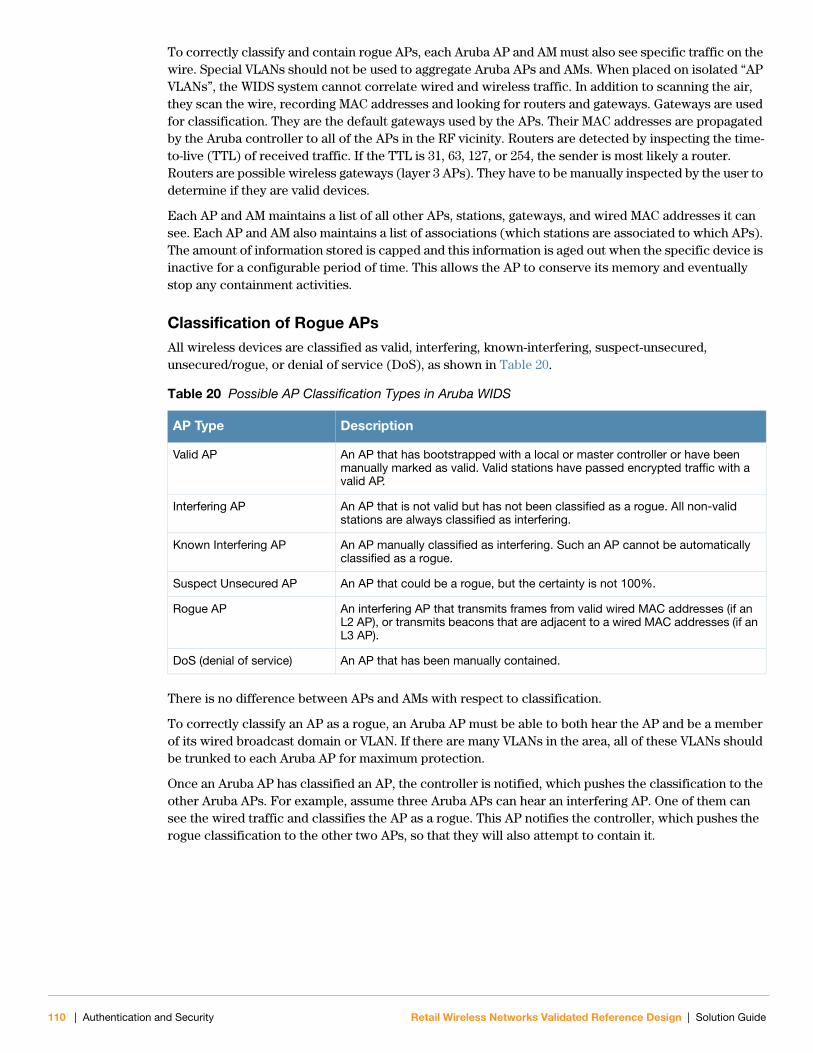
To correctly classify and contain rogue APs, each Aruba AP and AM must also see specific traffic on the wire. Special VLANs should not be used to aggregate Aruba APs and AMs. When placed on isolated “AP VLANs”, the WIDS system cannot correlate wired and wireless traffic. In addition to scanning the air, they scan the wire, recording MAC addresses and looking for routers and gateways. Gateways are used for classification. They are the default gateways used by the APs. Their MAC addresses are propagated by the Aruba controller to all of the APs in the RF vicinity. Routers are detected by inspecting the time-to-live (TTL) of received traffic. If the TTL is 31, 63, 127, or 254, the sender is most likely a router. Routers are possible wireless gateways (layer 3 APs). They have to be manually inspected by the user to determine if they are valid devices.
Each AP and AM maintains a list of all other APs, stations, gateways, and wired MAC addresses it can see. Each AP and AM also maintains a list of associations (which stations are associated to which APs). The amount of information stored is capped and this information is aged out when the specific device is inactive for a configurable period of time. This allows the AP to conserve its memory and eventually stop any containment activities.
Classification of Rogue APsAll wireless devices are classified as valid, interfering, known-interfering, suspect-unsecured, unsecured/rogue, or denial of service (DoS), as shown in Table 20.
There is no difference between APs and AMs with respect to classification.
To correctly classify an AP as a rogue, an Aruba AP must be able to both hear the AP and be a member of its wired broadcast domain or VLAN. If there are many VLANs in the area, all of these VLANs should be trunked to each Aruba AP for maximum protection.
Once an Aruba AP has classified an AP, the controller is notified, which pushes the classification to the other Aruba APs. For example, assume three Aruba APs can hear an interfering AP. One of them can see the wired traffic and classifies the AP as a rogue. This AP notifies the controller, which pushes the rogue classification to the other two APs, so that they will also attempt to contain it.
Table 20 Possible AP Classification Types in Aruba WIDS
AP Type Description
Valid AP An AP that has bootstrapped with a local or master controller or have been manually marked as valid. Valid stations have passed encrypted traffic with a valid AP.
Interfering AP An AP that is not valid but has not been classified as a rogue. All non-valid stations are always classified as interfering.
Known Interfering AP An AP manually classified as interfering. Such an AP cannot be automatically classified as a rogue.
Suspect Unsecured AP An AP that could be a rogue, but the certainty is not 100%.
Rogue AP An interfering AP that transmits frames from valid wired MAC addresses (if an L2 AP), or transmits beacons that are adjacent to a wired MAC addresses (if an L3 AP).
DoS (denial of service) An AP that has been manually contained.
110 | Authentication and Security Retail Wireless Networks Validated Reference Design | Solution Guide

Containment of Rogue APsThere are two ways to contain rogue APs. One is in the air using deauths (a deauth is an 802.11 control frame that instructs a wireless device to terminate its session). The second is on the wire using ARP poisoning. Using both increases the odds that the rogue AP will in fact be successfully contained. They can be enabled separately if desired.
Wireless Containment
Most containment is done through the air. When an AP is classified as a rogue, Aruba APs and AMs that can hear the AP will send wireless deauths to the AP and any associated stations. Specifically, the Aruba AP or AM will send a deauth to the AP on behalf of each station, and a deauth to each station on behalf of the rogue AP. The deauth frames are sent in response to data and a as a subset of management frames that are seen between the AP and the client.
APs and AMs contain rogues differently because they scan differently. If the rogue-AP-aware Adaptive Radio Management option is disabled, an AP will only contain a rogue when it scans the channel that the rogue is on. If the ARM option is enabled, the AP will switch to the channel that the rogue is on and contain it by continually sending deauths. The ARM option assignment must be enabled. Also, if a rogue AP is already on the channel the AP is on, the AP will not switch to another channel where another rogue might reside.
Wireless containment only works when the rogue AP is servicing a channel within the Aruba AP’s regulatory domain. It is illegal to send wireless frames on channels outside the regulatory domain. Wired containment must be used to contain rogues outside the regulatory domain.
Wired Containment
For wired containment, attempts are made to contain the station associated to the rogue AP. Each IP address (AP or station) is contained by ARP poisoning every second. Specifically, an ARP request is sent for the AP’s default gateway from the IP address being contained, and the ARP response is even sent on behalf of the default gateway. All relevant MAC addresses are locally administered so that the traffic will be dropped. This exchange attempts to fool both the device being contained and the default gateway. This is also known as a man-in-the middle (MITM) attack against the rogue AP.
Retail Wireless Networks Validated Reference Design | Solution Guide Authentication and Security | 111
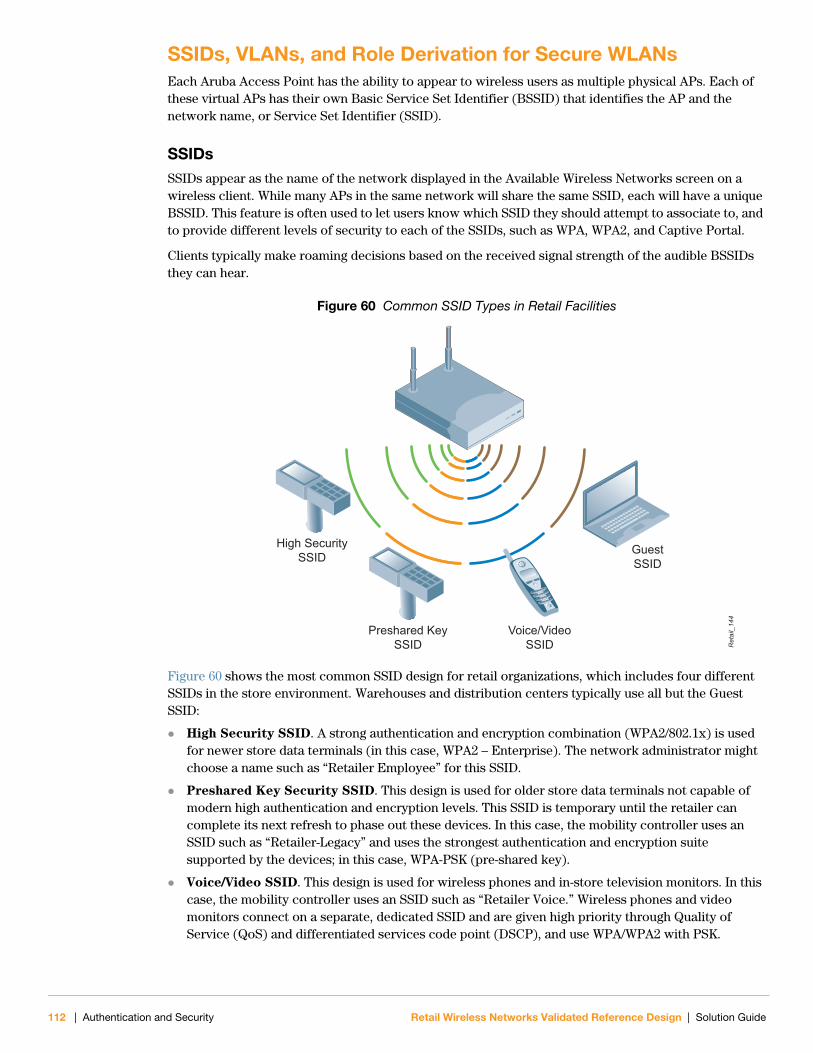
SSIDs, VLANs, and Role Derivation for Secure WLANsEach Aruba Access Point has the ability to appear to wireless users as multiple physical APs. Each of these virtual APs has their own Basic Service Set Identifier (BSSID) that identifies the AP and the network name, or Service Set Identifier (SSID).
SSIDsSSIDs appear as the name of the network displayed in the Available Wireless Networks screen on a wireless client. While many APs in the same network will share the same SSID, each will have a unique BSSID. This feature is often used to let users know which SSID they should attempt to associate to, and to provide different levels of security to each of the SSIDs, such as WPA, WPA2, and Captive Portal.
Clients typically make roaming decisions based on the received signal strength of the audible BSSIDs they can hear.
Figure 60 Common SSID Types in Retail Facilities
Figure 60 shows the most common SSID design for retail organizations, which includes four different SSIDs in the store environment. Warehouses and distribution centers typically use all but the Guest SSID:
High Security SSID. A strong authentication and encryption combination (WPA2/802.1x) is used for newer store data terminals (in this case, WPA2 – Enterprise). The network administrator might choose a name such as “Retailer Employee” for this SSID.
Preshared Key Security SSID. This design is used for older store data terminals not capable of modern high authentication and encryption levels. This SSID is temporary until the retailer can complete its next refresh to phase out these devices. In this case, the mobility controller uses an SSID such as “Retailer-Legacy” and uses the strongest authentication and encryption suite supported by the devices; in this case, WPA-PSK (pre-shared key).
Voice/Video SSID. This design is used for wireless phones and in-store television monitors. In this case, the mobility controller uses an SSID such as “Retailer Voice.” Wireless phones and video monitors connect on a separate, dedicated SSID and are given high priority through Quality of Service (QoS) and differentiated services code point (DSCP), and use WPA/WPA2 with PSK.
Ret
ail_
144
High SecuritySSID
Preshared KeySSID
GuestSSID
Voice/VideoSSID
112 | Authentication and Security Retail Wireless Networks Validated Reference Design | Solution Guide

Guest SSID. SSID is used to provide guest access to the network for customers or vendors. This SSID will not run any encryption and will require guests to authenticate using the Captive Portal capability that is built into the Aruba Mobility Controller. The guest users can authenticate against a centralized authentication server or the built-in local database on the mobility controller.
The strongest available level of security for a given class of devices should always be used. Use Table 2 on page 24 to select the appropriate authentication and encryption level for each SSID. Always update the firmware or operating system to the most current version. You can use the Aruba interoperability matrix as a handy reference to determine device capabilities (see Appendix B, “Client Device Interoperability Matrix”).
VLANsNetwork flow, security, and performance policies are applied to all traffic from users who have successfully authenticated into any of the four SSIDs. You define policies by means of a role derivation process utilizing the configuration profiles in the AP group assigned to that AP. You place the high-security and legacy users on a VLAN with access to internal network resources; you can further refine this setup with sophisticated firewall rules applied on a per-packet basis. For example, a dual-mode Wi-Fi voice device is placed on a voice-only VLAN and only permitted to contact a SIP server and transmit RTP traffic. Any attempt by the device to do something else would automatically ‘blacklist’ that device from the network. Finally, guest users are placed onto a guest-only VLAN with access only to the default gateway leading to the Internet. No other store or company network access is allowed.
Role DerivationAruba uses the term role derivation to describe the process of determining which role is to be assigned to a user. The system can take into account the user’s credentials, location, time of day, and authentication type when deciding which role to assign. This system can be as detailed or as general as the administrator prefers. The role derivation process determines the following:
What class of service is provided to user traffic
Which firewall ACLs are applied to the user’s traffic
Which VLAN the user is placed into
For detailed information on configuring Roles and Policies, see Volume 4 of the Aruba OS User Guide.
Secure Authentication MethodsEach SSID must have an associated authentication method. The most common authentication methods for retail WLANs are WPA2 or WPA with PSK, and captive portal. 802.1x is strongly recommended for retail store managers and all other retail employees who have centrally managed login credentials. Mobility controllers at the Aggregation Layer are the central point of control for users and APs. The controllers sit in the authentication path, terminate user-encrypted traffic, and enforce policy using the optional Aruba Policy Enforcement Firewall (PEF) module. This capability exceeds PCI v1.2 section 1.2.3.
This ICSA certified stateful firewall allows control of user traffic as well as application awareness through deep packet inspection. The Aruba PEF module has the capacity to dynamically follow sessions, log user sessions, and take actions through the blocking of user traffic and blacklisting of users for policy violation. This role-based access control system allows users with different access rights to share the same APs.
A wireless user gains access to the network by attempting to associate to the AP with the strongest signal. The association request may have originated from a new user logging on to the network, or from an active user who has just roamed from elsewhere in the store. The 802.11 MAC layer protocol association request is forwarded to the mobility controller, which then attempts to retrieve the user’s
Retail Wireless Networks Validated Reference Design | Solution Guide Authentication and Security | 113

state from the active user database. If the user was not active previously, the mobility controller will proceed to authenticate the user via the authentication mode for the SSID. With 802.1x, it is coupled with back-end authentications mechanisms such as Remote Authentication Dial-In User Service (RADIUS), Active Directory, or Lightweight Directory Access Protocol (LDAP).
The mobility controller can perform user authentication in multiple ways to suit the varying needs of an enterprise and the Authentication, Authorization, and Accounting (AAA) infrastructure currently in use. The typical authentication methods employed on Aruba networks can be summarized as:
WPA2 or WPA with PSK
802.1x based user authentication with a backend server
802.1x PEAP termination on the controller
Captive portal based user authentication
A combination of authentication methods such as 802.1x followed by captive portal, or WEP authentication followed by VPN.
Use Table 5 on page 28 to finalize the SSID and Authentication mode combinations for each of your facility types. Although the Aruba mobility controller contains a scalable local database for users and guests, it is a best practice to use the existing authentication infrastructure, which is typically engineered for redundancy and high performance. Aruba supports integration with external RADIUS, Active Directory, and LDAP servers.
Authentication Methods for Pre-Shared Key DevicesLegacy authentication methods include pre-shared keys (PSK), Wired Equivalent Privacy (WEP), and open access with no authentication or encryption. Pre-shared keys are often used on older devices, or devices that cannot handle full 802.1x authentication.
Wi-Fi Protected Access (WPA and WPA2) is a certification program administered by the Wi-Fi Alliance to indicate compliance with the security protocol created by the Wi-Fi Alliance to secure wireless computer networks. This protocol was created in response to several serious weaknesses researchers had found in the previous system, Wired Equivalent Privacy (WEP). WPA protocol implements the majority of the IEEE 802.11i standard, and was intended as an intermediate measure to take the place of WEP while 802.11i was prepared. WPA is specifically designed to also work with pre-WPA wireless network interface cards that pre-date the protocol (through firmware upgrades), but not necessarily with first generation wireless APs. The WPA2 certification mark indicates compliance with an advanced protocol that implements the full standard. This advanced protocol will not work with some older network cards.
PSK mode (also known as personal mode) is designed for small or medium business networks that do not require the complexity of an 802.1x authentication server. Each user must enter a passphrase to access the network. The passphrase may be from 8 to 63 printable ASCII characters or 64 hexadecimal digits (256 bits). If you choose to use the ASCII characters, a hash function reduces it from 504 bits (63 characters * 8 bits/character) to 256 bits (using the SSID). In most operating systems the passphrase may be stored on the user's device at their discretion to avoid re-entry. The passphrase must remain stored in the wireless controller configuration.
114 | Authentication and Security Retail Wireless Networks Validated Reference Design | Solution Guide
Complying with the WEP Phase-Out Requirement
In the PCI DSS v1.2 standard, use of WEP must either be phased out or segmented by a compliant firewall solution.
Requirement 4.1.1: Make sure wireless networks transmitting cardholder data or connected to the
cardholder data environment, use industry best practices (for example, IEEE 802.11i) to implement
strong encryption for authentication and transmission. For new wireless implementations, it is
prohibited to implement WEP after March 31, 2009. For current wireless implementations, it is
prohibited to use WEP after June 30, 2010.
This requirement specifies the use of strong encryption for wireless transmission, whether or not credit and debit card data are transmitted, and strict timelines on the elimination of the compromised security mechanism, WEP. Prior to PCI DSS v1.2, this requirement applied only if the wireless networks were transmitting credit card data.
There are two approaches to complying with Requirement 4.1.1.
1. Eliminate the WEP security by reconfiguring existing wireless networks to use 802.11i-specified security such as WPA or WPA2. Given hardware and software restrictions of legacy devices in use, this approach may require a replacement of certain wireless devices such as barcode scanners and embedded wireless devices.
2. Segment the wireless network and devices to quarantine WEP-based devices from the cardholder environment using PCI-defined segmentation techniques. Doing so shifts WEP-only devices out-of-scope of PCI compliance. This approach can shield merchants from the cost and complexity of replacing legacy systems already in place.
Aruba specifically recommends against the use of WEP because of security concerns. To this end, an Aruba wireless LAN simultaneously supports all of the following encryption and authentication protocols:
WPA. 802.1x authentication with Temporal Key Integrity Protocol [TKIP] encryption
WPA2. 802.1x authentication with Advanced Encryption Standard (AES)-Combined Cipher Machine (CCM) encryption
IPSEC. Triple Data Encryption Standard (3DES) AES-CBC Encryption
Peer-to-Peer Tunneling Protocol (PPTP). VPN technology using Microsoft Point-to-Point Encryption (MPPE) encryption
xSec. 802.1x authentication with AES-CBC-256 encryption designed for federal and sensitive commercial applications.
Legacy barcode scanners present a specific challenge with respect to WEP, and in many cases legacy scanners do not support alternate encryption and authentication protocols. Aruba’s integrated ICSA-
certified, role-based firewall can segment these WEP devices and thereby move them outside the scope
of PCI compliance. The role-based firewall also enables Aruba to prevent unauthorized access to the cardholder environment, blacklisting any unauthorized devices that attempt to penetrate the Aruba wireless LAN.
Retail Wireless Networks Validated Reference Design | Solution Guide Authentication and Security | 115

Authenticating with 802.1x802.1x is the most secure method of wireless security; however, it requires client devices that are capable of supporting 802.1x, and a back-end authentication infrastructure with unique login credentials for each user. This may be a challenge in many present retail environments. Unique logins are often assigned only to store managers, and team member turnover may make the use of PSK more economical for certain applications.
802.1x was developed to secure wired ports by placing the port in a ‘blocking’ state until authentication completed using Extensible Authentication Protocol (EAP). EAP is a framework that allows many different authentication types to take place within the EAP system; Protected EAP (PEAP) is most commonly used in wireless. In this mode, a Transport Layer Security (TLS) tunnel is created and user credentials are passed to the authentication server within the tunnel. When the authentication is complete, the client and the mobility controller both have copies of the keys used to protect the user session.
Figure 61 802.1x Authentication Handshake
Ret
ail_
057
Associate
Associate response
EAP request identity
EAP response
EAP exchange
APStation
802.11 Association 802.1x Authentication 4-way Handshake
Key1
Key2
Key3
Key4
116 | Authentication and Security Retail Wireless Networks Validated Reference Design | Solution Guide

Using RADIUS and a WPA2-protected connection as an example, authentication occurs using 802.1x. The mobility controller forwards the request to the RADIUS server, which performs the actual authentication and sends a response to the mobility controller. Once authentication completes successfully, encryption keys are passed to the mobility controller from the RADIUS server, along with the user’s access policies. The mobility controller then completes the role derivation process and adds the new user, along with all the relevant state information, into the active user database and completes the authentication process. A security context is created, and for encrypted links, key exchange occurs where all traffic is now encrypted.
Figure 62 RADIUS Server Authentication
If the user already exists in the active user database and attempts to associate to a new AP, the mobility controller will understand that an active user has moved and will restore the user’s connectivity state and initiate mobility processing.
For distribution center, warehouse, and large footprint store deployments, a compatible AAA server must exist in order to utilize 802.1x authentication. If a centralized AAA infrastructure exists that is queried across the retailer WAN, it can easily be used for wireless authentication. This is the more reliable solution with the least administrative cost for the retailer. On the other hand, if the AAA server is located in the store or warehouse, each local controller must be configured with appropriate IP address information during the staging process. Verification of 802.1x authentication to the production AAA server is recommended either during staging or on the night of the installation.
For Remote AP deployments in small footprint stores, Aruba recommends using a centralized AAA server for 802.1x SSIDs. You can co-locate this server at the retail data center where the DMZ with the local controllers is installed.
ArubaOS uniquely supports AAA FastConnect, which allows the encrypted portions of the 802.1x authentication exchanges to terminate on the mobility controller. Here the Aruba hardware encryption engine dramatically increases authentication scalability and performance. Supported for PEAPMSCHAPv2, PEAP-GTC, and EAP-TLS, AAA FastConnect removes the requirement for external authentication servers to be 802.1x-capable and increases authentication server scalability by permitting several hundred authentication requests per second to be processed.
Ret
ail_
056
WLANSwitch
1
5
3 4
3
AP
L2/L3Switch
CorporateBackbone
RADIUSServer
2
1.
2. 3.
4.
5.
Client sends 802.11 association request that isautomatically forwarded by the AP to the WLAN switch
WLAN switch responds with association acknowledgement
Client and WLAN switch start 802.1x authenticationconversation along with RADIUS server
Encryption keys passed to the WLAN switch, and user derivesown encryption keys, begins sending encrypted data
WLAN switch decrypts data, processes packets, appliesservices and forwards packets based on .11 MAC
Retail Wireless Networks Validated Reference Design | Solution Guide Authentication and Security | 117

Authenticating with Captive PortalFor temporary store visitors, including customers and vendors, Aruba supports a Web-based captive portal that provides secure browser-based authentication. Captive portal authentication is encrypted using Secure Sockets Layer (SSL), and can support both registered users with a login and password or guest users who supply only an email address.
The user connects to the SSID, which requires no authentication, and is placed in a state that requires a login. When the user opens a web browser, a captive portal screen appears, asking them to enter either the credentials chosen by the retailer for access, such as an email address, or to simply accept a set of service terms.
Figure 63 Aruba Captive Portal Screen
Configuring Roles for Different UsersThe Aruba system uniquely combines user-based security as a part of the WLAN model. When a user is authenticated using one of the methods discussed in the previous section, a role is applied to the user that is enforced via the firewall and the defined policies for that user. The retail environment uses the following roles for users:
Secure role for mobile data terminals (high security or legacy security)
Voice or video
Guest access.
Secure Role for Mobile Data TerminalsUsers who are company employees can be granted access to secure data based on their specific job function, or simply be given a universal employee role. Additional qualifications for user access can be applied, such as permitting stock clerks to access the in-store processor but not the finance or accounting servers.
118 | Authentication and Security Retail Wireless Networks Validated Reference Design | Solution Guide

At the store and distribution center level, users will most likely be placed in a single user subnet that has access to internal resources at that location only.
Voice Handset RoleSpecial-purpose device access is similar to guest access and typically includes voice devices. Limit device access to a known set of IP addresses and port numbers. A voice device should only be able to run voice protocols such as Session Initiation Protocol (SIP) to the SIP server, Real-Time Transport Protocol (RTP) and basic Internet Control Message Protocol (ICMP) commands. Any other uses should result in the device being blacklisted as it is most likely the subject of an impersonation attack.
Guest Access RoleGuest usage warrants special consideration for retail wireless networks. It is not enough for guest users to be separated from employee users through VLANs in the network. Guests must be limited not only in where they may go, but also limited by what network protocols and ports they may use to access resources.
A guest policy as implemented by the stateful firewall should only allow the guest to access the local resources that are required for IP connectivity. These include DHCP and possibly DNS if an outside DNS server is not available. The Aruba firewall also allows for certain guest services such as printers and fax, which the firewall policies can allow if desired. All other internal resources should be off limits for the guest. This condition is usually achieved by denying any internal address space to the guest user.
Figure 64 Guest Access is Time Limited
Configure additional policies to limit the use of the network for guests. The first policy is a time-of-day restriction. The user should be limited to accessing the network during normal store hours. Accounts should be set to expire automatically, typically at the end of each business day.
Figure 65 Guest Access is Bandwidth Limited
A rate limit can be put on each guest user to keep the user from using up the limited wireless bandwidth. Employee users should always have first priority to the wireless medium for conducting company business. Remember to leave enough bandwidth to keep the system usable by guests. Aruba recommends a minimum of 10% bandwidth. Guests can always burst when the medium is idle.
Ret
ail_
060
No accessafter hours
Access controlled
Ret
ail_
061
Mobilitycontroller
Data Controlleddata
Retail Wireless Networks Validated Reference Design | Solution Guide Authentication and Security | 119

With appropriate levels of encryption and authentication for different users, the system is completely secured. The unique combination of these security mechanisms and Aruba Role-Based Access Control (RBAC) gives an Aruba WLAN far more control and granularity of user traffic than simply demanding a particular type of authentication and encryption. Aruba uniquely meets the requirements of PCI compliance while allowing for a smooth and seamless transition from legacy devices and applications to those that support the strongest encryption and authentication provided by WPA2 and 802.11i.
Putting It All Together: Building an Authentication DesignThe key deliverable from this chapter is the authentication design for each major type of facility to be covered. The three main elements of an authentication design are:
AAA profile design
SSID profile design
Role policy design.
This section explains the basics of Aruba profiles and how the SSID and AAA profiles work together to implement role-based access control in compliance with PCI requirements.
What Is A Profile?A profile is defined as a logical container consisting of a number of related configuration settings. There are nearly 30 different types of profiles available. To bring up a basic working SSID with limited security on an AP, only a SSID Profile is required. More complex configurations require more profiles to be defined, such as for high security SSIDs using 802.1x authentication. In this case, a AAA Profile is also required as shown in Figure 66.
Figure 66 Examples of Aruba SSID and AAA Profiles
Every profile must be assigned a unique name; names cannot contain any white space characters. The example SSID Profile on the left contains related values whose purpose is to define a specific 802.11 SSID that will be available for a specific group of users, in this case employees who typically authenticate against an organization’s AAA infrastructure. The example AAA profile on the right defines the configuration of the RADIUS or LDAP server. As we have discussed, in a retail deployment it is common to have separate SSID profiles for PSK devices, voice devices, and guests. Guests typically may authenticate through a captive portal, which would require other profiles be defined to configure its operation. SSID profiles and AAA profiles can then be combined as desired to use different authentication servers for different groups of users.
SSID Profile“XYZ_Corp_Employees”
AAA Profile“XYZ_dot1x_AAA_Profile”
Network Name = “Employee_SSID”Authentication = 802.1xEncryption = AES802.11g Rates = 1,2,5,6,9,11,12,18,24,36,48,54802.11a Rates = 6,9,12,18,24,36,48,54RTS Threshold = 2333 bytesHide SSID = NoShort Preamble = Yes
Initial Role = Logon802.1x Default Role = XYZ_Corp_dot1x_RoleUser Derivation Rules = NoneWired-to-Wireless Roaming = Yes
Properties Properties
Ret
ail_
077
120 | Authentication and Security Retail Wireless Networks Validated Reference Design | Solution Guide

Profiles are realized on the mobility controller through the GUI or the CLI. In the web GUI, each type of profile has its own page, with all relevant parameters that are accessed through the Profiles tab on the Configuration page. Figure 67 shows the GUI for the SSID Profile example above, along with a CLI excerpt from the startup-config file for the same profile:
Figure 67 Configuring an SSID Profile in the Controller GUI
N O T E
Profile names, AP names, and AP Group names must not contain any spaces or other white space characters.
Retail Wireless Networks Validated Reference Design | Solution Guide Authentication and Security | 121

Aggregating Profiles into a Complete ConfigurationProfiles are combined in a building-block fashion to produce the desired functionality. In addition, most profiles are portable and reusable, allowing the administrator to reduce configuration complexity while simultaneously permitting almost any combination of profiles.
A basic example is the virtual AP profile which includes both virtual AP settings and other profiles in a hierarchical fashion. A virtual AP profile contains the VLAN number, a valid SSID profile, and possibly an AAA profile. Figure 68 shows how a common AP group for a retailer can be visualized.
Figure 68 Typical AP Group for Retail Store SSIDs with Nested VAP Profiles
Ret
ail_
079
AAAProfile
“Preshared_Key_AAA_Profile”
SSIDProfile
“Preshared_Key_SSID_Profile”
AAAProfile
“HighSecurity_AAA_Profile”
SSIDProfile
“HighSecurity_SSID_Profile”
AAAProfile
“Guest_AAA_Profile”
SSIDProfile
“Guest_SSID_Profile”
AAAProfile
“Voice_AAA_Profile”
SSIDProfile
“Voice_SSID_Profile”
AP Group“Retail_Store_Group”
VAP Profile“Preshared_Key_VAP_Profile”
VLAN = 200
VAP Profile“HighSecurity_VAP_Profile”
VLAN = 100
VAP Profile“Guest_VAP_Profile”
Captive PortalAuthentication Profile
“Guest_CP_Profile”
802.1xAuthentication Profile“HighSecurity_dot1x_Profile”
802.1xAuthentication Profile
“Preshared_Key_dot1x_Profile”
VLAN = 300
VAP Profile“Voice_VAP_Profile”
VLAN = 400
122 | Authentication and Security Retail Wireless Networks Validated Reference Design | Solution Guide
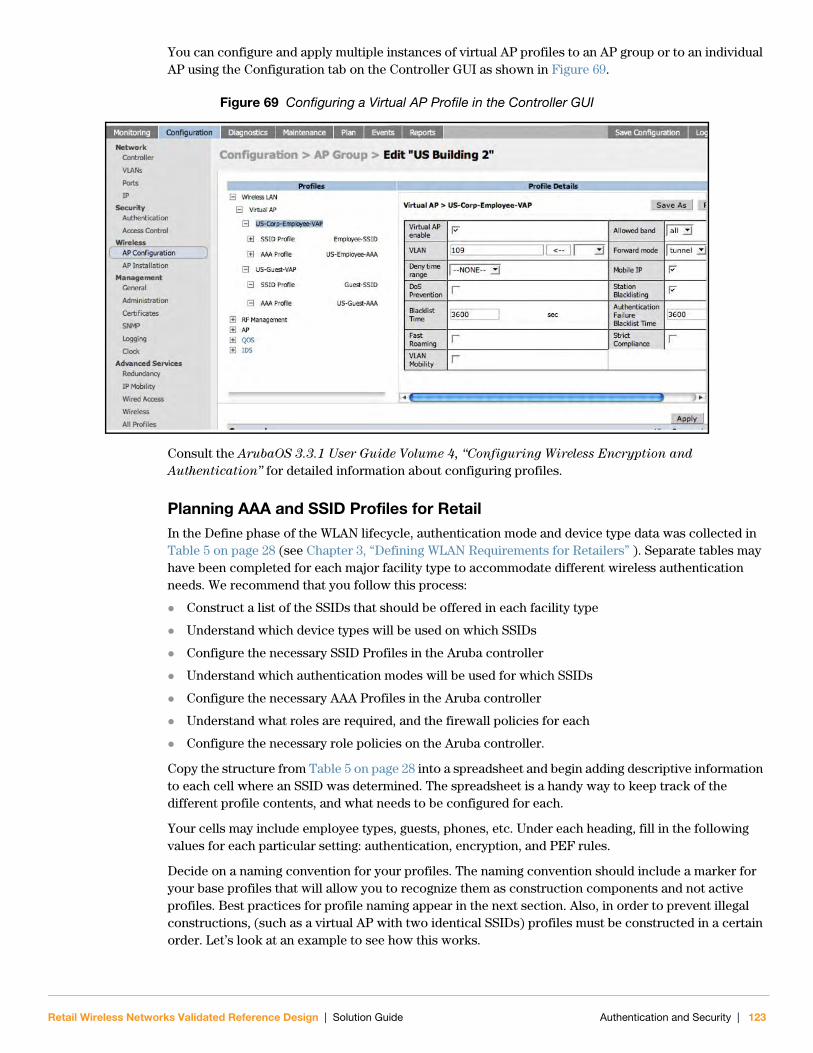
You can configure and apply multiple instances of virtual AP profiles to an AP group or to an individual AP using the Configuration tab on the Controller GUI as shown in Figure 69.
Figure 69 Configuring a Virtual AP Profile in the Controller GUI
Consult the ArubaOS 3.3.1 User Guide Volume 4, “Configuring Wireless Encryption and
Authentication” for detailed information about configuring profiles.
Planning AAA and SSID Profiles for RetailIn the Define phase of the WLAN lifecycle, authentication mode and device type data was collected in Table 5 on page 28 (see Chapter 3, “Defining WLAN Requirements for Retailers” ). Separate tables may have been completed for each major facility type to accommodate different wireless authentication needs. We recommend that you follow this process:
Construct a list of the SSIDs that should be offered in each facility type
Understand which device types will be used on which SSIDs
Configure the necessary SSID Profiles in the Aruba controller
Understand which authentication modes will be used for which SSIDs
Configure the necessary AAA Profiles in the Aruba controller
Understand what roles are required, and the firewall policies for each
Configure the necessary role policies on the Aruba controller.
Copy the structure from Table 5 on page 28 into a spreadsheet and begin adding descriptive information to each cell where an SSID was determined. The spreadsheet is a handy way to keep track of the different profile contents, and what needs to be configured for each.
Your cells may include employee types, guests, phones, etc. Under each heading, fill in the following values for each particular setting: authentication, encryption, and PEF rules.
Decide on a naming convention for your profiles. The naming convention should include a marker for your base profiles that will allow you to recognize them as construction components and not active profiles. Best practices for profile naming appear in the next section. Also, in order to prevent illegal constructions, (such as a virtual AP with two identical SSIDs) profiles must be constructed in a certain order. Let’s look at an example to see how this works.
Retail Wireless Networks Validated Reference Design | Solution Guide Authentication and Security | 123
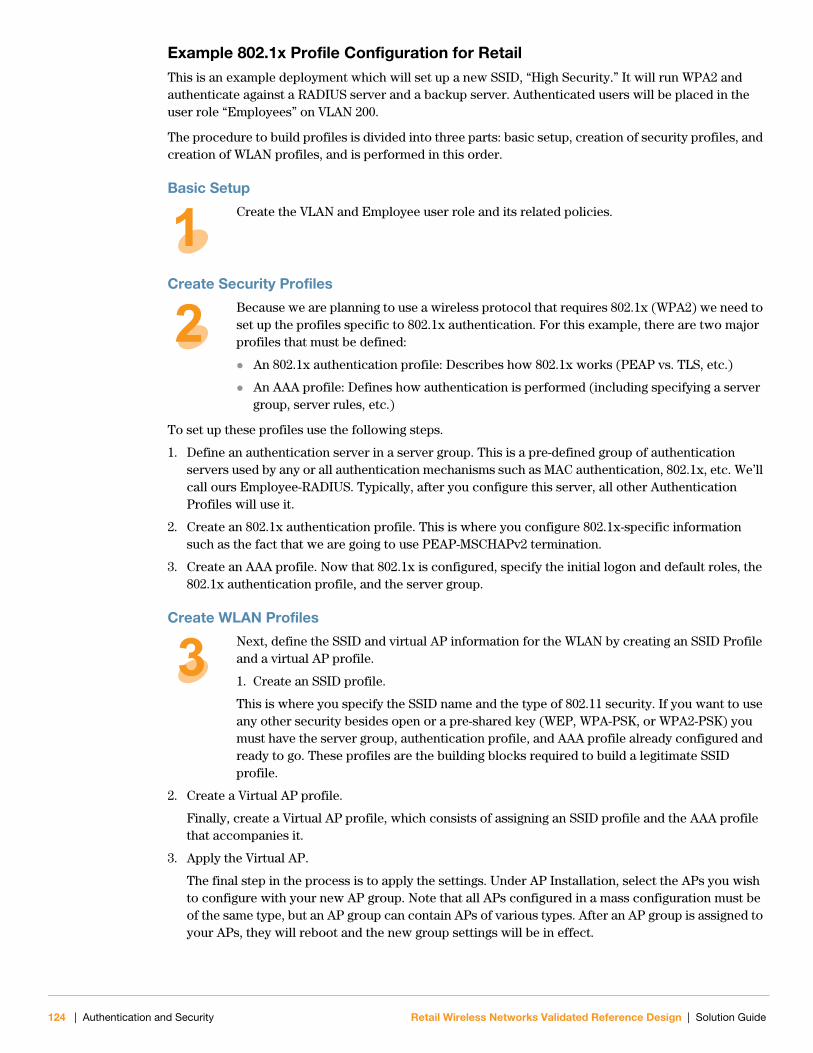
Example 802.1x Profile Configuration for RetailThis is an example deployment which will set up a new SSID, “High Security.” It will run WPA2 and authenticate against a RADIUS server and a backup server. Authenticated users will be placed in the user role “Employees” on VLAN 200.
The procedure to build profiles is divided into three parts: basic setup, creation of security profiles, and creation of WLAN profiles, and is performed in this order.
Basic Setup
Create the VLAN and Employee user role and its related policies.
Create Security Profiles
Because we are planning to use a wireless protocol that requires 802.1x (WPA2) we need to set up the profiles specific to 802.1x authentication. For this example, there are two major profiles that must be defined:
An 802.1x authentication profile: Describes how 802.1x works (PEAP vs. TLS, etc.)
An AAA profile: Defines how authentication is performed (including specifying a server group, server rules, etc.)
To set up these profiles use the following steps.
1. Define an authentication server in a server group. This is a pre-defined group of authentication servers used by any or all authentication mechanisms such as MAC authentication, 802.1x, etc. We’ll call ours Employee-RADIUS. Typically, after you configure this server, all other Authentication Profiles will use it.
2. Create an 802.1x authentication profile. This is where you configure 802.1x-specific information such as the fact that we are going to use PEAP-MSCHAPv2 termination.
3. Create an AAA profile. Now that 802.1x is configured, specify the initial logon and default roles, the 802.1x authentication profile, and the server group.
Create WLAN Profiles
Next, define the SSID and virtual AP information for the WLAN by creating an SSID Profile and a virtual AP profile.
1. Create an SSID profile.
This is where you specify the SSID name and the type of 802.11 security. If you want to use any other security besides open or a pre-shared key (WEP, WPA-PSK, or WPA2-PSK) you must have the server group, authentication profile, and AAA profile already configured and ready to go. These profiles are the building blocks required to build a legitimate SSID profile.
2. Create a Virtual AP profile.
Finally, create a Virtual AP profile, which consists of assigning an SSID profile and the AAA profile that accompanies it.
3. Apply the Virtual AP.
The final step in the process is to apply the settings. Under AP Installation, select the APs you wish to configure with your new AP group. Note that all APs configured in a mass configuration must be of the same type, but an AP group can contain APs of various types. After an AP group is assigned to your APs, they will reboot and the new group settings will be in effect.
124 | Authentication and Security Retail Wireless Networks Validated Reference Design | Solution Guide
Best Practices for Wireless LAN ProfilesProfiles can be divided into one of two basic types: Wireless LAN definition and Wireless security definition.
As part of the building block approach to profile creation, we recommend that you create the minimum number of profiles required with the maximum amount of profile reuse. This approach can be generalized as follows:
Authentication Servers and Server Groups
1. Create a server group for each type of server.
a. RADIUS_Servers
b. LDAP_Servers
2. If multiple groups of the same type of servers exist, specify the unique application for each group within its name.
a. NorthAmerica_RADIUS_Servers
b. EMEA_RADIUS_Servers
3. If further distinction is necessary, add these servers:
a. EMEA_Corp_RADIUS_Servers
b. EMEA_Guest_RADIUS_Servers
AAA Fast Connect
If you are using 802.1x with EAP Type PEAP, configure the 802.1x authentication profile for termination.
User Role Assignment
1. Always place unauthenticated users in an initial role with the minimum possible privileges or access required.
2. Use server derivation rules if multiple types of users (employees, contractors, phones) will authenticate using the same authentication method (such as MAC or 802.1x) on the same virtual AP.
3. Use the default role assignment within the AAA profile if each type of user or device authenticates using a different authentication method.
SSID Configuration
When planning SSIDs for a WLAN:
1. Use the minimum SSIDs possible to keep radio beacons and RF contention and management to a minimum.
2. Use the Aruba firewall and user roles to keep different groups of users separated from each other or from network resources.
3. Do not mix different types of wireless security on the same SSID. For example: 802.1x and WPA security on the same SSID.
4. Do not change the basic rates or default 802.11 advanced settings for any reason.
5. If you want to eliminate some of the slower transmit rates supported by an SSID, allow at least two speeds. Do not remove all but the highest rate.
Virtual APs
Do not enable strict compliance unless you have legacy wireless equipment.
Retail Wireless Networks Validated Reference Design | Solution Guide Authentication and Security | 125

126 | Authentication and Security Retail Wireless Networks Validated Reference Design | Solution Guide

Retail Wireless Networks Validated Reference Design | Solution Guide
Chapter 8QoS Design for Voice and Data Devices
Toll quality in-store voice over 802.11 wireless networks is a critical application for many retailers. The Aruba WLAN controller contains significant voice-specific quality of service (QoS) features that provide dramatic increases in call security, quality, and reliability when compared to previous generations of technology.
This chapter will show you how to make key voice and QoS design decisions including:
When to use a separate service set identifier (SSID) for voice
What is the encryption and authentication mechanism that should be enabled
Should voice have a dedicated VLAN
How can battery life be improved
What RF settings should be used
Tagging and QoS features
Call capacity planning.
These topics will be covered in this chapter. Several of the tables that were collected in Chapter 3, “Defining WLAN Requirements for Retailers” as part of the Define phase contain information needed to complete a QoS design.
WLAN Infrastructure Design
Band SelectionFirst, decide on the RF band that the real-time delay-sensitive application will use. When making these decisions, remember that the Wi-Fi network should be designed such that:
The interference on all the channels used by the voice devices is minimized.
Congestion is reduced. Non voice traffic on the voice channels should be limited to accommodate the bandwidth requirements of the voice traffic. Shifting data clients to 5 GHz is one way to achieve this.
The band selection depends on the voice Wi-Fi handset that will be deployed. Not all handsets operate in the 802.11a band, which is less vulnerable to interference from consumer market devices such as microwave ovens and cordless phones operating in the 2.4 GHz band. Some devices are only 802.11b capable, and depending on the number of handsets deployed, the net throughput of the band could be limited to 802.11b throughput. The deployment may also contain mixed-mode devices capable of operating in multiple bands, or multi-vendor devices operating in different bands.
Here are basic guidelines for band planning for voice devices:
802.11a capable devices
Aruba strongly recommends the use of the 5 GHz band for voice deployments due to its relatively unused nature, the substantially greater number of non-overlapping channels, and the absence of common interference sources that exist in 2.4 GHz.
QoS Design for Voice and Data Devices | 127

802.11b capable devices only
If the majority of the handsets deployed are only capable of 802.11b, make sure that:
You limit all other non-voice devices on the 802.11b band. Most data devices are 802.11a/b/g capable. By broadcasting the data SSIDs on the 802.11a band alone, the data devices can be limited to the 5 GHz band, freeing the 2.4 GHz 802.11b channels.
There may be some data devices on the 802.11b/g band that are not 802.11a capable. Limit the bandwidth and number of client associations to control congestion.
802.11b/g capable devices
Most voice capable devices in the industry today are 802.11b and 802.11g capable. Using only 802.11g devices in the 2.4 GHz band improves the performance of the band by 20% or more
compared to using a mix of both 802.11b and 802.11g devices in the band.
Use 802.11g if the handsets support both 802.11b and 802.11g. If the handset allows you to disable 802.11b and operate using only 802.11g, then this option is recommended because it will allow more handsets to be supported simultaneously.
Limit 802.11b/g traffic in the 2.4 GHz band. Limit the number of 802.11b/g-only clients in the 2.4 GHz band.
Move all end points that support 802.11a/b/g to 802.11a
If the handset supports only 802.11b, set the basic rates to 1 and 2, and set the supported rates on the access points (APs) to 1, 2, 5.5, and 11. Lower basic rates increase reliability in certain case where the client may have issues receiving acknowledgements at higher rates in a dense environment, or if the client is at the cell border.
Adaptive Radio ManagementAdaptive Radio Management (ARM) enables the WLAN system to adapt to the changing RF environment. It is highly recommended to optimize the RF environment using ARM.
Enable dynamic RF management by enabling ARM. This allows the system to adapt to the changing RF environment.
Enable scanning and set the assignment to single band. Set the transmit power levels as per the recommendation in the next section.
Enable voice aware scanning. Voice aware scanning allows the Aruba system to postpone scanning functions on a per-AP basis when it detects an active voice call on the AP.
Enable Power Save Aware Scan for some headsets, such as Spectralink and Vocera. Power Save Aware Scan blocks ARM channel change when the client is in the power save mode.
In addition to enabling these features, Aruba recommends limiting the minimum and maximum transmit power settings that ARM can use. In Chapter 6, “RF Design” , we covered the importance of matching client and AP power. This is especially important for voice devices which typically have limited battery life and low radio power output.
Min TX Power Max TX Power General Recommendation
0 12 Make sure that the difference between the max and min TX power is no larger than two levels.12 18
15 20
18 30
128 | QoS Design for Voice and Data Devices Retail Wireless Networks Validated Reference Design | Solution Guide

Separate SSIDs For Voice ClientsThe decision here is whether or not to use a dedicated SSID for the voice devices. This choice should be based more on the device’s RF capabilities than on security (see Appendix B, “Client Device Interoperability Matrix” for a quick reference for these capabilities). The dedicated firewall integrated into the Aruba controller allows the administrator to isolate the SSID used for connectivity from the security and QoS policies, which are based on the user profile and traffic type.
A dedicated SSID should be used for the voice devices if and only if the following apply:
The device operates with Delivery Traffic Indication Message (DTIM) settings of 3 or greater. The battery save settings (Power Save and DTIM settings) on the handset can be optimized to larger DTIM values to improve battery life without adversely affecting the handset operations. Changes in these values do affect data device performance.
The encryption and authentication levels supported by the handsets do not match the encryption and authentication mechanisms enforced on the data clients.
The encryption and authentication methods supported by the handsets match the security enforced on the data devices, but these settings adversely affect handset roaming due to the handset driver behavior or processing power.
The voice solution selected demands a dedicated VLAN as it does not support L3 connectivity back to the call servers.
If none of these criteria match, it should be possible to use the same SSIDs and the same encryption and authentication methods that the data devices use. Different levels of QoS can be enforced based on the traffic type without requiring a separate SSID.
Authentication and Encryption The authentication and encryption mechanism that is chosen for the voice clients depends on whether the device supports roaming when the encryption and authentication method is enabled. Roaming time is the time taken by mobile clients to move from one AP to another. How long a client takes to roam is dependent upon the number of key exchanges that need to be supported as part of the re-association process. This directly impacts the overall time the handset takes to associate with the new AP.
Even though static WEP and Open system take the least amount of time, they are prohibited by the PCI DSS v1.2 requirements with which retailers must comply. Table 21 summarizes the PCI compliant authentication and encryption types typically supported by Voice over Wi-Fi (VoFi) handsets. Use Chapter 3, “Defining WLAN Requirements for Retailers” to assess the capabilities of the devices in use at your facilities.
Table 21 PCI DSS v1.2 Compliant Authentication and Encryption Types
Authentication/Encryption Type Description
WPA-PSK and WPA2-PSK Supported by all the handsets in the industry today. WPA-PSK and WPA2-PSK have reliable roam times and shorter key exchange times.
WPA2-AES with OKC The most optimal authentication/encryption type because it offers low roam times and strong security.
WPA-TKIP Enterprise These types can also be used, provided that the roam times are low for these encryption and authentication methods.
N O T E
When using WPA or WPA2, set the wpa-key-period timer to 100 ms.
Retail Wireless Networks Validated Reference Design | Solution Guide QoS Design for Voice and Data Devices | 129

As far as authentication is concerned if dynamic encryption is a mandate then 802.1x or 802.11i is the preferred choice. The preferred Extensible Authentication Protocol (EAP) type should be chosen according to the vendor’s recommendations or according to certification lab recommendations.
Virtual AP Design
VLAN SettingsSome voice deployments require that both the handsets and the servers reside in the same broadcast domain. This is because the handsets use broadcast or multicast traffic for registration to find the server or for other voice-server based features to limit the traffic in the VLAN to voice traffic. This may also be done to make sure that the broadcast domain is contained. If the number of devices in a single broadcast domain is greater than 200, the handsets may experience call quality issues. This is not likely to be an issue in most retail stores. However, large distribution centers could have hundreds of active voice users at one time.
If the voice client supports layer 3 communications between the server and the handset and the number of devices exceeds 200, it is recommended to use VLAN pooling to load balance all the devices associated with the SSID across a number of dedicated voice VLANs. Alternatively, the voice devices can also co-exist with the data devices in the data VLAN provided that the devices and the VLANs are secured.
Battery Life – Delivery Traffic Indicator Map Settings and UAPSD Power-saving mechanisms help improve the battery life on the handsets by allowing the handsets to sleep longer. This service is part of the Aruba Voice Services Module (VSM) license and is strongly recommended if voice is a production application in your stores or warehouses.
If the handset supports Unscheduled Automatic Power Save Delivery (UAPSD), enable UAPSD on the handset and enable Wireless Multimedia Extensions (WME) on the infrastructure by setting Delivery Traffic Indicator Map (DTIM) to 10. For handsets that do not support UAPSD, set the DTIM to 3.
Aruba recommends enabling the Battery Boost feature of the VSM license if the handset supports battery boost. Contact the Aruba interoperability labs for information on whether the handset and VoIP protocol supports the battery boost feature. The Device Interoperability Matrix in Appendix B, “Client Device Interoperability Matrix” lists known compatible devices.
Max-Retries A general best practice for voice deployments is to set the retries on the controller and handset to 2. Because VoIP is delay sensitive, after the packet is delayed, retrying in order to successfully transmit a packet may just add to the latency in the network.
Max Transmit Failures Set the max-tx-fail retries value to 25 for the Voice SSID.
Scanning, Probe Requests, and Beacons All handsets scan the environment to update the list of available APs in order to speed roaming decisions. Scanning can be aggressive and active, or passive and reactive.
N O T E
In noisy wireless environments, try increasing this value slightly to improve reliability.
130 | QoS Design for Voice and Data Devices Retail Wireless Networks Validated Reference Design | Solution Guide

Some handsets also use probe requests to identify available APs and these probe requests may be broadcast probe requests. When using these handsets, be sure to enable Infrastructure Response to the broadcast probe requests for the voice SSID. Otherwise, disable the broadcast probe requests for the voice SSID. Another good practice is to not hide the beacons for the voice SSID.
End-to-End QoS DesignDifferent applications have different QoS requirements. The International Telecommunication Union (ITU) provides recommendations for good voice quality:
Round trip delay for the voice traffic and the call setup control traffic should be less than 100 ms.
A jitter of more than 10 ms is considered unacceptable. Jitter is the variation in time of the arriving packets due to delays introduced in the network. Each handset vendor has a different tolerance level to jitter, depending on their implementation of jitter buffers.
Packet loss should be less than 5%. Packet loss often results in dropped audio.
QoS enforcement is not the responsibility of any one network component. All of the devices in the network should be able to recognize the relative priority of the traffic and prioritize locally accordingly. QoS enforcement also requires client participation, especially over the air.
Figure 70 End-to-End QoS From Client to Core
Wired QoS Recommendations Use 802.1p tags and DSCP tags to prioritize the traffic on the wire. Commonly used values for voice
are ToS 6 or 7 and dot1p 6.
If supported, priority queuing for the voice traffic should be enabled on the routers and switches.
All the routers and switches in the network path between APs and the controller should be configured to recognize the tagging on the traffic and prioritize the traffic accordingly.
If network devices rewrite the tags on the packet headers, make sure that all network devices use the same tags for a given traffic type.
Ret
ail_
117
LAN Core LAN Edge Wireless
Bandwidth ManagementQueuing
Bandwidth ManagementCall Admission Control
QoS Aware RF Management
Downstream traffic
Upstream traffic
Tagged DSCP
Tagged DSCPTagged DSCP, 802.1p
Tagged DSCP, 802.1p
WMM / strict queuing
WMM / SVP
Retail Wireless Networks Validated Reference Design | Solution Guide QoS Design for Voice and Data Devices | 131

Wireless QoS Recommendations If the client supports WMM, then enable WMM on the Aruba system and the handset. Verify that the
client tags the voice (and data traffic) appropriately.
WMM queues map to different DSCP and ToS tags. Unless otherwise recommended by the handset manufacturer, use the default WMM mappings.
Make sure that the traffic prioritization is such that voice receives the highest priority, followed by video. Data should receive the lowest priority. The priority levels for each of the applications are set according the delay, retry, jitter, and loss tolerance of the application.
Make sure that the protocols for voice data traffic (for example, RTP) and control traffic (for example, SIP) are prioritized. Control traffic is used for call setup and the voice data traffic needs to be prioritized to provide good call quality.
In the absence of WMM support on the handset, make sure that voice uses the high-priority queue and all the other applications use the low-priority queue.
Capacity PlanningThe 802.11 wireless networking protocols are half-duplex by nature and use a contention based algorithm. As a result, there is a limit to the optimal number of voice clients per AP, depending on the overhead of the VoIP protocol headers, packet sizes, and the encryption used.
Figure 71 AP Capacity Planning for Call Admission Control (CAC)
Figure 71 illustrates the potential call capacity of an AP. The top horizontal line in the figure represents the total gross call capacity of the AP and the bottom horizontal line represents a call capacity of zero. The gross call capacity of the AP is diminished by the following areas shown in the figure:
Data reservation (top of figure). This amount of the gross call capacity is reserved for data applications. Subtracting out the Data Reservation leaves the total voice call capacity (labeled Total Call Capacity in the figure).
High capacity threshold and handoff reservation. These two shared areas on the diagram further diminish the call capacity. The High Capacity Threshold area is the amount of capacity reserved for peak calling activity so that calls are not dropped during high call demand periods. The Handoff Reservation area is the amount of capacity kept on standby for roaming users who are coming from one AP to another AP.
The net resulting average call capacity of the AP is labeled Call Capacity in the figure.
Ret
ail_
157
AP Capacity Data Reservation
HandoffReservation
HighCapacity
Threshold
Total CallCapacity
Call Capacity
132 | QoS Design for Voice and Data Devices Retail Wireless Networks Validated Reference Design | Solution Guide

The recommended maximum per-AP call capacities for clients using G.711 and SIP are listed in Table 22.
Call capacity with codecs such as G.729 yield up to a 20% improvement over the call capacities just listed. G.711 is widely supported. G.711 is the recommended choice for VoFi because it marginally improves voice quality.
Enabling call admission control (CAC) on an AP helps make sure that the AP is not overwhelmed by simultaneous calls beyond a specified capacity. Aruba CAC is aware of the call status of the client (the on-hook/on-call status), which allows the algorithm to make intelligent call balancing and capacity control decisions with minimal impact to the call quality.
Aruba strongly recommends enabling CAC for production voice deployments. The maximum number of calls supported per AP is a configurable parameter and should be set depending on the other traffic bandwidth requirements on the AP on the same band as the voice clients. CAC is implemented on a per-AP, per-radio basis. Set the handoff reservations and the high capacity threshold value to 20%.
These call-based CAC settings are recommended for a single-controller environment only. CAC also supports TSpec based bandwidth reservation for voice clients, allowing voice clients that don’t support TSpec to coexist with the clients that do. TSpec based CAC can be enabled in a single-controller environment in addition to the call based CAC for handsets that support TSpec.
In a multi-controller environment, CAC can be enforced on clients that roam from one controller to another if and only if the clients support TSpec signaling and TSpec signaling is enabled. The recommended setting in a multi-controller environment is to enable both call based CAC for intra-controller CAC enforcement, and TSpec based CAC for both intra- and inter-controller CAC enforcement. The TSpec based CAC enforcement for an inter-controller environment is available as of ArubaOS version 3.2.
Roaming and MobilityVoice over Wi-Fi is a mobile application by definition. It should be possible for the client to roam from one AP to another with very low roam times and also to maintain its IP address. This capability is necessary to make sure that the devices maintain their registration to the call server and maintain call quality while in use.
There are two possible mobility designs on the Aruba Controller: Layer 2 Mobility and Layer 3 Mobility. Layer 2 is most common in Retail facilities.
Layer 2 (VLAN) Mobility Layer 2 mobility designs are the best choice when the voice servers and the voice handsets are confined on the same VLAN or IP broadcast domain. Most retail store deployments employ layer 2 designs due to the limited number of APs and VLANs at each location. One example of a vendor-driven layer 2 requirement as of this writing is the Polycom Spectralink solution.
Table 22 Call Capacities for Clients Using G.711 and SIP
802.11 Variant Simultaneous Call Range
802.11b 12 calls
802.11g 25-30 if there are no 802.11b clients
802.11b/g 18-20 calls in a mixed 802.11b/g environment
802.11a 20-25 calls
Retail Wireless Networks Validated Reference Design | Solution Guide QoS Design for Voice and Data Devices | 133

A layer 2 mobility event is when the client moves from one AP to another and retains its VLAN (layer 2) association. This mobility event could be across APs connected to the same controller or across multiple controllers. In case of a multi-controller deployment, layer 2 mobility requires the controllers to be layer 2 connected for the voice VLAN. Using layer 2 mobility in a multi-controller scenario is recommended only if the voice protocol in use does not require session awareness, such as the Spectralink SVP Protocol.
Figure 72 Layer 2 Mobility Event
In a layer 2 mobility design, the network is designed such that the client maintains its IP address as it roams across controllers and is always assigned an address from the same IP subnet irrespective of the controller or AP it associates to. A general rule of thumb is to limit the number of devices per subnet to 200. However, this number can vary depending on the voice protocol used and the amount of broadcast or multicast traffic generated by the protocol.
Voice clients should be assigned an IP address using SSID-based VLAN assignment or role-based VLAN assignment along with OUI- or MAC-based role assignment.
Enable layer 2 mobility on the Aruba Controller (this is the default setting).
In case of a multi-controller design:
Permit all traffic from and to the handsets and the call servers.
Enable layer 2 mobility on all controllers (default setting).
Make sure that the controllers are L2 connected.
Make sure that the voice VLAN and subnet is active on all the controllers and the handsets are assigned the Voice VLAN when connecting to the APs on each of the controllers.
N O T E
When layer 2 mobility is used, layer 3 mobility should be disabled for the SSID/virtual AP group.
Ret
ail_
119
Layer 2 Mobility Event
Data Center
Closets
NetworkAccess
VoiceNet1
VoiceNet1VoiceNet1
VoiceNet1
VLAN 4
VLAN 1 VLAN 2
VLAN 3
Internet
134 | QoS Design for Voice and Data Devices Retail Wireless Networks Validated Reference Design | Solution Guide

Layer 3 (IP) Mobility Layer 3 mobility is the best choice when the voice servers and the voice user equipment can communicate with each other over a layer 3 network and the voice protocol used is a dynamic port-based protocol. Layer 3 mobility can also be used if the voice devices are spread over multiple subnets and roam between the subnets, and there are two or more layer 3 connected controllers.
Examples of layer 3 mobility protocols include SIP, NoE, and SCCP.
A layer 3 mobility event occurs when a device moves from one AP to another and its IP context changes. In the case of layer 3 mobility, the new subnet assigned to the client will be different from its subnet prior to the move. Normally, a change in IP address requires the handset to re-register with the call server. If a call is active, a layer 3 mobility event could result in the call dropping. Aruba supports IP Mobility, a feature that allows the client to retain its previous IP address as it moves across different IP contexts without affecting the call status. This is achieved by tunneling all the client traffic from the new foreign subnet to the home subnet from which it can then be routed normally.
Figure 73 Layer 3 Roam
Ret
ail_
121
Traffic Pattern prior to roam
Traffic Pattern post roam. The redirection of traffic from the foreign agentto the home agent helps preserve the L3 context of the client.
Layer 3 Mobility Event
SSID VoiceVoiceNet2
SSID VoiceVoiceNet1
VoiceNet1 VoiceNet2
Core
Retail Wireless Networks Validated Reference Design | Solution Guide QoS Design for Voice and Data Devices | 135

136 | QoS Design for Voice and Data Devices Retail Wireless Networks Validated Reference Design | Solution Guide

Retail Wireless Networks Validated Reference Design | Solution Guide
Chapter 9Deployment Methodologies
This section describes the available WLAN deployment methodologies, processes, and project management requirements to successfully roll out an Aruba secure wireless solution for retailers.
Aruba Deployment Process for RetailersAruba recommends a six-step process for large-scale rollouts. The general deployment sequence is shown in Figure 74.
Figure 74 Six Step Rollout Process
Step 1 – Install Test StoreRetailer IT organizations typically maintain a test store that contains an exact copy of the network infrastructure, application servers, and client devices that are deployed in one of their stores. The test store is likely to be in a controlled IT environment, but depending on the size of the retailer, it could be an actual store location that is either simulated or open to customers. Sometimes the retailer operates multiple test stores, for instance if it has acquired multiple brands over the years and each one has its own IT footprint.
Aruba recommends that merchants begin the deployment process by setting up an Aruba infrastructure in the test store in order to design and test the system configuration and client interoperability that will eventually be installed in the field. This confirms that controller and access point configurations are working and that the proper software images are running on the client devices to achieve optimum performance. The customer can learn to configure the AirWave Wireless Management Suite, and the chosen redundancy model (such as 1+1 or N:1) can be validated. Due to the prevalence of VSAT and private WANs with 64Kbps links from remote store locations to the DC, Aruba strongly recommends that failover and image upgrades be validated using the same type of backhaul that exists in the actual retail stores or DCs. The time spent in the test store verifying equipment, configuration, and connectivity is a good investment to avoid wasted time and expense in the field during the deployment cycle.
Step 2 – Deploy Data Center The data center houses the master controllers that are responsible for overall management of the APs and local controllers installed at the store locations. In addition, for N:1 and large-scale remote AP deployments, local controllers that provide these services are usually located within a DMZ at the data center. The AWMS servers are also installed at the data center.
Ret
ail_
100
Step 1Install
Test Store
Step 2Deploy
Data Center
Step 3ActivateStagingCenter
Step 4Install
Pilot Sites
Step 5Mass
ProduceRF Plans
Step 6Execute
FullDeployment
Deployment Methodologies | 137

In order to bring up the Aruba components at the data center, integration is required with infrastructure elements, including core routers, distribution switches, firewalls, authentication servers, DHCP and DNS servers, and syslog servers. For voice deployments, integration with the appropriate call manager system and/or private branch exchange (PBX) is also required. The specific configuration changes on each of these elements are generally developed as part of building the test store.
Step 3 – Activate Staging Center A retail staging center is needed to prepare equipment to be delivered to the store locations. The Aruba equipment is unpacked, configured, and verified at the staging center prior to final delivery. Many retailers depend on third-party systems integrators that perform equipment configuration as well as shipment logistics and field deployment. The staging center could also be owned and operated by the retailer.
The staging center should have LAN and WAN connectivity to the data center, as well as Internet connectivity to the Aruba License Management web site for activating optional controller license certificates. The center should have sufficient floor space and workbench space to allow a steady flow of controllers and APs to be configured and distributed appropriately for testing. The space should be designed for maximum efficiency for unpacking, hookup, configuration, test and verification, and repacking for shipping to the final store or DC location. Adequate secure warehouse storage is required to house both Aruba equipment as well as other infrastructure installed in the store at the same time. If utilizing a systems integrator, be certain that their contract provides insurance against risk of loss or damage.
Each Aruba controller is shipped with an envelope that contains a hard-copy license certificate. To transfer licenses between controllers, Aruba uses an activation process that converts the certificate to an electronic key. The controller serial number and the code from the printed license certificate are required to generate the key. This information is entered into the Aruba License Management web site, which returns a valid electronic key. This process is repeated for each controller.
Other prerequisites for the staging center include:
If Remote APs are being deployed, there must be VPN access from the staging center to the controller that is located in the data center, because remote APs are always preprovisioned in order to exchange IPSec encryption keys.
If APs are going to be preprovisioned at the staging center, the center must have PoE switches so that the APs can be provisioned by the controller that will be going to the store.
Detailed procedures should be developed and training given to installers to make sure that best practice is followed during the configuration process.
Step 4 – Install Pilot Sites After the staging center is running smoothly, the WLAN equipment for a limited number of pilot sites should be configured, tested, and installed. Pilot store locations should meet the following criteria:
Target one pilot store for each major store layout, or size band from Table 3 on page 26
Ensure that all client devices in Table 2 on page 24 are included in the pilot
If WAN link speeds vary widely, target stores with differing connections
Close proximity to each other and to company IT resources
Cooperative store management with experience participating in trials
Cooperative store employees with experience participating in trials
Larger merchants will need more pilot stores; Aruba recommends a minimum of three locations. Allow four weeks of operation to ensure that all design issues and client device optimizations have been adequately exposed.
138 | Deployment Methodologies Retail Wireless Networks Validated Reference Design | Solution Guide

Plan to achieve the following critical objectives during this phase:
1. Perfect the physical and logical network design
2. Perfect the RF design
3. Finalize the “golden” controller configuration
4. Finalize configuration changes needed in site routers or switches
5. Identify the optimal client device settings
Performance of the master/local design over the wide-area network should be evaluated in the pilot. This is also an excellent opportunity to test controller and AP failover.
Operating pilot stores greatly reduces the project risks during the Full Deployment phase. Once full deployment commences, the cost of making changes to controller or client device configurations at completed stores becomes very high.
Step 5 – Mass Produce RF Plans RF plans are required for every location that will be receiving APs. They are needed to finalize the overall equipment budget for the WLAN deployment. RF plans are needed by the cabling teams in order to know where to terminate PoE cables and mount APs. They are also necessary for management of the Aruba WLAN to visualize store RF conditions in realtime or to locate security threats.
Once the overall RF design strategy has been perfected in Step 4, it will be necessary to set up a “factory” to create plans for each site. Aruba recommends using the most recent possible drawings for stores, because they can change every year. An efficient means of generating the RF plans is to have a dedicated employee start with a common RF plan template for a particular store type, then modify it as needed to adjust to the actual floor plan. A reasonable metric is one hour per floor plan map for importing, layout, exporting and validation.
Most retailers try to limit the number of store layouts to gain various economies, even when the absolute number of stores is large. Of course, no two stores are ever exactly the same even when starting from the same plan. Over time, moves, additions, and changes increase the uniqueness of each store. In Chapter 4, “RF Site Surveys” we covered creating the template RF plans for each major store layout in order to come up with a budget for the entire project. If one knows the number of APs required by a given layout, and the number of stores that use the layout, one can quickly arrive at a reasonably accurate estimate of how many APs to purchase.
During the staging process, each store and DC should have an RF Plan loaded into its controller(s) showing the floor plan of the facility and the approximate location of each AP on the map. The purpose of an RF Plan is twofold. First, it enables retailer network engineers to use the Aruba RF Live feature to see real-time radio heat maps, as well as to locate rogue wireless devices if the optional Wireless Intrusion Prevention license is installed. Second, it suggests AP counts and placements that meet the customer’s specific RF coverage criteria based on connection needs (speed, coverage, or AP count) and redundancy (cell overlap).
Step 6 – Execute Full Deployment After a successful pilot deployment, begin the full deployment. Typically, multiple stores are installed each night by separate installation crews. The run rate of stores per night is determined by the retailer’s total store count, overall deployment timeline, and availability of resources to support the deployment.
Many times, large retailers find it attractive to outsource much of the deployment work to third-party systems integrators. This is especially true for large, nationwide rollouts. If properly trained, systems integrators can efficiently perform shipping, staging, configuration, and validation tasks.
For very large deployments with thousands of sites, it is not uncommon to have multiple deployment partners, each responsible for a different geographical region. Aruba has relationships with and can recommend experienced third-party integrators to assist with these tasks.
Retail Wireless Networks Validated Reference Design | Solution Guide Deployment Methodologies | 139

Recommended Deployment MethodologiesMerchants can adopt any of three principal deployment methodologies as best practices for Aruba rollouts. The choice of methodology is driven by store geography, VPN access to the stores, and the size of the rollout. The available methodologies are:
The Preprovision and Postprovision methodologies are shown in Figure 75.
Figure 75 Pre- and Post-Provisioning
Preprovisioning refers to the process of provisioning the APs before they arrive at a store. Provisioning refers to the process of programming the APs to find their controller, and of assigning their physical location on the store floor plan in order to show real-time heat maps in the controller. This is normally done at a retailer or system integrator staging center. Postprovisioning refers to the process of provisioning APs remotely after they are installed in a store. This is performed through VPN access from the retailer network operations center (NOC) to the controller located at each store.
Local DeploymentA local deployment is appropriate for smaller merchants in which all stores and warehouses are within 250 miles of each other and the IT staff is directly responsible for turn-up of each site. In this situation, it is most cost-effective to configure the controllers onsite at each local retail store. The pace of the rollout schedule is typically gated by the size of the retailer’s IT department.
From a process perspective, local deployment is similar to the postprovisioned model described below. The controllers are typically preconfigured in an IT lab before being driven to each site. A structured cabling vendor with experience installing APs and antennas typically mounts each AP and pulls any required cable runs. The retailer IT team then provisions the APs directly into the controller while they are onsite.
Deployment Scale Store Count Best Methodology
Local Under 50 sites Postprovisioned APs using customer IT staff
Regional Under 200 sites Preprovisioned APs using integrator
National Over 200 sites Postprovisioned APs using integrator
Ret
ail_
103
ship
ship ship ship
VPNfor
Preprovision APs Postprovision APs
ship
VPN for Provisioning
ship
ship
shipRAPs
ControllersAPsControllersAPs
StagingCenter
StagingCenter
RetailStore # 2
RetailStore # 3
RetailStore # 1
RetailStore # 2
RetailStore # 3
RetailStore # 1
DataCenter
IntegratorOperations
Center (IOC)
DataCenter
Provision APs in AirWave
140 | Deployment Methodologies Retail Wireless Networks Validated Reference Design | Solution Guide

Multi-City Deployment with Preprovisioned APsThe preprovisioned AP methodology is used as a best practice for medium sized merchants in a deployment model where controllers and APs are installed in multiple cities that are not in close proximity. In addition, APs must be preprovisioned in the following three cases regardless of the size of the deployment:
When there is no possibility of VPN access to the in-store network from a central NOC.
When stores do not use local onsite controllers; instead, remote APs are implemented. In this case, the APs are located at the store and the controller is located at the data center.
When the customer requires that APs be statically configured (this is discouraged but required in some customer layer 3 network designs).
The APs would normally be shipped to a retailer or integrator staging center to be preprovisioned, after which they are shipped to the actual store location. In this case, there needs to be VPN access from the staging center to the data center to bring each newly staged controller up in AirWave. VPN access is also required for Remote APs to establish communication and encryption keys with the controllers that will be managing the Remote APs.
Each AP has a unique MAC address. When APs are preprovisioned, each one is pre-assigned to a specific location in the store.
Each local controller uses the MAC address of the APs to make adjustments to important AP parameters. If an AP is placed in the wrong location, proper management is not possible and the management console will not display accurate information. Therefore, to avoid mistakes, preprovisioning is generally recommended for customers with a moderate number of locations (less than 200 stores), with traveling installation teams that can be counted on to install each and every preprovisioned AP in the right place each and every time.
Multi-City Deployment with Postprovisioned APsIn a deployment model where controllers and APs are installed in multiple cities that are not in close proximity, and secure VPN access is available to the store from a central NOC, it is much more efficient to postprovision the APs. This is especially true if there are thousands of stores.
Postprovisioning takes advantage of the Aruba AP auto-discovery features. The customer’s infrastructure must support either the resolving of ‘aruba-master’ via DNS, or the use of DHCP Option 43 in each store. In this case, APs can be shipped directly from Aruba to each store location, as opposed to being shipped first to a staging center for configuration. This avoids having to pay twice to ship and house the APs for the staging process.
For installation crews, Aruba postprovisioning features enable a grab-and-go model that is very convenient. It does not matter what AP goes in what ceiling location. When postprovisioned APs are installed, there is no possibility of placing APs in the wrong locations as in the Preprovision model. This is a risk mitigation technique for very large installs with dozens of stores being installed per night using a different crew on every store. Local labor can then be sourced by the prime contractor with minimal training requirements.
Once the APs are in the ceiling and powered up on the network, they must still be provisioned. This is where VPN access for the Integrator Operations Center or Customer NOC comes in. The installation crew sends a list of AP locations and corresponding MAC addresses by fax or email to the international operations center (IOC)/NOC. Aruba APs come with a field-removable sticker with the device MAC address. Installers generally paste the sticker into a prepared table with the store location IDs as they go.
N O T E
With preprovisioning, when the install team actually places the APs in the store, it is vital that they be placed in accordance with the floor plan map that has already been developed.
Retail Wireless Networks Validated Reference Design | Solution Guide Deployment Methodologies | 141
At the IOC/NOC, a network engineer logs into the store controller across the VPN and completes the provisioning process using the information from the install crew. The Operations Center releases the install crew to leave the site once all APs are provisioned and verified.
Preprovisioning MethodologyThis section describes the general steps to follow if using the Preprovision model with the controllers and APs that are shipped from Aruba to the staging center. These procedures are provided to help customers and their systems integrators prepare for a successful Aruba deployment. The procedures should be customized for the unique needs of each customer.
In this model, the controllers are provisioned first, followed by the APs. The controllers and APs are then shipped to the store location. If Remote APs are being implemented, they communicate with the master controllers that are preinstalled at the retailer data center. Then, at the store location, the APs are mounted in their pre-assigned locations according to their MAC address. In this situation, there is no need for a NOC to have access to the APs or controllers after they are installed in the store because all of the work that was done in the staging center. Assuming all the APs are mounted in the intended location, the system will operate just as it did during staging.
Staging the Controllers Follow this general procedure to stage and configure the controllers:
1. Unpack all the equipment.
2. Check all the controllers to make sure they power up.
3. Load the specific software image selected by customer onto the controllers.
4. Activate and load controller license keys.
5. Program the controller using the customer “baseline” configuration. Customize each controller with the proper IP addressing, AP naming, DNS, DHCP, and other store-specific values.
6. Load the store floor plan onto the controllers.
7. If you are implementing redundant controllers, repeat steps 1 through 5 for the second controller and test VRRP failover.
8. Add the controller in the AirWave console at the customer NOC if you are using AirWave (assumes VPN connectivity to data center).
9. Record controller serial numbers and asset information for the customer database.
All Aruba controllers are identified by “Regulatory Domain” for “Restricted” and “Unrestricted” use. If staging controllers for both restricted and unrestricted regulatory domains, it is important to verify each controller is configured and shipped to the correct site according to its approved regulatory domain. Controllers shipped to all US locations require Restricted Regulatory Domain controllers. These controller part numbers can be recognized by the “-US” (dash “US”) appended to the base SKU. Controllers shipped to all other locations are “Unrestricted”.
N O T E
Retain all original packing materials and note the packing details. Use the original packing materials and method for repacking to prevent any product damage when reshipping to the final destination.
142 | Deployment Methodologies Retail Wireless Networks Validated Reference Design | Solution Guide

Staging the APs Once the controllers have been staged, follow this general procedure:
1. Unpack all APs for a given location.
2. Check all the APs to make sure they power up.
3. Connect all the APs to a PoE switch.
4. Use the store controller in the staging center to provision the APs.
5. Assign each AP to a specific location on the store floor plan.
6. Record in a clear and legible manner the MAC address and location of each AP on the floor plan that will be given to the installation crew for that store, so the chances of the installer making mistakes during installation are minimized.
7. Repack and ship all the controllers and APs to the store location. Make sure the MAC addresses and location IDs are marked on each box or AP.
Store Installation Follow this general procedure to install the equipment in the store:
1. Unpack the controllers and APs.
2. Install the APs, making sure that each AP is installed according to its location and MAC address as noted on the floor plan.
3. Install the controllers (if implementing remote APs, no store controllers are installed).
4. Complete the Site Validation procedure.
Postprovisioning MethodologyThis section describes the general steps to follow to Postprovision controllers and APs. These procedures are provided to help customers and their systems integrators prepare for a successful Aruba deployment. They should be customized for the unique needs of each customer.
In this scenario, the controllers are shipped from Aruba to the staging center and the APs are shipped directly to the store. The controllers are provisioned and shipped to the store. During the installation at the store, any AP can be mounted in any location, and their locations and MAC addresses are carefully noted on the floor plan. This is generally done by pasting the MAC address sticker from each AP into a prepared table, and noting the AP code on the floor plan. Both the table and the floor plan are then faxed or emailed to the IOC/NOC, which then provisions them using a VPN connection directly to the store.
N O T E
If you are implementing remote APs, the staging center needs VPN connectivity to the master controller in the data center. A controller at the staging center is not required.
N O T E
The installers will most likely be working during a graveyard shift and likely have limited experience installing APs.
N O T E
Postprovisioning is not possible with Remote APs.
Retail Wireless Networks Validated Reference Design | Solution Guide Deployment Methodologies | 143

Staging the Controllers Follow the same preprovisioning procedure process for controllers as described in Staging the Controllers on page 142.
Store Installation 1. Unpack the controllers and APs.
2. Install the APs as desired, making sure that the MAC address and location of each AP is carefully noted on the floor plan.
3. Install the controllers.
Provisioning the APsThe APs must now be configured from the Integrator Operations Center (IOC) or Customer NOC. The IOC is a centralized resource to support the installation teams. The APs are configured using this general procedure:
1. While installers are onsite, after APs are mounted, the installer’s site foreman faxes or emails the store floor plan (annotated with the location and MAC address of each AP) to the IOC.
2. The IOC logs into the store controller using VPN.
3. The IOC provisions the APs.
4. The IOC assigns AP locations in the controller console.
5. The IOC verifies proper operation of the system and notifies the installation crew to depart.
Site Validation and Documentation ConsiderationsRegardless of which deployment methodology is selected, a standard site checkout and validation procedure must be developed to make sure that all stores are fully functioning before installer crews are released. Some common techniques are briefly described in the following sections. As with the procedures above, these must be adapted for each individual customer’s logical, RF, and security design as well as their unique client device population.
Controller ValidationIn the case where controllers are located at the store (remote APs are not implemented), you can do the following to verify proper operation:
Log in to the controller GUI and verify that all APs are up and the controller is showing normal operation.
Review the controller logs for boot-phase or other error messages.
Verify with the customer NOC that the controllers are visible on the AirWave management console.
Repeat the verification for any backup controller.
Manually test VRRP failover for any backup controller.
144 | Deployment Methodologies Retail Wireless Networks Validated Reference Design | Solution Guide

Cabling and AP ValidationPerform the following cabling tasks when new wiring is required to complete the installation:
Require the installer to scope each pulled run and print the test results.
Require the installer to TDR any installed antenna or RF cable and print the test results.
Perform a visual inspection of all APs and external antennas to make sure that cables are dressed in, the AP status lights are correct, and all antennas are extended and oriented properly.
If outdoor antennas are installed, complete a visual inspection to make sure that lightning arrestors are properly inserted and grounded, and that all connectors have been weather sealed.
RF ValidationUse the following verification methods to make sure that RF signals meet the criteria specified by the design team:
Use RF Live on the controller console to review a heat map for the facility to check that channel and power settings are within expected tolerances.
Complete a passive RF survey with AirMagnet, Ekahau, RFProtect Mobile, or other site survey tool to generate the “heat map” of store coverage.
If there is no budget for a tool such as AirMagnet or Ekahau, you can perform a less comprehensive validation by using Netstumbler during a walkabout to check for received signal strength indication (RSSI) values. This method does not produce a heat map.
For stores that do not pass certification testing, use APs from the reserve/spare pool to close coverage holes. In this case, you should perform a site survey to measure the location and area of holes.
Client Device ValidationComplete in-store validation testing requires device specific verification. Potential tests often include:
Walk around performing a continuous Ping test to see if APs and controllers can be reached. Verify that dropped packets are below a preset threshold.
Perform a basic client device walkabout test with each type of device used by store or DC employees and verify proper operation in a number of locations.
Complete detailed Client Device tests (for example, measure MOS scores on a voice handset while roaming around).
As-Built Documentation RecommendationsWhen an installation is complete, certain documentation should be created that captures how the system was built and configured. Examples include:
A three-column table containing all AP location IDs, AP names, and the sticker with the MAC address of the AP.
A markup of the floor plan with the exact final location of each AP (as opposed to the plan that was given to the install team in advance).
A record of saved config files from all controllers.
A record of all passwords.
Photographs of key locations, especially any install locations that deviated from expectations.
Final site drawing markups.
Retail Wireless Networks Validated Reference Design | Solution Guide Deployment Methodologies | 145

Post-Deployment PCI ReassessmentThe remediation phase of the PCI compliance process often requires the implementation of a new process or technology. Aruba WLAN deployments are usually conducted as part of this phase.
Upon the completion of an Aruba deployment, the cardholder data environment is considered “post-remediation” and is reassessed against the PCI DSS. A PCI-defined report of compliance (ROC) document is created and submitted to the pertinent bank or credit card brand, together with documentation listed below. Level 1 merchants must use the PCI-approved QSA for the ROC. Merchants at others levels may instead use a self-answered questionnaire.
Vulnerability scan(s) must completed by a PCI-Approved Scanning Vendor (ASV), and evidence of passing scan(s) must be submitted with the ROC.
A PCI-specified Attestation of Compliance document must be completed and submitted with the ROC.
Any other required supporting documentation must be submitted.
Each merchant must repeat the PCI compliance process annually as well as conduct quarterly network security scans using automated tools. Any compensating controls must be reviewed and validated annually.
146 | Deployment Methodologies Retail Wireless Networks Validated Reference Design | Solution Guide

Retail Wireless Networks Validated Reference Design | Solution Guide
Chapter 10Operations and Management
Retail organizations are actively building some of the largest wireless networks in the world, often fielding 30,000 or more wireless access points (APs). Managing those large scale Wi-Fi networks involves challenges a traditional campus-based enterprise does not encounter, even though the Wi-Fi hardware is exactly the same. The network is larger and more distributed, operating environments are more varied, onsite support resources are limited or nonexistent, and network security is critical.
The Aruba AirWave Wireless Management Suite (AWMS) provides the level of control IT needs to successfully manage a large, distributed WLAN with many APs and controllers, and to meet the newest PCI data security standard without additional hardware investment.
AirWave is specifically designed with features that meet the specific needs of merchants:
Manageability – Supports centralized configuration and control of the Wi-Fi infrastructure regardless of vendor or architecture.
Security – Detects devices and enforces security policies across all Wi-Fi devices automatically.
Visibility – Allows viewing of real-time information on every user and device as well as historical trend reports for planning and diagnostics.
Flexibility – Fits the Wi-Fi management solution to the existing network architecture.
PCI Compliance – Meets PCI v1.1 data security standard, consisting of nine WLAN specific requirements.
With the AWMS, retailers can effectively control the largest wireless LANs in the world, in thousands of remote locations.
Remote ManagementIn the retail environment, especially where each store is relatively small, local IT support does not exist, and onsite staff may not be able to diagnose or resolve network issues on their own. Efficient remote support has to come through a centralized NOC or operating costs will mount with each local service call.
Using the AWMS, remote IT staff gain the same type of information IT personnel would get as if they were standing in the store. Through a combination of RF monitoring using authorized APs and wired network scans, AWMS shows IT exactly who is connected to the network, what signal they are receiving, how much bandwidth they are using and how the network is performing locally.
AWMS provides a flexible grouping mechanism that enables logical segmentation of devices based on location, security, or even device type. Flexible grouping coupled with robust searching capabilities allows IT to quickly locate and drill into detailed data for a single device, a group of devices, an individual user, a group of users, a floor plan, or a building. Using the AirWave VisualRF module, IT sees where each user or Wi-Fi tag is located and can assess the RF environment for likely sources of interference. With this data, IT can diagnose problems quickly to determine whether the issue is related to the client AP, controller, or wired network.
Operations and Management | 147

Figure 76 shows an example of a user diagnostic page within AWMS that combines all upstream data and indicates potential bottlenecks or problems highlighted in red.
Figure 76 AirWave User Diagnostic Page
This diagnostic enables help desk personnel to quickly diagnose a problem or create an incident for a Level II support engineer. Help Desk personnel can correlate and capture this page or any page in AWMS to the incident. This capability makes sure that the Level II engineer can view the user’s experience as it was when the incident was created.
Figure 77 AirWave Help Desk Ticket
148 | Operations and Management Retail Wireless Networks Validated Reference Design | Solution Guide

Planning and Location ServicesMerchants with hundreds or thousands of stores need the ability to view real-time RF information at each location to ensure optimization and efficiently diagnose problems. A key feature, location services assist retailers in reducing costs and increasing productivity. Efficient stocking and inventory control benefit from the ability to quickly locate handheld guns and printers. Wi-Fi tag tracking helps reduce shrinkage by tracking high ticket items from dock to showcase.
An easy-to-use planning and provisioning tool, VisualRF reduces the time required for importing floor plans and provisioning APs. VisualRF provides a simple, intuitive, interface to guide even an RF novice through the process.
In a sample planning and provisioning scenario for a typical retailer, a typical procedure would take less than 15 minutes per store using VisualRF:
Import floor plan CAD file (DWG formats are converted automatically with dimensions and layers).
Associate floor plan with floor number and building.
Remove non-vital layers (cubes, writing, …).
Crop white space.
Draw external walls.
Auto provision APs by drawing provisioning region.
If using the Preprovisioning deployment methodology for store rollouts that is described in this chapter, the actual APs could be configured directly in AirWave at the retailer’s staging center. If using the Postprovisioning methodology, first install the stores, then return to the AirWave floor plan for each store and match the previously planned APs to actual APs.
Figure 78 3-D Navigation With VisualRF
This work produces an easy to use 3-D navigation capability as shown in Figure 78. This navigation capability enables all IT personnel quick access to location and diagnostic services within VisualRF without having to know the physical or logical network topology. AirWave uses the hierarchy of the network, campus, and building to organize floor plans. A campus is a collection of buildings; there is no requirement that they be physically near one another. Therefore, retailers often map their store Districts into the campus concept within AirWave, with each district loaded as a separate campus. Districts and stores can be named with their identifying numbers as well as the city or geographic region they cover.
VisualRF also provides auto import capability from MMS, AOS (Aruba controllers), RFPlan, and WCS. If you have already loaded your floor plans and placed your APs, you will not have to repeat the process when you install AWMS.
Retail Wireless Networks Validated Reference Design | Solution Guide Operations and Management | 149

From the building view you can select the floor of interest and obtain diagnostic and location information, as shown in Figure 79.
Figure 79 Floor Plan Views
From this view you can also focus on a client or AP, view Wi-Fi tag locations, view rogue devices, view roaming history, view heat maps, view data rates, view channel overlap, perform remote site surveys, adjust antenna properties, and view neighboring APs.
Managing Legacy and New APsA retail organization’s wireless LAN is significantly more likely to have hardware from multiple vendors than a standard enterprise organization with carpeted offices. Several key factors contribute to this diversity:
Mergers and acquisitions
Aggressive vendor management
Diverse operating environments
Large deployments and lengthy rollouts.
No matter how inexpensive the Wi-Fi hardware, the real cost of installing or replacing a wireless AP for a large merchant can be thousands of dollars. Changing APs in retail is not as easy as changing a light bulb, as some hardware vendors have maintained. Equipment must be staged, local contractors hired, and the work performed in a way that does not disrupt store operations. Even a small mistake can cost hundreds of thousands of dollars if it is replicated in every store location, so retail operators prefer to update a test segment of the network to work out the kinks with the upgrade. When the test upgrade is successful, the retailer gradually migrates the changes to the rest of the network, segment by segment. As a result, upgrading the entire network may take several years.
A retail network management platform must maintain extensive support for legacy devices and architectures while permitting the addition of new products. It must also allow the wireless network to function in logical segments, to enable new products and changes to be rolled out gradually.
The AWMS supports a broad library of the most popular Wi-Fi devices, including legacy hardware from the early days of Wi-Fi. The organization can extend the life of its existing investment and determine when to upgrade its network infrastructure.
Within AWMS, users can define as many device groups as needed, allowing retailers to set up test groups for new devices and configurations. When a network change is made, AWMS can implement it globally or segment by segment. Changes can be scheduled to occur late at night, to minimize the impact on local network performance.
150 | Operations and Management Retail Wireless Networks Validated Reference Design | Solution Guide

PCI ReportingRetail IT must guarantee the security of the network and corporate data. In order to comply with PCI standards and Visa’s Cardholder Information Security Plan (CISP) requirements, security policies must be properly defined and enforced. Non-compliance can result in substantial financial penalties and sanctions, including the prohibition to process Visa transactions.
The AirWave Management Platform helps retail organizations meet strict PCI/CISP standards that protect cardholder data with the following wireless network provisions.
PCI/CISP 11.1: Detect and locate rogue APs
The AirWave RAPIDS™ module uses both RF and wired network-scanning techniques to discover any unauthorized wireless APs connected to the retailers' network or broadcasting in the airspace.
RAPIDS wireline network scans are a reliable way to check for rogue devices in store locations that do not have wireless APs or RF sensors.
From the Rogue Detail page, shown in Figure 80, a user can quickly ascertain the radio
interfaces, LAN interfaces, manufacturer, signal, SSID, IP, operating systems, switch, port, all
devices that heard the rogue, and the physical location.
Figure 80 Rogue Detail Page
CISP: Maintain full, accurate audit trails.
AWMS logs all actions by administrative users, and allows IT to restrict administrative access to a subset of users by job function for additional security.
AWMS also supports integration into centralized administrative access solutions like TACACS+, which provides enhanced security and audit logging in addition to built-in AWMS features.
AWMS can store up to 18 months of user-session data so the retailer can perform forensic analysis in case a network breach is detected.
PCI 2.1.1/CISP: Change factory default passwords and settings (such as WEP keys, SSID, SNMP community strings, etc.)
AWMS allows IT to specify configuration policies for all wireless devices on the network and automatically configures the devices to comply with those policies.
AWMS automatically discovers wireless APs and controllers. Once you have authorized the newly discovered devices, AWMS automatically pushes your group-based configuration policies to overwrite the default settings (WEP keys, SSID, etc.)
Retail Wireless Networks Validated Reference Design | Solution Guide Operations and Management | 151

You can configure the AirWave software to scan your network using factory default credentials to make sure that no devices are responding.
PCI 2.2/CISP: Establish and maintain clear configuration policies
AWMS provides a central location where wireless configuration policies are defined and enforced.
AWMS continually audits all Wi-Fi devices to detect any policy violations and automatically restores the correct settings. An automated daily report lists all detected violations.
AWMS provides an audit log of every change to every device including date, time, user of record making the change, and the actual settings that were changed.
AWMS provides the ability to mandate and push a minimum firmware version for each manufacture and model. If a device is out of compliance AWMS will alert and automatically bring it back into compliance.
PCI 4.1.1/CISP: Use WPA whenever possible; if WEP is used, rotate shared keys quarterly and when personnel changes occur
AWMS allows IT to specify that WPA must be used on all Wi-Fi APs and to indicate which authentication servers will control access on that segment of the network. If WEP is used, AWMS makes it easy to update keys on all APs as needed.
PCI 1.1.2/CISP: Maintain accurate network inventories
AWMS provides alerts when any new device is discovered on the network as well as a daily new device report listing every new device discovered during the previous 24 hours.
AWMS provides alerts for down devices. This provides immediate notification if an AP is physically removed from the network or the premise.
The AirWave device inventory report, shown in Figure 81, provides a complete list of every component of your wireless infrastructure, including brand, model, version, IP address, MAC address, SSID, notes on physical location, and more.
Figure 81 Inventory Report
VisualRF software shows the physical location of each device on a floor plan or longitude and latitude for outdoor devices.
152 | Operations and Management Retail Wireless Networks Validated Reference Design | Solution Guide

Role-Based ManagementIn a typical retail organization, dozens or even hundreds of IT employees need access to information about the wireless LAN. A management solution designed only for network engineers cannot meet the diverse needs of all IT staff members.
Helpdesk staff typically fields calls from retail-store employees reporting network problems. The help desk needs to locate the remote user quickly (preferably by username), determine which store he is in, view real-time performance and usage data, and access historical information for diagnostic purposes. One help desk group may be responsible for all stores or the responsibility may be assigned to multiple, smaller help desks. This team usually has no administrative privileges for changing network settings or security policies.
AWMS has Help Desk specific screens that provide a snapshot of incidents, allowing staff the ability to quickly drill down and diagnose an end user-reported issue. 3-D navigation works very well if the help desk knows the location. Otherwise, the search mechanism will find all instances of a user on the network.
Figure 82 Help Desk Problem Resolution Progression
Network engineers need to manage device configurations on their segment of the network. Individual network engineers responsible for a geographic region or a specific set of stores should not have administrative access to other network segments.
Corporate network administrators need to define network and security policies across the entire network, as well as see detailed trend reports and exception reports.
Network planners need detailed trend reporting, by store and other logical groupings, in order to plan wireless network expansion to assure performance and security.
Installers (often contractors) need detailed installation reports and forms to fill in site-specific information, but typically should not be able to configure or monitor Wi-Fi devices on an ongoing basis.
IT security and audit teams must be alerted when device configurations violate policies or when rogue devices are discovered, and need to view audit trails and log files as needed.
Retail Wireless Networks Validated Reference Design | Solution Guide Operations and Management | 153

AWMS allows the IT organization to tailor permissions and views to match the responsibilities of these various IT users:
Password-protected user permissions can be set to ‘view-only’ levels for users who only need to monitor data, while ‘read-write’ administrative access is granted to network engineers. Users can be given permission to view data across the entire WLAN infrastructure or be restricted to those groups or devices for which they are responsible.
AWMS reports are automatically delivered to specified email distribution lists to make sure staff members receive job-appropriate information. The audit group can receive configuration-compliance reports and rogue-device reports, without administrative access to the system. Network planners can receive usage reports and trend data without accessing the AWMS system.
VisualRF provides special bill of material reports for installers without giving them access to any configuration data, ensuring security of the network and data.
ScalabilityFor a merchant with hundreds or thousands of store locations, installing two or three APs per store means the IT organization must manage a WLAN with thousands of APs. When corporate headquarters, distribution facilities, and local offices are included, it is not unusual for a retailer to have 30,000 or more APs (and tens of thousands of wireless devices) on its network.
Most management solutions are designed for smaller wireless networks, with limits on the number of APs or controllers that can be managed. This forces IT to manage their wireless LAN as multiple separate stand-alone networks. To operate a large, mission-critical wireless network, retail IT needs enterprise-grade features such as many-to-one automated failover, TACACS integration, and more.
The AWMS is designed for maximum scalability, and can routinely manage networks with 30,000-plus wireless APs. The AirWave Management Platform (AMP) is a software-only solution that allows the user to select a hardware platform that meets its needs rather than using a one-size-fits-all appliance with limited scalability.
AWMS also employs a distributed architecture that allows IT to install the software on multiple servers, and to manage and monitor the software from a unified, web-based Master Console. These servers can be co-located in a single NOC or distributed in multiple locations, as appropriate. As a result, AWMS has nearly unlimited scalability: more servers can be added as the WLAN grows without sacrificing centralized control and manageability.
Figure 83 Master Console
154 | Operations and Management Retail Wireless Networks Validated Reference Design | Solution Guide

Trend ReportingWhen a merchant decides to add another wireless AP to a standard store configuration, the decision impacts not one store but thousands; the cost is not a few hundred dollars, but several hundred thousand dollars. With so many remote locations, retailers tend to standardize their network environments to keep operational costs low. As a result, the successful retail IT organization needs to know not just real-time information on network utilization and performance in each store, but detailed trending data on individual users and devices:
Which APs are most heavily loaded, the APs on the shop floor or those on the shipping docks?
How variable are usage patterns? Are there peak usage times at certain points in the day or year, or is usage fairly steady?
Which users are causing the network traffic to increase? Was there a significant utilization increase in the 10 stores where you are testing wireless VoIP?
Are there seasonal patterns to network usage? Was there a spike in usage during the holiday season last year that would indicate that IT should plan for a comparable spike this year?
Only with reliable historical trending data added to real-time information can IT make informed, intelligent decisions about when, where, and how to grow their wireless networks.
Figure 84 Trend Reporting
The AMP provides both the real-time and historical information that retailers need. AWMS retains historical user and performance data for a year or more, enabling the IT staff to run detailed trending reports for specific groups of stores or globally across the entire network. AWMS also uses a flexible folder UI design that allows IT to examine retail shop-floor APs separately from back-office APs to get more granular trend and performance data.
Retail Wireless Networks Validated Reference Design | Solution Guide Operations and Management | 155

Diverse WAN EnvironmentsOn a campus network, a reliable broadband connection is nearly always available, so bandwidth and latency are not significant concerns. In a highly distributed retail environment, some stores may use a T1 connection and others may have a DSL connection—or even an intermittent satellite connection. Even if the primary connection is a broadband line, the emergency backup link typically is not. Retailers need management solutions that can adapt to the available bandwidth rather than forcing IT to re-architect their entire network infrastructure simply to support wireless.
AWMS provides maximum flexibility to support nearly any network environment, whether stand-alone or lightweight APs are deployed. Using Group-based parameters, IT can configure AWMS to poll network locations with a broadband connection frequently to provide near real-time monitoring data. In other locations, where bandwidth is more of a concern, the polling interval can be longer to minimize network traffic.
Similarly, the AWMS triggers and alert thresholds can be configured to reflect network design and support high-latency networks. On a high-latency network, for example, AWMS can be configured to wait longer for a response to a polling query. Instead of treating all network locations the same, AWMS provides IT maximum flexibility, fine-tuning management settings for each type of location.
156 | Operations and Management Retail Wireless Networks Validated Reference Design | Solution Guide

Retail Wireless Networks Validated Reference Design | Solution Guide
Appendix A
RF Concepts and Terminology
RF Concepts and Mathematics
RF PowerThe output power of a transmitter is usually specified in watts, milliwatts, or dBm (dB above 1 milliwatt). Typically, this power is specified at the output interface of the radio, which is internal to the access point (AP) for the case of an integrated antenna and at the output connectors for APs with external antennas. Maximum output RF power depends primarily on the AP hardware limitations and local regulatory requirements.
For effective planning, the output power of the client devices must also be considered. A typical and frustrating experience for clients is to plan and survey RF coverage based on the AP output power characteristics only. This is typical, for example, when a passive site survey is performed with the AP at full power for the purpose of determining the minimum number of APs that are required to cover a facility. Typical mobile client devices are limited in power to approximately 12-16 dBm (15-30 mW), whereas typical APs have output power up to 20 dBm (100 mW). If the lower output power of the client devices is not accounted for in the RF plan, the result is that the clients can receive transmissions from the APs (including broadcast SSIDs), but cannot effectively communicate back.
Thus, Aruba recommends planning the deployment around the client output RF power instead of the AP power characteristics. This is because the client device power is typically the limiting parameter for performance, and usually determines the required density of APs for desired bidirectional coverage and resulting throughput performance.
Output power can be adjusted by Aruba Adaptive Radio Management (ARM) to optimize a deployment automatically post installation, which minimizes the need for a pre-installation site survey to determine specific recommended output power levels at individual APs.
FrequencyFor wireless LANs, an antenna is tuned for either 2.4 GHz (802.11b) or 5 GHz (802.11a). An antenna will only work efficiently if the frequencies of the antenna and radio match. Some antennas are “dual band” which means that they are rated for transmission in both the 2.4 GHz and 5 GHz frequency ranges. In a mixed 802.11a/b/g deployment, the use of dual band antennas can simplify installation as there is a reduced chance for error due to connection of the wrong antenna to the wrong radio. Dual band antennas also allow for the ability to re-provision single radio APs to service 802.11a versus 802.11bg clients from the Aruba Controller without having to physically connect a different antenna.
RF Concepts and Terminology | 157

Antenna Gain and PatternThe gain of an antenna is specified in dBi, which is the directional gain of the antenna compared to an isotropic antenna. An isotropic antenna is an ideal (theoretical) antenna that spreads energy in all directions (in a sphere) with equal power.
Figure 85 Isotropic Antenna
Antenna gain is often confused with power because the gain of an antenna can increase the transmitted or received signal levels. However, it is important to note that gain is usually only stated as a maximum value and this value will increase signal levels only in a particular direction. This is because antenna gain is achieved only by compressing the radiated power into a tighter region in 3D space, and antennas (by themselves) do not create increased power. Antenna gain is more correctly described as a focusing of radiated power rather than an amplification of it. This means that any antenna with gain > 1 dBi will provide higher signal levels than the isotropic radiator in some directions, but will actually reduce signal levels in other directions. With increasing maximum gain, the area in 3D space with reduced signal level grows inversely with increasing gain. This means that higher gain antennas focus the power into a tighter and tighter region of space, which can actually result in much worse coverage if clients are not in the region of higher gain.
Free-Space RF PropagationThe RF signals emitted by an antenna go through significant attenuation, even in free space (i.e., no obstructions between the transmitter and the receiver), before they reach the intended recipient. The free-space propagation loss in dB is given by the formula:
The frequency of transmission f is specified in MHz and the distance d is specified in kilometers. The higher the transmission frequency, the higher the propagation loss is for the same distance.
The parameter n is known as the path loss exponent (indicating how fast the signal attenuates with distance), whose value is 2 for free-space communication. In non-line-of-sight communication and in indoor environments, many other factors such as attenuation due to absorption, reflections and multipath come into this equation. If the types of material and the exact amount of the attenuation are known, these losses may be added to the propagation loss formula to help you calculate the actual loss. In a mixed environment, such as a warehouse, a different path loss exponent value may be used instead to approximate the path loss. For example, a value of 2.5 to 4 may be typical of most indoor environments, though the path loss exponent can be as high as 8 in some RF unfriendly environments.
dfLp n 1010 log10log204.32 ++=
158 | RF Concepts and Terminology Retail Wireless Networks Validated Reference Design | Solution Guide

NoiseThe noise at the radio receiver consists of the thermal noise and the noise figure of the receiver. The thermal noise at room temperature is a known quantity, -174 dBm/Hz. Because 802.11 operates on 20 MHz channels, the thermal noise floor at room temperature is -174 dBm + 73 dB = -101 dBm. The typical noise figure of an 802.11 receiver varies from 4 dB to 10 dB. The noise figure of the receiver depends on the type and quality of the components used in the design (e.g., amplifiers). Based on these numbers, the typical minimum noise floor of an 802.11 device is in the range of -97 dBm to -91 dBm. The IEEE 802.11a standard specifies that the noise figure due to components, design and implementation be kept at or below 15 dB, thereby requiring a maximum noise floor of – 86 dBm.
Introduction of additional thermal noise or components with higher noise figures would alter the noise floor of the receiver. In addition, noise floor may also be affected by certain types of interference sources, though not all interference types result in increased noise floor. Since noise floor of a receiver may be affected by a variety of factors and may change with the operating environment, an 802.11 wireless device typically recalibrates the noise floor at periodic intervals (e.g., every 30 or 60 seconds). This is especially useful for client devices, where the noise floor may vary depending on the noise introduced by components used in the computer or client device. Since a client may be mobile, the external sources of noise from the environment may also change over time. It is also a good practice to periodically recalibrate the fixed wireless devices (e.g., Access Points), as the noise floor may change over time due to external or thermal factors.
Signal-to-Noise Ratio (SNR)The signal-to-noise ratio (SNR) is the ratio of the signal strength (dBm) at the receiver to the noise (dBm) floor. Since dBm is in logarithmic scale, SNR is obtained by subtracting the noise from the signal strength. The minimum required SNR for a receiver varies depends on the bit rate or modulation. The design of the receiver also plays a role in the minimum required SNR for a specific bit rate. A positive SNR is required (i.e., signal strength should be a higher than the noise) for reliable detection of a radio signal.
The typical minimum SNR requirements for 802.11 are shown in Table 23. The theoretical minimum SNR values for specific modulations shown in the table are usually lower, however in practice the SNR values are closer to the values given in the table. A minimum of about 4 dB SNR (± 2 dB depending on the design) is required for any reliable 802.11 communication (at 1 Mbps or 6 Mbps).
Receive SensitivityThe receive sensitivity of a receiver is the minimum power required at the receiver for reliable detection. In other words, the Rx sensitivity indicates the weakest signal the receiver can reliably decode. Similar to the SNR, the Rx sensitivity depends on the modulation and the bit rate. The design of the radio also plays a role in the Rx sensitivity, as some radios may have better (lower) Rx sensitivity than others for the same bit rate. The typical Rx sensitivity values for 802.11 vary from -91 (±3) dBm at 1 Mbps to -67 (±4) dBm at 54 Mbps. The lower the Rx sensitivity, the better the radio is. It should be noted that the Rx sensitivity alone is not a good indication of the weakest signal that can be reliably decoded. If the SNR is not sufficient due to higher noise floor, the system may be limited by the noise floor rather than the Rx sensitivity.
Table 23 Typical minimum required SNR for proper detection of 802.11 rates
DSSS Rates OFDM Rates
Rate (Mbps) 1 2 5.5 11 6 9 12 18 24 36 48 54
SNR (dB) 4 6 8 10 4 5 7 9 12 16 20 21
Retail Wireless Networks Validated Reference Design | Solution Guide RF Concepts and Terminology | 159
Link Budget AnalysisBecause each bit rate requires a specific minimum receiver sensitivity for a given radio, any wireless network (simply referred to as link for the purpose of this discussion) design must estimate the available link budget in dB to make sure that the link budget is at least 0 dB for the highest bit rate desired. It is also a good practice to leave some reasonable margin (e.g., 10 dB) in the link budget to accommodate any variations in signal strength caused by interferers or reflectors and to increase the reliability of the link. Use the link budget analysis to estimate the range or capacity or to select an antenna.
The first step in the calculation of the link budget is to calculate the received power at the receiver.
The received power is given as:
The equivalent isotropic radiated power (EIRP) is the correct technical term) in dBm is given as:
The path loss can be calculated using the appropriate path loss formula, as discussed earlier, and may include attenuations caused by other objects in the path, if known. The Receiver Gain is given as:
When the received power (or signal strength) is known, the link budget can be calculated by subtracting the receive sensitivity of the receiver from the received power:
The noise floor at the receiver can be subtracted from the received power to calculate the SNR. If the noise is lower than the Rx sensitivity, the link will be limited by the Rx sensitivity. Otherwise, the link will be limited by the noise floor.
For example, with 30 dBm EIRP (e.g., 23 dBm transmit power, 10 dBi antenna gain, and 3 dB cable/connector loss) in 2.4 GHz, the signal attenuates to -50 dBm at 100 meters in free space. For a receiver with receive gain of 0 dB (e.g., 2 dBi Receiver antenna and 2 dB cable/connector loss), the received power is -50 dBm. If the receive sensitivity is -91 dBm for 1 Mbps, then the link margin is 41 dB. However, if the noise floor is -85 dBm, then the SNR is 35 dB. In either case, the signal is more than enough to decode 1 Mbps. However, as the distance increases the noise floor will be the limiting factor in this specific example.
The choice of an antenna and transmit power are dictated by the specific requirements of the wireless system. For example, in order to create symmetric links (i.e., each end of the wireless link can talk to the other end with same bit rate at the same reliability), the transmit power at both ends should be kept the same, assuming the RX sensitivity and noise floor are identical at both ends. The range of the system for such symmetric networks should be increased by selecting the appropriate antennas on both ends, rather than increasing the transmit power at one end (which increases the range in only one direction). It is also important to calculate the link budget in both directions separately to make sure that the bidirectional system requirements are met, given the system parameters in each direction.
Received Power = Radiated Power/EIRP — Path Loss + Receiver Gain
EIRP (dBm) = Radio Transmit Power (dBm) — Cable/Connector/Switch Loss (dB) at
Transmitter + Transmit Antenna Gain (dBi)
Receiver Gain = Receive Antenna Gain (dBi) — Cable/Connector/Switch Loss (dB) at Receiver
Link Budget = Received Power — Receive Sensitivity
160 | RF Concepts and Terminology Retail Wireless Networks Validated Reference Design | Solution Guide

Target Data Rates, Client Bandwidth, and Required SNRAs we have seen, the range and coverage of each AP will depend on a number of RF considerations:
1. The lesser of AP or Client device power
2. The sum of the AP and Client antenna gains
3. The pattern of the AP antenna and client antennas
4. The receive sensitivity of the AP and Client radios
5. The target data rate and associated 802.11 required SNR
6. Consideration of Absorption and losses
In order to simplify the planning process, the above is typically reduced by making the following assumptions:
1. The client power will be lower than the AP power; typically, 12 dBm maximum is recommended to be used for planning purposes. Even in cases when the client power is known or advertised to be higher, it is not recommended to assume higher power unless verified by performance testing. There are many different ways to measure power, and maximum power is also dependent on the modulation and data pattern. The 12 dBm maximum is typical of many portable 802.11 client devices based on measurements.
2. The client antenna gain will be low (2 dBi). Many client devices will claim a higher gain antenna, but the pattern information is much less often provided for client devices. In many cases, higher gain on a client device can actually decrease the reliability of the signals because the use of higher gain omnidirectional or directional antennas means that gain is reduced in directions away from the maximum. Because in general the direction from the AP to the client is not known, the use of a lower gain antenna on the client will provide approximately uniform performance regardless of the client location relative to the AP. When a higher gain antenna is used on the client, and it cannot be guaranteed that the AP will be in the direction of the increased gain, the gain must be de-rated. Thus, 2 dBi is a good assumption for client antenna performance of any client antenna in the range of 2-5 dBi, unless there is a fixed and known directional relationship between the clients and the APs. For clients that will have a fixed direction to the AP, a higher gain antenna can be useful to improve performance, range and connection reliability.
3. The receive sensitivity is approximately equal (client and AP) and range will be determined by SNR using an assumed maximum noise floor of -90 to -85 dBm.
After using the above assumptions, we can now focus on target data rate and SNR in order to determine per-AP coverage. Table 24 provides the required SNR by data rate. Using an assumed noise floor of -85 dBm, the table shows the required receive signal levels to achieve various data rates.
Table 24 Typical rates, SNR, and Signal Levels for Typical -85 dBm Noise Floor Planning
DSSS Rates OFDM Rates
Rate (Mbps) 1 2 5.5 11 6 9 12 18 24 36 48 54
SNR (dB) 4 6 8 10 4 5 7 9 12 16 20 21
Signal Level (dBm) -81 -79 -77 -75 -81 -80 -78 -76 -73 -69 -65 -64
Retail Wireless Networks Validated Reference Design | Solution Guide RF Concepts and Terminology | 161

Unfortunately, 802.11a/b/g standards are stated in terms of the physical layer data rates and do not represent actual expected throughput. The following charts (Figure 86 and Figure 87) provide a correlation between expected actual throughput as a function of SNR and packet size:
Figure 86 TCP Downstream Throughput (WPA2, 802.11a)
Figure 87 TCP Downstream Throughput (WPA2, 802.11b/g)
AP80M to Client (802.11A) : TCP Downstream Throughput (WPA2)
0
5
10
15
20
25
5 6 7 8 9 10 11 12 13 14 15 16 17 18 19 20
Throughput (Mbit/s)
RS
SI a
t A
P (
dB
)
64
512
1500
Packet Size
AP80M to Client (802.11BG) : TCP Downstream Throughput (WPA2)
0
5
10
15
20
25
1 2 3 4 5 6 7 8 9 10 11 12 13 14 15 16 17 18 19 20 21 22 23
Throughput (Mbit/s)
RS
SI a
t A
P (
dB
)
64b
512b
1500b
64G
512G
1500G
Packet Size
162 | RF Concepts and Terminology Retail Wireless Networks Validated Reference Design | Solution Guide

Determining how much bandwidth each user will need depends on the applications. The bandwidth calculations will define the user experience as well as the number of APs required. A good rule of thumb for an 802.11a network is to allow for 2 Mbps downstream and upstream (4 Mbps total) per user, which delivers about the same user experience as being on a wired LAN. For an 802.11b network, a rule of thumb is to allow for 500 Kbps each way (1 Mbps total), which delivers a user experience similar to a broadband DSL connection.
Calculating Cell Size and Coverage ApproximationAfter you select a target data rate, use the Aruba Networks RF Plan or Airwave VisualRF planning tools to estimate the required number of APs and to determine proper AP placement. The information in this section is provided as a general guide for coverage planning.
The following tables assume these typical parameters:
Minimum of client or AP power: 12 dBm
Client antenna gain: 2 dBi
AP antenna gain: 3 dBi
Design margin: 6 dB
Noise floor: -85 dBm
Table 25 802.11BG Data Rates, Range, and Coverage Area
Rate 1 5.5 11 6 18 36 54
SNR 4 8 10 4 9 16 21
Signal Level (dBm) -81 -77 -75 -81 -76 -69 -64
Range (radius, meters) 380 240 190 270 190 96 54
Coverage Area (square meters)
453,646 180,956 113,411 229,022 113,411 28,953 9,161
Table 26 802.11A Data Rates, Range, and Coverage Area
Rate 6 18 36 54
SNR 4 9 16 21
Signal Level (dBm) -81 -76 -69 -64
Range (radius, meters) 160 90 40 22
Coverage Area (square meters)
80, 425 25,447 5,027 1,521
Retail Wireless Networks Validated Reference Design | Solution Guide RF Concepts and Terminology | 163

Comparing Dipole and Downtilt AntennasThe pattern plots of an antenna provide more complete information about its pattern-focusing effects. In general, there are two antenna types that both provide gain over the isotropic radiator: omnidirectional antennas and directional (also called sector) antennas. A special case of the omnidirectional antenna is called the down-tilt omnidirectional (or squint), and is described here because of its importance for many retail applications.
Figure 88 shows the horizontal and vertical patterns of three omnidirectional antennas. Note that omnidirectional is a reference to the pattern in the horizontal (azimuth) plane, which is equal in all directions. However, amongst these three omnidirectional antennas, there is various stated maximum gain, ranging from a low-gain (3 dBi) down-tilt omnidirectional to a high-gain (10 dBi) omnidirectional.
The figure shows that for omnidirectional antennas, gain is achieved by focusing the vertical pattern of the antenna. The higher the gain, the more tightly focused the coverage in the vertical direction.
Figure 88 Omnidirectional Antenna Patterns
Vertical Horizontal
High Gain AntennaAruba ANT-86
10 dBiVert Beamwidth: 8°Max Range: 500m
Collinear “Stick” Omni
Lower Gain AntennaAruba ANT-8
5dBiVert Beamwidth: 18°Max Range: 285m
Collinear “Stick” Omni
Down Tilt AntennaAruba ANT-14
3dBiVert Beamwidth: 60°
Centered at -45°Max Range: 226m
“Squint” Omni
164 | RF Concepts and Terminology Retail Wireless Networks Validated Reference Design | Solution Guide

In typical indoor office deployments with only a few feet separation vertically from the clients to the APs, high-gain omnidirectional antennas were often recommended since the horizontal range is increased and the clients are primarily in the horizontal direction.
However, in many retail environments, the available mounting locations for APs and antennas may be separated significantly in the vertical direction from the client locations. For example, if the antennas are ceiling mounted the APs and antennas may be all in the same horizontal plane (at the ceiling height) but separated by 30 to 40 feet from the clients in the vertical direction. In this case, the down-tilt omnidirectional antenna is recommended because it achieves two goals:
1. The direction of maximum gain is at 45 degrees downward from the antenna location (directed toward the clients).
2. The signal level directed at other antennas/APs is lowered, which helps to reduce AP to AP interference.
The example below shows the details of how antenna pattern and gain are inter-related. In this example, it is shown how a 3 dBi antenna (the downtilt or “squint” omnidirectional) can provide a stronger signal to the clients than the 10 dBi high-gain omnidirectional antenna. The high-gain antenna is commonly called a “stick omni” because it is tall and thin.
Case StudyThis case study addresses the question: When does a 3 dBi antenna provide a stronger signal than a 10 dBi antenna?
A common oversight in RF planning is to select antennas based on stated gain without consideration of the antenna pattern. This example illustrates how gain and pattern should be considered together for the case of ceiling mounted antennas in a warehouse. The conclusion is not trivial: the low-gain omnidirectional (3 dBi) actually provides a 20 dB stronger signal in both directions to the clients than the high-gain 10 dBi omnidirectional antenna. At the same time AP-AP interference is reduced significantly.
The squint is technically a directional antenna, because it faces down. However, the antenna is electronically designed to provide standard vertical polarization and in the horizontal plane operates as a full 360 degree omnidirectional. The antenna has a very low-gain (3-5dBi depending on frequency). This creates a tight, well-formed “cell” with the bulk of the signal focused down towards clients. This can be visualized as follows.
Figure 89 Omnidirectional Antenna Comparison, Azimuth View
10dBi “Stick” Omni 3dBi “Squint” Omni
Retail Wireless Networks Validated Reference Design | Solution Guide RF Concepts and Terminology | 165

The horizontal range of the squint antenna is much less than the high-gain antenna due to the lower gain. Note that above plots are for two APs operating on the same channel, 54 Mbps coverage, and at a reduced power setting (10 dBm). Figure 90 shows the vertical coverage of the same two antennas, which are mounted at a 40 foot height.
Figure 90 Omnidirectional Antenna Comparison, Elevation View
The elevation view shows the vertical pattern of both antennas when mounted at the same height. A more detailed analysis of the 2D pattern plots can show the performance difference in another way. Figure 91 shows the pattern plot for the high-gain antenna.
Figure 91 Vertical Coverage: High-Gain “Stick” Omni Pattern
This figure shows that the gain in the direction of other APs at the same mounting height is 10 dBi. However, the gain in the direction of clients (defined as -20º to -80º down angle) ranges from 0 dBi to -10 dBi.
For the low gain, squint omnidirectional antenna, the nominal gain is lower, but the direction of maximum gain is directed at 45º downward in the vertical plane and the vertical beamwidth is wider.
10dBi “Stick” Omni 3dBi “Squint” Omni
Ret
ail_
115
180165150
195210
225
240
255
270-30 -20 -10 dBi
285
300
315
330345015
30
45
60
75
90
105
120
135
High Gain Omnidirectional(10 dBi, 2.4 GHz)
Direction of maximumgain at 0°, gain = 10 dBi
10 dBi - 10 dBi = 0 dBi at -20°
10 dBi - 20 dBi =-10 dBi at 80°
Highest gain is directed at next APinstead of clients!
Weakest signal is directed to clients on floor!
166 | RF Concepts and Terminology Retail Wireless Networks Validated Reference Design | Solution Guide
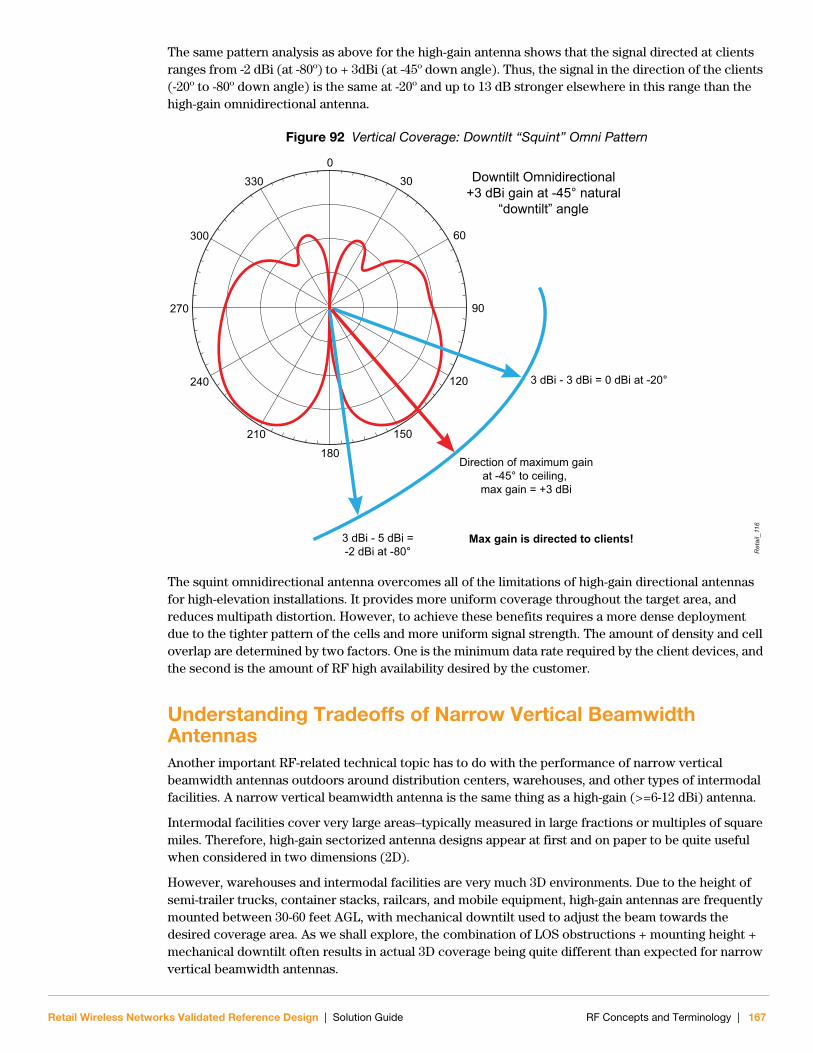
The same pattern analysis as above for the high-gain antenna shows that the signal directed at clients ranges from -2 dBi (at -80º) to + 3dBi (at -45º down angle). Thus, the signal in the direction of the clients (-20º to -80º down angle) is the same at -20º and up to 13 dB stronger elsewhere in this range than the high-gain omnidirectional antenna.
Figure 92 Vertical Coverage: Downtilt “Squint” Omni Pattern
The squint omnidirectional antenna overcomes all of the limitations of high-gain directional antennas for high-elevation installations. It provides more uniform coverage throughout the target area, and reduces multipath distortion. However, to achieve these benefits requires a more dense deployment due to the tighter pattern of the cells and more uniform signal strength. The amount of density and cell overlap are determined by two factors. One is the minimum data rate required by the client devices, and the second is the amount of RF high availability desired by the customer.
Understanding Tradeoffs of Narrow Vertical Beamwidth AntennasAnother important RF-related technical topic has to do with the performance of narrow vertical beamwidth antennas outdoors around distribution centers, warehouses, and other types of intermodal facilities. A narrow vertical beamwidth antenna is the same thing as a high-gain (>=6-12 dBi) antenna.
Intermodal facilities cover very large areas–typically measured in large fractions or multiples of square miles. Therefore, high-gain sectorized antenna designs appear at first and on paper to be quite useful when considered in two dimensions (2D).
However, warehouses and intermodal facilities are very much 3D environments. Due to the height of semi-trailer trucks, container stacks, railcars, and mobile equipment, high-gain antennas are frequently mounted between 30-60 feet AGL, with mechanical downtilt used to adjust the beam towards the desired coverage area. As we shall explore, the combination of LOS obstructions + mounting height + mechanical downtilt often results in actual 3D coverage being quite different than expected for narrow vertical beamwidth antennas.
Ret
ail_
116
0330 30
60
90
120
150
180
210
240
270
300
Downtilt Omnidirectional+3 dBi gain at -45° natural
“downtilt” angle
Direction of maximum gainat -45° to ceiling, max gain = +3 dBi
3 dBi - 3 dBi = 0 dBi at -20°
3 dBi - 5 dBi =-2 dBi at -80°
Max gain is directed to clients!
Retail Wireless Networks Validated Reference Design | Solution Guide RF Concepts and Terminology | 167

With respect, professional wireless designers generally think in terms of 2D pattern plots, and often do not fully consider or have the tools to model 3D behavior. In this section we attempt to help explain and visualize issues that specifically affect these deployment scenarios.
Effect of Increased Antenna Gain on Vertical BeamwidthAntennas neither create nor destroy energy. Rather, they are engineered to selectively focus energy in a desired shape and direction. Given a certain input power, the antenna designer must choose between horizontal range, horizontal beamwidth, and vertical beamwidth. Increasing any of these values will reduce the others. This is best visualized using 3D antenna models.
We begin by showing (in Figure 93) the relative horizontal and vertical beamwidths of two commonly used directional antenna types. On the left is a 12 dBi antenna (Aruba ANT-82) and on the right is a 7 dBi antenna (Aruba ANT-83). Both offer 90 degrees of horizontal beamwidth. This makes it easy to see how the increased gain of the higher-gain antenna comes at the expense of vertical beamwidth (60 degrees on the 7 dBi antenna versus only 10 degrees for the 12 dBi antenna). In this example, the antennas were modeled at a height of 30 meters.
The lighter area in the diagram in the upper right (and in the diagrams that follow in this section) shows the main lobe of the antenna in contact with the ground.
Figure 93 Effect of Higher Gain on Vertical Beamwidth
Plan ViewPlan View
Elevation View
12 dBi gain (ANT-82)90 degrees horizontal beamwidth
10 degrees vertical beamwidth
7 dBi gain (ANT-83)90 degrees horizontal beamwidth
60 degrees vertical beamwidth
168 | RF Concepts and Terminology Retail Wireless Networks Validated Reference Design | Solution Guide

Note how narrow the vertical beamwidth of the high-gain antenna is and that the main lobe does not touch the ground. And while the wider vertical beamwidth of the lower-gain antenna does touch the ground, it is only the bottom portion of the main lobe, meaning that most of the signal is wasted overhead. Both antennas could benefit from mechanical downtilt.
Effect of Mechanical DowntiltMechanical downtilt is used to aim an antenna mounted high up towards its intended coverage zone. With respect, our experience is that professional wireless designers are often casual about downtilt. They are generally content to estimate downtilt based on a quick ground-based visual inspection of a site without fully considering the 3D implications on the shape of delivered coverage at ground level. However, the results of high mounting height and modest downtilt can often surprise experienced wireless engineers, as we shall see in the following examples.
In this example, shown in Figure 94, we add 10 degrees of mechanical downtilt to the earlier model. At this setting, the main lobe of both antennas now hits the ground.
Figure 94 Effect of 10 Degrees of Mechanical Downtilt
The first surprise is that one can see that the narrow vertical beamwidth antenna on the left sacrifices close-in coverage in order to achieve greater range. This is the “null” area underneath the antenna before the pattern hits the ground. Mechanical downtilt cannot fully compensate for this. This is not an issue on the right, where more of the main lobe of the wide vertical beamwidth antenna now hits the ground.
Plan View
Elevation View
12 dBi gain (ANT-82) 7 dBi gain (ANT-83)
12 dBi (ANT-82)
7 dBi (ANT-83)
Retail Wireless Networks Validated Reference Design | Solution Guide RF Concepts and Terminology | 169

In Figure 95, we increase the mechanical downtilt to 15 degrees. One can see that at 10 degrees, the wide vertical beamwidth antenna on the right was already optimized for the target area. Increasing to 15 degrees just starts reducing coverage. For the narrow vertical beamwidth antenna on the left, 15 degrees still leaves a large gap near the antenna and the range (distance) advantage is no longer present. Note that the main lobe of the high-gain antenna now completely bisects the ground before the end of the coverage zone.
Figure 95 Effect of 15 Degrees of Mechanical Downtilt
Further increasing down-tilt to 30 degrees (as shown in Figure 96) for the narrow vertical beamwidth antenna in attempt to get better coverage close to the AP results in a distorted and narrow coverage pattern (lighter shaded area only is at ground level in above).
Figure 96 Effect of 30 Degrees of Mechanical Downtilt (ANT-82 Only)
Plan View
12 dBi gain (ANT-82) 7 dBi gain (ANT-83)
Plan View Elevation View
170 | RF Concepts and Terminology Retail Wireless Networks Validated Reference Design | Solution Guide

The second surprise is that at relatively modest mounting heights (e.g., 40-50 feet and common in this facility type) and small mechanical downtilts (10-15 degrees) the narrow vertical beamwidth antenna ends up painting only a small stripe on the ground. This is the opposite of what the wireless designer intended, which was to provide uniform coverage throughout the coverage area.
Effect of Vertical Beamwidth on Horizontal CoverageWhile it is true that higher-gain antennas have the effect of increasing range in the direction of the antenna gain, it is not true that the signal strength is the same everywhere in that direction. Because narrow vertical beamwidth antennas achieve the range by stretching the pattern, this also causes the null area that exists between every antenna and the beginning of its main lobe to stretch out as well. This can be visualized in Figure 97:
Figure 97 Typical Narrow Vertical Beamwidth Antenna (Elevation View)
This diagram is typical of a 12-14 dBi antenna with an 8 degree vertical beamwidth. It is assumed to be mounted at 30 meters with no downtilt.
We contrast this with a wide vertical beamwidth directional, in this case a 5 dBi, 60 degree sector, which has a null zone of just 50 meters or so from the same mounting height (See Figure 98). This will increase the gain by a little more than 2X results in a 9X increase in the size of the null zone.
Figure 98 Typical Wide Vertical Beamwidth Antenna (Elevation View)
Ret
ail_
139
447 m1,500 m
Ground level
50% radiated towards sky
50% radiated towards ground
N O T E
The dead zone in this example is almost one-quarter of a mile.
Ret
ail_
14053 m
600 mGround level
50% radiated towards sky
50% radiated towards ground
Retail Wireless Networks Validated Reference Design | Solution Guide RF Concepts and Terminology | 171

Assuming that the wireless designer is determined to use the narrow vertical beamwidth antenna, there are two methods available to reduce the size of the null area:
1. Use mechanical downtilt. However, as we have seen, relatively small amounts of downtilt (just 15 degrees) produce the striping effect and effectively reduce the overall coverage area.
2. Reduce the mounting height. This is the only effective way to maximize the coverage area of a narrow vertical beamwidth antenna while minimizing the null. For this reason, Aruba recommends that high-gain directionals used for client coverage (as opposed to point-to-point links) should never be mounted higher than about 30 feet with a maximum of about 5 degrees of mechanical downtilt.
Unfortunately, reducing the mounting height of a narrow vertical beamwidth directional also renders the main lobe more vulnerable to LOS obstructions.
ConclusionsHere is a short summary of the key points from this section:
High-gain antennas are primarily intended for long-distance, point-to-point connections, not close-in client coverage.
Vertical beamwidth is more important than horizontal beamwidth in determining the experience of clients.
Mechanical downtilt is not a good solution to compensate for narrow vertical beamwidth, and it has the effect of reducing the size of the main antenna lobe that reaches the ground.
High mounting heights are not compatible with narrow vertical beamwidth antennas due to the size of the null zone between the antenna and 3 dB points.
Low mounting heights are easily obstructed by container stacks and mobile equipment.
More power creates more reflections, increasing the overall amount of RF distortion.
An effective alternative overhead strategy uses low-gain “squint” omnis in intermodal facilities.
Understanding Differences between 900 MHz and 2.4 GHz/5 GHz SystemsAt various places in this guide we have addressed the topic of reusing existing cable plants to minimize the cost of a retail deployment. Retailers operate on tightly controlled margins, so the desire to avoid pulling new cable is understandable.
It is Aruba’s experience that most retailers have selected their existing 802.11 AP locations using a coverage design strategy. In some cases, much older 900 MHz Frequency Hopping (FH) APs existed in these same locations before the 802.11b or 802.11bg APs were installed, and the existing cabling was reused. This effectively means that the current 2.4 GHz radios have inherited a 900 MHz RF plan.
For this reason, it is appropriate to discuss critical differences between 900 MHz and 2.4 GHz/5 GHz operation. These differences mean that the design of the two types of systems is not interchangeable. In short, the only time that reusing an existing cable plan is possible is if the APs being replaced already have a density that is appropriate for 5 GHz operation.
Summary of DifferencesIt is a basic fact of physics that lower frequency radio energy travels farther though cables, through the air, and through and around ground clutter like trees, hills, and buildings. Here are some examples of propagation loss in three commonly used unlicensed frequency bands. Because these are expressed in
172 | RF Concepts and Terminology Retail Wireless Networks Validated Reference Design | Solution Guide

terms of loss, they are independent of initial Equivalent Isotropically Radiated Power (EIRP) from a transmitter/antenna combination.
Free Space Loss. The loss due to radio energy passing through air with a clear Fresnel zone.1
Generally, a 900 MHz signal travels through air with much less loss than does a higher frequency signal.
Cable Loss. The loss expected due to radio energy passing through RF cables2
Wall and Glass Loss. The loss expected due to radio energy being absorbed or reflected while passing through the walls and windows of a building. The amount of absorption or reflection varies depending on the construction materials and thickness of the material. Generally, more energy is absorbed at the higher frequencies.
In addition to differences in propagation losses, 900 MHz enjoys certain constructive advantages that are not present, or may be destructive to RF energy at higher frequencies due to shorter wavelengths. These include:
Gains from Reflection. In the real world, radio energy does not follow just one path from the transmitter to the receiver. In a cluttered NLOS environment (e.g., lots of buildings surrounding the receiving modem), the received signal is really the sum of many signals that have reflected off surrounding buildings, the ground, trees etc. With higher frequencies, more of the signal gets absorbed during a reflection. With lower frequency 900 MHz signals, more energy will ultimately reach the receiving antenna, benefiting from the reflections.
Impact on System DesignBecause of the significant differences in RF propagation in these different frequencies, however, it is absolutely vital that they be designed separately. It is not possible–and in fact will result in totally unacceptable performance–to use an RF Plan from a 900 MHz system and attempt to reuse the radio locations and radio densities for a 2.4 GHz/5 GHz system. A professional wireless site survey in the intended frequency band is a basic requirement for any 802.11a/b/g system.
In addition, when planning for 802.11a/b/g systems it is important to think of them as dense systems. Due to inherent propagation characteristics in the available frequencies and the regulatory limits placed on EIRP, any proper design will necessarily require more radios per unit of area than was the case with lower frequency bands.
1. See http://www.timesmicrowave.com/calculators/index.htm
900 MHz 2.4 GHz 5.8 GHz
Loss relative to 900 MHz at an arbitrary distance from radio
0 dB 8.5 dB 16.1 dB
900 MHz 2.4 GHz 5.8 GHz
150 feet – LMR400 5.9 dB 10.0 dB 16.1 dB
150 feet – LMR900 2.6 dB 4.4 dB 7.2 dB
2. Use the common formula: Free Space Loss = 20Log10(Frequency in MHz) + 20Log10 (Distance in km) + 32.4
Retail Wireless Networks Validated Reference Design | Solution Guide RF Concepts and Terminology | 173

174 | RF Concepts and Terminology Retail Wireless Networks Validated Reference Design | Solution Guide

Retail Wireless Networks Validated Reference Design | Solution Guide
Appendix B
Client Device Interoperability Matrix
Mobile applications in the extended retail industry (retail stores, warehouses, and factory floors) are unique in that they are not run on traditional Windows-based laptop-type devices. On the contrary, mobile applications run on a wide variety of application-specific devices (ASDs) that differ in form, input and output capabilities, operating systems, security capabilities, radio types, and more. Fifteen years and three generations of mobile device technology have further added to the mix of mobile devices that must be supported on the mobility infrastructure.
To validate Aruba device agnostic architecture, the Aruba solution is tested with a broad set of application-specific devices for interoperability, security, and mobility performance metrics. The following sections outline the devices tested, the security modes supported, and mobility performance metric measured.
This Interoperability Matrix is updated periodically. The most recent version may be found at: http://www.arubanetworks.com/support/interoperability.php
Tested DevicesTable 27 lists all of the mobile devices tested with the Aruba mobility infrastructure. The list includes relevant details such as vendor, model, operating system and software version for each device.
Table 27 List of Devices Tested on Aruba Infrastructure
Vendor Device Type Device Model Operating System Software Version
Symbol MC3000 MC3090 Win CE 5.00.1400
Symbol MC50 MC5040 Win Mobile 2003 4.21.1088
Symbol MC70 MC7090 Win Mobile 5.0 5.1.70
Symbol MC9000 MC9090S Win Mobile 5.0 5.1.70
Symbol PPT8800 PPT8846 Win CE .NET 4.10
Symbol PPT8100 PPT8146 MS PocketPC
Symbol VC5090 VC5090 Win CE 5.00.1400
Symbol MK2000 MK2046 Win CE 4.10
Symbol WT4090 WT4090 Win CE 5.00.1400
Symbol PDT6800 PDT6846 DOS
Intermec 700 series 751 MS PocketPC 4.20
Intermec CN2 CN2B MS PocketPC 4.20
Intermec CN3 CN3 Win Mobile 5.0 5.1.342
Intermec CK31 CK31 Win CE .NET 4.20
Intermec CK60 CK60 Win Mobile 5.0 5.1.70
Intermec T2425 T2425 DOS
Intermec T2455 T2455 DOS
Intermec CV60 CV60 Win CE.NET 4.20
Client Device Interoperability Matrix | 175
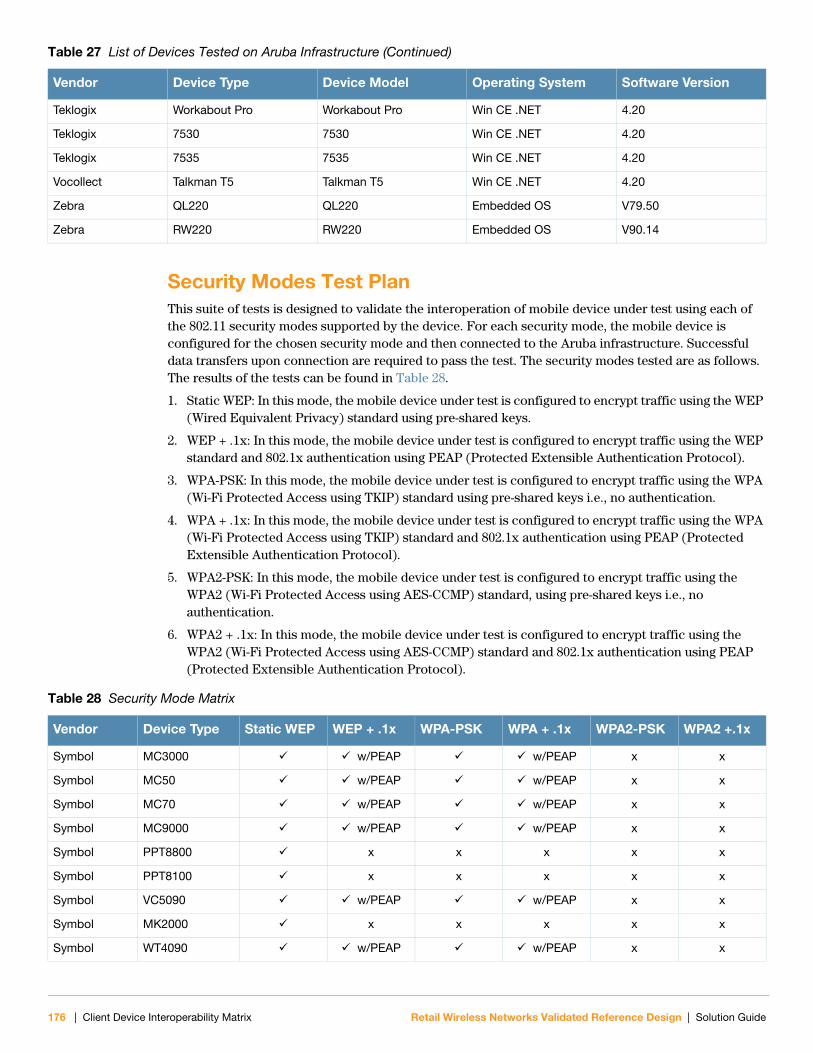
Security Modes Test PlanThis suite of tests is designed to validate the interoperation of mobile device under test using each of the 802.11 security modes supported by the device. For each security mode, the mobile device is configured for the chosen security mode and then connected to the Aruba infrastructure. Successful data transfers upon connection are required to pass the test. The security modes tested are as follows. The results of the tests can be found in Table 28.
1. Static WEP: In this mode, the mobile device under test is configured to encrypt traffic using the WEP (Wired Equivalent Privacy) standard using pre-shared keys.
2. WEP + .1x: In this mode, the mobile device under test is configured to encrypt traffic using the WEP standard and 802.1x authentication using PEAP (Protected Extensible Authentication Protocol).
3. WPA-PSK: In this mode, the mobile device under test is configured to encrypt traffic using the WPA (Wi-Fi Protected Access using TKIP) standard using pre-shared keys i.e., no authentication.
4. WPA + .1x: In this mode, the mobile device under test is configured to encrypt traffic using the WPA (Wi-Fi Protected Access using TKIP) standard and 802.1x authentication using PEAP (Protected Extensible Authentication Protocol).
5. WPA2-PSK: In this mode, the mobile device under test is configured to encrypt traffic using the WPA2 (Wi-Fi Protected Access using AES-CCMP) standard, using pre-shared keys i.e., no authentication.
6. WPA2 + .1x: In this mode, the mobile device under test is configured to encrypt traffic using the WPA2 (Wi-Fi Protected Access using AES-CCMP) standard and 802.1x authentication using PEAP (Protected Extensible Authentication Protocol).
Teklogix Workabout Pro Workabout Pro Win CE .NET 4.20
Teklogix 7530 7530 Win CE .NET 4.20
Teklogix 7535 7535 Win CE .NET 4.20
Vocollect Talkman T5 Talkman T5 Win CE .NET 4.20
Zebra QL220 QL220 Embedded OS V79.50
Zebra RW220 RW220 Embedded OS V90.14
Table 27 List of Devices Tested on Aruba Infrastructure (Continued)
Vendor Device Type Device Model Operating System Software Version
Table 28 Security Mode Matrix
Vendor Device Type Static WEP WEP + .1x WPA-PSK WPA + .1x WPA2-PSK WPA2 +.1x
Symbol MC3000 w/PEAP w/PEAP x x
Symbol MC50 w/PEAP w/PEAP x x
Symbol MC70 w/PEAP w/PEAP x x
Symbol MC9000 w/PEAP w/PEAP x x
Symbol PPT8800 x x x x x
Symbol PPT8100 x x x x x
Symbol VC5090 w/PEAP w/PEAP x x
Symbol MK2000 x x x x x
Symbol WT4090 w/PEAP w/PEAP x x
176 | Client Device Interoperability Matrix Retail Wireless Networks Validated Reference Design | Solution Guide

Mobility Performance Test PlanThis suite of tests is designed to validate that the Aruba infrastructure can reliably support mobile applications (provide application persistence in a truly mobile use-case). The results of these tests can be found in Table 29. This suite includes the following tests:
Fast Roaming: This test validates that mobile devices can roam from one access point (AP) to another with less than 30 ms latency so as to not disrupt any mobile applications.
Standby Roaming: This test validates that a mobile device can resume from the device stand-by mode and reliably re-connect to the infrastructure within 15 seconds.
Load Balancing: This test validates that mobile devices are automatically load-balanced between APs that have overlapping coverage to ensure higher overall network performance.
PSP Support: This test validates that mobile devices running in PSP (Power Save Polling) mode can reliably connect to the Aruba infrastructure. PSP mode is tested with different security modes and in roaming conditions.
Battery Boost: This test validates improved battery life on mobile devices when the Aruba battery boost features are turned on as compared to only standard PSP modes.
Symbol PDT6800 x x x x x
Intermec 700 series w/PEAP w/PEAP x x
Intermec CN2 w/PEAP w/PEAP w/PEAP
Intermec CN3 w/PEAP w/PEAP w/PEAP
Intermec CK31 w/PEAP w/PEAP w/PEAP
Intermec CK60 w/PEAP w/PEAP x x
Intermec T2425 x x x x x
Intermec T2455 w/PEAP w/PEAP x x
Intermec CV60 x x x w/PEAP
Teklogix Workabout Pro w/PEAP w/PEAP x x
Teklogix 7530 w/PEAP w/PEAP w/PEAP
Teklogix 7535 w/PEAP w/PEAP w/PEAP
Vocollect Talkman T5 x x x x
Zebra QL220 x w/PEAP x x
Zebra RW220 x x x x
Table 28 Security Mode Matrix (Continued)
Vendor Device Type Static WEP WEP + .1x WPA-PSK WPA + .1x WPA2-PSK WPA2 +.1x
Table 29 Mobility Performance Matrix
Vendor Device Type Fast RoamingStandby Roaming
Load Balancing
PSP Support Battery Boost
Symbol MC3000
Symbol MC50
Symbol MC70
Symbol MC9000
Retail Wireless Networks Validated Reference Design | Solution Guide Client Device Interoperability Matrix | 177

Symbol PPT8800
Symbol PPT8100
Symbol VC5090
Symbol MK2000
Symbol WT4090
Symbol PDT6800
Intermec 700 series
Intermec CN2
Intermec CN3
Intermec CK31
Intermec CK60
Intermec T2425
Intermec T2455
Intermec CV60
Teklogix Workabout Pro
Teklogix 7530
Teklogix 7535
Vocollect Talkman T5
Zebra QL220
Table 29 Mobility Performance Matrix (Continued)
Vendor Device Type Fast RoamingStandby Roaming
Load Balancing
PSP Support Battery Boost
178 | Client Device Interoperability Matrix Retail Wireless Networks Validated Reference Design | Solution Guide
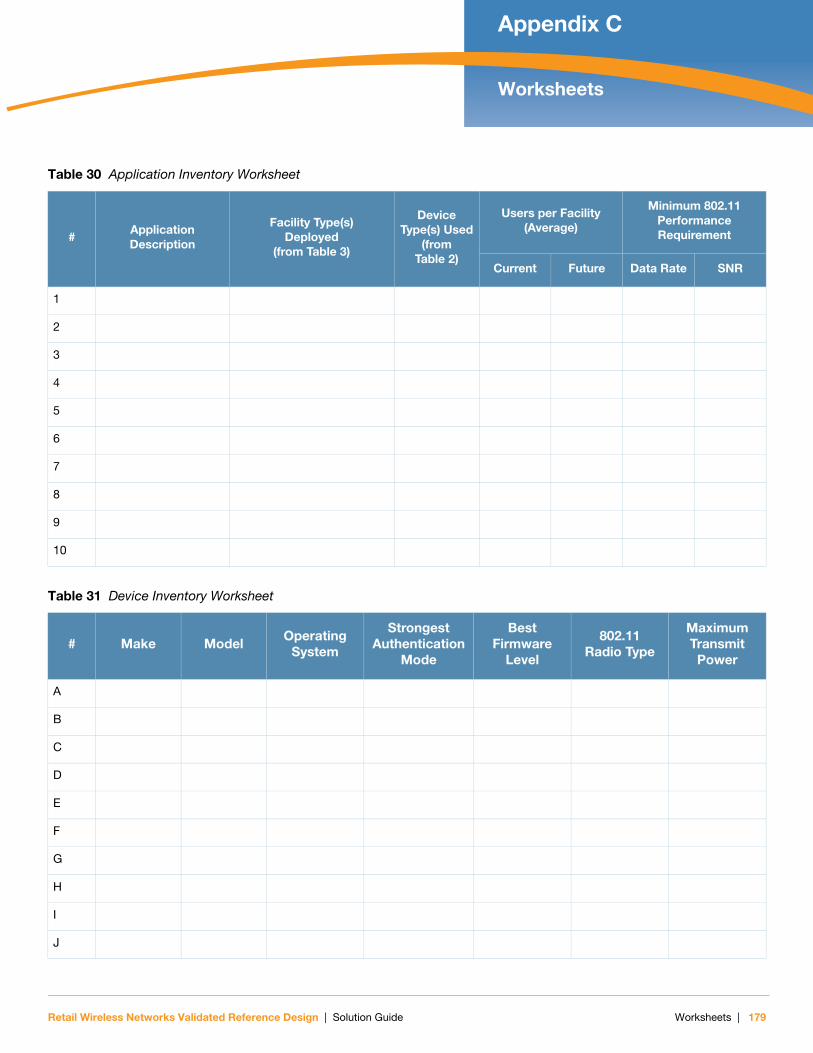
Retail Wireless Networks Validated Reference Design | Solution Guide
Appendix C
Worksheets
Table 30 Application Inventory Worksheet
#Application Description
Facility Type(s)Deployed
(from Table 3)
Device Type(s) Used
(from Table 2)
Users per Facility(Average)
Minimum 802.11 Performance Requirement
Current Future Data Rate SNR
1
2
3
4
5
6
7
8
9
10
Table 31 Device Inventory Worksheet
# Make ModelOperating
System
Strongest Authentication
Mode
Best Firmware
Level
802.11 Radio Type
Maximum TransmitPower
A
B
C
D
E
F
G
H
I
J
Worksheets | 179

Table 32 Facility Inventory Worksheet
Facility Type QtyFacility
Addresses / Store IDs
Average SquareFootage
Max Ceiling Height
Digital Floor Plan Available
Country/Regulatory
Domain
WANBackhaul
Speed
WANLink
Type/ Latency
Local Controller
Distribution Centers
Retail Stores - Country 1
Size Band 1
Size Band 2
Size Band 3
Size Band 4
Size Band 5
Size Band 6
Retail Stores – Country 2
Size Band 1
Size Band 2
Size Band 3
Size Band 4
Size Band 5
Size Band 6
Retail Stores – Country 3
Size Band 1
Size Band 2
Size Band 3
Size Band 4
Size Band 5
Size Band 6
180 | Worksheets Retail Wireless Networks Validated Reference Design | Solution Guide

Table 33 Hardened Environment Inventory Worksheet
Facility TypeHardened Area
Type(s) Per Location
Hardened Area
Count(s) Per
Location
Average Square Footage
Thermal Limits (Min or Max)
AP Model
2.4GHz Antenna Model & Mount
5 GHz Antenna Model & Mount
AP Backhaul Method
Distribution Centers
Retail Stores - Country 1
Size Band 1
Size Band 2
Size Band 3
Size Band 4
Size Band 5
Size Band 6
Retail Stores – Country 2
Size Band 1
Size Band 2
Size Band 3
Size Band 4
Size Band 5
Size Band 6
Retail Stores – Country 3
Size Band 1
Size Band 2
Size Band 3
Size Band 4
Size Band 5
Size Band 6
Retail Wireless Networks Validated Reference Design | Solution Guide Worksheets | 181

Table 34 User Device Types and Authentication Modes Matrix
User Authentication Modes
High-Security (WPA2/802.1x)
PresharedKey Security
(WPA/WPA2 with PSK
Legacy Security (WEP with PSK)
Voice (WPA/WPA2 with
PSK)
Captive Portal (no PSK)
Use
r D
evic
e Ty
pes
Manager Device
POS Terminal
Inventory Device (New)
Inventory Device (Legacy)
Guest Device
Voice Handset
Device #7
Device #8
Device #9
Device #10
Device #11
Device #12
182 | Worksheets Retail Wireless Networks Validated Reference Design | Solution Guide

Table 35 QoS Settings Inventory
QoS Configuration
Handset Capability(see Table 2)
Controller Configuration Handset Configuration
Des
ign
Par
amet
ers
Band Selection
Adaptive Radio Management
Separate SSIDs
Authentication
VLAN Settings
Battery Life
RF Management
Capacity Planning
Retail Wireless Networks Validated Reference Design | Solution Guide Worksheets | 183

184 | Worksheets Retail Wireless Networks Validated Reference Design | Solution Guide


