Dexcom Studio Software | User’s Guide · Dexcom Studio Software User’s Guide For Use with the...
60
1 Dexcom Studio Software User’s Guide For Use with the Dexcom Continuous Glucose Monitoring Systems
Transcript of Dexcom Studio Software | User’s Guide · Dexcom Studio Software User’s Guide For Use with the...

-‐ 1 -‐
Dexcom Studio Software
User’s Guide
For Use with the Dexcom Continuous Glucose Monitoring Systems

-‐ 2 -‐
Table of Contents
1 INTRODUCTION TO DEXCOM STUDIO DATA MANAGER SOFTWARE ................................. 4
1.1 CONTACTING TECHNICAL SUPPORT AT DEXCOM, INC. ............................................................... 4 1.2 SYSTEM COMPATIBILITY AND MINIMUM SYSTEM REQUIREMENTS ............................................... 5 1.3 IMPORTANT INFORMATION BEFORE YOU BEGIN USING THE SOFTWARE ........................................ 6 1.4 INSTALLING DEXCOM STUDIO SOFTWARE .............................................................................. 7 1.5 RUNNING THE SOFTWARE FOR THE FIRST TIME ..................................................................... 10
2 DEXCOM STUDIO SOFTWARE NAVIGATIONAL OVERVIEW ............................................. 10
2.1 RUNNING THE SOFTWARE ............................................................................................... 10 2.2 THE MENU BAR ........................................................................................................... 11 2.3 THE TAB BAR ............................................................................................................... 12 2.4 POP-‐UP WINDOWS ...................................................................................................... 13 2.5 EXITING THE SOFTWARE ................................................................................................. 13
3 DOWNLOADING DATA FROM THE DEXCOM RECEIVER ................................................... 13
3.1 CONNECTING THE DEXCOM RECEIVER TO YOUR PC ................................................................ 13 3.2 ASSIGNMENT OF DOWNLOADED DATA TO THE PATIENT DATABASE ............................................ 14
4 CHARTS/REPORTS .......................................................................................................... 15
4.1 CHANGING THE CURRENT PATIENT .................................................................................... 15 4.2 VIEWING, PRINTING AND SAVING CHARTS/REPORTS ............................................................. 16 4.3 PATTERNS TAB ............................................................................................................. 18 4.4 SUCCESS REPORT TAB .................................................................................................... 21 4.5 GLUCOSE TREND TAB ..................................................................................................... 24 4.6 HOURLY STATS TAB ....................................................................................................... 27 4.7 DAILY TRENDS TAB ....................................................................................................... 30 4.8 DISTRIBUTION TAB ........................................................................................................ 31 4.9 DAILY STATS TAB .......................................................................................................... 33 4.10 A1C RECORDS TAB ....................................................................................................... 35 4.11 CUSTOMIZING CHARTS/REPORTS ...................................................................................... 36 4.12 QUICK PRINT ............................................................................................................... 40
5 PATIENT MANAGEMENT ................................................................................................ 40
5.1 ORGANIZING AND SORTING THE PATIENT LIST ...................................................................... 41 5.2 SELECTING A PATIENT AS THE CURRENT PATIENT ................................................................... 42

-‐ 3 -‐
5.3 EDITING A PATIENT ....................................................................................................... 42 5.4 REMOVING A PATIENT ................................................................................................... 43 5.5 EXPORTING PATIENT DATA .............................................................................................. 43 5.6 VIEWING EXPORTED DATA .............................................................................................. 44 5.7 SAVING/LOADING PATIENT FILES ...................................................................................... 45 5.8 CONNECT TO TECHNICAL SUPPORT .................................................................................... 45
6 OPTIONS ........................................................................................................................ 46
6.1 GLUCOSE DISPLAY UNITS ................................................................................................ 46 6.2 PATIENT DATA EXPORT .................................................................................................. 47 6.3 DEFAULT CHART/REPORT ............................................................................................... 47 6.4 QUICK PRINT CONFIGURATION ........................................................................................ 48 6.5 HEALTH CARE PROFESSIONALS ......................................................................................... 49 6.6 PATIENT DISPLAY .......................................................................................................... 50 6.7 GLUCOSE RANGE LISTS ................................................................................................... 51 6.8 APPLICATION APPEARANCE ............................................................................................. 53 6.9 MANAGE OPTIONS AND SETTINGS .................................................................................... 53
7 TOOLS ........................................................................................................................... 54
7.1 RESET THE DEXCOM RECEIVER DATABASE ........................................................................... 54 7.2 ACTIVATE CLINICAL FEATURES .......................................................................................... 56 7.3 BLINDING AND UNBLINDING THE RECEIVER DISPLAY .............................................................. 57 7.4 DISPLAYING BLINDED DATA IN SOFTWARE CHARTS/REPORTS................................................... 57 7.5 IMPORTING DM3 PATIENT DATABASE INTO DEXCOM STUDIO .................................................. 58 7.6 INSTALLING RECEIVER DRIVER .......................................................................................... 58
8 HELP .............................................................................................................................. 58
8.1 ABOUT ....................................................................................................................... 58 8.2 ONLINE HELP ............................................................................................................... 58 8.3 SOFTWARE LICENSE AGREEMENT ...................................................................................... 59
9 APPENDIX ...................................................................................................................... 59

-‐ 4 -‐
1 Introduction to Dexcom Studio Data Manager Software
The Dexcom Studio Data Manager software is an accessory software program intended to allow the transfer of glucose data stored by the Dexcom Continuous Glucose Monitoring System into a personal computer (PC). The software can be used by either a clinician or an end user.
WARNING: This software does not provide any medical advice and may not be relied upon for that purpose. Do not make fundamental changes in your treatment program without talking to your healthcare professionals.
After downloading the glucose data stored in the Dexcom CGM Receiver, the Dexcom Studio software displays the information in both charts and tables to help analyze trends and patterns in your glucose levels.
NOTES: • Throughout this User’s Guide, the “Dexcom Continuous Glucose Monitoring System” will be referred to as the “Dexcom System”, or “system”, the “Dexcom CGM Receiver” will be referred to as the “receiver”, the “Dexcom Studio Data Manager software” will be referred to as the “Dexcom Studio software” or “software” and “Dexcom Data Manager 3” will be referred to as “DM3”.
• Dexcom Studio Data Manager software is backward compatible with the Dexcom SEVEN Plus Continuous Glucose Monitoring System.
1.1 Contacting Technical Support at Dexcom, Inc. (U.S. Only)
The Dexcom Technical Support Team is available Monday through Friday from 6 AM to 5 PM Pacific Standard Time (PST) to assist you and answer questions about Dexcom Studio.
Telephone: 1-858-200-0200 or 1-877-339-2664
Web: www.dexcom.com
Email: [email protected]
Outside the U.S., please contact your local distributor.

-‐ 5 -‐
1.2 System Compatibility and Minimum System Requirements
Dexcom Studio software runs on the following operating systems:
§ Microsoft Windows 8 § Microsoft Windows 7 SP1 § Microsoft Windows Vista SP2 § Microsoft Windows XP SP3 § Microsoft Windows Server 2008 R2 SP1
NOTE: Dexcom Studio software will run on systems supported by either 64-bit or 32-bit processors.
Dexcom Studio software requires the following minimum system hardware and software requirements:
• Minimum display screen resolution of 1024 x 768. Higher resolution may be necessary if you activate software options that require higher resolution, such as a large font size.
• The software requires 32bit color for proper display of user interface • 1 GHz Pentium Processor or equivalent • 300 MB free RAM • 50 MB free hard drive space for a single patient. • Mouse • USB 2.0 port to attach the receiver for data downloads • USB to micro USB cable to connect the receiver to your PC for data downloads. Only use the
cable that is provided with the Dexcom System. • CD-ROM reader (if software will be installed from the CD). Software may also be installed via
web download. • A software program that can handle “.doc” files (e.g., Microsoft Word 2003, Microsoft Word
2007, Apache OpenOffice) for viewing, saving, and printing charts/reports • Printer (if hard copies of charts/reports are desired) • Internet connection of at least 56 Kb/s to:
o install the software from the web (optional) o send diagnostic information to Dexcom Technical Support o view online Help, link to the Dexcom web site, or troubleshoot technical problems with
the Dexcom System • Microsoft® .NET Framework 4.0. If you do not already have Microsoft® .NET Framework 4.0
installed on your PC, a copy is available as part of the software installation. Before installing Microsoft® .NET Framework 4.0, you must: o have Windows Installer 3.1 or later installed o have 850 MB free hard drive space (2GB on 64bit OS) o install all the latest Service Packs (SPs) and critical updates that apply to your operating
system. This includes update KB959209 (to address application compatibility issues)

-‐ 6 -‐
and update KB967190 (to address an XPS document file association issue if you are using Windows Vista® or Windows Server 2008 64-bit systems).
Dexcom Studio software requires the user to have the following access rights to install and run the software:
• Administrator rights to install the Dexcom USB/COM (Dexcom receiver) software driver
o Read/write/modify/execute rights to the location/folders where the software application files reside and to the data folder.
1.3 Important Information Before You Begin Using the Software
• The receiver holds up to 30 days of sensor data in its memory. When the memory is full, the oldest data records will be replaced with the newest data records as new sensor data is collected. For this reason, Dexcom recommends that receiver data be downloaded to the software every 3-4 weeks at a minimum. This will allow for all the sensor glucose readings to be included in the charts/reports, and will keep these data records from being lost.
• The receiver displays and stores sensor glucose readings from 40-400 mg/dL (2.22-22.20
mmol/L). Sensor glucose readings above 400 mg/dL (22.20 mmol/L) are displayed as “High”, and sensor glucose readings below 40 mg/dL (2.22 mmol/L) are displayed as “Low”. When sensor glucose readings are downloaded to the software, readings above 400 mg/dL (22.20 mmol/L) are converted to 401 mg/dL (22.26 mmol/L) and readings below 40 mg/dL (2.22 mmol/L) are converted to 39 mg/dL (2.16 mmol/L). When exporting data, readings above 400 mg/dL (22.20 mmol/L) are output ”High”, and readings below 40 mg/dL (2.22 mmol/L) are output as ”Low”. Some calculations in charts/reports, such as percentages, may not total 100% exactly due to rounding.
• The software will automatically search for a connected receiver whenever you run the software. If the software detects a connected receiver, it will begin the steps for downloading data from that receiver. You will need to have the receiver software drivers installed on your PC that enable the PC to connect to and download data from the receiver. You will need to run the software with administrator rights to install the drivers.
• Software charts/reports always reflect the data for the “current patient”. The current patient is defined either by the patient name recognized or created during the current data download, or the current patient from the last time the software was run. Changing the current patient will automatically update all the charts/reports/tabs to the new patient.
• The first time you run the software, it will use the default settings for the options available for viewing and printing Charts/Reports, setting the Home screen, etc. You can customize these settings while running the software, as well as restore the default settings at any time.

-‐ 7 -‐
• You can change the default language of the software in the Options Tab, under Application Appearance.
1.4 Installing Dexcom Studio Software The Dexcom Studio software Setup Wizard will walk you through the steps for installing the software.
1. Insert the software CD into the CD-ROM drive on your PC. 2. Follow the prompts from the Setup Wizard for installing the software.
If you do not have a CD-ROM drive, you may also download the software from the Products page on the Dexcom website at http://www.dexcom.com. You have the option to run the setup program (setup.exe) from the website, or save the setup program to your PC where you can run it at another time, as long as you still have an internet connection.
During installation, you will be prompted to select a destination folder for storing the software files. You can choose the default destination (C:\Program Files\Dexcom\Dexcom Studio) or another destination. Make note of any alternate destination folder so you will remember where you can access the software files.
You will also be prompted that you need administrator rights to install the receiver software drivers. The drivers enable the PC to connect to and download data from the receiver. The Software will detect and install the receiver driver during the Software installation process, if the receiver is connected to the PC. A manual installation of the drivers can be done from the Tools menu.
When you run the software with administrator rights, a series of pop-up window prompts will walk you through the driver installation process. The first prompt will tell you to disconnect any receivers from your PC, and then click OK to Continue.

-‐ 8 -‐
The Device Driver Installation Wizard pop-up window will appear. Click Next To Continue.
Click Install on the Windows Security pop-up window to confirm that you want the drivers installed.

-‐ 9 -‐
Click Finish to complete the installation.
You will then be prompted to attach your receiver to your PC to complete the installation. After connecting, click OK.
After installation, the Dexcom Studio icon will appear on the PC desktop as a shortcut to run the software.

-‐ 10 -‐
You can also access the software by first clicking Start on the PC taskbar, and then clicking All Programs. Click to open the Dexcom folder, and then click the Dexcom Studio icon to run the software.
1.5 Running the Software for the First Time The first time you open/run the software, a Software License Agreement pop-up window will appear. Click YES to agree to the terms and then click OK to continue.
Click NO and Cancel to exit the software.
The Software License Agreement may be viewed under the Help menu on the tool bar. See Section 8, Help.
If you have the Dexcom Data Manager 3 software installed on your computer, Dexcom Studio will attempt to import the DM3 patient files automatically at the first run.
2 Dexcom Studio Software Navigational Overview
2.1 Running the Software Find the Dexcom Studio icon on the PC desktop or in the destination folder where you saved the software files during installation. To run the software, click the icon.
The home screen will appear each time you run the software. The home screen is divided into sections that let you access the key features of the software, and keep you informed on the status of operations.

-‐ 11 -‐
2.2 The Menu Bar The menu bar sits at the top of software screen and consists of 3 drop down menus.
File – lets you launch the Quick Print feature where you customize and print a batch of charts/reports. With Quick Print, you can set up the software to print the same set of charts/reports with the same set of options. You can also exit the software from the File drop down menu.
Tools – lets you reset the receiver database. Resetting will erase all data from the receiver, set the receiver time and date to the Internet time and date, and preserve the prior transmitter ID and blind/unblind settings back into the receiver. Tools also lets health care professionals activate special Clinical Features that will blind/unblind receiver data downloads when using the data for clinical trials. Tools menu also allows you to import your Dexcom DM3 patient database, as well as install the relevant receiver drivers, if needed.
Help – lets you obtain information about the software version you are using, get online help, view the Software License Agreement and troubleshoot the system with Dexcom Technical Support.

-‐ 12 -‐
2.3 The Tab Bar The tab bar sits below the tool bar on software screens. There are 10 graphic tabs that let you quickly access that software feature. Click any tab to go directly to that software screen.
Home tab – displays the home screen. You can customize the home screen to show the Dexcom
logo, or the Dexcom web portal. See Section 6, Options, for setting the Home screen.
Charts/reports tabs – displays a report/chart/graph for the patient and date range.
• Patterns
• Hourly Stats
• Daily Trends
• Distribution
• Glucose Trend
• Daily Stats
• Success Report
• A1c Records
Patients tab – displays the patient screen where you can manage a patient database.
Options tab – displays the options screen where you can customize how you use the software.

-‐ 13 -‐
2.4 Pop-Up Windows
Certain display windows will pop-up when running the software and may prompt you to make a selection. On some windows you must either make a selection or click the X on the top right of the window to close the window and continue running the software.
2.5 Exiting the Software
Click the X on the top right of any software screen, or select Exit from the File drop down menu.
3 Downloading Data from the Dexcom Receiver You can download glucose readings and other data from the Dexcom System by connecting the receiver to your PC. Whenever you run the software, it is designed to automatically search for a receiver every few seconds and begin the download process whenever it finds one.
NOTE: The receiver holds up to 30 days of sensor data in its memory. When the memory is full, the oldest data records will be replaced with the newest as new sensor data are collected. For this reason, Dexcom recommends that the receiver data be downloaded to the software every 3-4 weeks at a minimum. This will allow for all the sensor glucose readings to be included in the charts/reports, and will keep these data records from being lost.
3.1 Connecting the Dexcom Receiver to your PC You will need the USB to Micro USB cable provided with your Dexcom System to connect the receiver to your PC.
1. Slide open the USB port cover on the side of the receiver (skip this step for Seven Plus Receiver).
2. Plug the Micro USB end of the cable into the receiver USB port.
3. Connect the other end of the cable into any free USB port on your PC.

-‐ 14 -‐
Once the software recognizes that a receiver is connected to the PC, it will identify that receiver by its serial number in the status area on the home screen. Then the software will begin the download. The status area will indicate the progress of the download.
NOTES:
• Only one receiver at a time can be connected to the PC for data downloading. If multiple receivers are connected, an error message will appear in the status area of Dexcom Studio.
• If data has already been downloaded from a receiver, the receiver status area will indicate "Finished".
3.2 Assignment of Downloaded Data to the Patient Database The software will first try to assign the new receiver download to an existing patient record (that has been previously matched with this same receiver). If it does not find a match, the Edit Patient pop-up window will appear where you can create a new patient record for this download. See Section 5, Patient Management, for editing patient record information.

-‐ 15 -‐
NOTE: As soon as a data download is complete, the software will display the chart/report you select in the Options tab, for the patient name recognized or created during the patient download. See Section 6, Options, for selecting the chart/report that is automatically displayed after downloading. That chart/report will be displayed even if no new data have been downloaded.
4 Charts/Reports You can choose from several charts/reports to view, analyze, and print patient data. The software will always use data from the current patient as the basis for displaying data. The current patient is defined either by the patient name recognized or created during the current data download, or as the current patient from the last time the software was run. You can change the current patient from any software screen. Changing the current patient will automatically update all the tabs/charts/reports to the new patient data. The new current patient will appear in the current patient window.
NOTES: • As soon as a data download is complete, the software will display the chart/report you select in
the Options tab, for the patient name recognized or created during the patient download. See Section 6, Options, for selecting the chart/report that is automatically displayed after downloading.
• You can customize certain charts/reports by selecting the viewable time period, and filtering the data. Filtering lets you display data for certain times of the day, certain days of the week, and over a defined set of glucose ranges.
• The Quick Print option lets you print the same charts/reports with the same customizable options, each time you run the software.
4.1 Changing the Current Patient There are two ways to change the current patient:
1. Click the down arrow in the current patient window on the top right of any software screen. This will display a drop down menu of all patients. Select another current patient.
or,
2. Click the Patients tab on any software screen. Highlight a patient from the list, and click Select as Current. See Section 5, Patient Management.

-‐ 16 -‐
4.2 Viewing, Printing and Saving Charts/Reports
To view and/or print a chart/report, click the chart/report tab on the software tab bar. The chart/report will be displayed within the software for the current patient.
Example report viewed within the software
Chart/report displays are designed to fit the selected number of days (days range) for viewing on one software screen. You can display patient data over the default days range for that particular chart/report or you can select a different days range by clicking the down arrow on the days range window and choosing another range. Changing the days range will automatically update the chart/report to the new range. In addition to selecting the number of days viewed, you can also choose the start and end dates of the viewing period.

-‐ 17 -‐
Clicking the single arrow buttons to the left and right of the horizontal scroll bar will shift the days range by 1-day increments. Clicking the double arrows will shift the days range to the earliest and latest days range available. You can also click, hold and drag the slider to shift the days range to a desired date. You can also click to the left or right of the slider to jump by the current viewing period.
As you shift/slide the scrollbar, an information window above the chart/report will detail the start and end dates and times of the current viewing period.
You can also view charts/reports as they would appear in a printed report. With the chart/report displayed, click View Report.
Example Report viewed as a Microsoft Word file
The chart/report will open and display as a Microsoft Word file. You can then use the Microsoft Word tool bar to save, print, edit, etc. the file as you would any other .doc/.docx file. To print the chart/report as a Microsoft Word document, you can also click Print Report. Close the Microsoft Word document by clicking the X on the top right of the screen.

-‐ 18 -‐
4.3 Patterns Tab The Patterns Tab allows you to quickly identify the patterns of high and low trends and allows the healthcare professional and the patient to have efficient conversations about patterns. The pattern map is lined up by time with the daily trend traces so that a healthcare professional can quickly visualize the high and low trends.
The Pattern Tab is split into four sections:
Daily Trends. This chart is identical to the daily trend chart in section 4.7; however it includes a shaded area for the Nighttime range. Nighttime range is user settable, and changing the Nighttime range will update the Pattern Insight Summary accordingly.

-‐ 19 -‐
Pattern Map
A light color pattern represents a detected low/high pattern. An intensified color shows an increase in distance from target and frequency of excursions outside of the target range.
Target is the target glucose range that you defined (see page 39). The default is 80-130 mg/dL. Distance is how much the glucose differs from the target range (in mg/dL). Distances farther away from the target are given higher weight and then averaged over the range of days you select. Frequency is how many times in the range of days you select that your glucose went above or below the target. A significant pattern is a time of day when you repeatedly pass preset limits for frequency and average of weighted distances.
Pattern Insights Summary
The Pattern Insights Summary displays how many patterns were found for each of the four conditions (Nighttime Lows, Daytime Lows, Nighttime Highs, and Daytime Highs). It also shows when the most significant pattern occurred. If no significant patterns were found, the “No significant patterns detected” message would be displayed.
Hovering over the cells in the Pattern Insights Summary will highlight the section on the chart that shows the matching pattern.

-‐ 20 -‐
Statistics
The Statistics section displays various relevant statistics for the searched days.
The Sensor Usage statistics displays the number of days with sensor readings out of the number of days searched.
The Calibrations per Day statistics displays the total number of calibrations divided by the sensor usage days.
Trend Patterns & Insights Report
The Trend Patterns & Insights report offers a complete overview of the discovered patterns, and contains two additional sections.

-‐ 21 -‐
"Some Possible Considerations" provides you with potential factors to consider if a certain pattern was detected.
The report also includes a section for notes by a healthcare professional.
Note: You must consult a healthcare professional before making any medical interpretations and therapy adjustments.
4.4 Success Report Tab The Success Report tab lets you compare glucose readings from 2 separate time periods to help you identify areas that show or need improvement. You can compare weekly, monthly or quarterly data.
The Success Report is split into 4 sections:

-‐ 22 -‐
1. Key Success Metrics
The top left section of the Success Report displays a side-by-side comparison of glucose statistics for the two time periods.
The Key Success Metrics includes comparative bar chart data for the following:
• A1c %
• Mean (Average) Glucose
• Standard Deviation
• % in Target (Glucose Range)
• Days Sensor Used
2. Glucose Ranges
The top right section of the Success Report displays a side-by-side pie chart comparison showing the percentage of glucose readings that fall within various glucose ranges around your target. You can modify the Target Glucose Range by clicking the Target Glucose Range button that will be described later in this Section.

-‐ 23 -‐
The Glucose Ranges section displays data for the following ranges:
• % in Hypoglycemia
• % in Low
• % in Target
• % in High
• % in Hyperglycemia
NOTE: The number of pie sections that appear is impacted by how much overlap exists with the Target glucose range.
3. Average Glucose Values Graph
The middle section of the Success Report graphs the average hourly glucose reading for the two time periods. Data points are color/symbol coded by time period.
4. Improvement Statistics/Average Glucose Statistics
The bottom section of the Success Report displays statistical data from the top sections in chart form, and includes the % change for each of the measurements. A green check mark notes positive improvement, and a red caution symbol notes areas that need attention.
The Improvement Statistics tab displays the full set of glucose statistics for the two time periods, and the % change. The Average Glucose Statistics tab displays the hourly average glucose reading for the two time periods, and the % change.

-‐ 24 -‐
Success Report Tab Options
You can customize the following: • Whether you want to display comparative weekly, monthly or quarterly data. • The start dates of the weekly, monthly or quarterly periods. • The Target Glucose Range that will be used to display the Glucose Ranges pie charts, and the
green target range band in the Average Glucose Values graph.
4.5 Glucose Trend Tab The Glucose Trend tab lets you graph sensor glucose readings over time, to help you identify patterns and trends. You can zoom in to highlight a particular time period by clicking and dragging an area on the chart. Alternating vertical grey and white bands let you distinguish nighttime readings (grey band for 6:00 pm-6:00 am) from daytime readings (white band for 6:00 am-6:00 pm).
-‐ 25 -‐
The Glucose Trend Report is split into 2 sections:
1. Glucose Trend Graph
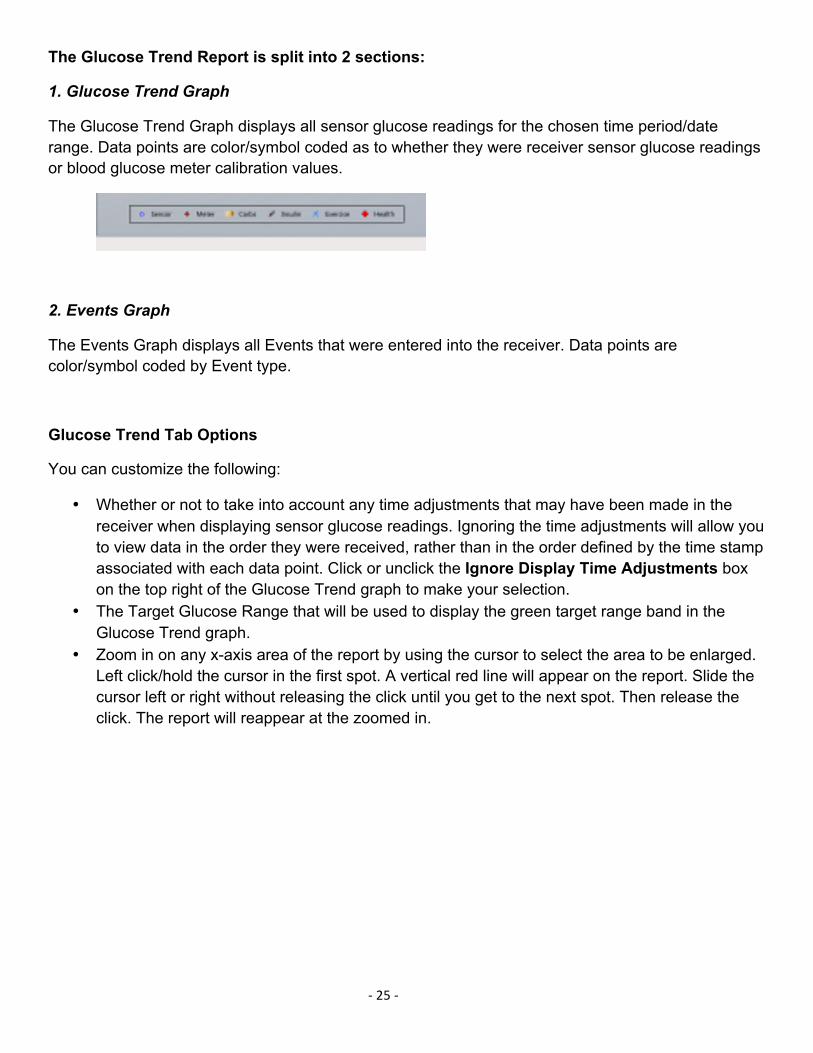
The Glucose Trend Graph displays all sensor glucose readings for the chosen time period/date range. Data points are color/symbol coded as to whether they were receiver sensor glucose readings or blood glucose meter calibration values.
2. Events Graph
The Events Graph displays all Events that were entered into the receiver. Data points are color/symbol coded by Event type.
Glucose Trend Tab Options
You can customize the following:
• Whether or not to take into account any time adjustments that may have been made in the receiver when displaying sensor glucose readings. Ignoring the time adjustments will allow you to view data in the order they were received, rather than in the order defined by the time stamp associated with each data point. Click or unclick the Ignore Display Time Adjustments box on the top right of the Glucose Trend graph to make your selection.
• The Target Glucose Range that will be used to display the green target range band in the Glucose Trend graph.
• Zoom in on any x-axis area of the report by using the cursor to select the area to be enlarged. Left click/hold the cursor in the first spot. A vertical red line will appear on the report. Slide the cursor left or right without releasing the click until you get to the next spot. Then release the click. The report will reappear at the zoomed in.

-‐ 26 -‐
At the zoomed in view, another scroll bar will appear at the bottom of the Glucose Trend and Events graphs. You can use this scroll bar to shift the zoomed in viewable time period in 30-minute increments. Click the o button on the far left of the scrollbar to undo any zooming and revert back to the normal view.

-‐ 27 -‐
Strip View/Print
Click on "View Daily Strips" to generate and display a Microsoft Word document containing the currently displayed number of days as individual single day strip charts, with a list of the User Events for each day.
4.6 Hourly Stats Tab The Hourly Stats tab lets you view summary glucose statistics for a set number of days, over each hour of the day. This can help you identify variations and trends in sensor glucose readings throughout the day. Data is available for viewing in both graph and chart formats.

-‐ 28 -‐
The Hourly Stats Report is split into 2 sections:
1. Hourly Stats graph
The Hourly Stats graph displays the summary glucose statistics in graphical form, for each hour of the day. A shaded box defines the Inter Quartile range for each hour, with vertical lines extending above and below, representing the maximum and minimum sensor glucose reading for the hour. Median hourly sensor glucose readings appear as yellow diamonds, and average hourly sensor glucose readings appear as red diamonds, and are connected by a trend line. Each statistic is color/symbol coded.

-‐ 29 -‐
2. Glucose Statistics Chart
The Glucose Statistics chart displays the summary glucose statistics in chart form, for each hour of the day and for the full day.
See Appendix table for the statistics’ definitions included in Hourly Stats tab.

-‐ 30 -‐
Hourly Stats Tab Options
You can customize the following:
• The Target Glucose Range that will be used to display the green target range band in the Hourly Stats graph.
• The Glucose Range Filter you apply to the data. • The Times Of The Day you apply to the data. • The Days Of The Week you apply to the data.
4.7 Daily Trends Tab The Daily Trends tab lets you view an overlap of several days of sensor glucose readings over each hour of the day. This can help you identify patterns and trends in your sensor glucose readings from hour to hour, and day to day.

-‐ 31 -‐
The Daily Trends Report is split into 2 sections:
1. Daily Trends graph
The Daily Trends displays individual sensor glucose readings in graphical form, for each hour of the day. Each day’s readings are color/symbol coded by day, and are overlaid on the same 24-hour breakdown. The number of days’ readings displayed on the same graph is specified by the days range.
2. Glucose Statistics Chart
The Glucose Statistics chart displays summary glucose statistics in chart form, for each hour of the day and for the full day.
See Appendix table for the statistics’ definitions included in Daily Trends tab.
Daily Trends Tab Options
You can customize the following:
• The Target Glucose Range that will be used to display the green target range band in the Daily Trends graph.
• The Glucose Range Filter you apply to the data. • The Times Of The Day you apply to the data. • The Days Of The Week you apply to the data.
4.8 Distribution Tab The Distribution tab provides pie chart breakdowns of sensor glucose readings that are above, below, and within the Target Glucose Range. Separate pie charts are displayed by time of day. You can also view a histogram breakdown of the same sensor glucose readings, by range interval. Data breakdowns help you identify how often you are within range, and how that varies by time of day.

-‐ 32 -‐
The Distribution Report is split into 2 sections:
1. Pie Distribution Chart
The Pie Distribution Chart displays the % of sensor glucose readings that fall above, below and within the Target Glucose Range. Pie Charts are split out by the various times of the day, and as a summary pie chart for the entire day.

-‐ 33 -‐
2. Bar Distribution Chart
The Bar Distribution chart displays the total number of sensor glucose readings within various range intervals, against a color coded background indicating which range intervals are above, below and within the Target Glucose Range.
Distribution Report Options
You can customize the following:
• The Target Glucose Range that will be used to display the target slice of pie charts, and the green “target range” band in the Bar Distribution chart.
• The Times Of The Day Filter that defines how the pie charts are split out by time of day. • The Days Of The Week Filter you apply to the data.
4.9 Daily Stats Tab The Daily Stats tab provides pie chart breakdowns of sensor glucose readings that are above, below, and within the Target Glucose Range. Separate pie charts are displayed for each day of the week. You can also view summary statistics for each day. Data breakdowns by day of the week can help you identify variations and trends in sensor glucose readings from day to day.

-‐ 34 -‐
Daily Stats Report Options
You can customize the following:
• The Target Glucose Range that will be used to display the target slice of pie charts. • What Days of the Week filter you apply to the data. • Whether to include/exclude pie charts from the display • Whether to include/exclude “empty days” in the report. Empty days are days in which there is
no data for this report.
Daily Stats (Statistics)
See Appendix table for the statistics’ definitions included in Daily Stats tab.

-‐ 35 -‐
4.10 A1c Records Tab The A1c Records tab lets you enter and view HbA1c data. A1c data will be used in the "Key Success Metrics" section of the Success Report tab.
When you click the A1c Records tab, the stored list of A1c results will appear for the current patient.
To add a new A1c record, click New. The Edit A1c Record pop-up window will appear where you can enter the date and value (%) of the A1c result. For the date, you can either change the date in the date window, or click the calendar icon to display a pop calendar where you can click a date. When you are done, click OK to save the record, or click Cancel to cancel.
You can also edit or remove an A1c record by clicking on that record (row). Click the Edit button to edit the record, or click the Remove button to delete the record. You can select multiple A1c records for removal by holding down the Ctrl key on your keyboard as you click/drag on records. Then click the Remove button.
-‐ 36 -‐
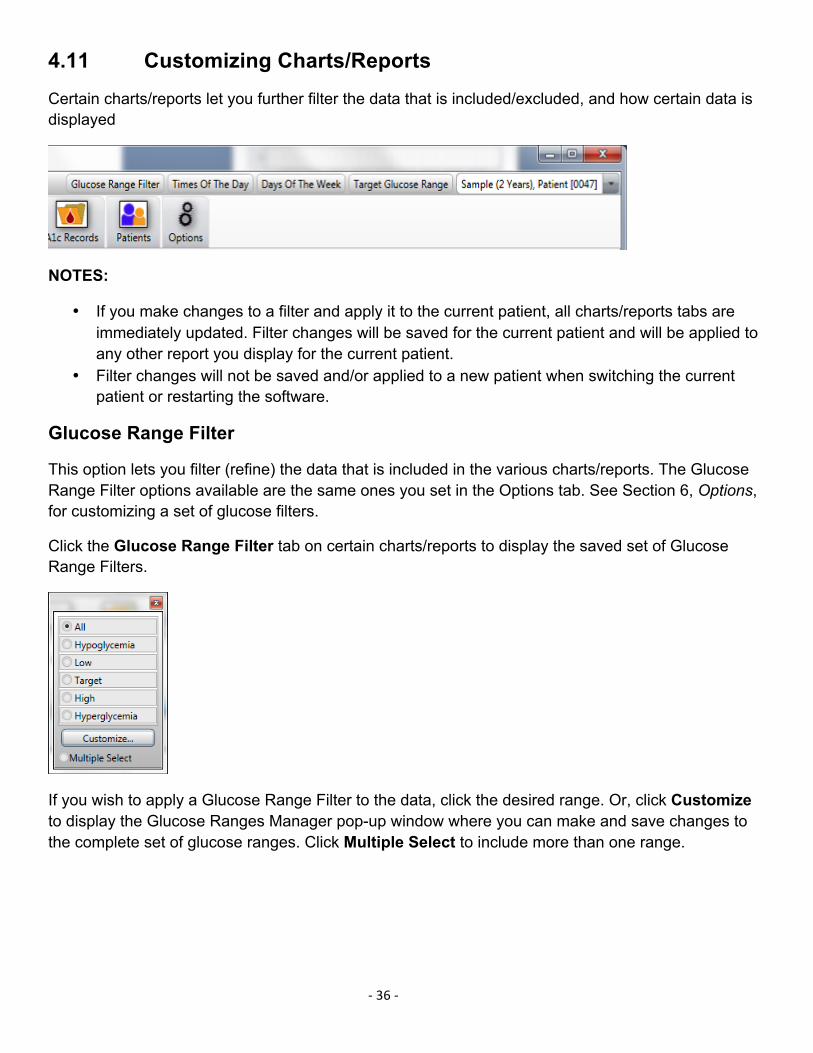
4.11 Customizing Charts/Reports Certain charts/reports let you further filter the data that is included/excluded, and how certain data is displayed
NOTES:
• If you make changes to a filter and apply it to the current patient, all charts/reports tabs are immediately updated. Filter changes will be saved for the current patient and will be applied to any other report you display for the current patient.
• Filter changes will not be saved and/or applied to a new patient when switching the current patient or restarting the software.
Glucose Range Filter
This option lets you filter (refine) the data that is included in the various charts/reports. The Glucose Range Filter options available are the same ones you set in the Options tab. See Section 6, Options, for customizing a set of glucose filters.
Click the Glucose Range Filter tab on certain charts/reports to display the saved set of Glucose Range Filters.
If you wish to apply a Glucose Range Filter to the data, click the desired range. Or, click Customize to display the Glucose Ranges Manager pop-up window where you can make and save changes to the complete set of glucose ranges. Click Multiple Select to include more than one range.

-‐ 37 -‐
The Glucose Range Filter is available when viewing the following Charts/Report tabs:
• Hourly Stats
• Daily Trends
Times Of The Day Filter
This option lets you define the time periods of the day that are included in the various charts/reports. Click the Times Of The Day tab on certain charts/reports to display the saved set of Times Of The Day Filter.
If you wish to apply a Times Of The Day filter to the data, click the desired time of day. Or, click Customize to display the Times Of Day Manager pop-up window where you can make and save changes. Click Multiple Select to include more than one time of day.

-‐ 38 -‐
The Times Of The Day filter is available when viewing the following charts/report tabs:
• Hourly Stats
• Daily Trends
• Distribution
Days Of The Week Filter
This option lets you define the days of the week that are included in the various charts/reports. Click the Days Of The Week tab on certain charts/reports to display the saved set of Days of the Week filter

-‐ 39 -‐
If you wish to apply a Days of the Week filter to the data, click the desired day(s) of the week or, click Customize to display the Times of the Day manager pop-up window where you can make and save changes. Click Multiple Select to choose individual days of the week.
The Days Of The Week filter is available when viewing the following charts/report tabs:
• Hourly Stats
• Daily Trends
• Distribution
• Daily Stats
Target Glucose Range This option lets you customize the Target Glucose Range for any patient. The Target Glucose Range will also impact how data is organized and displayed in charts/reports that break the data out by % within, above and below the target range. It also defines the green target range band that appears on charts/reports. The Glucose Target Ranges available are the same ones you set in the Options tab. See Section 6 Options, for customizing the Target Glucose Ranges.
Click the Target Glucose Range tab to display the saved Target Glucose Range.
You can adjust the Min and Max values for the Target Glucose Range. The lowest value you can set is Low (<40 mg/dL or 2.22 mmol/L). The highest value you can set is High (>400 mg/dL or 22.20 mmol/L). When you are done, click Save to save your changes, or click Cancel to cancel your changes. Clicking Default will display the default Glucose Target Range 80-130 mg/dL (4.44-7.22 mmol/L).
You can also display the complete list of Target Glucose Ranges you set in the Options tab. Click Quick Pick to display that list and then select the desired Target Range from the list. You can also click Customize in the Quick Pick window to display the Glucose Ranges Manager pop-up window where you can make and save changes to the complete set of Target Glucose Ranges.
The Target Glucose Range is available on all chart/report tabs.

-‐ 40 -‐
4.12 Quick Print The Quick Print feature lets you view and print a “batch” of charts/reports with one click. This option is useful if you typically review the same charts/reports on a regular basis. You can set Quick Print options for viewing and printing weekly, monthly and quarterly data charts/reports. See Section 6, Options, for customizing Quick Print options. To use the Quick Print feature, click File in the Tool Bar, and select Quick Print from the drop down menu, or press CTRL-Q on your keyboard. You have the option to view charts/reports (click View), print charts/reports (click Print), or customize Quick Print settings (click Configure).
The selected Quick Print charts/reports/options will be displayed and printed as a Microsoft Word file.
5 Patient Management The Patients tab lets you organize and edit patient information. You can also save the patient database to a separate file for safekeeping, retrieve it at a later date, and export patient data into another file format that can be used by other applications. The Patients tab also lets you select a patient as the current patient for viewing and printing carts/reports.
When you click the Patients tab, the existing patient database will appear on the screen.

-‐ 41 -‐
NOTE: New patients are added to the database when their data is downloaded from the Dexcom Receiver.
5.1 Organizing and Sorting the Patient List To change the order of the patient information fields, drag (click, hold and slide) a column header onto another header to insert it into that spot. The other headers will be shifted to the left or right to accommodate the newly inserted header.
To sort the patient list within a particular column, first click on that column header. Then click the up arrow or down arrow on the header to sort the list using that field. Clicking the up arrow will sort the list in one direction. Clicking the down arrow will sort the list in reverse order. Holding the Shift key on your keyboard and clicking will let you sort by more than one column.

-‐ 42 -‐
5.2 Selecting a Patient as the Current Patient The software will always use data from the current patient for viewing and printing charts/reports. To select a different patient as the current patient, click any patient (row), and then click Select as Current. You can also right click and choose Select as Current from the pop-up menu. The new patient name will appear in the Current Patient window.
5.3 Editing a Patient Click that patient (row), and then click Edit Patient, or simply double click on the row. The Edit Patient pop-up window will appear where you can make your edits to the various patient information fields. Fields that are bolded are used when displaying patient information on software screens. See Patient Display in Section 6, Options. Click OK when you are done to save your edits. You will return to the Patients tab screen where the updated patient database will be displayed.
NOTE: If you do not want personal information included when exporting data, click Keep Private. This will remove personal information when exporting.
NOTE: The Edit Patient pop-up window also appears when you are downloading receiver data for a new patient.

-‐ 43 -‐
5.4 Removing a Patient Click that patient (row), and then click Remove Patient. You will be prompted to confirm that you want this patient removed from the database. Click Yes to remove the patient, or click No to cancel. You will return to the Patients tab screen where the updated patient database will be displayed.
You can select multiple patients for removal by holding the Shift or Ctrl keys down as you click on names. Then click Remove Patient.
5.5 Exporting Patient Data Exporting lets you save data for the currently selected patient into a separate file. This file cannot be read by the software but can be read with other spreadsheet and database management programs. You can choose to export the data as either an XML file (.xml) or a Tab Delimited file (.txt). Tab Delimited file format (.txt) is the default option. See Section 6, Options, for setting the export file type.
Click that patient (row) on the screen, and then click Export Data.
You can select multiple patients for exporting data by holding the Shift or Ctrl keys down as you click on names. Then click Export Data.
The Export Patient Data pop-up window will be displayed. You will be prompted to choose the date range for the data export. You have the option to export all the available data for this patient, or to define a specific date range. If you want to define a date range, you can either select a set number of weeks, or customize by selecting an actual start and end date. Make your selection and then click OK to export the data, or click Cancel to cancel the export.

-‐ 44 -‐
NOTE: When exporting data, readings above 400 mg/dL (22.22 mmol/L) are output as ”High” and readings below 40 mg/dL (2.22 mmol/L) are output as ”Low”..
If you selected a single patient for exporting, the Save As pop-up window will appear. Here you can select the location/file name for saving the exported file. The default patient file name that appears is defined by the information in the fields you selected in Patient Display in Section 6, Options. With either the default name or a new name, click Save on the pop-up window to save the file.
If you selected multiple patients for exporting, the Browse For Folder pop-up window will appear. Here you can select the location/name of the folder that will contain the exported patient files. The default patient file names are defined by the information in the fields you selected in Patient Display in Section 6, Options. After either identifying a folder or creating a new folder, click OK on the pop-up window to save the files in the target folder. You can rename the files in the folder at a later date, if desired.
5.6 Viewing Exported Data You can open/view exported data in spreadsheet programs like Microsoft Excel. Simply drag the file (XML or Tab Delimited) onto an open worksheet, or select Open from the Microsoft Excel Tool Bar. You may also need to adjust the column width of the Microsoft Excel file to fit the data.
Event types are as follows:
• Carbs • Insulin • ExerciseLight • ExerciseMedium • ExerciseHeavy • HealthIllness

-‐ 45 -‐
• HealthStress • HealthHighSymptoms • HealthLowSymptoms • HealthCycle • HealthAlcohol
For each Event type, the description is as follows:
• Carbs XX grams: where “XX” is the number of grams • Insulin XX units: where ”XX” is the number of units • Exercise Type (XX minutes): where “type” is the exercise type above and “XX” is the number
of minutes the exercise is performed • Health Type: is the health type above
5.7 Saving/Loading Patient Files
Saving patient data lets you store the data in a separate (.patient) file for safekeeping and retrieval at a later date. Saving patient data is different than exporting patient data in that the (.patient) file can only be read by the software.
To save data for one or more patients, first click that patient row or rows, and then click Save Patient File. The Save As or Browse For Folder pop-up window will appear. Here you can select the location/file name for saving a single patient file or the folder for saving multiple patient files. Click Save to save the file or OK to save the folder. Click Cancel to cancel.
To load patient data back into the software database, first click Load Patient File. The Open pop-up window will appear where you can select the name/location of the file to be retrieved. Click Open to load the patient data.
5.8 Connect to Technical Support Your receiver needs to be authorized by Dexcom, prior to sending the data to Technical Support. To authorize a receiver, if in the US, contact Dexcom Technical Support by e-mail or phone for assistance: 1-877-339-2664. If outside the US, please contact your local distributor. To send receiver data to Technical Support, make sure you have downloaded the most recent data from the receiver to Dexcom Studio. After downloading the receiver, go to the “Patients” tab, select a patient, and click on “Send Patient File to Technical Support”.

-‐ 46 -‐
6 Options The Options tab lets you customize how you want to display software screens, download and organize data, view and print charts/reports, and export data.
For any of the 9 categories, click the down arrow to display the available drop down menu selections for that category. Then make your selections by clicking/unclicking the menu options.
You may also click Expand All Options to view the drop down selections for all options, or click Collapse All Options to view only the main option headers.
6.1 Glucose Display Units Select the unit of measure (mg/dL or mmol/L) for viewing and printing glucose readings.
Click the desired unit of measure.

-‐ 47 -‐
6.2 Patient Data Export Select the format (XML or Tab Delimited) for exporting data to an external file.
XML file formats (.xml) are compatible with many Internet-based application programs. Tab Delimited file formats (.txt) are compatible with many spreadsheet and data management programs.
Click the desired file format.
6.3 Default Chart/Report Select the Default Chart/Report that will displayed whenever you download data from the receiver.
As soon as data is downloaded, the software will display the chosen chart/report.
Click the desired Default Chart/Report.

-‐ 48 -‐
6.4 Quick Print Configuration Select and customize charts/reports for printing with the Quick Print Configuration option. You can set up Quick Print for printing weekly, monthly and quarterly charts/reports. The Quick Print Configuration option also lets you create your own custom name and descriptions for any of the 3 Quick Print setups.
Example Quick Print Setup for Last Week Reports

-‐ 49 -‐
First choose the charts/reports to be included with Quick Print by clicking the appropriate boxes. Then select the options that are available for those charts/reports either by clicking the boxes, or clicking the down arrow to display the menu options and then make your selections.
6.5 Health Care Professionals
Customize what happens each time you open/run the software. These options are intended for health care professionals only.
• Automatically load previous patient at startup – select whether the current patient will be set to the same patient as when you last exited the software.
• Prompt to reset the receiver after every download – select whether to be prompted to reset
the receiver after every time you download data. Resetting will erase all data from the receiver database, set the receiver time and date to the Internet time and date, and set the prior Transmitter ID and blind/unblind settings back into the receiver.
You also have the option to customize the default Target Glucose Range. The default range will be applied to any new patient added to the database, or when you click Default on the Edit Glucose Range pop-up window (see Target Glucose Range in Section 4, Charts/Reports.
Click Edit Default to set a new target range. You can change the min and max values of the range. When you are done, click Save to save your changes, or click Cancel to cancel.

-‐ 50 -‐
6.6 Patient Display Customize how patient information will appear when selecting patients, viewing and printing charts/reports. This option also defines the default patient file names when exporting or saving patient data/files.
You can choose the type and order of patient information, and how you want information fields separated.
Click the down arrow for any patient field to display the drop down menu selections. Select None if you do not want that patient field to appear. Continue to make your selections until you have the desired patient display options.
When you are done, click Save to save your selections, or click Cancel to cancel your selections or start over. You may also click Reset To Default to use the default patient display (Last Name, First Name [Serial Number]).
-‐ 51 -‐
6.7 Glucose Range Lists
Glucose Range Filters
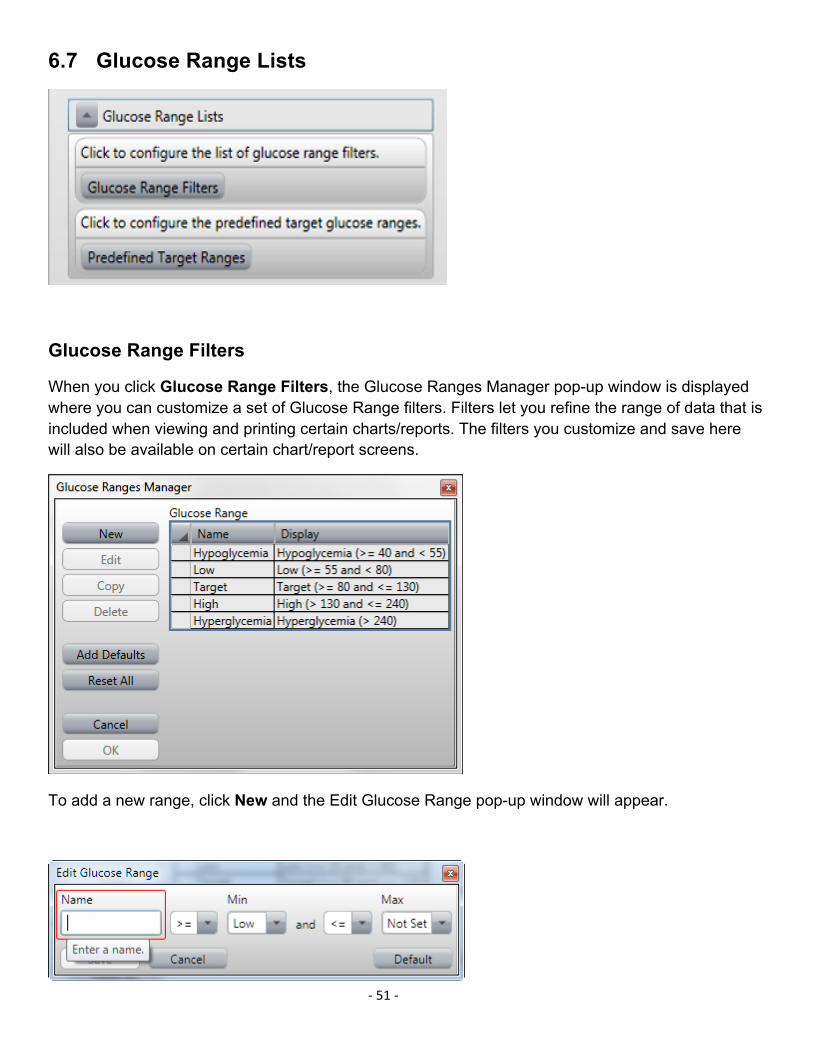
When you click Glucose Range Filters, the Glucose Ranges Manager pop-up window is displayed where you can customize a set of Glucose Range filters. Filters let you refine the range of data that is included when viewing and printing certain charts/reports. The filters you customize and save here will also be available on certain chart/report screens.
To add a new range, click New and the Edit Glucose Range pop-up window will appear.

-‐ 52 -‐
You can set the name and min and max values for the new range. The lowest value you can set for the new range is Low (<40 mg/dL or 2.2 mmol/L). The highest value you can set is High (>400 mg/dL or 22.2 mmol/L). When you are done, click Save to save your changes, or click Cancel to cancel your changes. Clicking Default will display the default software Target Range of 80-130 mg/dL (4.44-7.22 mmol/L).
To edit a range, select any glucose range (row) and click Edit to make changes to the name or min/max values for that range. Repeat for any other ranges (rows). When you are done, click OK to save your changes.
To reset all the Glucose Range filters to the software default values, click Reset All.
Other options available on the Glucose Ranges Manager pop-up window include adding the full set of default ranges to your customized list (click Add Defaults), or adding a copy of one of your ranges (select row and click Copy) to your customized list.
Predefined Target Ranges
When you click Predefined Target Ranges, the Glucose Ranges Manager pop-up window is displayed where you can customize a set of Target Glucose Ranges. Separate ranges can be set for different meal periods throughout the day, such as a separate Fasting, Pre-Meal and Post-Meal target range. The ranges you customize and save here will also be available on the Quick Pick option when changing the Target Glucose Range for the current patient.
To add a new target range, click New and the Edit Glucose Range pop-up window will appear.

-‐ 53 -‐
You can set the name, and min and max values for the new target range. The lowest value you can set for the new range is Low (<40 mg/dL or 2.2 mmol/L). The highest value you can set is High (>400 mg/dL or 22.2 mmol/L). When you are done, click Save to save your changes, or click Cancel to cancel your changes. Clicking Default will display the default software target range of 80-130 mg/dL (4.44-7.22 mmol/L).
To edit a target range, select any target range (row) and click Edit to make changes to the name or min/max values for that target range. Repeat for any other target ranges (rows). When you are done, click OK to save your changes.
To reset all the target ranges to the software default values, click Reset All.
Other options available on the Glucose Ranges Manager pop-up window include adding the full set of software default ranges to your customized list (click Add Defaults), or adding a copy of one of your ranges (select row and click Copy) to your customized list.
6.8 Application Appearance Customize how software screens will appear on your PC.
You can set the Home screen display (Dexcom logo or the Dexcom web portal), the font size of the software screens (8 to 24 point), the application language, and how the software screen tabs appear (images only, text only, or text and images)
6.9 Manage Options and Settings Lets you export/import your software Options settings to/from a separate file, or restore the default software Options settings.

-‐ 54 -‐
Saving your Options settings to a separate XML (.xml) file will allow you to store them in a safe place where they can be accessed at a later date.
Click Save All Settings to File to display the Save As pop-up window where you can select the file name/location for saving the file. Click Save on the pop-up window to save the file.
Click Load Settings from File to display the Open pop-up window where you can select the file name/location for importing the file. Click Open on the pop-up window to import the file. The Option settings from the imported file will be applied to the software after you click Open.
You can also reset Options settings to the software defaults by clicking Reset All Settings to Defaults.
7 Tools The Tools tab provides an extra set of features for health care professionals. Click Tools on the tool bar to display the drop down menu of options.
7.1 Reset The Dexcom Receiver Database A useful feature for healthcare professionals is to be able to reset the receiver database. Resetting will erase all data from the receiver database, and set the receiver time and date to the Internet time and date. The Transmitter ID and blind/unblind settings in the receiver will be preserved. The receiver must be attached to the PC and the software open to reset the receiver.
You can also choose to automatically be prompted to reset after every download by making this selection in Section 6, Options.
NOTE: This feature is not recommended for people using the software to store and track data downloads for their own personal use. Resetting the receiver will require a future data download to be stored under a different patient record. This means that data from future downloads cannot be combined with data from previous downloads.
To reset the receiver, click Tools on the tool bar and select Reset Receiver Database from the drop down menu.

-‐ 55 -‐
The Receiver Reset Tool pop-up window will appear, and will prompt you to connect the receiver if it is not already connected. Connecting the receiver will activate the Reset Receiver button. The connected receiver will be identified in the bottom right message area of the pop-up window.
Click Reset Receiver.
You will be prompted to confirm that you want to reset the receiver.
Click OK.
The message area on the bottom left of the pop-up window will indicate the progress of the reset and when the reset is complete.
The pop-up window will also notify you if the reset was unsuccessful, such as when no receiver is attached.
Example of unsuccessful reset

-‐ 56 -‐
7.2 Activate Clinical Features A special feature is available for health care professionals doing clinical studies with patients using the Dexcom CGM System. The blind/unblind feature lets health care professionals set the receiver display so that a patient will only see certain types of information on the display.
To activate clinical features, first click Tools on the tool bar and select Activate Clinical Features from the drop down menu.
You will be prompted to contact Dexcom Technical Support and provide them with the Activation Request Key that appears in the Activate Clinical Features pop-up window. Once you receive an Activation Code enter it in the Activate Clinical Features window. Then click OK. Clinical features activation is a one-time action, and you won’t need to repeat it.
The Tools drop down menu will now include an option to Blind/Unblind Receiver, and Display Blinded Data. These options are useful for health care professionals who have patients in clinical studies.

-‐ 57 -‐
7.3 Blinding and Unblinding the Receiver Display Blinding the receiver sets the display so that a patient will not see sensor glucose readings, trend arrows or alarms.
Note: This feature is for professional use only. If you’re not a healthcare professional, you should never attempt to blind your receiver.
Connecting a receiver will activate the Blind/Unblind Receiver option on the Tools drop down menu if you have previously entered the proper Activation Code. The option that appears (Blind Attached Receiver or Unblind Attached Receiver) depends on whether the connected receiver is currently blinded or unblinded.
When connected the receiver is currently unblinded
When connected the receiver is currently blinded
Choose Blind Attached Receiver or Unblind Attached Receiver from the drop down menu. You will be prompted to confirm your selection before the receiver display is updated.
If you change the current blind/unblind setting, an updated set of receiver settings will automatically be downloaded to the software. Some of the downloaded settings may affect the charts/reports currently being displayed in the software.
NOTE: The choice of blinding/unblinding the receiver does not impact the data that is downloaded from the receiver. It does impact whether the data will be visible in charts/reports after downloading.
7.4 Displaying Blinded Data in Software Charts/Reports If you connect a blinded receiver, that receiver data will be downloaded but will not be visible in software charts/reports. If you want to display blinded data, select Display Blinded Data to update charts/reports to include blinded data.

-‐ 58 -‐
7.5 Importing DM3 Patient Database into Dexcom Studio If you have patient files in Data Manager 3, you may import those into Dexcom Studio. To do so, click on "Import Dexcom DM3 Patient Database" in the Tools menu.
At startup, Dexcom Studio will automatically check for the presence of DM3 patient data, and import the data if found.
7.6 Installing Receiver Driver Dexcom Studio would install the driver for the attached receiver during set-up.
If you ever need to manually install a receiver driver, go to the Tools menu, and select your receiver from the "Drivers for Dexcom Receivers" option.
8 Help Dexcom Studio software lets you obtain help for running the software, or if you are having problems with the receiver/System. Make your selection from the Help drop down menu on the tool bar, and follow any display prompts as instructed.
8.1 About Displays information about the software version you are using.
8.2 Online Help Navigates your browser to the Dexcom website where you can get online technical help.

-‐ 59 -‐
8.3 Software License Agreement Displays the Software License agreement. With Yes selected, click OK, Cancel or the “X” at the top right to return to the previous screen.
If you select No and click OK, you will exit the software. The next time you open/run the software, you will need to agree to the terms again before you can begin running the software.
9 Appendix Table 1 Statistics’ Definitions
Statistic What it means # Readings Total number of sensor glucose readings. Average Average sensor glucose reading. Minimum Minimum – the lowest sensor glucose
reading. Quartile 25 Quartile 25 – This is the sensor glucose
reading whereby 25% of all readings fell at or below this value, after ranking all values from lowest to highest.
Median The midpoint of all the sensor glucose readings, where half the readings fall below this value and half the readings fall above.
Quartile 75 Quartile 75 – This is the sensor glucose reading whereby 75% of all readings fell at or below this value, after ranking all values from lowest to highest.
Maximum Maximum –the highest glucose reading. Standard Deviation (SD) A measure of variability in sensor glucose
readings around the Average. The larger the Standard Deviation, the larger the variability.
Estimated Standard Deviation (Est. SD) A separate (SD) statistic that first removes the top 25% and bottom 25% of sensor glucose readings (considered “outliers”) before calculating the standard deviation.
Inter Quartile Range (IQR) The difference between the Quartile 75 reading and the Quartile 25 reading (Quartile 75 – Quartile 25).
Standard Error of the Mean (SE Mean) Another estimate of variability that is calculated by dividing the SD by the square root of the # of values.
Percentage Coefficient of Variation (% CV) Another estimate of variability that is calculated by dividing the SD by the Average.

-‐ 60 -‐
Dexcom, Inc. MediTech Strategic Consultants B.V.
6340 Sequence Drive Maastrichterlaan 127 - 129
San Diego, CA 92121 NL – 6291 EN Vaals
+ 1.858.200.0200 Tel. +31.43.306.3320
www.dexcom.com Fax. +31.43.306.3338
Outside US: Contact your local distributor
© 2013 Dexcom, Inc.
Dexcom, Dexcom Data Manager, Dexcom Studio, SEVEN and The Glucose Sensor Company are either registered trademarks or trademarks of Dexcom, Inc. in the United States and/or other countries. All other product or company names that may be mentioned in this publication are tradenames, trademarks or registered trademarks of their respective owners.
LBL-011046 Rev 08