
DEVELOPMENT OF SELF-CONSOLIDATING CONCRETE FOR DRILLED SHAFT ... · PDF fileDEVELOPMENT OF...
148
DEVELOPMENT OF SELF-CONSOLIDATING CONCRETE FOR DRILLED SHAFT APPLICATIONS IN HAWAI‘I Renee Ishisaka and Ian N. Robertson Research Report UHM/CEE/07-05 August 2007
Transcript of DEVELOPMENT OF SELF-CONSOLIDATING CONCRETE FOR DRILLED SHAFT ... · PDF fileDEVELOPMENT OF...

DEVELOPMENT OF SELF-CONSOLIDATING CONCRETE
FOR DRILLED SHAFT APPLICATIONS IN HAWAI‘I
Renee Ishisaka
and
Ian N. Robertson
Research Report UHM/CEE/07-05
August 2007

ii

iii
Acknowledgements
This report is based on a master’s thesis prepared by Renee Ishisaka under the direction
of Dr. Ian Robertson.
The authors would like to thank Dr. Gaur Johnson for his input and guidance throughout
this project, and Drs. Riggs and Archilla for reviewing the report and providing valuable
feedback.
Thanks are also extended to Mr. Timothy Folks of Hawaiian Cement and Mr. Thomas
Meehan of BASF for sharing their technical expertise. Both Hawaiian Cement and
Ameron Corporation donated aggregates for use in this project, while BASF Admixtures
donated many of the admixtures used. These contributions are gratefully acknowledged.
The authors would also like to thank Myles Wagner and his student assistants for their
assistance in the structures laboratory, as well as Yuka Nishikawa, Alex Okamura, Reef
Ozaki-Train and Kris Maile, who assisted in preparing the many mixtures tested in this
study.
This research project was funded by the Federal highway Administration (FHWA) and
the Hawai‘i Department of Transportation (HDOT) under research contract No. 54211.
This financial support is gratefully acknowledged.

iv
TABLE OF CONTENTS
ACKNOWLEDGEMENTS ....................................................................................................................... III
LIST OF TABLES .................................................................................................................................... VII
LIST OF FIGURES ................................................................................................................................ VIII
CHAPTER 1: INTRODUCTION ................................................................................................................ 2
MATERIAL DESCRIPTION ............................................................................................................................. 2
PROJECT DESCRIPTION ................................................................................................................................ 2
CHAPTER 2: LITERATURE REVIEW .................................................................................................... 5
EXISTING SCC RESEARCH AND APPLICATIONS ........................................................................................... 5
Overseas Usage ..................................................................................................................................... 5
Research in the United States ................................................................................................................ 5
IMPORTANCE OF REPETITION FOR HAWAI‘I APPLICATIONS ......................................................................... 6
OTHER LOCAL APPLICATIONS OF SCC ........................................................................................................ 7
CHAPTER 3: MATERIAL PROPERTIES ................................................................................................ 8
SIEVE ANALYSIS ......................................................................................................................................... 8
MOISTURE CONTENT ................................................................................................................................... 8
ABSORPTION ............................................................................................................................................... 9
CHAPTER 4: TEST PROCEDURES ....................................................................................................... 10
FRESH MIX PROPERTIES ............................................................................................................................ 10
Slump Flow, T-20 and Visual Stability Index (VSI) ............................................................................. 10
J-Ring ................................................................................................................................................... 14
L-Box .................................................................................................................................................... 15
Segregation Column ............................................................................................................................ 17
Modified Segregation Column ............................................................................................................. 17
Segregation Probe ............................................................................................................................... 18
Air Content ........................................................................................................................................... 19
HARDENED MIX PROPERTIES .................................................................................................................... 20
Compressive Stress .............................................................................................................................. 20
v
Voids .................................................................................................................................................... 20
Shrinkage ............................................................................................................................................. 20
CHAPTER 5: MIX DESIGNS ................................................................................................................... 21
METHODOLOGY ........................................................................................................................................ 21
MIXES ....................................................................................................................................................... 22
Mixes 1-4 ............................................................................................................................................. 22
Large Scale Mix ................................................................................................................................... 22
Mixes 5-9 ............................................................................................................................................. 25
Mixes 10-20.......................................................................................................................................... 25
Mixes 21-24.......................................................................................................................................... 26
Mixes 25 -30......................................................................................................................................... 26
CHAPTER 6: RESULTS ............................................................................................................................ 29
FRESH PROPERTIES .................................................................................................................................... 29
Slump Flow .......................................................................................................................................... 29
T-20 ...................................................................................................................................................... 33
VSI ....................................................................................................................................................... 35
J-Ring ................................................................................................................................................... 36
L-Box .................................................................................................................................................... 40
Segregation Column ............................................................................................................................ 41
Modified Segregation Column ............................................................................................................. 42
Segregation Probe ............................................................................................................................... 45
Air Content ........................................................................................................................................... 48
HARDENED PROPERTIES ............................................................................................................................ 48
Compressive Strength Results .............................................................................................................. 48
Shrinkage Results ................................................................................................................................. 51
CHAPTER 7: DISCUSSION ...................................................................................................................... 53
FRESH PROPERTIES .................................................................................................................................... 53

vi
Appearance and Consistency ............................................................................................................... 53
Air Content ........................................................................................................................................... 56
High Range Water Reducer (HRWR) Dosage ..................................................................................... 57
Viscosity Modifying Admixture (VMA) Dosage ................................................................................... 58
Set Time ............................................................................................................................................... 59
SLUMP FLOW VS. TIME .............................................................................................................................. 60
COMPARISON OF TEST METHODS .............................................................................................................. 61
Best Representation of Material .......................................................................................................... 61
Ease of Execution ................................................................................................................................. 64
EFFECTS OF ADMIXTURES ......................................................................................................................... 65
High Range Water Reducer (HRWR) ................................................................................................... 65
Viscosity Modifying Admixture (VMA) ................................................................................................ 66
Retarding admixtures ........................................................................................................................... 66
SEGREGATION COLUMN VS. MODIFIED SEGREGATION COLUMN ............................................................... 67
RETEMPERING ........................................................................................................................................... 67
CHAPTER 8: CONCLUSIONS AND RECOMMENDATIONS ............................................................ 69
CONCLUSIONS ........................................................................................................................................... 69
RECOMMENDATIONS ................................................................................................................................. 71
APPENDIX A: MIXING PROCEDURES ................................................................................................ 72
APPENDIX B: MIX DESIGN SPREADSHEETS ................................................................................... 77
APPENDIX C: DRAFT SPECIFICATIONS ........................................................................................... 84
APPENDIX D: AGGREGATE AND MIX GRADATIONS ................................................................... 98
LITERATURE CITED ............................................................................................................................. 138

vii
List of Tables
Table 1. Kapa‘a Quarry Mix Proportions ........................................................................ 27
Table 2. Halawa Quarry Mix Proportions ........................................................................ 28

viii
List of Figures
Figure 1. Slump Flow Test............................................................................................... 11
Figure 2. Example of VSI = 0 (left) and VSI = 0.5/1 (right). .......................................... 12
Figure 3. Example of VSI = 1.5 (left) and VSI = 2 (right). ............................................. 13
Figure 4. Examples of VSI = 3 Concrete. ........................................................................ 13
Figure 5. J-Ring Dimensions from Fig 1 in ASTM 1621 (2006) ..................................... 14
Figure 6. J-Ring Test........................................................................................................ 15
Figure 7. L-Box Test Apparatus ...................................................................................... 16
Figure 8. Completed L-Box Test ..................................................................................... 16
Figure 9. Modified Segregation Column (left) and Segregation Column (right) ............ 18
Figure 10. Segregation Probe Dimensions and Guidelines (Jeknaorian and Cornman,
2007) ................................................................................................................................. 19
Figure 11. Construction of SCC Beam (left) and Slab (right). ........................................ 23
Figure 12. Exposed Reinforcing and Spacers .................................................................. 24
Figure 13. SCC Beams with a Poor Finish ...................................................................... 24
Figure 14. SCC Beams with a Nice Finish ...................................................................... 24
Figure 15. Slump Flow for Mix 25 .................................................................................. 29
Figure 16. Slump Flow for Mix 26 .................................................................................. 30
Figure 17. Slump Flow for Mix 27 .................................................................................. 30
Figure 18. Slump Flow for Mix 28 .................................................................................. 31
Figure 19. Slump Flow for Mix 29 .................................................................................. 32

ix
Figure 20. Slump Flow for Mix 30 .................................................................................. 32
Figure 21. T-20 times for Initial and Retempered Conditions. ........................................ 33
Figure 22. T-20 Times – Approx. 30 Minutes After Initial Slump Flow. ....................... 34
Figure 23. T-20 Times – Approx. 60 Minutes After Initial Slump Flow. ....................... 34
Figure 24. Visual Stability Index ..................................................................................... 35
Figure 26. J-Ring Flows for Halawa Mixes ...................................................................... 37
Figure 27. Difference Between J-Ring and Slump Flow Beasurements ......................... 38
Figure 28. J-Ring to Slump Flow Ratios .......................................................................... 39
Figure 29. L-Box H2/H1 Ratios....................................................................................... 40
Figure 30. Segregation Column Segregation Indexes ...................................................... 41
Figure 31. Modified Segregation Column Segregation Index - No Retempering ........... 42
Figure 32. Modified Segregation Column Segregation Index - After First Retempering
........................................................................................................................................... 43
Figure 33. Modified Segregation Column Index - After Second Retempering .............. 43
Figure 34. Modified Segregation Column ....................................................................... 44
Figure 35. Segregation Column vs. Modified Segregation Column ................................ 45
Figure 36. Segregation Probe for Mix 25 Butter Batch (left) and Mix 25 (right) ........... 46
Figure 37. Segregation Probe for Mix 27 Unretempered (left) and Retempered (right) . 46
Figure 38. Segregation Probe for Mix 28 Unretempered (left) and twice Retempered
(right) ................................................................................................................................ 46
Figure 39. Segregation Probe for Mix 29 Butter Batch (left) and Mix 25 (right) ........... 47
Figure 40. Segregation Probe for Mix 29 Retempered Once (left) and Twice (right) ..... 47

x
Figure 41. Segregation Probe for Mix 29 Butter Batch (left) and Mix 25 (right) ........... 47
Figure 42. Air Content – Before and After Retempering ................................................ 48
Figure 43: Average Maximum Compressive Stress – No Retempering ........................... 49
Figure 44. Average Maximum Compressive Stress – Retempered Twice. ...................... 50
Figure 45. Average Maximum Stress Comparison .......................................................... 51
Figure 47. Shrinkage for Halawa Mixes .......................................................................... 52
Figure 48. Mix 25 Before (left) and After (right) Adding Glenium and VMA ............... 53
Figure 49. Mix 26 Before (left) and After (right) Adding Glenium and VMA ............... 53
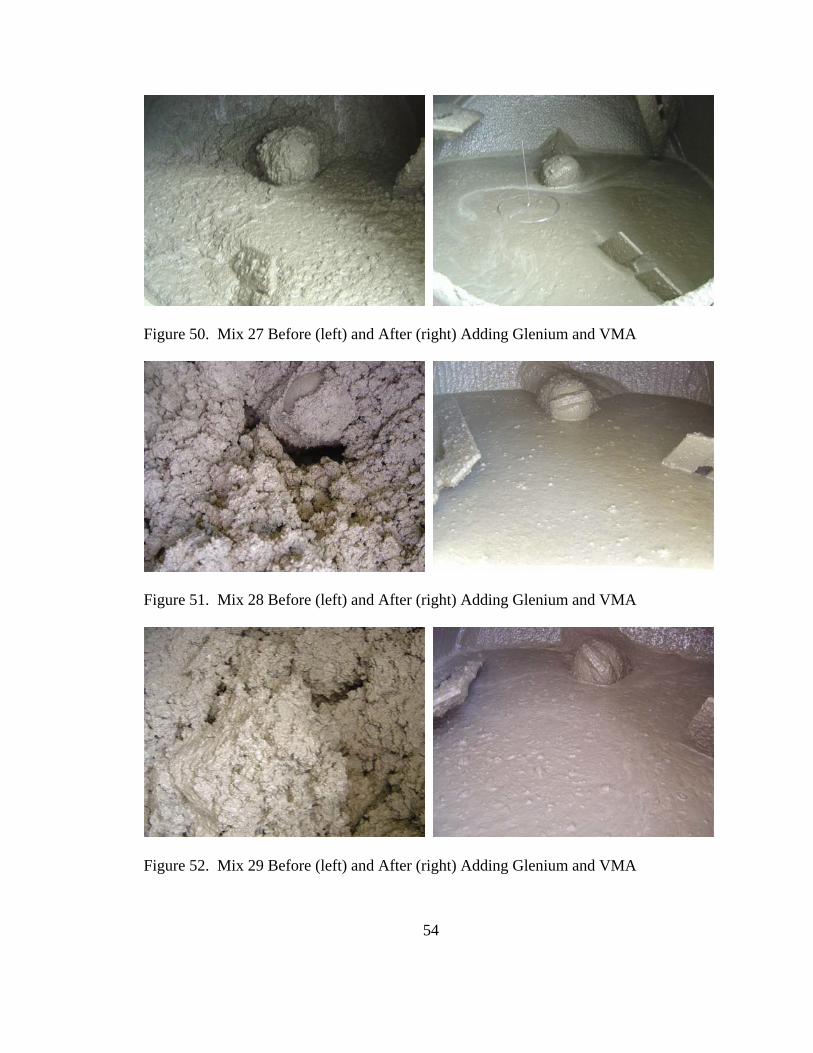
Figure 50. Mix 27 Before (left) and After (right) Adding Glenium and VMA ............... 54
Figure 51. Mix 28 Before (left) and After (right) Adding Glenium and VMA ............... 54
Figure 52. Mix 29 Before (left) and After (right) Adding Glenium and VMA ............... 54
Figure 53. Mix 30 Before (left) and After (right) Adding Glenium and VMA ............... 55
Figure 54. Bubbling Observed in Mix 28 ........................................................................ 56
Figure 55. Glenium Dosage ............................................................................................. 57
Figure 56. VMA Dosage .................................................................................................. 59
Figure 57. Table 1 from ASTM C1621 (2006) ................................................................ 61
Figure 58. Slump Flow (left) vs. J-Ring (right) of an acceptable mix ............................. 62
Figure 59. J-Ring flow with J-Ring removed. ................................................................. 63
Figure 60. Slump Flow (left) and J-Ring Flow (right) of an Unacceptable Mix ............. 64
Figure 61. Unacceptable J-Ring Flow (left) and Good J-Ring Flow (right) .................... 64
2
Chapter 1: Introduction
Material Description
Self Consolidating Concrete (SCC) is a high flow concrete that provides various
advantages over traditional concrete. It can flow between dense reinforcing steel under
its own weight, reducing or even eliminating the need for mechanical consolidation. It
can also reduce finishing time and produce a higher quality end result. SCC was
developed during the late 1980’s in Japan and has since become quite common in
Japanese and European construction. Over the past few years, there has been increased
interest in this product in the United States, especially for precast construction. Research
has been done in several states, however, many recommend using rounded aggregate,
such as river gravel, to improve flow. The aggregate that is readily available in Hawai‘i
is made from crushed basalt and is very angular. This may cause problems in getting the
mix to flow properly without segregation.
Project Description
In traditional drilled shaft construction, reinforcing cages are often very dense and the
larger aggregate tend to interfere with the concrete flow through the reinforcing steel and
into the outer areas of the shaft. Debris from shaft walls can also interfere with the
concrete’s ability to fill properly. These obstructions often result in large voids,
inadequate coverage of reinforcing steel and even exposed reinforcing steel. It is also
difficult to uniformly vibrate the concrete in these shafts and over-vibration can lead to

3
segregation of the concrete. Using SCC in drilled shaft construction would minimize
these problems since the fluidity of the mix should carry larger aggregates through dense
reinforcing steel and completely surround the reinforcing steel to protect it from
corrosion. This in turn will provide more uniform coverage as well as prevent the
reinforcing steel from being exposed to the ground.
The objective of this project is to explore the viability of using SCC for drilled shaft
construction in Hawai‘i. The scope of this report covers the first phase of a larger
project. It addresses drafting specifications, working with and gaining an understanding
of the material, and evaluating the feasibility of using SCC for local projects, particularly
drilled shaft construction. The draft specifications are included as Appendix C. The later
phase(s) of the project, which are not covered in this report, will involve exploring
options such as adding fibers or pozzolans such as fly ash and culminate with placing a
test pile to determine the actual performance of SCC in this setting, as well as the
monitoring of long term characteristics, such as creep and shrinkage.
Preliminary specifications were drafted based on literature review of research that has
already been conducted by other institutions and the needs of drilled shaft construction.
The locally available aggregates are significantly different from those used in
“traditional” SCC and could affect the quality of the SCC produced. The angularity and
high aspect ratio of the local aggregates may increase the aggregate interlocking and
inhibit flow. Testing was performed to understand the effects of the aggregates and

4
commonly used admixtures on the concrete behavior and to develop viable mix designs.
Research from various institutions indicates that the mixing method can significantly
affect the characteristics of SCC. Consequently, a standard mixing procedure was
developed and used to help reduce the number of variables present during the trials. As
trial mixes were made with the local materials, a set of mix design guidelines were
developed and the specifications were refined as the behavior of the material was
experienced firsthand. SCC mix trials were conducted using aggregates from both of
Honolulu’s main quarries, Halawa and Kapa‘a. A sample mix was also batched at a local
ready mix plant to observe any differences caused by producing a large volume in a plant
setting.

5
Chapter 2: Literature Review
Existing SCC Research and Applications
Overseas Usage
SCC was developed in Japan in the late 1980s by building upon underwater concrete
technology in response to a low skilled labor supply and spread through Europe in the
1990s (Hamilton and Labonte 2005). SCC has been used in applications ranging from
the Akashi-Kaikyo Bridge to the Landmark Tower in Japan, several bridges in Sweden,
and various civil engineering structures in Thailand, among others (RILEM 2000). In
Europe, EFNARC produced their “Specifications and Guidelines for Self-Compacting
Concrete” in early 2002 as a source of information for both producers and consumers.
Later, in 2004, EFNARC, along with BIBM, CEMBUREAU, ERMCO and EFCA
formed the Self-Compacting Concrete European Project Group and published “The
European Guidelines for Self Compacting Concrete” in May 2005.
Research in the United States
Several states in the US have explored the possibility for using SCC as a standard
building material. Many of the studies conducted have been funded by either the Federal
Highways Administration or various State Departments of Transportation. The desire to
use SCC in precast concrete construction has also spread quickly throughout the United
States and Europe. It is especially desirable in the precast industry and for architectural
concrete because it produces a more uniform final product with a higher quality surface

6
and can be used to form shapes that would otherwise be impossible. The precast industry
is an ideal candidate for using SCC because, compared to other construction venues, it is
in a very controlled environment. Many precast plants produce concrete on site or at a
specific nearby plant. This reduces several variables, especially transit time and makes
producing a consistent, high quality SCC mix easier. The University of Florida, in
conjunction with the Florida State Department of Transportation has conducted research
in using SCC to produce precast bridge girders (Hamilton and Labonte 2005). Other uses
are also being investigated by institutions such as the Federal Highways Administration
(FHWA), Virginia Department of Transportation (VDOT) and Iowa State University
(Lwin 2006). Research in the area of using SCC for drilled shaft construction is has also
been conducted at Auburn University in Alabama (Hodgson et al. 2004) and successful
construction of an SCC drilled shaft has been achieved by the South Carolina Department
of Transportation (Lwin 2006).
Importance of Repetition for Hawai‘i Applications
Although research utilizing SCC for drilled pile construction has been conducted by
others, none have been restricted to aggregate as angular as the locally produced crushed
basalt. Many SCC mixes are made with smooth river gravel, which increases the flow
ability of the mix. It needs to be determined whether or not the angularity of the crushed
basalt will inhibit the flow ability of the mix and if its effects can be remedied by using
admixtures. Another property of the local aggregate that may affect the plastic behavior
of SCC produced with it is the high absorptions of some of the coarse aggregates.

7
Mix trials need to be performed using the local aggregates in order to determine how the
aggregate properties affect the SCC mix properties. If a decrease in flow ability is found,
testing is necessary to determine if it can be remedied by refining the mix proportions or
by using admixtures. Also, it must be determined whether or not a mix with the
necessary characteristics will be able to be produced in a cost effective manner. Since the
focus of this project is to develop a viable mix for use in drilled shaft piles, the mix will
be created around the requirements of that application and the specifications developed
may not reflect the standards of other states or be suitable for all other applications.
Other Local Applications of SCC
Hawaiian Cement is known to have successfully produced SCC mixes of varying
strengths for several clients. However, these mixes were for small scale projects. The
mix being developed for this project is to be used as the main component for drilled shaft
bridge piles. Consequently, it needs to be appropriate for the conditions that will be
encountered during the pour including delays, dense reinforcing, etc.
The Hawaiian Cement mix designs will be used as a starting point for the drilled shaft
mix design. The mix proportions and admixtures will be adjusted until the desired flow
and working time has been achieved in a non segregating mix.

8
Chapter 3: Material Properties
The aggregates used in this project were 3/4" and 3/8” crushed basalt rock and basalt
sand from both the Halawa and Kapa‘a quarries, as well as Maui Dune Sand and
Nanakuli Limestone. The cement used was packaged Hawaiian Cement Type I/II
cement. The high range water reducer (HRWR) used was Master Builders Glenium 3030
and the viscosity modifying admixture was Master Builders VMA 358. Master Builders
Delvo and Daratard HC were also used in some trials, with Delvo being the
recommended retarding admixture and Daratard HC being the retarding admixture used
in the Hawaiian Cement mix.
Sieve Analysis
Sieve analysis was performed for the eight different aggregates used in the mix trials.
This was necessary to proportion the initial mixes. It also provided an idea of the
gradation of mixes given the proportions of each mix, as well as the ability to monitor the
consistency of the raw materials used. Mix gradations and sieve analysis results can be
found for mixes one through eight and 25 through 30 in Appendix D.
Moisture Content
The moisture content of each aggregate was determined at different stages in the project
in order to adjust the amount of additional water that needed to be added to produce the
desired water cement ratio. It was also important to know the moisture content of the

9
aggregates because of the sensitivity of the fresh properties of SCC mixtures to variations
in mixing water that was observed.
Absorption
The absorption of the aggregate also needed to be taken into account in order to
determine the amount of water that needed to be added to the mix to reach the saturated
surface dry (SSD) condition. Also, it was unknown if the high absorptions of the local
aggregate would have an effect on the mix behavior. Absorptions were determined for
all aggregates used and new absorption values were determined when a new batch of
aggregates was received.

10
Chapter 4: Test Procedures
Fresh Mix Properties
There are several tests that can be used to test the fresh properties of SCC. These include
the slump flow, VSI, T20, J-Ring, L-Box, U-box, V-Funnel and Segregation Column. In
this investigation, the slump flow was the main test used in the initial trials, and the
slump flow, VSI, T20, J-Ring, L-Box and Segregation Column were used in the final six
trials. The U-Box and V-Funnel were not used because they are the least likely to be
used as field tests as they are rather large. The Modified Segregation Column was
developed as a possible smaller scale alternative for the Segregation Column. ASTM
standards have recently been developed for three of these tests: the Slump Flow, J-Ring
and Segregation Column. These standards describe the test method and standardize its
application to SCC.
Slump Flow, T-20 and Visual Stability Index (VSI)
The slump flow is used to determine the flowability of the mix. This test is similar to the
slump cone test for traditional concrete and is governed by ASTM C1611 (2005).
Research conducted at Auburn University concerning SCC for use in drilled shaft
applications suggests a slump flow of 24 to 30 inches (Hodgson et al. 2004). Based on
the preliminary mixes, it is believed that SCC with a slump flow less than 20 inches will
not be able to effectively flow through the drilled shaft reinforcing on its own. However,
the greater the slump flow, the more difficult it is to keep the mix from segregating.

11
Figure 1. Slump Flow Test.
The T-20 test, also known as the T-50 test is the time it takes for the mix to reach a
diameter of twenty inches (50 cm). This gives the mix’s unconfined flow rate and can
also be an indication of the mix’s viscosity. It is performed simultaneously with the
slump flow by timing from the time the cone is lifted to the time the concrete reaches a
20 inch diameter ring inscribed on the base plate. Guidelines for the T-20 test are given
in an appendix to ASTM C1611 (2005).

12
The Visual Stability Index (VSI) is a visual evaluation of the amount of the segregation
that the mix exhibits. The VSI is determined by looking at the concrete after performing
the slump flow test to identify any clumping of coarse aggregate, halos or water sheen
that is present. The appendix of ASTM C1611 (2005) provides visual samples as well as
written descriptions of what each level should look like. The concrete is rated on a scale
of zero to three, with zero being the best and three being the worst. An acceptable VSI
for this project is estimated to be 1.5 or less based on the descriptions given.
Representative samples of each common VSI levels encountered in this project are shown
in Figures 2 through 4. VSI values less than or equal to one all have uniform distribution
of coarse aggregate all the way to the outer edges. Incremental distinctions are made by
the amount of excess paste or water sheen on the surface or the appearance of the edges.
VSI values between one and two have coarse aggregate relatively evenly distributed and
reaching within half an inch of the edge with an evident water sheen or mortar halo. VSI
values of three have a severe mortar or bleed water halo and clumping of aggregate at the
center. They may also have coarse aggregate that appears to be separate from the paste.
Figure 2. Example of VSI = 0 (left) and VSI = 0.5/1 (right).

13
Figure 3. Example of VSI = 1.5 (left) and VSI = 2 (right).
Figure 4. Examples of VSI = 3 Concrete.
In this project, the slump flow, T-20 and VSI tests were conducted after initial mixing
was completed and before and after each retempering. In this project, retepering refers to
the addition of small amounts of HRWR on site to regain the desired slump flow. Each
batch was retempered twice at approximately 30 minute intervals by adding small
amounts of high range water reducer in increments of 1.5 oz./cwt and mixing for 90
seconds until the slump flow reached at least 20 inches. This was done in an attempt to
remedy the rapid slump flow loss encountered.

14
J-Ring
The J-Ring simulates a reinforcing steel cage to test the passing ability of the SCC. This
test is governed by ASTM C1621 (2006) and is basically the slump flow test performed
within a reinforcing steel ring. The passing ability of the mix is determined based on the
slump flow difference with and without the ring. Intuitively, deformed bars would be
used in the ring, however, the ASTM standard indicates that smooth bars are to be used.
Preliminary review of other institutions research notes little difference between the two
and both types will be used during the course of this project (Billberg et al. 2004). J-Ring
flows were taken initially and after each retempering.
Figure 5. J-Ring Dimensions from Fig 1 in ASTM 1621 (2006)

15
Figure 6. J-Ring Test
L-Box
The L-Box is another test for passing ability but does not yet have an ASTM standard. In
this test, the box is shaped like an L with three bars positioned at the point of transition
from the vertical portion to the horizontal portion, which are separated with a sliding
gate. The box is eight inches wide throughout and the vertical section is 24 inches high
and 4 inches deep, while the horizontal section is 6 inches high and 27.75 inches deep.
The vertical portion is filled with concrete and the gate is lifted, allowing the concrete to
flow under its own power to fill the horizontal portion. The difference between concrete
levels at both ends of the horizontal leg of the L-Box indicates the ability to pass through
the reinforcing steel screen. One L-Box test was performed for each trial.

16
Figure 7. L-Box Test Apparatus
Figure 8. Completed L-Box Test

17
Segregation Column
The segregation column is important for checking the stability of the mix. It is a
quantitative test in which a sectioned 26 inch high, eight inch diameter column is filled
with concrete and allowed to stand for 15 minutes. After this time has elapsed, the top
section, which is 6.5 inches tall, is removed and its contents collected and washed over a
No. 4 sieve. The recovered coarse aggregate is then dried to a saturated surface dry
condition and weighed. The same is repeated for the contents of the bottom 6.5 inch
section and the two masses are compared. This test is governed by ASTM C1610 (2006).
A segregation column test was performed after the initial mixing for each trial. A special
provision issued by the Illinois Department of Transportation limits the segregation index
to 15% (Hine 2006).
Modified Segregation Column
The modified segregation column is a scaled down version of the segregation column
developed to try to create a segregation test that could be viable for use in the field. The
full sized segregation column uses a large amount of material and is difficult to conduct
with two people and near impossible with only one person. The height of the column
sections was kept the same as those of the standard segregation column, however, the
diameter of the column was decreased by half to four inches. The test procedure is the
same as that for the segregation column. A modified segregation column test was
performed initially and after each retempering for each trial. The decrease in diameter
may restrict the settling of the aggregates and results will be compared to those of the
standard segregation column to determine if there is a correlation.

18
Figure 9. Modified Segregation Column (left) and Segregation Column (right)
Segregation Probe
The Segregation Probe is a wire ring with a handle (Figure 10) that is placed on top of
SCC and allowed to sit on the surface for a given period of time in order to get an idea of
the stability of the mix. The method given by Concrete Construction Magazine for this
test is to cast a cylinder and allow it to sit for two minutes before the probe is placed, then
to allow the probe to sit another minute before the reading is taken (2006). This test was
brought to our attention near the end of the trials and our probe was improvised and not
used consistently. Also, since the cylinders were cast after all of the other tests in the
trials and the consistency changed greatly over that time period, the probe was placed on

19
the surface of the concrete in the mixer for one to five minutes immediately after mixing.
This can be seen in Figure 53.
Figure 10. Segregation Probe Dimensions and Guidelines (Jeknaorian and Cornman,
2007)
Air Content
Testing for air content is not specific to SCC and is often used as an indicator of concrete
durability. In places that experience freezing temperatures, a certain percentage of
entrained air is critical for freeze-thaw resistance. This was not an issue in this study,
however, air content measurements were still taken to help determine to what extent air
was being entrapped within the concrete. These measurements were taken using a Type
B meter as defined in ASTM C231 (2004).

20
Hardened Mix Properties
Compressive Stress
The compressive stress is an important property of concrete. Although high strength
concrete is not necessary for the drilled shaft application, strength needs to be monitored
to determine if the different admixtures significantly affect the strength of the mixes.
Three cylinders will be cast after the initial mixing and an additional two cylinders will
be cast after two retemperings have been done in order to see if there are any adverse
effects caused by the retempering.
Voids
The amount of voids visible in the completed test specimens is relevant since they are
made with no consolidation, unlike tradition test cylinders. Large voids are an indication
that the filling ability of the mix may not be acceptable. Cured cylinders were visually
checked for significant voids both externally before testing and internally after testing.
Shrinkage
Shrinkage is also monitored since mixes with higher cement content often have higher
shrinkage rates. The shrinkage results obtained during the course of this study will not
cover a long enough time period to give conclusive results. However, the long term
results obtained from the specimens cast may prove useful when paired with the other
data gathered from these trials.

21
Chapter 5: Mix Designs
Methodology
A total of 30 mix trials were conducted in this study. The initial mixes were prepared to
observe the properties of SCC made with local aggregates and to determine a starting
point for the stability testing. After a reasonable mix had been found, it was used as the
basis for mixes from both quarries with various water cement ratios. This base mix was
produced at a local ready mix plant to observe any significant differences due to the
different mixing conditions before more intensive trials were performed.
Each subsequent batch was done using a butter batch before the actual batch to get a
more accurate representation of the mix without the paste loss resulting from the empty
mixer. The expected high range water reducer (HRWR) demand was determined for
these mixes using a standard process involving incrementally adding the HRWR and
mixing for 90 seconds each time until a self leveling mix was obtained. The amount of
viscosity modifying admixture (VMA) was then determined by incrementally adding it
and mixing for 30 seconds until coarse aggregate was visible at the surface of the
mixture.
Trials were conducted using the above process for four water cement ratios (0.39, 0.45,
0.50 and 0.55) for mixtures using aggregates from each quarry. Finally, four cubic foot
batches were conducted with the 0.39, 0.45 and 0.50 water cement ratio mixes for each

22
quarry. The 0.55 water cement ratio mix was omitted since it would not be a viable
option for below grade construction. These six trials were used to compile a
representative data set.
Mixes
Mixes 1-4
The primary purpose of mixes one through four was to experience the behavior of the
material. The starting point for these mixes was an existing SCC mix design provided by
Hawaiian Cement. The first mix substituted 3/8 inch maximum aggregate for all the
coarse aggregate and yielded poor results. All subsequent mixes used both 3/4 inch and
3/8 inch maximum aggregate. The first two mixes were made using aggregate from
Kapa‘a Quarry, while the second two were made using aggregate from Halawa Quarry.
The effect of the material properties on the fresh concrete properties was evident when
the same mix design yielded very different results when prepared using aggregate from a
different quarry. All four batch sizes were proportioned to use one 94 pound sack of
cement and ranged from three to 3.4 cubic feet.
Large Scale Mix
Mix design number four produced a reasonable mix using Halawa aggregate. This mix
was submitted to Hawaiian Cement to be produced at the batch plant and delivered to the
University of Hawai‘i Structures Lab. The concrete was used to construct eight beams
for the Reinforced Concrete Design class and a concrete slab for another research project

23
(Figure 11). Slump flow, J-Ring, and Segregation Column tests were performed on this
mix as well.
Figure 11. Construction of SCC Beam (left) and Slab (right).
The fresh properties of this mix were similar to what was experienced in the lab trial.
The mix was not self leveling, but performed reasonably well as far as being self
consolidating.
Many of the beams produced had a nice formed finish (Figure 14) and most to the
defects, such as exposed reinforcing steel, were in areas where the minimum clearance
between the reinforcing and the formwork or areas with reinforcement spacers (Figure
12). The far ends of the beams also had some unevenness. This is believed to be due to
the fact that the concrete was placed from one end an allowed to flow to the other end
under its own weight as much as possible (Figure 13).

24
Figure 12. Exposed Reinforcing and Spacers
Figure 13. SCC Beams with a Poor Finish
Figure 14. SCC Beams with a Nice Finish
25
Mixes 5-9
For these five mixes, a smaller batch size of one cubic foot was used, along with a 0.5
cubic foot butter batch. The switch to a smaller batch size was to conserve materials and
make the preliminary trials easier to conduct. The butter batch was introduced to try and
produce a more accurate picture of the mix produced from the mix design, especially
since the initial batches exhibited sensitivity to water content. Due to this sensitivity,
mixes five through nine included trials with oven dried aggregate as well as those with
oven dried aggregate that had water added to approximate the saturated surface dry
condition. It was found that the oven dried aggregate mix had high amounts of surface
water and the SSD mix showed reduced amounts of surface water and required less
HRWR. The mix proportions and gradation information for mixes one through eight can
be found in Appendix D.
Mixes 10-20
For mixes 10 through 20, a standard mix procedure was introduced and the batch sizes
were kept the same as those for mixes five through nine. The mix procedure used can be
found in Appendix A. The main goal for these trials was to determine the amount of
HRWR necessary to obtain a slump flow above 20 inches and the corresponding dose of
VMA. Trials were conducted using four different water cement ratios for mixes designed
for each of the two quarries.

26
Mixes 21-24
The Halawa base mix design for mixes 10 through 20 used eight 94 pound sacks of
cement per cubic yard, while the Kapa’a base mix used nine sacks. The Kapa’a mixes
tended to have better workability so a trial mix 21 was done with a nine sack Halawa mix
that slightly reduced the amount of HRWR used and exhibited greater workability than
the corresponding eight sack mix. It was then decided that all mixes for the final trials
would be designed for nine sacks of cement per cubic yard.
Mixes 21 through 24 also served as the trials for which different methods were tried to
offset slump flow loss. One method tried was to simulate the constant mixing that would
be experienced in a concrete truck by mixing intermittently throughout the test period.
This did not seem to help to reduce slump flow loss at all. The next method tried was to
retemper the concrete using a small dose of HRWR immediately before placement.
Although this did not significantly delay slump flow loss, it allowed the slump flow
characteristics to return for placement.
Mixes 25 -30
These final six mixes were done in four cubic foot batches with 0.75 cubic foot butter
batches. The increase in mix size was to accommodate for the additional tests that would
be run. While mixes 5 through 21 only had the slump flow and J-Ring performed, these
six mixes needed to be large enough to perform the slump flow, J-Ring, L-Box,
Segregation Column, Modified Segregation Column and air content tests, as well as to
cast five six inch compression cylinders and two shrinkage prisms. Due to their large
27
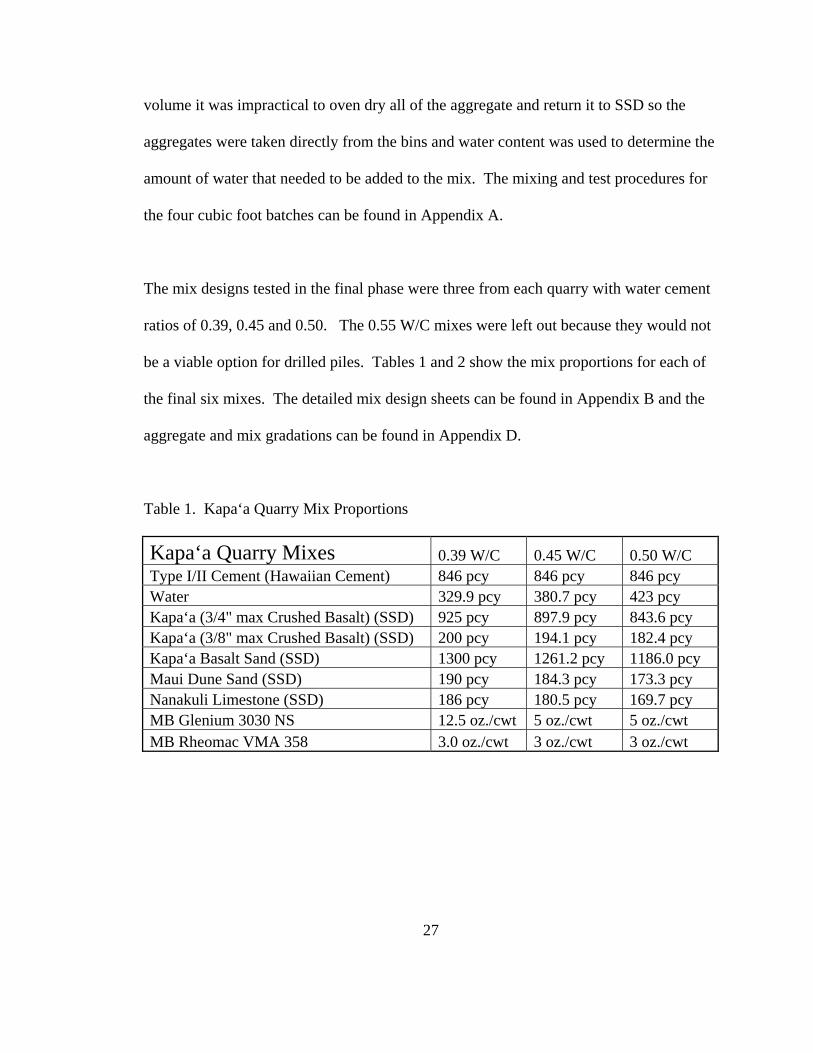
volume it was impractical to oven dry all of the aggregate and return it to SSD so the
aggregates were taken directly from the bins and water content was used to determine the
amount of water that needed to be added to the mix. The mixing and test procedures for
the four cubic foot batches can be found in Appendix A.
The mix designs tested in the final phase were three from each quarry with water cement
ratios of 0.39, 0.45 and 0.50. The 0.55 W/C mixes were left out because they would not
be a viable option for drilled piles. Tables 1 and 2 show the mix proportions for each of
the final six mixes. The detailed mix design sheets can be found in Appendix B and the
aggregate and mix gradations can be found in Appendix D.
Table 1. Kapa‘a Quarry Mix Proportions
Kapa‘a Quarry Mixes 0.39 W/C 0.45 W/C 0.50 W/C Type I/II Cement (Hawaiian Cement) 846 pcy 846 pcy 846 pcy Water 329.9 pcy 380.7 pcy 423 pcy Kapa‘a (3/4" max Crushed Basalt) (SSD) 925 pcy 897.9 pcy 843.6 pcy Kapa‘a (3/8" max Crushed Basalt) (SSD) 200 pcy 194.1 pcy 182.4 pcy Kapa‘a Basalt Sand (SSD) 1300 pcy 1261.2 pcy 1186.0 pcy Maui Dune Sand (SSD) 190 pcy 184.3 pcy 173.3 pcy Nanakuli Limestone (SSD) 186 pcy 180.5 pcy 169.7 pcy MB Glenium 3030 NS 12.5 oz./cwt 5 oz./cwt 5 oz./cwt MB Rheomac VMA 358 3.0 oz./cwt 3 oz./cwt 3 oz./cwt

28
Table 2. Halawa Quarry Mix Proportions
Halawa Quarry Mixes 0.39 W/C 0.45 W/C 0.50 W/C Type I/II Cement (Hawaiian Cement) 846 pcy 846 pcy 846 pcy Water 329.9 pcy 380.7 pcy 423 pcy Halawa 3F (3/4" max Crushed Basalt) (SSD) 900 pcy 858.2 pcy 823.4 pcy Halawa Chips (3/8" max Crushed Basalt) (SSD) 240 pcy 228.8 pcy 219.6 pcy Halawa Basalt Sand (SSD) 934 pcy 890.8 pcy 854.2 pcy Maui Dune Sand (SSD) 250 pcy 238.4 pcy 228.6 pcy Nanakuli Limestone (SSD) 525 pcy 500.7 pcy 480.1 pcy MB Glenium 3030 NS 20 oz./cwt 15 oz./cwt 5 oz./cwt MB Rheomac VMA 358 1.5 oz./cwt 3 oz./cwt 1.5 oz./cwt

29
Chapter 6: Results
Fresh Properties
Slump Flow
Figures 15 through 20 show the slump flow in inches taken at various points throughout
each trial. The low points on each graph show the slump flow before retempering, while
the peaks are the initial and retempered slump flow measurements.
Slump Flow - Mix 25Kapa'a 0.39 W/C
0
5
10
15
20
25
30
0 20 40 60 80 100 120
Elapsed Time (minutes)
Slu
mp
Flo
w (
inch
es)
Initial
Before 1st Retempering
Before 2nd Retempering
After 2nd Retempering
After 1st Retempering
Figure 15. Slump Flow for Mix 25

30
Slump Flow - Mix 26Kapa'a 0.45 W/C
0
5
10
15
20
25
30
0 10 20 30 40 50 60 70 80 90 100
Elapsed Time (minutes)
Slu
mp
Flo
w (
inch
es)
Initial
Before 1st Retempering
Before 2ndRetempering
After 2nd RetemperingAfter 1st Retempering
Dose 1
After 1st RetemperingDose 2
Figure 16. Slump Flow for Mix 26
Slump Flow - Mix 27Kapa'a 0.50 W/C
0
5
10
15
20
25
30
0 10 20 30 40 50 60 70 80 90
Elapsed Time (minutes)
Slu
mp
Flo
w (
inch
es)
Initial
Before 1st Retempering
Before 2nd Retempering
After 2nd Retempering
After 1st Retempering
Figure 17. Slump Flow for Mix 27

31
In Figures 18 and 19, the extra data point is due to the fact that the initial retempering
dose of Glenium added to the mix was not sufficient to return it to an acceptable slump
flow of greater than 20 inches. The fourth point in these graphs show the slump flow
obtained after the next incremental dose was added.
Slump Flow - Mix 28Halawa 0.39 W/C
0
5
10
15
20
25
30
0 10 20 30 40 50 60 70 80 90 100
Elapsed Time (minutes)
Slu
mp
Flo
w (
inch
es)
Initial
Before 1stRetempering
Before 2nd Retempering
After 2nd Retempering
After 1st RetemperingDose 1
After 1st RetemperingDose 2
Figure 18. Slump Flow for Mix 28

32
Slump Flow - Mix 29Halawa 0.45 W/C
0
5
10
15
20
25
30
0 10 20 30 40 50 60 70 80 90 100
Elapsed Time (minutes)
Slu
mp
Flo
w (
inch
es)
Initial
Before 1st Retempering
Before 2ndRetempering
After 2nd Retempering
After 1st RetemperingDose 1
After 1st RetemperingDose 2
Figure 19. Slump Flow for Mix 29
Slump Flow - Mix 30Halawa 0.50 W/C
0
5
10
15
20
25
30
0 10 20 30 40 50 60 70 80 90 100
Elapsed Time (minutes)
Slu
mp
Flo
w (
inch
es)
Initial
Before 1st Retempering Before 2nd
Retempering
After 2nd Retempering
After 1stRetempering
Figure 20. Slump Flow for Mix 30

33
T-20
Figure 21 shows the T-20 times for the initial condition, after the first retempering and
after the second retempering. T-20 times between one and 25 seconds have been deemed
acceptable for drilled shaft applications of SCC (Hodgson et al. 2006). Figures 22 and 23
show the effects of each retempering on the T-20 times for each mix. Mixes with an
infinite T-20 time (slump flow less than 20 inches) are represented by having a T-20 time
of 10 seconds.
T-20 Times
0
1
2
3
4
5
6
7
8
9
10
Mix 25 Kapa'a 0.39
Mix 26 Kapa'a 0.45
Mix 27 Kapa'a 0.50
Mix 28 Halawa 0.39
Mix 29 Halawa 0.45
Mix 30 Halawa 0.50
T-2
0 T
ime
(sec
.)
Initial
After 1st Retemp
After 2nd Retemp
Figure 21. T-20 times for Initial and Retempered Conditions.

34
T-20 Times - 1st Retempering
0
1
2
3
4
5
6
7
8
9
10
Mix 25 Kapa'a 0.39
Mix 26 Kapa'a 0.45
Mix 27 Kapa'a 0.50
Mix 28 Halawa 0.39
Mix 29 Halawa 0.45
Mix 30 Halawa 0.50
T-2
0 T
imes
(se
c.)
Before Retemp
Initial Dose
Additional Dose
Note: T-20 times shown as 10 represent cases where the slump flow was < 20 inches.
Figure 22. T-20 Times – Approx. 30 Minutes After Initial Slump Flow.
T-20 Times - 2nd Retempering
0
1
2
3
4
5
6
7
8
9
10
Mix 25 Kapa'a 0.39
Mix 26 Kapa'a 0.45
Mix 27 Kapa'a 0.50
Mix 28 Halaw a
0.39
Mix 29 Halaw a
0.45
Mix 30 Halaw a
0.50
T-2
0 T
ime
(sec
.)
Before 2nd Retemp
After 2nd Retemp
Note: T-20 t imes shown as ten represent cases wherethe slump f low was < 20 inches.
Figure 23. T-20 Times – Approx. 60 Minutes After Initial Slump Flow.
35
VSI
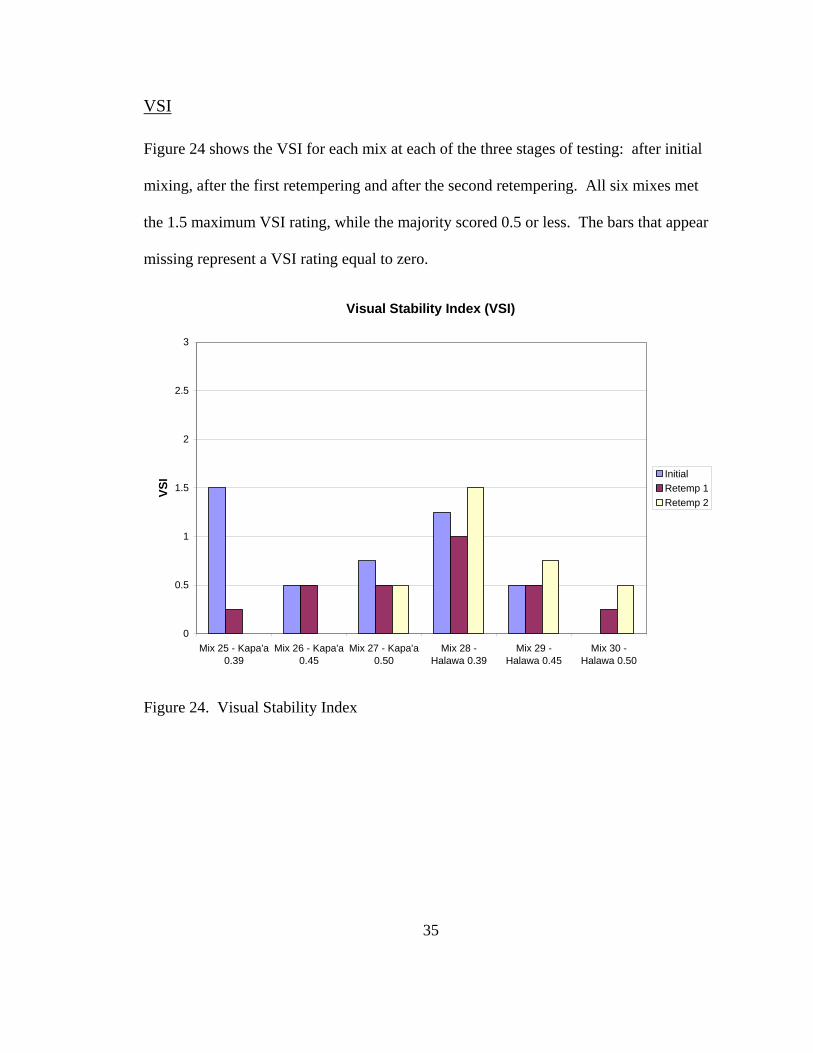
Figure 24 shows the VSI for each mix at each of the three stages of testing: after initial
mixing, after the first retempering and after the second retempering. All six mixes met
the 1.5 maximum VSI rating, while the majority scored 0.5 or less. The bars that appear
missing represent a VSI rating equal to zero.
Visual Stability Index (VSI)
0
0.5
1
1.5
2
2.5
3
Mix 25 - Kapa'a0.39
Mix 26 - Kapa'a0.45
Mix 27 - Kapa'a0.50
Mix 28 -Halawa 0.39
Mix 29 -Halawa 0.45
Mix 30 -Halawa 0.50
VS
I Initial
Retemp 1
Retemp 2
Figure 24. Visual Stability Index

36
J-Ring
Figures 25 and 26 show the J-Ring flow values in inches taken initially and after each of
the two retemperings. Mix 26 (Figure 25) and Mix 28 (Figure 26) have an extra point
each since they both were dosed twice during the first retempering. Mix 29 (Figure 26)
was also dosed twice during the first retempering, however, a J-Ring test was not
performed after the first dose.
J-Ring Flows - Kapa'a
0
5
10
15
20
25
30
0 20 40 60 80 100 120
Time (min)
Flo
w (
in) Mix 25 - Kapa'a 0.39
Mix 26 - Kapa'a 0.40
Mix 27- Kapa'a 0.50
Figure 25. J-Ring Flows for Kapa‘a Mixes

37
J-Ring Flows - Halawa
0
5
10
15
20
25
30
0 20 40 60 80 100 120
Time (min)
Flo
w (
in) Mix 28 - Halaw a 0.39
Mix 29 - Halaw a 0.45
Mix 30 - Halaw a 0.50
Figure 26. J-Ring Flows for Halawa Mixes

38
Figure 27 shows the difference, in inches, between the slump flow and J-Ring
measurements. This is the criteria by which ASTM C-1621 (2006) dictates blocking be
determined.
Slump Flow vs. J-RingDifference in Inches
0
0.5
1
1.5
2
2.5
3
3.5
Mix 25 Mix 26 Mix 27 Mix 28 Mix 29 Mix 30
Dif
fere
nce
(in
ches
)
Initial
Retemp 1
Retemp2
Figure 27. Difference Between J-Ring and Slump Flow Beasurements

39
Figure 28 shows the ratios between the J-Ring measurements and slump flow
measurements. The ratios were computed because it was observed that some mixes with
a two inch difference between the slump flow and J-Ring measurements did not exhibit
the “extreme blocking” described in the table given in ASTM C-1621 (2006) (Figure 57).
J-Ring / Slump Flow Ratios
0.75
0.8
0.85
0.9
0.95
1
1.05
Mix 25 Kapa'a 0.39
Mix 26 Kapa'a 0.45
Mix 27 Kapa'a 0.50
Mix 28 Halaw a 0.39
Mix 29 Halaw a 0.45
Mix 30 Halaw a 0.50
JR
/SF
Initial
Retemp 1
Retemp 2
Figure 28. J-Ring to Slump Flow Ratios

40
L-Box
Figure 29 shows the H2/H1 ratios obtained during this project. Acceptable values for
SCC are between 0.60 and 0.85 (Hodgson et al. 2004). All L-Box ratios obtained were
above the 0.60 minimum except for Mix 30, which is the 0.50 W/C Halawa mix. Those
that show as greater than one are due to the measurement at the far end being higher than
that of the the near end.
L-Box Ratios
0.00
0.20
0.40
0.60
0.80
1.00
1.20
1.40
Mix 25 - Kapa'a0.39 W/C
Mix 26 - Kapa'a0.45 W/C
Mix 27 - Kapa'a0.5 W/C
Mix 28 - Halawa0.39 W/C
Mix 29 - Halawa0.45 W/C
Mix 30 - Halawa0.50 W/C
H2
/H1
Figure 29. L-Box H2/H1 Ratios.

41
Segregation Column
Figure 30 shows the segregation indexes for mixes 25 through 30 obtained by using the
segregation column. The segregation index, S, is obtained using Equation 1 and should
be less than 15 % (Hine 2006).
100*2
topbottom
topbottom
ww
wwS Equation 1
Where:
Wbottom = oven dry weight of the aggregate from the bottom section
Wtop = oven dry weight of the aggregate from the top section
Segregation Column
0.0%
2.0%
4.0%
6.0%
8.0%
10.0%
12.0%
14.0%
16.0%
18.0%
Mix 25 - Kapa'a0.39
Mix 26 - Kapa'a0.45
Mix 27 - Kapa'a0.50
Mix 28 -Halaw a 0.39
Mix 29 -Halaw a 0.45
Mix 30 -Halaw a 0.50
Seg
reg
atio
n In
dex
Figure 30. Segregation Column Segregation Indexes

42
Modified Segregation Column
The segregation index for the modified segregation column is obtained by the same
equation as for the segregation column (Equation 1). Figures 31 through 33 show the
segregation index for each of the six mixes initially and after each of two retemperings.
Modified Segregation Column - No Retempering
0.0%
5.0%
10.0%
15.0%
20.0%
25.0%
30.0%
Mix 25 - Kapa'a0.39
Mix 26 - Kapa'a0.45
Mix 27 - Kapa'a0.50
Mix 28 -Halaw a 0.39
Mix 29 -Halaw a 0.45
Mix 30 -Halaw a 0.50
Seg
reg
atio
n In
dex
Figure 31. Modified Segregation Column Segregation Index - No Retempering

43
Modified Segregation Column - Retempered Once
0.0%
5.0%
10.0%
15.0%
20.0%
25.0%
30.0%
Mix 25 -Kapa'a 0.39
Mix 26 -Kapa'a 0.45
Mix 27 -Kapa'a 0.50
Mix 28 -Halaw a 0.39
Mix 29 -Halaw a 0.45
Mix 30 -Halaw a 0.50
Seg
reg
atio
n In
dex
Figure 32. Modified Segregation Column Segregation Index - After First Retempering
Modified Segregation Column - Retempered Twice
0.0%
5.0%
10.0%
15.0%
20.0%
25.0%
30.0%
Mix 25 -Kapa'a 0.39
Mix 26 -Kapa'a 0.45
Mix 27 -Kapa'a 0.50
Mix 28 -Halaw a 0.39
Mix 29 -Halaw a 0.45
Mix 30 -Halaw a 0.50
Seg
reg
atio
n In
dex
Figure 33. Modified Segregation Column Index - After Second Retempering

44
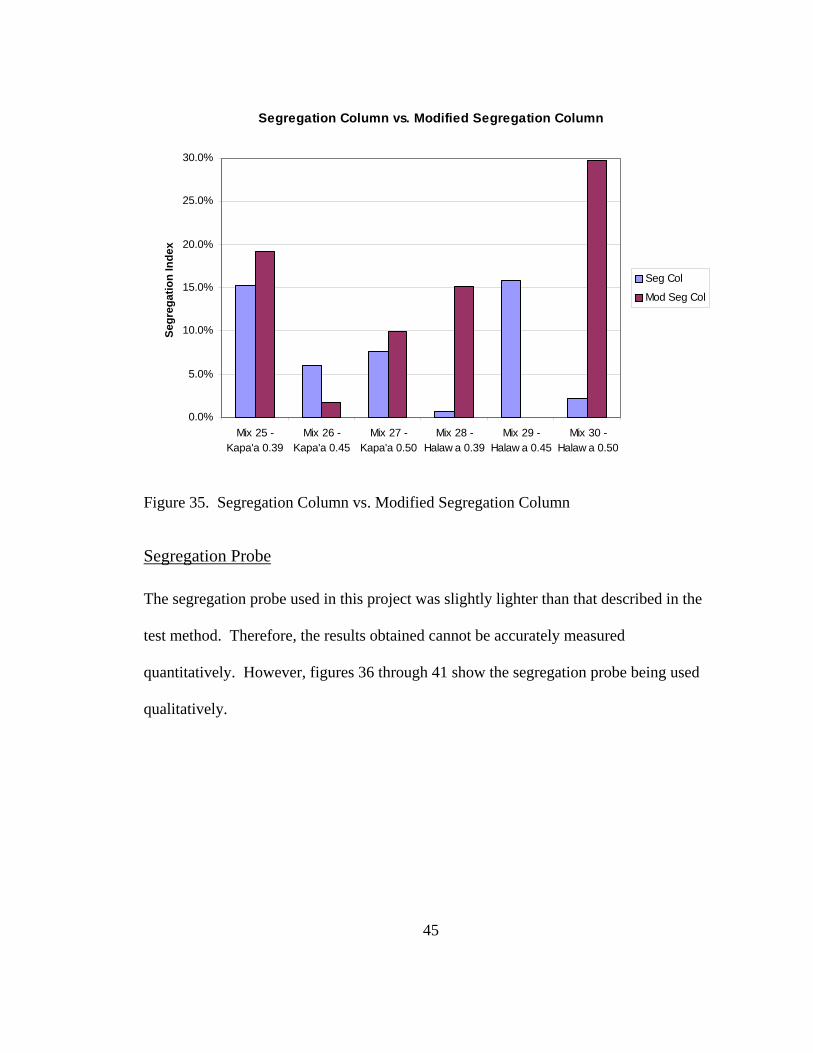
Figure 34 shows the values from figures 31 through 33 together to ease comparison of the
segregation index between phases. Figure 35 shows the segregation index values
obtained with the traditional segregation column alongside the values obtained with the
modified segregation column for the unretempered concrete.
Modified Segregation Column
0%
5%
10%
15%
20%
25%
30%
Mix 25 -Kapa'a 0.39
Mix 26 -Kapa'a 0.45
Mix 27 -Kapa'a 0.50
Mix 28 -Halaw a 0.39
Mix 29 -Halaw a 0.45
Mix 30 -Halaw a 0.50
Se
gre
ga
tio
n In
de
x
Initial
Retemp 1
Retemp 2
Figure 34. Modified Segregation Column
45
Segregation Column vs. Modified Segregation Column
0.0%
5.0%
10.0%
15.0%
20.0%
25.0%
30.0%
Mix 25 -Kapa'a 0.39
Mix 26 -Kapa'a 0.45
Mix 27 -Kapa'a 0.50
Mix 28 -Halaw a 0.39
Mix 29 -Halaw a 0.45
Mix 30 -Halaw a 0.50
Se
gre
ga
tio
n In
de
x
Seg Col
Mod Seg Col
Figure 35. Segregation Column vs. Modified Segregation Column
Segregation Probe
The segregation probe used in this project was slightly lighter than that described in the
test method. Therefore, the results obtained cannot be accurately measured
quantitatively. However, figures 36 through 41 show the segregation probe being used
qualitatively.

46
Figure 36. Segregation Probe for Mix 25 Butter Batch (left) and Mix 25 (right)
Figure 37. Segregation Probe for Mix 27 Unretempered (left) and Retempered (right)
Figure 38. Segregation Probe for Mix 28 Unretempered (left) and twice Retempered
(right)
47
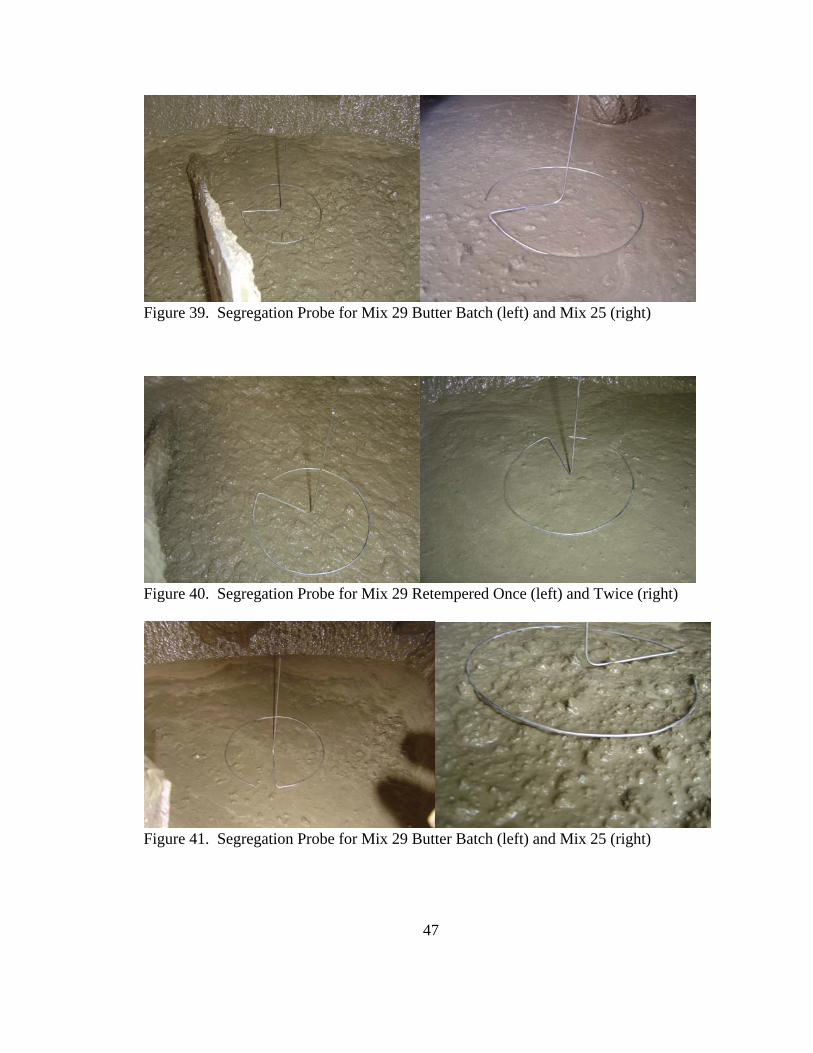
Figure 39. Segregation Probe for Mix 29 Butter Batch (left) and Mix 25 (right)
Figure 40. Segregation Probe for Mix 29 Retempered Once (left) and Twice (right)
Figure 41. Segregation Probe for Mix 29 Butter Batch (left) and Mix 25 (right)

48
Air Content
Figure 42 shows the air content of each mix before any retempering and after two
retemperings. Air content was determined to get an idea of the amount of air being
entrapped. Air content was not determined for Mix 30.
Air Content
0.0%
0.5%
1.0%
1.5%
2.0%
2.5%
3.0%
3.5%
4.0%
4.5%
Mix 25 -Kapa'a 0.39
Mix 26 -Kapa'a 0.45
Mix 27 -Kapa'a 0.5
Mix 28 -Halawa 0.39
Mix 29 -Halawa 0.45
Mix 30 -Halawa 0.50
Air
Co
nte
nt
No Retempering
After Retempering
No Data
Figure 42. Air Content – Before and After Retempering
Hardened Properties
Compressive Strength Results
Figure 43 shows the average maximum compressive stress for each mix. Values are the
average of three test cylinders and represent the unretempered condition. The Halawa
mixes had higher maximum stresses than their Kapa‘a counterparts. All mixes followed

49
the expected trend of lower water cement ratios corresponding to higher compressive
strength.
Average Maximum Stress - No Retempering
0
2,000
4,000
6,000
8,000
10,000
12,000
0.39 0.45 0.5
Water to Cement Ratio
Str
es
s (
ps
i)
Kapa'a
Halaw a
Figure 43: Average Maximum Compressive Stress – No Retempering
Figure 44 shows the average maximum compressive stress after two retemperings. These
were calculated by taking the average of two cylinders cast after the second retempering.
Even after retempering, the compressive strengths of the Halawa 0.39 W/C and 0.45 W/C
mixes continue to remain higher than the Kapa‘a mixes but is lower than the Kapa’a mix
of the same water cement ratio for the 0.50 W/C mix. Again, the expected trend of
higher strengths corresponding to lower water to cement ratios is preserved.

50
Average Maximum Stress - Retempered Twice
0
2,000
4,000
6,000
8,000
10,000
12,000
0.39 0.45 0.5
Water to Cement Ratio
Str
es
s (
ps
i)
Kapa'a
Halaw a
Figure 44. Average Maximum Compressive Stress – Retempered Twice.
Figure 45 shows each mix without retempering next to its retempered counterpart.
Except for the Kapa‘a 0.39 W/C mix, all mixes gained compressive strength.

51
Average Maximum Stress
0
2,000
4,000
6,000
8,000
10,000
12,000
0.39 0.45 0.5
Water to Cement Ratio
Str
es
s (
ps
i) Kapa'a
Kapa'a Retemp
Halaw a
Halaw a Retemp
Figure 45. Average Maximum Stress Comparison
Shrinkage Results
Figures 46 and 47 show the shrinkage observed from prisms cast from all six mixes.
Two shrinkage prisms were cast from the unretempered concrete for each mix.
Shrinkage will continue to be monitored intermittently over time.

52
Shrinkage for Kapa'a Mixes
-700
-600
-500
-400
-300
-200
-100
0
0.00
2.00
4.00
6.00
11.0
013
.00
19.0
030
.00
33.0
038
.00
Days from Removing Forms
Sh
rin
ka
ge
(m
icro
str
ain
)
0.39 W/C - Mix 25 Prism 1
0.39 W/C - Mix 25 Prism 2
0.45 W/C - Mix 26 Prism 1
0.45 W/C - Mix 26 Prism 2
0.50 W/C - Mix 27 Prism 1
0.50 W/C - Mix 27 Prism 2
Figure 46. Shrinkage for Kapa‘a Mixes.
Shrinkage for Halawa Mixes
-500
-400
-300
-200
-100
0
100
200
0.00 4.00 5.00 6.00 7.00 10.00 13.00 14.00 24.00 25.00 27.00 28.00 32.00
Days from Removing Forms
Sh
rin
kag
e (m
icro
stra
in)
0.39 W/C - Mix 28 Prism 1
0.39 W/C - Mix 28 Prism 2
0.45 W/C - Mix 29 Prism 1
0.45 W/C - Mix 29 Prism 2
0.50 W/C - Mix 30 Prism 1
0.50 W/C - Mix 30 Prism 2
Figure 47. Shrinkage for Halawa Mixes
53
Chapter 7: Discussion
Fresh Properties
Appearance and Consistency
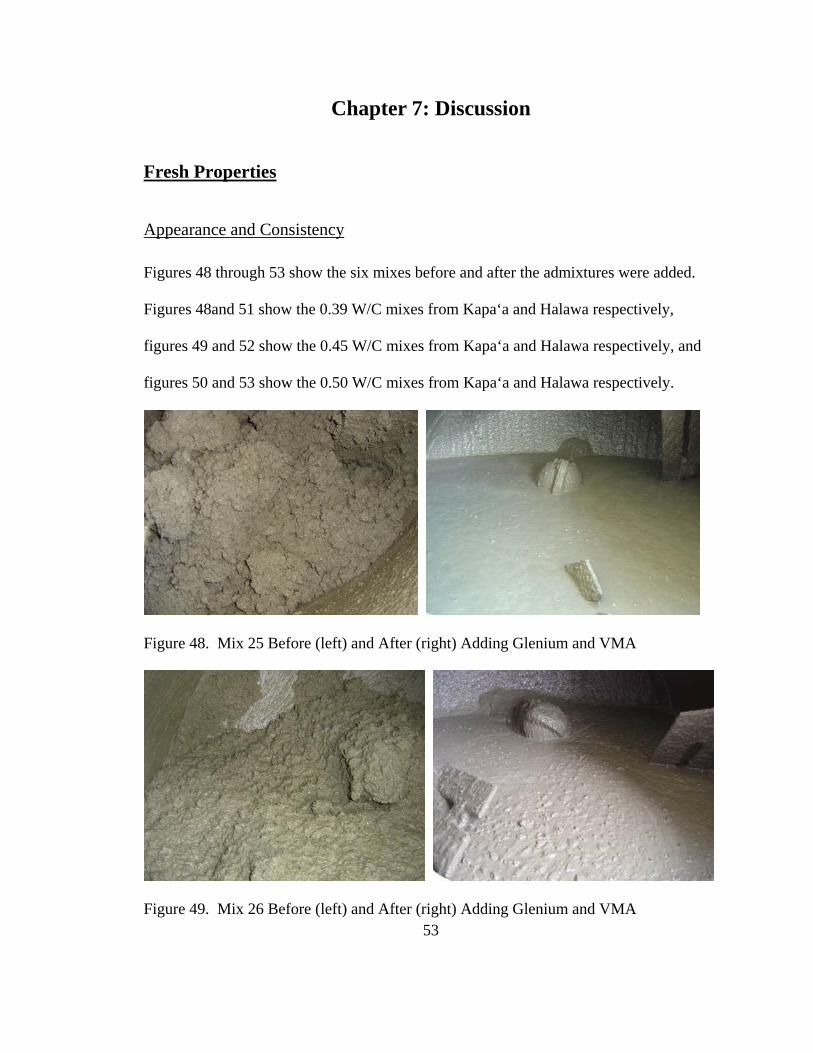
Figures 48 through 53 show the six mixes before and after the admixtures were added.
Figures 48and 51 show the 0.39 W/C mixes from Kapa‘a and Halawa respectively,
figures 49 and 52 show the 0.45 W/C mixes from Kapa‘a and Halawa respectively, and
figures 50 and 53 show the 0.50 W/C mixes from Kapa‘a and Halawa respectively.
Figure 48. Mix 25 Before (left) and After (right) Adding Glenium and VMA
Figure 49. Mix 26 Before (left) and After (right) Adding Glenium and VMA
54
Figure 50. Mix 27 Before (left) and After (right) Adding Glenium and VMA
Figure 51. Mix 28 Before (left) and After (right) Adding Glenium and VMA
Figure 52. Mix 29 Before (left) and After (right) Adding Glenium and VMA

55
Figure 53. Mix 30 Before (left) and After (right) Adding Glenium and VMA
As the pictures show, the 0.50 W/C mixes produce a slightly fluid mix without any
admixtures. This provides two main advantages. First, less HRWR is required to
produce the desired flow characteristics, which reduces cost and second, the flow
retention is better since the mix is not relying solely on the HRWR to flow. However,
these mixes also appeared to have more bleed water visible on the surface.
The 0.39 W/C mixes were able to produce SCC with the desired consistency, however, it
was much harder to get the amount of HRWR just right and the mixes seemed to be more
sensitive to the water content of the aggregates and other factors. There were also some
mixing issues with these mixes in the larger batches due to the dry nature of the mix.
More clumping of the fine aggregate, especially of the dune sand was observed around
pieces of coarse aggregate and around the mixing drum.
56
The 0.45 W/C mixes seemed to be a nice compromise of practicality, consistency and
sensitivity. The water-cement ratio is low enough that concrete produced can be used in
below grade applications, while maintaining a workable yet stable mix. These mixes also
had the lowest observed instance of bubbling due to the HRWR.
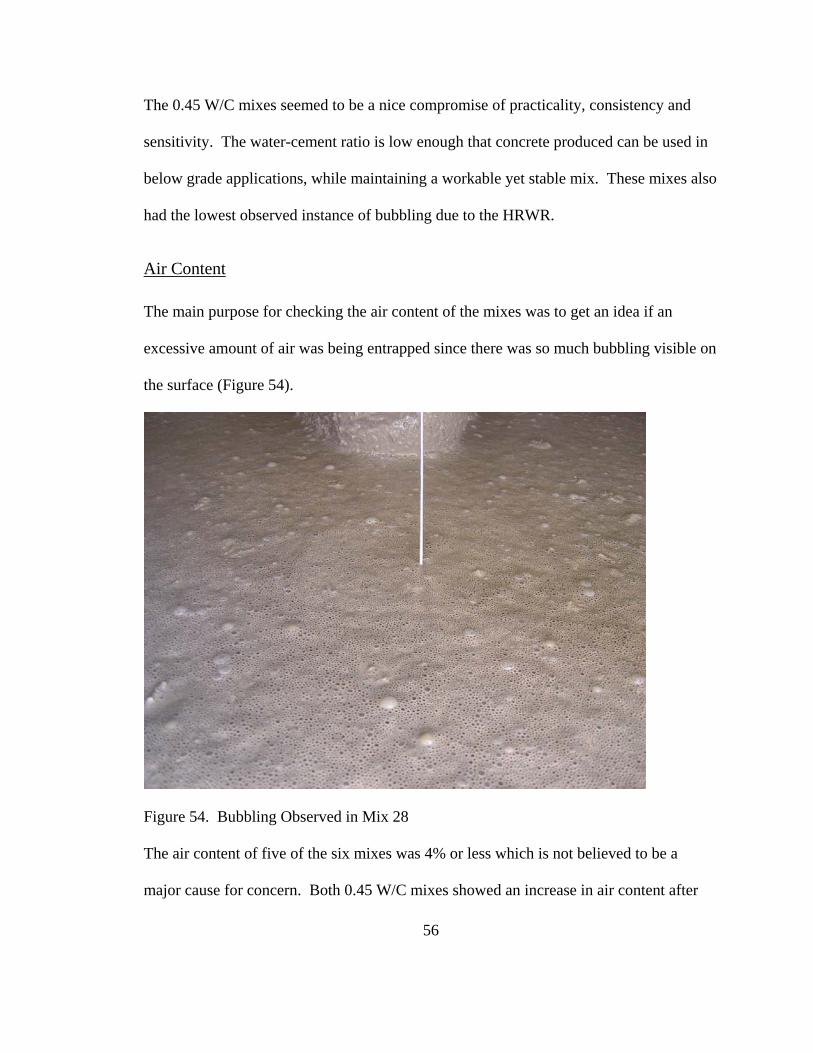
Air Content
The main purpose for checking the air content of the mixes was to get an idea if an
excessive amount of air was being entrapped since there was so much bubbling visible on
the surface (Figure 54).
Figure 54. Bubbling Observed in Mix 28
The air content of five of the six mixes was 4% or less which is not believed to be a
major cause for concern. Both 0.45 W/C mixes showed an increase in air content after

57
retempering. The 0.39 and 0.50 W/C Kapa‘a mixes did not show any change after the
second retempering and the 0.39 Halawa mix actually showed a reduction in air content
after retempering. There is no air content data for the 0.50 W/C Halawa mix.
High Range Water Reducer (HRWR) Dosage
Figure 55 shows the total amount of Glenium in oz./cwt that was added to each mix. It
also breaks it down into three levels: the initial dose, the first retempering and the second
retempering.
Glenium Dosage
0
5
10
15
20
25
30
35
Mix 25 -Kapa'a 0.39
Mix 26 -Kapa'a 0.45
Mix 27 -Kapa'a 0.5
Mix 28 -Halawa 0.39
Mix 29 -Halawa 0.45
Mix 30 -Halawa 0.50
Gle
niu
m (
oz.
/cw
t)
60 min. Retempering Dose
30 min. Retempering Dose
Initial Dose
Figure 55. Glenium Dosage
The Kapa‘a mixes typically required less Glenium than the Halawa mixes. This could be
due to the differences in the physical characteristics of the aggregate, as the Halawa
aggregate has a higher percentage of porous rock. As stated earlier, the 0.50 W/C mixes

58
from either quarry have much smaller HRWR demands that the 0.39 W/C mixes. The
Kapa‘a 0.45 W/C mix surprisingly used the same initial dosage as the 0.5 W/C mixes,
however, it did require double the amount the 0.5 W/C mixes did during each
retempering to reach the desired minimum slump flow of 20 inches.
Viscosity Modifying Admixture (VMA) Dosage
Figure 56 shows the VMA dosage for each of the six mixes. The VMA was administered
as the last component during the initial mixing cycle. The VMA dosages were typically
between 1.5oz./cwt and 3oz./cwt in the six main batches as well as other trials that were
performed previously. The amount of VMA used can vary depending on the amount of
Glenium or other HRWR used. This is because larger amounts of HRWR can cause
instabilities and VMA can counteract those instabilities to a certain extent. However, it
was observed that in doses over 3 to 5oz./cwt, VMA did not appear to add significantly to
the stability of the mixes and actually began to cause a decrease in slump flow.

59
VMA Dosage
0
0.5
1
1.5
2
2.5
3
3.5
Mix 25 - Kapa'a0.39
Mix 26 - Kapa'a0.45
Mix 27 - Kapa'a0.5
Mix 28 - Halawa0.39
Mix 29 - Halawa0.45
Mix 30 - Halawa0.50
VM
A (
oz.
/cw
t)
Figure 56. VMA Dosage
Set Time
Placement problems encountered with these mixes are believed to be primarily due to
loss of flow due to the effects of the Glenium wearing off quickly. It did not appear that
the concrete was actually beginning to truly set until after around 90 minutes. The use of
retarding admixtures such as Daratard HC and Delvo had little to no effect on the time
the mix maintained the desired flow characteristics. The fact that the higher water
cement ratio mixes had longer work times support this because they are naturally more
workable due to their higher water content. If anything, the Daratard HC and Delvo
added an extra variable in the mixes and resulted in greater instability and
unpredictability of the mix. Retempering by adding small amounts of Glenium, typically

60
1.5-3 oz./cwt, immediately before placement appears to be effective in extending work
time and does not appear to have any adverse effects on the mix.
Slump Flow vs. Time
For various reasons, such as mixing time and the performance of other tests, it was not
possible to get slump flows at exactly 30 minutes from the time the cement and water
began mixing. The initial slump flow results were obtained after all admixtures had been
added and mixed for the prescribed amount of time. This was usually about 10-15
minutes after the officially noted mix start time. The second slump flow was taken at
approximately 30 minutes after the first slump flow, placing it typically around 45
minutes after the actual start time. The first retempering was then performed and another
slump flow taken. A second round of slump flows and retempering was done again after
about another 30 minutes had elapsed. The variations in these times make it difficult to
make an exact comparison between the slump flow losses. However, it appears
reasonable to deduce from the data that the 0.39 W/C mixes from both quarries lost
slump at a faster rate that the mixes with higher water cement ratios. The Kapa‘a mix
(Figure 15), showed a drop of at least 12 inches in 52 minutes, while the Halawa mix
(Figure 18) dropped at least 13 inches in 30 minutes. This is assuming the initial 10-15
minutes before the first slump flow did not incur any slump flow losses.
The slump flow loss results are too similar for the 0.45 and 0.50 W/C mixes to draw any
conclusions about which retains slump flow better. However, it is useful to note that the
0.45 W/C mix does not perform noticeably worse with regard to slump flow retention.

61
Another notable observation is that the slump flow loss between the first retempering and
the next unretempered slump flow is typically less rapid than the initial drop, with the
exception of the 0.5 W/C mixes. This is believed to show that the added Glenium not
only can help recover lost flow but also slow the rate of loss over time. This raises the
possibility that if the Glenium or other HRWR is added gradually over time, it may
produce a longer lasting result. However, even if this is true, it is not as practical as
redosing with a small amount on site.
Comparison of Test Methods
Best Representation of Material
It is believed that the J-ring test is the most representative single test that can be used. By
itself, it not only provides an idea of the mix’s flow characteristics, but also its passing
ability and a visual stability check. The ASTM procedure for this test requires a slump
flow to be done as well and defines the difference between the averages to be a
representation of passing ability.
Table 1 Blocking Assessment
Difference Between Slump Flow and J-Ring Flow
Blocking Assessment
0 to 1 in. [0 to 25 mm] No visible blocking
>1 to 2 in. [>25 to 50 mm] Minimal to noticeable
blocking
>2 in. [> 50 mm] Noticeable to extreme
blocking
Figure 57. Table 1 from ASTM C1621 (2006)
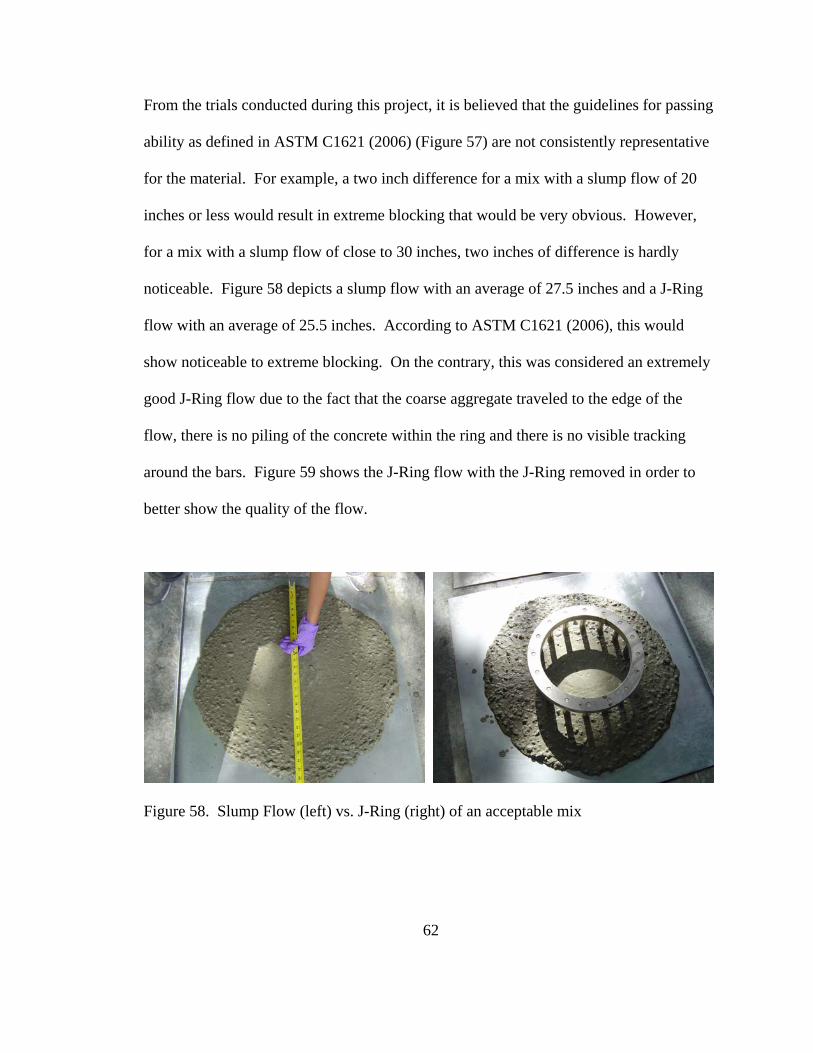
62
From the trials conducted during this project, it is believed that the guidelines for passing
ability as defined in ASTM C1621 (2006) (Figure 57) are not consistently representative
for the material. For example, a two inch difference for a mix with a slump flow of 20
inches or less would result in extreme blocking that would be very obvious. However,
for a mix with a slump flow of close to 30 inches, two inches of difference is hardly
noticeable. Figure 58 depicts a slump flow with an average of 27.5 inches and a J-Ring
flow with an average of 25.5 inches. According to ASTM C1621 (2006), this would
show noticeable to extreme blocking. On the contrary, this was considered an extremely
good J-Ring flow due to the fact that the coarse aggregate traveled to the edge of the
flow, there is no piling of the concrete within the ring and there is no visible tracking
around the bars. Figure 59 shows the J-Ring flow with the J-Ring removed in order to
better show the quality of the flow.
Figure 58. Slump Flow (left) vs. J-Ring (right) of an acceptable mix

63
Figure 59. J-Ring flow with J-Ring removed.
Figure 60 shows an unacceptable example of a two inch difference between slump flow
and J-Ring. It shows an average slump flow of 21 inches and an average J-Ring flow of
18.75 inches. Figure 61 shows the difference between the two examples from a similar
perspective. In the left picture, the height difference from the center of the ring to the
edge of the flow is apparent, as well as the tracking from the bars. In the right picture,
the concrete has flowed around the bars to an almost level condition with no tracking
around the bars.

64
Figure 60. Slump Flow (left) and J-Ring Flow (right) of an Unacceptable Mix
Figure 61. Unacceptable J-Ring Flow (left) and Good J-Ring Flow (right)
Due in part to the fact that this mix is intended to be used in drilled shaft piles, the L-Box
is believed to be a more accurate representation of the mix’s passing ability if it is
available. This belief is based on the fact that the slump flow and J-Ring are measures of
unconfined flow. The L-Box provides a finite flow distance which is believed to allow
for more consistent results.
Ease of Execution
The slump flow, J-Ring, T-20, VSI, segregation probe and modified segregation column
are all easily performed. In a field inspection setting, it is believed that the J-Ring would

65
provide the most information with the least effort. Although the guidelines for T-20 and
VSI are provided in ASTM C1611 (2005), they can be performed with the J-Ring test as
well. This means that with a single, simple test, information about a mix’s flow
characteristics, passing ability, viscosity and stability can be obtained.
The L-Box is also reasonable simple to perform. However, it is bulky and difficult to
clean well after the test. Its results are also believed to be more sensitive to slope in the
ground. For these reasons, it is not highly recommended for use in a field setting.
If visual inspection of the mix raises concerns about the mix’s segregation resistance, the
segregation probe is recommended as the best option for quantitative field evaluation
since the modified segregation column does not provide immediate results.
Effects of Admixtures
High Range Water Reducer (HRWR)
A polycarboxylate HRWR is necessary in the production of SCC to obtain the high flow
rates while preserving lower W/C ratios. Over dosage of HRWR can result in excessive
air bubbles due to the collapse of the mix. It was observed that up to a certain point,
HRWR can be added and the bubbles will disperse within five to ten minutes, resulting in
an acceptable mix. It was also observed that in the case of accidental over dosage of
HRWR that results in excessive segregation, larger amounts of VMA can be added to
66
recover the mix up to a certain point with no significant adverse effects on the final
product.
The HRWR appears to wear off quickly and the flow rate does not maintain itself for
very long. It is believed that the amount of HRWR needed to obtain a self leveling
mixture should be added at the batching plant and a small amount of HRWR (1 to
3oz./cwt) added at the site immediately before placement to obtain the desired behavior.
Viscosity Modifying Admixture (VMA)
The amount of VMA does not seem as critical to the mixes as the amount of HRWR. It
was found to be very useful in reducing segregation in mixes where slightly too much
HRWR had been added, however, if the mix was not already relatively stable or had an
excessive overdose of HRWR, even large amounts of VMA did not make a significant
difference.
Retarding admixtures
Daratard HC and Delvo were both experimented with at the beginning of this project. It
was discovered that neither made a significant difference in extending the period of
workability. Temperatures also indicated that the concrete was not actually beginning to
truly set, even without the retarding admixtures being introduced. It is believed that
retarding admixtures may be helpful if extension beyond the standard 90 minutes is
required but should otherwise be omitted since they add an extra degree of uncertainty to
the mix with no apparent benefit.

67
Segregation Column vs. Modified Segregation Column
The results on the accuracy of the modified segregation column are inconclusive at this
time. As seen in Figures 34 and 35, the segregation index values are not consistent. The
modified segregation column does not yield results that even mirror the trends shown
with the traditional segregation column, though it does show a tendency to give a higher
index. The maximum segregation index for the segregation column was 15%, while the
maximum segregation index for the modified segregation column was 30%. For
comparison, the Illinois Department of Transportation produced a special provision for
cast in place SCC in 2006 that states a maximum segregation index of 15% (Hine 2006).
In evaluating the accuracy of the modified segregation column, it must be considered,
that the mixes used in these trials were for the most part stable mixes. A more effective
way of evaluating the accuracy of this test method would be to test it against the
traditional segregation column, using multiple trials, with mixes of slight, moderate and
severe visual segregation. Testing of different diameter columns would also be beneficial
to determine at what diameter the data no longer correlates with that obtained from the
traditional column.
Retempering
Retempering with small amounts of HRWR immediately before placement may prove to
be the key to producing high quality SCC in Hawai‘i. It is more time consuming since
the HRWR must be mixed in on site in small increments, however, it produces a better

68
product and overcomes the issue of rapid slump loss. In both 0.45 W/C mixes (Fig. 26
and 29), the final slump flow after a second retempering was actually higher than the
initial slump flow. Also, in terms of compressive strength, in five out of six trial mixes
the compressive strength after retempering twice either increased or remained the same
(Fig. 45).
The key to obtaining higher stable slump flows appears to be adding the HRWR in
increments over time so as not to overdose it at any time but instead slowly raise its flow.
The retempering testing done during the course of this project was mainly to determine if
re-dosing the mix with HRWR could recover the SCC back to the minimum acceptable
flow of 20 inches and if there were any adverse effects. This was done with very positive
results. The next step in pursuing this technique would be to determine the minimum
initial amount needed at initial mixing to produce acceptable flows at placement with
small (< 5oz./cwt) added quantities of HRWR on site, as well as the maximum amount
that can be added at the plant and still yield a non segregating mix after 30 minutes.
Also, it should be determined how much HRWR can be added on site at around T=60
minutes without causing segregation to get an idea of the maximum additional dose
tolerated by the mix and the corresponding maximum slump flow obtainable.

69
Chapter 8: Conclusions and Recommendations
Conclusions
The use of SCC for drilled shaft pile construction in Hawai‘i is promising.
The effect of the angularity of the aggregates can be overcome by proper mix
proportioning, the appropriate use of admixtures, and retempering with HRWR on
site.
The physical properties of the aggregate appear to influence the mix behavior.
This became evident when attempting to use the same mix design with aggregates
from the two different quarries (Kapa’a and Halawa).
The fresh properties of SCC are very sensitive to overall water content, as well as
aggregate water content.
Mixes with a water cement ratio less than 0.5 typically exhibit retention of the
desired flow characteristics for less than 30 minutes. On site re-dosing with
HRWR (retempering) immediately before placement seems to be the best option
for obtaining the desired flow rates at the time of placement.
High range water reducers (HRWR) are important to obtain the desired flow
characteristics but cause segregation and excessive bubbling in high quantities.
HRWR should not be used in doses higher than 20 oz./cwt.
Viscosity modifying admixtures reinforce the stability of the mix, it cannon
“create” it.

70
Retarding admixtures such as Delvo or Daratard HC are ineffective at prolonging
the time frame for desirable flow characteristics. They also seem to produce less
stable mixes and should be avoided unless time between mixing and placement
will exceed 90 minutes.
Using nine sacks of cement per cubic yard versus eight sacks per cubic yard
produced a more workable mix.
A water cement ratio of 0.45 appears to be the most promising for both quarries.
The idea of the modified segregation column is promising as a more manageable
alternative to the segregation column, however, more testing needs to be done
with varying aggregate sizes and segregation levels to produce a reliable
correlation.
For retempering with HRWR on site, enough HRWR should be added at the
batching plant to produce a roughly self leveling mix and HRWR should be added
on site in approximately 1.5 oz/cwt increments on site until the desired flow
characteristics are obtained.
Retempering does not appear to adversely affect the performance of SCC. In
some instances, it seemed to produce a more desirable product.
The slump flow and J-Ring are the tests best suited for field qualification because
of their portability and ease of execution.
The traditional segregation column is not practical. Segregation columns in
general are not suitable for field qualification because they cannot provide
immediate results.

71
Recommendations
More testing should be done with respect to retempering. It is recommended that
more mix trials be conducted to determine the maximum amounts of HRWR that
are tolerated by each mix initially and after each retempering.
Further testing to incorporate retarding admixtures, such as Delvo, while
maintaining a stable mix should be done to determine the viability of SCC when
faced with extended transport/placement times.
The modified segregation column is a much more manageable alternative to the
traditional segregation column. It is recommended that further testing be done to
determine if it is accurate. This testing should include multiple tests with both the
segregation column and modified segregation column to provide a better basis of
variability. These tests should also be done on mixes with varying amounts of
visual segregation.

72
Appendix A: Mixing Procedures

73
General Concrete Mixing Procedures
Always use a butter batch (0.5 and 0.75 cu ft minimum for the 6 and 9 cu ft drum mixers
respectively). Both the butter batch and main batch will use all the constituents as a first
check of the mix design. In this way, adjustments can be made to the main batch prior to
mixing it. The procedures listed below shall be followed for both butter and main
batching,
1. Add the Coarse Aggregate (CA) and 1-2 lbs. batch water.
2. Mix for 30 seconds.
3. Add the Fine Aggregate (FA) and Cementitious Materials
4. Mix to a homogenous blend (about 1 minute).
5. Add the remaining water as the mixer is running (with Delvo if applicable)
6. Mix for 3 minutes
7. Turn off the mixer and let rest for 3 minutes.
8. Begin mixing and immediately begin to add the HRWR
9. Mix for 90 seconds
10. Main batch only – Add VMA and mix for 30 seconds
11. Stop mixer
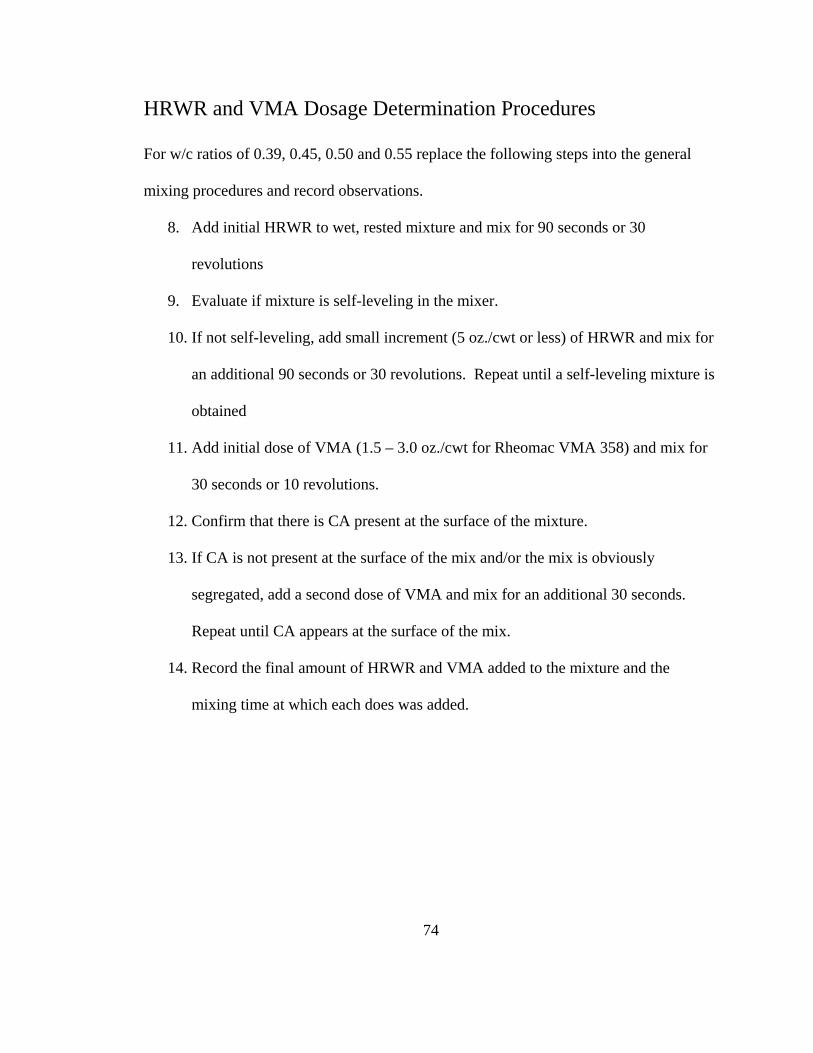
74
HRWR and VMA Dosage Determination Procedures
For w/c ratios of 0.39, 0.45, 0.50 and 0.55 replace the following steps into the general
mixing procedures and record observations.
8. Add initial HRWR to wet, rested mixture and mix for 90 seconds or 30
revolutions
9. Evaluate if mixture is self-leveling in the mixer.
10. If not self-leveling, add small increment (5 oz./cwt or less) of HRWR and mix for
an additional 90 seconds or 30 revolutions. Repeat until a self-leveling mixture is
obtained
11. Add initial dose of VMA (1.5 – 3.0 oz./cwt for Rheomac VMA 358) and mix for
30 seconds or 10 revolutions.
12. Confirm that there is CA present at the surface of the mixture.
13. If CA is not present at the surface of the mix and/or the mix is obviously
segregated, add a second dose of VMA and mix for an additional 30 seconds.
Repeat until CA appears at the surface of the mix.
14. Record the final amount of HRWR and VMA added to the mixture and the
mixing time at which each does was added.

75
Mixing and Test Procedures for Final Mixtures 25 to 30:
1. Mix half of CA and enough water to moisten
2. Mix 30 sec.
3. With mixer running, add FA, cement and remaining water incrementally, as
tolerated.
4. Mix for 3 min.
5. Let rest for 3 min. (Document properties)
6. Begin mixing and add HRWR.
7. Mix 90s, check for consistency.
8. For actual batch, add VMA.
9. Mix 30 sec.
10. Stop Mixer. (Document properties)
11. Do Slump Flow, J-Ring, T-20 and VSI
12. Do Segregation Col, Mod Segregation Col
13. Do L-Box and take Air Content
14. Make 3 cylinders and 2 shrinkage prisms
15. After about 25 min from initial slump flow:
a. Perform another slump flow
b. If slump flow is > 20 in, perform J-Ring
16. After about 30 min from initial slump flow:
a. Retemper with 1.5 oz/cwt HRWR
b. Mix for 90 sec.

76
c. Repeat a and b until self leveling in mixer
d. Perform slump flow
e. Repeat a, b, and d until slump flow is at least 21 inches
f. Perform J-Ring
g. Do Modified Segregation Column
17. After 30 min from last slump flow, repeat step 16
18. Make 2 cylinders, take Air Content
19. After 30 from last slump flow, take another slump flow if possible

77
Appendix B: Mix Design Spreadsheets
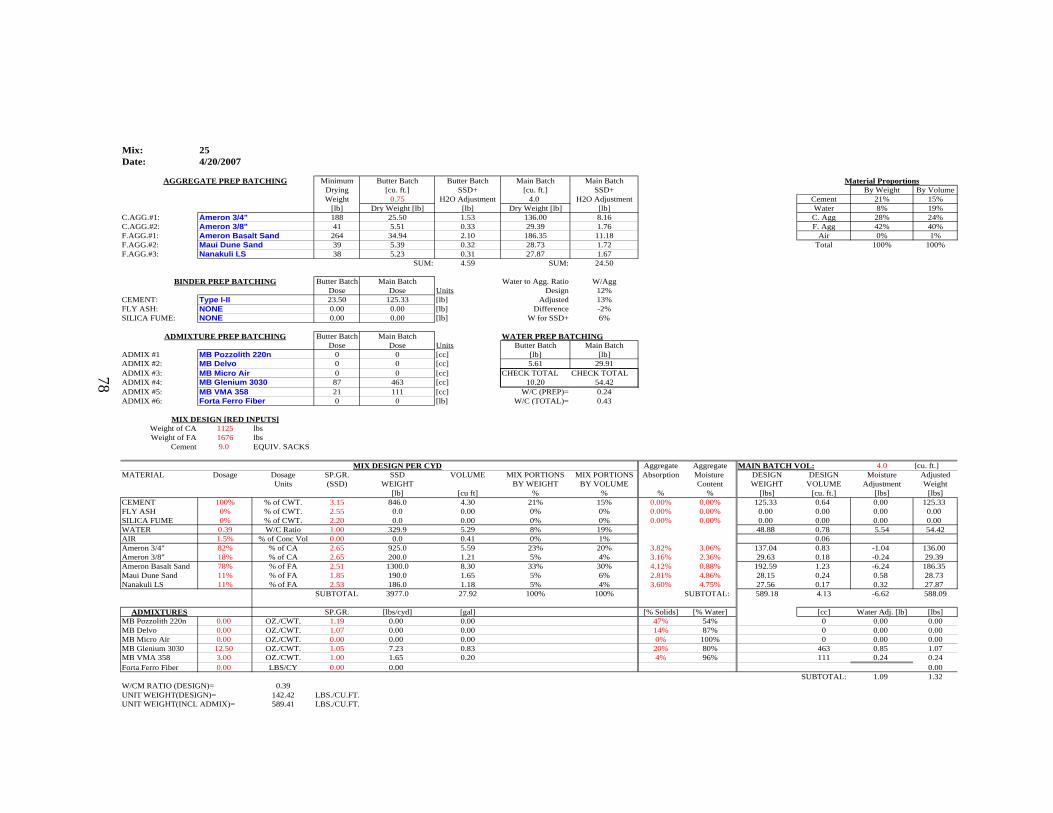
Mix: 25Date: 4/20/2007
AGGREGATE PREP BATCHING Minimum Butter Batch Butter Batch Main Batch Main Batch Material ProportionsDrying [cu. ft.] SSD+ [cu. ft.] SSD+ By Weight By VolumeWeight 0.75 H2O Adjustment 4.0 H2O Adjustment Cement 21% 15%
[lb] Dry Weight [lb] [lb] Dry Weight [lb] [lb] Water 8% 19%C.AGG.#1: Ameron 3/4" 188 25.50 1.53 136.00 8.16 C. Agg 28% 24%C.AGG.#2: Ameron 3/8" 41 5.51 0.33 29.39 1.76 F. Agg 42% 40%F.AGG.#1: Ameron Basalt Sand 264 34.94 2.10 186.35 11.18 Air 0% 1%F.AGG.#2: Maui Dune Sand 39 5.39 0.32 28.73 1.72 Total 100% 100%F.AGG.#3: Nanakuli LS 38 5.23 0.31 27.87 1.67
SUM: 4.59 SUM: 24.50
BINDER PREP BATCHING Butter Batch Main Batch Water to Agg. Ratio W/AggDose Dose Units Design 12%
CEMENT: Type I-II 23.50 125.33 [lb] Adjusted 13%FLY ASH: NONE 0.00 0.00 [lb] Difference -2%SILICA FUME: NONE 0.00 0.00 [lb] W for SSD+ 6%
ADMIXTURE PREP BATCHING Butter Batch Main Batch WATER PREP BATCHINGDose Dose Units Butter Batch Main Batch
ADMIX #1 MB Pozzolith 220n 0 0 [cc] [lb] [lb]ADMIX #2: MB Delvo 0 0 [cc] 5.61 29.91ADMIX #3: MB Micro Air 0 0 [cc] CHECK TOTAL CHECK TOTALADMIX #4: MB Glenium 3030 87 463 [cc] 10.20 54.42ADMIX #5: MB VMA 358 21 111 [cc] W/C (PREP)= 0.24ADMIX #6: Forta Ferro Fiber 0 0 [lb] W/C (TOTAL)= 0.43
MIX DESIGN [RED INPUTS]Weight of CA 1125 lbsWeight of FA 1676 lbs
Cement 9.0 EQUIV. SACKS
MIX DESIGN PER CYD Aggregate Aggregate MAIN BATCH VOL: 4.0 [cu. ft.]MATERIAL Dosage Dosage SP.GR. SSD VOLUME MIX PORTIONS MIX PORTIONS Absorption Moisture DESIGN DESIGN Moisture Adjusted
Units (SSD) WEIGHT BY WEIGHT BY VOLUME Content WEIGHT VOLUME Adjustment Weight[lb] [cu ft] % % % % [lbs] [cu. ft.] [lbs] [lbs]
CEMENT 100% % of CWT. 3.15 846.0 4.30 21% 15% 0.00% 0.00% 125.33 0.64 0.00 125.33FLY ASH 0% % of CWT. 2.55 0.0 0.00 0% 0% 0.00% 0.00% 0.00 0.00 0.00 0.00SILICA FUME 0% % of CWT. 2.20 0.0 0.00 0% 0% 0.00% 0.00% 0.00 0.00 0.00 0.00WATER 0.39 W/C Ratio 1.00 329.9 5.29 8% 19% 48.88 0.78 5.54 54.42AIR 1.5% % of Conc Vol 0.00 0.0 0.41 0% 1% 0.06Ameron 3/4" 82% % of CA 2.65 925.0 5.59 23% 20% 3.82% 3.06% 137.04 0.83 -1.04 136.00Ameron 3/8" 18% % of CA 2.65 200.0 1.21 5% 4% 3.16% 2.36% 29.63 0.18 -0.24 29.39Ameron Basalt Sand 78% % of FA 2.51 1300.0 8.30 33% 30% 4.12% 0.88% 192.59 1.23 -6.24 186.35Maui Dune Sand 11% % of FA 1.85 190.0 1.65 5% 6% 2.81% 4.86% 28.15 0.24 0.58 28.73Nanakuli LS 11% % of FA 2.53 186.0 1.18 5% 4% 3.60% 4.75% 27.56 0.17 0.32 27.87
SUBTOTAL: 3977.0 27.92 100% 100% SUBTOTAL: 589.18 4.13 -6.62 588.09
ADMIXTURES SP.GR. [lbs/cyd] [gal] [% Solids] [% Water] [cc] Water Adj. [lb] [lbs]MB Pozzolith 220n 0.00 OZ./CWT. 1.19 0.00 0.00 47% 54% 0 0.00 0.00MB Delvo 0.00 OZ./CWT. 1.07 0.00 0.00 14% 87% 0 0.00 0.00MB Micro Air 0.00 OZ./CWT. 0.00 0.00 0.00 0% 100% 0 0.00 0.00MB Glenium 3030 12.50 OZ./CWT. 1.05 7.23 0.83 20% 80% 463 0.85 1.07MB VMA 358 3.00 OZ./CWT. 1.00 1.65 0.20 4% 96% 111 0.24 0.24Forta Ferro Fiber 0.00 LBS/CY 0.00 0.00 0.00
SUBTOTAL: 1.09 1.32W/CM RATIO (DESIGN)= 0.39UNIT WEIGHT(DESIGN)= 142.42 LBS./CU.FT.UNIT WEIGHT(INCL ADMIX)= 589.41 LBS./CU.FT.
78

Mix: 26Date: 4/23/2007
AGGREGATE PREP BATCHING Minimum Butter Batch Butter Batch Main Batch Main Batch Material ProportionsBatching [cu. ft.] SSD+ [cu. ft.] SSD+ By Weight By VolumeWeight 0.75 H2O Adjustment 4.0 H2O Adjustment Cement 21.4% 15.8%
[lb] Weight [lb] [lb] Weight [lb] [lb] Water 9.7% 22.3%C.AGG.#1: Ameron 3/4" 182 24.89 1.49 132.74 7.96 C. Agg 27.7% 24.2%C.AGG.#2: Ameron 3/8" 40 5.36 0.32 28.60 1.72 F. Agg 41.2% 36.3%F.AGG.#1: Amerson Basalt Sand 256 33.90 2.03 180.79 10.85 Air 0.0% 1.5%F.AGG.#2: Maui Dune Sand 38 5.22 0.31 27.86 1.67 Total 100% 100%F.AGG.#3: Nanakuli LS 37 5.07 0.30 27.05 1.62
SUM: 4.47 SUM: 23.82
BINDER PREP BATCHING Butter Batch Main Batch Water to Agg. Ratio W/AggDose Dose Units Design 14%
CEMENT: Type I-II 23.50 125.33 [lb] Adjusted 15%FLY ASH: NONE 0.00 0.00 [lb] Difference -1%SILICA FUME: NONE 0.00 0.00 [lb] W for SSD+ 6%
ADMIXTURE PREP BATCHING Butter Batch Main Batch WATER PREP BATCHINGDose Dose Units Butter Batch Main Batch
ADMIX #1 MB Pozzolith 220n 0 0 [cc] [lb] [lb]ADMIX #2: MB Delvo 0 0 [cc] 7.05 37.62 SSD+ inclusionADMIX #3: MB Micro Air 0 0 [cc] CHECK TOTAL CHECK TOTALADMIX #4: MB Glenium 3030 35 185 [cc] 11.52 61.45 Normal BatchingADMIX #5: MB VMA 358 21 111 [cc] W/C (PREP)= 0.30ADMIX #6: Forta Ferro Fiber 0 0 [lb] W/C (TOTAL)= 0.49
MIX DESIGN [RED INPUTS]Weight of CA 1092 lbsWeight of FA 1626 lbs
Cement 9.0 EQUIV. SACKS
MIX DESIGN PER CYD Aggregate Aggregate MAIN BATCH VOL: 4.0 [cu. ft.]MATERIAL Dosage Dosage SP.GR. SSD VOLUME MIX PORTIONS MIX PORTIONS Absorption Moisture DESIGN DESIGN Moisture Adjusted
Units (SSD) WEIGHT BY WEIGHT BY VOLUME Content WEIGHT VOLUME Adjustment Weight[lb] [cu ft] % % % % [lbs] [cu. ft.] [lbs] [lbs]
CEMENT 100% % of CWT. 3.15 846.0 4.30 21% 16% 0.00% 0.00% 125.33 0.64 0.00 125.33FLY ASH 0% % of CWT. 2.55 0.0 0.00 0% 0% 0.00% 0.00% 0.00 0.00 0.00 0.00SILICA FUME 0% % of CWT. 2.20 0.0 0.00 0% 0% 0.00% 0.00% 0.00 0.00 0.00 0.00WATER 0.45 W/C Ratio 1.00 380.7 6.10 10% 22% 56.40 0.90 5.05 61.45AIR 1.5% % of Conc Vol 0.00 0.0 0.41 0% 1.5% 0.06Ameron 3/4" 82% % of CA 2.65 897.9 5.43 23% 20% 3.27% 3.06% 133.02 0.80 -0.28 132.74Ameron 3/8" 18% % of CA 2.65 194.1 1.17 5% 4% 2.91% 2.36% 28.76 0.17 -0.16 28.60Amerson Basalt Sand 78% % of FA 2.65 1261.2 7.63 32% 28% 4.12% 0.88% 186.85 1.13 -6.05 180.79Maui Dune Sand 11% % of FA 2.65 184.3 1.11 5% 4% 2.81% 4.86% 27.30 0.17 0.56 27.86Nanakuli LS 11% % of FA 2.49 180.5 1.16 5% 4% 3.60% 4.75% 26.74 0.17 0.31 27.05
SUBTOTAL: 3944.7 27.32 100% 100% SUBTOTAL: 584.40 4.05 -5.62 583.82
ADMIXTURES SP.GR. [lbs/cyd] [gal] [% Solids] [% Water] [cc] Water Adj. [lb] [lbs]MB Pozzolith 220n 0.00 OZ./CWT. 1.19 0.00 0.00 47% 54% 0 0.00 0.00MB Delvo 0.00 OZ./CWT. 1.07 0.00 0.00 14% 87% 0 0.00 0.00MB Micro Air 0.00 OZ./CWT. 0.00 0.00 0.00 0% 100% 0 0.00 0.00MB Glenium 3030 5.00 OZ./CWT. 1.05 2.89 0.33 20% 80% 185 0.34 0.43MB VMA 358 3.00 OZ./CWT. 1.00 1.65 0.20 4% 96% 111 0.24 0.24Forta Ferro Fiber 0.00 LBS/CY 0.00 0.00 0.00
SUBTOTAL: 0.58 0.67W/CM RATIO (DESIGN)= 0.45UNIT WEIGHT(DESIGN)= 144.40 LBS./CU.FT.UNIT WEIGHT(INCL ADMIX)= 584.50 LBS./CU.FT.
79

Mix: 27Date: 2/23/2006
AGGREGATE PREP BATCHING Minimum Butter Batch Butter Batch Main Batch Main Batch Material ProportionsBatching [cu. ft.] SSD+ [cu. ft.] SSD+ By Weight By VolumeWeight 0.75 H2O Adjustment 4.0 H2O Adjustment Cement 22.1% 15.9%
[lb] Weight [lb] [lb] Weight [lb] [lb] Water 11.1% 25.1%C.AGG.#1: Ameron 3/4" 171 23.38 1.40 124.72 7.48 C. Agg 26.8% 23.0%C.AGG.#2: Ameron 3/8" 37 5.04 0.30 26.87 1.61 F. Agg 40.0% 34.5%F.AGG.#1: Amerson Basalt Sand 240 31.88 1.91 170.01 10.20 Air 0.0% 1.5%F.AGG.#2: Maui Dune Sand 36 4.91 0.29 26.20 1.57 Total 100% 100%F.AGG.#3: Nanakuli LS 35 4.77 0.29 25.43 1.53
SUM: 4.20 SUM: 22.39
BINDER PREP BATCHING Butter Batch Main Batch Water to Agg. Ratio W/AggDose Dose Units Design 17%
CEMENT: Type I-II 23.50 125.33 [lb] Adjusted 18%FLY ASH: NONE 0.00 0.00 [lb] Difference -1%SILICA FUME: NONE 0.00 0.00 [lb] W for SSD+ 6%
ADMIXTURE PREP BATCHING Butter Batch Main Batch WATER PREP BATCHINGDose Dose Units Butter Batch Main Batch
ADMIX #1 MB Pozzolith 220n 0 0 [cc] [lb] [lb]ADMIX #2: MB Delvo 0 0 [cc] 8.43 44.98 SSD+ inclusionADMIX #3: MB Micro Air 0 0 [cc] CHECK TOTAL CHECK TOTALADMIX #4: MB Glenium 3030 35 185 [cc] 12.63 67.38 Normal BatchingADMIX #5: MB VMA 358 21 111 [cc] W/C (PREP)= 0.36ADMIX #6: Forta Ferro Fiber 0 0 [lb] W/C (TOTAL)= 0.54
MIX DESIGN [RED INPUTS]Weight of CA 1026 lbsWeight of FA 1529 lbs
Cement 9.0 EQUIV. SACKS
MIX DESIGN PER CYD Aggregate Aggregate MAIN BATCH VOL: 4.0 [cu. ft.]MATERIAL Dosage Dosage SP.GR. SSD VOLUME MIX PORTIONS MIX PORTIONS Absorption Moisture DESIGN DESIGN Moisture Adjusted
Units (SSD) WEIGHT BY WEIGHT BY VOLUME Content WEIGHT VOLUME Adjustment Weight[lb] [cu ft] % % % % [lbs] [cu. ft.] [lbs] [lbs]
CEMENT 100% % of CWT. 3.15 846.0 4.30 22% 16% 0.00% 0.00% 125.33 0.64 0.00 125.33FLY ASH 0% % of CWT. 2.55 0.0 0.00 0% 0% 0.00% 0.00% 0.00 0.00 0.00 0.00SILICA FUME 0% % of CWT. 2.20 0.0 0.00 0% 0% 0.00% 0.00% 0.00 0.00 0.00 0.00WATER 0.5 W/C Ratio 1.00 423.0 6.78 11% 25% 62.67 1.00 4.71 67.38AIR 1.5% % of Conc Vol 0.00 0.0 0.41 0% 1.5% 0.06Ameron 3/4" 82% % of CA 2.65 843.6 5.10 22% 19% 3.27% 3.06% 124.98 0.76 -0.26 124.72Ameron 3/8" 18% % of CA 2.65 182.4 1.10 5% 4% 2.91% 2.36% 27.02 0.16 -0.15 26.87Amerson Basalt Sand 78% % of FA 2.65 1186.0 7.17 31% 27% 4.12% 0.88% 175.70 1.06 -5.69 170.01Maui Dune Sand 11% % of FA 2.65 173.3 1.05 5% 4% 2.81% 4.86% 25.68 0.16 0.53 26.20Nanakuli LS 11% % of FA 2.49 169.7 1.09 4% 4% 3.60% 4.75% 25.14 0.16 0.29 25.43
SUBTOTAL: 3824.0 27.00 100% 100% SUBTOTAL: 566.52 4.00 -5.29 565.94
ADMIXTURES SP.GR. [lbs/cyd] [gal] [% Solids] [% Water] [cc] Water Adj. [lb] [lbs]MB Pozzolith 220n 0.00 OZ./CWT. 1.19 0.00 0.00 47% 54% 0 0.00 0.00MB Delvo 0.00 OZ./CWT. 1.07 0.00 0.00 14% 87% 0 0.00 0.00MB Micro Air 0.00 OZ./CWT. 0.00 0.00 0.00 0% 100% 0 0.00 0.00MB Glenium 3030 5.00 OZ./CWT. 1.05 2.89 0.33 20% 80% 185 0.34 0.43MB VMA 358 3.00 OZ./CWT. 1.00 1.65 0.20 4% 96% 111 0.24 0.24Forta Ferro Fiber 0.00 LBS/CY 0.00 0.00 0.00
SUBTOTAL: 0.58 0.67W/CM RATIO (DESIGN)= 0.50UNIT WEIGHT(DESIGN)= 141.60 LBS./CU.FT.UNIT WEIGHT(INCL ADMIX)= 566.62 LBS./CU.FT.
80

Mix: 28Date: 4/26/2007
AGGREGATE PREP BATCHING Minimum Butter Batch Butter Batch Main Batch Main Batch Material ProportionsBatching [cu. ft.] SSD+ [cu. ft.] SSD+ By Weight By VolumeWeight 0.75 H2O Adjustment 4.0 H2O Adjustment Cement 21.0% 15.7%
[lb] Weight [lb] [lb] Weight [lb] [lb] Water 8.2% 19.3%C.AGG.#1: Halawa 3F (3/4") 183 24.78 1.49 132.13 7.93 C. Agg 28.3% 25.1%C.AGG.#2: Halawa Chips (3/8") 49 6.61 0.40 35.27 2.12 F. Agg 42.5% 38.4%F.AGG.#1: Halawa #4 Basalt Sand 189 25.62 1.54 136.63 8.20 Air 0.0% 1.5%F.AGG.#2: Maui Dune Sand 51 7.09 0.43 37.80 2.27 Total 100% 100%F.AGG.#3: Nanakuli LS 107 14.75 0.89 78.67 4.72
SUM: 4.73 SUM: 25.23
BINDER PREP BATCHING Butter Batch Main Batch Water to Agg. Ratio W/AggDose Dose Units Design 12%
CEMENT: Type I-II 23.50 125.33 [lb] Adjusted 12%FLY ASH: NONE 0.00 0.00 [lb] Difference 0%SILICA FUME: NONE 0.00 0.00 [lb] W for SSD+ 6%
ADMIXTURE PREP BATCHING Butter Batch Main Batch WATER PREP BATCHINGDose Dose Units Butter Batch Main Batch
ADMIX #1 MB Pozzolith 220n 0 0 [cc] [lb] [lb]ADMIX #2: MB Delvo 0 0 [cc] 4.45 23.74 SSD+ inclusionADMIX #3: MB Micro Air 0 0 [cc] CHECK TOTAL CHECK TOTALADMIX #4: MB Glenium 3030 139 741 [cc] 9.18 48.97 Normal BatchingADMIX #5: MB VMA 358 10 56 [cc] W/C (PREP)= 0.19ADMIX #6: Forta Ferro Fiber 0 0 [lb] W/C (TOTAL)= 0.39
MIX DESIGN [RED INPUTS]Weight of CA 1140 lbsWeight of FA 1709 lbs
Cement 9.0 EQUIV. SACKS
MIX DESIGN PER CYD Aggregate Aggregate MAIN BATCH VOL: 4.0 [cu. ft.]MATERIAL Dosage Dosage SP.GR. SSD VOLUME MIX PORTIONS MIX PORTIONS Absorption Moisture DESIGN DESIGN Moisture Adjusted
Units (SSD) WEIGHT BY WEIGHT BY VOLUME Content WEIGHT VOLUME Adjustment Weight[lb] [cu ft] % % % % [lbs] [cu. ft.] [lbs] [lbs]
CEMENT 100% % of CWT. 3.15 846.0 4.30 21% 16% 0.00% 0.00% 125.33 0.64 0.00 125.33FLY ASH 0% % of CWT. 2.55 0.0 0.00 0% 0% 0.00% 0.00% 0.00 0.00 0.00 0.00SILICA FUME 0% % of CWT. 2.20 0.0 0.00 0% 0% 0.00% 0.00% 0.00 0.00 0.00 0.00WATER 0.39 W/C Ratio 1.00 329.9 5.29 8% 19% 48.88 0.78 0.09 48.97AIR 1.5% % of Conc Vol 0.00 0.0 0.41 0% 1% 0.06Halawa 3F (3/4") 79% % of CA 2.65 900.0 5.44 22% 20% 4.00% 3.10% 133.33 0.81 -1.20 132.13Halawa Chips (3/8") 21% % of CA 2.65 240.0 1.45 6% 5% 4.50% 3.71% 35.56 0.22 -0.28 35.27Halawa #4 Basalt Sand 55% % of FA 2.65 934.0 5.65 23% 21% 5.50% 4.24% 138.37 0.84 -1.74 136.63Maui Dune Sand 15% % of FA 2.65 250.0 1.51 6% 6% 2.81% 4.86% 37.04 0.22 0.76 37.80Nanakuli LS 31% % of FA 2.49 525.0 3.38 13% 12% 3.60% 4.75% 77.78 0.50 0.89 78.67
SUBTOTAL: 4024.9 27.43 100% 100% SUBTOTAL: 596.29 4.06 -1.57 594.80
ADMIXTURES SP.GR. [lbs/cyd] [gal] [% Solids] [% Water] [cc] Water Adj. [lb] [lbs]MB Pozzolith 220n 0.00 OZ./CWT. 1.19 0.00 0.00 47% 54% 0 0.00 0.00MB Delvo 0.00 OZ./CWT. 1.07 0.00 0.00 14% 87% 0 0.00 0.00MB Micro Air 0.00 OZ./CWT. 0.00 0.00 0.00 0% 100% 0 0.00 0.00MB Glenium 3030 20.00 OZ./CWT. 1.05 11.58 1.32 20% 80% 741 1.37 1.71MB VMA 358 1.50 OZ./CWT. 1.00 0.83 0.10 4% 96% 56 0.12 0.12Forta Ferro Fiber 0.00 LBS/CY 0.00 0.00 0.00
SUBTOTAL: 1.48 1.84W/CM RATIO (DESIGN)= 0.39UNIT WEIGHT(DESIGN)= 146.74 LBS./CU.FT.UNIT WEIGHT(INCL ADMIX)= 596.64 LBS./CU.FT.
81

Mix: 29Date: 4/30/2007
AGGREGATE PREP BATCHING Minimum Butter Batch Butter Batch Main Batch Main Batch Material ProportionsBatching [cu. ft.] SSD+ [cu. ft.] SSD+ By Weight By VolumeWeight 0.75 H2O Adjustment 4.0 H2O Adjustment Cement 21.5% 15.7%
[lb] Weight [lb] [lb] Weight [lb] [lb] Water 9.7% 22.2%C.AGG.#1: Halawa 3F (3/4") 174 23.89 1.43 127.39 7.64 C. Agg 27.6% 24.0%C.AGG.#2: Halawa Chips (3/8") 47 6.39 0.38 34.07 2.04 F. Agg 41.3% 36.6%F.AGG.#1: Halawa #4 Basalt Sand 181 24.14 1.45 128.74 7.72 Air 0.0% 1.5%F.AGG.#2: Maui Dune Sand 49 6.86 0.41 36.58 2.19 Total 100% 100%F.AGG.#3: Nanakuli LS 102 14.30 0.86 76.29 4.58
SUM: 4.53 SUM: 24.18
BINDER PREP BATCHING Butter Batch Main Batch Water to Agg. Ratio W/AggDose Dose Units Design 14%
CEMENT: Type I-II 23.50 125.33 [lb] Adjusted 14%FLY ASH: NONE 0.00 0.00 [lb] Difference 0%SILICA FUME: NONE 0.00 0.00 [lb] W for SSD+ 6%
ADMIXTURE PREP BATCHING Butter Batch Main Batch WATER PREP BATCHINGDose Dose Units Butter Batch Main Batch
ADMIX #1 MB Pozzolith 220n 0 0 [cc] [lb] [lb]ADMIX #2: MB Delvo 0 0 [cc] 5.70 30.40 SSD+ inclusionADMIX #3: MB Micro Air 0 0 [cc] CHECK TOTAL CHECK TOTALADMIX #4: MB Glenium 3030 104 556 [cc] 10.23 54.58 Normal BatchingADMIX #5: MB VMA 358 21 111 [cc] W/C (PREP)= 0.24ADMIX #6: Forta Ferro Fiber 0 0 [lb] W/C (TOTAL)= 0.44
MIX DESIGN [RED INPUTS]Weight of CA 1087 lbsWeight of FA 1630 lbs
Cement 9.0 EQUIV. SACKS
MIX DESIGN PER CYD Aggregate Aggregate MAIN BATCH VOL: 4.0 [cu. ft.]MATERIAL Dosage Dosage SP.GR. SSD VOLUME MIX PORTIONS MIX PORTIONS Absorption Moisture DESIGN DESIGN Moisture Adjusted
Units (SSD) WEIGHT BY WEIGHT BY VOLUME Content WEIGHT VOLUME Adjustment Weight[lb] [cu ft] % % % % [lbs] [cu. ft.] [lbs] [lbs]
CEMENT 100% % of CWT. 3.15 846.0 4.30 21% 16% 0.00% 0.00% 125.33 0.64 0.00 125.33FLY ASH 0% % of CWT. 2.55 0.0 0.00 0% 0% 0.00% 0.00% 0.00 0.00 0.00 0.00SILICA FUME 0% % of CWT. 2.20 0.0 0.00 0% 0% 0.00% 0.00% 0.00 0.00 0.00 0.00WATER 0.45 W/C Ratio 1.00 380.7 6.10 10% 22% 56.40 0.90 -1.82 54.58AIR 1.5% % of Conc Vol 0.00 0.0 0.41 0% 1% 0.06Halawa 3F (3/4") 79% % of CA 2.65 858.2 5.19 22% 19% 4.00% 4.20% 127.13 0.77 0.25 127.39Halawa Chips (3/8") 21% % of CA 2.65 228.8 1.38 6% 5% 4.50% 5.00% 33.90 0.21 0.17 34.07Halawa #4 Basalt Sand 55% % of FA 2.65 890.8 5.39 23% 20% 5.50% 3.05% 131.97 0.80 -3.23 128.74Maui Dune Sand 15% % of FA 2.65 238.4 1.44 6% 5% 1.92% 5.48% 35.32 0.21 1.26 36.58Nanakuli LS 31% % of FA 2.49 500.7 3.22 13% 12% 3.91% 6.75% 74.18 0.48 2.11 76.29
SUBTOTAL: 3943.7 27.44 100% 100% SUBTOTAL: 584.25 4.06 0.55 582.99
ADMIXTURES SP.GR. [lbs/cyd] [gal] [% Solids] [% Water] [cc] Water Adj. [lb] [lbs]MB Pozzolith 220n 0.00 OZ./CWT. 1.19 0.00 0.00 47% 54% 0 0.00 0.00MB Delvo 0.00 OZ./CWT. 1.07 0.00 0.00 14% 87% 0 0.00 0.00MB Micro Air 0.00 OZ./CWT. 0.00 0.00 0.00 0% 100% 0 0.00 0.00MB Glenium 3030 15.00 OZ./CWT. 1.05 8.68 0.99 20% 80% 556 1.03 1.29MB VMA 358 3.00 OZ./CWT. 1.00 1.65 0.20 4% 96% 111 0.24 0.24Forta Ferro Fiber 0.00 LBS/CY 0.00 0.00 0.00
SUBTOTAL: 1.26 1.53W/CM RATIO (DESIGN)= 0.45UNIT WEIGHT(DESIGN)= 143.75 LBS./CU.FT.UNIT WEIGHT(INCL ADMIX)= 584.52 LBS./CU.FT.
82

Mix: 30Date: 5/1/2007
AGGREGATE PREP BATCHING Minimum Butter Batch Butter Batch Main Batch Main Batch Material ProportionsBatching [cu. ft.] SSD+ [cu. ft.] SSD+ By Weight By VolumeWeight 0.75 H2O Adjustment 4.0 H2O Adjustment Cement 21.8% 15.7%
[lb] Weight [lb] [lb] Weight [lb] [lb] Water 10.9% 24.7%C.AGG.#1: Halawa 3F (3/4") 167 23.00 1.38 122.65 7.36 C. Agg 26.9% 23.0%C.AGG.#2: Halawa Chips (3/8") 45 6.13 0.37 32.69 1.96 F. Agg 40.3% 35.1%F.AGG.#1: Halawa #4 Basalt Sand 173 23.15 1.39 123.45 7.41 Air 0.0% 1.5%F.AGG.#2: Maui Dune Sand 47 6.58 0.39 35.08 2.10 Total 100% 100%F.AGG.#3: Nanakuli LS 98 13.72 0.82 73.15 4.39
SUM: 4.35 SUM: 23.22
BINDER PREP BATCHING Butter Batch Main Batch Water to Agg. Ratio W/AggDose Dose Units Design 16%
CEMENT: Type I-II 23.50 125.33 [lb] Adjusted 16%FLY ASH: NONE 0.00 0.00 [lb] Difference 0%SILICA FUME: NONE 0.00 0.00 [lb] W for SSD+ 6%
ADMIXTURE PREP BATCHING Butter Batch Main Batch WATER PREP BATCHINGDose Dose Units Butter Batch Main Batch
ADMIX #1 MB Pozzolith 220n 0 0 [cc] [lb] [lb]ADMIX #2: MB Delvo 0 0 [cc] 7.13 38.03 SSD+ inclusionADMIX #3: MB Micro Air 0 0 [cc] CHECK TOTAL CHECK TOTALADMIX #4: MB Glenium 3030 35 185 [cc] 11.49 61.26 Normal BatchingADMIX #5: MB VMA 358 10 56 [cc] W/C (PREP)= 0.30ADMIX #6: Forta Ferro Fiber 0 0 [lb] W/C (TOTAL)= 0.49
MIX DESIGN [RED INPUTS]Weight of CA 1043 lbsWeight of FA 1563 lbs
Cement 9.0 EQUIV. SACKS
MIX DESIGN PER CYD Aggregate Aggregate MAIN BATCH VOL: 4.0 [cu. ft.]MATERIAL Dosage Dosage SP.GR. SSD VOLUME MIX PORTIONS MIX PORTIONS Absorption Moisture DESIGN DESIGN Moisture Adjusted
Units (SSD) WEIGHT BY WEIGHT BY VOLUME Content WEIGHT VOLUME Adjustment Weight[lb] [cu ft] % % % % [lbs] [cu. ft.] [lbs] [lbs]
CEMENT 100% % of CWT. 3.15 846.0 4.30 22% 16% 0.00% 0.00% 125.33 0.64 0.00 125.33FLY ASH 0% % of CWT. 2.55 0.0 0.00 0% 0% 0.00% 0.00% 0.00 0.00 0.00 0.00SILICA FUME 0% % of CWT. 2.20 0.0 0.00 0% 0% 0.00% 0.00% 0.00 0.00 0.00 0.00WATER 0.5 W/C Ratio 1.00 423.0 6.78 11% 25% 62.67 1.00 -1.41 61.26AIR 1.5% % of Conc Vol 0.00 0.0 0.41 0% 1% 0.06Halawa 3F (3/4") 79% % of CA 2.65 823.4 4.98 21% 18% 4.00% 4.54% 121.99 0.74 0.66 122.65Halawa Chips (3/8") 21% % of CA 2.65 219.6 1.33 6% 5% 4.50% 5.00% 32.53 0.20 0.16 32.69Halawa #4 Basalt Sand 55% % of FA 2.65 854.2 5.17 22% 19% 5.50% 3.05% 126.55 0.77 -3.10 123.45Maui Dune Sand 15% % of FA 2.65 228.6 1.38 6% 5% 1.92% 5.48% 33.87 0.20 1.21 35.08Nanakuli LS 31% % of FA 2.49 480.1 3.09 12% 11% 3.91% 6.75% 71.13 0.46 2.02 73.15
SUBTOTAL: 3875.0 27.43 100% 100% SUBTOTAL: 574.07 4.06 0.95 573.61
ADMIXTURES SP.GR. [lbs/cyd] [gal] [% Solids] [% Water] [cc] Water Adj. [lb] [lbs]MB Pozzolith 220n 0.00 OZ./CWT. 1.19 0.00 0.00 47% 54% 0 0.00 0.00MB Delvo 0.00 OZ./CWT. 1.07 0.00 0.00 14% 87% 0 0.00 0.00MB Micro Air 0.00 OZ./CWT. 0.00 0.00 0.00 0% 100% 0 0.00 0.00MB Glenium 3030 5.00 OZ./CWT. 1.05 2.89 0.33 20% 80% 185 0.34 0.43MB VMA 358 1.50 OZ./CWT. 1.00 0.83 0.10 4% 96% 56 0.12 0.12Forta Ferro Fiber 0.00 LBS/CY 0.00 0.00 0.00
SUBTOTAL: 0.46 0.55W/CM RATIO (DESIGN)= 0.50UNIT WEIGHT(DESIGN)= 141.25 LBS./CU.FT.UNIT WEIGHT(INCL ADMIX)= 574.17 LBS./CU.FT.
83

84
Appendix C: Draft Specifications

85
STATE OF HAWAI‘I DEPARTMENT OF TRANSPORTATION EXPERIMENTAL DRILLED SHAFT CASTING PROGRAM 1.0 DESCRIPTION These Special Provisions are for the experimental shaft casting program for the proposed North Kahana Stream Bridge Replacement project on Oahu, Hawai‘i. The information obtained during this experimental shaft casting program may be incorporated into the load test program and production shafts of the project. The experimental castings will include both normal conventional concrete and self consolidating concrete (SCC). Experimental drilled shaft castings should be: installed by an approved Drilled Shaft Sub-Contractor who will provide services for the experimental research portion of the project. Prior to any construction at the experimental drilled shaft casting sites, a preconstruction conference will be scheduled with representatives of the Contractor, Subcontractors, Engineer and University of Hawai‘i research team personnel (Contact: Ian Robertson 808-956-6536) to discuss all aspects of the experimental drilled shaft casting program. 2.0 SCOPE The work under these Special Provisions consists of the Contractor furnishing the supervision, labor, material, equipment and related services necessary to install the experimental shaft castings in the presence of the Engineer as indicated on the project plans, attached drawings, and specified herein. For this project, the objectives of the experimental casting program are: 1. Demonstrate the use of SCC in an actual field setting; 2. Obtain experience with the use of SCC for drilled shaft construction; The objective is as follows: Construct experimental castings of drilled shafts using both SCC and conventional concrete, with these castings to be observed during construction; examined to inspect the characteristics of the as-built concrete shafts; and subsequently monitored for six (6) months by the University of Hawai‘i research team personnel. All installation of experimental drilled shaft castings will be conducted under the direction of the Engineer with accommodations made by the Contractor.
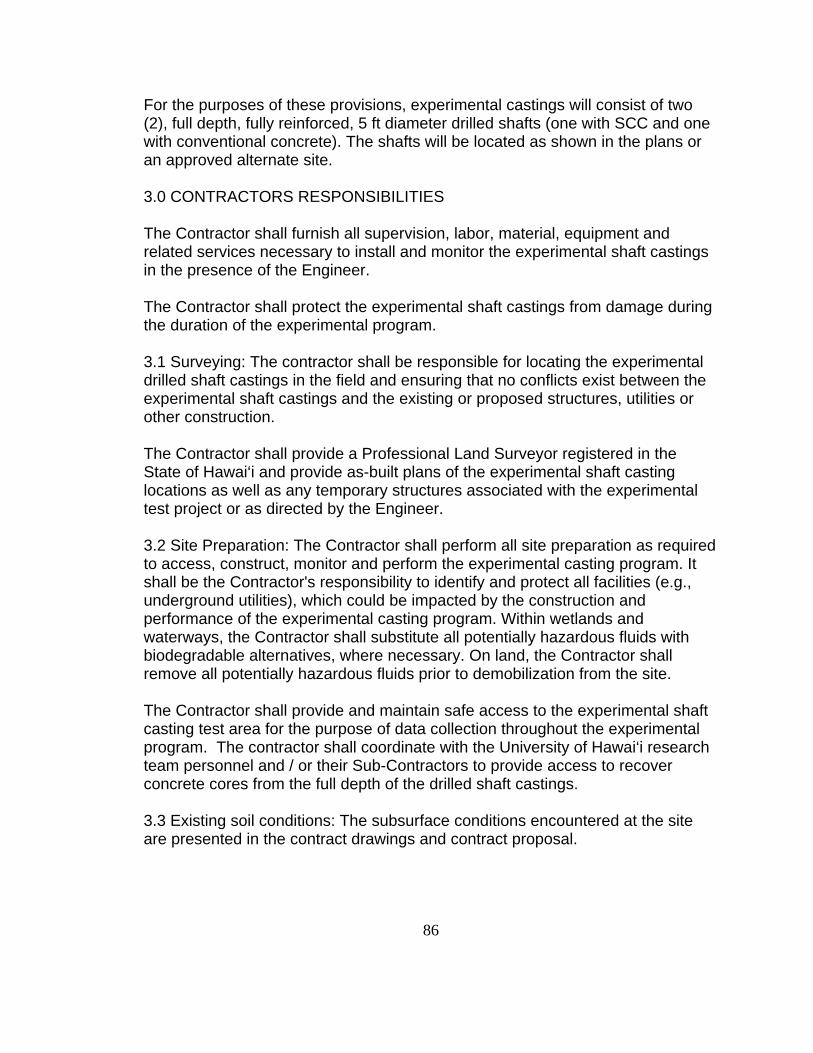
86
For the purposes of these provisions, experimental castings will consist of two (2), full depth, fully reinforced, 5 ft diameter drilled shafts (one with SCC and one with conventional concrete). The shafts will be located as shown in the plans or an approved alternate site. 3.0 CONTRACTORS RESPONSIBILITIES The Contractor shall furnish all supervision, labor, material, equipment and related services necessary to install and monitor the experimental shaft castings in the presence of the Engineer. The Contractor shall protect the experimental shaft castings from damage during the duration of the experimental program. 3.1 Surveying: The contractor shall be responsible for locating the experimental drilled shaft castings in the field and ensuring that no conflicts exist between the experimental shaft castings and the existing or proposed structures, utilities or other construction. The Contractor shall provide a Professional Land Surveyor registered in the State of Hawai‘i and provide as-built plans of the experimental shaft casting locations as well as any temporary structures associated with the experimental test project or as directed by the Engineer. 3.2 Site Preparation: The Contractor shall perform all site preparation as required to access, construct, monitor and perform the experimental casting program. It shall be the Contractor's responsibility to identify and protect all facilities (e.g., underground utilities), which could be impacted by the construction and performance of the experimental casting program. Within wetlands and waterways, the Contractor shall substitute all potentially hazardous fluids with biodegradable alternatives, where necessary. On land, the Contractor shall remove all potentially hazardous fluids prior to demobilization from the site. The Contractor shall provide and maintain safe access to the experimental shaft casting test area for the purpose of data collection throughout the experimental program. The contractor shall coordinate with the University of Hawai‘i research team personnel and / or their Sub-Contractors to provide access to recover concrete cores from the full depth of the drilled shaft castings. 3.3 Existing soil conditions: The subsurface conditions encountered at the site are presented in the contract drawings and contract proposal.
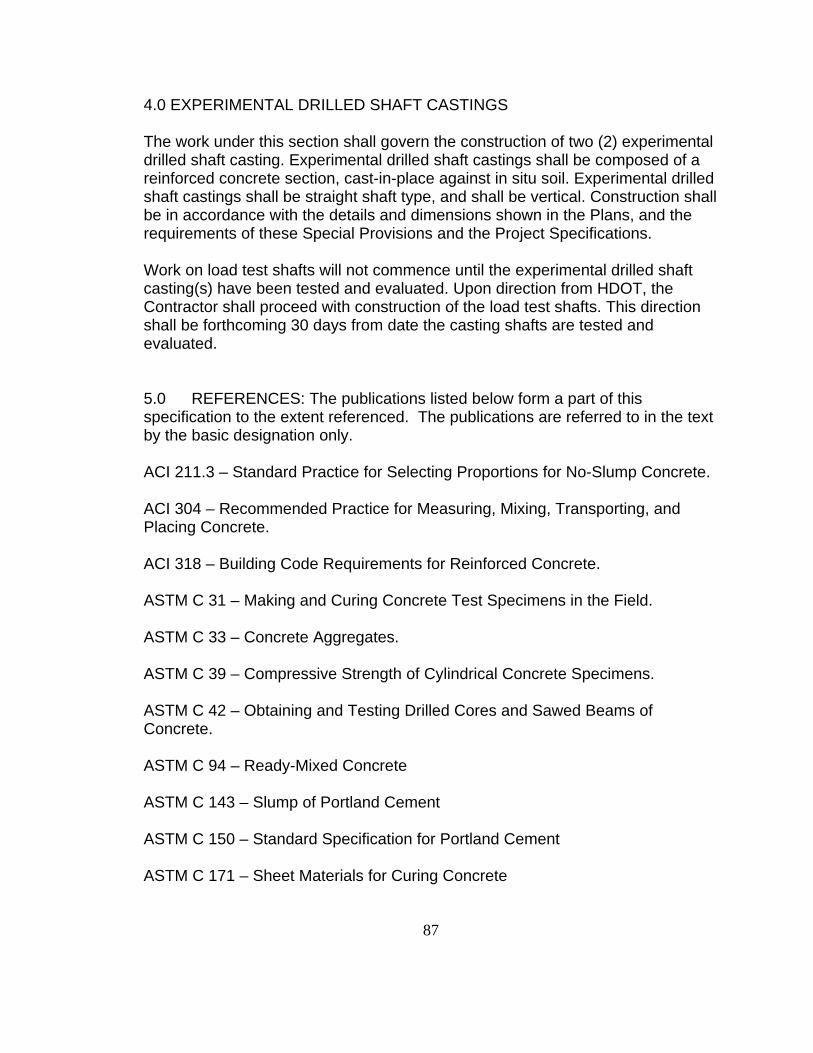
87
4.0 EXPERIMENTAL DRILLED SHAFT CASTINGS The work under this section shall govern the construction of two (2) experimental drilled shaft casting. Experimental drilled shaft castings shall be composed of a reinforced concrete section, cast-in-place against in situ soil. Experimental drilled shaft castings shall be straight shaft type, and shall be vertical. Construction shall be in accordance with the details and dimensions shown in the Plans, and the requirements of these Special Provisions and the Project Specifications. Work on load test shafts will not commence until the experimental drilled shaft casting(s) have been tested and evaluated. Upon direction from HDOT, the Contractor shall proceed with construction of the load test shafts. This direction shall be forthcoming 30 days from date the casting shafts are tested and evaluated. 5.0 REFERENCES: The publications listed below form a part of this specification to the extent referenced. The publications are referred to in the text by the basic designation only. ACI 211.3 – Standard Practice for Selecting Proportions for No-Slump Concrete. ACI 304 – Recommended Practice for Measuring, Mixing, Transporting, and Placing Concrete. ACI 318 – Building Code Requirements for Reinforced Concrete. ASTM C 31 – Making and Curing Concrete Test Specimens in the Field. ASTM C 33 – Concrete Aggregates. ASTM C 39 – Compressive Strength of Cylindrical Concrete Specimens. ASTM C 42 – Obtaining and Testing Drilled Cores and Sawed Beams of Concrete. ASTM C 94 – Ready-Mixed Concrete ASTM C 143 – Slump of Portland Cement ASTM C 150 – Standard Specification for Portland Cement ASTM C 171 – Sheet Materials for Curing Concrete

88
ASTM C 260 – Standard Specification for Air-Entraining Admixtures for Concrete ASTM C 494 – Standard Specification for Chemical Admixtures for Concrete ASTM C 1611 – Standard Test Method for Slump Flow of Self-Consolidating Concrete ASTM C 1621 – Standard Test Method for Passing Ability of Self-Consolidating Concrete ASTM D 448 – Standard Classification for Sizes of Aggregate for Road and Bridge Construction 6.0 MATERIALS A. Portland Cement shall conform to the requirements of ASTM C150, Type I, for all concrete work. B. Concrete Aggregates:
1. Fine Aggregates shall be calcareous or basalt sands, or a combination thereof. They shall meet the grading requirements of ASTM C33 unless the concrete producer can provide past data that shows that a proposed non-conforming gradation will produce concrete with the required strength and suitable workability. The maximum acceptable fine to total aggregate ratio is 50% by volume.
2. Coarse Aggregates shall be crushed close-grained, blue lava rock meeting the grading requirements of sizes 57 or 67 (ASTM D448) or both. The maximum size of aggregate shall not be larger than 3/4 inch. C. Water used in mixing concrete shall be clean and free from injurious amounts of oils, acids, alkalis, salts, organic materials or other substances that may be deleterious to concrete or reinforcement. Non-potable water shall not be used. D. Admixtures, if used, shall conform to ASTM C494 or ASTM C260 and shall be mixed in proper amount in accordance with directions of manufacturer. Water reducers may only be added at the batching plant unless it is a concrete mix design requirement to maintain the slump flow characteristics specified for placement and has been approved per Paragraph 6.2.

89
6.1 TESTS A. Slump Flow: Standard slump flow tests as described in ASTM C1611 will be made periodically during the placement of concrete by the Engineer or Inspector to ensure that the slump flow spread for which the concrete has been designed is met. At least one slump flow test shall be performed for every 50 cubic yards of concrete placed. Any concrete batch tested and showing slump flow spread not within the approved range at the time of placement shall be rejected. Any concrete placed prior to slump flow testing shall be the sole responsibility of the Contractor and shall be rejected should the subsequent slump flow test of the batch in question indicate that the slump flow spread is outside the acceptable range. All rejected concrete shall be promptly removed and properly replaced. All costs resulting therefrom shall be borne by the Contractor. B. J-Ring: Standard J-Ring tests with deformed bars, as described in ASTM C1621, will be made periodically during the placement of concrete by the Engineer or Inspector to ensure that the passing rate for which the concrete has been designed is met. At least one J-Ring test shall be performed for every 50 cubic yards of concrete placed. Any concrete batch tested and showing a blocking of 2 inches or greater shall be rejected. Batches exhibiting blocking greater than 1 inch and less than 2 inches may be rejected at the discretion of the Engineer or Inspector. Any concrete placed prior to J-Ring testing shall be the sole responsibility of the Contractor and shall be rejected should the subsequent J-Ring test of the batch in question indicate that the blocking exceeds the maximum acceptable limit. All rejected concrete shall be promptly removed and properly replaced. All costs resulting therefrom shall be borne by the Contractor. C. Visual Stability Index: The Visual Stability Index (VSI) should be determined by the Engineer or Inspector according to ASTM C1611 Appendix X1 every time a slump flow test is conducted. Concrete with a VSI greater than 1.5 shall be rejected. D. Compressive Strength: During the progress of the work compressive strength tests of concrete shall be made in accordance with ASTM C39. Standard 6-inch x 12-inch cylinders shall be taken from each major pour by the Engineer or Inspector at the rate of 3 cylinders for each 100 cubic yards. Notwithstanding this established rate, however, the Engineer, University of Hawai‘i research team personnel (Contact: Ian Robertson 808-956-6536), or Inspector shall take concrete cylinders in whatever quantity he/she deems fit and/or necessary from any concrete pour.

90
1. The Engineer or Inspector will make and identify all test cylinders. The Contractor shall provide the equipment, such as a shovel and a wheelbarrow for the Engineer or Inspector to make and move the cylinders, and shall also provide the labor and equipment to deliver the cylinders to the testing laboratory as directed by the Engineer or Inspector.
2. Cost of testing will be borne by the Client.
3. The standard age for testing the cylinders shall be 28 days. However, 7-day tests may be made for indication of final 28-day strengths.
4. All cylinders shall be made and cured in accordance with ASTM C31 with the exception that test cylinders shall be made in one lift with no rodding or vibration.
5. In all cases where the strength of any group of cylinders falls below the minimum compressive strength specified, the Engineer shall have the right to require that test specimens be cut from the structure. Specimens shall be selected by the Engineer from the location in the structure represented by the test specimen or specimens which failed. Specimens shall be secured, prepared, and tested in accordance with ASTM C42 within a period of 60 days after placing the concrete. The testing shall be performed by a laboratory approved by the Engineer. Concrete in the area represented by the core tests will be considered structurally adequate if the average strength of 3 cores is no less than 85% of the specified 28-day strength, and the strength of any individual core is no less than 75% of the 28-days strength specified. Should laboratory analysis indicate, however, that the proper concrete mix has not been used by the Contractor, all such concrete placed using the improper mix shall be subject to rejection. The cost of cutting specimens from the structure, patching the resulting holes, and making the analysis, including laboratory and consultation costs, shall be borne by the Contractor. The holes from which the cored samples are taken shall be packed solid with no-slump concrete proportioned in accordance with the ACI 211.3 "Standard Practice for Selecting Proportions of No-Slump Concrete". The patching concrete shall have an "extremely dry" consistency and the same design strength as the specified concrete.
6. If the strength of the specimens cut from the structure falls below the requirements stipulated above, the Engineer shall have the right to require any and all defective concrete to be replaced, and all costs resulting therefrom shall be borne by the Contractor.

91
6.2 DESIGN OF SELF-CONSOLIDATING CONCRETE MIXTURES The SCC mix design for experimental drilled shaft castings concrete shall be provided by the Engineer. The conventional concrete mix design for experimental drilled shaft castings and production drill shaft concrete shall be provided by the Contractor, approved by the Engineer, and except as modified herein, shall meet the requirements of the Project Specifications. A. Ingredients for concrete shall be Portland cement, fine and coarse aggregates and water. B. Minimum 28-Day Strength: Concrete shall have a minimum 28-day specified compressive strength (f’c) of 4000 psi. C. Segregation: Concrete shall be designed so that the concrete materials will not segregate nor cause excessive bleeding. The Visual Stability Index (VSI) of the concrete, at the time of placement, shall be 1.5 or less. D. Slump flow spread shall be 21±3 inches at the time of placement. E. Slump flow spread with the deformed bar J-Ring shall be within 2 inches of the slump flow spread without the J-Ring. F. Concrete shall have a T20 (T50) time of 4.5±2.5 seconds and shall be recorded for each slump flow test. G. Concrete shall be designed to achieve an L-Box test value of H2/H1 = 0.65 to 0.8. H. Slump for the concrete shall be a minimum of 6 inches after 4 hours from initial mixing. I. The Contractor shall submit for approval by the Engineer the mixes to be used at least 14 days before the actual concrete placing operations. The submittal shall include any retempering procedures conforming with Paragraph 6.3D. A production batch of the submitted mix design shall be delivered to the University of Hawai‘i (10 days before actual concrete placement) for the purpose of evaluating the performance specifications by the Engineer and the University of Hawai‘i research team personnel (Contact: Ian Robertson 808-956-6536). J. The Contractor shall use only approved mixes.

92
K. For budgeting purposes, the following two SCC mix design proportions should be used as a starting point: Halawa Quarry Mixture Constituents Value Type I/II Cement (Hawaiian Cement) 846 pcy Water 380.7 pcy Class F Fly ash (---) 0 pcy Halawa 3F (3/4” max) (SSD) 1066 pcy Halawa Chips (3/8” max) (SSD) 284 pcy Halawa #4 Basalt Sand (SSD) 738 pcy Maui Dune Sand (SSD) 198 pcy Nanakuli Lagoonal Sand (SSD) 415 pcy Entrained air 2% MB - Delvo Stabilizer . 5 oz/cwt MB - Glenium 3030 NS 8 to 15 oz/cwt MB - Rheomac VMA 358 3 to 6 oz/cwt Kapaa Quarry Mixture Constituents Value Type I/II Cement (Hawaiian Cement) 846 pcy Water 380.7 pcy Class F Fly ash (---) 0 pcy Kapaa (3/4” max) (SSD) 1110 pcy Kapaa (3/8” max) (SSD) 240 pcy Kapaa Basalt Sand (SSD) 1047 pcy Maui Dune Sand (SSD) 153 pcy Nanakuli Lagoonal Sand (SSD) 150 pcy Entrained air 2% MB - Delvo Stabilizer . 5 oz/cwt MB - Glenium 3030 NS 8 to 12 oz/cwt MB - Rheomac VMA 358 3 to 9 oz/cwt 6.3 MIXING CONCRETE A. All concrete throughout shall be either job or plant mixed in an approved power operated mixer that will ensure uniformity and homogeneity of the concrete produced. The Contractor shall provide a sufficient number of mixers to continuously carry on the work. B. Mixing at Jobsite shall be performed in accordance with ACI 304 and as follows:

93
1. Concrete shall be thoroughly mixed in a batch mixer of an approved type and size which will ensure a uniform distribution of materials throughout the mass. The machine shall have a control device to prevent materials from being discharged until they have been mixed for the specified minimum time. 2. The entire contents of the drum shall be discharged before materials of the succeeding batch are placed therein. No mixer shall be used which has a rated capacity of less than a 1-sack batch and no mixer shall be charged in excess of its rated capacity. 3. The first batch of materials placed in the mixer after the machine has been cleaned shall contain a sufficient excess of cement, sand and water to coat the inside of the drum without reducing the required mortar content of the mix. Upon cessation of mixing, the mixer shall be thoroughly cleaned. C. Ready Mixed and Mixed-In-Transit Concrete shall be mixed to conform to the provisions of ASTM C94 and as follows: 1. The plant shall have sufficient capacity and transportation equipment to deliver concrete at the rate desired. The interval between batches for a pour shall not exceed 30 minutes. 2. The time elapsed between the introduction of the mixing water to the cement and aggregates, and the placing of concrete in its final position shall not exceed 90 minutes. 3. In hot weather (more than 90 degrees Fahrenheit ambient temperature) or other conditions contributing to quick stiffening of the concrete, the elapsed time in 2, shall not exceed 60 minutes, if no retarding admixture is used. If an ASTM C494 Type B or D admixture is added to the concrete, the maximum elapsed time in 2 shall remain at 90 minutes. D. Concrete shall be mixed only in such quantity as is required for immediate use. No retempering will be permitted, unless such procedure is specified and tested according to the approved concrete mix design, Paragraph 6.2 I. Concrete that has started to harden shall be discarded and promptly removed from the jobsite. E. Admixtures conforming to Paragraph 6.0 may be used in the concrete as recommended by the supplier and approved by the Engineer. Retempering with admixtures shall only occur as detailed in the concrete mix design approved by the Engineer in Paragraph 6.2 I.

94
7.0 CONSTRUCTION The Contractor shall supply all materials required to install the experimental drilled shaft castings as required. This Special Provision supplements the requirements of Section 712 of the Specifications. 7.1 Construction Sequence Plan: The Contractor shall develop a detailed construction sequence plan and submit the same for review and approval by the Engineer two (2) weeks prior to beginning construction of the experimental drilled shaft castings. The construction sequence plan shall provide detailed information as outlined in Section 712 of the Specifications and include the following: 1. Details on how the experimental castings will be installed, protected and remain accessible to the University of Hawai‘i research team personnel (Contact: Ian Robertson 808-956-6536) for the duration of the experimental shaft casting and testing program. 2. Other information shown in the plans or requested by the Engineer. The Engineer will review the experimental drilled shaft casting construction sequence plan for conformance with these Special Provisions and the Project Plans and Specifications. Within seven (7) days after receipt of the construction documents, the Engineer will notify the Contractor of any additional information necessary to satisfy the Project Plans, these Special Provisions, and the Project Specifications. Any part of the construction sequence plan that is unsatisfactory will be rejected and the Contractor shall submit changes agreed upon for reevaluation. The Engineer will notify the Contractor within seven (7) days after receipt of proposed changes. During the construction of experimental drilled shaft castings, the Contractor may elect to make minor modifications to his procedures for constructing the remaining foundations. This is permissible provided the Engineer is informed in writing of any desired changes in technique and equipment, and such changes are approved by the Engineer. 7.2 Experimental Drilled Shaft Casting Construction: The Contractor shall supply all materials required to install the experimental drilled shaft castings as required. This Special Provision supplements the requirements of Section 712 of the specifications. Fabrication of the reinforcing steel cage shall be performed prior to concrete placement to allow installation of instrumentation by the Engineer and / or University of Hawai‘i research team personnel (Contact: Ian Robertson 808-956-6536). The Contractor shall coordinate the access required for instrumentation

95
installation. Instrumentation pertaining to the experimental portion will be provided and installed by the Engineer and / or the University of Hawai‘i research team personnel (Contact: Ian Robertson 808-956-6536) with the exception of the following: (i) Inclinometer casings, (ii) Transparent acrylic casing (capped at each end), two (2) each drilled
shaft full depth of drilled shafts, (iii) Cross-Hole Sonic Logging set-ups for integrity testing, (iv) Other incidentals necessary to secure and maintain safe items (i), (ii),
and (iii) during reinforcing cage installation. The Contractor shall coordinate the number and placement of these items with the Engineer and the University of Hawai‘i research team personnel (Contact: Ian Robertson 808-956-6536). The Contractor will be delayed up to a maximum of 4 hours per shaft during the placement of concrete within the experimental drilled shaft castings. Delays will be outlined by the Engineer prior to concrete placement. 7.3 Experimental Drilled Shaft Casting Installation: The contractor shall construct the experimental drilled shaft casting using the approved shaft installation techniques until the experimental casting has been completed. The techniques used to construct the experimental drilled shaft castings will be used for load test and production drilled shafts at the option of the Engineer and HDOT. 7.4 PLACING SELF-CONSOLIDATING CONCRETE IN DRILLED SHAFTS A. No concrete shall be placed in the absence of the Engineer and University of Hawai‘i research team personnel (Contact: Ian Robertson 808-956-6536) or Inspector who shall be given one day advance notice of starting time of each concrete pour. Place no concrete until reinforcing, embeds, instrumentation, and all other items to be installed prior to concrete placement, have been inspected and approved by the Engineer and University of Hawai‘i research team personnel (Contact: Ian Robertson 808-956-6536) or Inspector. Concrete placed without such notice and approval shall be rejected. B. Preparation 1. Excavations must be cleared of all loose debris prior to concrete placement.

96
2. Before depositing the concrete, the reinforcing steel cage and any necessary concrete spacer blocks or other approved spacers to ensure the concentric placement of the cage shall be in place. D. Depositing 1. Concrete shall be placed as soon as possible after excavation has been completed. 2. Drilled shafts shall not remain open for more than eight (8) hours. 3. Concrete shall be placed continuously. Cold joints are not allowed. 4. Concrete is to be placed by tremie to prevent segregation and splashing. 8.0 SCHEDULING AND RESTRICTIONS Prior to the elapse of at least-sixteen (16) hours after a drilled shaft has achieved its initial concrete set (as determined by the Engineer), no adjacent shaft shall be drilled, no adjacent piles shall be driven, and no equipment wheel loads or "excessive" vibrations shall be allowed to occur at any point within a 25 ft radius of the drilled shaft. In the event that the Contractor fails to satisfactorily perform the procedures described within, the Engineer may shut down the construction operations and/or reject the experimental drilled shaft casting. All the work, construction, and testing on the experimental drilled shaft castings, shall be performed during the daylight hours. All testing procedures will be performed by University of Hawai‘i research team personnel (Contact: Ian Robertson 808-956-6536). Upon completion experimental drilled shaft cutting, coring and testing activities, the remaining portions of the experimental drilled shaft castings shall be completed per the direction of the Plans and / or the Engineer. Payment for removing the experimental drilled shaft castings shall be included in this pay item. 9.0 METHOD OF MEASUREMENT 9.1 Experimental Drilled Shaft Castings: Experimental drilled shaft casting construction will be paid for at the unit price bid per each for the type and diameter and at the locations indicated on the Plans, complete in place as specified. Final payment shall be made when all experimental drilled shaft castings have been accepted by the Engineer and University of Hawai‘i research

97
team personnel (Contact: Ian Robertson 808-956-6536). This payment shall be full compensation for labor, material and equipment for: (i) All excavations including disposal of excavated materials and slurry; (ii) Temporary casing, shoring and/or dewatering; (iii) Removing obstructions; (iv) Cleaning and pumping; (v) Reinforcing steel in the shaft; (vi) Conventional concrete in the shaft, SCC concrete in shaft, and slurry; (vii) Inclinometer casing; (Viii) Transparent acrylic casing (capped at each end), two (2) each full depth of drilled shafts; (ix) Surveying of experimental shaft casts locations as described in Paragraph 3.1. (x) Site preparation as described in Paragraph 3.2. (xi) Cross-Hole Sonic Logging set-ups for experimental shaft castings; (xii) Other incidentals necessary to complete the experimental drilled shaft castings as shown in the Plans. 10.0 BASIS OF PAYMENT Payment will be made under: Item No. Pav Item Pay Unit 8990309 EXPERIMENTAL DRILLED SHAFT CASTING EA

98
Appendix D: Aggregate and Mix Gradations

99
Appendix D contains the aggregate proportions and gradations for initial trial mixes one
through nine, as well as for the final six mixes (25-30). For each mix, the individual
aggregate gradations, as well as the gradation for the blend are given. Following the
gradation information, the individual percent retained for each sieve size is plotted with a
modified 8-22 gradation envelope. The final graph for each set depicts the mixes
coarseness and workability. Before the mix gradations for the final six mixes are the
gradation curves for the eight individual aggregates used.

Project: SCCDate: 9/14/06
Mix Info: 1 3/8" Kapa'a Mix
Kapa'a 3/4 Kapa'a 3/8 Kapa'a Basalt Sand Maui Dune Sand Nanakuli LS
Cumulative Indiv. Cumulative Indiv. Cumulative Indiv. Cumulative Indiv. Cumulative Indiv.Percent Percent Percent Percent Percent Percent Percent Percent Percent Percent
Sieve Passing Retained Passing Retained Passing Retained Passing Retained Passing Retained
1 1/2" 100.0 0.00 100.0 0.00 100.0 0.00 100.0 0.00 100.0 0.001" 100.0 0.00 100.0 0.00 100.0 0.00 100.0 0.00 100.0 0.00
3/4" 99.9 0.08 100.0 0.00 100.0 0.00 100.0 0.00 100.0 0.001/2" 66.9 33.02 100.0 0.00 100.0 0.00 100.0 0.00 100.0 0.003/8" 25.9 41.04 98.4 1.63 100.0 0.00 100.0 0.00 100.0 0.00#4 2.5 23.40 4.6 93.80 98.0 2.00 100.0 0.00 100.0 0.00#8 1.6 0.89 0.8 3.81 69.0 29.00 99.0 1.00 94.0 6.00#16 1.6 0.00 0.3 0.48 43.0 26.00 98.0 1.00 68.0 26.00#30 1.6 0.00 0.2 0.09 28.0 15.00 94.0 4.00 46.0 22.00#50 1.6 0.00 0.2 0.02 19.0 9.00 66.0 28.00 28.0 18.00
#100 1.6 0.00 0.1 0.05 15.0 4.00 9.0 57.00 11.0 17.00#200 1.6 0.00 0.1 0.04 12.0 3.00 2.2 6.80 4.5 6.50
FM 6.97 5.96 3.28 1.34 2.53
FIVE AGGREGATE BLENDIndiv. Cumulative
Kapa'a 3/4 0.0 % 0 Lbs. Blend Percent PercentKapa'a 3/8 40.1 % 1110 Lbs. Sieve % Passing Retained Retained
Kapa'a Basalt 32.7 % 907 Lbs.Maui Dune Sand 8.8 % 243 Lbs. 1 1/2" 100.0 0.0 0.0
Nanakuli LS 18.4 % 510 Lbs. 1" 100.0 0.0 0.03/4" 100.0 0.0 0.0
Total= 100.0 % 2770 Lbs. 1/2" 100.0 0.0 0.0 3/8" 99.3 0.7 0.7
#4 61.1 38.2 38.9#8 48.9 12.2 51.1
#16 35.3 13.6 64.7#30 26.0 9.3 74.0
Coarseness Factor (CF) = 1.3 #50 17.2 8.7 82.8Workability Factor (W) = 48.9 #100 7.8 9.5 92.2
Corrected = 56.4 #200 5.0 2.8 95.0
Fine Aggregate 3Coarse Aggregate Intermediate agg. Fine Aggregate 1 Fine Aggregate 2
100

Coarseness - Workability Graph
20
25
30
35
40
45
50
55
3035404550556065707580
Coarseness Factor Cf
Wo
rka
bili
ty F
ac
tor
Wf
Mod. 8 - 22 Curve, Combined Percent Retained
0
5
10
15
20
25
30
35
40
1 1/2" 1" 3/4" 1/2" 3/8" #4 #8 #16 #30 #50 #100 #200
Sieve Size
Per
cen
t R
etai
ned
101

Project: SCCDate: 9/21/06
Mix Info: 2 3/4" Kapa'a Mix
Kapa'a 3/4 Kapa'a 3/8 Kapa'a Basalt Sand Maui Dune Sand Nanakuli LS
Cumulative Indiv. Cumulative Indiv. Cumulative Indiv. Cumulative Indiv. Cumulative Indiv.Percent Percent Percent Percent Percent Percent Percent Percent Percent Percent
Sieve Passing Retained Passing Retained Passing Retained Passing Retained Passing Retained
1 1/2" 100.0 0.00 100.0 0.00 100.0 0.00 100.0 0.00 100.0 0.001" 100.0 0.00 100.0 0.00 100.0 0.00 100.0 0.00 100.0 0.00
3/4" 99.9 0.08 100.0 0.00 100.0 0.00 100.0 0.00 100.0 0.001/2" 66.9 33.02 100.0 0.00 100.0 0.00 100.0 0.00 100.0 0.003/8" 25.9 41.04 98.4 1.63 100.0 0.00 100.0 0.00 100.0 0.00#4 2.5 23.40 4.6 93.80 98.0 2.00 100.0 0.00 100.0 0.00#8 1.6 0.89 0.8 3.81 69.0 29.00 99.9 0.12 95.1 4.85
#16 1.6 0.00 0.3 0.48 43.0 26.00 99.1 0.81 67.2 27.92#30 1.6 0.00 0.2 0.09 28.0 15.00 94.1 5.00 42.2 25.01#50 1.6 0.00 0.2 0.02 19.0 9.00 63.0 31.05 16.7 25.54#100 1.6 0.00 0.1 0.05 15.0 4.00 9.2 53.81 5.3 11.38#200 1.6 0.00 0.1 0.04 12.0 3.00 0.6 8.60 1.9 3.45
FM 6.97 5.96 3.28 1.35 2.73
FIVE AGGREGATE BLENDIndiv. Cumulative
Kapa'a 3/4 33.0 % 925 Lbs. Blend Percent PercentKapa'a 3/8 7.1 % 200 Lbs. Sieve % Passing Retained Retained
Kapa'a Basalt 46.4 % 1300 Lbs.Maui Dune Sand 6.8 % 190 Lbs. 1 1/2" 100.0 0.0 0.0
Nanakuli LS 6.6 % 186 Lbs. 1" 100.0 0.0 0.03/4" 100.0 0.0 0.0
Total= 100.0 % 2801 Lbs. 1/2" 89.1 10.9 10.9 3/8" 75.4 13.7 24.6
#4 60.1 15.4 39.9#8 45.7 14.4 54.3
#16 31.7 14.0 68.3#30 22.7 9.0 77.3
Coarseness Factor (CF) = 45.3 #50 14.7 8.0 85.3Workability Factor (W) = 45.7 #100 8.5 6.3 91.5
Corrected = 53.2 #200 6.3 2.2 93.7
Fine Aggregate 3Coarse Aggregate Intermediate agg. Fine Aggregate 1 Fine Aggregate 2
102

Coarseness - Workability Graph
20
25
30
35
40
45
50
3035404550556065707580
Coarseness Factor Cf
Wo
rka
bili
ty F
ac
tor
Wf
Mod. 8 - 22 Curve, Combined Percent Retained
0.0
5.0
10.0
15.0
20.0
25.0
1 1/2" 1" 3/4" 1/2" 3/8" #4 #8 #16 #30 #50 #100 #200
Sieve Size
Per
cen
t R
etai
ne
d
103
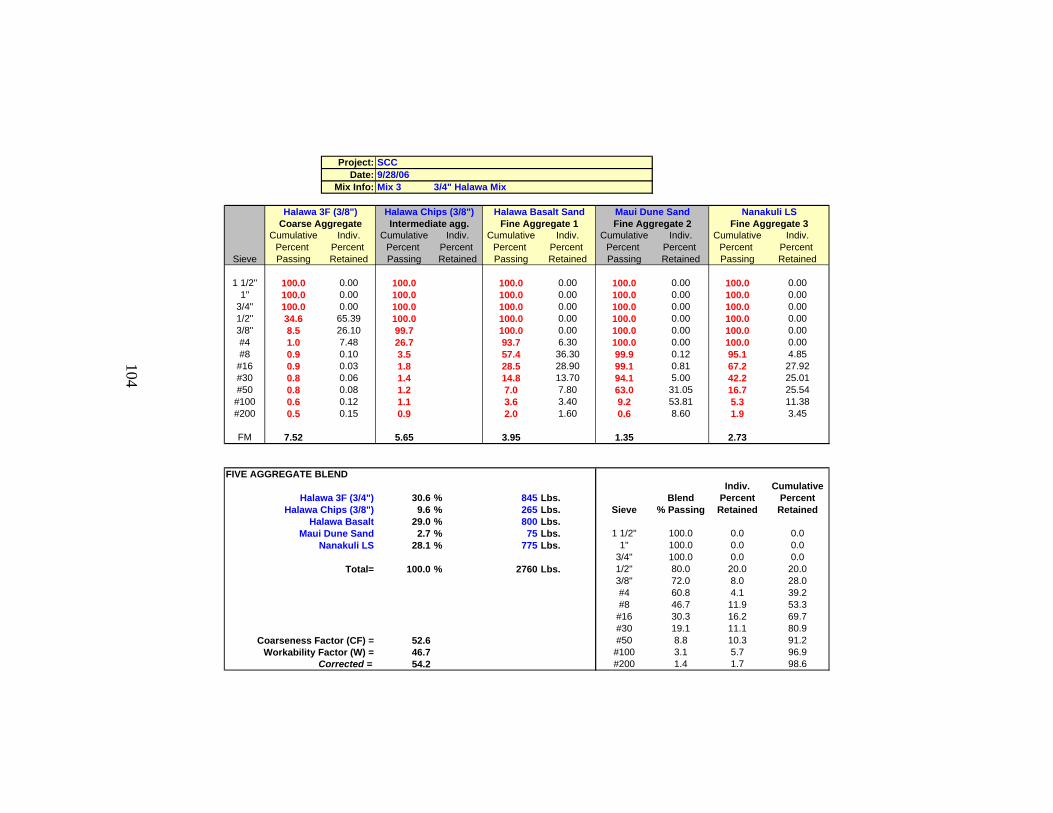
Project: SCCDate: 9/28/06
Mix Info: Mix 3 3/4" Halawa Mix
Halawa 3F (3/8") Halawa Chips (3/8") Halawa Basalt Sand Maui Dune Sand Nanakuli LS
Cumulative Indiv. Cumulative Indiv. Cumulative Indiv. Cumulative Indiv. Cumulative Indiv.Percent Percent Percent Percent Percent Percent Percent Percent Percent Percent
Sieve Passing Retained Passing Retained Passing Retained Passing Retained Passing Retained
1 1/2" 100.0 0.00 100.0 100.0 0.00 100.0 0.00 100.0 0.001" 100.0 0.00 100.0 100.0 0.00 100.0 0.00 100.0 0.00
3/4" 100.0 0.00 100.0 100.0 0.00 100.0 0.00 100.0 0.001/2" 34.6 65.39 100.0 100.0 0.00 100.0 0.00 100.0 0.003/8" 8.5 26.10 99.7 100.0 0.00 100.0 0.00 100.0 0.00#4 1.0 7.48 26.7 93.7 6.30 100.0 0.00 100.0 0.00#8 0.9 0.10 3.5 57.4 36.30 99.9 0.12 95.1 4.85#16 0.9 0.03 1.8 28.5 28.90 99.1 0.81 67.2 27.92#30 0.8 0.06 1.4 14.8 13.70 94.1 5.00 42.2 25.01#50 0.8 0.08 1.2 7.0 7.80 63.0 31.05 16.7 25.54
#100 0.6 0.12 1.1 3.6 3.40 9.2 53.81 5.3 11.38#200 0.5 0.15 0.9 2.0 1.60 0.6 8.60 1.9 3.45
FM 7.52 5.65 3.95 1.35 2.73
FIVE AGGREGATE BLENDIndiv. Cumulative
Halawa 3F (3/4") 30.6 % 845 Lbs. Blend Percent PercentHalawa Chips (3/8") 9.6 % 265 Lbs. Sieve % Passing Retained Retained
Halawa Basalt 29.0 % 800 Lbs.Maui Dune Sand 2.7 % 75 Lbs. 1 1/2" 100.0 0.0 0.0
Nanakuli LS 28.1 % 775 Lbs. 1" 100.0 0.0 0.03/4" 100.0 0.0 0.0
Total= 100.0 % 2760 Lbs. 1/2" 80.0 20.0 20.0 3/8" 72.0 8.0 28.0
#4 60.8 4.1 39.2#8 46.7 11.9 53.3
#16 30.3 16.2 69.7#30 19.1 11.1 80.9
Coarseness Factor (CF) = 52.6 #50 8.8 10.3 91.2Workability Factor (W) = 46.7 #100 3.1 5.7 96.9
Corrected = 54.2 #200 1.4 1.7 98.6
Fine Aggregate 3Coarse Aggregate Intermediate agg. Fine Aggregate 1 Fine Aggregate 2
104

Coarseness - Workability Graph
20
25
30
35
40
45
50
3035404550556065707580
Coarseness Factor Cf
Wo
rka
bili
ty F
ac
tor
Wf
Mod. 8 - 22 Curve, Combined Percent Retained
0.0
5.0
10.0
15.0
20.0
25.0
1 1/2" 1" 3/4" 1/2" 3/8" #4 #8 #16 #30 #50 #100 #200
Sieve Size
Per
cen
t R
etai
ne
d
105

Project: SCCDate: 10/5/06
Mix Info: Mix 4 3/4" Halawa Mix
Halawa 3F (3/4") Halawa Chips (3/8") Halawa Basalt Sand Maui Dune Sand Nanakuli LS
Cumulative Indiv. Cumulative Indiv. Cumulative Indiv. Cumulative Indiv. Cumulative Indiv.Percent Percent Percent Percent Percent Percent Percent Percent Percent Percent
Sieve Passing Retained Passing Retained Passing Retained Passing Retained Passing Retained
1 1/2" 100.0 0.00 100.0 0.00 100.0 0.00 100.0 0.00 100.0 0.001" 100.0 0.00 100.0 0.00 100.0 0.00 100.0 0.00 100.0 0.00
3/4" 100.0 0.00 100.0 0.00 100.0 0.00 100.0 0.00 100.0 0.001/2" 34.6 65.40 100.0 0.00 100.0 0.00 100.0 0.00 100.0 0.003/8" 8.5 26.10 99.7 0.30 100.0 0.00 100.0 0.00 100.0 0.00#4 1.0 7.50 26.7 73.00 93.7 6.30 100.0 0.00 100.0 0.00#8 0.9 0.10 3.5 23.20 57.4 36.30 99.9 0.12 95.1 4.85#16 0.9 0.00 1.8 1.70 28.5 28.90 99.1 0.81 67.2 27.92#30 0.8 0.10 1.4 0.40 14.8 13.70 94.1 5.00 42.2 25.01#50 0.8 0.00 1.2 0.20 7.0 7.80 63.0 31.05 16.7 25.54
#100 0.6 0.20 1.1 0.10 3.6 3.40 9.2 53.81 5.3 11.38#200 0.5 0.10 0.9 0.20 2.0 1.60 0.6 8.60 1.9 3.45
FM 7.52 5.65 3.95 1.35 2.73
FIVE AGGREGATE BLENDIndiv. Cumulative
Halawa 3F (3/4") 31.6 % 900 Lbs. Blend Percent PercentHalawa Chips (3/8") 8.4 % 240 Lbs. Sieve % Passing Retained Retained
Halawa Basalt 32.8 % 934 Lbs.Maui Dune Sand 8.8 % 250 Lbs. 1 1/2" 100.0 0.0 0.0
Nanakuli LS 18.4 % 525 Lbs. 1" 100.0 0.0 0.03/4" 100.0 0.0 0.0
Total= 100.0 % 2849 Lbs. 1/2" 79.3 20.7 20.7 3/8" 71.1 8.3 28.9
#4 60.5 10.6 39.5#8 45.7 14.8 54.3
#16 30.9 14.8 69.1#30 21.3 9.6 78.7
Coarseness Factor (CF) = 53.3 #50 11.3 10.0 88.7Workability Factor (W) = 45.7 #100 3.2 8.0 96.8
Corrected = 53.2 #200 1.3 2.0 98.7
Fine Aggregate 3Coarse Aggregate Intermediate agg. Fine Aggregate 1 Fine Aggregate 2
106

Coarseness - Workability Graph
20
25
30
35
40
45
50
3035404550556065707580
Coarseness Factor Cf
Wo
rka
bili
ty F
ac
tor
Wf
Mod. 8 - 22 Curve, Combined Percent Retained
0.0
5.0
10.0
15.0
20.0
25.0
1 1/2" 1" 3/4" 1/2" 3/8" #4 #8 #16 #30 #50 #100 #200
Sieve Size
Per
cen
t R
etai
ne
d
107

Project: SCCDate: 12/5/06
Mix Info: Mix 5 3/4" Halawa - Delvo
Halawa 3F (3/4") Halawa Chips (3/8") Halawa Basalt Sand Maui Dune Sand Nanakuli LS
Cumulative Indiv. Cumulative Indiv. Cumulative Indiv. Cumulative Indiv. Cumulative Indiv.Percent Percent Percent Percent Percent Percent Percent Percent Percent Percent
Sieve Passing Retained Passing Retained Passing Retained Passing Retained Passing Retained
1 1/2" 100.0 0.00 100.0 0.00 100.0 0.00 100.0 0.00 100.0 0.001" 100.0 0.00 100.0 0.00 100.0 0.00 100.0 0.00 100.0 0.00
3/4" 100.0 0.00 100.0 0.00 100.0 0.00 100.0 0.00 100.0 0.001/2" 47.4 52.63 100.0 0.00 100.0 0.00 100.0 0.00 100.0 0.003/8" 20.0 27.41 99.7 0.30 100.0 0.00 100.0 0.00 100.0 0.00#4 3.5 16.45 27.5 72.20 93.5 6.50 100.0 0.00 100.0 0.00#8 3.1 0.41 7.6 19.90 61.4 32.10 99.9 0.12 95.1 4.85#16 2.9 0.22 4.3 3.30 37.2 24.20 99.1 0.81 67.2 27.92#30 2.5 0.39 3.4 0.90 23.1 14.10 94.1 5.00 42.2 25.01#50 2.1 0.41 3.0 0.40 13.4 9.70 63.0 31.05 16.7 25.54
#100 1.7 0.35 2.6 0.40 7.8 5.60 9.2 53.81 5.3 11.38#200 1.3 0.41 2.2 0.40 4.1 3.70 0.6 8.60 1.9 3.45
FM 7.17 5.52 3.64 1.35 2.73
FIVE AGGREGATE BLENDIndiv. Cumulative
Halawa 3F (3/4") 32.6 % 925 Lbs. Blend Percent PercentHalawa Chips (3/8") 7.0 % 198 Lbs. Sieve % Passing Retained Retained
Halawa Basalt 38.8 % 1100 Lbs.Maui Dune Sand 3.5 % 100 Lbs. 1 1/2" 100.0 0.0 0.0
Nanakuli LS 18.0 % 511 Lbs. 1" 100.0 0.0 0.03/4" 100.0 0.0 0.0
Total= 100.0 % 2834 Lbs. 1/2" 82.8 17.2 17.2 3/8" 73.9 9.0 26.1
#4 60.9 12.9 39.1#8 46.1 14.9 53.9
#16 31.3 14.8 68.7#30 20.9 10.3 79.1
Coarseness Factor (CF) = 48.5 #50 11.3 9.6 88.7Workability Factor (W) = 46.1 #100 5.1 6.3 94.9
Corrected = 53.6 #200 2.5 2.5 97.5
Fine Aggregate 3Coarse Aggregate Intermediate agg. Fine Aggregate 1 Fine Aggregate 2
108
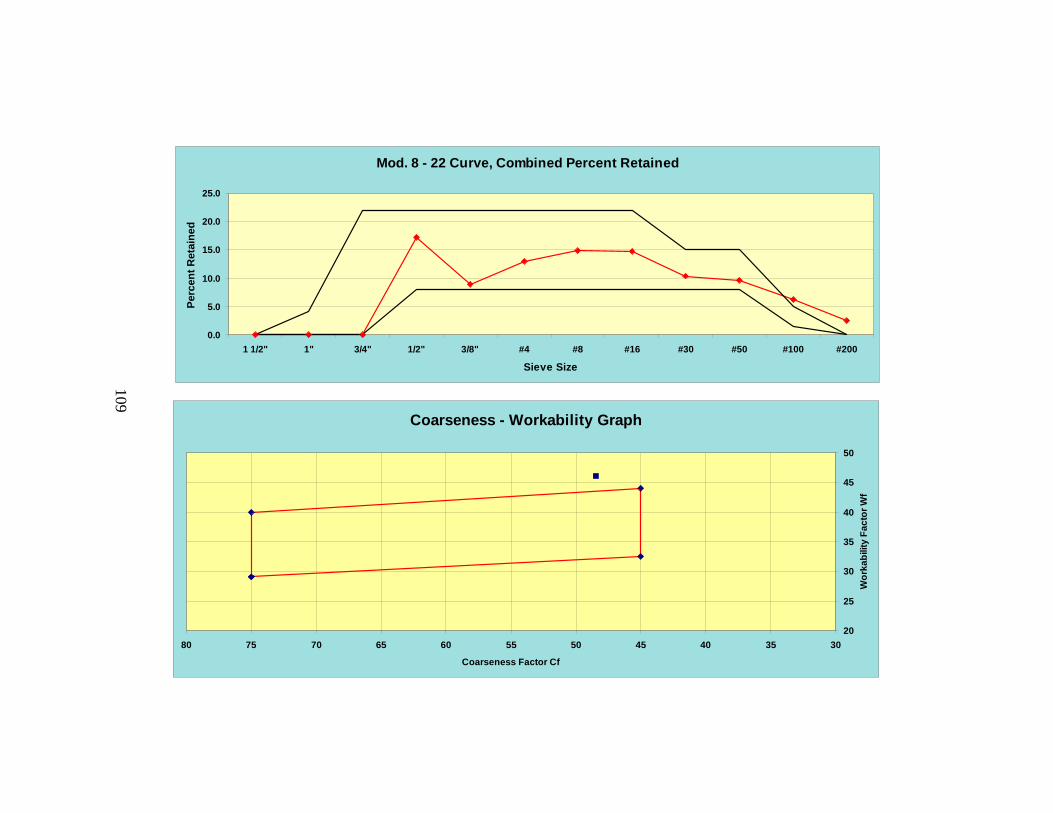
Coarseness - Workability Graph
20
25
30
35
40
45
50
3035404550556065707580
Coarseness Factor Cf
Wo
rka
bili
ty F
ac
tor
Wf
Mod. 8 - 22 Curve, Combined Percent Retained
0.0
5.0
10.0
15.0
20.0
25.0
1 1/2" 1" 3/4" 1/2" 3/8" #4 #8 #16 #30 #50 #100 #200
Sieve Size
Per
cen
t R
etai
ne
d
109

Project: SCCDate: 1/18/2007
Mix Info: 6 3/4" Kapa'a Mix - Mix 2 w/ HC
Kapa'a 3/4 Kapa'a 3/8 Kapa'a Basalt Sand Maui Dune Sand Nanakuli LS
Cumulative Indiv. Cumulative Indiv. Cumulative Indiv. Cumulative Indiv. Cumulative Indiv.Percent Percent Percent Percent Percent Percent Percent Percent Percent Percent
Sieve Passing Retained Passing Retained Passing Retained Passing Retained Passing Retained
1 1/2" 100.0 0.00 100.0 0.00 100.0 0.00 100.0 0.00 100.0 0.001" 100.0 0.00 100.0 0.00 100.0 0.00 100.0 0.00 100.0 0.00
3/4" 99.9 0.08 100.0 0.00 100.0 0.00 100.0 0.00 100.0 0.001/2" 66.9 33.02 100.0 0.00 100.0 0.00 100.0 0.00 100.0 0.003/8" 25.9 41.04 98.4 1.63 100.0 0.00 100.0 0.00 100.0 0.00#4 2.5 23.40 4.6 93.80 98.0 2.00 100.0 0.00 100.0 0.00#8 1.6 0.89 0.8 3.81 69.0 29.00 99.9 0.12 95.1 4.85
#16 1.6 0.00 0.3 0.48 43.0 26.00 99.1 0.81 67.2 27.92#30 1.6 0.00 0.2 0.09 28.0 15.00 94.1 5.00 42.2 25.01#50 1.6 0.00 0.2 0.02 19.0 9.00 63.0 31.05 16.7 25.54#100 1.6 0.00 0.1 0.05 15.0 4.00 9.2 53.81 5.3 11.38#200 1.6 0.00 0.1 0.04 12.0 3.00 0.6 8.60 1.9 3.45
FM 6.97 5.96 3.28 1.35 2.73
FIVE AGGREGATE BLENDIndiv. Cumulative
Kapa'a 3/4 33.0 % 925 Lbs. Blend Percent PercentKapa'a 3/8 7.1 % 200 Lbs. Sieve % Passing Retained Retained
Kapa'a Basalt 46.4 % 1300 Lbs.Maui Dune Sand 6.8 % 190 Lbs. 1 1/2" 100.0 0.0 0.0
Nanakuli LS 6.6 % 186 Lbs. 1" 100.0 0.0 0.03/4" 100.0 0.0 0.0
Total= 100.0 % 2801 Lbs. 1/2" 89.1 10.9 10.9 3/8" 75.4 13.7 24.6
#4 60.1 15.4 39.9#8 45.7 14.4 54.3
#16 31.7 14.0 68.3#30 22.7 9.0 77.3
Coarseness Factor (CF) = 45.3 #50 14.7 8.0 85.3Workability Factor (W) = 45.7 #100 8.5 6.3 91.5
Corrected = 53.2 #200 6.3 2.2 93.7
Fine Aggregate 3Coarse Aggregate Intermediate agg. Fine Aggregate 1 Fine Aggregate 2
110
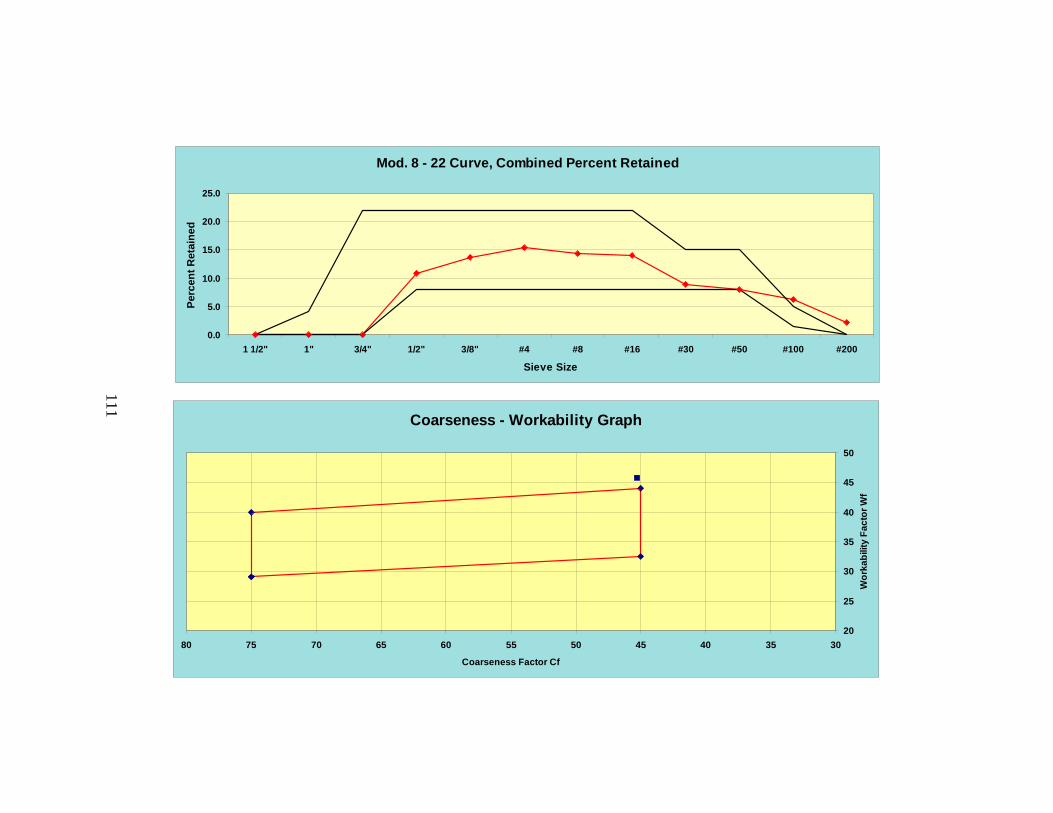
Coarseness - Workability Graph
20
25
30
35
40
45
50
3035404550556065707580
Coarseness Factor Cf
Wo
rka
bili
ty F
ac
tor
Wf
Mod. 8 - 22 Curve, Combined Percent Retained
0.0
5.0
10.0
15.0
20.0
25.0
1 1/2" 1" 3/4" 1/2" 3/8" #4 #8 #16 #30 #50 #100 #200
Sieve Size
Per
cen
t R
etai
ne
d
111

Project: SCCDate: 1/18/07
Mix Info: Mix 7 3/4" Halawa Mix
Halawa 3F (3/4") Halawa Chips (3/8") Halawa Basalt Sand Maui Dune Sand Nanakuli LS
Cumulative Indiv. Cumulative Indiv. Cumulative Indiv. Cumulative Indiv. Cumulative Indiv.Percent Percent Percent Percent Percent Percent Percent Percent Percent Percent
Sieve Passing Retained Passing Retained Passing Retained Passing Retained Passing Retained
1 1/2" 100.0 0.00 100.0 0.00 100.0 0.00 100.0 0.00 100.0 0.001" 100.0 0.00 100.0 0.00 100.0 0.00 100.0 0.00 100.0 0.00
3/4" 100.0 0.00 100.0 0.00 100.0 0.00 100.0 0.00 100.0 0.001/2" 47.4 52.63 100.0 0.00 100.0 0.00 100.0 0.00 100.0 0.003/8" 20.0 27.41 99.7 0.30 100.0 0.00 100.0 0.00 100.0 0.00#4 3.5 16.45 27.5 72.20 93.7 6.30 100.0 0.00 100.0 0.00#8 3.1 0.41 7.6 19.90 57.4 36.30 99.9 0.12 95.1 4.85#16 2.9 0.22 4.3 3.30 28.5 28.90 99.1 0.81 67.2 27.92#30 2.5 0.39 3.4 0.90 14.8 13.70 94.1 5.00 42.2 25.01#50 2.1 0.41 3.0 0.40 7.0 7.80 63.0 31.05 16.7 25.54
#100 1.7 0.35 2.6 0.40 3.6 3.40 9.2 53.81 5.3 11.38#200 1.3 0.41 2.2 0.40 2.0 1.60 0.6 8.60 1.9 3.45
FM 7.17 5.52 3.95 1.35 2.73
FIVE AGGREGATE BLENDIndiv. Cumulative
Halawa 3F (3/4") 31.6 % 900 Lbs. Blend Percent PercentHalawa Chips (3/8") 8.4 % 240 Lbs. Sieve % Passing Retained Retained
Halawa Basalt 32.8 % 934 Lbs.Maui Dune Sand 8.8 % 250 Lbs. 1 1/2" 100.0 0.0 0.0
Nanakuli LS 18.4 % 525 Lbs. 1" 100.0 0.0 0.03/4" 100.0 0.0 0.0
Total= 100.0 % 2849 Lbs. 1/2" 83.4 16.6 16.6 3/8" 74.7 8.7 25.3
#4 61.3 13.3 38.7#8 46.7 14.6 53.3
#16 31.7 15.0 68.3#30 22.0 9.7 78.0
Coarseness Factor (CF) = 47.5 #50 11.8 10.2 88.2Workability Factor (W) = 46.7 #100 3.7 8.1 96.3
Corrected = 54.2 #200 1.7 2.1 98.3
Fine Aggregate 3Coarse Aggregate Intermediate agg. Fine Aggregate 1 Fine Aggregate 2
112

Coarseness - Workability Graph
20
25
30
35
40
45
50
3035404550556065707580
Coarseness Factor Cf
Wo
rka
bili
ty F
ac
tor
Wf
Mod. 8 - 22 Curve, Combined Percent Retained
0.0
5.0
10.0
15.0
20.0
25.0
1 1/2" 1" 3/4" 1/2" 3/8" #4 #8 #16 #30 #50 #100 #200
Sieve Size
Per
cen
t R
eta
ined
113

Project: SCCDate: 1/25/2007
Mix Info: 8 3/4" Kapa'a Mix - Mix 6 - Dry
Kapa'a 3/4 Kapa'a 3/8 Kapa'a Basalt Sand Maui Dune Sand Nanakuli LS
Cumulative Indiv. Cumulative Indiv. Cumulative Indiv. Cumulative Indiv. Cumulative Indiv.Percent Percent Percent Percent Percent Percent Percent Percent Percent Percent
Sieve Passing Retained Passing Retained Passing Retained Passing Retained Passing Retained
1 1/2" 100.0 0.00 100.0 0.00 100.0 0.00 100.0 0.00 100.0 0.001" 100.0 0.00 100.0 0.00 100.0 0.00 100.0 0.00 100.0 0.00
3/4" 99.9 0.08 100.0 0.00 100.0 0.00 100.0 0.00 100.0 0.001/2" 66.9 33.02 100.0 0.00 100.0 0.00 100.0 0.00 100.0 0.003/8" 25.9 41.04 98.4 1.63 100.0 0.00 100.0 0.00 100.0 0.00#4 2.5 23.40 4.6 93.80 98.0 2.00 100.0 0.00 100.0 0.00#8 1.6 0.89 0.8 3.81 69.0 29.00 99.9 0.12 95.1 4.85#16 1.6 0.00 0.3 0.48 43.0 26.00 99.1 0.81 67.2 27.92#30 1.6 0.00 0.2 0.09 28.0 15.00 94.1 5.00 42.2 25.01#50 1.6 0.00 0.2 0.02 19.0 9.00 63.0 31.05 16.7 25.54
#100 1.6 0.00 0.1 0.05 15.0 4.00 9.2 53.81 5.3 11.38#200 1.6 0.00 0.1 0.04 12.0 3.00 0.6 8.60 1.9 3.45
FM 6.97 5.96 3.28 1.35 2.73
FIVE AGGREGATE BLENDIndiv. Cumulative
Kapa'a 3/4 33.0 % 925 Lbs. Blend Percent PercentKapa'a 3/8 7.1 % 200 Lbs. Sieve % Passing Retained Retained
Kapa'a Basalt 46.4 % 1300 Lbs.Maui Dune Sand 6.8 % 190 Lbs. 1 1/2" 100.0 0.0 0.0
Nanakuli LS 6.6 % 186 Lbs. 1" 100.0 0.0 0.03/4" 100.0 0.0 0.0
Total= 100.0 % 2801 Lbs. 1/2" 89.1 10.9 10.9 3/8" 75.4 13.7 24.6
#4 60.1 15.4 39.9#8 45.7 14.4 54.3
#16 31.7 14.0 68.3#30 22.7 9.0 77.3
Coarseness Factor (CF) = 45.3 #50 14.7 8.0 85.3Workability Factor (W) = 45.7 #100 8.5 6.3 91.5
Corrected = 53.2 #200 6.3 2.2 93.7
Fine Aggregate 3Coarse Aggregate Intermediate agg. Fine Aggregate 1 Fine Aggregate 2
114
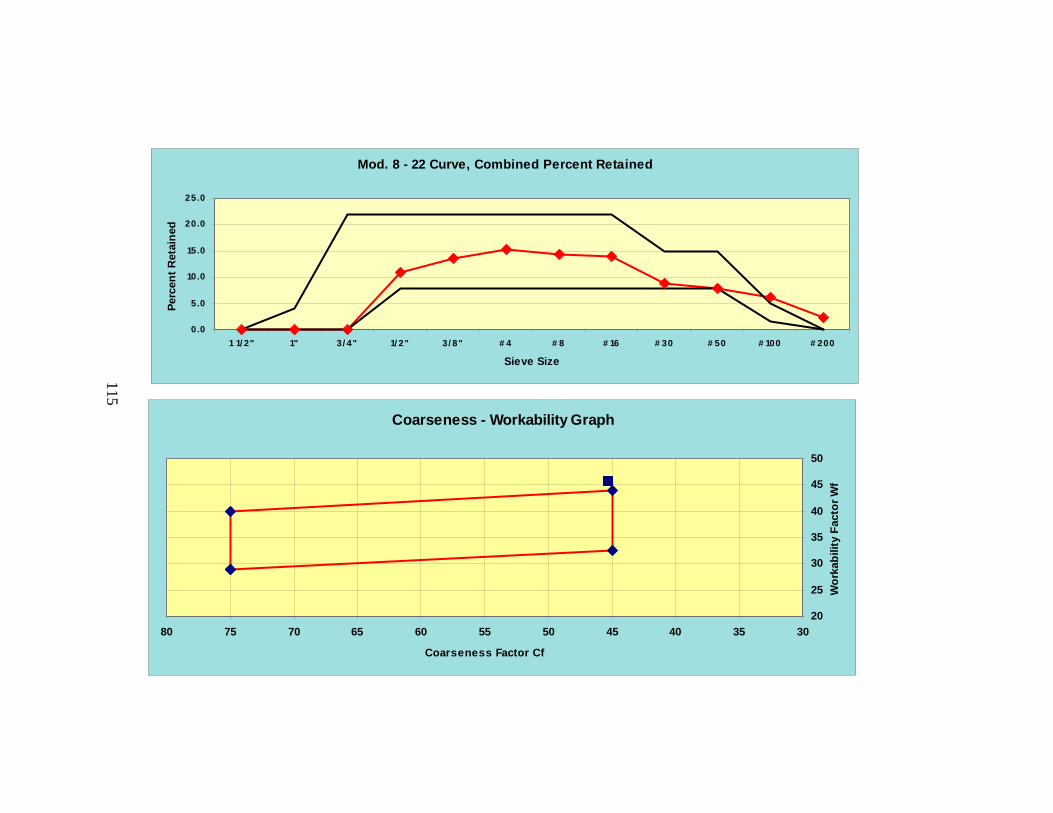
Coarseness - Workability Graph
20
25
30
35
40
45
50
3035404550556065707580
Coarseness Factor Cf
Wo
rkab
ility
Fac
tor
Wf
Mod. 8 - 22 Curve, Combined Percent Retained
0.0
5.0
10.0
15.0
20.0
25.0
1 1/ 2" 1" 3/ 4" 1/ 2" 3/ 8" # 4 # 8 # 16 # 30 # 50 # 100 # 200
Sieve Size
Per
cen
t R
etai
ned
115

Project: SCCDate: 2/1/2007
Mix Info: 9 3/4" Kapa'a Mix - Mix 6 - Dry
Kapa'a 3/4 Kapa'a 3/8 Kapa'a Basalt Sand Maui Dune Sand Nanakuli LS
Cumulative Indiv. Cumulative Indiv. Cumulative Indiv. Cumulative Indiv. Cumulative Indiv.Percent Percent Percent Percent Percent Percent Percent Percent Percent Percent
Sieve Passing Retained Passing Retained Passing Retained Passing Retained Passing Retained
1 1/2" 100.0 0.00 100.0 0.00 100.0 0.00 100.0 0.00 100.0 0.001" 100.0 0.00 100.0 0.00 100.0 0.00 100.0 0.00 100.0 0.00
3/4" 99.9 0.08 100.0 0.00 100.0 0.00 100.0 0.00 100.0 0.001/2" 66.9 33.02 100.0 0.00 100.0 0.00 100.0 0.00 100.0 0.003/8" 25.9 41.04 98.4 1.63 100.0 0.00 100.0 0.00 100.0 0.00#4 2.5 23.40 4.6 93.80 98.0 2.00 100.0 0.00 100.0 0.00#8 1.6 0.89 0.8 3.81 69.0 29.00 99.9 0.12 95.1 4.85#16 1.6 0.00 0.3 0.48 43.0 26.00 99.1 0.81 67.2 27.92#30 1.6 0.00 0.2 0.09 28.0 15.00 94.1 5.00 42.2 25.01#50 1.6 0.00 0.2 0.02 19.0 9.00 63.0 31.05 16.7 25.54
#100 1.6 0.00 0.1 0.05 15.0 4.00 9.2 53.81 5.3 11.38#200 1.6 0.00 0.1 0.04 12.0 3.00 0.6 8.60 1.9 3.45
FM 6.97 5.96 3.28 1.35 2.73
FIVE AGGREGATE BLENDIndiv. Cumulative
Kapa'a 3/4 33.0 % 925 Lbs. Blend Percent PercentKapa'a 3/8 7.1 % 200 Lbs. Sieve % Passing Retained Retained
Kapa'a Basalt 46.4 % 1300 Lbs.Maui Dune Sand 6.8 % 190 Lbs. 1 1/2" 100.0 0.0 0.0
Nanakuli LS 6.6 % 186 Lbs. 1" 100.0 0.0 0.03/4" 100.0 0.0 0.0
Total= 100.0 % 2801 Lbs. 1/2" 89.1 10.9 10.9 3/8" 75.4 13.7 24.6
#4 60.1 15.4 39.9#8 45.7 14.4 54.3
#16 31.7 14.0 68.3#30 22.7 9.0 77.3
Coarseness Factor (CF) = 45.3 #50 14.7 8.0 85.3Workability Factor (W) = 45.7 #100 8.5 6.3 91.5
Corrected = 53.2 #200 6.3 2.2 93.7
Fine Aggregate 3Coarse Aggregate Intermediate agg. Fine Aggregate 1 Fine Aggregate 2
116

Coarseness - Workability Graph
20
25
30
35
40
45
50
3035404550556065707580
Coarseness Factor Cf
Wo
rka
bili
ty F
ac
tor
Wf
Mod. 8 - 22 Curve, Combined Percent Retained
0.0
5.0
10.0
15.0
20.0
25.0
1 1/2" 1" 3/4" 1/2" 3/8" #4 #8 #16 #30 #50 #100 #200
Sieve Size
Per
cen
t R
etai
ne
d
117
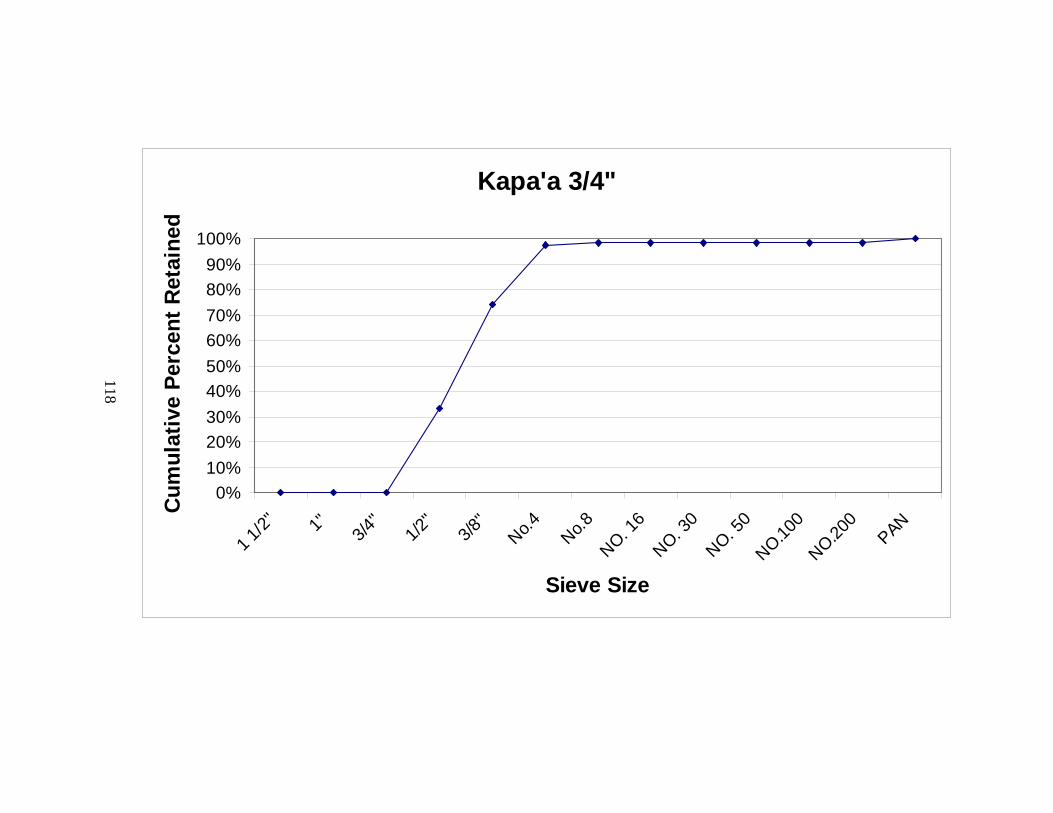
Kapa'a 3/4"
0%
10%
20%
30%
40%
50%
60%
70%
80%
90%
100%
1 1/
2" 1"
3/4"
1/2"
3/8"
No.4
No.8
NO. 16
NO. 30
NO. 50
NO.100
NO.200
PAN
Sieve Size
Cu
mu
lati
ve P
erce
nt
Ret
ain
ed
118

Kapa'a 3/8"
0%
10%
20%
30%
40%
50%
60%
70%
80%
90%
100%
1 1/
2" 1"
3/4"
1/2"
3/8"
No.4
No.8
NO. 16
NO. 30
NO. 50
NO.100
NO.200
PAN
Sieve Size
Cu
mu
lati
ve P
erce
nt
Ret
ain
ed
119

Kapa'a Basalt Sand
0%10%20%30%40%50%60%70%80%90%
100%
3/8"
NO. 4
NO. 8
NO. 16
NO. 30
NO. 50
NO.100
NO.200
PAN
Sieve Size
Cu
mu
lati
ve
Pe
rce
nt
Pa
ss
ing
120

Halawa 3F (3/4")
0%
10%
20%
30%
40%
50%
60%
70%
80%
90%
100%
1 1/
2" 1"
3/4"
1/2"
3/8"
No.4
No.8
NO. 16
NO. 30
NO. 50
NO.100
NO.200
PAN
Sieve Size
Cu
mu
lati
ve P
erce
nt
Ret
ain
ed
121

Halawa Chips (3/8")
0%
10%
20%
30%
40%
50%
60%
70%
80%
90%
100%
1 1/
2" 1"
3/4"
1/2"
3/8"
No.4
No.8
NO. 16
NO. 30
NO. 50
NO.100
NO.200
PAN
Sieve Size
Cu
mu
lati
ve P
erce
nt
Ret
ain
ed
122

Halawa Basalt Sand
0%10%20%30%40%50%60%70%80%90%
100%
3/8"
NO. 4
NO. 8
NO. 16
NO. 30
NO. 50
NO.100
NO.200
PAN
Sieve Size
Cu
mu
lati
ve
Pe
rce
nt
Pa
ss
ing
123

Maui Dune Sand
0%10%20%30%40%50%60%70%80%90%
100%
3/8"
NO. 4
NO. 8
NO. 16
NO. 30
NO. 50
NO.100
NO.200
PAN
Sieve Size
Cu
mu
lati
ve
Pe
rce
nt
Pa
ss
ing
124

Nanakuli Limestone
0%10%20%30%40%50%60%70%80%90%
100%
3/8"
NO. 4
NO. 8
NO. 16
NO. 30
NO. 50
NO.100
NO.200
PAN
Sieve Size
Cu
mu
lati
ve
Pe
rce
nt
Pa
ss
ing
125
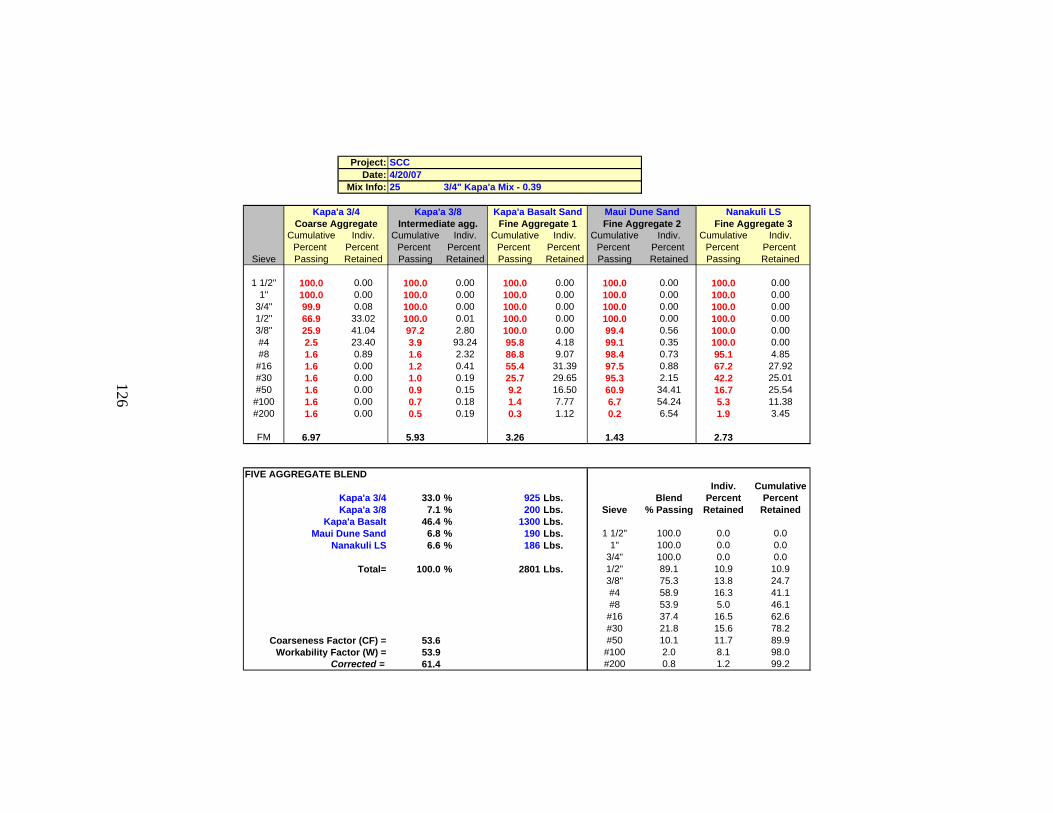
Project: SCCDate: 4/20/07
Mix Info: 25 3/4" Kapa'a Mix - 0.39
Kapa'a 3/4 Kapa'a 3/8 Kapa'a Basalt Sand Maui Dune Sand Nanakuli LS
Cumulative Indiv. Cumulative Indiv. Cumulative Indiv. Cumulative Indiv. Cumulative Indiv.Percent Percent Percent Percent Percent Percent Percent Percent Percent Percent
Sieve Passing Retained Passing Retained Passing Retained Passing Retained Passing Retained
1 1/2" 100.0 0.00 100.0 0.00 100.0 0.00 100.0 0.00 100.0 0.001" 100.0 0.00 100.0 0.00 100.0 0.00 100.0 0.00 100.0 0.00
3/4" 99.9 0.08 100.0 0.00 100.0 0.00 100.0 0.00 100.0 0.001/2" 66.9 33.02 100.0 0.01 100.0 0.00 100.0 0.00 100.0 0.003/8" 25.9 41.04 97.2 2.80 100.0 0.00 99.4 0.56 100.0 0.00#4 2.5 23.40 3.9 93.24 95.8 4.18 99.1 0.35 100.0 0.00#8 1.6 0.89 1.6 2.32 86.8 9.07 98.4 0.73 95.1 4.85#16 1.6 0.00 1.2 0.41 55.4 31.39 97.5 0.88 67.2 27.92#30 1.6 0.00 1.0 0.19 25.7 29.65 95.3 2.15 42.2 25.01#50 1.6 0.00 0.9 0.15 9.2 16.50 60.9 34.41 16.7 25.54
#100 1.6 0.00 0.7 0.18 1.4 7.77 6.7 54.24 5.3 11.38#200 1.6 0.00 0.5 0.19 0.3 1.12 0.2 6.54 1.9 3.45
FM 6.97 5.93 3.26 1.43 2.73
FIVE AGGREGATE BLENDIndiv. Cumulative
Kapa'a 3/4 33.0 % 925 Lbs. Blend Percent PercentKapa'a 3/8 7.1 % 200 Lbs. Sieve % Passing Retained Retained
Kapa'a Basalt 46.4 % 1300 Lbs.Maui Dune Sand 6.8 % 190 Lbs. 1 1/2" 100.0 0.0 0.0
Nanakuli LS 6.6 % 186 Lbs. 1" 100.0 0.0 0.03/4" 100.0 0.0 0.0
Total= 100.0 % 2801 Lbs. 1/2" 89.1 10.9 10.9 3/8" 75.3 13.8 24.7
#4 58.9 16.3 41.1#8 53.9 5.0 46.1#16 37.4 16.5 62.6#30 21.8 15.6 78.2
Coarseness Factor (CF) = 53.6 #50 10.1 11.7 89.9Workability Factor (W) = 53.9 #100 2.0 8.1 98.0
Corrected = 61.4 #200 0.8 1.2 99.2
Fine Aggregate 3Coarse Aggregate Intermediate agg. Fine Aggregate 1 Fine Aggregate 2
126

Coarseness - Workability Graph
20
25
30
35
40
45
50
55
60
3035404550556065707580
Coarseness Factor Cf
Wo
rka
bili
ty F
ac
tor
Wf
Mod. 8 - 22 Curve, Combined Percent Retained
0.0
5.0
10.0
15.0
20.0
25.0
1 1/2" 1" 3/4" 1/2" 3/8" #4 #8 #16 #30 #50 #100 #200
Sieve Size
Per
cen
t R
etai
ned
127
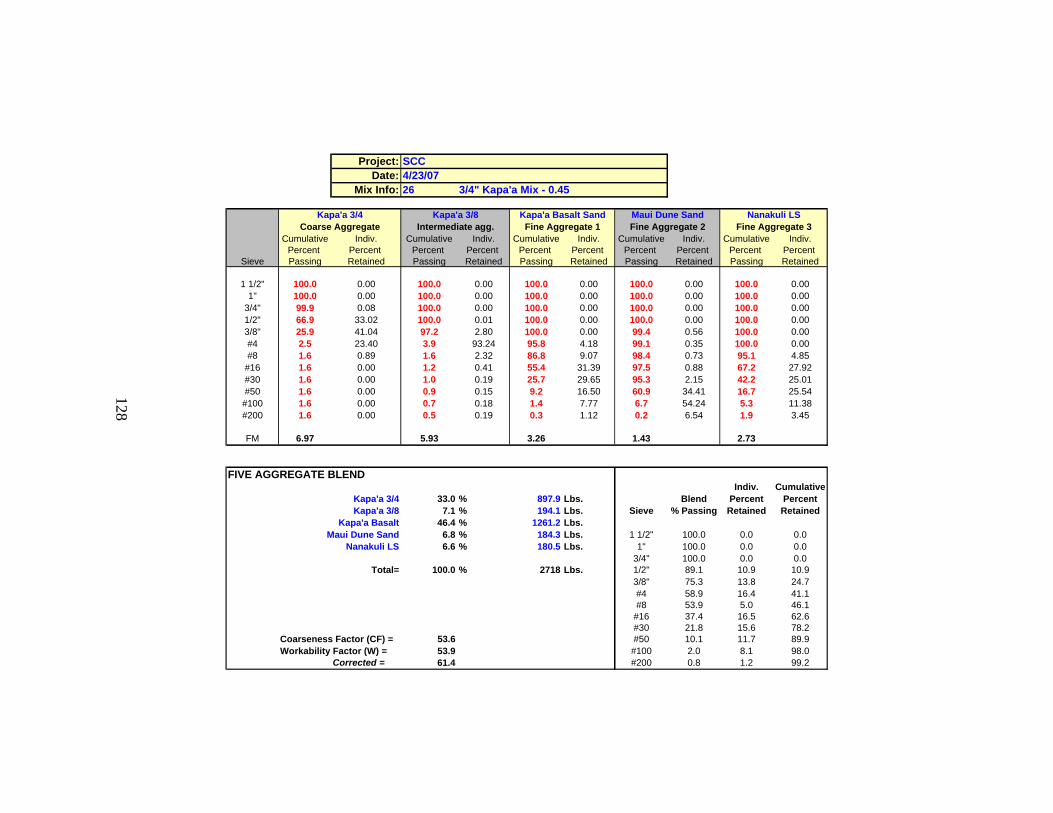
Project: SCCDate: 4/23/07
Mix Info: 26 3/4" Kapa'a Mix - 0.45
Kapa'a 3/4 Kapa'a 3/8 Kapa'a Basalt Sand Maui Dune Sand Nanakuli LS
Cumulative Indiv. Cumulative Indiv. Cumulative Indiv. Cumulative Indiv. Cumulative Indiv.Percent Percent Percent Percent Percent Percent Percent Percent Percent Percent
Sieve Passing Retained Passing Retained Passing Retained Passing Retained Passing Retained
1 1/2" 100.0 0.00 100.0 0.00 100.0 0.00 100.0 0.00 100.0 0.001" 100.0 0.00 100.0 0.00 100.0 0.00 100.0 0.00 100.0 0.00
3/4" 99.9 0.08 100.0 0.00 100.0 0.00 100.0 0.00 100.0 0.001/2" 66.9 33.02 100.0 0.01 100.0 0.00 100.0 0.00 100.0 0.003/8" 25.9 41.04 97.2 2.80 100.0 0.00 99.4 0.56 100.0 0.00#4 2.5 23.40 3.9 93.24 95.8 4.18 99.1 0.35 100.0 0.00#8 1.6 0.89 1.6 2.32 86.8 9.07 98.4 0.73 95.1 4.85
#16 1.6 0.00 1.2 0.41 55.4 31.39 97.5 0.88 67.2 27.92#30 1.6 0.00 1.0 0.19 25.7 29.65 95.3 2.15 42.2 25.01#50 1.6 0.00 0.9 0.15 9.2 16.50 60.9 34.41 16.7 25.54#100 1.6 0.00 0.7 0.18 1.4 7.77 6.7 54.24 5.3 11.38#200 1.6 0.00 0.5 0.19 0.3 1.12 0.2 6.54 1.9 3.45
FM 6.97 5.93 3.26 1.43 2.73
FIVE AGGREGATE BLENDIndiv. Cumulative
Kapa'a 3/4 33.0 % 897.9 Lbs. Blend Percent PercentKapa'a 3/8 7.1 % 194.1 Lbs. Sieve % Passing Retained Retained
Kapa'a Basalt 46.4 % 1261.2 Lbs.Maui Dune Sand 6.8 % 184.3 Lbs. 1 1/2" 100.0 0.0 0.0
Nanakuli LS 6.6 % 180.5 Lbs. 1" 100.0 0.0 0.03/4" 100.0 0.0 0.0
Total= 100.0 % 2718 Lbs. 1/2" 89.1 10.9 10.9 3/8" 75.3 13.8 24.7
#4 58.9 16.4 41.1#8 53.9 5.0 46.1
#16 37.4 16.5 62.6#30 21.8 15.6 78.2
Coarseness Factor (CF) = 53.6 #50 10.1 11.7 89.9Workability Factor (W) = 53.9 #100 2.0 8.1 98.0
Corrected = 61.4 #200 0.8 1.2 99.2
Fine Aggregate 3Coarse Aggregate Intermediate agg. Fine Aggregate 1 Fine Aggregate 2
128

Coarseness - Workability Graph
20
25
30
35
40
45
50
55
60
3035404550556065707580
Coarseness Factor Cf
Wo
rka
bili
ty F
acto
r W
f
Mod. 8 - 22 Curve, Combined Percent Retained
0.0
5.0
10.0
15.0
20.0
25.0
1 1/2" 1" 3/4" 1/2" 3/8" #4 #8 #16 #30 #50 #100 #200
Sieve Size
Per
cen
t R
etai
ned
129
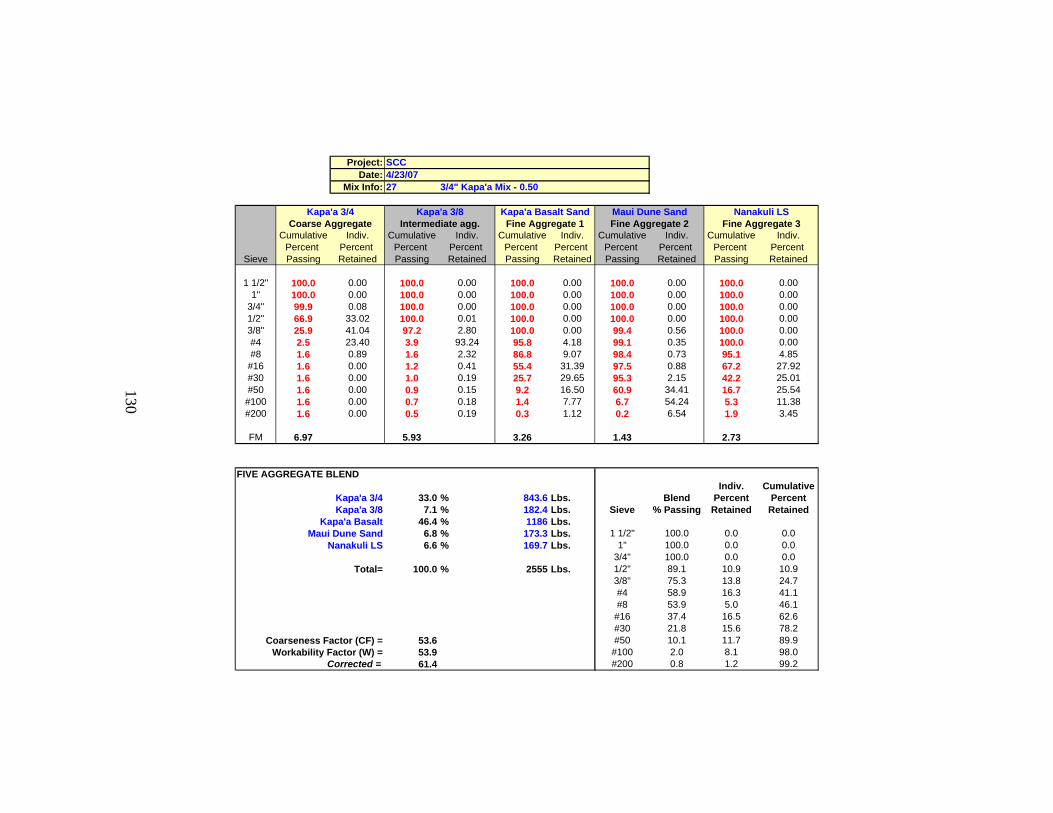
Project: SCCDate: 4/23/07
Mix Info: 27 3/4" Kapa'a Mix - 0.50
Kapa'a 3/4 Kapa'a 3/8 Kapa'a Basalt Sand Maui Dune Sand Nanakuli LS
Cumulative Indiv. Cumulative Indiv. Cumulative Indiv. Cumulative Indiv. Cumulative Indiv.Percent Percent Percent Percent Percent Percent Percent Percent Percent Percent
Sieve Passing Retained Passing Retained Passing Retained Passing Retained Passing Retained
1 1/2" 100.0 0.00 100.0 0.00 100.0 0.00 100.0 0.00 100.0 0.001" 100.0 0.00 100.0 0.00 100.0 0.00 100.0 0.00 100.0 0.00
3/4" 99.9 0.08 100.0 0.00 100.0 0.00 100.0 0.00 100.0 0.001/2" 66.9 33.02 100.0 0.01 100.0 0.00 100.0 0.00 100.0 0.003/8" 25.9 41.04 97.2 2.80 100.0 0.00 99.4 0.56 100.0 0.00#4 2.5 23.40 3.9 93.24 95.8 4.18 99.1 0.35 100.0 0.00#8 1.6 0.89 1.6 2.32 86.8 9.07 98.4 0.73 95.1 4.85
#16 1.6 0.00 1.2 0.41 55.4 31.39 97.5 0.88 67.2 27.92#30 1.6 0.00 1.0 0.19 25.7 29.65 95.3 2.15 42.2 25.01#50 1.6 0.00 0.9 0.15 9.2 16.50 60.9 34.41 16.7 25.54#100 1.6 0.00 0.7 0.18 1.4 7.77 6.7 54.24 5.3 11.38#200 1.6 0.00 0.5 0.19 0.3 1.12 0.2 6.54 1.9 3.45
FM 6.97 5.93 3.26 1.43 2.73
FIVE AGGREGATE BLENDIndiv. Cumulative
Kapa'a 3/4 33.0 % 843.6 Lbs. Blend Percent PercentKapa'a 3/8 7.1 % 182.4 Lbs. Sieve % Passing Retained Retained
Kapa'a Basalt 46.4 % 1186 Lbs.Maui Dune Sand 6.8 % 173.3 Lbs. 1 1/2" 100.0 0.0 0.0
Nanakuli LS 6.6 % 169.7 Lbs. 1" 100.0 0.0 0.03/4" 100.0 0.0 0.0
Total= 100.0 % 2555 Lbs. 1/2" 89.1 10.9 10.9 3/8" 75.3 13.8 24.7
#4 58.9 16.3 41.1#8 53.9 5.0 46.1
#16 37.4 16.5 62.6#30 21.8 15.6 78.2
Coarseness Factor (CF) = 53.6 #50 10.1 11.7 89.9Workability Factor (W) = 53.9 #100 2.0 8.1 98.0
Corrected = 61.4 #200 0.8 1.2 99.2
Fine Aggregate 3Coarse Aggregate Intermediate agg. Fine Aggregate 1 Fine Aggregate 2
130

Coarseness - Workability Graph
20
25
30
35
40
45
50
55
60
3035404550556065707580
Coarseness Factor Cf
Wo
rka
bili
ty F
ac
tor
Wf
Mod. 8 - 22 Curve, Combined Percent Retained
0.0
5.0
10.0
15.0
20.0
25.0
1 1/2" 1" 3/4" 1/2" 3/8" #4 #8 #16 #30 #50 #100 #200
Sieve Size
Per
cen
t R
etai
ned
131

Project: SCCDate: 4/26/07
Mix Info: Mix 28 3/4" Halawa Mix - 0.39
Halawa 3F (3/4") Halawa Chips (3/8") Halawa Basalt Sand Maui Dune Sand Nanakuli LS
Cumulative Indiv. Cumulative Indiv. Cumulative Indiv. Cumulative Indiv. Cumulative Indiv.Percent Percent Percent Percent Percent Percent Percent Percent Percent Percent
Sieve Passing Retained Passing Retained Passing Retained Passing Retained Passing Retained
1 1/2" 100.0 0.00 100.0 0.00 100.0 0.00 100.0 0.00 100.0 0.001" 100.0 0.00 100.0 0.00 100.0 0.00 100.0 0.00 100.0 0.00
3/4" 100.0 0.00 100.0 0.00 100.0 0.00 100.0 0.00 100.0 0.001/2" 47.4 52.63 100.0 0.00 100.0 0.00 100.0 0.00 100.0 0.003/8" 20.0 27.41 99.7 0.28 100.0 0.00 99.4 0.56 100.0 0.00#4 3.5 16.45 27.5 72.23 93.5 6.50 99.1 0.35 100.0 0.00#8 3.1 0.41 7.6 19.85 61.4 32.12 98.4 0.73 95.1 4.85#16 2.9 0.22 4.3 3.36 37.2 24.17 97.5 0.88 67.2 27.92#30 2.5 0.39 3.4 0.91 23.1 14.12 95.3 2.15 42.2 25.01#50 2.1 0.41 3.0 0.39 13.4 9.66 60.9 34.41 16.7 25.54
#100 1.7 0.35 2.6 0.35 7.8 5.68 6.7 54.24 5.3 11.38#200 1.3 0.41 2.2 0.39 4.1 3.63 0.2 6.54 1.9 3.45
FM 7.17 5.52 3.64 1.43 2.73
FIVE AGGREGATE BLENDIndiv. Cumulative
Halawa 3F (3/4") 31.6 % 900 Lbs. Blend Percent PercentHalawa Chips (3/8") 8.4 % 240 Lbs. Sieve % Passing Retained Retained
Halawa Basalt 32.8 % 934 Lbs.Maui Dune Sand 8.8 % 250 Lbs. 1 1/2" 100.0 0.0 0.0
Nanakuli LS 18.4 % 525 Lbs. 1" 100.0 0.0 0.03/4" 100.0 0.0 0.0
Total= 100.0 % 2849 Lbs. 1/2" 83.4 16.6 16.6 3/8" 74.6 8.7 25.4
#4 61.2 13.4 38.8#8 47.9 13.3 52.1
#16 34.4 13.5 65.6#30 24.8 9.6 75.2
Coarseness Factor (CF) = 48.7 #50 13.7 11.1 86.3Workability Factor (W) = 47.9 #100 4.9 8.9 95.1
Corrected = 55.4 #200 2.3 2.6 97.7
Fine Aggregate 3Coarse Aggregate Intermediate agg. Fine Aggregate 1 Fine Aggregate 2
132

Coarseness - Workability Graph
20
25
30
35
40
45
50
3035404550556065707580
Coarseness Factor Cf
Wo
rkab
ility
Fac
tor
Wf
Mod. 8 - 22 Curve, Combined Percent Retained
0.0
5.0
10.0
15.0
20.0
25.0
1 1/2" 1" 3/4" 1/2" 3/8" # 4 # 8 # 16 # 30 # 50 # 100 # 200
Sieve Size
Per
cen
t R
etai
ned
133

Project: SCCDate: 4/30/07
Mix Info: Mix 29 3/4" Halawa - 0.45
Halawa 3F (3/4") Halawa Chips (3/8") Halawa Basalt Sand Maui Dune Sand Nanakuli LS
Cumulative Indiv. Cumulative Indiv. Cumulative Indiv. Cumulative Indiv. Cumulative Indiv.Percent Percent Percent Percent Percent Percent Percent Percent Percent Percent
Sieve Passing Retained Passing Retained Passing Retained Passing Retained Passing Retained
1 1/2" 100.0 0.00 100.0 0.00 100.0 0.00 100.0 0.00 100.0 0.001" 100.0 0.00 100.0 0.00 100.0 0.00 100.0 0.00 100.0 0.00
3/4" 100.0 0.00 100.0 0.00 100.0 0.00 100.0 0.00 100.0 0.001/2" 47.4 52.63 100.0 0.00 100.0 0.00 100.0 0.00 100.0 0.003/8" 20.0 27.41 99.7 0.28 100.0 0.00 99.4 0.56 100.0 0.00#4 3.5 16.45 27.5 72.23 93.5 6.50 99.1 0.35 100.0 0.00#8 3.1 0.41 7.6 19.85 61.4 32.12 98.4 0.73 95.1 4.85#16 2.9 0.22 4.3 3.36 37.2 24.17 97.5 0.88 67.2 27.92#30 2.5 0.39 3.4 0.91 23.1 14.12 95.3 2.15 42.2 25.01#50 2.1 0.41 3.0 0.39 13.4 9.66 60.9 34.41 16.7 25.54
#100 1.7 0.35 2.6 0.35 7.8 5.68 6.7 54.24 5.3 11.38#200 1.3 0.41 2.2 0.39 4.1 3.63 0.2 6.54 1.9 3.45
FM 7.17 5.52 3.64 1.43 2.73
FIVE AGGREGATE BLENDIndiv. Cumulative
Halawa 3F (3/4") 31.6 % 858.2 Lbs. Blend Percent PercentHalawa Chips (3/8") 8.4 % 228.8 Lbs. Sieve % Passing Retained Retained
Halawa Basalt 32.8 % 890.8 Lbs.Maui Dune Sand 8.8 % 238.4 Lbs. 1 1/2" 100.0 0.0 0.0
Nanakuli LS 18.4 % 500.7 Lbs. 1" 100.0 0.0 0.03/4" 100.0 0.0 0.0
Total= 100.0 % 2716.9 Lbs. 1/2" 83.4 16.6 16.6 3/8" 74.6 8.7 25.4
#4 61.2 13.4 38.8#8 47.9 13.3 52.1
#16 34.4 13.5 65.6#30 24.8 9.6 75.2
Coarseness Factor (CF) = 48.7 #50 13.7 11.1 86.3Workability Factor (W) = 47.9 #100 4.9 8.9 95.1
Corrected = 55.4 #200 2.3 2.6 97.7
Fine Aggregate 3Coarse Aggregate Intermediate agg. Fine Aggregate 1 Fine Aggregate 2
134
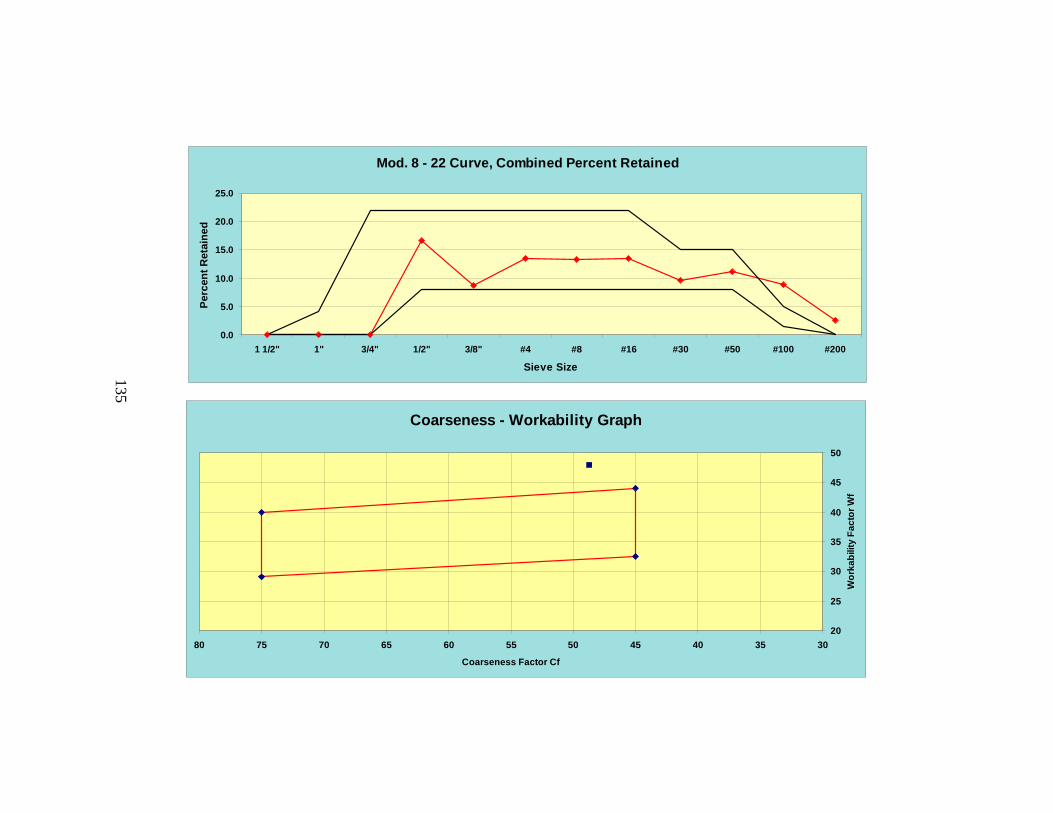
Coarseness - Workability Graph
20
25
30
35
40
45
50
3035404550556065707580
Coarseness Factor Cf
Wo
rka
bili
ty F
ac
tor
Wf
Mod. 8 - 22 Curve, Combined Percent Retained
0.0
5.0
10.0
15.0
20.0
25.0
1 1/2" 1" 3/4" 1/2" 3/8" #4 #8 #16 #30 #50 #100 #200
Sieve Size
Per
cen
t R
etai
ned
135

Project: SCCDate: 5/1/07
Mix Info: Mix 30 3/4" Halawa Mix - 0.50
Halawa 3F (3/4") Halawa Chips (3/8") Halawa Basalt Sand Maui Dune Sand Nanakuli LS
Cumulative Indiv. Cumulative Indiv. Cumulative Indiv. Cumulative Indiv. Cumulative Indiv.Percent Percent Percent Percent Percent Percent Percent Percent Percent Percent
Sieve Passing Retained Passing Retained Passing Retained Passing Retained Passing Retained
1 1/2" 100.0 0.00 100.0 0.00 100.0 0.00 100.0 0.00 100.0 0.001" 100.0 0.00 100.0 0.00 100.0 0.00 100.0 0.00 100.0 0.00
3/4" 100.0 0.00 100.0 0.00 100.0 0.00 100.0 0.00 100.0 0.001/2" 47.4 52.63 100.0 0.00 100.0 0.00 100.0 0.00 100.0 0.003/8" 20.0 27.41 99.7 0.28 100.0 0.00 99.4 0.56 100.0 0.00#4 3.5 16.45 27.5 72.23 93.5 6.50 99.1 0.35 100.0 0.00#8 3.1 0.41 7.6 19.85 61.4 32.12 98.4 0.73 95.1 4.85#16 2.9 0.22 4.3 3.36 37.2 24.17 97.5 0.88 67.2 27.92#30 2.5 0.39 3.4 0.91 23.1 14.12 95.3 2.15 42.2 25.01#50 2.1 0.41 3.0 0.39 13.4 9.66 60.9 34.41 16.7 25.54
#100 1.7 0.35 2.6 0.35 7.8 5.68 6.7 54.24 5.3 11.38#200 1.3 0.41 2.2 0.39 4.1 3.63 0.2 6.54 1.9 3.45
FM 7.17 5.52 3.64 1.43 2.73
FIVE AGGREGATE BLENDIndiv. Cumulative
Halawa 3F (3/4") 31.6 % 823.4 Lbs. Blend Percent PercentHalawa Chips (3/8") 8.4 % 219.6 Lbs. Sieve % Passing Retained Retained
Halawa Basalt 32.8 % 854.2 Lbs.Maui Dune Sand 8.8 % 228.6 Lbs. 1 1/2" 100.0 0.0 0.0
Nanakuli LS 18.4 % 480.1 Lbs. 1" 100.0 0.0 0.03/4" 100.0 0.0 0.0
Total= 100.0 % 2605.9 Lbs. 1/2" 83.4 16.6 16.6 3/8" 74.6 8.7 25.4
#4 61.2 13.4 38.8#8 47.9 13.3 52.1
#16 34.4 13.5 65.6#30 24.8 9.6 75.2
Coarseness Factor (CF) = 48.7 #50 13.7 11.1 86.3Workability Factor (W) = 47.9 #100 4.9 8.9 95.1
Corrected = 55.4 #200 2.3 2.6 97.7
Fine Aggregate 3Coarse Aggregate Intermediate agg. Fine Aggregate 1 Fine Aggregate 2
136

Coarseness - Workability Graph
20
25
30
35
40
45
50
3035404550556065707580
Coarseness Factor Cf
Wo
rka
bili
ty F
ac
tor
Wf
Mod. 8 - 22 Curve, Combined Percent Retained
0.0
5.0
10.0
15.0
20.0
25.0
1 1/2" 1" 3/4" 1/2" 3/8" #4 #8 #16 #30 #50 #100 #200
Sieve Size
Per
cen
t R
etai
ned
137

138
Literature Cited
ASTM C1610/C1610M-06, (2006), “Standard Test Method for Static Segregation of
Self-Consolidating Concrete Using Column Technique”, ASTM International,
West Conshohocken, PA.
ASTM C1611/C1611M-05, (2005), “Standard Test Method for Slump Flow of Self-
Consolidating Concrete”, ASTM International, West Conshohocken, PA.
ASTM C1621/C1621M-06, (2006), “Standard Test Method for Passing Ability of Self-
Consolidating Concrete by J-Ring”, ASTM International, West Conshohocken,
PA.
ASTM C231-04, (2004), “Standard Test Method for Air Content of Freshly Mixed
Concrete by the Pressure Method”, ASTM International, West Conshohocken,
PA.
Billberg, P., Petersson, Ö., Westerholm, M., Wüstholz, T., Reinhardt, H., (2004)
“Summary Report on Work package 3.2 Test Methods for Passing Ability”
Swedish Cement and Concrete Research Institute, CBI, Universität Stuttgart,
IWB, October 14.
Concrete Construction Staff, (2006), “Testing SCC in the Field”, Concrete Construction
Online, http://www.concreteconstructiononline.com/industry-
news.asp?sectionID=691&articleID=342708, August 1.
Hamilton, H.R., Labonte, T., (2005), “Self-Consolidating Concrete (SCC) Structural
Investigation”, University of Florida Project Number 455404712, Gainesville,
FL.

139
Hine, M., (2006) “Special Provision for Self-Consolidating Concrete for Cast-In-Place
Construction”, Illinois Department of Transportation. September 29, 2006.
Hodgson III, D., Schindler, A., Brown, D. A., Stroup-Gardiner, M., (2004), “Self-
Consolidating Concrete (SCC) for use in Drilled Shaft Applications”, ASCE
Materials Journal on Materials in Civil Engineering, Vol. 17, Issue 3, pp 363-369.
Jeknavorian, A.A. and Cornman, C., (2007) “Moisture Tolerance in Self-Consolidating
Concrete”, presentation by Grace Construction Products at the ACI Spring
Convention, April, Atlanta, GA.
Lwin, M. M., (2006), “The State-of-the-Knowledge of SCC”, FHWA Office of Bridge
Technology, Washington D.C.
RILEM, (2000), “Self Compacting Concrete” State of the Art report of RILEM Technical
Committee 174-SCC, ed. Skarendahl, A., and Peterson, O., France.