Development of a Two C omponent Ac/Ds · Development of a Two C omponent Ac/Ds ... appearance of...
139
Development of a Two Component Ac/Ds System for Targeted Gene Tagging in B arley Inaugural-Dissertation zur Erlangung des Doktorgrades der Mathematisch-Naturwissenschaftlichen Fakultät der Universität zu Köln vorgelegt von Tie-Han Zh ao aus Beijing, China Köln, May 2005
Transcript of Development of a Two C omponent Ac/Ds · Development of a Two C omponent Ac/Ds ... appearance of...

Development of a Two Component Ac/Ds
System for Targeted Gene Tagging in Barley
Inaugural-Dissertation
zur
Erlangung des Doktorgrades
der Mathematisch-Naturwissenschaftlichen Fakultät
der Universität zu Köln
vorgelegt von
Tie-Han Zhao
aus Beijing, China
Köln, May 2005

Berichterstatter: Prof. Dr. Paul Schulze -Lefert
Prof. Dr. Martin Hülskamp
Prüfingsvorsitzender: Prof. Dr. Wolfgang Werr
Tag der mündlichen Prüfung: 11. July 2005

Index I ________________________________________________________________________
Table of Contents
1. General Introduction
1
1. 2. Barley as a model crop for Triticeae family 1
1. 3. Gene discovery in Barely 2
1. 4. Genomics 4
1. 5. Functional genomics 6
1. 5. 1. Tilling 6
1. 5. 2. RNA induced gene silencing 8
1. 5. 3. insertion mutagenesis 9
T-DNA insertion mutagenesis 9
Transposon insertion mutagenesis 11
Transposon in heterologous system 11
Transposon mediated targeted gene tagging 14
Activation tagging and gene traps 15
Activation tagging 16
Enhancer and gene trap elements 17
1. 6. Identification of insertional mutants 18
1. 7. Analysis of insertional mutants 20
1. 8. Prospects 21
2. Materials and Methods
22
2.1. Abbreviations
22
2. 2. Materials
24
2. 2. 1. Plant material
24
2. 2. 1. 1. Donor plants 24

Index II ________________________________________________________________________
2. 2. 1. 2. Barley mapping populations 24
2. 2. 1. 3. Ac transposase expressing lines 24
2. 2. 2. Bacterial strains 25
2. 2. 3. Cloning vectors 25
2. 2. 4. Antibiotics 25
2. 2. 5. Media 25
2. 2. 6. Chemical and Enzyme 27
2. 2. 7. Buffers and Solutions 28
2. 2. 8. Oligonucleotides 31
2. 3. Methods
33
2. 3. 1. Growth of donor plant material for barley transformation 33
2. 3. 2. Vector construction 34
2. 3. 2. 1. Construction of pWBV-Ds-Ubi-bar-Ds 34
2. 3. 2. 2. Construction of pWBVI-Ubi-DsI-Bar 34
2.3. 2. 3. Construct of pWBV-Ac-AcPTase 35
2. 3. 3. Agrobacterium-mediated transformation 35
2. 3. 3. 1. Preparation of Agrobacterium tumefaciens strain 35
2. 3. 3. 2. Isolation of barley immature embryos and transformation 36
2. 3. 3. 3. Regeneration of transgenic plants 36
2. 3. 4. Isolation of genome DNA 36
2. 3. 5. Genomic Southern blot analysis 36
2. 3. 6. Preparation of [a-32P]-labeled probes 37
2. 3. 7. Polymerase chain reaction (PCR ) amplification analysis 38
2. 3. 8. Restriction endonuclease digestion of DNA 39
2. 3. 9. Plasmid DNA isolation 39
2. 3.10. Isolation of DNA fragments from Agarose-gel 39
2. 3. 11. Transformation of E.coli 39
2. 3. 11.1. Preparation of electro-competent E.coli cells 39
2. 3. 11. 2. Transformation of electro-competent E. coli cells 40

Index III ________________________________________________________________________
2. 3. 13. 1. Inverse PCR 41
2. 3. 13. 2. Adaptor -ligation PCR 41
2. 3. 14. DNA sequencing 42
2. 3. 15. Mapping T-DNA insertion loci 42
2. 3. 15. 1 Chromosome mapping T-DNA insertion loci using wheat-barley
addition line
42
2. 3. 15. 2. Mapping T-DNA insertion loci by SSCP analysis 42
2. 3. 16. Mapping Ds insertion sites 43
2. 3. 16. 1. Mapping Ds insertion sites by RFLP 43
2. 3. 17. Linkage map construction 43
2. 3. 18. Database searching 44
3. Results:
45
3.1. Generation of starter lines 45
3.1.1. Transformation with plasmid pWBV-Ds-Ubi-Bar-Ds 45
3.1.2. Transformation with plasmid pWBVI-Ubi-DsI-Bar 47
3. 2. Analysis of T-DNA integration in barley genomic DNA 50
3. 3. Analysis of T-DNA flanking sequences 57
3. 4. Analysis of Ds flanking sequences 58
3. 5. Comparison of Ds and T-DNA insertion sites 62
3. 6. Mapping Ds launch pad T-DNA integration sites 66
3. 7. Genetic mapping Ds insertion sites 74
3. 8. Ds excision and re-insertion 77
2. 3. 12. Isolation of T-DNA flanking sequence 40
2. 3. 13. Isolation of Ds flanking sequences 41

Index IV ________________________________________________________________________
4. Discussion
83
4. 1. Generation of single-copy Ds-T-DNA launch pads by Agrobacterium-
mediated transformation
83
4. 2. Analysis of T-DNA border junctions with genomic DNA 84
4. 3. Analysis of genomic DNA flanking T-DNA insertions 87
4. 4. Analysis of Ds flanking sequences 88
4. 5. Distribution of T-DNA insertions in the barley genome 90
4. 6. Distribution sites of Ds transpositions 91
4. 7. Ds excision and re-insertion 93
4. 8. Conclusion and perspectives 94
5. Summary
96
6. Zusammenfassung
98
7. References
100
8. Appendix
118
8.1. Table A 118
8.2. Table B 124
9. Acknowledgements
127
10. Lebenslauf
129
General Introduction 1 ________________________________________________________________________
1. General Introduction
1. 1. The host plant- Hordeum vulgare L.
Barley (Hordeum vulgara L.) is globally the fourth most important crop after wheat, rice
and maize, belonging to the tribe (tribus) Triticeae. This tribe represents a highly
successful evolutionary branch of the grass family Poaceae and comprises a vast number
of species and genera. The numerous wild species are potential gene sources for
breeding. Barley belongs to the genus Hordeum, which comprises about 32 species and
about 45 taxa (Bothmer et al., 1995). Barley is adopted to marginal and stress-affected
environments. It is an important crop for direct human consumption and for animal feed.
Barley was one of the first domesticated cereals. Domesticated barley has evolved from
its wild progenitor Hordeum spontaneum (von Bothmer and Jacobsen, 1985), originating
in the Fertile Crescent (Israel-Jordan area) of the Near East (Zohary et al., 1993;
Diamond, 1998; Badr et al., 2000). The main differences between wild and domesticated
barley are the acquisition of a non-brittle rachis, increased seed weight, and the
appearance of six -rowed ears and naked seed varieties in the domesticated form.
Cultivated barley is one of 32 Hordeum species which is an annual diploid species with
2n = 14 chromosomes. Its genetic system is relatively simple, while the species is
genetically diverse, making it an ideal model organism.
1. 2. Barley as a model crop for Triticeae family
Molecular evidence has revealed considerable homology between barley, wheat, and rye
with large chromosomal syntenic regions between these species make barley an ideal
model crop for other Triticeae species with an even more complex and bigger genome,
such as rye (8,400 Mb) and wheat (16,000 Mb). Being a true diploid self-fertilizer with
seven chromosomes containing approximately 5.3Mb of DNA (Bennett et al., 1976;
Arumuganathan et al., 1991) is one of the main advantages of barley as a genetic system.
Barley is one of the best investigated crop plants which has extensively been used for
genetic research because it is easy to generate mutants and to carry out genetic analysis.

General Introduction 2 ________________________________________________________________________
Chemical and irradiation induced mutagenesis procedures are widely applied in barley.
These have resulted in an extensive collection of over 10,000 documented mutants and
accessions (von Wettstein-Knowles, 1992; http://www.ars-grin.gov/npgs/index.html;
http://barley.ipk-gatersleben.de/ebdb/;) which are well suited for genetic analysis. Due to
the low chromosome number and the annual life cycle of barley, recessive mutations can
be more easily identified in barley than in its polyploid relatives, oat and wheat (Scholtz
et al. 2001). At present, thousands of molecular markers, morphological markers,
resistance markers, and quantitative trait markers have been mapped in reference
populations (Franckowiak, 1997; Ramsay et al., 2000; Kleinhofs and Graner, 2001;
Kleinhofs and Han, 2001). Current information on the integrated molecular,
morphological, and physiological marker maps are presented as BIN maps
(http:/barleygenomics.wsu.edu). In addition, a large number of expressed sequence tags
(EST) (http://www.ncbi.nim.nih.gov/dbEST/) has been generated. Several large insert
YAC (Kleine et al., 1993) and BAC (Yu et al., 2000; Isidore et al., 2005) libraries have
been constructed and these have been used by forward genetics strategies to clone a
number of genes including several resistance genes Mlo, Mla, Rar1, Rpg1, Rpg5 , and
Ror2 (Table 1), which allow for the integration of physical and genetic maps. A recently
released commercially available barley microarray, the Barley1 Chip, permits global
expression profiling in barley. Furthermore, the establishment of efficient techniques for
barley transformation by direct gene transfer (Wan et al., 1994) and Agrobacterium-
mediated gene transfer (Tingay et al., 1997) opened the route for the development of
additional genomics tools such as insertional mutagenesis and dsRNA mediated gene
silencing. The combined array of classical genetics and genomics tools in barley make
this species a suitable model for the Triticeae and the species of choice for insertional
mutagenesis.
1. 3. Gene discovery in barley
There are many different ways of cloning genes of interest. Basically, gene isolation can
be followed by two different strategies, the ‘forward genetics’ (from phenotype to gene)
and the ‘reverse genetics’ (from gene to phenotype) approaches (Takahashi et al., 1994).
In forward genetics, a mutant phenotype for the trait of interest, obtained by induced or

General Introduction 3 ________________________________________________________________________
natural mutagenesis, is identified and the affected gene, along with a large number of
molecular markers, is genetically mapped. The resulting map is used for gene isolation.
This forward genetics approach of gene isolation is described as map based cloning
(MBC) (for review see: Leyser et al.,1996; Jander et al., 2002; Peter et al., 2003). MBC
basically involves the following three steps: 1. initial genetic mapping and fine mapping
of the target gene, 2. physical mapping, the identification and isolation of the candidate
gene, 3. proof of biological function of the candidate gene via transformation or mutant
analysis. Map-based cloning in barley is a relatively recent development. A number of
genes in barley have been cloned by this approach (Table 1.). For example, the first
barley gene cloned by the map-based approach was the recessive mlo gene which confers
broad spectrum resistance to Blimeria graminis f. sp. hordei (Erysiphe graminis f. sp.
hordei) (Büschges et al., 1997). The development of a high resolution genetic map and
physical map of the Mla locus (Wei et al., 1999) led to the identification of multiple
genes, including the race-specific resistance genes Mla1 Mla6, Mla12, Mla13 Mla7 and
Mla10, which confer resistance to a large number of different races of the barley powdery
mildew fungus Blumeria graminis f.sp.hordei. The Rar1 gene which is required for Mla
resistance and Rpg1 gene conferring resistance to the stem rust pathogen Puccinia
graminis f. sp. tritici were also cloned by map-based cloning (Brueggeman et al., 2002).
Map-based cloning in barley has resulted in the isolation of unique and interesting genes
that have accelerated science not only in barley or the Triticeae, but also in other plant
families. For example, the mlo gene (Büschges et al., 1997) is still unique among disease
resistance genes in spite of the extensive cloning of genes from the model plant
Arabidopsis thaliana. The Rar1 gene (Shirasu et al., 1999), first cloned from barley, has
become an important player for the understanding of plant pathogen interactions in a
variety of different plant species. Cloning of the Mla locus combined with a newly
developed transient assay to test for protein interactions has resulted in one of the best
systems for studying plant pathogen interactions (Zhou et al., 2001; Shen et al., 2003). In
principal, map-based cloning is straight-forward. However, with its large genome of
approximately 5300 Mb per haploid genome, barley is not an ideal organism for map-
based cloning and gene isolation is often extremely time consuming. The availability of a
General Introduction 4 ________________________________________________________________________
complete barley genome sequence would greatly facilitate map-based cloning but due to
its large genome size barley is not a likely candidate for complete genome sequencing
projects in the near future. The availability of comprehensive genomics approache s
provides a novel option for the systematic investigation of the function of genes.
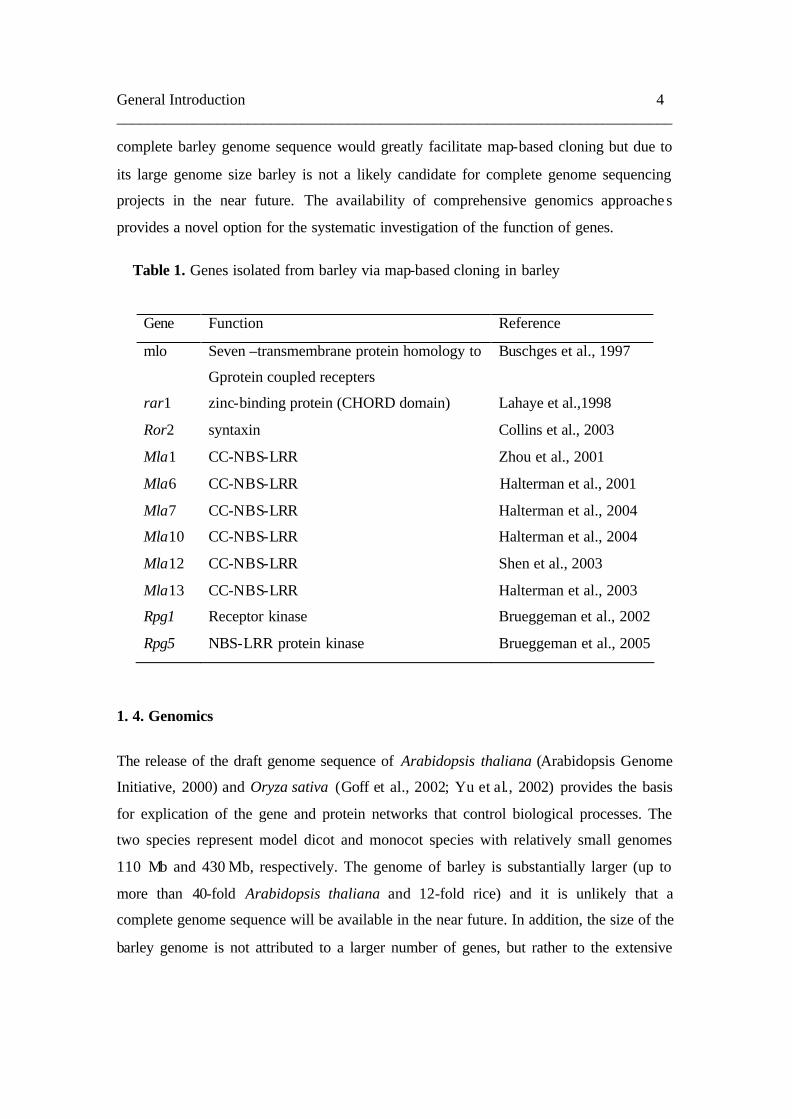
Table 1. Genes isolated from barley via map-based cloning in barley
1. 4. Genomics
The release of the draft genome sequence of Arabidopsis thaliana (Arabidopsis Genome
Initiative, 2000) and Oryza sativa (Goff et al., 2002; Yu et al., 2002) provides the basis
for explication of the gene and protein networks that control biological processes. The
two species represent model dicot and monocot species with relatively small genomes
110 Mb and 430 Mb, respectively. The genome of barley is substantially larger (up to
more than 40-fold Arabidopsis thaliana and 12-fold rice) and it is unlikely that a
complete genome sequence will be available in the near future. In addition, the size of the
barley genome is not attributed to a larger number of genes, but rather to the extensive
Gene Function Reference
mlo Seven –transmembrane protein homology to
Gprotein coupled recepters
Buschges et al., 1997
rar1 zinc-binding protein (CHORD domain) Lahaye et al.,1998
Ror2 syntaxin Collins et al., 2003
Mla1 CC-NBS-LRR Zhou et al., 2001
Mla6 CC-NBS-LRR Halterman et al., 2001
Mla7 CC-NBS-LRR Halterman et al., 2004
Mla10 CC-NBS-LRR Halterman et al., 2004
Mla12 CC-NBS-LRR Shen et al., 2003
Mla13 CC-NBS-LRR Halterman et al., 2003
Rpg1 Receptor kinase Brueggeman et al., 2002
Rpg5 NBS-LRR protein kinase Brueggeman et al., 2005

General Introduction 5 ________________________________________________________________________
expansion of repetitive DNA, in particular the amplification of retrotransposons
(Bennetzen et al., 1998; Ramakrishna et al., 2002). Moreover, barley has unique
commercial properties such as malting quality, which makes it distinct from other cereals.
This suggests that at least for this particular trait, barley comprises genes, which are
absent in Arabidopsis and rice. Similarly, many other unique genes for barley specific
traits can be anticipated.
Because the full sequence analysis of barley is at present not feasible, other technical
approaches for the identification of gene sequences have been devised. Alternative to full
genome sequencing are the analysis of expressed genes (transcriptome) or the sequence
analysis of gene-rich regions, which provide a basis for the discovery of genes and their
functions even for large-genome species such as barley. The transcriptome of a particular
species can be sampled by large-scale collections of expressed sequence tags (ESTs)
from cDNA libraries, which are constructed from different tissues and developmental
stages or from plants subjected to different environmental conditions.
High throughput single-pass and partial sequences from cDNA clones to generate large
collections of ESTs represent the transcriptome or transcribed portions of the genome and
avoid the highly repetitive and non-coding DNA that makes up the bulk of genomic
DNA. EST data has directly been applied for gene discovery (Ohlrogge et al., 2000;
Sterky et al., 1998), the evaluation of the genome-wide gene content and structure (Van
der Hoeven et al., 2002), as well as in silico comparative expression analysis between
different plant tissues (Ogihara et al., 2003; Ronning et al., 2003). Moreover, ESTs can
be a valuable resource for high-throughput expression analysis via the cDNA-array
technology (Potokina et al., 2002; Schena et al., 1995; Sreenivasulu et al., 2002, 2004).
Over the last few years, ESTs have become the foundation of barley genomics providing
a substrate for a wide range activity. As of May 2005, approximately 394,937 ESTs have
been generated for barley (see http://www.ncbi.nlm.nih.gov/dbEST). These are derived
from more than 80 different cDNA libraries covering virtually any tissue and growth
stage of the barley plant as well as a series of physiological conditions. These ESTs
provide a firm foundation for structural and functional barley genome analysis.

General Introduction 6 ________________________________________________________________________
In addition, the barley ESTs resources provide a valuable DNA sequence resource that
forms a rich source for development of novel functional markers including RFLPs
(restriction fragment length polymorphisms), SSRs (simple sequence repeats) and SNPs
(single nucleotide polymorphisms).
More recently, mainly cDNA clones corresponding to the barley ESTs have been utilized
to prepare microarrays. A microarray chip “Barley 1” representing approximately 21,000
barley unigenes has been developed (Close et al., 2004). The content of the chip was
derived from more than 400,000 barley EST sequences received from world -wide
cooperators. Complete details on the content of the barley microarray, and enhanced
probe-set annotations, can be obtained using the software HarvEST:Barley (available
from http://harvest.ucr.edu). A conservative estimate of the number of barley genes
represented on the Barley 1 microarray is about 14,000. The Barley 1 microarray
provides an excellent starting point for global analysis of gene expression profiling of at
least 25% of the genes in the barley genome.
1. 5. Functional genomics
Functional genomics aims at the functional analysis of genes discovered and annotated by
genome sequencing projects. While an increasing array of genomic tools and resources
continues to be developed, the functional analysis of annotated genes and of candidate
genes for a number of traits is gathering pace but is still a bottle neck in functional
genomics. As a result, rapid and high throughput methods for the confirmation and
validation of gene function by random or targeted gene inactivation or overexpression are
now becoming increasingly important priorities. Different approaches have been
developed for identification of gene function.
1. 5. 1. Tilling
Of all the approaches used to discover the function of a given gene, the most direct
approach is to disrupt the gene or generate mutations in the gene and analyze the
consequences. In barley, chemical (using ethyl methane sulfonate) and irradiation
mutagenesis have frequently been used for random gene inactivation resulting in over

General Introduction 7 ________________________________________________________________________
10,000 well-characterized mutants (von Wettstein-Knowles,1992; http://www.ars-
grin.gov/npgs/index.html; http://barley.ipk-gatersleben.de/ebdb/). Recently, two
structured chemically mutagenized populations of the barley cultivar (cv.) Optic have
been generated (Caldwell et al., 2004), which will allow for both forward genetics and
genome-wide reverse genetics in barley. One of the major disadvantages using chemical
or irradiation induced mutagenesis for functional genomics is the randomness of induced
mutations which requires large mutant populations of plants necessary for a mutant
screen. To enhance forward genetic screenings Caldwell et al. (2004) assessed 12-16 M3
individuals from each of the mutagenized M2 families for visible phenotypes and the data
entered into a database accessible on the internet (http://bioinf.scri.sari.ac.uk/). Once the
mutant is identified by its phenotype, positional cloning of the responsible gene requires
mapping of the mutation and the identification of a closely linked molecular marker to
the mutant locus that can be used to initiate chromosome walking and sequencing.
Chromosome walking can be tedious and difficult, particularly when dealing with barley
containing a large, unsequenced genome.
A method called Targeted Induced Local Lesions IN Genomes (TILLING) (McCallum
et al., 2000) addresses some of the problems mentioned above. This procedure identifies
single nucleotide change in the gene of interest by PCR-based reverse -genetics strategy in
wild-type and mutant alleles from EMS-mutagenized populations(Henikoff et al., 2003;
Till et al., 2003). This technique relies on the formation of heteroduplexes between PCR
products of the wild-type and mutated fragments, mismatch cleaved by the endonuclease
Cel I (Henikoff et al., 2003, 2004; Till et al., 2003). Plant pools giving rise to
heteroduplex DNA are subdivided and reanalyzed until the mutant plant is isolated.
Because TILLING does not depend on genome size or on the transformation method, it
can be scaled up for high throughput screening of mutants and can be applied to all plant
species. However, TILLING is a reverse genetics tool and it does not enable one to make
a direct transition from a mutant phenotype to a mutated gene, on top of requiring
sequence information.

General Introduction 8 ________________________________________________________________________
1. 5. 2. RNA-induced gene silencing
DsRNA-induced gene silencing, commonly called RNA interference (RNAi) in animals
and post-transcriptional gene silencing (PTGS) in plants, is a powerful reverse genetics
tool based on small double -stranded RNAs (dsRNAs) that guide sequence-specific
mRNA degradation (Helliwell et al., 2005; Waterhouse et al., 2003; Hannon et al., 2002).
This technique requires that constructs are made for each gene or a few target genes and
introduced into each plant by standard transgenic techniques. Although various vectors
designed for high-throughput cloning are available (Helliwell et al., 2005) , fast and
efficient transformation strategies for high-throughput application are limiting in plants
other than Arabidopsis. RNA-induced gene silencing usually results in a range of variable
phenotypes from wild-type to knockouts, which necessitates the analysis of sufficiently
large numbers of transformants for each gene being silenced.
Virus-induced gene silencing (VIGS), targets the same RNA silencing machinery as
RNAi, however, it is triggered by the double stranded RNA produced by viral genome
replication (Lu et al., 2003). VIGS uses viral vectors and bypasses the need for
transformation because the viral construct can be scrubbed into leaves or the
Agrobacterium containing the viral construct can be conveniently infiltrated into leaves
(Waterhouse et al., 2003; Liu et al., 2002; Baulcombe et al., 1999). In addition, VIGS has
the advantage that entire cDNA libraries can be cloned in the viral vector instead of
individual genes. However, VIGS-mediated phenotypes are transient and an appropriate
viral vector that can infect and cause gene silencing in a desired plant is a requirement.
Furthermore, VIGS is not suitable for all functional genomics application. Many viruses
are excluded from tissues such as meristems and seeds and so it may be difficult to
develop a system which is applicable to the genes associated with all traits of importance.
In the cases, RNAi or dsRNA induced gene silencing would be more applicable even if
lower throughput.

General Introduction 9 ________________________________________________________________________
1. 5. 3. Insertional mutagenesis
Inserional mutagenesis is a tractable genetic system in which a known DNA sequence (T-
DNA or transposon) is used to mutate and tag the genome, with the convenience of
looking for the mutated site using the tag as an identifier. Once a mutant is identified by
its phenotype, it is relatively simple to clone the gene using PCR-based techniques. These
insertional mutagenesis populations can be used for forward and reverse genetics and the
testing of specific hypotheses about the function of a gene.
In many plant species insertional mutagenesis has been used to generate knockout
mutations (Parino and Sundaresan, 2000). T-DNA (Azpiroz-Leehan et al., 1997 and
Krysan et al., 1999) as well as transposons (Ramachanddran and Sundaresan, 2001) have
successfully been used as insertional mutagens in plants. In Arabidopsis, efforts by
various laboratories from the public and private sector have developed large insertion
populations resulting in a high degree of saturation of the genome with independent
insertions (Alonso et al., 2003, Sessions et al., 2002). In rice, a large numbers of
independent insertion lines have been produced with different insertional mutagens. In
these transgenic lines the insertion sites are being systematically determined in order to
identify tagged genes (An et al., 2003; Chen et al., 2003). These resources in Arabidopsis
and rice provide the opportunity for barley researchers to address the function of
orthologous genes. However, there are situations, where a clear candidate orthologue
cannot be identified in rice or, where rice is not a suitable model for a barley trait.
Therefore, it is desireable to establish systems for insertional mutagenesis in barley.
Currently T-DNA and transposon insertional mutagenesis were used to generate large -
scale mutagegenesis population in plants as described as following:
T-DNA insertion mutagenesis
Agrobacterium–mediated transformation is a common approach to generate transgenic
plants. T-DNA is not known to insert in the genome of plants with site specificity, but it
has often been reported that T-DNA shows a preference for insertion in or near gene
containing regions of the genome (Barakat et al., 2000). Therefore, it should be to

General Introduction 10 ________________________________________________________________________
saturate the genic regions of the genome with T-DNA insertions (Azpiroz-Leehan and
Feldmann, 1997). In plant systems with high transformation efficiency large plant
populations containing numerous independent T-DNA insertions can quickly be
generated.
Large collections of T-DNA insertion lines have been generated in Arabidopsis (Campisi
et al. , 1999; Krysan et al. , 1999; Weigel et al., 2000). Similar systems exist in rice where
Jeon et al., (2000) have generated 22,090 transgenic rice plants with T-DNA insertions
with an average of 1.4 loci per transgenic line. Systematic efforts are now underway to
use these collections for forward and reverse genetic screens to identify insertions in
genes of interest (Winkler et al., 1998; Krysan et al., 1999, An et al., 2003). To date, no
successful T-DNA insertional mutagenesis has been reported for barley.
The most significant advantage of T-DNA tagging is the local stability of the insert.
While other molecular tags such as transposable elements have to be stabilized in order to
avoid further transpositions of the elements and possible reversions and footprints of
initially tagged genes, T-DNA insertions remain in most cases after the integration
process in the same chromosomal position. However, T-DNA insertions are often
complex generating T-DNA repeats in direct or inverted orientations, with occasional
rearrangements of adjacent chromosomal DNA and deletions at the target site sequences
(Mayerhofer et al., 1991; Ohba et al., 1995; Nacry et al. , 1998; Laufs et al. , 1999;
Sessions et al., 2002). Multiple insertion may occur both in multiple copies per locus and
in multiple loci (Bechtold et al. , 1993; Lindsey et al. , 1993). These characteristics of T-
DNA insertions frequently impede the isolation of T-DNA flanking genomic DNA.
In general, the use of T-DNA for insertional mutagenesis is limited to plant species which
can readily be transformed by Agrobacterium in large numbers, while it may not be
feasible in those plant species where the transformation methods are slow or labor
intensive such as in barley. Until recently, the relatively low efficiency of
Agrobacterium-mediated barley transformation, the large genome of barley as well as the
lack of detailed knowledge about preferred T-DNA insertion sites, T-DNA tagging in
barley appeared to be not feasible in the short term. Therefore, the development of large

General Introduction 11 ________________________________________________________________________
collections of T-DNA insertion lines with a critically high number of independent
insertions was not a favored approach in the barley research community. Alternatively,
large numbers of knockout lines can be generated in barley using transposable elements
after mobilization from relatively few T-DNA launch-pads.
Transposon insertion mutagenesis
Transposoable elements are mobile genomic DNA sequences that can modify their
number and/or their location within a host genome. Transposoable elements are widely
distributed in plants (Kumar and Bennetzen, 1999) and generally fall into two broad
classes according to their transposition intermediated and their known or supposed
transposition mechanisms (for review, see Capy et al, 1998), namely, class I
(retrotransposons) that transpose through an RNA intermediate generated by reverse
transcription and class II (DNA-based transposons) elements that transpose through
DNA-cut and-paste type mechanisms. Only a few plants, such as maize, petunia, and
snapgragon (Antirhinum majus), have well-characterized endogenous tra nsposons called
Ac/Ds, En/Spm, Mu , Tam, and pTph1.
After the first discovery of transposable elements in maize by Barbara McClintock in the
first forties of the last century (McClintock, 1950), the detailed analyses of their
transpositional behavior and the cloning of these mobile elements has resulted in the
isolation of numerous genes of the transposons natural hosts (Bruce et al., 2003).
Transposons in heterologous systems
The demonstration that maize transposable element Activator (Ac) and Dissociation (Ds)
can be active in a heterologous system of transgenic tobacco (Nicotiana tobaccum)
(Baker et al.,1986; 1987) laid the foundation for the use of transposon tagging to isolated
and characterize genes from plants. Since then, the maize Ac/Ds elements have been
shown to transpose actively and been exploited for tagging studies in a number of
heterologous species (Table 2). Similarly the maize transposable elements
Enhancer/Suppressor-mutator (En/Spm) have been used successfully in tobacco, potato
General Introduction 12 ________________________________________________________________________
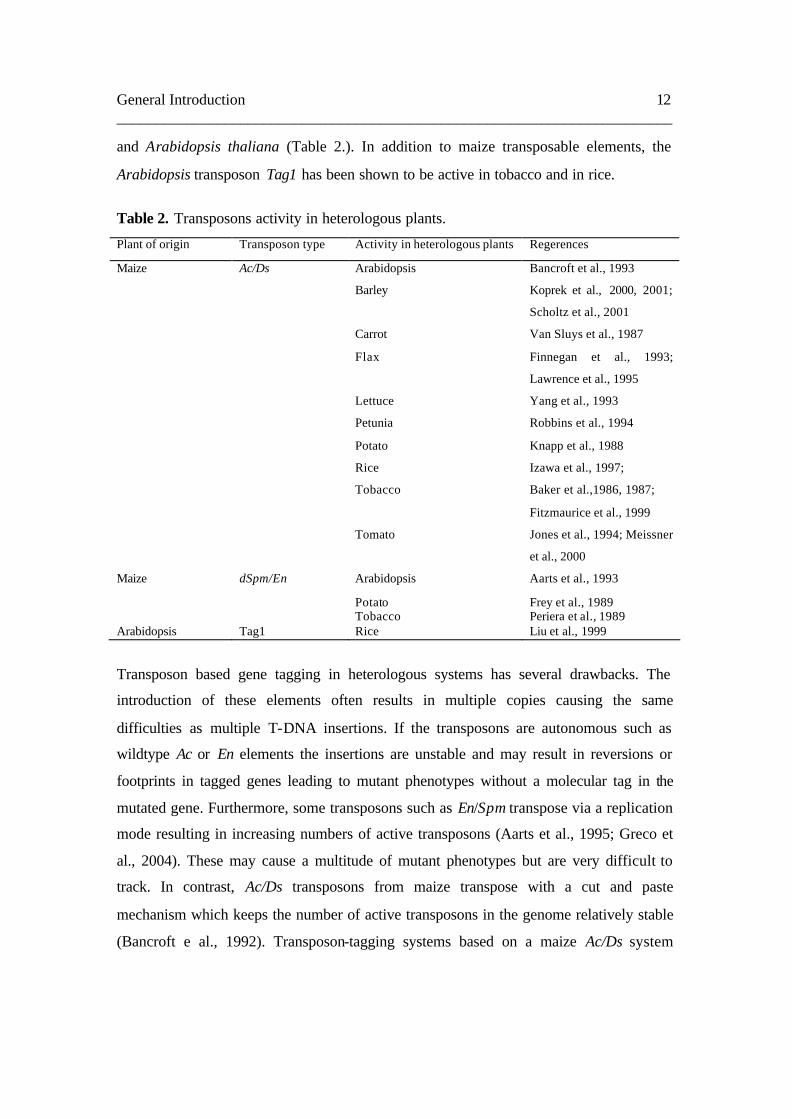
and Arabidopsis thaliana (Table 2.). In addition to maize transposable elements, the
Arabidopsis transposon Tag1 has been shown to be active in tobacco and in rice.
Table 2. Transposons activity in heterologous plants.
Plant of origin Transposon type Activity in heterologous plants Regerences
Maize Ac/Ds Arabidopsis Bancroft et al., 1993
Barley Koprek et al., 2000, 2001;
Scholtz et al., 2001
Carrot Van Sluys et al., 1987
Flax Finnegan et al., 1993;
Lawrence et al., 1995
Lettuce Yang et al., 1993
Petunia Robbins et al., 1994
Potato Knapp et al., 1988
Rice Izawa et al., 1997;
Tobacco Baker et al.,1986, 1987;
Fitzmaurice et al., 1999
Tomato Jones et al., 1994; Meissner
et al., 2000
Maize dSpm/En Arabidopsis Aarts et al., 1993
Potato Frey et al., 1989 Tobacco Periera et al., 1989 Arabidopsis Tag1 Rice Liu et al., 1999
Transposon based gene tagging in heterologous systems has several drawbacks. The
introduction of these elements often results in multiple copies causing the same
difficulties as multiple T-DNA insertions. If the transposons are autonomous such as
wildtype Ac or En elements the insertions are unstable and may result in reversions or
footprints in tagged genes leading to mutant phenotypes without a molecular tag in the
mutated gene. Furthermore, some transposons such as En/Spm transpose via a replication
mode resulting in increasing numbers of active transposons (Aarts et al., 1995; Greco et
al., 2004). These may cause a multitude of mutant phenotypes but are very difficult to
track. In contrast, Ac/Ds transposons from maize transpose with a cut and paste
mechanism which keeps the number of active transposons in the genome relatively stable
(Bancroft e al., 1992). Transposon-tagging systems based on a maize Ac/Ds system

General Introduction 13 ________________________________________________________________________
contain often a large proportion of insertion lines with single transposed elements
(Sundaresan et al., 1995; Martienssen et al., 1998). Even though this system requires
many plants for a complete genome coverage it is easier to analyze and isolate unique
insertion sites.
However, the use of Ac/Ds for random saturation mutagenesis has a serious disadvantage
due to the strong tendency of Ds to transpose to closely linked sites. In principle, this
limitation can be overcome by using a large scale starter lines. Alternatively, in the Ac/Ds
system, the propensity of Ds elements to transpose to linked sites was overcome by
selection against the donor site using a selection marker GFP in the Ds construct
(Kolesnik et al. , 2004). In the modified Spm/En system designed by Tissier et al. (1999),
the Spm transposase and the mobile dSpm elements are contained within the same T-
DNA transformed into A. thaliana. This system eliminates the need for crossing, and also
reduces the number of progeny required for the selection, as the negative selection is
applied against only a single locus as opposed to two loci when the transposase is
introduced separately. However, the maintenance of starter lines becomes problematic, as
the dSpm elements will continuously transpose in the presence of the Spm transposase, so
that this system requires a relatively large number of independent starter lines obtained
through transformation.
In order to obtain stable insertions, an optimal strategy usually employs a two-component
system. In a typical two-component system, a defective transposon is mobilized by a
transposase source supplied either in cis (on the same vector) or in trans (on a different
vector by co-transformation or cross). The lines carrying stable insertions can be obtained
subsequently by segregation of the transposase source. The transposase itself consist of
an immobilized autonomous element, which is deprived of the cis-requirements for
transposition and is usually driven by a constitutive promoter. Selectable markers such as
antibiotic resistance or herbicide resistance markers can be engineered in the non-
autonomous elements to select for the presence of transposed elements. In order to
monitor the transposition events, the non-autonomous transposon can be inserted between
General Introduction 14 ________________________________________________________________________
a promoter and the marker gene so that excision results in expression of the selectable
marker gene.
In recent years Koprek et al. (2000; 2001) showed the mobility and dispersion of Ds
elements from maize in barley and Scholtz et al. (2001) demonstrated the activity and
transposition of maize Ac elements in barley. A number of confirmed independent single-
copy Ds containing transgenic barley lines are available in the assembled collection at
MPIZ (Koprek et al., 2004). Recently, 19 mapped Ds inserted lines in barley were
released for public use (Cooper et al., 2004). Determination of the genetic location of the
Ds insertions will lead to maximum utility of these lines since it will allow for targeting
genetically linked genes.
Transposon mediated targeted gene tagging
Most transposable elements, including Ac/Ds and En /Spm, have a tendency to
preferentially transpose to genetically linked sites (Bancroft et al., 1993; James et al.,
1995; Jones et al., 1990). This feature can be advantageous for directed tagging of a
specific target gene or for performing regional insertion mutagenesis in a selected region
of a chromosome when a transposable element is inserted close to the target gene or
within the derived chromosomal region (Ito et al., 1999; Jones et al., 1994; Seki et al.,
1999). For instance, Ac/Ds transposons and cDNA scanning methods were used together
to perform regional insertional mutagenesis on genes from CIC7E11/8B11 and
5CIC5F11/CIC2B9 loci on A. thaliana chromosome V (Ito et al., 1999; Seki et al., 1999).
This allows cloning of cDNAs from a small region in the genome. The flanking
sequences of insertions showed that 14–20 % of the transpositions were located in about
1 Mb of genomic DNA surrounding the Ds donor sites.
The maize Ac/Ds transposable elements have been used successfully for insertional
mutagenesis in tomato and a number of tomato genes have been isolated by transposon
tagging with Ac/Ds. In most cases, these genes were tagged by targeted tagging taking
advantage of the preferential transposition of Ac/Ds to nearby sites (Carroll et al., 1995.,
Healy et al., 1993) and of the linkage between the target and previously mapped Ds

General Introduction 15 ________________________________________________________________________
elements (Knapp et al., 1994; Thomas et al., 1994). These include the Cf-9 (Jones et al.,
1994) and Cf-4 loci (Takken, 1998), which control resistance to various races of
Cladosporium fulvum; Dwarf, a gene encoding a cytochrome p450 homologue (Bishop et
al., 1996); defective chloroplasts and leaves (DCL), which controls chloroplast
development (Keddie et al., 1996); and FEEBLY, a gene involved in metabolism and
development (van der Biezen, et al., 1996). There has been a concerted effort by
European groups to map a large number of Ds elements in the tomato genome in order to
facilitate and improve targeted tagging in tomato. The European Union-funded
TAGAMAP project has completed the mapping of 140 Ds-containing T-DNA inserts
(Gidoni et al., 2003). These inserts are distributed throughout the 12 chromosomes of
tomato, allowing targeted transposon tagging within defined regions linked to the T-DNA
insertion site.
Barley plant is one of the best investigated crop plants. Currently, many genes controlling
the expression of morphological makers, disease resistance, and abiotic stress tolerances
have been mapped in barley chromosomes. Based on Ac/Ds preferential transposition of
genetically linked sites, using Ac/Ds system allows the targeting of a particular gene of
interest with a high frequency of Ds insertions if a linked starting point is available.
Therefore, transposon mediated targeted gene tagging strategy may provide a potentially
powerful tool for gene isolation in barley.
Activation tagging and Gene traps
Transposon and T-DNA tagging represent important tools for a variety of gene discovery
programs within plant biology. However, conventional insertional mutagenesis usually
generates recessive loss-of function mutations, which can only be studied when the
mutated gene is homozygous. Moreover, they are unsuitable for functional analysis of
redundant genes. Dif ferent approaches have been devised to solve these problems. The
most frequently used methods are activation tagging, which creates over-expression
mutants and gene trap tagging resulting in expression of reporter genes which are inserted
in or near gene regulatory elements.

General Introduction 16 ________________________________________________________________________
Activation tagging
Activation tagging is used to increase the expression level or to ectopically express a
gene which then provides a dominant gain-of function mutation that produces
informative mutant phenotypes. The Activation tagging strategy offers the possibility to
produce mutants as a consequence of increased or expanded expression of a tagged gene.
Activation tagging employs a powerful enhancer in either T-DNA or a transposon
resulting in ectopic expression or over-expression of nearby genes through transcriptional
activation. Populations of randomly inserted lines can be subjected to either forward or
reverse genetics screens for phenotypes resulting from this mis -expression. The first
successful activation tagging in plants was reported by Hayashi et al. (1992). Their
system uses T-DNA vectors that contain tetrameric CaMV 35S transcriptional enhancers
adjacent to the right T-DNA border. From the T-DNA activation tagging pool of
Arabidopsis, Weigel et al. (2000) have characterized over 30 dominant mutants with
various phenotypes, Analysis of a subset of the mutants has shown that the tagging vector
causes over-expression of the gene immediately adjacent to the inserted enhancer. A
number of novel alleles and genes which fulfill important functions in plant development,
metabolism and environmental interactions have been discovered using activation
tagging in Arabidopsis (Kardailsky et al., 1999; Zhao et al., 2001; Li et al., 2002;
Borevitz et al., 2000; Xia et al., 2004). To date, activation tagging has predominantly
been applied to gene discovery programs in Arabidopsis, however, this technology is now
being deployed in an increasing number of diverse plant species. A high-throughput
activation tagging program has recently been developed for tomato to identify key
regulators of metabolic pathways (Mathews et al., 2003). For example, activation tagging
in tomato identified the ANT1 gene, a transcriptional regulator of anthocyanin
biosynthesis, modification and transport. Recently, activation tagging pools for rice have
been generated using a binary vector which carries the tetramerized 35S enhancers and a
promoterless GUS reporter gene for gene -trapping (Jeong et al. , 2002). This provided a
platform for the discovery of genes via either activation tagging or by virtue of their
developmental or environmental expression pattern.

General Introduction 17 ________________________________________________________________________
A limitation of this approach is that the observed frequency of dominant mutations
through activation tagging has been significantly lower than that of recessive mutations
arising from insertional inactivation (Weigel et al., 2000), suggesting that many genes
may be over-expressed without observable phenotypes. Current activation tagging
technology is therefore unlikely to identify every gene by its potential over-expression
phenotype. The presence of insulator sequences, which protect genes from the effects of
adjacent enhancers or silencers may explain this phenomenon (Weigel et al., 2000; Jeong
et al. , 2002). These sequences may be ubiquitous in the gene-rich genomes of
Arabidopsis and rice. Alternatively, the CaMV 35S enhancers could activate only a
subset of adjacent genes due to promoter preference or promoter selectivity; similar
mechanisms of action have been well documented in other systems (Ohtsuki et al., 1998).
In this case, the application of an alternative enhancer sequence may generate a different
spectrum of activation tagged genes. Nevertheless, activation tagging has proven to be a
valuable complementary approach for the identification of gene functions.
Enhancer and gene trap elements
Insertional mutagenesis by transposon tagging is useful when disruption of a gene results
in an obvious mutant phenotype. However, in eukaryotic systems, disruption of genes
frequently can not lead to visible phenotypes due to functional gene redundancy, or they
may result in early lethality that obscures late-acting functions when the same gene has
multiple functions in development. These difficulties can be circumvented by modified
transposons called enhancer trap, promoter trap and gene trap (Springer, 2000; Kumar, et
al., 1998; Sundaresan, 1996). The enhancer traps contain a reporter gene, such as ß-
glucuronidase (GUS) or green fluorescent protein (GFP) by a minimal or weak promoter
in the dependent transposable element. The reporter gene expression is achieved by an
endogenous enhancer sequence of a neighboring gene. Although enhancer trapping
generates a higher frequency of in-situ reporter gene activation, promoter trapping and
gene trapping have an additional feature that generates loss-of function mutations. In the
promoter trap system the transposable element contains a promoterless reporter gene,
which is only expressed when it is inserted into an exon and forms a translational fusion

General Introduction 18 ________________________________________________________________________
with an endogenous gene (Topping et al., 1997). In contrast, gene trap vectors are
designed to contain an intron with one or more splice donor and accepter sequences in
front of a reporter gene (Sundaresan, 1995). This allows splicing from the donor site in
the disrupted gene to the reporter gene, resulting in a fusion transcript of upstream exon
sequences to the reporter gene. Therefore, the reporter gene can be expressed regardless
of insert position (exon, intron, or UTR).
Activation of the reporter gene in a promoter trap vector can be as high as 30%
(Sundaresan et al., 1996). In rice, at least 5% of the T-DNA and 10 % of the Ds elements
become activated in various tissues (Chin et al., 1999; Joen et al., 2000). An enhancer
trap system has been developed for rice (Greco et al., 2003; Wu et al., 2003). The
modified enhancer system uses the yeast transcription factor GAL4 fused to activation
domain of VP16 (Herpes simplex virus protein 16) (Triezenberg et al., 1988). This
GAL4/VP16 system has been applied to construction of enhancer trap lines in rice (Wu et
al., 2003).
1. 6. Identification of insertional mutants
Insertional mutagenesis, with transposable elements or T-DNA insertions, can generate
mutants and leads directly to gene identification. The insertion may cause a knockout
mutation and might display a mutant phenotype. The mutant gene which is tagged by the
insertion can be isolated by recovering DNA flanking the insert and subsequently lead to
the isolation of the wild-type gene without additional knowledge about gene or protein
sequences. Since genome sequencing projects for various plant species are progressing
rapidly, more and more sequences encoding predicted genes are available in public
databases. Reverse genetics strategies will be of great importance for the purpose of
assigning functions to predicted genes. Gene disruption by transposons or T-DNA
insertions constitutes a powerful tool for reverse genetics.
Reverse genetic is used to determine the function of a gene for which the sequence is
known, by generating and analyzing the phenotype of the corresponding knockout

General Introduction 19 ________________________________________________________________________
mutant. If the gene sequence is known and the biological function of that gene is
unknown, a knockout mutant can be generated and analyzed to determine its function.
In order to perform reverse genetic screens efficiently, it is necessary to generate a large
population of transposon tagged mutants. The number of lines to be screened is
dependent on the genome size and the number of genes of a given plant species and the
type and copy number of transposon used.
To facilitate the screen for an insertion in a particular gene, a PCR-based strategy has
been applied in isolation of tagged genes. In this approach, a gene-specific primer and an
insertion-specific primer are used for PCR amplification. Several insertion lines are
pooled together and the DNA extracted is then used as a template for PCR reactions.
Samples of 20 to 100 insertion lines are pooled to extract genomic DNA, and a gene -
specific primer and an insertion-specific primer were used for PCR (Merssner et al.,
1999; Tissier et al., 1999). Any pool showing a positive signal is re-screened using DNA
from individual lines, to identify the line carrying the insertion of interest. Several pools
can be combined to form a super pool if the number of insertion lines in the population is
very high (Tissier et al., 1999). This method is advantageous as it requires less
amplification reactions, and directly identifies the single plant with an insertion in the
gene of interest.
An alternative approach to identify tagged genes in a mutant population involves random
amplification of the DNA flanking the insertions. This strategy is particularly useful
when substantial genome sequence information is available, as in the case of A. thaliana
and rice. Several different methods have been developed for the PCR based isolation of
genome regions flanking the insertions. A protocol such as inverse PCR (iPCR) (Ochman
et al., 1988), adaptor-ligation PCR (Meza et al., 2002) or thermal asymmetric interlaced
PCR (Liu et al., 1995) can be used to amplify and sequence the flanking region of single-
or low-copy insertion lines. With an appropriately constructed database of such flanking
sequences, it will be feasible to identify insertions in a particular gene by simple
computer searches, eliminating the necessity for the more tedious pooling and
hybridization protocols. In addition, even though no ‘hit’ is found, the availability of a

General Introduction 20 ________________________________________________________________________
transposon insertion close to a gene of interest can be determined by a computer search or
mapping the insertions, and then the gene can be tagged by re-mobilizing the transposon
after crossing in the relevant transposase. As described previously, transposons from the
Ac/Ds and En/Spm families are very useful for mutagenesis of closely linked genes, and a
collection of sequenced insertions provides launch pads for tagging most of the genes
within the genome.
1. 7. Analysis of insertional mutants
Once a knockout in a given gene has been identified through reverse genetics strategies
among the population of insertional mutants, it becomes necessary to functionally
characterize the mutant. The first step in the characterization process is to obtain a mutant
that has a single insertion in the gene of interest. If a two-component transposable
element system (for example Ac /Ds) has been used in generating a population of insertion
mutants, the subsequent isolation of a single insertion line is rather straight forward. On
the other hand, if multi-copy transposable elements are used to perform the reverse
genetics screen, then it is necessary to do several out-crosses to assure that only a single
insertion is in the gene.
The next step in the characterization is the identification of phenotypes caused by the
gene knockout. If there is a detectable phenotype caused by the single stable insertion the
gene function may be deduced through detailed analysis of the phenotype. However,
there are many instances, where a gene knockout does not show an observable
phenotype. This could be result from functional redundancies with other genes or the
expression of the knockout gene only under specific conditions, such as pathogen
infection or environmental stresses.
For mutations in those genes it is necessary to expose the plants to conditions in which
the gene is required or expressed in order to detect a phenotype. In addition, the
generation of double or triple mutants of functionally redundant genes will uncover the
phenotype and permit the characterization of their functions. Since the genome-sequences
of A. thaliana and rice have been released, it is feasible to identify all closely related
General Introduction 21 ________________________________________________________________________
members of a gene family in these species. Together with computational analyses of
flanking sequence databases, it will soon be possible to construct combinations of
mutants to reveal novel functions that have gone undetected using the current genetics
methodologies.
1. 8. Prospects
In the post-genomics era, one of the most challenging works now is to examine the
function of a large number of plant genes. Significant progress in the field of cereal
genomics has already been made in almost all cereals. During the last five years, a large
amount of sequence data have been generated from many genome/EST sequencing
projects in cereals including barley. Available sequence data are being already utilized
for a variety of purposes, including annotation of these genomic sequences. An important
area of research in the field of functional genomics in cereal plants is the study of
expression pattern in time and space. Transposable element promises to be an ideal tool
for large–scale insertional mutagenesis in barley. A large population of insertional
mutants generated by transposon mutagenesis can be used to dissect gene function in
barley. However, it is would be unrealistic for assume that transposon tagging alone will
be sufficient for saturation mutagenesis. A comprehensive functional genomics approach
in barley will require transposon tagging to be complemented with other systems,
including map-based cloning, activation tagging, promoter and enhancer trapping,
TILLING and RNA-induced gene silencing as well as combination with the information
across EST and genomic sequences from a variety of sources.

Materials and Methods 22 ________________________________________________________________________
2. Materials and Methods
2. 1. Abbreviations
Ac Activator
Amp ampicillin
APS ammonium persulphate
BAP 6-benzy-laminopurine
bp base pair(s)
BSA Bovine Serium Albumin
dATP deoxyadenosinetriphosphate
dCTP deoxycytosinetriphosphate
dGTP deoxyguanosinetriphosphate
dTTP deoxythymidinetriphosphate
Dicamba 2-methoxy-3,6-dichorobenzoic acid
DNA deoxyribonulcleic acid
DNase deoxyribonulclease
DH double hapliod
Ds Dissociation
2,4-D 2,4-dichlorophenoxyacetic acid
EDTA ethylenediamine tetraacetic acid
EtOH ethanol
EtBr ethidium bromide
E. coli Escherichia coli
IPTG isopropylthio-ß-o-galactopyranoside
kb kilo base (s)
LB left border of T-DNA
MDE mutation detection enhancement
MS Murashige &Skoog
mRNA messenger ribonucleic acid
RNA ribonucleic acid

Materials and Methods 23 ________________________________________________________________________
RB right border of T-DNA
RNase ribonulclease
PVP polyvinyl pyrrolidone
SDS sodium dodecyl sulfate
SSCP single strain conformation polymorphisim
T-DNA transfer DNA
TEMED tetrametylethylenediamine
TAE tris acetic acid EDTA
TBE tris borate ethylenediaminetetraacetic acid

Materials and Methods 24 ________________________________________________________________________
2. 2. Materials
2. 2. 1. Plant material
2. 2. 1. 1. Donor plants
The spring barley plants (Hordeum vulgare L. cv. Golden promise) was used for
transformation
2. 2. 1. 2. Barley mapping populations
Barley DH mapping populations:
Igri x Franka (Graner et al., 1991))
Morex x Steptoe (Kleinhofs et al. 1993)
Oregon Wolfe Barley (OWB) Dom x Rec (Costa et al., 2001)
Galleon x Haruna Nijo (Karakousis et al., 2003)
Chebec x Harrington (Barr et al., 2003)
Clipper x Sahara (Karakousis et al., 2003)
Sloop x Halcyon (Read et al., 2003)
Whear-barley addition lines ( Islam AKMR et al., 1981)
cv. Chinese Spring wheat carried additional cv. Betzes barley chromosome 1H, 2H, 3H,
4H, 6H, 7H, respectively.
All materials described as above were kindly provided by Drs. Graner and Börner (IPK,
Gatersleben, Germany)
Unless otherwise stated these mapping population were used for genetically mapping of
T-DNA as well as Ds insertions.
2. 2. 1. 3. Ac transposase expressing lines
The AcTPase expressing lines were previously developed using a vector containing
AcTPase gene, under control of an Ac transposase promoter and the nos terminator
(Koprek et al., 1999, 2000).

Materials and Methods 25 ________________________________________________________________________
2. 2. 2. Bacterial strains
E. coli strain
DH5a (Invitrogen)
Agrobacterium tumefaciens strain
AGL1(Lazo et al., 1991)
2. 2. 3 Cloning vectors
pWBVec8+A (Wang et al., 1998)
pPSDs-Ubi-Bar-Ds (Koprek et al., 2000)
pDM302 (Cao et al., 1992) Rice-Actin1 promoter ::Bar::nos-terminator
pBlue+A (MPIZ)
pUbiGus (Ye, et al., 1997) Maize-Ubiqutin1-promoter::GUS: CaMV35S-terminator
pUC-codA-Act- AcAc (Koprek, et al.,1999) Maize-putative Ac promoter:: Ac : nos
terminator
2. 2. 4 Antibiotics
Ampincillin (1000x): 100mg/ml in H2O
Kanamycin (1000x): 50mg/ml in H2O
Rifampicin (1000x): 50mg/ml in DMSO
Spectinomycin (1000x): 100mg/ml in H2O
Stock solultion stored at -20°C
2. 2. 5. Media
LB (Lauria Broth)
Tryptone peptone 1%
Yeast extract 0.5%
NaCl 0.5%
pH 7.0

Materials and Methods 26 ________________________________________________________________________
MG/L medium
Tryptone peptone 5.0g/l
Mannitol 5.0g/l
L-glutamin acid 1.0g/l
Yeast extract 2.5g/l
NaCl 100mg/l
MgSO4 100mg/l
Biotin 10µl (0.1mg/ml stock)
pH 7.0
Agar 15g/l
supplemented with 50mg/l rifampicin, 50mg/l kanamycin, and 150µmol/l acetosyringone
After autoclaving the medium was cooled to 50°C, then antibiotics was add to the
required concentration.
Barley callus induction medium(BCIM)
MS plant salt base 4.3g/l
malt ose 30g/l
casein hydrolysate 10g/l
myo-inositol 350mg/l
proline 650mg/l
thiamine HCl 1.0mg/l
Dicamba 2.5mg/l
pH 5.8
Phytagel 3.5g/l

Materials and Methods 27 ________________________________________________________________________
Barley shoot induction medium (BSIM)
MS plant salt base but without NH4NO3 2.7g/l
maltose 20g/l
NH4NO3
165mg/l
Glutamine 750mg/l
myo-inositol 100mg/l
thiamine HCl 0.4mg/l
2-4 D 2.5mg/l
BAP 0.1mg/l
pH 5.8
Phytagel 3.5g/l
Barley shoot regeneration medium (BSRM)
MS plant salt base but without NH4NO3 2.7g/l
Maltose 20g/l
NH4NO3 165mg/l
Glutamine 750mg/l
myo-inositol 100mg/l
thiamine HCl 0.4mg/l
pH 5.8
Phytagel 3.5 g/l
2. 2. 6. Chemical and Enzymes
Laboratory regents were obtained from Fluka, Merck, Roth, Serva, and Sigma-Aldrich
unless otherwise stated.
Restriction enzymes were purchase from New England BioLabs, Invitrogen, and with the
10X buffer supplied unless otherwise stated.

Materials and Methods 28 ________________________________________________________________________
Nucleic acid modifying enzymes
Standard PCR reactions were performed using home-made Taq DNA polymerase and/or
red Taq DNA polymerase from Bioline for normal PCR reactions. Modifying enzymes
were listed below and purchased from various sources:
Taq-DNA polymerase Home-made
Bioline
T4 DNA ligase Invitrogene
Sprimp alkaline phosphatase Roche
2. 2. 7. Buffers and Solutions
General buffers and solutions
Acetosyringone 100mM in DMSO
3M Sodium acetate
NaC2H3O2·3H2O 408g
Dissolve sodium acetate trihydrate in 800 ml H2O, adjust pH to 4.8 with 3M acetic acid,
add H2O to 1000 ml, autoclaved
.
TE (Tris/EDTA) buffer
10mM Tris/HCl (pH8.0)
1mM EDTA (pH8.0) in distilled water
EDTA (ethylenediaminetetraacetic acid)-stock (0.5 M, pH 8.0)
Na2EDTA 186.1g
H2O 1000ml
Dissolve 186.1g Na2EDTA in 700ml water, adjust pH to 8.0 with
10 M HaOH,
add water up to 1 l.

Materials and Methods 29 ________________________________________________________________________
SDS (sodium docdecyl sulfate or sodium lauryl sulfate) (10%, w/v)
SDS 100g
H2O 1000ml
Slightly heat may be necessary to fully dissolve the powder
IPTG stock (0.1M)
1.2g IPTG add water to 50ml final volume, filter-sterilize and store
at 20°C
X-gal (20mg/ml in DMF)
Dissolve 5-bromo-4-chloro-3-indoly-ß-D-galactopyranosid in
N, N-Dimethylformamide and store at -20°C.
Ethidium bromide stock (10 mg/ml)
Ethidium bromide 0.2g
H2O 20ml
Stored at 4°C in dark or in a foil-wrapped bottle.
Denhardts solution (X100)
2% (W/V) BSA, 2% (W/V) Ficoll 400, 2% (W/V) PVP360
20xSSC 3 M NaCl, 300 mM sodium citrate
20xSSPE 200mM disodium hydrogen phosphate, 20mM sodium dihydrogen
phosphate, 3.6M NaCl, 20mM EDTA pH8.0
TAE buffer (50x)
Tris base 242g

Materials and Methods 30 ________________________________________________________________________
Na2 EDTA·2H2O 8.6g
Add 800 ml of distilled water. Mix to dissolve. Adjust to
pH 8 with glacial acetic acid (~57 ml7l). make up to final volume
1000 ml.
TBE buffer (10x)
Tris base 108g
boric acid 55g
0.5M Na2 EDTA (pH8.0) 40ml
H2O 960ml
DNA gel loading buffer (6x)
Bromphenol blue 0.25%
Xylence cyanol FF 0.25%
Ficoll 400 15%
Stored at 4°C
DNA gel loading buffer for SSCP analysis
Formamide 99% (v/v)
bromophenol blu 0.05% (w/v)
xylene cyanol 0.05% (w/v)
NaOH 10mM
Materials and Methods 31 ________________________________________________________________________
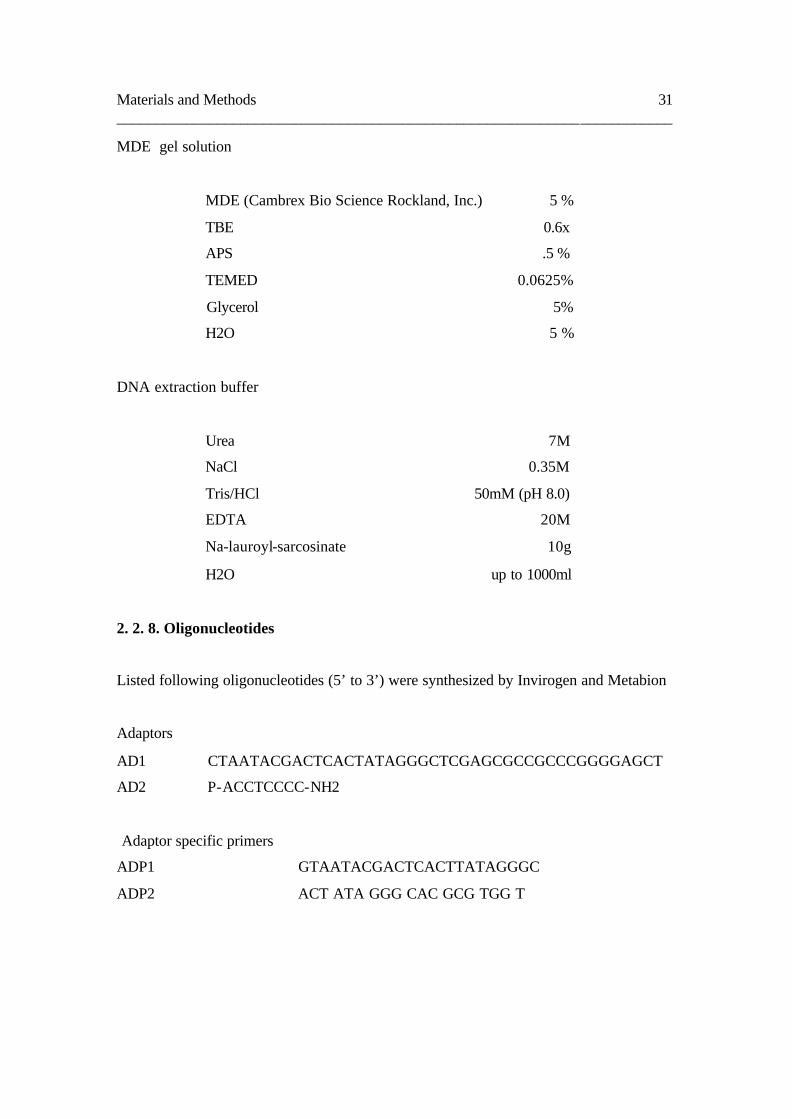
MDE gel solution
MDE (Cambrex Bio Science Rockland, Inc.) 5 %
TBE 0.6x
APS .5 %
TEMED 0.0625%
Glycerol 5%
H2O 5 %
DNA extraction buffer
Urea 7M
NaCl 0.35M
Tris/HCl 50mM (pH 8.0)
EDTA 20M
Na-lauroyl-sarcosinate 10g
H2O up to 1000ml
2. 2. 8. Oligonucleotides
Listed following oligonucleotides (5’ to 3’) were synthesized by Invirogen and Metabion
Adaptors
AD1 CTAATACGACTCACTATAGGGCTCGAGCGCCGCCCGGGGAGCT
AD2 P-ACCTCCCC-NH2
Adaptor specific primers
ADP1 GTAATACGACTCACTTATAGGGC
ADP2 ACT ATA GGG CAC GCG TGG T

Materials and Methods 32 ________________________________________________________________________
Amplification of Bar gene
BarF TGCACCATCGTCAACCACTA
BarR ACAGCGACCACGCTCTTGAA
Amplification of HPT gene
HPTF GCGAAGGGTCTCGTGCTTTC
HPTR GATGTTGGCGACCTCGTATT
Amplification of AcTPase gene
AcF TCTTCCACTCCTCGGCTTTA
AcR ACCTTGGTTGCAAAGGATGG
Amplification of genomic DNA flanking Ds3 regions by IPCR
Ds3F1 CATCCTGAAATTGCGTGGCGG
Ds3F2 ATTCCTTTCCCACCGCTCCTTCGC
Ds3F3 ACCTCGTGTTGTTCGGAGCGCAC
Ds3R1 CGACCGGATCGTATCGGTTTTCG
Ds3R2 CGATTACCGTATTTATCCCGTTCG
Ds3R3 GACCGTTACCGACCGTTTTCATCC
Amplification of genomic DNA flanking Ds5 regions by IPCR
Ds5F1 ACCTCGGGTTCGAAATCGATCG
Ds5F2 ATCGGTTATACGATAACGGTCGG
Ds5R1 CGGAAACGGGATATACAAAACGG
Ds5R2 CGGAAACGGTAGAGCTAGTTTCC
Amplification of genomic DNA flanking Ds3 regions by adaptor -ligation PCR
Ds3R1-ALP GAT TTC GAC TT ACC CCG ACC GGA TCG
Ds3R2-ALP GACTTTACCCCGAC CGGATCGTATCGG
Ds3R3-ALP GTT ACC GGT ATA TCC CGT TTT CGT TTC CG
Materials and Methods 33 ________________________________________________________________________
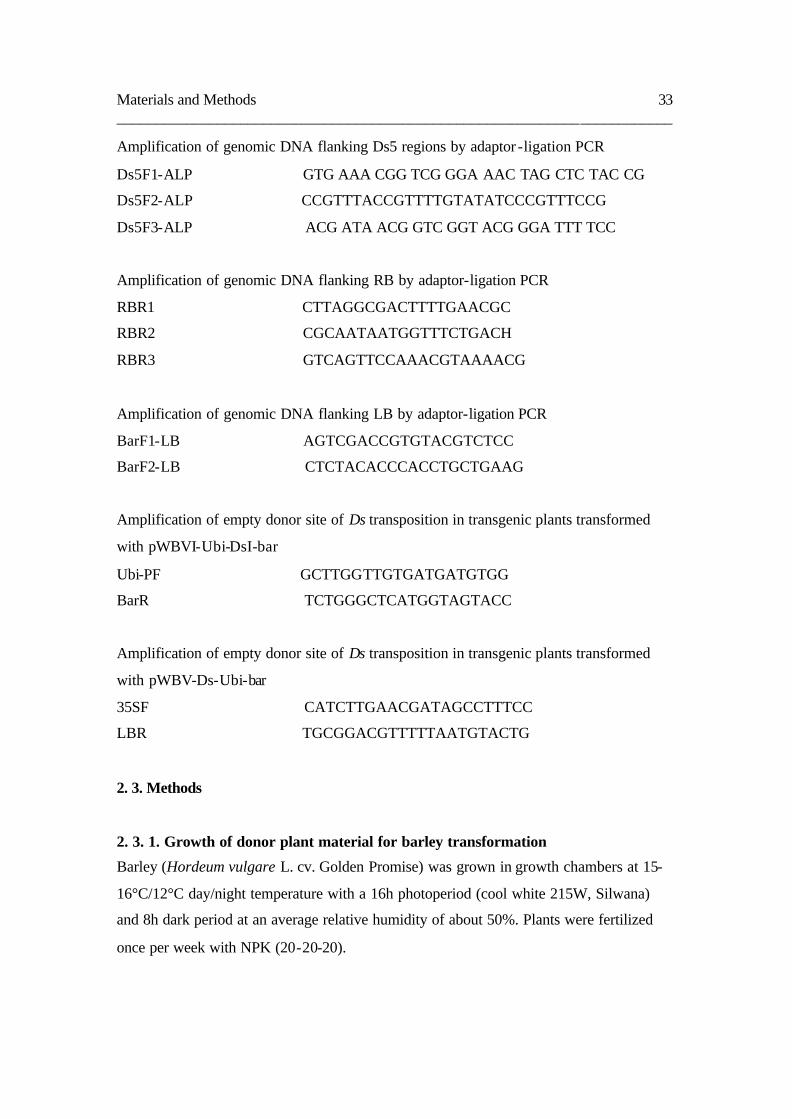
Amplification of genomic DNA flanking Ds5 regions by adaptor -ligation PCR
Ds5F1-ALP GTG AAA CGG TCG GGA AAC TAG CTC TAC CG
Ds5F2-ALP CCGTTTACCGTTTTGTATATCCCGTTTCCG
Ds5F3-ALP ACG ATA ACG GTC GGT ACG GGA TTT TCC
Amplification of genomic DNA flanking RB by adaptor-ligation PCR
RBR1 CTTAGGCGACTTTTGAACGC
RBR2 CGCAATAATGGTTTCTGACH
RBR3 GTCAGTTCCAAACGTAAAACG
Amplification of genomic DNA flanking LB by adaptor-ligation PCR
BarF1-LB AGTCGACCGTGTACGTCTCC
BarF2-LB CTCTACACCCACCTGCTGAAG
Amplification of empty donor site of Ds transposition in transgenic plants transformed
with pWBVI-Ubi-DsI-bar
Ubi-PF GCTTGGTTGTGATGATGTGG
BarR TCTGGGCTCATGGTAGTACC
Amplification of empty donor site of Ds transposition in transgenic plants transformed
with pWBV-Ds-Ubi-bar
35SF CATCTTGAACGATAGCCTTTCC
LBR TGCGGACGTTTTTAATGTACTG
2. 3. Methods
2. 3. 1. Growth of donor plant material for barley transformation
Barley (Hordeum vulgare L. cv. Golden Promise) was grown in growth chambers at 15-
16°C/12°C day/night temperature with a 16h photoperiod (cool white 215W, Silwana)
and 8h dark period at an average relative humidity of about 50%. Plants were fertilized
once per week with NPK (20-20-20).

Materials and Methods 34 ________________________________________________________________________
2. 3. 2. Vector construction
All modification and constructions of vectors for transformation and all intermediates
were carried our according to standard protocols (Sambrook et al., 1989) and according
to the instructions of the manufactures of restriction and modifying enzymes.
2. 3. 2. 1 Construction of pWBV-Ds-Ubi-bar-Ds
The HindIII and ClaI fragment (blunted) of pSPDs-Ubi-bar-Ds (Koprek et al., 2000),
which contains Ds elements carrying a bar gene under control of maize ubiquitin 1
promoter, was ligated to the Not I digested (blunted) pWBVec8+A to result in construct
pWBV-Ds-Ubi-bar-Ds.
2. 3. 2. 2. Construction of pWBVI-Ubi-DsI-Bar
For cloning I-SceI restriction site into the vector bone and Ds element, two
oligonucloetid (5’-GGCCGCTAGGGATAACAGGGTAATGC-3’, 5’-GGCCGCATT
ACCCTGTTATCCTCAGC-3’) were annealed in 1x PCR buffer at 94°C for 5 min and
cold down at room temperature. The I-SceI sequences was inserted into NotI sites of
pSPDs-Ubi-bar-Ds (after removal of Ubi-bar cassette with NotI) and pWBVec8+A to
generate pSPDsI and pWBVI, respectively. The Hind III and EcoRV digested fragment
(blunted) of pSPDsI containing DsI element was ligated to Hind III (blunted) site of
pDM302 to generate pDM-DsI-bar-nos in which the HindIII/HindIII (blunted) site was
converted to a NheI site. The DsI-bar fragment (blunted) was isolated from pDM-DsI-
bar-nos as a NheI and XbaI fragment was ligated to BamHI digested (blunted) pUbiGUS
to generate pUBi-DsI-bar. The Hind III cassette of pUBi-DsI-bar, which contains
ubiqutin 1 promoter fused to DsI-bar -35 teminator, was ligated to Hind III site of
pWBVI to generate PWBVI-Ubi-DsI-Bar.
2. 3. 2. 3. Construct of pWBV-Ac-AcPTase
The PstI fragment of pUC-codA-Act-Ac-Ac, which contains AcTPase under control of
putative Ac promoter, was ligated to the PstI site of pBlue+AN to result in pBlue -Ac-Ac.
Materials and Methods 35 ________________________________________________________________________
The AscI and NotI cassette from pBlue-Ac-Ac was inserted into the AscI and NotI
restriction site of pWBV+8A to generate pWBV-Ac-Ac.
2. 3. 3. Agrobacterium-mediated transformation
2. 3. 3. 1. Preparation of Agrobacterium tumefaciens strain
The binary vector pWBV-Ds-Ubi-bar-Ds and PWBVI-Ubi-DsI-Bar and pWBV-Ac-Ac
were introduced into Agrobacterium tumefaciens strain AGL1 (Lazo et al., 1991) by
electoporation. AGL1 inoculum was prepared from a single colony and grown overnight
on a shaker (150 rpm) at 28C in 5ml MG/L medium supplemented with 50mg/L
rifampicin, 50mg/L kanamycin. Four or five hours before inoculation, Agrobacterium
tumefaciens cells were collected by centrifugation and resuspended in 5ml MG/L
medium (pH5.2) supplemented with 50mg/L rifampicin, 50mg/L kanamycin, and 150
µmol/L acetosyringone. Before inoculation, the OD600 of the Agrobacterium
tumefaciens cell should be between 1.4 and 1.7. They were transferred to barley callus
induction medium supplemented with 150 µmol/L acetosyringone.
2. 3. 3. 2. Isolation of barley immature embryos and transformation
Spikes of barley were harvested when the immature embryos were between 1.5-2.5 mm
in length, approximately 14 days post-anthesis. Surface sterilization of developing
caryopses was carried out while stirring caryopses in 70% (v/v) ethanol for 1-2 min,
followed by 15 min in sodium hypochlorite (0.6% to 1.4%; v/v) with a few droplets of
tween 20 and with 3-5 rinses in sterile water for 10 min each. Immature embryos were
excised from the caryopses and the embryonic was axis removed with a scalpel blade.
Tissue explants were placed scutellum side up on callus induction medium (BCI) and
incubate in the dark at 24°C during co-cultivation and subsequent periods of culture. For
transformation 40 immature embryos are placed in the middle of BCI-plate with the
scutellum-side facing upwards.
The 150mL -200mL AGL1 suspension was pipetted on to the barley immature embryos,
which was then transferred to a fresh petri-dish to remove the excess inoculums. After 3-
Materials and Methods 36 ________________________________________________________________________
4 days of co-cultivation at 24°C in the dark, explants were transferred to BCI medium
with 150-200mg/l Timentin and 25 mg/L hygromycin and incubate in the dark at 24°C.
subculture the developing calli every 14 days for 12 weeks.
2. 3. 3. 3. Regeneration of transgenic plants
Following shooting, resistant embryogenic callus lines were transferred to regeneration
medium (BSI) and incubated at 24°C under fluorescent lights (16h/day). Regeneration
plantlets were transferred to rooting medium (BRM). After development of a root system,
plantlets were transferred to soil and placed in green house.
2. 3. 4. Isolation of genomic DNA
Genome DNA was isolated from leaf tissue of individual transgenic plants as described
in (Cone, 1989). Collected fresh leaves were ground to a fine powder with a well-chilled
1.5 ml eppendorf tube in liquid nitrogen with fitting pellet pestles. 500 µl of DNA
extraction buffer were added into the eppendorf tuber, mixed well on a vortex sha ker
before adding 500 µl of phenol:chloroform solution (1:1; v/v) (Roche). The mixture was
vortexed for 30 seconds. Centrifuged for 10 min at 13, 000rpm at RT and the upper
watery phase was transferred into a new 1.5ml eppendorf tube. DNA was precipitated
after adding 0.8 volume of 2-propanol and gently mixing by centrifugation for 10 min at
13,000 rpm. The DNA pellet was washed twice with 1ml of 70% EtOH, mixed gently
and centrifuge 10 min at 13,000 rpm and air-dried. The DNA was dissolved in sterilized
TE (100 to 200µl, depending on pellet size), incubated in a 65° C water bath with gentle
inversion several times until DNA was completely dissolved. the DNA concentration was
determined spectrophotometrically (Eppendorf BioPhotometer).
2. 3. 5. Genomic Southern blot analysis
10 µg genomic DNA was completely digested with restriction enzyme. DNA was loaded
and separated on a 0.8% agarose gel with TAE or TBE buffer. The gel was then treated
by washing in 0.125M HCL for 10 min to depurinate the DNA, followed by 30 min
washes in 0.5N NaOH to denature the DNA. The denatured DNA was then transferred

Materials and Methods 37 ________________________________________________________________________
and bound to Hybond-N+ menbrance (Amersham) according to the standard capillary
transfer procedure (Sambrook et al., 1989). Filters were UV-cross linked, prehybridized
and hybridized in prehybridization solution (5xSSC, 0.5%SDS, 5XDenhardt’s solution,
and 50µg/ml denatured salmon sperm DNA) at 65°C.
Following hybridization, the filters were washed at low stringency as follows:
1x15min in (2xSSC, 0.1% (w/v) SDS) at 65°C
1x15min in (1xSSC, 0.1% (w/v) SDS) at 65°C
The filters were sealed in plastic bags, orientated and exposed to autoradiography for 7-
10 days at -80°C.
2. 3. 6. Preparation of [a-32P]-labeled probes
To perform Southern blot, probes were prepared from agarose gel electrophoresis-
separated DNA fragments using the RediprimeTM II Random Prime Labelling System Kit
(Amersham Biosciences). The labeling was carried out in 50 µl of the following reaction
mix:
Add 50ng (45µl) denatured DNA,
Flick tube and spin briefly
Add 5µl [a-32P]-dCTP
Pipette up and down
Spin briefly
The reaction was incubated at 37°C for 30 min. The probe was purified with kit (
ProbeQuantTM G-50 Micto Columns, Amersham Biosciences) and denatured at 95° C for
5 min and immediately chilled on ice prior to use.

Materials and Methods 38 ________________________________________________________________________
2. 3. 7. Polymerase chain reaction (PCR) amplification analysis
PCR was performed to confirm transgenic plants and to produce probes from plasmids
2. 3. 7. 1. Genomic DNA PCR amplification
PCR amplification buffer (10x)
Tris/HCl(pH8.4) 200mM
KCl 500 mM
MgCl2 25mM
If without special state, amplification from genomic DNA template was performed in 50
µl volume as follows:
Template DNA (genomic) 200 -500 ng
PCR amplification buffer (10x) 5µl
dNTP mix(2.5mM) (dATP, dGTP, dCTP, dTTP) 4µl
upstream primer (10µM) 2µl
downstream primer (10µM) 2µl
Taq DNA polymerase (1-4 U/ µl) 0.5 µl
Nuclease free water up to 50 µl
Amplification was carried out under the following conditions in a Thermal reactor
Initial denaturation 94°C 2 min
Denaturation 94°C 45-60 seconds
Annealing 55-65°C 30-60 seconds
Extension 72°C 1-3 min
The final three stages were cycled 30-36 times following which a longer extension of

Materials and Methods 39 ________________________________________________________________________
10 min at 72°C was added to ensure all reactions had completed.
2. 3. 8. Restriction endonuclease digestion of DNA
All restriction digests were carried out using the manufacturers recommended conditions.
The reactions were carried out in 1.5ml eppendorfs using 2-5units of restriction
enzyme/µg plasmid DNA and 2-3 units of restriction enzyme /µg genomic DNA per 50
µl reaction volume. All digests were carried out at the appropriate temperature in
incubators or in a thermal cycler for am minimum of 3 hours or overnight.
2. 3. 9. Plasmid DNA isolation
Plasmid DNA was isolated by alkaline lysis method (Birnboim and Doly, 1979).
2. 3. 10. Isolation of DNA fragments from Agarose-gel
The nucleospin Extract-Kit (MACHEREY-NAGEL) or GFXTM PCR DNA and Gel
Band Purification Kit (Amersham Biosciences) was used to extract DNA fragments from
the agrose-gel according to the manufacture’s protocol.
2. 3. 11. Transformation of E.coli
2. 3. 11.1. Preparation of electro-competent E.coli cells
10ml of an overnight culture of E.coli strain (DH5a) was added to 1 liter of LB medium
and shaken at 37° C until the bacterial growth reached an OD=0.5-0.6. The bacterial were
pellet gently resuspended in ice-cold sterile water. The cells were pelleted as before and
again resuspended in ice-cold water. The process was repeated twice. Finally the cells
were gently resuspended in a 1/100 volume of the initial culture in 10% sterile glycerol,
pelleted once more and then resuspended in 5 ml 10% glycerol, 50µl aliquots of cells
were frozen in liquid nitrogen and stored at -80°C.

Materials and Methods 40 ________________________________________________________________________
2. 3. 11. 2. Transformation of electro-competent E. coli cells
20 to 50 ng of salt -free ligated plasmid DNA (or ~1µl of ligated mix from 10µl ligation
volume) was mixed with 50 µl of electro-competent cells, and then transferred to the
1mm cold BioRad electroporation cuvette. The BioRad gene pulse apparatus was set to
25µF capacitance, 1.8 kV voltage and the pulse controller to 200 seconds and 500µl LB
medium was immediately added to the cuvette and the cells were quickly resuspended
and incubated at 37° C for 1 hour. A fraction (~100 to 300µl) of transformation mixture
was plated out onto selection media plates containing 100mg/l required antibiotic.
2. 3. 12. Isolation of T-DNA flanking sequence
Adaptor-ligation PCR (Meza et al., 2002) was modified to amplify genomic DNA
flanking T-DNA. For annealing adaptors, using 25mM of adaptors with any PCR buffer
without dNTP in 100 µl volume for 5 min and followed by gradual cooling at room
temperature. Digestion of 5µg gDNA with 10 unit EcoRV, or SspI, respectively,
overnight in 100µl volume, and then purification with nucleospin Extract-Kit
(MACHEREY-NAGEL). ligation with 10µl (25mM) adaptors using T4 DNA ligase at
16°C overnight in 100 µl volume, then purification with nucleospin Extract-Kit
(MACHEREY-NAGEL). First round PCR: using 10µl DNA (~500ng), 5 µl buffer, 6 µl
dNTP (2.5µM), 2µl (10µM) AP1, 2µl (10µM) RBR1 for isolation of RB flanking
sequences, 2µl (10µM) AP1, 2µl (10µM) Ds5F1 or BarF1 for isolation of LB flanking
sequences, 0.5 u Taq DNA polymerase in a 50 µl reaction volume. PCR condition as
followed: 94°C 2 min, 94° C 1 min, 60-65°C 1 min, 72°C 3min, 31 cycles. Secondary
round PCR: using 1 or 2 µl of dilution of 1/10 of the first round PCR product to perform
secondary PCR, using same conditions as for first round PCR, but using AP2 and Ds3R2,
Ds5F2 or BarF2 and 35 cycles.

Materials and Methods 41 ________________________________________________________________________
2. 3. 13. Isolation of Ds flanking sequences
Two methods were employed in order to obtain sequences flanking Ds insertion sites,
including inverse PCR (IPCR) and adaptor-ligation PCR methods.
2. 3. 13. 1. Inverse PCR
Inverse PCR (IPCR) (Ochman et al., 1993) was modified to isolate the genomic DNA
flanking Ds insertions, with the following modifications. Genomic DNA (5µg) was
digested with 20 unit BstyI in 100 µl volume at 60°C for 6 hours, followed by purification
using the nucleospin Extract-Kit (MACHEREY-NAGEL), and self -ligation in 100µl
reaction volume using 10 unit T4 ligase at 16°C for 16-24 hours, followed by purification
using the nucleospin Extract-Kit (MACHEREY-NAGEL). The IPCR contained
approximately 500 ng of purified, ligated DNA. First round of PCR using 2µl (10µM)
primer Ds3R1 and Ds3F1, respectively, 5µl buffer, 4µl dNTP (2.5 mM), 1 unit Taq DNA
polymerase, were performed on the 3’ side of the Ds element. PCR condition as
followed: 94°C 2 min, 94° C 1 min, 55-60 °C 1 min, 72°C 3min, 31 cycles.1-2µl PCR
products from the first round of PCR (1/10 dilution) were used as the template for the
second round PCR. In the second round of PCR, specific PCR products were generated
with the nested primers Ds3R2 or Ds3R3 and Ds3F2 of Ds3F3 on the Ds 3’side. The
PCR condition was same as first round PCR but 36 cycles. The IPCR products were gel-
purified using Nucleospin Extract -Kit (MACHEREY-NAGEL) and sequenced.
2. 3. 13. 2. Adaptor-ligation PCR
Adaptor-ligation PCR procedure for isolation of the genomic DNA flanking Ds insertions
was same as mention above (2.3.13)but DraI and EcoRV were used to digest genomic
DNA, 2µl (10µM) AP1, 2µl (10µM) Ds3R1 and Ds5F1 were used for first round PCR on
the 3’ side and 5’ side of the Ds element, respectively, 2µl (10µM) AP2, 2 µl (10µM)
Ds3R2 and Ds5F2 were used for secondary PCR
Materials and Methods 42 ________________________________________________________________________
2. 3. 14. DNA sequencing
DNA sequences were determined by the Automatsche DNA Isolierung und
Sequenzierung /ADIS-Unit) in MPIZ on Applied Biosystems (Weiterstadt, Germany) Abi
Prism 377 and 3700 sequencers using Dig Dye-terminator chemistry (Sanger et al.,
1997). PCR products were purified with the nucleospin Extract -Kit (MACHEREY-
NAGEL) or GFXTM PCR DNA and Gel Band Purification Kit (Amersham Biosciences),
ensuring sufficient amount at appropriate concentration to be directly sequenced.
2. 3. 15. Mapping T-DNA insertion loci
2. 3. 15. 1 Chromosome mapping T-DNA insertion loci using wheat-barley
additional lines
The distribution of T-DNA insertions on barley chromosomes was determined by PCR
analysis of wheat-barley addition lines. PCR primers corresponding isolated and
sequenced genomic DNA flanking either the right border or the left border of the T-DNA
insertion site were designed. These primers were used to amplified the known sequence
in the parents of the wheat-barley addition lines (cv. Chinese Spring wheat and cv. Betzes
barley) as well as in the wheat lines carrying additional barley chromosomes. Due to the
difference of the PCR products between wheat and barley the barley chromosome in
which the T-DNA is inserted can be directly determined. This procedure also helps to
detect fragments which are repetitive or belong to gene families as they will be amplified
in multiple wheat-barley additions on different barley chromosomes. These fragments
cannot be mapped unambiguously and are therefore excluded from the more time
consuming genetic mapping by SSCP analysis.
2. 3. 15. 2. Mapping T-DNA insertion loci by SSCP analysis
SSCP analysis as described (Sentinelli et at., 2000). SSCP analysis was used to
genetically map T-DNA integration sites. In order to discover polymorphism between the
parents of mapping populations by SSCP analysis, primers corresponding genomic DNA

Materials and Methods 43 ________________________________________________________________________
flanking T-DNA insertion sites were used to carry out PCR reaction with genomic DNA
from the parents of the mapping populations. PCR products amplified from Dom and Rec
and Morex and Steptoe were digested with a range of restriction endonucleases which
recognize 4-base sequences: AluI, BstuI, HaeIII HhaI, HinfI, MseI, MspI, RsaI, Sau96I
ScrFI, TaqI, and Tsp509. PCR product were mixed with 1 µl buffer and 0.5µl (5-10
units/µl) restriction enzyme, respectively, in 10 µl reaction volume for 4 hours. Digested
PCR products were mixed with 15 µl loading buffer. The samples were heated at 94° C
for 3 min, placed on ice to stabilize single strands and then loaded on a 18 x 26 cm x 1
mm midi gel using MDE gel. Electrophoresis was performed in 0.6X TBE buffer and run
at room temperature at constant 1 W for 16 h. The gel was fixed with 10 % ETOH and
0.5% acetic acid for 3 min; silver stained with 0.2 % AgNO3, 10%ETOH and 0.5%
acetic acid for 5 min; washed with water for 2 min, developed with 3% NaOH and 0.1%
formaldehyde for 10 -20 min; fixed with 10 % ETOH and 0.5 % acetic acid for 5 min;
washed with H2O for 10 min. Once restriction enzymes which produce polymorphisms
between the parents of at least on of the DH mapping population were identified,
individual F2 progenies were analyzed.
2. 3. 16. Mapping Ds insertion sites
2. 3. 16. 1. Mapping Ds insertion sites by RFLP
Genomic DNA samples from the DH mapping populations were each digested with six
restriction enzymes (BamHI, DraI, EcoRI, EcoRV, HindIII, XbaI) and a Southern blot
was performed with these samples as described earlier. The following DH mapping
populations of Igri x Franka, Morex x Steptoe Oregon Wolfe Barley (OWB) Dom x Rec,
Galleon x Haruna Nijo, Chebec x Harrington Clipper x Sahara, and Sloop x Halcyon
were used to map Ds insertions. The membranes were hybridized with 32P labeled probes
generated using genomic DNA flanking single-copy Ds insertion site. The procedure
used for RFLP analysis is described in Kleinhofs et al (1993).
2. 3. 17. Linkage map construction Linkage map construction was performed using Mapmanager (Manly et al., 2001)

Materials and Methods 44 ________________________________________________________________________
2. 3. 18. Database searching
DNA sequences data of Ds and T-DNA flanking regions was used for database searches
in the following database
NCBI Blast: http://www.ncb.nlm.nil.gov/BLAST
Gramene: http://www.ncb.nlm.nil.gov/BLAST
GreenGene: http://www.ncb.nlm.nil.gov/BLAST )
IPK barley ESTs database: http://pgrc.ipk-gatersleben.de
TIGR gene indicies: http://tigrblast.tigr.org/tgi/

Results 45 ________________________________________________________________________
3. Results:
3.1. Generation of starter lines
3.1.1. Transformation with plasmid pWBV-Ds-Ubi-Bar-Ds
In order to obtain transgenic barley plants containing a single-copy of the Ds element, we
constructed the binary vector pWBV-Ds-Ubi-Bar (Fig. 1) containing the selectable
marker gene hygromycin phosphotrasferase (HPT) under control of the 35S promoter and
a modified Ds element carrying the Bar gene conferring resistance to phosphinothricin
(herbicide Basta) under control of maize ubiquitin1 promoter and first intron.
Figure 1: Linear map of the T-DNA region of plasmid pWBV-Ds-Ubi-Bar-Ds (not to
scale). The plasmid contains the selection marker gene HPT under control of the 35S
promoter and nos terminator. The 5’ and 3’ regions of the Ds element flank the selection
marker gene Bar under control of the ubiquitin promoter and first intron from maize and
nos terminator. HindIII is the unique restriction enzyme in T-DNA region. The hpt and
bar probes used for DNA hybridization analysis are indicated by a red bar.
171 putative independent transgenic lines were recovered via Agrobacterium-mediated
transformation from 537 immature embryos under selection with hygromycin (Tab. 3).
Southern blot analysis was performed to confirm the presence and copy number of the
HPT and Bar genes (Fig. 2A and 2B). Genomic DNA extracted from the regenerated T0
plants was digested with HindIII and hybridized to the probes made from internal coding
sequences of the HPT and Bar genes, respectively. HindIII cuts outside of the Ds element
and the other end of the restriction fragment is generated by a cut in the flanking genomic
DNA. The hybridization bands reflects integration pattern of T-DNA in the genome and
RB Nos HPT 35SP Ds3 Ubi Prom Intron1 Bar Nos Ds5 LB
Hin
dIII

Results 46 ________________________________________________________________________
provide an estimate for the copy number of the integrated transgenes. Out of 157 putative
independent transgenic lines analyzed, 155 lines contained the HPT gene while 145
showed the presence of the Bar gene. The number of hybridization bands varied from one
to four in different plants, and 81 (51%) independent lines exhibited a single
hybridization band for the bar gene indicating the presence of a single integrated
transgene. However, in a few cases single-copy HPT or Bar insertions may represent two
T-DNA integration at the same locus with inverted orientation and adjacent to the right
border of the T-DNA. The remaining 76 (49%) lines represented two to four copies of T-
DNA integration. Only two lines out of 159 lines analyzed turned out to be non-
transgenic (escapes). The average transformation frequency in the transformation
experiments was 28.%. Lines containing a single-copy of the Ds element were used as a
potential launch pad in the development of a population for targeted gene tagging.
Table 3. Summary of the number of independent transgenic plants
No. of immature embryos used 537
No. of putative transgenic lines recovered 171
No. of put No. of putative transgenic lines analyzed 157
No. of transgenic lines containing the HPT 155
No. of transgenic lines containing the Bar gene 145
No. of transgenic lines containing single-copy Bar gene 81
Efficiency of transformation 28%

Results 47 ________________________________________________________________________
1 2 3 4 5 6 7 8 9 10 11 12 13 14 15 16 17 18 19 20 21 22 23 24 25 26 27 28 29 30 31 32 33 34 35 36 37 381 2 3 4 5 6 7 8 9 10 11 12 13 14 15 16 17 18 19 20 21 22 23 24 25 26 27 28 29 30 31 32 33 34 35 36 37 38
A
B
Figure 2: Southern hybridization analysis of transgenic barley plants. Genomic DNA
(20 µg) from lines 1 to 38 was digested with HindIII, fractionated by 0.8% agarose gel,
transferred to Hybond-N+, and hybridized with 32P-labeled HPT probe (A) and Bar probe
(B). 26 of 38 lines may represent independent transgenic plants
3.1.2. Transformation with plasmid pWBVI-Ubi-DsI-Bar
We constructed a binary vector pWBVI-Ubi-DsI-Bar which carries two cleavage sites for
I-SceI in the Ds element and the T-DNA region (Fig. 3). I-SceI recognizes a very rare 18-
bp sequences, the expected frequency of cleavage site for I-SceI is less than one in the
barley genome. The physical distance of a Ds transpostion can directly be determined by
measuring the size of the DNA segment generated by digestion with I-SceI when Ds
elements transpose into genetically linked sites (Fig. 3). This will enable us to estimate
the number of plants needed to saturate a specific genomic region with independent Ds
1 2 3 4 5 6 7 8 9 10 11 12 13 14 15 16 17 18 19 20 21 22 23 24 25 26 27 28 29 30 31 32 33 34 35 36 37 38

Results 48 ________________________________________________________________________
insertions . Furthermore, transposition events can easily be detected by the restoration of
resistance against the herbicide Basta after excision of the Ds element.
Figure 3: Linear map of the T-DNA region of plasmid pWBV -Ubi-Ds-Bar (not to scale)
and the strategy for physical mapping Ds insertions. The plasmid contains the selection
marker gene hpt under control of 35S promoter and nos terminator. The Ds element and
T-DNA contain each a I -Scel I restriction enzyme site. The HPT and Bar probes used for
DNA hybridization analysis are indicated by a bar.
Three transformation experiments were carried out by Agrobacterium-mediated gene
transfer using construct pWBVI-Ubi-DsI-Bar. 149 putative independent transgenic lines
were obtained from 674 immature embryos. The integration of the transgene was
confirmed by Southern blot analysis (Fig. 4 A and B). The genomic DNA was digested
with either EcoRV and HindIII, respectively, which cut the respective sites near LB and
RB within T-DNA, and consecutively hybridized with the bar probe and HPT probe in
order to clearly identify single-copy insertions. Out of 143 transgenic lines analyzed, 119
lines contained the Bargene as confirmed by Southern blot analysis, and 50 lines (42%)
were determined to contain a single copy of the Bar gene (Table 4). The remaining lines
contained two to eight copies of the bar gene. The average transformation frequency was
EcoR
V
EcoR
V
I-Sc
eIH
indI
II
Hin
dIII
EcoR
V
I -Sc
eI
RB Nos HPT 35SP Ubi-Prom Ds BAR 35T LB
RB Nos HPT 35SP Ubi-Prom BAR 35T LB Ds
I-SceI I-SceIPhysical distance of Ds transposition
AcTPase
RB Nos HPT 35SP Ubi-Prom BAR 35T LB
I-SceI
Ds
I-SceIPhysical distance of Ds transposition
Probe1
Probe1
Probe2
Probe2
EcoR
V
EcoR
V
I-Sc
eIH
indI
II
Hin
dIII
EcoR
V
I -Sc
eI
RB Nos HPT 35SP Ubi-Prom Ds BAR 35T LB
RB Nos HPT 35SP Ubi-Prom BAR 35T LB Ds
I-SceI I-SceIPhysical distance of Ds transposition
AcTPase
RB Nos HPT 35SP Ubi-Prom BAR 35T LB
I-SceI
Ds
I-SceIPhysical distance of Ds transposition
Probe1
Probe1
Probe2
Probe2

Results 49 ________________________________________________________________________
19.3 %. Lines containing a single-copy of the Ds element were used as a potential launch
pad in the development of a population for targeted gene tagging.
Table 4. Summary of transgenic plants with pWBVI-Ubi-DsI-Bar
A
B
Figure 4: Southern hybridization analysis of transgenic barley plants. Genomic DNA
(20µg) from lines 1 to 37 was digested with HindIII (A) and EcoRV (B), fractionated by
0.8% agarose gel, transferred to Hybond-N+, and hybridized with 32P-labeled HPT and
Bar probes, respectively. Thirty-three out of 37 lines represent independent transgenic
plants containing the Bar gene.
No. of immature embryos used 676
No. of putative transgenic lines recovered 149
No. of putative transgenic lines analyzed 143
No. of transgenic lines containing the HPT 131
No. of transgenic lines containing the Bar gene 119
No. of transgenic lines containing single-copy Bar gene 55
Efficiency of transformation 19.3%
1 2 3 4 5 6 7 8 9 10 11 12 13 14 15 16 17 18 19 20 21 22 23 24 25 26 27 28 29 30 31 32 33 34 35 36 37

Results 50 ________________________________________________________________________
3. 2. Analysis of T-DNA integration in barley genomic DNA
In order to obtain insight into the mechanism of T-DNA integration into the barley
genome, analysis of junction sequences between the T-DNA borders and the genomic
DNA in the transgenic barley were carried out. To determine T-DNA/plant DNA
junctions at right and left borders, genomic regions flanking the T-DNA insertions were
amplified from 128 independent T-DNA lines transformed with either pWBV-Ds-Ubi-
Bar-Ds or pWBVI-Ubi-DsI-Bar were analyzed. For simplicity, only confirmed single-
copy transgenic lines were used in these studies. Flanking regions were isolated by
adaptor-ligation PCR, with nested primers located near the T-DNA borders and the
ligated adaptors (Fig. 5 and 6). The authenticity of junctions was confirmed by
sequencing of the PCR products. The presence of expected T-DNA border sequences
(Fig. 7) was indicative of correct PCR amplification.
A B
A
Figure 5: Isolation of genomic DNA flanking the right border and left border of the integrated
T-DNA by adaptor-ligation PCR. Sixteen single -copy T-DNA lines transformed with pWBV-Ds-
Ubi-Bar-Ds are numbered from one to 16. Genomic DNA samples were digested with either
EcoRV and ligated to the adaptors (AD). Two-step PCR reactions using combinations of two
nested primers were performed. (A): RBR1/AP1 and RBR2/AP2 were used to amplify genomic
DNA flanking RB, (B): Ds5F1/AP1 and Ds5F2/AP2 were used to amplify genomic DNA
flanking LB. M: 1 kb ladder (Invitrogen)
RB Nos HPT 35SP Ds Ubi-Prom BAR 35T Ds5 LB
RB1RB2
Ds5ADL1Ds5ADL2
ADAP1
AP2
ADAP2
AP1
RB Nos HPT 35SP Ds Ubi-Prom BAR 35T Ds5 LB
RB1RB2
Ds5ADL1Ds5ADL2
ADAP1
AP2
ADAP2
AP1
M 1 2 3 4 5 6 7 8 9 10 11 12 13 14 15 16M 1 2 3 4 5 6 7 8 9 10 11 12 13 14 15 16 M 1 2 3 4 5 6 7 8 9 10 11 12 13 14 15 16M 1 2 3 4 5 6 7 8 9 10 11 12 13 14 15 16

Results 51 ________________________________________________________________________
A
B
Figure 6: Isolation of genomic DNA flanking left border of T-DNA by adaptor-ligation
PCR method. Nine single-copy T-DNA lines transformed with pWBVI-Ubi-DsI-Bar are
numbered from 1A to 44B. Genomic DNA samples were digested with EcoRV (E) and
SspI (S), respectively, and ligated to the adaptors. Two-step PCR using combinations of
two nested primers were performed. (A): RBR1/AP1 and RBR2/AP2 were used to
amplify RB flanking sequences; (B): BarF1/AP1 and BarF2/AP2 were used to amplify
LB flanking sequences
1A 3A
9A
19B
21A
30A
37A
39A
44B
1A 3A
9A
19B
21A
30A
37A
39A
44B
EcoRV SspI
1A 3A
9A
19B
21A
30A
37A
39A
44B
1A 3A
9A
19B
21A
30A
37A
39A
44B
EcoRV SspI
E S E S E S E S E S E S E S E S E S1A 3A 9A 19B 21A 30A 37A 39A 44B
M E S E S E S E S E S E S E S E S E S1A 3A 9A 19B 21A 30A 37A 39A 44B
M
RB Nos HPT 35SP Ubi-Prom Ds BAR 35T LB
RB1RB2
BarF1BarF2
ADAP1
AP2
ADAP2
AP1
RB Nos HPT 35SP Ubi-Prom Ds BAR 35T LB
RB1RB2
BarF1BarF2
ADAP1
AP2
ADAP2
AP1
Results 52 ________________________________________________________________________
In total 64 fragments flanking the T-DNA RB and 55 fragments flanking the T-DNA LB
from 91 independent transgenic lines were isolated, sequenced and analyzed. Figure 7
shows the sequences at the junctions between RB and the flanking genomic region. In 24
events, junction points were observed between the third and fourth nucleotide (nt) of the
25 nt border sequence (Fig. 7A). This result was similar to previous observations that 29
out of 53 junctions in rice (Sung-Ryul Kim et al.,2003), 18 out of 27 in aspen ( Kumar et
al., 2002), and 3 out of 11 in bar ley (Stahl et al., 2002) were located between the third
and fourth nucleotide. This site is a known cleavage site for generating single-stranded T-
DNA fragments (Yanofsky et al., 1986; Stachel et al., 1987). In most of the remaining
plants, usually one to 28 nt were deleted from the RB cleavage site (Fig. 7A).
Unlike with the RB, only two cases (line 29-42A and 33-15A) were found in which the
correct cleavage site remained in the LB (Figure 7B). Among those 55 samples
examined, 53 retained a portion of the LB, while in the other samples one to 105 bp of T-
DNA were deleted at from the LB cleavage site (Fig. 7B).
Analysis of junction sequences of the T-DNA with the genomic DNA in transgenic
barley indicated that two types of integration could be distinguished based on the
sequences found at the junction regions.
In the first type flanking sequences consisted of genomic barley DNA. This was the case
for 58 of the right border and 53 of the left border sequences. In the second type, the
flanking sequence contained or consisted of RB linked to partial HPT coding sequences
(28-32A, 41-1A), and vector backbone sequence (40-22A), which could not be detected
by Southern blot analysis. This integration type is probably a consequence of re-
arrangements of more than one T-DNA copy during the integration process. Since the
results of Southern blot analysis did not indicate a second T-DNA copy, the majority of
the second T-DNA molecule was apparently not integrated during the rearrangement. In
line 28-22A, 29-37A, 33-38A, flanking sequences from RB had LB filler DNA (31 to 33
bp sequences). In line 41-1A, flanking sequences from the RB had 31 bp HPT filler

Results 53 ________________________________________________________________________
DNA. In line 40-32A and 40-44B, flanking sequences from LB had 21 bp unknown filler
DNA.
A
Line number T-DNA RB cleavage site Barley genome DNA
RB 25 bp repeat Vector GTTTCCCGCCTTCAGTTTAAACTATCAGTGTTTGACAGGATATATTGGCGGGTAAAC 28-8A GTTTCCCGCCTTCAGTTTAAACTATCAGTGTTTGACTGGATCCCAGCATTTTGGTCACAAAGAAAACCCTGGTGGAGGAATTAATCATGAGGTAAA
41-21A GTTTCCCGCCTTCAGTTTAAACTATCAGTGTTTGACGTATAATTCTTACAGAACTCTCCTCCCACTTCTGGCGACTCAGTGATACCTCCCCGGGCGG
40-50A GTTTCCCGCCTTCAGTTTAAACTATCAGTGTTTGACTGGCGAGTATATCTCTAAGATGTTGCTTGGTGTTCTTGCTGAGCAAGGGACTCTTTCT C
40-38A GTTTCCCGCCTTCAGTTTAAACTATCAGTGTTTGAAATTCTGCGCTTAGACAACTTAGACACTGTTTCAAGAAAGGCAAGGGCTAGAAGGGAT
40-32A GTTTCCCGCCTTCAGTTTAAACTATCAGTGTTTGAAACGTTCTCCGCTCATCAAGGGAAAACCAATGCAAGCTCAAGAGGTAGCAAGAAGTAT
40-21A GTTTCCCGCCTTCAGTTTAAACTATCAGTGTTTGAGGATGTTTTTCCATTTCTTTTTGGTAGGGTAGTACTGTATTATTATATACAGTACTTCAGGA
33-61A GTTTCCCGCCTTCAGTTTAAACTATCAGTGTTTGAACTATAAAGAGGCTAGCAATGGTGGAAGGTCAAAGTGCATCTATACCATGG
33-48A GTTTCCCGCCTTCAGTTTAAACTATCAGTGTTTGATGAAATCGACATTGCTGTCTGAGCATAAGATTCTACAGAGCTGCTAG
41-44B GTTTCCCGCCTTCAGTTTAAACTATCAGTGTTTGA TATTCAAATGAGAACTTTGAAGGCCGAAGAGGAGAAAGGTTCCAT GTGAACG
33-49A GTTTCCCGCCTTCAGTTTAAACTATCAGTGTTTGAAGCATCGACCGTGCTTCCTTGCCTTTGTTTACACAGCCATTGTCGCAATGCTGAAATCTTATCC
29-40A GTTTCCCGCCTTCAGTTTAAACTATCAGTGTTTGAGACCGAGGGAGCAGGTGTGGTGTATCGATCGGGGTATGTTGGCATGTTGTCGACCACCGGAAAT
29-26A GTTTCCCGCCTTCAGTTTAAACTATCAGTGTTTGATGGAAAAATAAGAGTCAGAACACGTCACCTTGGTTGAGCACATTCTTCGTTCATAGTCAGCACA
41-39A GTTTCCCGCCTTCAGTTTAAACTATCAGTGTTTGAATCCAACCAAAAAGCTAGGGAATTTTGGCATTTGAAACATGATTTTTGAATAATTG TTTATG
28-31A GTTTCCCGCCTTCAGTTTAAACTATCAGTGTTTGAAACGAGGCAAAATAGTTGCCCCCTTAATTAGAGGAAAACTAAGTGAAAACCGAGATTAC 28-23A GTTTCCCGCCTTCAGTTTAAACTATCAGTGTTTGAAAGTACATATTAATGTTTTAGGTTTGTTTAGAAATGAATGTATCTAAATACTAAAATATGACT 28-21A GTTTCCCGCCTTCAGTTTAAACTATCAGTGTTTGAACTCACGTCGCAGCCCCACCTAAGACTAATCAGAGAGGCCAGCCGCCGGCCCTAAATCCTAAG
28-7A GTTTCCCGCCTTCAGTTTAAACTATCAGTGTTTGAGTTGTGACACGGCAGAGCGAGAGGCGAGTCTTCGGGGAACTATTCAGGAGTCCACGGCACCAT
28-17A GTTTCCCGCCTTCAGTTTAAACTATCAGTGTTTGATTAGTCTATTGATTGTCATCCTTTGTGTGGCGGTCGGGATCACGCGATGGTTTATACCTACC
28-9A GTTTCCCGCCTTCAGTTTAAACTATCAGTGTTTGAGAATTTCTGATAGGTATATGTGGTTGACATATTGTGGATCAGAAGTAATGTAGAATTTCTGTAA
28-13A GTTTCCCGCCTTCAGTTTAAACTATCAGTGTTTGAGTTGTGACACGGCAGAGCGAGAGGCGAGTCTTCGGGGAACTATTCAGGAGTCCACGGCACCAT
28-51A GTTTCCCGCCTTCAGTTTAAACTATCAGTGTTTGAGCGAATCGCTACGCCTCTCCCCCACTGAATCGGTGCACTCGGCCTGAATTCGCTGCCTCTAGCC
39-29A GTTTCCCGCCTTCAGTTTAAACTATCAGTGTTTGATGCATGCTGTGATGTCTCTTATCGAATTA CCACTATCGTTTATGGGTTATGCATTAGAGACA
39-13A GTTTCCCGCCTTCAGTTTAAACTATCAGTGTTTGAGTCGACGTCAATTTCGACCCAAACAAGTAAAATTTGGGCTCGTGGGAACGTGACTGAATGAAA
28-32A GTTTCCCGCCTTCAGTTTAAACTATCAGTGTTTGAAGAAAACTAGAAATTTACCTGCAGACCATCGGGCAGTTCGGTTTCAGGCAGGTCTTGCAACGTG T-DNA (partial HPT sequence) 29-37A GTTTCCCGCCTTCAGTTTAAACTATCAGTGTTTGAATGGAAAGCTACCTCCCCGGGCGGCCGCTCGAGCCCTATAGTNAG TCGA
LB-Border 28-22A GTTTCCCGCCTTCAGTTTAAACTATCAGTGTTTGAATTCAATTTGTTTACACCACAATATATTCATCTTAAAAGCGGCAATGTATTCATCTTCATTTGT
LB-border 40-22A GTTTCCCGCCTTCAGTTTAAACTATCAGTGTTTGAAAAAGGAAAGTCTACACGAACCCTTTGGCAAAATCCTGTATATCGTGCGAAAAAGGATGGA
Vector backbone 33-25A GTTTCCCGCCTTCAGTTTAAACTATCAGTGTTTGCGTTGCAGATGACGCAGGAGGCAACGTACGGCCAGGTGTACAGCAACTAGCTCGGCGGCCGCA
39-19A GTTTCCCGCCTTCAGTTTAAACTATCAGTGTTTGTCATGTATATCGAAGCCACAAGATGGCTCTCCAACAGTTCATAAGACACTGTTTAAAAGGGCC
Figure 7: Sequences at junction regions between the T-DNA right border and barley genomic
DNA (A), and between the T-DNA left border and barley genomic DNA (B). T-DNA sequences
are presented in with RB and LB sequences in yellow shaded. T-DNA RB and LB repeat are
represented in red shaded. Filler DNA is represented in underlined italics in yellow shaded.
Barley DNA is presented in green shaded.
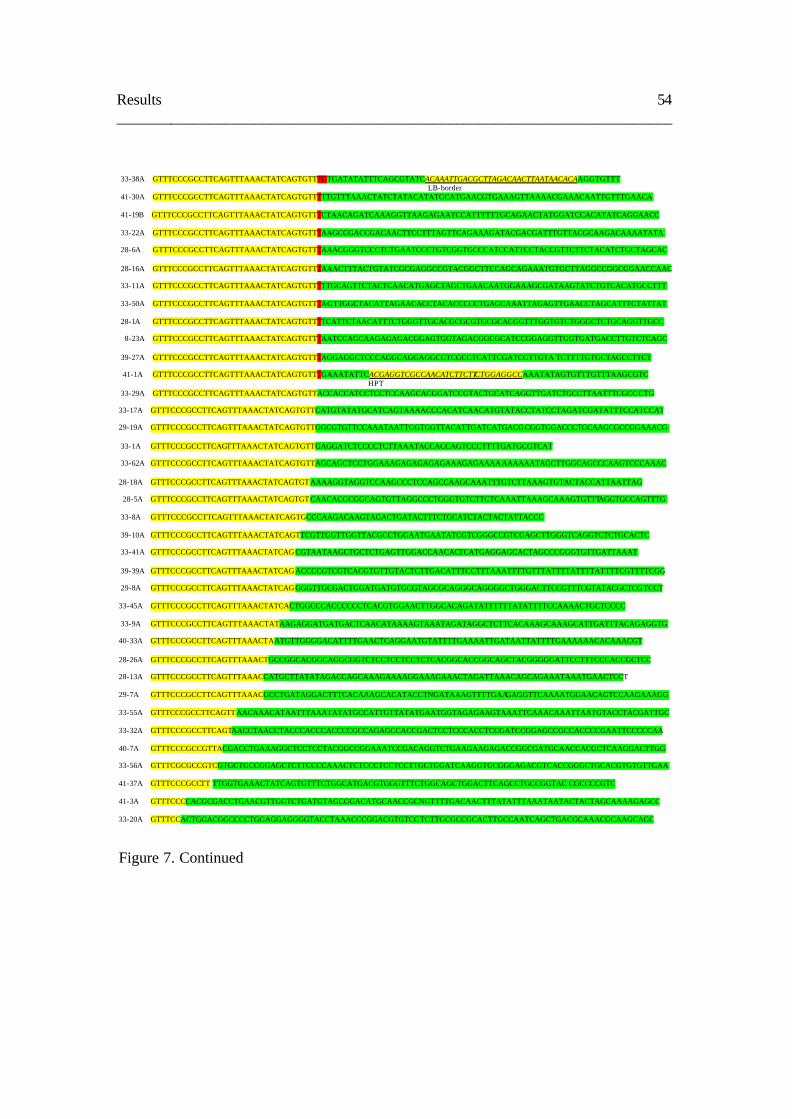
Results 54 ________________________________________________________________________
33-38A GTTTCCCGCCTTCAGTTTAAACTATCAGTGTTTGTGATATATTTCAGCGTATCACAAATTGACGCTTAGACAACTTAATAACACAAGGTGTTT LB-border
41-30A GTTTCCCGCCTTCAGTTTAAACTATCAGTGTTTTTGTTTAAACTATCTATACATATGCATGAACGTGAAAGTTAAAACGAAACAATTGTTTGAACA
41-19B GTTTCCCGCCTTCAGTTTAAACTATCAGTGTTTCTAACAGATCAAAGGTTAAGAGAATCCATTTTTTGCAGAACTATGGATCCACATATCAGGAACC
33-22A GTTTCCCGCCTTCAGTTTAAACTATCAGTGTTTAAGCCGACCGACAACTTCCTTTAGTTCAGAAAGATACGACGATTTGTTACGCAAGACAAAATATA
28-6A GTTTCCCGCCTTCAGTTTAAACTATCAGTGTTTAAACGGGTCCCTCTGAATCCCTGTCGGTGCCCATCCATTCCTACCGTTCTTCTACATCTGCTAGCAC
28-16A GTTTCCCGCCTTCAGTTTAAACTATCAGTGTTTAAACTTTACTGTATCGCGAGGCCGTACGGCTTCCAGCAGAAATGTGCTTAGGCCGGCGGAACCAAC
33-11A GTTTCCCGCCTTCAGTTTAAACTATCAGTGTTTTTGCAGTTCTACTCAACATGAGCTAGCTGAACAATGGAAAGCGATAAGTATCTGTCACATGCCTTT 33-50A GTTTCCCGCCTTCAGTTTAAACTATCAGTGTTTAGTTGGCTACATTAGAACACCTACACCCCCTGAGCAAATTAGAGTTGAACCTAGCATTTCTATTAT
28-1A GTTTCCCGCCTTCAGTTTAAACTATCAGTGTTTTCATTCTAACATTTCTGGGTTGCACGCGCGTGCGCACGGTTTGGTGTCTGGGCTCTGCAGGTTGCC
8-23A GTTTCCCGCCTTCAGTTTAAACTATCAGTGTTTAATCCAGCAAGAGAGACGGAGTGGTAGACGGCGCATCCGGAGGTTGGTGATGACCTTGTCTCAGC
39-27A GTTTCCCGCCTTCAGTTTAAACTATCAGTGTTTAGGAGGCTCCCAGGCAGGAGGCCTCGCCTCATTCGATCGTTGTA TCTTTTGTGCTAGCCTTCT
41-1A GTTTCCCGCCTTCAGTTTAAACTATCAGTGTTTGAAATATTCACGAGGTCGCCAACATCTTCTTCTGGAGGCCAAATATAGTGTTTGTTTAAGCGTC
HPT 33-29A GTTTCCCGCCTTCAGTTTAAACTATCAGTGTTACCACCATCCTCCTCCAAGCACGGATCCGTACTGCATCAGGTTGATCTGCCTTAATTTCGCCCTG
33-17A GTTTCCCGCCTTCAGTTTAAACTATCAGTGTTCATGTATATGCATCAGTAAAACCCACATCAACATGTATACCTATCCTAGATCGATATTTCCATCCAT
29-19A GTTTCCCGCCTTCAGTTTAAACTATCAGTGTTGGCGTGTTCCAAATAATTGGTGGTTACATTGATCATGACG CGGTGGACCCTGCAAGCGCCGGAAACG
33-1A GTTTCCCGCCTTCAGTTTAAACTATCAGTGTTGAGGATCTCCCCTCTTAAATACCACCAGTCCCTTTTGATGCGTCAT
33-62A GTTTCCCGCCTTCAGTTTAAACTATCAGTGTTAGCAGCTCCTGGAAAGAGAGAGAGAAAGAGAAAA AAAAAATAGCTTGGCAGCCCAAGTCCCAAAC
28-18A GTTTCCCGCCTTCAGTTTAAACTATCAGTGT AAAAGGTAGGTCCAAGCCCTCCAGCCAAGCAAATTTGTCTTAAAGTGTACTACCATTAATTAG
28-5A GTTTCCCGCCTTCAGTTTAAACTATCAGTGTCAACACGCGGCAGTGTTAGGCCCTGGGTGTCTTCTCAAATTAAAGCAAAGTGTTTAGGTGCCAGTTTG
33-8A GTTTCCCGCCTTCAGTTTAAACTATCAGTGCCCAAGACAAGTAGACTGATACTTTCTGCATCTACTACTATTACCC
39-10A GTTTCCCGCCTTCAGTTTAAACTATCAGTTCGTTGGTTGGTTACGCCTGGAATGAATATCGTCGGGCCGTCGAGCTTGGGTCAGGTCTCTGCACTC
33-41A GTTTCCCGCCTTCAGTTTAAACTATCAG CGTAATAAGCTGCTCTGAGTTGGACCAACACTCATGAGGAGCACTAGCCCGGGTGTTGATTAAAT
39-39A GTTTCCCGCCTTCAGTTTAAACTATCAG ACCCCGTCGTCACGTGTTGTACTCTTGACATTTCCTTTAAATTTTGTTTATTTTATTTTATTTTCGTTTTCGG
29-8A GTTTCCCGCCTTCAGTTTAAACTATCAG GGGTTGCGACTGGATGATGTGCGTAGCGCAGGGCAGGGGCTGGGACTTCCGTTTCGTATACGCTCGTCCT
33-45A GTTTCCCGCCTTCAGTTTAAACTATCACTGGCCCACCCCCCTCACGTGGAACTTGGCACAGATATTTTTTATATTTTCCAAAACTGCTCCCC
33-9A GTTTCCCGCCTTCAGTTTAAACTATAAGAGGATGATGACTCAACATAAAAGTAAATAGATAGGCTCTTCACAAAGCAAAGCATTGATTTACAGAGGTG
40-33A GTTTCCCGCCTTCAGTTTAAACTAATGTTGGGGACATTTTGAACTCAGGAATGTATTTTGAAAATTGATAATTATTTTGAAAAAACACAAACGT
28-26A GTTTCCCGCCTTCAGTTTAAACTGCCGGCACGGCAGGCGGTCTCCTCCTCCTCTCACGGCACCGGCAGCTACGGGGGATTCCTTTCCCACCGCTCC
28-13A GTTTCCCGCCTTCAGTTTAAACCATGCTTATATAGACCAGCAAAGAAAAGGAAAGAAACTAGATTAAACAGCAGAAATAAATGAACTCCT
29-7A GTTTCCCGCCTTCAGTTTAAACGCCTGATAGGACTTTCACAAAGCACATACCTNGATAAAGTTTTGAAGAGGTTCAAAATGGAACAGTCCAAGAAAGG 33-55A GTTTCCCGCCTTCAGTTAACAAACATAATTTAAATATATGCCATTGTTATATGAATGGTAGAGAAGTAAATTCAAACAAATTAATGTACCTACGATTGC
33-32A GTTTCCCGCCTTCAGTAACCTAACCTACCCACCCACCCCGCCAGAGCCACCGACTCCTCCCACCTCCGATCCGGAGCCGCCACCCCGAATTCCCCCAA
40-7A GTTTCCCGCCGTTACGACCTGAAAGGCTCCTCCTACGGCCGGAAATCCGACAGGTCTGAAGAAGAGACCGGCGATGCAACCACGCTCAAGGACTTGG
33-56A GTTTCGCGCCGTCGTGCTGCCGGAGCTCTTCCCCAAACTCTCCCTCCTCCTTGCTGGATCAAGGTGCGGGAGACGTCACCGGGCTGCACGTGTGTTGAA
41-37A GTTTCCCGCCTT TTGGTGAAACTATCAGTGTTTCTGGCATGACGTGGGTTTCTGGCAGCTGGACTTCAGCCTGCCGGTAC CGCCCCGTC
41-3A GTTTCCCCACGCGACCTGAACGTTGGTCTGATGTAGCGGACATGCAACCGCNGTTTTGACAACTTTATATTTAAATAATACTACTAGCAAAAGAGCC
33-20A GTTTCCACTGGACGGCCCCTGGAGGAGGGGTACCTAAACCCGGACGTGTCCTCTTGCGCCGCACTTGCCAATCAGCTGACGCAAACGCAAGCAGC
Figure 7. Continued

Results 55 ________________________________________________________________________
B
T-DNA lines T-DNA LB cleavage site Barley DNA
LB LB 25 bp repeat
Vector GTCCGCAATGTGTTATTAAGTTGTCTAAGCGTCAATTTGTTTACACCACAATATATCCTGCCA
29-42A GTCCGCAACGTGTTATTAAGTTGTCTAAGCGTCAATTTGTTTACACCACAATATATCCTGGGCTATCCCG ATGTACCACCGGTATTATGTAAGTGACGTC
33-15A GTCCGCAATGTGTTATTAAGTTGTCTAAGCGTCAATTTGTTTACACCACAATATATCCTGAGTTATGGATATGGTAATATTAGAGTTATGTTAGTAGGGT
28-52A GTCCGCAATGTGTTATTAAGTTGTCTAAGCGTCAATTTGTTTACACCACAATATATCCTATATTTTTCAACGACTACGAATGGGCAACGATAGAAGTCA
33-11A GTCCGCAATGTGTTATTAAGTTGTCTAAGCGTCAATTTGTTTACACCACAATATATCCTATATGAACAAGGCAATACAAATAAATGTACTGACACGGAC
40-32A GTCCGCAATGTGTTATTAAGTTGTCTAAGCGTCAATTTGTTTACACCACAATATATCCTCATCAAGGGAAAACCAATGCAAGCTCAAGAGGTAGCAAGAA
40-44B GTCCGCAATGTGTTATTAAGTTGTCTAAGCGTCAATTTGTTTACACCACAATATATCCTCATCAAGGGAAAACCAATGCATCACAAACTCATCTAGCTCAA
33-34A GTCCGCAATGTGTTATTAAGTTGTCTAAGCGTCAATTTGTTTACACCACAATATATCCTTTTAATGTATATCCTTTCAATCTCGTTTACCGGCAAGTTTCT
29-38A GTCCGCAATGTGTTATTAAGTTGTCTAAGCGTCAATTTGTTTACACCACAATATATCCATGGCCTCTCATTGATCTTGGGGCCACCGGGTCAGTACTCAG
28-35A GTCCGCAATGTGTTATTAAGTTGTCTAAGCGTCAATTTGTTTACACCACAATATATCCACTTCGGGAATCCGGAACCTTATACCAGAGCCAAAGTCTCG
29-40A GTCCGCAATGTGTTATTAAGTTGTCTAAGCGTCAATTTGTTTACACCACAATATATCCCCCCCAATTGCGTACCCGCGATCAGAAGGAGGACGATTTGT
33-9A GTCCGCAATGTGTTATTAAGTTGTCTAAGCGTCAATTTGTTTACACCACAATATATCATGAGGAGCGTCATTAAGGACCAGAGAGCACTATCGTCATTCT
33-42A GTCCGCAATGTGTTATTAAGTTGTCTAAGCGTCAATTTGTTTACACCACAATACATTAAAAACCTCTTTGTAGAATTCCTTTGTTTTTCCTGTGCTATCA
33-20A GTCCGCAATGTGTTATTAAGTTGTCTAAGCGTCAATTTGTTTACACCACAATATATACGTTCGATGACTTACACGTGACTGATAAACATAAAGAGAAA
29-17A GTCCGCAATGTGTTATTAAGTTGTCTAAGCGTCAATTTGTTTACACCACAATATATGGAAAAACGATATATGGATCCTACAGTGCAGATTTAAAGCGCT
39-19A GTCCGCAATGTGTTATTAAGTTGTCTAAGCGTCAATTTGTTTACACCACAATATAAGACAAGATGGCACAATATGAGATAAGCCATTCGCATACTCAA
29-7A GTCCGCAATGTGTTATTAAGTTGTCTAAGCGTCAATTTGTTTACACCACAATATACAGGGGCATACAGGGGCGGCCACCATGGCGGTGATTCTAGACTC
29-9A GTCCGCAATGTGTTATTAAGTTGTCTAAGCGTCAATTTGTTTACACCACAATATAAATCTAGTTGGCCAGACTATTTCAATAGATCACAGAGAAGTAA
40-26A GTCCGCAATGTGTTATTAAGTTGTCTAAGCGTCAATTTGTTTACACCACAATATACACCTTCTCGAGGATTGGAAAAGGCCGGCCGGGGTCCACCACG
28-12A GTCCGCAATGTGTTATTAAGTTGTCTAAGCGTCAATTTGTTTACACCACAATATGAAGACAGCAAACGCAAGGAAGTAACATATGAAGTGGGAGACC
29-11A GTCCGCAATGTGTTATTAAGTTGTCTAAGCGTCAATTTGTTTACACCACAATGGTTCCCAAGCATTCCCCCCATGAACCATCATGATCATGTCTCTTTATT
28-3A GTCCGCAATGTGTTATTAAGTTGTCTAAGCGTCAATTTGTTTACACCACAATTTTGGCCTGAAAGGGCGGGGGGAATTATCCACCCATGCCCTCACGC
28-9A GTCCGCAATGTGTTATTAAGTTGTCTAAGCGTCAATTTGTTTACACCACAATTTGGAAATACAAGTTTCTCATAAACCTTGTACAAACCCAAAATCTT
40-2A GTCCGCAATGTGTTATTAAGTTGTCTAAGCGTCAATTTGTTTACACCACAAGACCGGTTATGTTGAGACAACATAGGCGGAGTTATTTCAAAAAAGAA A
33-31A GTCCGCAATGTGTTATTAAGTTGTCTAAGCGTCAATTTGTTTACACCACTAGGGGTATTCCTTGATACTCATATTGCTAGAGTTACTACCAATGTTCGTG
29-19A GTCCGCAATGTGTTATTAAGTTGTCTAAGCGTCAATTTGTTTACACCCTTAAGGCTAGTCAGAACAGGCTCACATTGTCTACACATGTGAGCTTGCTGG 28-16A GTCCGCAATGTGTTATTAAGTTGTCTAAGCGTCAATTTGTTTACACCTCTCTTCTTCCCCATCCTCCACCATGAATCCAATCACTCGCTACGAGAAGG
33-58A GTCCGCAATGTGTTATTAAGTTGTCTAAGCGTCAATTTGTTTACACAAACCCACCATATGCCTTCCTCAAAACAGCCACCATACCTACCTACTATGGCAT
33-45A GTCCGCAATGTGTTATTAAGTTGTCTAAGCGTCAATTTGTTCACACTGCAATTGTATCTATGAAAGCTTCCAAGTCCCATGGACGAGGTTCATGAATAT
28-22A GTCCGCAATGTGTTATTAAGTTGTCTAAGCGTCAATTTGTTTACGAAAGAAGAATTAAGACAAAGTCTAACCATAGCATTAAACTAGTGGATCCAAA 40-38A GTCCGCAATGTGTTATTAAGTTGTCTAAGCGTCAATTTGTTTACCAATACCAATAGAACTAGTGCACTACTAGGAAAAACCTTATAGGCAGGACCTCA
29-34A GTCCGCAATGTGTTATTAAGTTGTCTAAGCGTCAATTTGTTTATTAAGATGATAAGCTGGTTTAAAGGACAAGATTGATAAGGACGAACCCCGGGGCCG
29-16A GTCCGCAATGTGTTATTAAGTTGTCTAAGCGTCAATTTGTTATGGGTCCCCTTCAATAAATACCACGCGGCCTCTCTCGAGAGGTTACAACGCTTTACCA
40-33A GTCCGCAATGTGTTATTAAGTTGTCTAAGCGTCAATTTGTTGCATCAAGCACTGACCCACTAGATACTGGGTT CTGAGAGTGCGGTGCTTGATATTTGG
33-38A GTCCGCAATGTGTTATTAAGTTGTCTAAGCGTCAATTTGTTCACAGGGCCTGCCAGGACTGGGGCTTCTTTCAGGTCAGTTCCTTGGCTGAAAGTTTCCA 33-48A GTCCGCAATGTGTTATTAAGTTGTCTAAGCGTCAATTTGTTGCCATCGGAGCATCCCAAGCTTGCAGGGCCAGCGAGTGCCTCCCTCCCATCCCATGTTT
33-56A GTCCGCAATGTGTTATTAAGTTGTCTAAACGTCAATTTGTGGTGTCGATGGAGAGACGAGGTCTCCCTGCAGGGCTTCGCCAAGCACCGTGGGAGAGG
40-28A GTCCGCAATGTGTTATTAAGTTGTCTAAGCGTCAATTTGTCATGGAGCATTTGAGATGTTCCAGGAGTTGGAGTTTATCTTTCAGAAGAACGCCCGGATC
28-32A GTCCGCAATGTGTTATTAAGTTGTCTAAGCGTCAATTTGTCAGCATTCTCTGGATCGACAAAACCTTTTGGTTGCATCACATACAACTCTTCCTTAAGG
Figure 7. continued

Results 56 ________________________________________________________________________
29-34A GTCCGCAATGTGTTATTAAGTTGTCTAAGCGTCAATTTGTTTATTAAGATGATAAGCTGGTTTAAAGGACAAGATTGATAAGGACGAACCCCGGGGCCG
29-16A GTCCGCAATGTGTTATTAAGTTGTCTAAGCGTCAATTTGTTATGGGTCCCCTTCAATAAATACCACGCGGCCTCTCTCGAGAGGTTACAACGCTTTACCA
40-33A GTCCGCAATGTGTTATTAAGTTGTCTAAGCGTCAATTTGTTGCATCAAGCACTGACCCACTAGATACTGGGTTCTGAGAGTGCGGTGCTTGATATTTGG
33-38A GTCCGCAATGTGTTATTAAGTTGTCTAAGCGTCAATTTGTTCACAGGGCCTGCCAGGACTGGGGCTTCTTTCAGGTCAGTTCCTTGGCTGAAAGTTTCCA
33-48A GTCCGCAATGTGTTATTAAGTTGTCTAAGCGTCAATTTGTTGCCATCGGAGCATCCCAAGCTTGCAGGGCCAGCGAGTGCCTCCCTCCCATCCCATGTTT
33-56A GTCCGCAATGTGTTATTAAGTTGTCTAAACGTCAATTTGTGGTGTCGATGGAGAGACGAGGTCTCCCTGCAGGGCTTCGCCAAGCACCGTGGGAGAGG
40-28A GTCCGCAATGTGTTATTAAGTTGTCTAAGCGTCAATTTGTCATGGAGCATTTGAGATGTTCCAGGAGTTGGAGTTTATCTTTCAGAAGAACGCCCGGATC
28-32A GTCCGCAATGTGTTATTAAGTTGTCTAAGCGTCAATTTGTCAGCATTCTCTGGATCGACAAAACCTTTTGGTTGCATCACATACAACTCTTCCTTAAGG
39-29A GTCCGCAATGTGTTATTAAGTTGTCTAAGCGTCAATTTGTCTACAGTAGTACGCGATCTTGTGAACCTACGAGGCTTGTAGTAACTTGATCCGATGCTC
33-8A GTCCGCAATGTGTTATTAAGTTGTCTAAGCGTCTATATGTATGATCATTGCCGTAGATACCTCCCCGGGCGCCGCTCGA
28-36A GTCCGCAATGTGTTATTAAGTTGTCTAAGCGTCAATTTGACAAGTTGGTATCGGATCAGGGTTTCCATGGGGTTTAAAATAGGACCAAAGCGGGGCACC
39-30A GTCCGCAATGTGTTATTAAGTTGTCTAAGCGTCAATTTGGTGGCTGGACTATTTTGGTGGCAAAAAAATCCCCTTTCTCGCCCCTCACTTCTATCATTAAT
29-25A GTCCGCAATGTGTTATTAAGTTGTCTAAGCGTCAATTTATTAACTGGAGCATGCGAGTAGTACTTTTCTTCGAGAGATATAATAAAACATTGCAATAAG
33-61A GTCCGCAACGTGTTATTAAGTCGTCTAAGCGTCAATTCGTTTACACCACAATATATTTAGAGGGTGCTTGGGTCACTAAAACTAGTCTGACTAAAACTA
40-21A GTCCGCAATGTGTTATTAAGTTGTCTAAGCGTCAATCACAGTTAGTGGCTATACAGTTTGTTGCATTGTTACAGCCGTACAGGCTTCCACTCGTACCAGG
28-34A GTCCGCAATGTGTTATTAAGTTGTCTAAGCGTCAA CCTGACATCGCGATGATGTCATAATAGGATTTTACTAAATCTTTTAAAACTGTTTTTAATTCTT
29-37A GTCCGCAATGTGTTATTAAGTTGTCTAAGCGTCAA GTTGTCCAAAATTAATAAATCCACCAGGTAGTTTGAAACAGAATTAATTCTACTCCGATCT
39-45B GTCCGCAATGTGTTATTAAGTTGTCTGATGGAGGCCTCTTCCGTCGTCGCGTGGGGCTGTTCCGGTGGGCCGCATGCTATCCTAGCCTGGCTATT
40-22A GTCCGCAATGTGTTATTAAGTTGTCTGATGGAGGCCTCTTCCGTCGTCGC
33-41A GTCCGCAATGTGTTATTAAATAGTTCAGAAGATTTGTTGATTTGAAGTTCTGCATGCACAAATTAGCGT TTCCATTCTCTTGCAGTTCACACCTCCATAT
9-26A GTCCGCAATGTGTTATTTGTTGTAGTTGATGTCCCCGTTGATTTCCCACCCGAAATTACTGGCGTCCTGCACTCGTCACACAAGTAACGAAAATAAGCAC
29-43A GTCCGCAATGTGTTATTTCCTATAGCTTTTTCAGGACCACTTGCATCATGTCCCGAAAAGGATACACCAGGACGTGCTGAGCCTGGAGGTGGAAATAA
33-25A GTCCGCCCGTCTAACACATAGGTAAACGTTTGTGGCCGTTCGGCCGGTCGTCGCACGTGACCCGCGCACACAGCTGAATTGGCATGTAATTTTTTTCGT 29-37A ATAAGCTGTCAAACATGAGAATTCAGTACATT ? 69 bp GCTACAGACTGGTCTGTTTTTGACAGATTTTGTTTTTGTTGCGTTGATGCTTATTTTGATGAA
29-22A GGCCGCATGCATGGCGCGCCAAGCTTAT ? 105 bp TAGTCATTAATTTTGGGTACCGCTGCGATCCGAACGTTTGAGGAACCACGGGGTCCGGTTACAT
Figure 7. Continued

Results 57 ________________________________________________________________________
3. 3. Analysis of T-DNA flanking sequences
Genomic DNA flanking the RB and/or the LB of the T-DNA was isolated by adaptor -
ligation PCR. The genomic sequences from 82 independent T-DNA lines were used to
carry out BLASTN search. From 22 lines both the RB and the LB flanking regions were
isolated. From 23 lines only the RB and from 37 lines only the LB flanking regions were
isolated. After removal of border sequences, a primary database of genomic sequences
flanking RB and/or LB from 82 independent lines with a total of 103 sequences was
generated. Comparison of the sequence data with NCBI, GrainGene and
GrameneGreenGene, Gramene databases showed that isolated genomic DNA flanking
the T-DNA from 39 lines (47%) was significantly homologous to cereal EST databases.
The flanking regions of 22 lines (26%) were identical to barley retrotransposons or other
highly repetitive genomic regions. The remaining 23 lines (27%) lines showed no
significant similarity to any ESTs in public databases based on a threshold level for the e-
value of 10-5 (for details, see table A in the appendix). Because the information about
genomic sequences for barley is very limited it is not possible to determine if these lines
carry the T-DNA insertion in intergenic regions or non-coding regions of gene sequences
(introns, 5’ upstream or 3’ downstream regions. The analysis of the T-DNA flanking
regions indicated that T-DNA preferentially inserted in coding regions of the barley
genome. An evaluation of T-DNA insertion frequencies within coding sequences versus
intergenic sequences or repetitive elements revealed that T-DNA integration is non-
random.
In 21 lines, genomic sequences flanking (28-9A1, 28-12A, 28-34A, 28-35A, 28-36A, 28-
52A, 29-7A, 29-19A, 29-26A, 33-9A, 33-20A, 33-25A, 33-41A, 33-45A, 33-56A, 33-
61A, 39-13A, 39-29A, 40-21A, 40-32A, 41-37A) were isolated from both the RB and the
LB. BLASTN search results from RB and LB flanking sequences showed complete
consistency of the flanking sequences in six cases (28-9A1, 28-34A2, 28-35A, 33-41A,
33-45A, 33-56A). Other lines had in most cases either no homology to cereal ESTs for
the right and left border , or homologous sequences were at least on one side of the T-

Results 58 ________________________________________________________________________
DNA very short making it difficult to identify consistent regions between the left border
and the right border.
3. 4. Analysis of Ds flanking sequences
To determine the Ds insertion sites of every independent line, a simple inverse PCR
(IPCR) was developed to amplify genomic DNA sequences flanking Ds insertion sites in
barley. Since the selection of restriction sites (not too close or not too far from the
insertion) is a critical factor for a successful iPCR. The restriction enzyme BstyI was used
to digest genomic DNA. Two nested primers corresponding to Ds3 or Ds5 regions, and to
the sequences close to the BstyI site within the Ds3–Ubi-Bar–Ds5 cassette were designed
to carry out two nested PCR reactions. BstyI greatly increase the probability of
amplifying the flanking regions. Fig. 8 shows typical secondary IPCR products from 18
independent single copy Ds insertions derived from original Ds containing starter lines
obtained via particle bombardment. The IPCR products were directly used for
sequencing.
Figure 8: Isolation of Ds flanking sequences by the IPCR method. 18 independent
single-copy Ds lines numbered from 1 to 24, respectively,. Visualization of the secondary
PCR reaction products was performed by electrophoresis on 1% agarose gel. Genomic
DNA was digested with BstyI and ligated. Two nested PCR using the combination of
primers of Ds3R1/Ds3F1, Ds3R2/Ds3F2 at Ds3 region were then performed. M: 1 kb
ladder (Invitrogen).
In order to amplify longer fragments flanking Ds insertion sites, a modified adapter-
ligation PCR has been developed in barley. Genomic DNA was digested with Dra I or
1 2 3 4 5 6 7 8 9 10 11 12 13 14 15 16 17 18M 1 2 3 4 5 6 7 8 9 10 11 12 13 14 15 16 17 18M

Results 59 ________________________________________________________________________
EcoRV, and then ligated to an adaptor. Two nested adaptor primers AP1 and AP2 and
Ds-element primers Ds3ALP1, Ds3ALP2, and Ds5ALP1, Ds5ALP2 are used to amplify
the flanking region surrounding Ds3 and Ds5 regions, respectively. Fig.9. shows the
secondary PCR fragments flanking Ds3 and Ds5 regions from 24 independent single-
copy Ds insertion lines.
A
B
Figure 9: Isolation of Ds flanking fragments from genomic DNA of 24 lines containing a
single copy of Ds insertion by adaptor-ligation PCR method. Visualization of the
secondary PCR reaction products was performed by electrophoresis on 1% agarose gel.
Ds inserted lines are numbered from A11 to C3. Genomic DNA samples were digested
with DraI and ligated to the adaptors. Two-step PCR using combinations of primers of
(A) Ds3R1/AP1, Ds3R2/AP2, and (B) Ds5F1/AP1, Ds5F2/AP2 were performed. Marker:
1 kb ladder (Invitrogen).
To test if the PCR-based methods for isolation of Ds flanking genomic barley sequences
are reliable, a primer adjacent to one end of genomic sequences flanking Ds3 or Ds5
region and Ds3 and Ds5 region primers were used to re-amplify Ds flanking sequences.
A11
A12
A13
A14
A15
A16
A17
A18
A19
A20
B1
B2
B3 B4
B5
B6
B7
B8
B9
B10
B11
C1
C2
C3
A11
A12
A13
A14
A15
A16
A17
A18
A19
A20
B1
B2
B3 B4
B5
B6
B7
B8
B9
B10
B11
C1
C2
C3
Ubi-Prom Bar NosDs3 Ds5AD AD
Ds5ALP1Ds5ALP2
AP1AP2Ds3ALP1
Ds3ALP2
AP2AP1
Ubi-Prom Bar NosDs3 Ds5AD AD
Ds5ALP1Ds5ALP2
AP1AP2Ds3ALP1
Ds3ALP2
AP2AP1
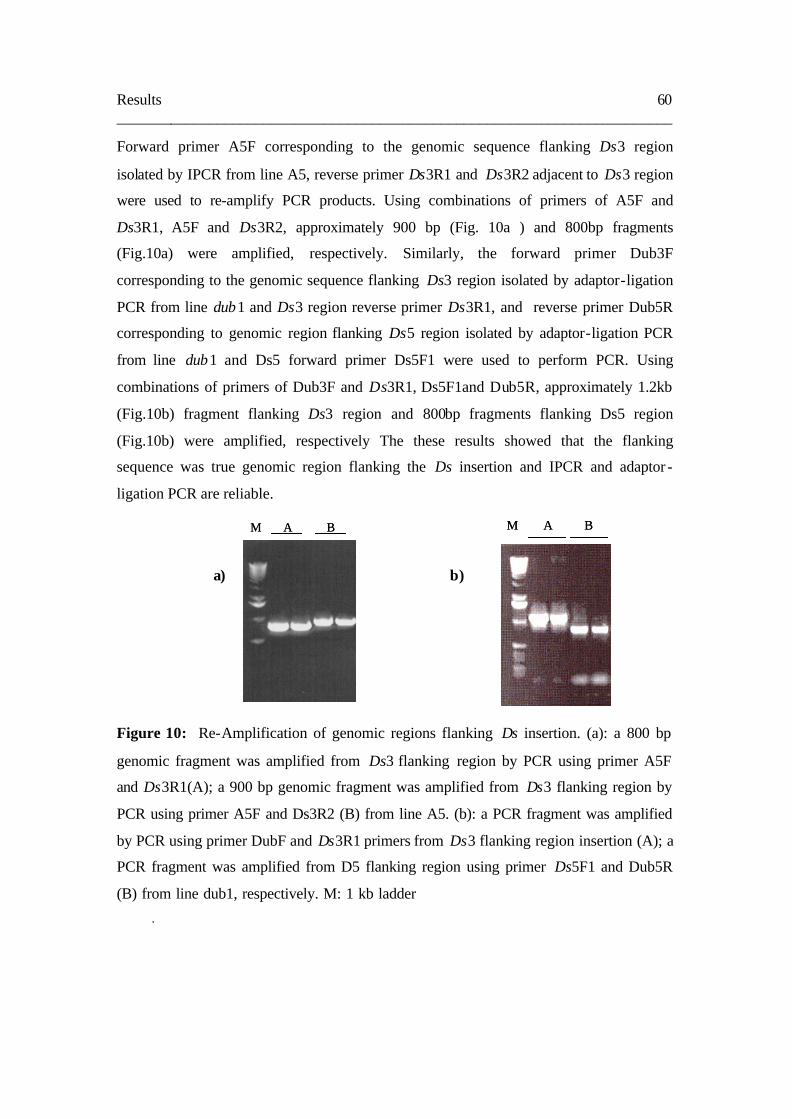
Results 60 ________________________________________________________________________
Forward primer A5F corresponding to the genomic sequence flanking Ds3 region
isolated by IPCR from line A5, reverse primer Ds3R1 and Ds3R2 adjacent to Ds3 region
were used to re-amplify PCR products. Using combinations of primers of A5F and
Ds3R1, A5F and Ds3R2, approximately 900 bp (Fig. 10a ) and 800bp fragments
(Fig.10a) were amplified, respectively. Similarly, the forward primer Dub3F
corresponding to the genomic sequence flanking Ds3 region isolated by adaptor-ligation
PCR from line dub1 and Ds3 region reverse primer Ds3R1, and reverse primer Dub5R
corresponding to genomic region flanking Ds5 region isolated by adaptor-ligation PCR
from line dub1 and Ds5 forward primer Ds5F1 were used to perform PCR. Using
combinations of primers of Dub3F and Ds3R1, Ds5F1and Dub5R, approximately 1.2kb
(Fig.10b) fragment flanking Ds3 region and 800bp fragments flanking Ds5 region
(Fig.10b) were amplified, respectively The these results showed that the flanking
sequence was true genomic region flanking the Ds insertion and IPCR and adaptor -
ligation PCR are reliable.
a) b)
Figure 10: Re-Amplification of genomic regions flanking Ds insertion. (a): a 800 bp
genomic fragment was amplified from Ds3 flanking region by PCR using primer A5F
and Ds3R1(A); a 900 bp genomic fragment was amplified from Ds3 flanking region by
PCR using primer A5F and Ds3R2 (B) from line A5. (b): a PCR fragment was amplified
by PCR using primer DubF and Ds3R1 primers from Ds3 flanking region insertion (A); a
PCR fragment was amplified from D5 flanking region using primer Ds5F1 and Dub5R
(B) from line dub1, respectively. M: 1 kb ladder
.
M A BM A B M A BM A B

Results 61 ________________________________________________________________________
Eighty-two stable, single copy Ds insertion lines were generated from the originally
available Ds starter lines obtained from particle bombardment as described by Koprek et
al (2000; 2001). Genomic DNA flanking Ds insertions from these lines has been isolated
and sequenced using inverse PCR and adaptor -ligation PCR. Out of 29 independent Ds
flanking sequences analyzed, 11 (37%) showed that the Ds flanking sequences are
significantly homology to ESTs from public Databases (Table 6) while the remaining 21
flanking sequences did not show significantly alignment to ESTs. These results support
the idea that in barley, as observed in the other heterologous plant systems such as
Arabidopsis (Tissier er al., 1999; Ito et.al., 2002) and rice (Greco et al. 2001; Kolesnik et
al 2004) the Ds element transposes preferentially into predicted gene coding regions.
Table 6. Example of Ds insertions with high sequence similarity to Genebank sequences
Ds lines Accession
number
Organism Blast homology (EST)
e-value
A1
A2
A3
A4
A5
A6
A7
A8
A9
A10
A11
A12
A13
A14
A15
CF308453
TC29838
CD979572
BJ232083
CB307665
AJ474919
Rice
Wheat
Maize
Wheat
Wheat
Barley
No good matches
Brought stress cDNA
No good matches
No good matches
Kinase R-like protein
Ear leaf cDNA
No good matches
No good matches
No good matches
No good matches
cDNA clone whe11a015’
HFIG650 Hessian fly
infested cDNA
cDNA clone
S0000800177G05F1
No good matches
No good matches
2e-09
1.6e-113
4.5e-06
7.4e-17
4.0e-18
9.5e-10

Results 62 ________________________________________________________________________
Table 6. continued
3. 5. Comparison of Ds and T-DNA insertion sites
The direct comparison of Ds and T-DNA insertion sites revealed characteristic features of
both insertional mutagens (Figure 11). A high percentage of the insertions were found in
single copy regions, whereas insertion in redundant or repetitive regions is lower than
expected from the frequency of repetitive regions in t he barley genome. Compared to the
occurrence of these regions in the barley genome, both the transposon and the T-DNA
show a preference for insertion in gene-containing genomic regions. Although the barley
genome consists for a large part of retrotransposons and other repetitive elements, these
elements where not as frequently found in Ds and T-DNA flanking sequences as
expected. Because the information about genomic DNA non-coding genomic DNA in
barley is limited, a high percentage of the Ds-flanking DNA could not be identified (Fig.
A17
A19
A20
B1
B3
B9
B10
B11
C1
C2
C3
C5
D3
D4
CB873151
TC259218
BQ659302
TC254255
CA639337
Barely
Wheat
Barley
Wheat
Wheat
No good matches
No good matches
Coleoptil tissue cDNA
No good matches
cDNA clone HD01C10 3-
PRIME
No good matches
No good matches
No good matches
cDNA clone
wre1n.pk0021.g3 5' end
No good matches
No good matches
No good matches
1.4e-70
1.9e-13
5.1e-11
1.8e-06
3.0e-61

Results 63 ________________________________________________________________________
11b). These regions could represent for example introns because many of the flanking
sequences contained at least small sequences of presumptive coding sequences further
upstream or downstream of the insertion site. A relative ly high percentage of Ds
insertions were found in presumptive 5’ regulatory regions whereas a majority of the T-
DNA appears to be inserted in presumptive 3’ regulatory regions (Fig. 11c).
The detailed analysis of the nucleotide composition of the genomic DNA directly
adjacent to the insertion site revealed no unusual patterns for Ds insertions (Fig12). For
T-DNA insertions, on the other hand an unusua lly high percentage of adenine residues
was found directly adjacent to the RB of the T-DNA. Normally, the percentage of
adenine is around 30% in the LB and RB flanking DNA. In the first nucleotide position
of the RB it was about 50%. Also in the second nucleotide position flanking the RB the
percentage of guanidine was exceptionally high. About 45% of all insertion sites
contained guanidine in the second nucleotide pos itions while the G-content is on average
at about 20%.
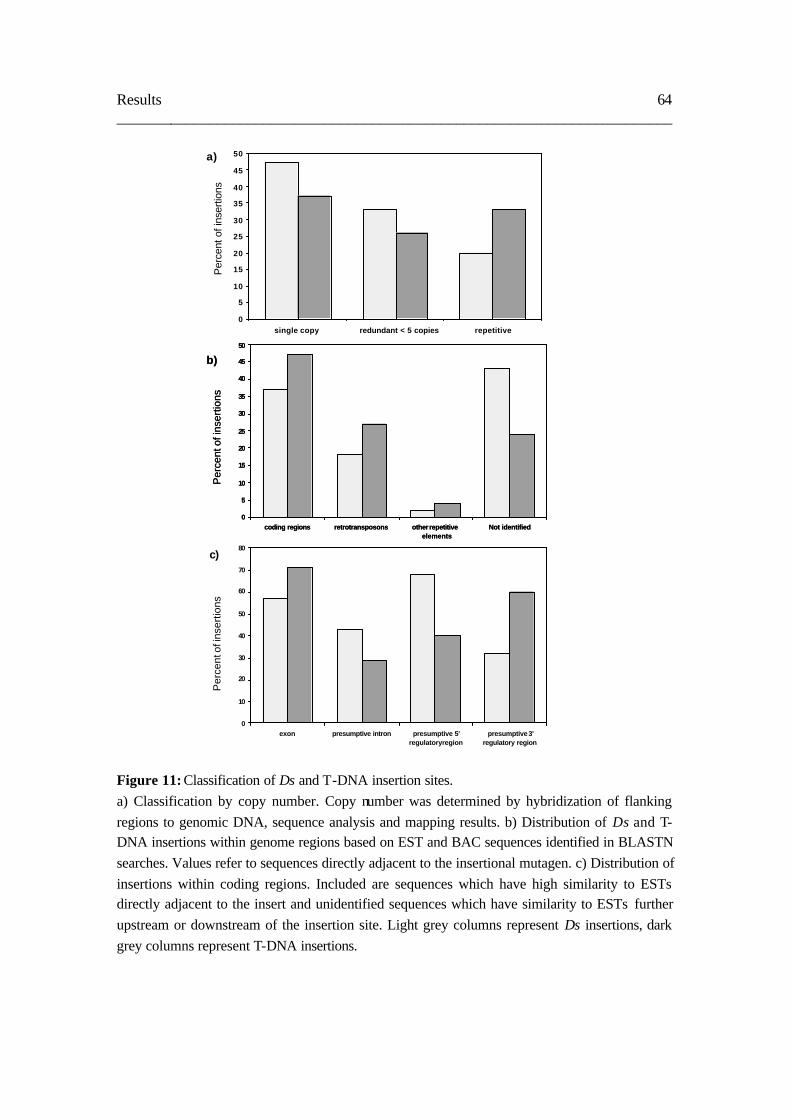
Results 64 ________________________________________________________________________
Figure 11: Classification of Ds and T-DNA insertion sites. a) Classification by copy number. Copy number was determined by hybridization of flanking regions to genomic DNA, sequence analysis and mapping results. b) Distribution of Ds and T-DNA insertions within genome regions based on EST and BAC sequences identified in BLASTN searches. Values refer to sequences directly adjacent to the insertional mutagen. c) Distribution of insertions within coding regions. Included are sequences which have high similarity to ESTs directly adjacent to the insert and unidentified sequences which have similarity to ESTs further upstream or downstream of the insertion site. Light grey columns represent Ds insertions, dark grey columns represent T-DNA insertions.
a)
0
5
10
15
20
25
30
35
40
45
50
single copy redundant < 5 copies repetitive
Per
cent
of i
nser
tions
Per
cent
of i
nser
tions
b)
0
5
10
15
20
25
30
35
40
45
50
coding regions retrotransposons other repetitiveelements
Not identified
Per
cent
of i
nser
tions
b)
0
5
10
15
20
25
30
35
40
45
50
coding regions retrotransposons other repetitiveelements
Not identified
Per
cent
of i
nser
tions
0
10
20
30
40
50
60
70
80
exon presumptive intron presumptive 5'regulatory region
presumptive 3'regulatory region
c)

Results 65 ________________________________________________________________________
Figure 12: Relative base composition of the H. vulgare DNA at Ds and T-DNA
insertion sites.
a) Nucleotide composition of LB and RB T-DNA flanking sequences. b) Nucleotide
composition of the 5’ and 3’ side of Ds insertion sites. c) Detailed nucleotide
composition 10 bp upstream and downstream of the T-DNA insertion site.
0
10
20
30
40
50
60
100 80 60 40 20 0 20 40 60 80 100
ISLB RB
Nuc
leot
ide
freq
uenc
y (%
)
ISLB RBISLB RB
Nuc
leot
ide
freq
uenc
y (%
)
ISDs 5‘ Ds 3‘
Nuc
leot
ide
freq
uenc
y (%
)
0
10
20
30
40
100 80 60 40 20 0 20 40 60 80 100
A
T
G
C
basepairs
ISDs 5‘ Ds 3‘
Nuc
leot
ide
freq
uenc
y (%
)
0
10
20
30
40
100 80 60 40 20 0 20 40 60 80 100
A
T
G
C
0
10
20
30
40
100 80 60 40 20 0 20 40 60 80 100
A
T
G
C
basepairs
0
10
20
30
40
50
60
10 9 8 7 6 5 4 3 2 1 0 1 2 3 4 5 6 7 8 9 10
Nuc
leot
ide
freq
uenc
y (%
)
basepairs
a)
b)
c)

Results 66 ________________________________________________________________________
3. 6. Mapping Ds launch pad T-DNA integration sites
The majority of Ds transpositions are within a few centi-Morgans of starting location,
therefore, use of an Ac/Ds system allows the targeting of a particular region of interest if
a linked starting point is available. To map the Ds launch pad T-DNA insertion sites, two
approaches were adopted based on DNA sequences flanking T-DNA insertion sites.
Wheat-barley addition lines and RFLP mapping populations were used for the mapping.
Using primers corresponding to genomic DNA flanking T-DNA line 33-48A, the PCR
fragments were amplified from genomic DNA in 2H addition line and barley. The result
indicated that the T-DNA distributed in chromosome 2H (Fig. 13 A). A PCR product was
amplified from only barley genomic DNA (Fig. 13B) using primers in genomic DNA
flanking T-DNA line 33-25A. The result suggested that the T-DNA might distribute in
chromosome 5H. However, the PCR products were amplified from 1H, 2H, 3H, 4H, 6H,
7H, barley and wheat in line 40-50A, and from 1H, 2H, 3H, 4H in line 33-15A (Fig. 13C
and D), respectively. In the case, T-DNA insertion sites can not be mapped. Using this
strategy, out of 57 T-DNA insertion sites analyzed, 33 T-DNA lines showed the PCR
products were amplified from one barley addition line or only from barley. Fig. 12A
showed the results: 2 from 1H (5.8 %), four from 2H (11.7%), 4 from 3H (11.7 %), 6
from 4H (20.5%), 16 (44%) from only barley, one from 6H (2.9%), respectively. Other
23 (40 %) T-DNA loci cannot be mapped because the PCR products were amplified from
more than two barley chromosomes (for details, see Table B in the appendix). In the
cases, genomic sequences flanking T-DNA may represent multi-gene families or
repetitive sequences.

Results 67 ________________________________________________________________________
Figure 13: Determination of the distribution of T-DNA insertion using wheat-barley
addition lines by PCR analysis. Primers based on the sequences flanking T-DNA were
designed to amplify PCR products. Lane 1, 2, 3, 4, 5, 6, 7, 8, represent wheat-barley
addition line 1H, 2H, 3H, 4H, 6H, 7H, barley (cv. Betzes) and wheat (cv. Chinese
Spring), respectively. A: a PCR product was amplified from 2H addition line in 33-48A.
B: a PCR product was amplified from only barely line in 33-25A. C: the PCR products
were amplified from 1H, 2H, 3H, 4H, 6H, 7H, barley and wheat in 40-50A. D: the PCR
products were amplified from 1H, 2H, 3H, 4H, addition lines and barley line in 33-15A.
M: 1kb DNA ladder (Invitrogen).
1H 2H 3H 4H 6H 7H B W 1H 2H 3H 4H 6H 7H B W
A
B
C D
B
M M1H 2H 3H 4H 6H 7H B W 1H 2H 3H 4H 6H 7H B W
A
B
C D
B
M M

Results 68 ________________________________________________________________________
Genetic mapping T-DNA insertion sites were performed using SSCP (single strain
conformation polymorphism) analysis based on RFLP mapping strategy. Primers
corresponding to genomic sequences flanking T-DNA, where PCR products were
amplified from only one of wheat-barley addition chromosome by PCR analysis using
wheat-barley additional lines, were used to screen for the polymorphisms between the
parents referencing DH mapping populations. In order to illustrate the mapping strategy,
an example of the mapping procedures for a SSCP analysis is presented. Figure 14
showed the polymorphisms from the digestion of the corresponding sequences from
alleles with a range of restriction endonucleases AluI, HaeIII, HhaI, MseI, MspI, RsaI,
TaqI, Sau96I, ScrFI, Tsp509, TaqI and BstuI from Dom and Rec in line 40-7A using
SSCP gel analysis.
Out of 33 analyzed, 16 genomic sequences generated from corresponding alleles from
Dom and Rec, or Mores and Steptoe showed the polymorphisms using SSCP analysis
(Table 7). The corresponding sequence was amplified from each member of the DH
mapping population, and digested with the appropriated restriction enzyme. Depending
upon the size of the DNA fragments the individual members of the appropriate mapping
population were assayed and scored for the polymorphisms on SSCP gels. The mapping
of T-DNA insertion in line 28-13 provides an example of the strategy. The PCR products
from each progenies of OWB DH mapping population were digested with BstuI and
polymorphism were scored using SSCP gel analysis. This gives a clear and easily scored
polymorphism, as shown for Dom, Rec, and 42 of the OWB DH lines (Fig. 15). Sixteen
T-DNA insertions were mapped in the OWB DH mapping population as well as More x
Steptoe DH mapping population (Fig. 16)

Results 69 ________________________________________________________________________
Figure 14: SSCP analysis of polymorphisms between the parents of DH mapping
populations. Primers based on the sequences flanking T-DNA from 40-7A were used to
identify polymorphisms in the sequences of the corresponding alleles from Dom (D) and
Rec (R). Restriction enzyme AluI, HaeIII, HhaI, MseI, MspI, RsaI, TaqI, Sau96I ScrFI,
Tsp509, TaqI and BstuI were used to digest PCR products from Dom and Rec.
D R D R D R D R D R D R D R D R D R D R D R D R
AluI HaeIII HhaI HinfI MseI MspI RsaI Sau96I ScrFI Tsp509 TaqI BstuI
D R D R D R D R D R D R D R D R D R D R D R D R
AluI HaeIII HhaI HinfI MseI MspI RsaI Sau96I ScrFI Tsp509 TaqI BstuI

Results 70 ________________________________________________________________________
Figure 15: SSCP analysis of polymorphisms in the OWB DH mapping population.
Primers based on the sequences flanking T-DNA from 28-13A were used to identify
polymorphisms in the each member of OWB DH mapping population. Restriction
enzyme BstuI was used to digest PCR products, lane 1 to 42 represent 42 members of the
mapping population, D: Dom, R: Rec.
1 2 3 4 5 6 7 8 9 10 11 12 13 14 15 16 17 18 19 20 21 22 23 24 25 26 27 28 29 30 31 32 33 34 35 36 37 38 39 40 41 42 D R1 2 3 4 5 6 7 8 9 10 11 12 13 14 15 16 17 18 19 20 21 22 23 24 25 26 27 28 29 30 31 32 33 34 35 36 37 38 39 40 41 42 D R

Results 71 ________________________________________________________________________
Table 7. Summery of the primer sequences and restriction endonucleases used to convert
RFLP marker into polymorphic T-DNA insertion sites
T-DNA
lines
primers sequences Polymorphism
detection
Parents of
mapping
population
28-13A CCTTGCACAGTGGACGAGTA
TGAGTTGTGACACGGCAGA
BstuI Dom and Rec
29-9A
CCATAATCATGCACATAAGA
ATCAC
CCCTCGAGGCTCTCCTAACT
AluI, MseI Dom and Rec
29-11A GATGTCACCCAATGTTGTGC
GGAATTGTGTTTGGCAATCC
AluI, HaeIII, HhaI,
MseI, Msp I, RsaI Dom and Rec
29-19A ACATGTGAGCTTGCTGGTTG
TGGGGGATGGTTAATGGTAG
AluI, HaeIII, HhaI,
MseI, Msp I, RsaI Dom and Rec
33-20A GAGGATAGGGTCGCATCTTG
CATTAAAAACGTCCGCAATGTG
MseI, Rsa I Dom and Rec
33-25A CACTCGCATCAAACCTCGTA
GTCCACGTACGCAAGACAATC
AluI, HaeIII, HhaI,
MseI, Msp I, RsaI Dom and Rec
33-29A ATCTAGAGGCCTTTTCCGACA
GATCCGTACTGCATCAGGTTG
MseI Dom and Rec
33-32A GCCATGTGATGTGATGCAGC
CCATGAGACCGTACAAGTTCG
AluI, HaeIII, HhaI,
HinfI, MseI, MspI,
RsaI
Dom and Rec
33-38A ATGAAGATCAGCATCCAGCAG
ACCGAACATGGCTTATTTACC
MseI Dom and Rec
33-42A ATCAAACACACTTCCAAATCCTG
ATCCATTTGTGTTTGCTGAGG
RsaI Dom and Rec
33-48A GAACTTTGGGGACGTGATTG
ATGCATCGTCTTCAGTGCATC
Sau96I Dom and Rec
33-56A GCCCTCCTTGGTCTTTTCTC
AGCTCTTCCCCTAACTCTCC
AluI, HaeIII, HhaI,
HinfI, MspI, RsaI, Dom and Rec
33-62A CCAAGTCCCAAACGTAGTCC
ATCGATCCATCGATGACCG
HhaI, Rsa I Dom and Rec
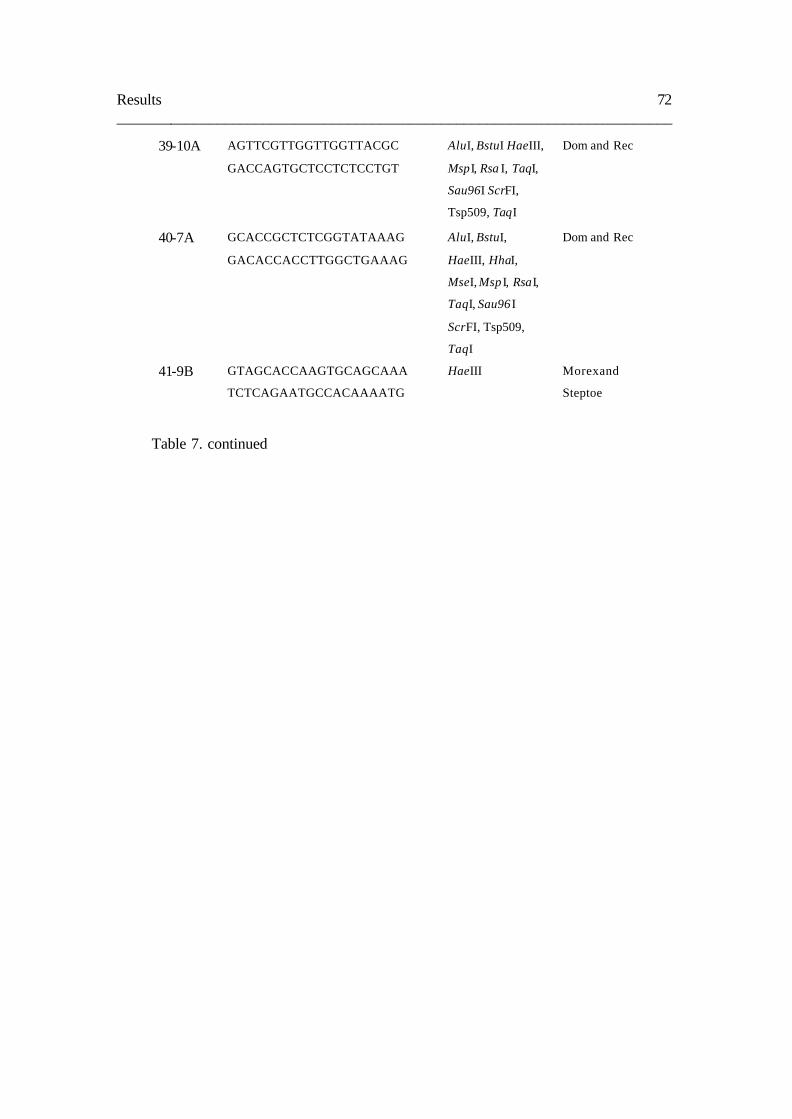
Results 72 ________________________________________________________________________
39-10A AGTTCGTTGGTTGGTTACGC
GACCAGTGCTCCTCTCCTGT
AluI, BstuI HaeIII,
MspI, Rsa I, TaqI,
Sau96I ScrFI,
Tsp509, TaqI
Dom and Rec
40-7A GCACCGCTCTCGGTATAAAG
GACACCACCTTGGCTGAAAG
AluI, BstuI,
HaeIII, HhaI,
MseI, Msp I, RsaI,
TaqI, Sau96 I
ScrFI, Tsp509,
TaqI
Dom and Rec
41-9B GTAGCACCAAGTGCAGCAAA
TCTCAGAATGCCACAAAATG
HaeIII Morex and
Steptoe
Table 7. continued

Results 73 ________________________________________________________________________
Figure 16: Positions of mapped Ds launch pad T-DNA insertions in Oregon Wolfe
Barley linkage and bin map. The map includes 16 mapped Ds launch pad T-DNA
insertions, as well as morphological markers, and centromeric regions. Distances are
given in Kosambi cM and are cumulative. T41-9B was mapped in the Steptoe and Mores
population.
T33-25A Bin 9-10
1H Bin
T33-25A Bin 9-10
1H Bin
T33-20A Bin 6-7
T33-42A Bin 10 -11
T33-56A Bin 7-8
6H Bin
T33-20A Bin 6-7
T33-42A Bin 10 -11
T33-56A Bin 7-8
6H Bin
T41 -9B Bin3-4
5H Bin
T41 -9B Bin3-4
5H Bin
T29-9A Bin 6-7T33-48A
T33-62A Bin 13
T40-7A Bin 14
2H Bin
T29-9A Bin 6-7T33-48A
T33-62A Bin 13
T40-7A Bin 14
2H Bin
T29-9A Bin 7-8
T33-29A Bin 14-15
T28-13A Bin 3-4
3H Bin
T29-9A Bin 7-8
T33-29A Bin 14-15
T28-13A Bin 3-4
3H Bin
T-33-38A Bin 13
T29A-11A Bin 8-9
T33-32A Bin 1
4H Bin
T39-10A Bin 3-4
T-33-38A Bin 13
T29A-11A Bin 8-9
T33-32A Bin 1
4H Bin
T39-10A Bin 3-4
7H Bin7H Bin
Results 74 ________________________________________________________________________
3. 7. Genetic mapping Ds insertion sites
Based on the ability of Ds to transpose preferentially to genetically linked sites, genes or
regions of interest in close vicinity to one of the mapped Ds elements can be targeted by
reactivating the Ds element by crossing with AcTransposase expressing lines. In order to
perform local mutagenesis, we genetically mapped independent Ds insertion sites in the
barley genome. Sequences flanking Ds elements were used as probes in RFLP mapping
analysis. In initial mapping experiments we used transposed Ds elements which were
derived from four different single-copy Ds starter lines (denominated DsA, DsB, DsC
and DsD). Using IPCR or adaptor -ligation PCR we obtained from 65 lines PCR products
as a single band which was large enough to be used as a hybridization probe in RFLP
mapping. Thirty-four of these PCR fragments showed a clear polymorphism in the
mapping populations used. The transposed Ds elements denoted DsD4 and DsB6 mapped
to two different loci. Currently, thirty-eight independent Ds insertion sites have been
mapped on the bin maps (Fig. 17) on all seven barley chromosomes by RFLP. DsA and
DsB were originally inserted in chromosome 6H and 4H, respectively. After re-
mobilization by crossing with AcTransposase expressing lines, five Ds insertions (A1,
A9, A10, A11, A12) (31.25%) of 16 Ds elements derived from DsA transposed into
genetically linked sites while out of 11 (68.75%) DsA elements, three DsA (A8, A14,
A16) transposed into chromosomes 2H; three DsA elements (A3, A6, A17) transposed
into chromosome 3H; DsA7 and DsA2 transposed into chromosome 1H and 4H,
respectively; four DsA (A5, A15, A19, A20) transposed into chromosome 5H. Three DsB
insertions (B2, B3) (22%) of 10 derived Ds elements transposed into genetically linked
sites on chromosome 4H; three DsB (B1, B5b, B7) transposed into chromosome 2H; two
DsB (B6a, B8) transposed into chromosome 3H; the remaining three DsB4b, DsB9 and
DsB6b transposed into chromosome 5H, 6H, and 7H, respectively. These results
demonstrated that Ds elements preferentially transposed into genetically linked sites and
are highly dispersed in the tagging population (Table 8). The number of mapped Ds
elements derived from DsC and DsD is too small to make statements about the linkage of
original and new insertion sites in these cases.

Results 75 ________________________________________________________________________
Table 8. Summary of distribution of genetically mapped Ds insertions
Ds insertions Chromosomal
distribution
DsA7 1H
DsA8, DsA14, DsA16, DsB1, DsB5b, DsB7,
DsC, DsC1, DsC5a, DsD4a
2H
DsA3, DsA6, DsA17, DsB6a, DsB8, DsC5a,
DsD
3H
DsA2, DsB, DsB2, DsB3 4H
DsA5, DsA15, DsA19, DsA20, DsC3, DsC4,
DsD4b
5H
DsA, DsA1, DsA9, DsA10, DsA11, DsA12,
DsB9
6H
DsB6b, DsD1 7H

Results 76 ________________________________________________________________________
Figure 17: Positions of mapped insertions in Oregon Wolfe Barley linkage and bin map.
The map includes 34 mapped Ds insertions, and as well as morphological markers, and
centromeric regions. Distances are given in Kosambi cM and are cumulative.
DsB6b Bin 1
DsD1 Bin 4-5
7H Bin
DsB6b Bin 1
DsD1 Bin 4-5
7H Bin
DsC5aDsD4a
DsA14
DsA16 Bin 11-12
DsC Bin 14-15DsC1
DsB7
Bin 1-2
Bin 10-11
DsA8 Bin 9-10
DsB1 Bin 5
2H Bin
DsB5b Bin 12-13
DsC5aDsD4a
DsA14
DsA16 Bin 11-12
DsC Bin 14-15DsC1
DsB7
Bin 1-2
Bin 10-11
DsA8 Bin 9-10
DsB1 Bin 5
2H Bin
DsB5b Bin 12-13
DsC5aDsD4a
DsA14
DsA16 Bin 11-12
DsC Bin 14-15DsC1
DsB7
Bin 1-2
Bin 10-11
DsA8 Bin 9-10
DsB1 Bin 5
2H Bin
DsB5b Bin 12-13
DsB8 Bin 4-5
DsC5b Bin 16DsB6a
DsA6 Bin 7-8
DsA3 Bin 13-14
3H Bin
DsD Bin 5-6
DsA17 Bin 15
DsB8 Bin 4-5
DsC5b Bin 16DsB6a
DsA6 Bin 7-8
DsA3 Bin 13-14
3H Bin
DsD Bin 5-6
DsA17 Bin 15DsB3 Bin 10-11
DsA2 Bin5-6
DsB2 Bin 8-10DsB
4H Bin
DsB3 Bin 10-11
DsA2 Bin5-6
DsB2 Bin 8-10DsB
4H Bin
DsA7
1H Bin
DsA7
1H Bin
DsA12 Bin 12-13DsB9 DsA1
6H Bin
DsA Bin 13-14DsA9DsA10DsA11
DsA12 Bin 12-13DsB9 DsA1
6H Bin
DsA Bin 13-14DsA9DsA10DsA11
DsC4 Bin 1
DsD4b Bin10-11DsA5
DsA19 Bin 11-12DsA20
DsC3 Bin 14-15DsA15
5H Bin
DsC4 Bin 1
DsD4b Bin10-11DsA5
DsA19 Bin 11-12DsA20
DsC3 Bin 14-15DsA15
5H Bin

Results 77 ________________________________________________________________________
3. 8. Ds excision and re -insertion
To assess the transposition efficiency of Ds elements in barley, single-copy Ds launch
pads containing pWBV-Ds-Ubi-Bar-Ds and pWBVI-Ubi-DsI-Bar were crossed with a
line expressing AcTransposase. To demonstrate excision of Ds element from the Ds
launch pads, PCR analysis was performed on F2 progeny. An empty donor 421 bp
fragment is amplified by PCR using the primers in the 35S promoter and left border when
the Ds element is excised from the lines transformed with pWBV-Ds-Ubi-Bar-Ds (Fig.
18B). Similarly, an empty donor 555 bp fragment (Fig. 19B) also amplified using the
primers in the maize ubiquitin1 promoter and Bar gene when Ds element is excised from
the lines transformed with pWBVI-Ubi-DsI-Bar while a 1200 bp fragment can be
amplified when Ds element stays at donor locus (Fig. 19A). In the lines transformed with
pWBV-Ds-Ubi-Bar-Ds, 17 of 20 independent F2 progenies showed Ds excision from
33% to 75%, the remaining three independent F2 progenies (28-10C, 28-15A, 33-32D)
did not showed Ds excision (Table 9). The average excision frequency of Ds element was
49.2%. In the lines transformed with pWBVI-Ubi-DsI-Bar, five of 6 independent F2
progenies gave rise to Ds excision from 71-75% and one F2 progeny (41-39A) did not
showed Ds excision (Table 10). In this study, the average excision frequency of Ds
element was 67.7% in the F2 progenies. Progeny from crosses with high transposition
frequencies were selected for large -scale mutagenesis.

Results 78 ________________________________________________________________________
A
B
C
Figure 18: Detection of excision of Ds in the leaves of F2 plants transformed with
pWBV-Ds-Ubi-Bar-Ds. A: Arrows represent primers corresponding to the 35S promoter
region and the T-DNA left border, respectively; B: An empty donor site (421bp) can be
amplified from F2 plants by PCR when the Ds element has been excised; C: 421 bp empty
donor sites were amplified from F2 plants of Ds line 28-25A and Ds line 28-26B. M: 1 kb
ladder (Invitrogen).
RB Nos Ubi-Prom Nos Ds5 LBHPT 35SP Ds3 Bar
Ubi-Prom Bar NosDs3 Ds 5RB Nos LBHPT 35SP
421 bp
Ubi-Prom Bar NosDs3 Ds 5Ubi-Prom Bar NosDs3 Ds 5RB Nos LBHPT 35SP
421 bp
RB Nos LBHPT 35SP
421 bp
M 1 2 3 4 5 6 7 8 9 10 11 12 1 2 3 4 5 6 7 8 9 10 11 12 Ds 28-25A Ds 28 – 26A
421 bp
M 1 2 3 4 5 6 7 8 9 10 11 12 1 2 3 4 5 6 7 8 9 10 11 12 Ds 28-25A Ds 28 – 26A
421 bp

Results 79 ________________________________________________________________________
Table 9. Frequency of Ds excision in the F2 progenies
Ds lines F2 plants tested
showing Ds
excision
No. of F2 plants showing
Ds excision
Frequency of Ds excision
28-1A 20 15 75
28-2A 19 11 57
28-9A 7 4 57
28-10C 21 0 0
28-15A 17 0 0
28-16A 17 8 47
28-24A 6 2 33
28-25A 29 14 48
28-26B 69 33 47
28-30C 21 12 57
28-40A 52 25 48
33-6B 25 9 36
33-8B 21 12 57
33-10A 4 2 50
33-14A 56 36 64
33-29A 35 21 60
33-32A 20 9 45
33-32D 17 0 0
33-48A 22 10 45
33-61A 35 22 57
Total 493 243 49.2

Results 80 ________________________________________________________________________
A
B
C
Figure 19: Detection of excision of Ds in the leaves of F2 plants transformed with
pWBVI-Ubi-DsI-Bar. A: Arrows represent primers corresponding to the maize
ubiquetin1 promoter region and the bar gene, respectively; B: An empty donor site (555
bp) can be amplified from F2 plants by PCR when the Ds element has been excised; C:
555 bp empty donor sites and 1200 bp donor sites were amplified from F2 plants of Ds
line 41-1A and 41-44B. M: 1 kb ladder (Invitrogen).
Table 10. Frequency of Ds excision in the F2 progenies
Ds lines F2 plants tested
showing Ds excision
No. of F2 plants showing
Ds excision
Frequency of Ds excision
41-1A 12 9 75
41-3A 25 18 72
41-21A 19 15 78
41-39A 8 0 0
41-44B 32 23 71
Total 96 65 67.7
RB Nos HPT 35SP Ubi-Prom Ds BAR 35T LB
1200 bp
RB Nos HPT 35SP Ubi-Prom Ds BAR 35T LB
1200 bp
RB Nos HPT 35SP Ubi-Prom BAR 35T LB Ds
555 bp
M 1 2 3 4 5 6 7 8 1 2 3 4 5 6 7 8 9 10 11 12 13 14 15
Ds 41-1A Ds 41-44B
555 bp
1200 bp
M 1 2 3 4 5 6 7 8 1 2 3 4 5 6 7 8 9 10 11 12 13 14 15
Ds 41-1A Ds 41-44B
555 bp
1200 bp

Results 81 ________________________________________________________________________
To demonstrate re-insertion of the Ds element, DNA gel-blot analysis was carried out on
F2 progeny (generated from a cross to a line containing AcTPase). This analysis detects
both intact Ds launch pads (non-excision Ds elements) and re-inserted Ds elements (Fig.
20). DNA gel-blot analysis indicated that hybridization fragments, corresponding to re-
inserted Ds elements, of various sizes (lanes 3, 4, 5, 6, 8, 9, 12) (Fig. 20). This
demonstrated the ability of Ds to excision and re-inserted into different genomic locations
in the independent lines. The hybr idization fragments corresponding to re-inserted Ds
elements demonstrated germinal excision events.
Figure 20: Southern blot analysis to detect Ds excision and re-insertion. Genomic DNA
from 12 independent F2 families from starter line 33-14A crossing with an Ac transposes
expressing line was digested with HindIII. A Ds5 probe was used to detect Ds excision
and re-insertion. S: starter line 33-14A, Excised and re-inserted Ds elements gave rise to
hybridizing bands of variable sizes, marked by triangles. Molecular size markers are
indicated in kb on the left.
23.1
9.4
6.5
4.3
2.3
2.0
0.5
S 1 2 3 4 5 6 7 8 9 10 11 1223.1
9.4
6.5
4.3
2.3
2.0
0.5
S 1 2 3 4 5 6 7 8 9 10 11 12

Results 82 ________________________________________________________________________
Discussion 83 ________________________________________________________________________
4. Discussion:
4.1. Generation of single-copy Ds-T-DNA launch pads by Agrobacterium-mediated
transformation
Transformation of barley is currently feasible using both biolistic (Wan and Lemaux,
1994) and Agrobacterium-based methods (Tingay et al., 1997; Horvath et al., 2000; Patel
et al., 2000; Trifonova et al., 2001; Matthews et al., 2001, Fang et al., 2002; Murray et al.,
2004). However, compared to the biolistic DNA transfer method, Agrobacterium-
mediated transformation offers several potential advantages that help to increase
transgene expression (Kohli et al., 1999). These include defined transgene integration,
low transgene copy numbers, integration of large intact DNA fragments, fewer
rearrangements within inserts and the integration into transcriptionally active regions of
the genome (Barakat et al., 2000), which increases transgene expression stability (Barakat
et al., 1997). Therefore, Agrobacterium-mediated transformation is a desirable method
for the transformation of barley and other grasses.
In this study, we have generated a large number of transgenic barley plants by
Agrobacterium-mediated transformation. The copy numbers of T-DNA insertions were in
the range from one to eight in transgenic barley plants. Approximately 50% of the
transgenic lines contain single-copy transgene. The average transformation efficiency
was 21% which was higher than the results reported in previous studies. Tingay et al.
(1997) reported a transformation frequency of 4.2%, Trifonova et al. (2001) reported
frequencies from 1.7% to 6.3%, Matthews et al. (2001) and Murray et al. (2004) reported
transformation frequencies of 2%-12% and 9.2%, respectively. The high transformation
frequency observed in our experiments is may be attributed to the optimization of growth
conditions of the donor plants, the concentration of the Agrobacteria inoculum and an
improved hygromycin selection system (Wang et al., 1997).
Although the expression of the selectable marker genes hpt and bar was not routinely
analyzed in all plants of the T1 and T2 generations it proved to be stable in those plants
were it was tested. This demonstrated the increased expression stability of the transgenes

Discussion 84 ________________________________________________________________________
compared to transgenic plants generated by particle bombardment (Kohli et al., 1999).
The reduction of transgene silencing effects is also of great importance for the application
of the transgenic plant lines for targeted gene tagging. It is in general a prerequisite of
transposon based gene tagging systems that both the transposase gene and the trans-
receptive and non-autonomous elements are not silenced. In different heterologous
transposon systems (Izawa et al., 1997; Chin et al., 1999) it has been observed that
autonomous as well as non-autonomous elements became silenced several generations
after introduction of the elements. Silencing of endogenous transposons has been
suggested as a mechanism to control transposon activity and to protect plants from
deleterious effects of frequent transpositions (Martienssen and Colot, 2001). In the
experiments described here, relatively high excision frequencies of the Ds elements have
been observed indicating full functional activity of the AcTPase gene and accessibility of
most Ds elements. In general, the primary transposition frequencies appeared to be higher
in the lines which were generated in these experiments compared to primary transposition
frequencies of comparable tagging systems in barley which were generated after particle
bombardment (Scholtz et al., 2001; Koprek et al., 2000).
Overall, our procedure of Agrobacterium-mediated transformation allows the production
of desirable transgenic barley plants with single copy integration of defined T-DNA in
large numbers. The transgenic lines proved to be more resistant to gene silencing
mechanisms.
4.2. Analysis of T-DNA border junctions with genomic DNA
The T-DNA integration patterns in barley chromosomes were studied. Generally three
nucleotides (TGA) of the right border repeat sequence are expected to be present at the
junction to the plant DNA. This site is a known cleavage site for generating single-
stranded T-DNA fragments (Yanofsky et al., 1986; Stachel et al., 1987). In 24 (37 %) of
64 RB flanking sequences examined the junction points were at this cleavage site. In the
remaining plants, one to 28 nucleotides were deleted downstream of the cleavage site.
This result is consistent with results from earlier barley experiments (Stahl et al. 2002).

Discussion 85 ________________________________________________________________________
The authors reported that three out of 11 RB contained the cleavage site and the
remaining eight sequences had deletions of between one and 30 nucleotides downstream
of the cleavage site. Similar observations have been made in rice (Sung-Ryul Kim et al.,
2003; Jeon et al., 2000) where 29 out of 53 junctions and 11 out of 32 RB junctions,
respectively were at the cleavage site. In aspen (Kumar et al., 2002) 18 out of 27 RB
junctions were at the cleavage site. Similar to dicots and rice, our results suggest that RB
was more conserved in the majority of the transgenic barley.
In contrast, LB junction sites were far less conserved. Among the 55 LB sequences
examined in this study, there were only two cases (3.7 %) where the LB cleavage site
remained. All other samples carried deletions of between 1-105 nucleotides from the LB
cleavage site. A very similar observation had been made by Stahl et al. (2002). They
found that only three out of 39 LB cleavage sites were conserved and contained the LB
cleavage site in barley. The deletions in the other 92% of analyzed sequences showed
deletions of between one to 95 nucleotides from the cleavage site. In Arabidopsis and
tobacco plants, Tinland (1996) found that three out of 15 LB cleavage sites were
conserved; the deletions were five to 109 nucleotides in length and one event had a 1500
bp deletion. In aspen, only four out of 20 LB cleavage sites remained, and deletions
ranged from two to 24 nucleotides (Kumar et al., 2002). In rice, among 61 LB sequences
analyzed (Kim et al., 2003) there were no cases where the LB cleavage site had remained
intact. Our results, based on a large sample size, were generally similar to those observed
with T-DNA junction in other plants, which suggests that T-DNA integration
mechanisms are comparable between monocot plants like barley and rice, and dicot
species.
Our analytical comparison of junction sites of T-DNA and barley genomic DNA presents
two distinct types of junction regions. In the first type of junction, T-DNA and barley
genomic sequences are directly linked. Fifty-eight flanking sequences out of 64 RB
sequences and 53 flanking sequences out of 55 LB sequences (84%) belong to the type.
No homology was found between these sequences and the sequences from the transfer
vectors pWBV-Ds-Ubi-Bar or pWBVI-Ubi-DsI-Bar. In research on rice, T-DNA and rice

Discussion 86 ________________________________________________________________________
genomic sequences from 21 out of 53 RB and three out of 61 LB are directly linked,
without any filler DNA and overlaps (Kim et al., 2003). This type is commonly found in
junctions between the T-DNA RB and plant DNA. Therefore, it could be postulated that
the T-DNA integration complex or individual components thereof may play a critical role
during the integration process and determine the integration structure. The VirD2 protein
which is attached to the T-DNA RB sequence may contribute to the synapsis of T-DNA
and plant chromosomal DNA (Rossi et al., 1996, Mysore et al., 1998). Our data showed
that this type of integration was not more frequent at the RB than at the LB. The observed
frequencies of T-DNA borders immediately adjacent to genomic DNA may in fact be a
little lower than calculated due to filler DNA sequences which were mostly very short
and the origin of these sequences could not be determined in barley.
In the second type of junction the flanking sequences had a more complicated structure.
In this study, two flanking sequences from RB contained HPT and vector backbone
sequences. Unlike the RB, no cases of this integration type were found for sequences
adjacent to the LB. In four lines the flanking sequences of the RB contained filler DNA
which consisted of short LB and HPT sequences (31-33 bp LB sequences and a 31 bp
HPT sequences) at the junction sites between T-DNA and barley genomic DNA. In rice,
17 out of 53 flanking sequences had filler DNA at the junction positions at the RB and 18
out of 63 flanking sequences had filler DNA of unknown origin between the LB and the
rice genomic sequences (Sung-Ryul Kim et al., 2003). Because the identified filler DNA
is normally very short (1-22 bp), it is usually difficult to deduce its origin. In aspen, filler
DNA arose either from the host genome or from the T-DNA (Kumar et al., 2002). In
Arabidopsis, 10 out of 23 junctions at RB had filler DNA ranging from 1 to 51 bp.
Similar results were obtained for LB junctions: 17 out of 44 junctions had filler DNA
ranging from 1 up 48 bp (Windels et al., 2003). However, in our case, it is difficult to
identify filler DNA which originates from either short T-DNA sequences or barley
genomic DNA without comparing the junction sequences with the receptive barley
genomic DNA sequences at junction sites between T-DNA and genomic DNA. Filler
DNA may serve to facilitate T-DNA integration into plant chromosomes (Windels et al.,
2003). The analysis of the nucleotide composition of the flanking genomic DNA directly

Discussion 87 ________________________________________________________________________
adjacent to the right border of the T-DNA insertion site showed a significant
overrepresentation of A (adenine) residues (50%) in the first nucleotide position and of G
(guanidine) residues (45%) in the second position. Brumaud et al. (2002) reported a 2-3
base pair long DNA duplex which preferentially includes a G close to the right end of the
T-DNA. They found that in Arabidopsis the nucleotides C, A and G are overrepresented
in the positions 1-3. Although we did not observe a frequently occurring C in the first
position flanking the T-DNA right border, the high percentage of A and G in the barley
lines hints at a possible role of these nucleotide sequence in the T-DNA integration
process. Based on the analysis of 91 independent transgenic lines, our results suggest
that the T-DNA integration in barley follows the same mechanism as in rice and dicot
plants.
4.3. Analysis of genomic DNA flanking T-DNA insertions
Using adaptor-ligation PCR, genomic DNA flanking T-DNA insertion sites were isolated
from RB and/or LB from eighty-one single-copy T-DNA lines. BLASTN search results
indicated that 47% T-DNA flanking genomic regions was significantly homologous
cereal ESTs. It has been estimated that only 12% of the barley genome is occupied by
gene -containing regions (Barakat et al., 1997). On the other hand, only 26% of the
genomic regions flanking T-DNA insertions were identical to barley retrotransposons or
other highly repetitive genomic regions. Repetitive DNA or retrotransposons can account
for over 70% of the barley genome (Bennetzen et al., 1998; Ramakrishna et al., 2002).
These results strongly suggest that T-DNA insertions are non-randomly distributed in the
barley genome. Instead, there is a strong bias of T-DNA to insert in genic regions and to
evade insertion in repetitive regions.
Studies of T-DNA insertions in Arabidopsis suggest a largely random nature of T-DNA
insertion distribution throughout all five Arabidopsis chromosomes (Alonso e al., 2003;
Forsbach, et al., 2003; Qin et al., 2003). The small Arabidopsis genome, however consists
of 85% gene-rich regions (Barakat et al., 1998). Therefore, a certain preference for T-
DNA insertion regions can be obscured. Only the analysis of large sets of T-DNA
Discussion 88 ________________________________________________________________________
insertion sites can help to discover insertion site preferences. The analysis of 1000 T-
DNA insertion sites in Arabidopsis has indicated that the majority of T-DNA land in
chromosomal domains of high gene density and that the frequency in insertions is higher
in the 5’- and 3’- regulatory regions (Szabados et al., 2002). In a recent study
bioinformatics tools have been used to analyze the T-DNA integration sites from about
19.000 Arabidopsis insertion lines (Pan et al., 2005). The results confirmed earlier
observations and demonstrated clearly an overrepresentation of T-DNA insertions in 5’ -
and 3’- regulatory regions of gene -rich genomic areas. The analysis of 3793 T-DNA
flanking sequences in rice showed that 48.7% of the T-DNA was integrated into genic
regions (An et al., 2003). These results and our own data support the idea that T-DNA
insertion site preference in monocots is very similar to dicots.
In comparison to the Arabidopsis genome, barley has large non-coding regions
interspersed with gene-rich regions. The observed preference of T-DNA to insert into
gene -containing regions has important implications for the targeted gene tagging strategy.
Preselection of genic regions reduces the number of T-DNA lines which are necessary for
a sufficient coverage of the barley genome with Ds launch pads. Furthermore, the Ds
launch pads are in places from which activation of the transposon promises higher
frequencies of Ds-tagged genes. Compared to random integration of Ds launch pads after
particle bombardment or similar direct transformation methods the use of T-DNA
promises a more successful transposon tagging system.
4. 4. Analysis of Ds flanking sequences
In this study, our BLAST search showed 37 % of Ds insertions shared significant
homology to cereal ESTs, which may represent the predicated coding region of the barley
genome. Ac/Ds has been shown to transpose preferentially into gene coding regions in
Arabidopsis (Parinov et al., 1999; Raina et al., 2002; Kuromori et al., 2004) and rice
(Enoki et al., 1999; Greco et al., 2001; Kolesnik et al., 2004). In Arabidopsis, out of about
11.000 Ds insertion line analyzed in detail, 46% of the insertions were in known or
assumed protein-coding region (Kuromori et al., 2004). In T-DNA lines, 30-35% of

Discussion 89 ________________________________________________________________________
insertions were mapped to transcription regions (Sessions et al., 2002; Szabados et al.,
2002). The results indicated that Ds lines have a higher rate of insertion into coding
region than T-DNA lines. The preference of the T-DNA to insert in upstream and
downstream regulatory regions of predicated coding domains in Arabidopsis has been
discussed above. T-DNA insertions in these regions are two to three times more frequent
than those in coding regions (Szabados et al., 2002). In contrast, analysis of the insertion
positions within genes demonstrated that Ds transposed equally into exons and introns
and there no preference toward the 5’ end of the gene as described in Arabidopsis
(Parinov et al., 1999). A similar Ds distribution has been reported in large scale analyses
(Kuromori et al., 2004; Pan et al., 2005). Moreover, in maize, a majority of Ac insertions
occurred at the middle of the gene (75% were in exons) and no bias was observed near
the ATG start condon (Cowperthwaite et al., 2002). Analysis of 2057 Ds flanking
sequences in rice (Kuromori et al., 2004) showed that 35% of Ds insertions shared
significant homology to proteins and rice ESTs. Furthermore, a detailed analysis of 200
Ds insertion positions on chromosome 1 (almost completely annotated) revealed that
72% of the insertions were in the genic region. It seems that the Ac/Ds transposon-
tagging system is better than the T-DNA tagging system for efficient isolation of gene
knockout mutants with a molecular tag in exons.
Ac/Ds tagging systems can make basically single insertion, which mostly contain a
single-transposed element (Fedoroff et al., 1993; Martienssen 1998; Sundaresan et al.,
1995). This would be suitable for reverse genetic analysis of disrupted genes. The tagging
rate for transposon tagging lines is likely to be higher than that for T-DNA insertion lines.
Furthermore, the Ds transposon is mainly inserted in or close to coding regions in the
genome at a rate higher than that for T-DNA tagging lines. Therefore, Ds tagging lines
might be more advantageous for systematic analysis of phenotypes of each tagged line
with single insertions in genes.
Discussion 90 ________________________________________________________________________
4. 5. Distribution of T-DNA insertions in the barley genome
To determine the distribution of T-DNA insertions in the barley genome, wheat-barley
addition lines were screened by PCR analysis using primers-specific genome regions
flanking T-DNA insertions. For the 57 lines analyzed in this study, 17 T-DNA insertion
sites distributed on five barley chromosomes (1H, 2H, 3H, 4H, and 6H). For the 16 T-
DNA lines the distribution of T-DNA can not be determined because the PCR products
were only generated from barley rather than from wheat barley addition lines. However,
based on our results, a non-random distribution of T-DNA in barley genome was
observed in this study. The results suggest that the distribution of T-DNA integration
sites was preferentially in 2H (11.7%), 3H (11.7%), 4H (20.5%). The remaining 23 lines
could not be mapped because the PCR products were amplified from two to seven barley
chromosomes. In these cases, genomic DNA flanking T-DNA insertion sites may
represent multi-gene families or repetitive sequences. For eleven lines, genomic DNA
sequences flanking the T-DNA insertion sites showed significant similarity to barley
repetitive sequences, which is consistent with the results from PCR analysis using wheat-
barley addition lines. In general, the use of wheat-barley addition lines proved to be a
helpful tool for the identification of chromosomes carrying a T-DNA insertion.
Salvo-Garrido et. al. (2004) analyzed 19 transgenic lines in barley using combined
physical and genetic mapping of transgenes. The authors observed transgene integration
sites on five of the barley chromosomes, 2H, 3H, 4H, 5H, and 6H. In addition, there
appeared to be specific regions on chromosomes 4H and 5H where transgene insertions
were clustered. In rice, T-DNA insertion density is higher in four chromosomes (i.e. 1, 2,
3, and 6) but lower in three chromosomes (9, 10 and 12) when compared with the other
chromosomes (Sallaud et al. 2004). Similar patterns in rice have been observed by other
groups (An et al., 2003). The authors observed T-DNA insertion density was higher in
chromosomes 1, 4 and 10, and T-DNA insertions were not evenly distributed on the
chromosome, with integration frequencies being lower near the centromere and higher in
the distal regions, where gene dens ity was high. These results support the conclusion that
transgenes may not randomly integrate in the genome of cereals.

Discussion 91 ________________________________________________________________________
Based on our results, the genetic location of T-DNA insertions appears to be not evenly
distributed on the chromosomes. However, the number of mapped insertion sites is still to
low to make final conclusions.
For the first time, we used the single-stranded conformation polymorphism (SSCP)
analysis approach for sequences-based RFLP mapping of T-DNA insertion sites in
barley. Based on our results, this technique is a simple and powerful tool for detection of
polymorphisms in DNA fragments in barley. Using this technique, 16 T-DNA insertion
sites were genetically mapped on barley chromosomes. SSCP analysis has been used
successfully as a genetic mapping tool in mouse (Beier et al., 1992, 1993). This PCR-
based method takes advantage of the observation that the migration pattern of a short,
single-stranded DNA fragment under non-denaturing conditions is sensitive to its DNA
sequence, presumably due to alternative secondary structures that can be formed (Orita et
al., 1989). Analysis of denatured PCR products can detect even a single base difference.
SSCP analysis is generally applicable, and can be used to map any unique DNA
sequence. It is applicable to all unique sequences in sufficiently divergent strains and
generates stable inherited polymorphisms that can be used for genetic mapping (Förnzler
et al., 1998). Unlike common RFLP mapping approaches, the PCR-SSCP analysis for the
sequence-based RFLP method does not require large amounts of genomic DNA and
radioactive labeling reactions. We have shown that SSPC analysis is an efficient, simple,
and reproducible method for mapping T-DNA insertions in barley.
4.7. Distribution sites of Ds transpositions
Using a RFLP based mapping strategy, we determined the genome location of 34
independent single-copy Ds insertions in the barley genome. The mapping results showed
that Ds elements preferentially transposed into genetically linked sites and are evenly
dispersed on all of the chromosomes in barley.
Ac/Ds elements tend to transpose preferentially to genetically linked sites in maize
(Dooner et al., 1989; 1991) and in heterologous plants such as Arabidopsis (Bancroft et

Discussion 92 ________________________________________________________________________
al., 1993a; Keller et al., 1993b; Raina et al., 2002), tobacco (Jones et al., 1991) and barley
(Koprek et al., 2000) and rice where the frequency of linked transposition ranged from 35
to 80% (Greco et al., 2001; Kim et al., 2004; 2004; Nakagawq et al., 2000). Analysis of
2057 Ds flanking sequences showed that the Ds insertions were distributed randomly
throughout the rice genome and preferentially transposed into genetically linked loci
(Kolesnik et. al., 2004). Similarly, the analysis of 1072 Ds insertion sites in rice indicate
that Ds is transposed into all chromosomes near the donor sites. However, insertions were
also found on physically unlinked chromosome arms (Kim et al., 2004). Recently,
insertion sites of T-DNA and Ds elements have been characterized in rice (An et al.,
2003; Chen et al., 2003; Kolesnik et al., 2004 ; Kim et al., 2004). 70% to 80% Ds
elements were found in genic regions, for T-DNA inserts, 50 to 60% were found in genic
regions. Therefore, Ds tends to be inserted into genic region. Ds might be more
preferential insertion sites than T-DNA, which could be a part of explanation why Ds is
found in genic region more frequency than T-DNA. However, in this study, our results
did not show that the Ds elements inserted in genic regions more frequency than T-DNA.
This might be due to the fact that the available information on EST as well as genomic
sequences for barley is limited and our own data results from relatively few events
compared to studies in rice or Arabidopsis.
Overall, the results of this study demonstrate the preference of Ds elements to transpose
to genetically linked gene-containing sites in barley. Consequently, the Ac/Ds system can
be effectively utilized for targeted gene tagging in barley. By locating the Ds insertions
on the barley genetic map researchers interested in a specific region of the genome can
choose the appropriate Ds insertion line for reactivation experiments. Recently, 19
mapped Ds insertion lines in barley were released to public use (Cooper et al., 2004) of
which 10 where also analyzed and mapped in our study. The combination of our 34
mapped Ds insertion lines, 15 mapped T-DNA lines and 9 additional lines from Cooper
et al. (2004), gives a total of 68 mapped insertion lines which are available for
researchers to carry out targeting gene tagging. Similar experiments are currently in
progress in Australia (P. Langridge, personal communication) which will add further
mapped Ds launch pads to the insertion map.

Discussion 93 ________________________________________________________________________
4.7. Ds excision and re-insertion
Activation of Ds transposition by crossing with plants containing the AcTransposase gene
resulted in F2 plants on average in Ds excision frequencies of 49.2% in lines carrying the
plasmid pWBVDs-Ubi-Bar and 67.7% in lines carrying plaasmid pWBVI-Ubi-DsI-Bar
Similar frequencies were reported in rice (Chin et al., 1999; Greco et., 2001; Nakagawa et
al., 2000; Kolesnik et al., 2004). We have observed varying excision rates depending on
the Ds starter lines used. The Ds excision frequency varied from 33% to 75% in presence
of same source of AcTransposase. Previous studies showed that the Ds donor locus may
influence the transposition frequency. Different chromatin structures as well as
methylation of the transposon were assumed to influence the binding of the transposase
and other host factors required for excision of the Ds element (Bancroft, et al., 1993). In
Arabidopsis, significant differences in transposition frequencies were reported, even in
the presence of the same transposase source (Bancroft et al., 1993). Our results support
the idea that the Ds donor locus may influence the transposition in barley.
In several transgenic lines the F2 progenies did not show an empty donor site as an
indication of excision. The reason in these lines could be the deletion of the PCR primer
annealing sequence adjacent to the left border. The left border of T-DNA is frequently
deleted during the integration of the foreign DNA into chromosomes (Hiei et al., 1994;
Jeon et al., 2000, Kim et al., 2003). The detection of excision events was therefore not
possible by PCR. The Ds re-insertion was confirmed by Southern blot analysis. However,
the frequency of Ds re-insertion was lower than that of Ds excision resulting from PCR
analysis of the empty donor sites. The results indicated that Ds excision occurred in
somatic and germinal transposition. In the cases of somatic transposition, it was difficult
to be detected by transposed events by Southern hybridization

Discussion 94 ________________________________________________________________________
4. 8. Conclusion and perspectives
Based on our results, we demonstrate that the Ac/Ds system is a highly efficient tool for
random insertional mutagenesis in barley. A high number of single-copy T-DNA
insertion lines which carry a Ds element have been generated. These T-DNA insertions
serve as Ds launch pads in tagging experiments. In order to generate a population that is
suitable for targeted gene tagging primary insertion sites of T-DNA and secondary
insertion sites of transposed Ds elements have been mapped. T-DNA insertion site were
successfully mapped by sequence-based RFLP mapping after optimization of the single-
stranded conformation polymorphism (SSCP) mapping approach for barley. Secondary
insertion site of transposed Ds elements have been mapped by RFLP mapping. Mapping
results showed that insertion sites are distributed on all chromosomes and that Ds
elements preferentially transposed to genetically linked sites.
Crosses between transgenic barley plants carrying the Ds launch pad with AcTransposase
expressing plants were made. Resulting F2 progenies showed an average Ds excision or
transposition efficiency 52 %. The frequency of transposition differed largely between
independent Ds launch pad lines and may be a consequence of the primary insertion site
of the T-DNA. However, the high frequency of transposition events allow for the
application of the sys tem for systematic insertional mutagenesis.
A comprehensive sequence analysis of T-DNA and Ds flanking genomic barley DNA has
been performed. In this study, BLASTN search results showed that 37 % of Ds insertion
sites shared significant homology to cerea l ESTs, which suggested that Ds elements
preferentially transposed into gene-rich regions in barley genome. Similarly, the analysis
of genomic DNA flanking T-DNA insertions also showed that T-DNA preferentially
inserted into gene-rich regions. Insertions into repetitive regions are fro both insertional
mutagens frequent but significantly underrepresented when compared with the
composition of the barley genome. Thus, the distribution of both T-DNA and Ds
elements in the barley genome shows a non-random pattern.

Discussion 95 ________________________________________________________________________
Detailed analysis of the nucleotide composition directly adjacent to the T-DNA revealed
that the T-DNA integration process follows apparently the same mechanism in monocots
as in dicots. Moreover, the analysis of the immediate right border sequences of the T-
DNA showed a very high percentage of adenin and guanidin residues at the first two base
pairs of the genomic sequence, which might be relevant for the integration mechanism. A
search for DNA motifs surrounding the integration sites showed for both elements a
relatively high number of kinked or bend DNA structures which have frequently be
suggested to be of importance for the integration of foreign DNA into the host genome.
The data presented here shows that an efficient system for targeted gene tagging in barley
has been generated. The use of Agrobacterium-mediated transformation made it feasible
to generate large numbers of single copy T-DNA insertion lines serving as launch pads of
Ds elements. The preferential integration of T-DNA in genic regions positions the Ds
elements in areas from where their activation will most likely result in insertions in genes
as a consequence of their preferential transposition into closely linked sites.
The combination of T-DNA and Ac/Ds transposons make this system an ideal tool for
barley functional genomics. Due to the synteny of the barley genome with genomes of
other Triticeae , especially tetraploid and hexaploid species such as oat and wheat, the
development of this system for targeted gene tagging in barley also promises to provide a
useful tool for functional genomics in other Triticeae.

Summary 96 ________________________________________________________________________
5. Summary
We have generated a large number of transgenic barley plants carrying the maize
transposons Activator (Ac) and Dissociation (Ds) by Agrobacterium-mediated
transformation. The average efficiency of transformation was more than 20%.
Approximately 50% of the transgenic lines contain a single copy of the Ds element. The
single-copy Ds lines have been used as launch pads to develop a population for targeted
gene tagging in barley.
In order to define Ds launch pads for targeted insertional mutagenes is, 16 T-DNA
insertion site and 38 secondary insertion sites of transposed Ds elements were genetically
mapped by a sequence-based SSCP (single strand conformation polymorphism) analysis
approach and RFLP analysis. The mapping results showed that Ds elements preferentially
transposed into genetically linked sites.
Single-copy Ds containing plants lines were crossed with lines expressing the
Actransposase gene to activate the Ds element. F2 plants resulting from these crosses
showed an average Ds excision frequency of 52% with a variation between 33% and 75%
depending on the Ds starter lines used.
A detailed molecular analysis of T-DNA integration sites in barley genome was carried
out using single-copy transgenic lines. Sequence analysis of T-DNA flanking regions
showed a non-random distribution of T-DNA integration sites in the genome.
Approximately 50% of the T-DNA insertions are found to be in gene-coding regions and
26 % of the T-DNA insertions are in repetitive regions of the barley genome. Likewise,
the sequence analysis of isolated Ds flanking DNA showed that Ds preferentially inserted
into coding region in the barley genome and is underrepresented in repetitive or non-
coding regions. Therefore, the combination of Agrobacterium-mediated transformation
and the Ac/Ds transposon system takes advantage of the insertion characteristics of the T-
DNA and the Ds elements. The T-DNA positions the Ds element preferentially in a gene-

Summary 97 ________________________________________________________________________
rich region from where Ds elements can be activated to transpose into closely linked sites
resulting in high gene tagging frequencies.
An Ac/Ds-based gene tagging system has been developed which has potential to be an
efficient tool for high-throughput insertional mutagenesis in barley. Due to the synteny
between the genomes of Triticeae species, the development of such a system promises to
provide a useful tool for functional genomics in other Triticeae species as well.
Summary 98 ________________________________________________________________________
Zusammenfassung Durch Agrobakterium-vermittelte Transformation wurde eine große Anzahl transgener
Gerstenpflanzen mit den Maistransposons Activator (Ac) and Dissociation (Ds) erzeugt.
Die durchschnittliche Transformationseffizienz lag dabei bei über 20%. Etwa 50% der
transgenen Linien enthalten das Ds element als single-copy Insertion. Die sincle-copy Ds
Linien wurden als Startpositionen verwendet, um eine Population zum zielgerichteten
Gen-tagging zu entwickeln.
Um Ds Startpositionen fürs zielgerichtete Gen-tagging zu definieren, wurden 16 T-DNA
Insertionsstellen und 38 Insertionsstellen transponierter Ds Elemente SSCP and RFLP
Analyse genetisch kartiert. Die Kartierung von transponierten Ds Elementen zeigte eine
bevorzugte Insertion in genetisch eng benachbarten Bereichen.
Ds Elemente in single-copy transgenen Pflanzen wurden durch Kreuzen mit
AcTransposase exprimierenden Pflanzen zum Springen aktiviert. Die aus den
Kreuzungen resultierenden F2 Pflanzen zeigten eine durchschnittliche Excisions frequenz
von 52%, wobei die Frequenzen je nach Starter Linie zwischen 33% und 75% variierten.
Mit den Linien, die nur eine Kopie des Transgens enthalten, wurde eine detailierte
molekulare Analyse der T-DNA Insertionsstellen durchgeführt. Die Sequenzanalyse der
T-DNA flankierenden genomischen Gersten DNA zeigte, dass die T-DNA Integration in
Gerste nicht zufällig erfolgt. Ungefähr 50% der T-DNA Insertionen wurden in
codierenden Bereichen und 26% in repetitiven Regionen des Gersten Genoms gefunden.
Ebenso zeigte die Sequenzanalyse der Ds flankierenden DNA, daß Ds bevorzugt in
codierende Regionen des Gerstengenoms springt und in repetitiven und nicht-
codierenden Regionen unterrepräsentiert ist. Folglich verbindet die Kombination der
Agrobakterium-vermittelten Transformation und des Ac /Ds Transposonsystems in
vorteilhafter Weise die Eigenschaften der T-DNA und der Ds Elemente. Die T-DNA
führt zur Integartion der Ds Elemente in Gen-reichen Regionen, von wo sie dann zu

Summary 99 ________________________________________________________________________
Transpositionen in genetisch eng verknüpfte Bereiche aktiviert werden können. Dies
resultiert dann in hohen Gen-tagging Frequenzen.
Es wurde ein auf den Maistransposons Ac/Ds basierendes Gen-tagging System
entwickelt, das potentiell ein effizientes Instrument zur Hochdurchsatz
Insertionsmutagenese in Gerste ist. Aufgrund der Syntheny zwischen den Genomen der
Triticeen verspricht die Enwicklung eines solchen Systems auch für andere Triticeae ein
hilfreiches Instrument zur funktionellen Genomanalyse zu werden.

Summary 96 ________________________________________________________________________
5. Summary
We have generated a large number of transgenic barley plants carrying the maize
transposons Activator (Ac) and Dissociation (Ds) by Agrobacterium-mediated
transformation. The average efficiency of transformation was more than 20%.
Approximately 50% of the transgenic lines contain a single copy of the Ds element. The
single-copy Ds lines have been used as launch pads to develop a population for targeted
gene tagging in barley.
In order to define Ds launch pads for targeted insertional mutagenes is, 16 T-DNA
insertion site and 38 secondary insertion sites of transposed Ds elements were genetically
mapped by a sequence-based SSCP (single strand conformation polymorphism) analysis
approach and RFLP analysis. The mapping results showed that Ds elements preferentially
transposed into genetically linked sites.
Single-copy Ds containing plants lines were crossed with lines expressing the
Actransposase gene to activate the Ds element. F2 plants resulting from these crosses
showed an average Ds excision frequency of 52% with a variation between 33% and 75%
depending on the Ds starter lines used.
A detailed molecular analysis of T-DNA integration sites in barley genome was carried
out using single-copy transgenic lines. Sequence analysis of T-DNA flanking regions
showed a non-random distribution of T-DNA integration sites in the genome.
Approximately 50% of the T-DNA insertions are found to be in gene-coding regions and
26 % of the T-DNA insertions are in repetitive regions of the barley genome. Likewise,
the sequence analysis of isolated Ds flanking DNA showed that Ds preferentially inserted
into coding region in the barley genome and is underrepresented in repetitive or non-
coding regions. Therefore, the combination of Agrobacterium-mediated transformation
and the Ac/Ds transposon system takes advantage of the insertion characteristics of the T-
DNA and the Ds elements. The T-DNA positions the Ds element preferentially in a gene-

Summary 97 ________________________________________________________________________
rich region from where Ds elements can be activated to transpose into closely linked sites
resulting in high gene tagging frequencies.
An Ac/Ds-based gene tagging system has been developed which has potential to be an
efficient tool for high-throughput insertional mutagenesis in barley. Due to the synteny
between the genomes of Triticeae species, the development of such a system promises to
provide a useful tool for functional genomics in other Triticeae species as well.

Summary 98 ________________________________________________________________________
Zusammenfassung Durch Agrobakterium-vermittelte Transformation wurde eine große Anzahl transgener
Gerstenpflanzen mit den Maistransposons Activator (Ac) and Dissociation (Ds) erzeugt.
Die durchschnittliche Transformationseffizienz lag dabei bei über 20%. Etwa 50% der
transgenen Linien enthalten das Ds element als single-copy Insertion. Die sincle-copy Ds
Linien wurden als Startpositionen verwendet, um eine Population zum zielgerichteten
Gen-tagging zu entwickeln.
Um Ds Startpositionen fürs zielgerichtete Gen-tagging zu definieren, wurden 16 T-DNA
Insertionsstellen und 38 Insertionsstellen transponierter Ds Elemente SSCP and RFLP
Analyse genetisch kartiert. Die Kartierung von transponierten Ds Elementen zeigte eine
bevorzugte Insertion in genetisch eng benachbarten Bereichen.
Ds Elemente in single-copy transgenen Pflanzen wurden durch Kreuzen mit
AcTransposase exprimierenden Pflanzen zum Springen aktiviert. Die aus den
Kreuzungen resultierenden F2 Pflanzen zeigten eine durchschnittliche Excisions frequenz
von 52%, wobei die Frequenzen je nach Starter Linie zwischen 33% und 75% variierten.
Mit den Linien, die nur eine Kopie des Transgens enthalten, wurde eine detailierte
molekulare Analyse der T-DNA Insertionsstellen durchgeführt. Die Sequenzanalyse der
T-DNA flankierenden genomischen Gersten DNA zeigte, dass die T-DNA Integration in
Gerste nicht zufällig erfolgt. Ungefähr 50% der T-DNA Insertionen wurden in
codierenden Bereichen und 26% in repetitiven Regionen des Gersten Genoms gefunden.
Ebenso zeigte die Sequenzanalyse der Ds flankierenden DNA, daß Ds bevorzugt in
codierende Regionen des Gerstengenoms springt und in repetitiven und nicht-
codierenden Regionen unterrepräsentiert ist. Folglich verbindet die Kombination der
Agrobakterium-vermittelten Transformation und des Ac /Ds Transposonsystems in
vorteilhafter Weise die Eigenschaften der T-DNA und der Ds Elemente. Die T-DNA
führt zur Integartion der Ds Elemente in Gen-reichen Regionen, von wo sie dann zu

Summary 99 ________________________________________________________________________
Transpositionen in genetisch eng verknüpfte Bereiche aktiviert werden können. Dies
resultiert dann in hohen Gen-tagging Frequenzen.
Es wurde ein auf den Maistransposons Ac/Ds basierendes Gen-tagging System
entwickelt, das potentiell ein effizientes Instrument zur Hochdurchsatz
Insertionsmutagenese in Gerste ist. Aufgrund der Syntheny zwischen den Genomen der
Triticeen verspricht die Enwicklung eines solchen Systems auch für andere Triticeae ein
hilfreiches Instrument zur funktionellen Genomanalyse zu werden.

References 100 ________________________________________________________________________ References
Aarts MG, Dirkse WG, Stiekema WJ and Periera A. (1993) Transposon tagging of a male sterility gene in A. thaliana. Nature. 363:715–717.
Aarts MG, Corzaan P, Stiekema W J and Pereria A. (1995) A two-element Enhancer-Inhibitor transposon system in Arabidopsis thaliana. Mol Gen Genet. 247: 555-564.
Alonso JM, Stepanova AN, Leisse TJ, Kim CJ, Chen H, Shinn P, Stevenson DK, Zimmerman J, Barajas P, Cheuk R, Gadrinab C, Heller C, Jeske A, Koesema E, Meyers CC, Parker H, Prednis L, Ansari Y, Choy N, Deen H, Geralt M, Hazari N, Hom E, Karnes M, Mulholland C, Ndubaku R, Schmidt I, Guzman P, Aguilar-Henonin L, Schmid M, Weigel D, Carter DE, Marchand T, Risseeuw E, Brogden D, Zeko A, Crosby WL, Berry CC, Ecker JR. (2003) Genome-Wide Insertional Mutagenesis of Arabidopsis thaliana. Science. 301: 653-657.
An S, Park S, Jeong DH, Lee DY, Kang HG, Yu JH, Hur J, Kim SR, Kim YH, Lee M, Han S, Kim SJ, Yang J, Kim E, Wi SJ, Chung HS, Hong JP, Choe V, Lee HK, Choi JH, Nam J, Kim SR, Park PB, Park KY, Kim WT, Choe S, Lee CB, An G. (2003) Generation and analysis of end sequence database for T-DNA tagging lines in rice. Plant Physiol. 133: 2040 2047.
Arumuganathan K, Earle ED. (1991) Nuclear DNA content of some important plant species. Plant Mol Biol Rep. 9: 208-218.
Azpiroz-Leehan R and Feldmann KA. (1997) T-DNA insertion mutagenesis in Arabidopsis: going back and forth. Trends Genet. 13: 152-156.
Badr A, Muller K, Schafer-Pregl R, El Rabey H, Effgen S, Ibrahim HH, Pozzi C, Rohde W, Salamini F. (2000) On the origin and domestication history of barley. Mol Biol Evol. 17: 499-510.
Baker B, Coupland G, Federoff NV, Starlinger P and Schell J. (1987) Phenotypic assay for excision of the maize controlling element Ac in tobacco. EMBO J. 6: 1547–1554.
Baker B, Schell J, Lorz H and Federoff NV. (1986) Transposition of the maize controlling element ‘Activator' in tobacco. Proc Natl Acad Sci USA. 83: 4844–4848.
Bancroft I., Bhatt AM, Sjodin C, Scofield S, Jones ID and Dean C. (1992) Development of an efficient two-element transposon tagging system in Arabidopsis thaliana. Mol Gen Genet. 233: 449-461.
Bancroft I and Dean C. (1993a) Transposition pattern of the maize element Ds in Arabidopsis thaliana. Genetics. 134, 1221 1229.

References 101 ________________________________________________________________________ Bancroft I and Dean C. (1993b) Factors affecting the excision frequency of the maize transposable element Ds in Arabidopsis thaliana. Mo. Ge. Genet. 240 : 65 72.
Barakat A, Carels N and Bernardi G. (1997) The distribution of genes in the genomes of Gramineae. Proc Natl Acad Sci USA. 94: 6857–6861.
Barakat A, Matassi A, and Bernardi G. (1998) Distribution of genes in the genome of Arabidopsis thaliana and its implications for the genome organization of plants. Proc Natl Acad Sci. USA 95: 10044–10049.
Barakat A, Gallois P, Raynal M, Mestre-Ortega D, Sallaud C, Guiderdoni E, Delseny M, Bernardi G. (2000) The distribution of T-DNA in the genomes of transgenic Arabidopsis and rice. FEBS Lett. 471:161–164.
Barr AR, Karakousis A, Lance RCM, Logue SJ, Manning S, Chalmers KJ, Kretschmer JM, Boyd WJR, Collins HM, Roumeliotis S, Coventry S, Moody DB, Read BJ, Poulsen D, Li CD, Platz GJ, Inkerman A, Panozzo JF, Cullis BR, Smith AB, Lim P, Langridge P. (2003) Mapping and QTL analysis of the barley population Chebec x Harrington. Aust J Ag Res. 54: 1125-1130.
Baulcombe DC. (1999) Fast for ward genetics based on virus -induced gene silencing, Curr Opin Plant Biol. 2: 109–113.
Bechtold N, Ellis J and Pelletier G. (1993) In plant Agrobacterium mediated gene transfer by infiltration of adult Arabidopsis thaliana plant. CR Acad Sci Ser III. 316: 1194-1199.
Beier, D.R., Dushkin H., and Sussman D. J. (1992) Mapping genes in the mouse using single-stranded conformation polymorphism analysis of recombinant inbred strains and interspecific crosses. Proc Natl Acad Sci USA. 89: 9102-9206.
Beier D.R. (1993) D.C. Single-stranded conformation polymorphism as a tool for genetic mapping. Mamm Genome. 4: 627-631.
Bennett MD and Smith JB. (1976) Nuclear DNA amount in angiosperms. Phil. Trans. Roy. Soc. Lond. B Biol Sci. 227-274.
Bennetzen JI. (1998) The structure and evolution of angiosperm nuclear genomes. Curr Opin Plant Biol. 2: 103-8.
Bennetzen JL, SanMiguel P, Chen M, Tikhonov A, Francki M, and Avramova Z. (1998) Grass genomes. Proc Natl Acad Sci USA. 95: 1975-1978.
van der Biezen EA, Brandwagt BF, van Leeuwen W, Nijkamp HJ and Hille J. (1996) Identification and isolation of the FEEBLY gene from tomato by transposon tagging. Mol Gen Genet. 251: 267–280.

References 102 ________________________________________________________________________ Bishop GJ, Harrison K, and Jones JDG. (1996) The tomato Dwarf gene isolated by heterologous transposon tagging encodes the first member of a new cytochrome P450 family. Plant Cell. 8: 959–969.
Borevitz JO. Borevitz, Xia Y, Blount J, Dixon RA and Lamb C. (2000) Activation Tagging Identifies a Conserved MYB Regulator of Phenylpropanoid Biosynthesis. Plant Cell. 12: 2383-2393.
Bothmer R von and Jacobsen N. (1985) Origin, taxonomy, and related species. in D. C. Rasmusson, ed. Barley. American Society of Agronomists, Madison, Wis. Pp. 19-56.
Bothmer R von, Jacobsen N, Baden C, Jorgensen B and Linde-Laursen R. (1995) An ecogeographical study od the genus Hordeum. 2nd edition. International Plant Genetic Resources Institute, FAO, Rome.
Bruce PM and Martienssen RA. (2003) Transposon mutagenesis in the study of plant development. Critical Reviews in Plant Sciences. 22:1-35.
Brueggeman R, Rostoks N, Kudrna D, Kilian A, Han F, Chen J, Druka A, Steffenson B, Kleinhofs A. (2002) The barley stem rust-resistance gene Rpg1 is a novel disease-resistance gene with homology to receptor kinases. Proc Natl Acad Sci U S A. 99: 9328-33.
Brueggeman R, Drader T, Druka A, Cavileer T, Steffenson B, Kleinhofs A.(2005) The barley stem rust resistance gene Rpg5 encodes the NBS-LRR and protein kinase domains in a single gene. Plant & Animal Genomes XIII Conference, San Diego, CA, p320.
Buschges R, Hollricher K, Panstruga R, Simons G, Wolter M, Frijters A, van Daelen R, van der Lee T, Diergaarde P, Groenendijk J, Topsch S, Vos P, Salamini F, Schulze-Lefert P. (1997) The barley Mlo gene: a novel control element of plant pathogen resistance. Cell. 88: 695-705.
Caldwell DG, McCallum N, Shaw P, Muehlbauer GJ, Marshall DF, Waugh RA. (2004) structured mutant population for forward and reverse genetics in Barley (Hordeum vulgare L.). Plant J. 40:143-150.
Campisi L, Yang Y, Yi Y, Heilig E, Herman B, Cassista AJ, Allen DW, Xiang H, Jack T. (1999) Generation of enhancer trap lines in Arabidopsis and characterization of expression patterns in the inflorescence. Plant J. 17: 699-707.
Cao J, Duan X, McElroy D and Wu R. (1992) Regeneration of herbicide resistant transgenic rice plants following microprojectile-mediated transformation of suspension culture cells. Plant Cell Rep. 11:586-591.

References 103 ________________________________________________________________________ Capy P, Bazin C, Higuet D & Langin T. (1998) (Eds.). Dynamics and Evolution of Transposable Elements Springer, Landes Biolsciences, Library of Congress, Austin, Texas.
Carroll BJ, Klimyuk VI, Thomas CM, Bishop GJ, Harrison K, Scofield SR and Jones JDG. (1995) Germinal transposition of the maize element Dissociation from T-DNA loci in tomato. Genetics. 139: 407–420. Chen S, Jin W, Wang M, Zhang F, Zhou J, Jia Q, Wu
Y, Liu F and Wu P. (2003) Distribution and characterization of over 1000 T-DNA tags in rice genome. Plant J. 36:105 113.
Chin HG, Choe MS, Lee SH, Park SH, Koo JC, Kim NY, Lee JJ, Oh BG, Yi GH, Kim SC, Choi HC, Cho MJ and Han CD. (1999) Molecular analysis of rice plants harboring an Ac/Ds transposable element-mediated gene trapping system. Plant J. 19: 615-623.
Close TJ, Wanamaker SI, Caldo RA, Turner SM, Ashlock DA, Dickerson JA, Wing RA, Muehlbauer GJ, Kleinhofs A, Wise RP. (2004) A new resource for cereal genomics: 22K barley GeneChip comes of age. Plant Physiol. 134: 960-8.
Collins NC, Thordal-Christensen H, Lipka V, Bau S, Kombrink E, Qiu JL, Huckelhoven R, Stein M, Freialdenhoven A, Somerville SC, Schulze -Lefert P. (2003) SNARE-protein-mediated disease resistance at the plant cell wall. Nature. 425: 973-7.
Cone K (1989) Yet another rapid plant DNA prep. Maize Gen Coop Newslett. 63: 68
Cooper L D, Marquez-Cedillo L, Singh J , Sturbaum A K, Zhang S , Edwards V , Johnson K, Kleinhofs A, Rangel S, Corollo V, Bregitzer P, Lemaux PG, Hayes PM. (2004) Mapping Ds insertions in barley using a sequence-based approach. Mol Gen Genomics. 272: 181-193.
Costa JM, Corey A and Hayes M. (2001) Molecular mapping of the Oregon Wolfe Barleys: a phenotypically polymorphic doubled-haploid population Theor Appl Genet 103: 415-424.
Cowperthwaite M, Park W, Xu Z, Yan X, Maurais SC and Dooner HK. (2002) Use of the transposon Ac as a gene-searching engine in the maize genome. Plant Cell. 14: 713 726.
Diamond J. (1998) Guns, germs and stell. Vintage, London.
Dooner HK, Keller J, Harper E and Ralston E. (1991) Variable patterns of transposition of the maize element Activator in tobacco. Plant Cell. 3: 473 482.
Dooner HK and Belachew A. (1989) Transposition pattern of the maize element Ac form bz-M2 (Ac) allele. Genetics. 136: 261 279.
References 104 ________________________________________________________________________ Emmanuel E and Levy A. (2002) Tomato mutants as tools for functional genomics. Current Opinion in Plant Biology. 5: 112-117.
Enoki H, Izawa T, Kawahara M, Komatsu M, Koh S, Kyozuka J and Shimamoto, K. (1999) Ac as a tool for the functional genomics of rice. Plant J. 19: 605 613.
Fang YD, Akula C, Altpeter F. (2002) Agrobacterium mediated barley (Hordeum vulgare L.) transformation using green fluorescent protein as a visual marker and sequence analysis of the T-DNA: barley genomic DNA junctions. J Plant Physiol. 10:1131-1138.
Fedoroff, NV and Smith DL. (1993) A versatile system for detecting transposition in Arabidopsis. Plant J. 3: 273 289.
Finnegan EJ, Lawrence GJ, Dennis ES and Ellis JG. (1993) Behavior of modified Ac
elements in flax callus and regenerated plants. Plant Mol. Biol. 22: 625–633.
Fitzmaurice WP, Nguyen LV, Wernsman EA, Thompson WF and Conkling MA. (1999) Transposon tagging of the sulfur gene of tobacco using engineered maize Ac/Ds elements. Genetics. 153: 1919–1928.
Förnzler D, Her H, Knapik EW, Clark M, Lehrach H, Postlethwait JH, Zon LI and David Beier R. (1998) Gene Mapping in Zebrafish Using Single-Strand Conformation Polymorphism Analysis. GENOMICS. 51: 216-222.
Forsbach A, Schubert D, Lechtenberg B, Gils M and Schmidt R. (2003) A comprehensive characterization of single-copy T-DNA insertions in the Arabidopsis thaliana genome. Plant Mol. Biol. 52: 161–176.
Franckowiak J. (1997) Revised linkage maps for morphological markers in barley, Hordeum vulgare. Barley Genet Newslett. 26: 9-21.
Frey MM, Tavatzis SM. and Saedler H. (1989) The maize En-I/Spm element transposes in potato. Mol Gen Genet. 217: 172–177.
Gidoni D, Fuss E, Burbidge A, Speckmann G-J, James S, Nijkamp D, Mett A, Feiler J, Smoker M, de Vroomen MJ, Leader D, Liharska T, Groenendijk J, Coppoolse E, Smit JJM, Levin I, de Both M, Schuch W, Jones JDG, Taylor IB, Theres K and van Haaren
MJJ. (2003) Multi-functional T-DNA/Ds tomato lines designed for gene cloning and molecular and physical dissection of the tomato genome. Plant Mol Biol. 51: 83-98.
Goff, S.A., Ricke, D., Lan, T.H. et al. (2002) A draft sequence of the rice genome (Oryza sativa L. ssp. japonica). Science. 296: 92 100.
Guiderdoni E., Meijer A.H., Hoge J.H.C., Pereira A. (2003) Transpositional behaviour of an Ac/Ds system for reverse genetics in rice. Theor Appl Genet. 108:10 –24.

References 105 ________________________________________________________________________ Graner A, Siedler H, Jahoor A, Herrmann RG, Wenzel G. (1991) Assessment of the degree and type of restriction fragement length polymorphism in barley (Hordeum vulgare) Theor Appl Genet. 83: 250-256.
Greco R, Ouwerkerk PB, Taal AJ, Favalli C, Beguiristain T, Puigdomenech P, Colombo L, Hoge JH and Pereira A. (2001) Early and multiple Ac transpositions in rice suitable for efficient insertional mutagenesis. Plant Mo. Biol. 46 , 215 227.
Greco R, Ouwerkerk PB, De Kam RJ, Sallaud C, Favalli C, Colombo L, Guiderdoni E, Meijer AH, Hoge Dagger JH and Pereira A. (2003) Transpositional behaviour of an Ac/Ds system for reverse genetics in rice. Theor Appl Genet. 108: 10-24.
Greco R, Ouwerkerk PB, Taal AJ, Sallaud C, Guiderdoni E, Meijer AH, Hoge JH, Pereira A. (2004) Transcription and somatic transposition of the maize En/Spm transposon system in rice. Mol Genet Genomics. 270:514-23.
Halterman D, Zhou F, Wei F, Wise RP, Schulze-Lefert P. (2001) The MLA6 coiled-coil, NBS-LRR protein confers AvrMla6-dependent resistance specificity to Blumeria graminis f. sp. hordei in barley and wheat. Plant J. 25:335-48.
Halterman DA, Wei F, Wise RP. (2003) Powdery mildew-induced Mla mRNAs are alternatively spliced and contain multiple upstream open reading frames. Plant Physiol. 131: 558-67.
Halterman DA, Wise RP. (2004) A single-amino acid substitution in the sixth leucine-rich repeat of barley MLA6 and MLA13 alleviates dependence on RAR1 for disease resistance signaling. Plant J. 38: 215-26.
Hannon GJ. (2002) RNA interference. Nature. 418: 244–251.
Hayashi H, Csaja I, Lubenow H, Schell J and Walden R. (1992) Activation of a plant gene by T-DNA tagging: auxin-independent growth in vitro. Science. 258: 1350–1353.
Healy J, Corr C, DeYoung J and Baker B. (1993) Linked and unlinked transposition of a genetically marked Dissociation element in transgenic tomato. Genetics. 134: 571–584.
Helliwell CA and Waterhouse PM. (2005) Constructs and methods for hairpin RNA-mediated gene silencing in plants. Methods Enzymol. 392: 24–35.
Henikoff S and Comai L. (2003) Single-nucleotide mutations for plant functional genomics, Ann. Rev Plant Biol. 54: 375–401.
Henikoff S, Till BJ, Comai L. (2004) TILLING: Traditional mutagenesis meets functional genomics. Plant Physiol. 135: 630-6.

References 106 ________________________________________________________________________ Hiei Y, Ohta S, Komari T and Kumashiro T. (1994) Efficient transformation of rice (Oryza sativa L.) mediated by Agrobacterium and sequence analysis of the boundaries of the T-DNA. Plant J. 6: 271 282.
Horvath H, Huang JT, Wong O, Kohl E, Okita T, Kannangara CG, von Wettstein D. (2000) The production of recombinant proteins in transgenic barley grains. Proc Natl Acad Sci USA. 97:1914–1919.
Islam AKMR, Shepherd KW, Sparrow DHB. (1981) Isolation and characterisation of euplasmic wheat-barley chromosome addition lines. Heredity. 46: 161-174.
Isidore E, Scherrer B, Bellec A , Budin K, Faivre-Rampant P, Waugh R, Keller B, Caboche M, Feuillet C and Chalhoub B. (2005) Direct targeting and rapid isolation of BAC clones spanning a defined chromosome region. Functional & Integrative Genomics. 5: 97 – 103.
Ito T, Seki M, Hayashida N, Shibata D and Shinozaki K. (1999) Regional insertional mutagenesis of genes on Arabidopsis thaliana chromosome V using the Ac/Ds transposon in combination with a cDNA scanning method. Plant J. 17: 433–444.
Izawa T, Ohnishi T, Nakano T, Ishida N, Enoki H, Hashimoto H, Itoh K, Terada R, Wu C, Miiyazaki C, Endo T, Iida S, Shimamoto K. (1997) Transposon tagging in rice. Plant Mol Biol. 35:219 –229.
James DW, Lim JE, Keller J, Plooy I., Ralston E and Dooner HK. (1995) Direct tagging of the Arabidopsis Fatty Acid Elongation 1 (FAE1) gene with the maize transposon Activator. Plant Cell 7: 309–319.
Jander G, Norris SR, Rounsley SD, Bush DF, Levin IM, Last RL. (2002) Arabidopsis map-based cloning in the post-genome era. Plant Physiol. 129: 440-50.
Jeon J and An G. (2001) Gene tagging in rice: a high throughput system for functional genomics. Plant Sci. 161 : 211 219.
Jeon JS, Sichul Lee, Jung KH, Jun SH, Jeong DH, Lee J, Kim C, Jang S, Lee S, Yang K, Nam J, An K, Han MJ, Sung RJ, Choi HS, Yu JH, Choi JH, Cho SY, Sang-Su Cha, Kim SI and An G. (2000) Plant J. 22: 561-570.
Johnson K , Kleinhofs A, Rangel S, Carollo V, Bregitzer P, Lemaux PG and Hayes P M. (2004) Mapping Ds insertions in barley using a sequence-based approach. Mol Gen Genet. 272:181-193.
Jones DA, Thomas CM, Hammond-Kosack KE, Balint-Kurti PJ and Jones JDG. (1994) Isolation of the tomato Cf-9 gene for resistance to Cladosporium fulvum by transposon tagging. Science. 266: 789–793.

References 107 ________________________________________________________________________ Jones, J.D.G., Carland, F., Lim, E., Ralston, E. and Dooner, H.K. (1990) Preferential transposition of the maize element Activator to linked chromosomal locations in tobacco. Plant Cell. 2: 701 708.
Karakousis A, Barr AR, Kretschmer JM, Manning S, Logue SJ, Roumeliotis S, Collins HM, Chalmers KJ, Li CD, Lance RCM, Langridge P. (2003) Mapping and QTL analysis of the barley population Galleon x Haruna Nijo. Aust J Ag Res. 54: 1131-1135.
Karakousis A, Barr AR, Kretschmer JM, Manning S, Jefferies SP, Chalmers KJ, Islam AKM, Langridge P. (2003) Mapping and QTL analysis of the barley population Clipper x Sahara. Aust J Ag Res. 54: 1137-1140.
Kardailsky I, Shukla VK, Ahn JH, Dagenais N, Christensen SK, Nguyen JT, Chory J, Harrison MJ, Weigel D. (1999) Activation tagging of the floral inducer FT. Science. 286: 1962-5.
Keddie JS, Carroll B, Jones JDG and Gruissem W. (1996) The DCL gene of tomato is required for chloroplast development and palisade cell morphogenesis in leaves. EMBO J. 15: 4208–4217.
Keller, J., Lim, E. and Dooner, H.K. (1993b) Preferential transposition of Ac to linked sites in Arabidopsis. Theor Appl Gene. 86: 585 588.
Kim S, Lee J, Jun S, Park, Kang H, Kwon S, An G. (2003) Transgene structure in T-DNA-inserted rice plants. Plant Mol Biol. 52: 761-773.
Kim CM, Piao HL, Park SJ, Chon NS, Han C et al., (2004) Rapid, large-scale generation of Ds transposant lines and analysis of the Ds insertion sites in rice. Plant J. 39: 252-263.
Kleine M, Michalek W, Graner A, Herrmann RG, Jung C. (1993) Construction of a barley (Hordeum vulgare L.) YAC library and isolation of a Hor1-specific clone. Mol Gen Genet. 240: 265-72.
Kleinhofs A, Kilian A, Saghai Maroof MA, Biyashev RM and Hayes P. (1993) A molecular, isozyme and morphological map of the barley (Hordeum vulgare) genome. Theor Appl Genet. 86: 705-712.
Kleinhofs A and Graner A. (2001) An integrated map of the barley genome. In RL Phillips, IK Vasil, eds, DNA-Based Markers in Plants. Kluwer Academic Publishers, Dordrecht, The Netherlands, pp 187-199.
Kleinhofs A and Han F. (2001) Molecular mapping of the barley genome. In JLM-CGA Slafer, JL Araus, R Savin, I Romagosa, eds, Barley Science: Recent Advances from Molecular Biology to Agronomy of Yield and Quality. Food Product Press, New York, pp 31-45.

References 108 ________________________________________________________________________ Knapp S, Coupland G, Uhrig H, Starlinger P and Salamini F. (1988) Transposition of the maize transposable element Ac in Solanum tuberosum. Mol Gen Genet. 213: 285–290.
Knapp S, Larondelle Y, Robberg M, Furtek D and Theres K. (1994) Transgenic tomato lines containing Ds elements at defined genomic positions as tools for targeted transposon tagging. Mol Gen Genet. 243: 666–673.
Kohli A, Gahakwa D, Vain P, Laurie DA, Christou P. (1999) Transgene expression in rice engineered through particle bombardment: molecular factors controlling stable expression and transgene silencing. Planta. 208: 88–97.
Kolesnik T, Szeverenyi I, Bachmann D, Kumar CS, Jiang S, Ramamoorthy R, Cai M, Ma ZG, Sundaresan V. and Ramachandran S. (2004) Establishing an efficient Ac/Ds tagging system in rice: large -scale analysis of Ds flanking sequences. Plant J. 37: 301 314.
Koprek, T., McElroy, D., Louwerse, J., Williams-Carrier, R., Lemaux, P.G. (1999) Negative selection systems for transgenic barley (Hordeum vulgare L.): comparison of bacterial codA- and cytochrome P450 gene-mediated selection. Plant J. 19: 719 726.
Koprek T, McElroy D, Louwerse J, Williams-Carrier R. and Lemaux PG. (2000) An efficient method for dispersing Ds elements in the barley genome as a tool for determining genefunction. Plant J. 24: 253 263.
Koprek T, Rangel S, McElroy D, Louwerse JD, Williams-Carrier RE, Lemaux PG. (2001) Transposon-mediated single-copy gene delivery leads to increased transgene expression stability in barley. Plant Physiol. 125:1354-62
Koprek T, Zhao T, Zimmermann D, Schulze-Lefert P. (2003) Systematic Ac/Ds transposon mutagenesis in barley. EUCARPIA Proceedings "From Biodiversity to Genomics: Breeding Strategies for Small Grain Cereals in the Third Millennium". 453-456.
Krysan PJ, Young JC, Sussman MR. (1999) T-DNA as an insertional mutagen in Arabidopsis. Plant Cell. 11: 2283-90.
Kumar CS and Narayanan KK. (1998) Plant transposable elements and functional genomics. Plant Biotech. 15: 159–165.
Kumar S and Fladung M. (2000) Trangenic integration in aspen: Structure of integration sites and mechanism of T-DNA integration. Plant J. 31: 543-551.
Kunzel G, Korzun L, Meister A. (2000) Cytologically integrated physical restriction fragment length polymorphism maps for the barley genome based on translocation breakpoints. Genetics. 154: 397-412.

References 109 ________________________________________________________________________ Kuromori T, Hirayama T, Kiyosue Y, Takabe H, Mizukado S, Sakurai T, Akiyama K, Kamiya A, Ito T, Shinozaki K. (2004) A collection of 11 800 single-copy Ds transposon insertion lines in Arabidopsis. Plant J. 37: 897-905.
Lahaye T, Shirasu K, Schulze-Lefert P. (1998) Chromosome landing at the barley Rar1 locus. Mol Gen Genet. 260: 92-101.
Laufs P, Autran D, Traas J. (1999) A chromosomal paracentric inversion associated with T-DNA integration in Arabidopsis. Plant J. 18:131-9.
Lawrence GJ, Finnegan EJ, Ayliffe MA and Ellis JG. (1995) The L6 gene for flax rust resistance is related to the Arabidopsis bacterial resistance gene RPS2 and the tobacco viral resistant gene N. Plant Cell 7: 1195–1206.
Leyser O, Chang C. (1996) Chromosome walking. In: G.D. Foster, D. Twell D. (eds) Plant Gene Isolation, John Wiley and Sons, Ltd, Chichester, pp. 248-271.
Li J, Wen J, Lease KA, Doke JT, Tax FE, Walker JC.(2002) BAK1, an Arabidopsis LRR receptor-like protein kinase, interacts with BRI1 and modulates brassinosteroid signaling. Cell. 110:213-22.
Lindsey K, Wei W, Clarke MC, McArdle HF, Rooke LM, Topping JF. (1993) Tagging genomic sequences that direct transgene expression by activation of a promoter trap in plants. Transgenic Res. 2:33-47.
Liu D, Zhang S, Fauque t C and Crawford NM. (1999) The Arabidopsis transposon Tag1 is active in rice, undergoing germinal transposition and restricted, late somatic excision. Mol Gen Genet. 262: 413–420.
Liu Y, Schiff M, Dinesh-Kumar SP. (2002) Virus-induced gene silencing in tomato. Plant J. 31: 777-86.
Liu YG and Whittier RF. (1995) Thermal asymmetric interlaced PCR: automatable amplification and sequencing of insert end fragments from P1 and YAC clones for chromosome walking. Genomics. 25: 674–681.
Lu R., Martin-Hernandez AM, Peart JR, Malcuit I and Baulcombe DC. (2003)Virus -induced gene silencing in plants. Methods. 30: 296-303.
Martienssen R. (1995) Patterns of gene action in plant development revealed by enhancer trap and gene trap transposable elements. Genes Dev. 9: 1797 1810.
Martienssen R.A. (1998) Functional genomics: probing plant gene function and expression with transposons. Proc Natl Acad Sci USA. 95: 2021 2026.

References 110 ________________________________________________________________________ Martienssen R, Colot V. (2001) DNA methylation and epigenetic inheritance in plants and filamentous fungi. Science. 293:1070 –1074.
Mathews H, Clendennen SK, Caldwell CG, Liu XL, Connors K, Matheis N, Schuster DK, Menasco DJ, Wagoner W, Lightner J, Wagner DR. (2003) Activation tagging in tomato identifies a transcriptional regulator of anthocyanin biosynthesis, modification, and transport. Plant Cell. 15:1689-703.
Matthews PR, Wang M, Waterhouse PM, Thornton S., Fieg SJ, Gubler F, Jacobsen JV. (2001) Marker gene elimination from transgenic barley, using co-transformation with adjacent “ twin T-DNAs” on a standard Agrobacterium transformation vector. Molecular Breeding. 7: 195-202.
Matthews DE, Carollo VL, Lazo GR and Anderson OD. (2003) GrainGenes, the genome database for small-grain crops. Nucleic Acids Res. 31: 183–186.
Mayerhofer R, Koncz-Kalman Z, Nawrath C, Bakkeren G, Crameri A, Angelis K, Redei GP, Schell J, Hohn B, Koncz C. (1991) T-DNA integration: a mode of illegitimate recombination in plants. EMBO J. 10: 697-704.
McClintock, B. (1950) Mutable loci in maize. In: Carnegie Institute of Washington Year Book, pp. 174-181, Washington.
McCallum CM, Comai L, Greene EA, Henikoff S. (2000) Targeting induced local lesions IN genomes (TILLING) for plant functional genomics. Plant Physiology. 123: 439 442.
Meissner RC, Jin H, Corminelli E, Denekamp M, Fuertes A, Greco R, Kranz HD, Penfield S, Petroni K and Urzainqui A. (1999) Function search in a large transcription factor gene family in Arabidopsis : Assessing the potential of reverse genetics to identify insertional mutations in r2r3 myb genes. Plant Cell. 11: 1827–1840.
Meissner R, Chague V, Zhu Q, Emmanuel E, Elkind Y and Levy AA. (2000) Technical advance: a high throughput system for transposon tagging and promoter trapping in tomato. Plant J. 22: 265–274.
Meza TJ, Stangeland B, Mercy IS, Skårn M, Nymoen DA, Berg A, Butenko MA, Håkelien A-M, Haslekås C, Meza-Zepeda LA et al. (2002) Analyses of single-copy Arabidopsis T-DNA transformed lines show that the presence of vector backbone sequences, short inverted repeats and DNA methylation is not sufficient or necessary for the induction of transgene silencing. Nucleic Acids Res. 30: 4556-4566.
Murray F, Brettell R, Matthews P, Bishop D, Jacobseb J. (2004) Comparision of Agrobacterium-mediated transformation of four barley cultivars using the GFP and GUS reporter genes. Plant Cell Rep. 22: 397-402.

References 111 ________________________________________________________________________ Mysore KS, Bassuner B, Deng X, Darbinian NS, Motchoulski A, Ream W and Gelvin SB. (1998) Role of the Agrobacterium tumefaciens VirD2 Protein in T-DNA Transfer and Integration. MPMI. 11: 668-683).
Nacry P, Camilleri C, Courtial B, Caboche M, Bouchez D. (1998) Major chromosomal rearrangements induced by T-DNA transformation in Arabidopsis. Genetics. 149:641-50.
Nakagawa, Y., Machida, C., Machida, Y. and Toriyama, K. (2000) Frequency and pattern of transposition of the maize transposable element Ds in transgenic rice plants. Plant Cell Physiol. 41: 733 742.
Ochman H, Geber AS and Hartl DL. (1988) Genetic applications of an inverse polymerase chain reaction. Genetics. 120: 621–623.
Ohba T, Yoshioka Y, Machida C, Machida Y. (1995) DNA rearrangement associated with the integration of T-DNA in tobacco: an example for multiple duplications of DNA around the integration target. Plant J. 7: 157-64.
Ohlrogge J. and Benning C. (2000) Unraveling plant metabolism by EST analysis. Curr Opin Plant Biol. 3: 224 228.
Ogihara Y, Mochida K, Nemoto Y, Murai K, Yamazaki Y, Shin IT and Kohara Y. (2003) Correlated clustering and virtual display of gene expression patterns in the wheat life cycle by large-scale statistical analyses of expressed sequence tags. Plant J. 33: 10011011.
Ohtsuki S, Levine M, Cai HN. (1998) Different core promoters possess distinct regulatory activities in the Drosophila embryo. Genes Dev. 12: 547-56.
Orita M, SuzukiY, Sekiya T and Hayashi, K. (1989) Rapid and sensitive detection of point mutations and DNA polymorphisms using the polymerase chain reaction. Genomics 5: 874-879.
Pan X, Li Y and Stein L. (2005) Site Preferences of Insertional Mutagenesis Agents in Arabidopsis. Plant Physiology.137: 168-175.
Parinov S, Sevugan M, Ye D, Yang WC, Kumaran M. and Sundaresan V. (1999) Analysis of flanking sequences from dissociation insertion lines: a database for reverse genetics in Arabidopsis. Plant Cell. 11: 2263 2270.
Patel M, Johnson JS,. Brettell RIS, Jacobsen J and Xue GP. (2000) Transgenic barley expressing a fungal xylanase gene in the endosperm of the deleloping grains, Mol Breed. 6:113–123.
Periera A and Saedler H. (1989) Transcriptional behavior of the maize En/Spm element in transgenic tobacco. EMBO J. 8: 1315–1321.

References 112 ________________________________________________________________________ Peter JL, Cnudde F, Gerats T. (2003) Forward genetics and map-based cloning approaches. Trend Plant Sci. 8: 484-491.
Potokina E, Sreenivasulu N, Altschmied L, Michalek W. and Graner A. (2002) Differential gene expression during seed germination in barley (Hordeum vulgare L.). Funct Integr Genomics. 2: 28 39.
Qin H, Dong Y, von Arnim AG. (2003) Epigenetic interactions between Arabidopsis transgenes: characterization in light of transgene integration sites. Plant Mol Biol. 52: 217-31.
Qin G, Kang D, Dong Y, Shen Y, Zhang L et al., (2003) Obtaining and analysis of flanking sequences from T-DNA transformants of Arabidopsis. Plant Sci. 165: 941–949.
Raina S, Mahalingam R, Chen F and Federoff N. (2002) A collection of sequenced and mapped Ds transposon insertion sites in Arabidopsis thaliana. Plant Mol Biol. 50 , 93110.
Ramachandran S and Sundaresan V. (2001) Transposons as tools for functional genomics. Plant Physio Biochem. 39: 243 252.
Ramakrishna W, Dubcovsky J, Park YJ, Busso C, Emberton J, SanMiguel P, Bennetzen JL. (2002) Different types and rates of genome evolution detected by comparative sequence analysis of orthologous segments from four cereal genomes. Genetics. 162:1389-400.
Ramsay L, Macaulay M, Ivanissevich SD, MacLean K, Cardle L, Fuller J, Edwards KJ, Tuvesson S, Morgante M, Massari A et al. (2000) A simple sequence repeat-based linkage map of barley. Genetics. 156: 1997-2005.
Read BJ, Raman H, McMichael G, Chalmers KJ, Ablett GA, Platz GJ, Raman R, Genger R, Boyd WJR, Li CD, Grime CR, Park RF, Wallwork H, Prangnell R, Lance RCM. (2003) Mapping and QTL analysis of the barley population Sloop x Halcyon. Aust J Ag Res. 54: 1145-1153.
Robbins TP, Jenkin M and Courtney-Gutterson N. (1994) Enhanced frequency of transposition of the maize transposable element Activator following excision from T-DNA in Petunia hybrida. Mol Gen Genet. 244: 491–500.
Ronning CM, Stegalkina SS, Ascenzi RA et al. (2003) Comparative analyses of potato expressed sequence tag libraries. Plant Physiol. 131 : 419 429.
Rossi L, Hohn B, and Tinland B. (1996) Integration of complete transferred DNA units is dependent on the activity of virulence E2 protein of Agrobacterium tumefaciens. Proc Natl Acad Sci USA. 93: 126-130.
References 113 ________________________________________________________________________ Sallaud C, Gay C, Larmande P, Bès M, Piffanelli P, PiéguB, Droc G, Regad F, Bourgeois E, Meynard D, Périn C, Sabau X, Ghesquière A, Glaszmann JC, Delseny M and Guiderdoni E. (2004) High throughput T-DNA insertion mutagenesis in rice: a first step towards in silico reverse genetics. Plant J. 39: 450-464.
Salvo-Garrido H, Travella S, Bilham LJ, Harwood WA and Snape JW. (2004) The Distribution of Transgene Insertion Sites in Barley Determined by Physical and Genetic Mapping. Genetics. 167: 1371-1379.
Schena M, Shalon D, Davis RW and Brown PO. (1995) Quantitative monitoring of gene expression patterns with a complementary DNA microarray. Science. 270: 467 470.
Scholtz S, Lörz H, Lutticke S. (2001) Transposition of maize transposable element Ac in barley (Hordeum vulgare L.). Mol Gen Genet. 264: 653-661.
Scot D and Sukumar S. (1992) Improved detection of mutations in the p53 gene in human tumors as single -stranded conformation polymorphs and double-stranded heteroduples DNA. PCR Methoed Appl. 2: 96-98.
Seki M, Ito T, Shibata D. and Shinozaki K. (1999) Regional insertional mutagenesis of specific genes on the CIC5F11/CIC2B9 locus of Arabidopsis thaliana chromosome 5 using the Ac /Ds transposon in combination with the cDNA scanning method. Plant Cell Physiol. 40: 624–639.
Sessions A, Burke E, Presting G, Aux G, McElver J, Patton D, Dietrich B, Ho P, Bacwaden J, Ko C, Clarke JD, Cotton D, Bullis D, Snell J, Miguel T, Hutchison D, Kimmerly B, Mitzel T, Katagiri F, Glazebrook J, Law M, Goff SA. (2002) A high-throughput Arabidopsis reverse genetics system. Plant Cell. 14: 2985 2994.
Sentinelli F, Lovari, S, Vitale M, Giorgi G., Mario U, Baroni M. (2000) A simple method for non-radioactive PCR-SSCP using MDETM gel solution and midi gel format: Application for the detection of variants in the GLUT1 and CTLA-4 genes. Journal of Biotechnology. 78: 201-204.
Shen QH, Zhou F, Bieri S, Haizel T, Shirasu K, Schulze-Lefert P. (2003) Recognition specificity and RAR1/SGT1 dependence in barley Mla disease resistance genes to the powdery mildew fungus. Plant Cell. 15: 732-44.
Springer P. (2000) Gene Traps: Tools for plant development and genomics. Plant Cell. 12: 1007–1020.
Sreenivasulu N, Altschmied L., Panitz R, Hahnel U, Michalek W, Weschke W and Wobus U. (2002) Identification of genes specifically expressed in maternal and filial tissues of barley caryopses: a cDNA array analysis. Mol Genet Genomics. 266: 758 767.
References 114 ________________________________________________________________________ Sreenivasulu, N., Altschmied, L., Radchuk, V., Gubatz, S., Wobus, U. and Weschke, W. (2004) Transcript profiles and deduced changes of metabolic pathways in maternal and filial tissues of developing barley grains. Plant J. 37: 539 553.
Stachel SE, Timmerman B and Zambryski P. (1987) Activation of Agrobacterium tumefaciens vir gene expression generates multiple single -stranded T-strand molecules from the pTiA6 T-region: requirement for 5’ virD gene products. EMBO J. 6: 857-863.
Stahl R, Horvath H, van Fleet J, Voetz M, vin Wettsteun D and Wolf N. (2002) T-DNA integration into the barley genome from single and double cassette vectors. Proc Natl Acad Sci USA. 99: 2146-2151.
Stekel DJ, Git Y and Falciani F. (2000) The comparison of gene expression from multiple cDNA libraries. Genome Res. 10: 2055-2061.
Sterky F, Regan S, Karlsson J, Hertzberg M, Rohde A, Holmberg A, Amini B, Bhalerao R, Larsson M, Villarroel R, Van Montagu M, Sandberg G, Olsson O, Teeri TT, Boerjan W, Gustafsson P, Uhlen M, Sundberg B, Lundeberg J. (1998) Gene discovery in the wood-forming tissues of poplar: analysis of 5, 692 expressed sequence tags. Proc Natl Acad Sci USA. 95: 13330 13335.
Sundaresan V, Springer P, Volpe T, Harward S, Jones JDG, Dean C and Martienssen R. (1995) Patterns of gene actions in plant development revealed by enhancer trap and gene trap transposable elements. Genes Dev. 9: 1797–1810.
Sundaresan V. (1996) Horizontal spread of transposon mutagenesis: new uses for old elements. Trends Plant Sci. 1: 184–190.
Stuurman J, Nijkamp HJJ and van Haaren MJJ. (1998) Molecular insertion-site selectivity of Ds in tomato. Plant J. 14: 215–223.
Szabados L, Kovacs I, Oberschall A, Abraham E, Kerekes I, Zsigmond L, Nagy R, Alvarado M, Krasovskaja I, Gal M, Berente A, Redei GP, Haim AB, Koncz C. (2002) Distribution of 1000 sequenced T-DNA tags in the Arabidopsis genome. Plant J. 32: 233-42.
Takahashi JS, Pinto LH and Vitaterna MN. (1994) Forward and reverse genetic approaches to behavior in mouse. Science. 264: 1724-1733.
Takken FL, Schipper D, Nijkamp HJ and Hille J. (1998) Identification and Ds-tagged isolation of a new gene at the Cf-4 locus of tomato involved in disease resistance to Cladosporium fulvum race 5. Plant J. 1: 401–411.
Thomas CM, Jones D, English JJ, Carroll BJ, Bennetzen JL, Harrison K, Burbidge A, Bishop GJ and Jones JDG. (1994) Analysis of the chromosomal distribution of

References 115 ________________________________________________________________________ transposon-carrying T-DNAs in tomato using the inverse polymerase chain reaction. Mol Gen Genet. 242: 573–585.
Till BJ, Reynolds SH, Greene EA, Codomo CA, Enns LC, Johnson JE, Burtner C, Odden AR, Young K, Taylor NE, Henikoff JG, Comai L, Henikoff S. (2003) Large -scale discovery of induced point mutations with high-throughput TILLING. Genome Res. 13:524-30.
Tingay S, McElroy D, Kalla R, Fieg S, Wang M, Thornton S, Brettell R. (1997) Agrobacterium tumefaciens-mediated barley transformation. Plant J. 11:1369–1376.
Tinland B. (1996) The integration of T-DNA into plant genomes. Trends Plant Sci. 1: 178-184.
Tissier AF, Marillonnet S, Kimyuk V, Patel K, Torres MA, Murphy G and Jones JDG. (1999) Multiple independent defective Suppressor -mutator transposon insertions in Arabidopsis: A tool for functional genomics. Plant Cell. 11: 1841–1852.
Topping JF, Lindsey K. (1997) Promoter trap markers differentiate structural and positional components of polar development in Arabidopsis. Plant Cell. 9:1713-25.
Triezenberg SJ, Kingsbury RC, McKnight SL. (1988) Functional dissection of VP16, the trans-activator of herpes simplex virus immediate early gene expression. Genes Dev. 2: 718-29.
Trifonova A, Madsen S, Olesen A (2001) Agrobacterium-mediated transgene delivery and integration into barley under a range of in vitro culture conditions. Plant Sci. 161: 871–880.
Van der Hoeven R, Ronning C, Giovannoni J, Martin G and Tanksley S. (2002) Deductions about the number, organization, and evolution of genes in the tomato genome based on analysis of a large expressed sequence tag collection and selective genomic sequencing. Plant Cell. 14: 1441 1456.
Van Sluys MA, Tempe J and Federoff N. (1987) Studies on the introduction and mobility of the maize Activator element in Arabidopsis thaliana and Daucus carota. EMBO J. 6: 3881–3889.
Wan, Y, Lemaux PG. (1994) Generation of large number of independently transformed fertile barley plants. Plant Physiol. 104 : 37-48.
Wang MB, Upadhyaya NM, Brettell RIS, Waterhouse PM. (1997) Intron-mediated improvement of a selectable marker gene for plant transformation using Agrobacterium tumefaciens. J Gen Breed. 51: 325–334.

References 116 ________________________________________________________________________ Wang MB, Li Z, Matthews PR, Upadhyaya NM, Waterhouse PM. (1998) Improved vectors for Agrobacterium tumefaciens-mediated transformation of monocot plants. Acta Hortic. 461: 401–407.
Waterhouse PM and Helliwell CA. (2003) Exploring plant genomes by RNA-induced gene silencing. Nat. Rev. Genet. 4: 29–38.
Wei F, Gobelman-Werner K, Morroll SM, Kurth J, Mao L, Wing R, Leister D, Schulze-Lefert P, Wise RP. (1999) The Mla (powdery mildew) resistance cluster is associated with three NBS-LRR gene families and suppressed recombination within a 240-kb DNA interval on chromosome 5S (1HS) of barley. Genetics. 153: 1929-48.
Wei F, Wing RA, Wise RP. (2002) Genome dynamics and evolution of the Mla (powdery mildew) resistance locus in barley. Plant Cell. 14:1903-17.
Weigel D, Ahn JH, Blazquez MA, Borevitz JO, Christensen SK, Fankhauser C, Ferrandiz C, Kardailsky I, Malancharuvil EJ, Neff MM, Nguyen JT, Sato S, Wang ZY, Xia Y, Dixon RA, Harrison MJ, Lamb CJ, Yanofsky MF, Chory J. (2000) Activation tagging in Arabidopsis. Plant Physiol. 122: 1003-13.
Windels P, Sylvie De Buck, Erik Van Bockstaele, Marc De Loose, and Ann Depicker (2003) T-DNA Integration in Arabidopsis Chromosomes. Presence and Origin of Filler DNA Sequences. Plant Physiol. 133: 2061-2068.
Winkler RG, Frank MR, Galbraith DW, Feyereisen R, Feldmann KA. (1998) Systematic reverse genetics of transfer-DNA-tagged lines of Arabidopsis. Isolation of mutations in the cytochrome p450 gene superfamily. Plant Physiol. 118: 743-50.
von Wettstein-Knowles P. (1992) Cloned and mapped genes: current status. In PR Shewry, ed, Barley: Genetics, Biochemistry, Molecular Biology and Biotechnology. C.A.B. International, Wallingford, UK, pp 73-98
Wu C, Li X, Yuan W, Chen G, Kilian A, Li J, Xu C, Li X, Zhou DX, Wang S, Zhang Q. (2003) Development of enhancer trap lines for functional analysis of the rice genome. Plant J. 35: 418-27.
Xia Y, Suzuki H, Borevitz J, Blount J, Guo Z, Patel K, Dixon RA, Lamb C. (2004) An extracellular aspartic protease functions in Arabidopsis disease resistance signaling. EMBO J. 23:980-8.
Yanofsky MF, Porter S G, Young C, Albright LM, Gordon MP and Nester EW. (1986) The virD operon of Agrobacterium tumefaciens encodes a site-specific endonuclease. Cell. 47: 471-477.
Yu Y, Tomkins JP, Waugh R, Frisch DA, Kudrna D, Kleinhofs A, Brueggeman RS, Muehlbauer GJ, Wise RP, Wing RA. (2000) A bacterial artificial chromosome library for

References 117 ________________________________________________________________________ barley (Hordeum vulgare L.) and the identification of clones containing putative resistance genes. Theor Appl Genet. 101:1093–1099.
Yu, J., Hu, S., Wang, J. et al. (2002) A draft sequence of the rice genome (Oryza sativa L. ssp. indica). Science. 296: 79 92.
Zhao Y, Christensen SK, Fankhauser C, Cashman JR, Cohen JD, Weigel D, Chory J. (2001) A role for flavin monooxygenase-like enzymes in auxin biosynthesis. Science. 291: 306-9.
Zhang H, Sreenivasulu N, Weschke W, Stein N, Rudd S, Radchuk V, Potokina E, Scholz U, Schweizer P, Zierold U, Langridge P, Varshney RK, Wobus U, Graner A. (2004) Large-scale analysis of the barley transcriptome based on expressed sequence tags. Plant J. 40:276-90.
Zhou F, Kurth J, Wei F, Elliott C, Vale G, Yahiaoui N, Keller B, Somerville S, Wise R, Schulze-Lefert P. (2001) Cell-autonomous expression of barley Mla1 confers race-specific resistance to the powdery mildew fungus via a Rar1-independent signaling pathway. Plant Cell. 13: 337-50.
Zohary D and Hope M. (1993) Domestication of plant in the Old World. The origin and spread of cultivated plants in West Asia, Europe and the Nile Vallery. Clarendon Press, Oxford, England.

Appendix 118 ________________________________________________________________________
Appendix
Table A. Summary of the BLASTN search of genomic DNA flanking T-DNA insertions T-DNA lines
RB or LB flanking sequences
Accession Alignment E-Val %ID Length
28-1A RB BG904855 Triticum aestivum cDNA clone TaLr1135D06 5'
e-100 87 349
28-3A LB No good matches
28-9A RB LB
AF521177 AF521177
Hordeum vulgare contig 211252, Retrotransposon BARE-1_211E24_1 Hordeum vulgare contig 211252 Retrotransposon BARE-1_211E24_1
0.00 0.00
98 98
627 833
28-10A RB No good matches
28-12A RB LB
BU992556 BQ661258
Hordeum vulgare cDNA clone HD10O02 Hordeum vulgare subsp. Vulgare cDNA clone HM02K21
2e-89 3e-80
96 96
188 173
28-13A RB BQ659039 Hordeum vulgare cDNA clone HD02E11
e-104 100 193
28-14A RB No good matches
28-16A LB AF427791 Hordeum vulgare Mla locus 4e-37 80 299 28-22A LB AJ279072 Hordeum vulgare BARE-2 and
partial BAGY-2, gene="BAGY-2 3'LTR (interrupted by BARE-2)
0.0 95 551
28-27A RB No good matches
28-30A RB AF474071 Hordeum vulgare subsp. vulgare cultivar Morex BAC clone 745
0.00 96 527
28-31A RB No good matches
28-32A LB AY485643 Hordeum vulgare subsp. vulgare BAC 615K1, Copia retrotransposon BARE1_AY485643-1
e-180 87 550
28-34A RB LB
AY643844 AY643844
Hordeum vulgare subsp. vulgareclones BAC 799C8 and 122A5 gypsy-like LTR-retrotransposon Vagabond
0.00 0.00
95 94
599 643
28-35A RB LB
BG415275.1 AF474982 AF474982
Hordeum vulgare subsp. Vulgare cDNA clone HVSMEk0005N06f Hordeum vulgare clone BAC 011009
1.4e-82 7e-27 6e-20
93 90 88
216 90 91

Appendix 119 ________________________________________________________________________
28-36A RB LB
BU975313 AV836977.1
Hordeum vulgare subsp. Vulgare cDNA clone HB30M08 Hordeum vulgare subsp . vulgare cDNA clone basd21c13
3e-30 1.2e-44
92 86
89 200
28-40A RB CA626177.1 Triticum aestivum cDNA clone wl1n.pk0130.g10 5'
1.3e-26 100 62
28-51A RB CA657048 Triticum aestivum cDNA 88 48 wlm0.pk0027.d6 5' end clone
4e-07 88 48
28-52A RB LB
BE515461 BM097817
Wheat ABA -treated embryo cDNA library Triticum aestivum cDNA clone WHE0613_E05_I09 EBem04 Hordeum vulgare subsp.vulgare cDNA clone EBem04_SQ002_M15
5e-17 0.0
83 99
109 530
29-7A RB LB
AF474373 CB873432.1
Hordeum vulgare BAC 259I16 LTR-retrotransposon BARE-1 Hordeum vulgare cDNA clone HC12B19
0.0 8.1e-47
96 92
380 95
29-9A LB BU992852 Hordeum vulgare cDNA clone HD11N10
8e-42 85 189
29-11A LB CA595770 Triticum aestivum cDNA clone 1e-22 82 140 29-16A LB CA657628.1 Triticum aestivum cDNA clone
wlm0.pk038.k19 wpa1c.pk010.p10
4.0e-19 93 66
29-17A LB No good matches
29-19A RB LB
AV836795 X64254
Hordeum vulgare subsp. Vulgare cDNA clone basd3f01 H.vulgare mRNA for seed protein B32E
1e-35 2e-43
94 93
102 117
29-22A LB X16096 Barley relic DNA HVT02, tandemly repeated seq
2e-32 84 194
29-25A LB AY368673 Triticum turgidum HMW-glutenin locus LTR retrotranposon Gasy_107M9-1
2e-96 86 377
29-26A RB LB
AB063248 BI480461.1
Hordeum vulgare DMAS1 mRNA for deoxymugineic acid synthase 1 Triticum aestivum cDNA clone WHE2903_D07_H13
1e-97 8.6e-27
100 97
184 71
29-33A LB AF474071.1 Hordeum vulgare subsp. vulgare cultivar Morex BAC clone 745c13 Similar to region between Sabrina LTR-2 and LTR-3 in AF254799
0.0 91 563
29-34A LB No good matches
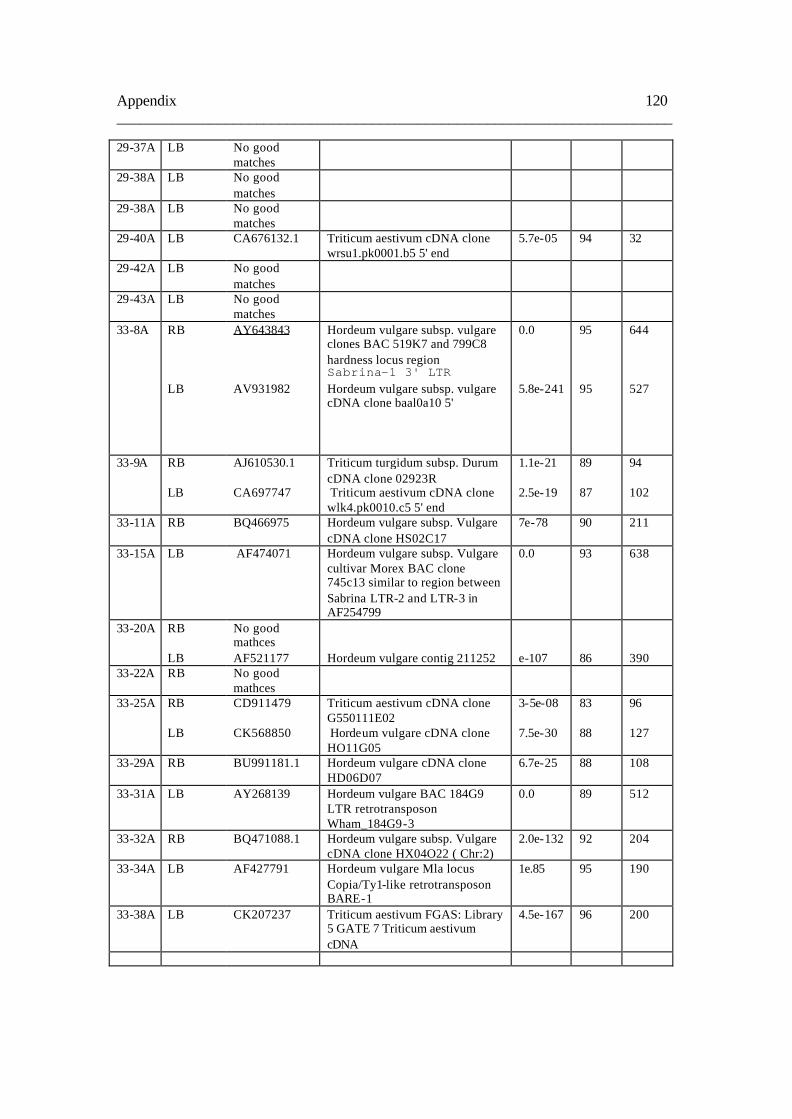
Appendix 120 ________________________________________________________________________
29-37A LB No good matches
29-38A LB No good matches
29-38A LB No good matches
29-40A LB CA676132.1 Triticum aestivum cDNA clone wrsu1.pk0001.b5 5' end
5.7e-05 94 32
29-42A LB No good matches
29-43A LB No good matches
33-8A RB LB
AY643843 AV931982
Hordeum vulgare subsp. vulgare clones BAC 519K7 and 799C8 hardness locus region Sabrina-1 3' LTR Hordeum vulgare subsp. vulgare cDNA clone baal0a10 5'
0.0 5.8e-241
95 95
644 527
33-9A RB LB
AJ610530.1 CA697747
Triticum turgidum subsp. Durum cDNA clone 02923R Triticum aestivum cDNA clone wlk4.pk0010.c5 5' end
1.1e-21 2.5e-19
89 87
94 102
33-11A RB BQ466975 Hordeum vulgare subsp. Vulgare cDNA clone HS02C17
7e-78 90 211
33-15A LB AF474071 Hordeum vulgare subsp. Vulgare cultivar Morex BAC clone 745c13 similar to region between Sabrina LTR-2 and LTR-3 in AF254799
0.0 93 638
33-20A RB LB
No good mathces AF521177
Hordeum vulgare contig 211252
e-107
86
390
33-22A RB No good mathces
33-25A RB LB
CD911479 CK568850
Triticum aestivum cDNA clone G550111E02 Hordeum vulgare cDNA clone HO11G05
3-5e-08 7.5e-30
83 88
96 127
33-29A RB BU991181.1 Hordeum vulgare cDNA clone HD06D07
6.7e-25 88 108
33-31A LB AY268139 Hordeum vulgare BAC 184G9 LTR retrotransposon Wham_184G9-3
0.0 89 512
33-32A RB BQ471088.1 Hordeum vulgare subsp. Vulgare cDNA clone HX04O22 ( Chr:2)
2.0e-132 92 204
33-34A LB AF427791 Hordeum vulgare Mla locus Copia/Ty1-like retrotransposon BARE-1
1e.85 95 190
33-38A LB CK207237 Triticum aestivum FGAS: Library 5 GATE 7 Triticum aestivum cDNA
4.5e-167 96 200

Appendix 121 ________________________________________________________________________
RB LB
AF427791 AF427791
Hordeum vulgare Mla locus Gypsy/Ty3-like retrotransposon Sukkula Hordeum vulgare Mla locus miniature inverted transposable element-like sequence
e-107 1e-20
91 89
301 92
33-42A LB AF521177 AJ474602
Hordeum vulgare contig 211252 Hordeum vulgare cDNA clone S0000800163F07F1
1e-90 1.9e-102
91 94
244 159
33-45A RB LB
AY268139 AY268139
Hordeum vulgare BAC 184G9 LTR retrotransposon Wham_184G9-3 Hordeum vulgare BAC 184G9, LTR retrotransposon Bare-1_184G9-6p"
2e-73 1e-44
91 95
213 105
33-48A LB L36882 Hordeum vulgare thionin (bth6) gene
7e-90 87 330
33-49A RB CD927703 Triticum aestivum cDNA clone GR45102O20
1.4e-55 98 73
33-50A RB AY643843 Hordeum vulgare subsp. vulgare clones BAC 519K7 and 799C8 hardness locus region BAGY-2 polyprotein
0.0 92 627
33-55A LB BM097351.2 EBro01 Hordeum vulgare subsp vulgare cDNA clone EBro01_SQ004_O05 5' clone HD13I08
3.8e-205 97 93
33-56A RB LB
AF474071 AF474071
Hordeum vulgare subsp. Vulgare Cultivar Morex BAC clone 745c13 Copia/Ty1-like retrotransposon BARE-1 Copia/Ty1-like retrotransposon BARE-1
6e-59 5e-81
89 89
192 243
33-58A LB CB881224 Hordeum vulgare subsp. vulgare cDNA clone HM09C12
1.4e-161 96 320
33-61A RB LB
BF617619.3 BI948107.1
Hordeum vulgare seedling shoot EST library HVcDNA0003 Hordeum vulgare spike EST library HVcDNA0012 (Fusarium infected) Hordeum vulgare subsp. Vulgare cDNA clone HVSMEl0008D17f
1.9e-280 6.8e-31
96 92
579 91
39-2B LB No good matches
39-10A LB No good matches
39-13A RB LB
CB863869.1 No good matches
Hordeum vulgare cDNA clone HH07E10
6.5e-24 95 70
39-19A LB Barley1_16492 Aspartic protease-like e-161 100 288 39-29A
RB
CA015863
Hordeum vulgare subsp. vulgare cDNA clone HV11L24
1.5e-126
98
240

Appendix 122 ________________________________________________________________________
LB
AF427791.1 BQ661082.1 AF427791.1
Hordeum vulgare Mla locus Hordeum vulgare subsp. vulgare cDNA clone HM01N08 Hordeum vulgare Mla locus
e-117 1.3e-162 3e-80
97 100 96
234 288 176
39-30A LB No good mathces
39-39A RB AY485644 Triticum monococcum phosphatidylserine decarboxylase, ZCCT2, ZCCT1, and SNF2genes
3e-07 81 96
40-7A LB CD930953.1 Triticum aestivum cDNA clone GR45112P24
6.0e-103 92 135
40-21A RB LB
No good matches No good mathces
40-26B LB No good mathces
40-28B LB AY643844 Hordeum vulgare subsp. vulgare clones BAC 799C8 and 122A5 hardness locus region copia-like LTR-retrotransposon BARE
e-155 98 291
40-32A RB LB
BU994527.1 AL816224.1
Hordeum vulgare subsp. vulgare cDNA clone HM07F17 Triticum aestivum cDNA clone G04_j122_plate_1
2.3e-27 1.3e-25
87 83
127 176
40-33A LB CA007005.1 Hordeum vulgare subsp. vulgare cDNA clone HU06H04
1.1e-86 87 323
40-38A LB AJ279072 Hordeum vulgare BARE-2 and partial BAGY-2 retrotransposons
1e-66 95 154
40-50A RB AF474071. Hordeum vulgare subsp. cultivar Morex BAC clone 745c 13 LTR retrotransposon Leojyg_184G9-1vulgare
0.0 93 486
41-1A RB AY643843 Hordeum vulgare subsp. vulgare clones BAC 519K7 and 799C8 hardness locus region gypsy-like LTR- retrotransposon Sabrina-1
0.0 95 499
41-9A RB No good matches
41-19B RB AF427791 Hordeum vulgare Mla locus Copia/Ty1-like retrotransposon BARE-1
0.0 97 420
41-30A RB LB
AJ470226.1 BQ461754.1
Hordeum vulgare cDNA clone S0000800204G06F1 Hordeum vulgare cDNA clone
2.9e-37 7.4e-143
100 97
80 287
41-33A LB No good mathces
41-37A RB LB
No good matches CA007005
Hordeum vulgare subsp. vulgare cDNA clone HU06H04
9e-85
87
280
41-38A LB No good

Appendix 123 ________________________________________________________________________
mathes 41-39A RB No good
matches
41-44B LB BU994527.1 Hordeum vulgare subsp. Vulgare cDNA clone HM07F17
2.3e-27 87 127
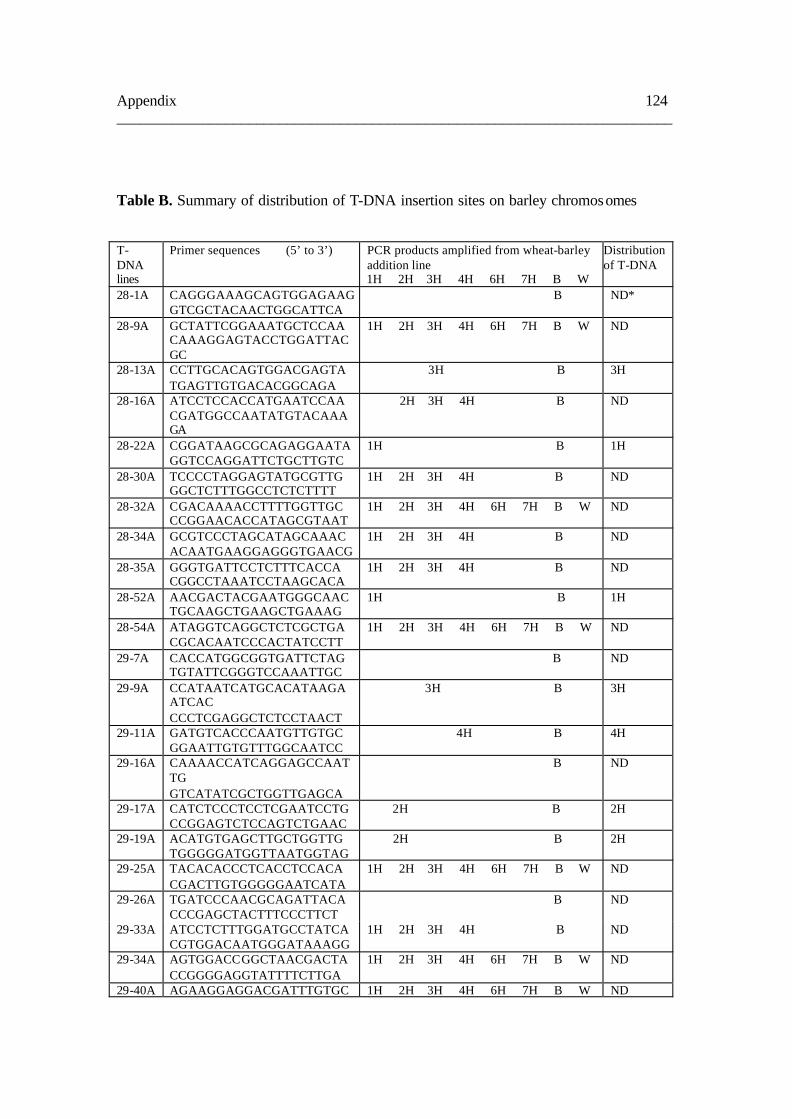
Appendix 124 ________________________________________________________________________
Table B. Summary of distribution of T-DNA insertion sites on barley chromosomes
T-DNA lines
Primer sequences (5’ to 3’) PCR products amplified from wheat-barley addition line
1H 2H 3H 4H 6H 7H B W
Distribution of T-DNA
28-1A CAGGGAAAGCAGTGGAGAAG GTCGCTACAACTGGCATTCA
B ND*
28-9A GCTATTCGGAAATGCTCCAA CAAAGGAGTACCTGGATTACGC
1H 2H 3H 4H 6H 7H B W ND
28-13A CCTTGCACAGTGGACGAGTA TGAGTTGTGACACGGCAGA
3H B 3H
28-16A ATCCTCCACCATGAATCCAA CGATGGCCAATATGTACAAAGA
2H 3H 4H B ND
28-22A CGGATAAGCGCAGAGGAATA GGTCCAGGATTCTGCTTGTC
1H B
1H
28-30A TCCCCTAGGAGTATGCGTTG GGCTCTTTGGCCTCTCTTTT
1H 2H 3H 4H B ND
28-32A CGACAAAACCTTTTGGTTGC CCGGAACACCATAGCGTAAT
1H 2H 3H 4H 6H 7H B W ND
28-34A GCGTCCCTAGCATAGCAAAC ACAATGAAGGAGGGTGAACG
1H 2H 3H 4H B ND
28-35A GGGTGATTCCTCTTTCACCA CGGCCTAAATCCTAAGCACA
1H 2H 3H 4H B ND
28-52A AACGACTACGAATGGGCAAC TGCAAGCTGAAGCTGAAAG
1H B 1H
28-54A ATAGGTCAGGCTCTCGCTGA CGCACAATCCCACTATCCTT
1H 2H 3H 4H 6H 7H B W ND
29-7A CACCATGGCGGTGATTCTAG TGTATTCGGGTCCAAATTGC
B ND
29-9A CCATAATCATGCACATAAGA ATCAC CCCTCGAGGCTCTCCTAACT
3H B 3H
29-11A GATGTCACCCAATGTTGTGC GGAATTGTGTTTGGCAATCC
4H B 4H
29-16A CAAAACCATCAGGAGCCAATTG GTCATATCGCTGGTTGAGCA
B ND
29-17A CATCTCCCTCCTCGAATCCTG CCGGAGTCTCCAGTCTGAAC
2H B 2H
29-19A ACATGTGAGCTTGCTGGTTG TGGGGGATGGTTAATGGTAG
2H B 2H
29-25A TACACACCCTCACCTCCACA CGACTTGTGGGGGAATCATA
1H 2H 3H 4H 6H 7H B W ND
29-26A TGATCCCAACGCAGATTACA CCCGAGCTACTTTCCCTTCT
B ND
29-33A ATCCTCTTTGGATGCCTATCA CGTGGACAATGGGATAAAGG
1H 2H 3H 4H B ND
29-34A AGTGGACCGGCTAACGACTA CCGGGGAGGTATTTTCTTGA
1H 2H 3H 4H 6H 7H B W ND
29-40A AGAAGGAGGACGATTTGTGC 1H 2H 3H 4H 6H 7H B W ND
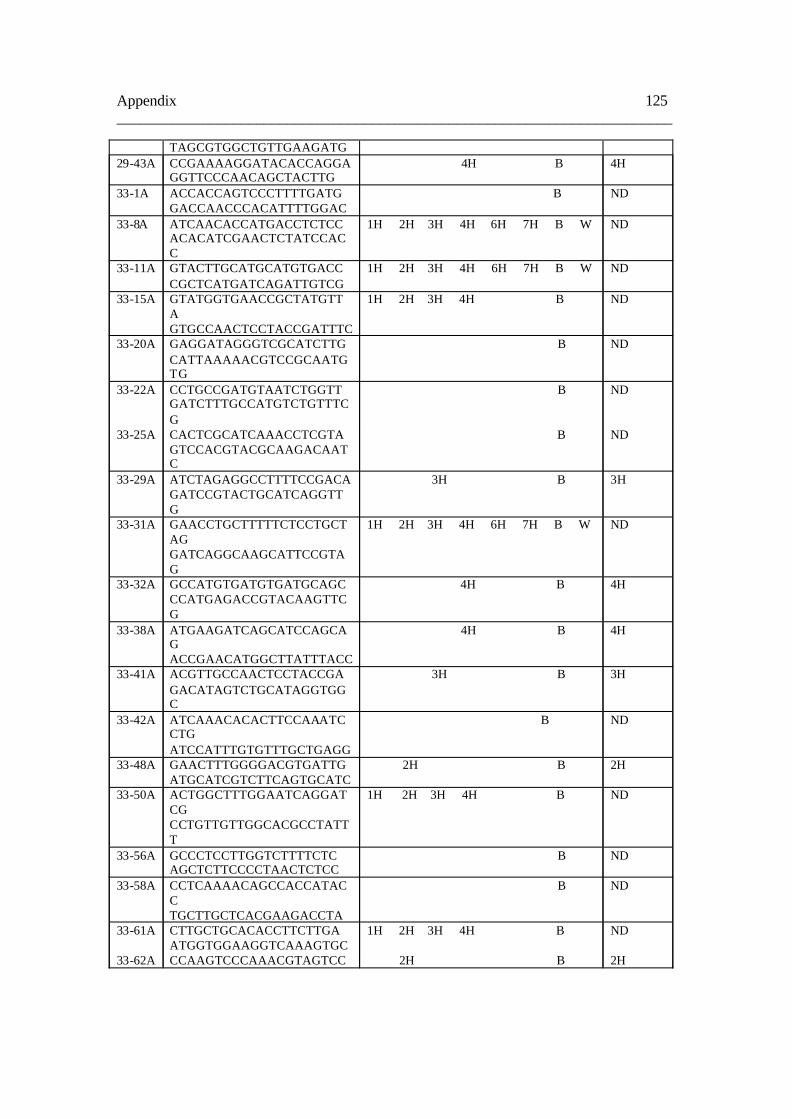
Appendix 125 ________________________________________________________________________
TAGCGTGGCTGTTGAAGATG 29-43A CCGAAAAGGATACACCAGGA
GGTTCCCAACAGCTACTTG 4H B 4H
33-1A ACCACCAGTCCCTTTTGATG GACCAACCCACATTTTGGAC
B ND
33-8A ATCAACACCATGACCTCTCC ACACATCGAACTCTATCCACC
1H 2H 3H 4H 6H 7H B W ND
33-11A GTACTTGCATGCATGTGACC CGCTCATGATCAGATTGTCG
1H 2H 3H 4H 6H 7H B W ND
33-15A GTATGGTGAACCGCTATGTTA GTGCCAACTCCTACCGATTTC
1H 2H 3H 4H B ND
33-20A GAGGATAGGGTCGCATCTTG CATTAAAAACGTCCGCAATGTG
B ND
33-22A CCTGCCGATGTAATCTGGTT GATCTTTGCCATGTCTGTTTCG
B ND
33-25A CACTCGCATCAAACCTCGTA GTCCACGTACGCAAGACAATC
B ND
33-29A ATCTAGAGGCCTTTTCCGACA GATCCGTACTGCATCAGGTTG
3H B 3H
33-31A GAACCTGCTTTTTCTCCTGCTAG GATCAGGCAAGCATTCCGTAG
1H 2H 3H 4H 6H 7H B W ND
33-32A GCCATGTGATGTGATGCAGC CCATGAGACCGTACAAGTTCG
4H B 4H
33-38A ATGAAGATCAGCATCCAGCAG ACCGAACATGGCTTATTTACC
4H B 4H
33-41A ACGTTGCCAACTCCTACCGA GACATAGTCTGCATAGGTGGC
3H B 3H
33-42A ATCAAACACACTTCCAAATCCTG ATCCATTTGTGTTTGCTGAGG
B ND
33-48A GAACTTTGGGGACGTGATTG ATGCATCGTCTTCAGTGCATC
2H B 2H
33-50A ACTGGCTTTGGAATCAGGATCG CCTGTTGTTGGCACGCCTATTT
1H 2H 3H 4H B ND
33-56A GCCCTCCTTGGTCTTTTCTC AGCTCTTCCCCTAACTCTCC
B ND
33-58A CCTCAAAACAGCCACCATACC TGCTTGCTCACGAAGACCTA
B ND
33-61A CTTGCTGCACACCTTCTTGA ATGGTGGAAGGTCAAAGTGC
1H 2H 3H 4H B ND
33-62A CCAAGTCCCAAACGTAGTCC 2H B 2H

Appendix 126 ________________________________________________________________________
ND*: the distribution of D-DNA insertions on barely chromosome can not be determined.
ATCGATCCATCGATGACCG 39-10A AGTTCGTTGGTTGGTTACGC
GACCAGTGCTCCTCTCCTGT 4H B 4H
39-13A TGGGAACGTGACTGAATGAA GAGCGTAGGCAAAGAGATGG
4H B 4H
39-27A CGCCTCATTCGATCGTTGTA CGGGGAGGTATCACAACACA
1H 2H 3H 4H 6H 7H B W ND
39-29A CCACTATCGTTTATGGGTTATGC GATGCATTTATCCGCTTTGG
1H 2H 3H 4H 6H 7H B W ND
39-30A CTCGAAGTCCTCCTCCATTG TTTCTCGCCCCTCACTTCTA
1H 4H B ND
39-39A CCGTCGTCACGTGTTGTACTC CGTCGAGATCTCCAAAACTTG
B ND
39-45A CTGAGGCATGTGAAGGAGGT CCGCATGCTATCCTAGCC
B ND
40-7A GCACCGCTCTCGGTATAAAG GACACCACCTTGGCTGAAAG
B ND
40-33A GGGACATTTTGAACTCAGG AGGAGGGAGCGTTTTTCAGT
B ND
40-38A GAAAGGCAAGGGCTAGAAGG TTACGATGTAGCTTGCGCTAT
B ND
40-50A TGCTTGGTGTTCTTGCTGAG CATCCCGAGAGATACGCATT
1H 2H 3H 4H 6H 7H B W ND
41-1A AAGAGGCCTAAGAGCCCAAA AAAAGGCATGCAAAACATCC
1H 2H 3H 4H B ND
41-9A TCTCAGAATGCCACAAAATG GTAGCACCAAGTGCAGCAAA
B ND
41-19A CCACATATCAGGAACCTCGAA CCGGGGAGGTATCTCCAATA
1H 2H 3H 4H B ND
41-30A AACATGCAAGCACACGTCAT CATGATTGCTGTGGCTGACT
B ND

127 ________________________________________________________________________
Acknowledgements
I would like to thank Prof. Dr. Paul Schulze -Lefert for giving me the opportunity to
pursue my doctoral thesis at the Max-Plank Institute. I am grateful to his excellent
advices and support throughout my study.
I shall appreciate Dr. Thomas Koprek for his excellent guidance and unlimited
encouragement as well as extreme kindness in all aspects during my stay in the lab and
Köln. I will be forever grateful for his help and prompt availability whenever needed.
I would like to thank Sabine Schulze and Caren Davidson for their help in barley
transformation and green house work, respectively.
I also wish to acknowledge Anil Kumar Batchu and Zimmermann Dominik for their help
when needed. They were quite helpful in the lab and during the preparation of this thesis.
I also appreciate the help from Chaoying He, Sigi Effgen, and other colleagues in MPIZ.
I enjoyed and learned a lot from the excellent scientific research atmosphere in MPIZ.
My special thanks go to my wife who has given me unbe lievable support in every aspect.
She deserves equal credits that I deserve from this doctoral thesis.
128 ________________________________________________________________________
Erklärung
"Ich versichere, daß ich die von mir vorgelegte Dissertation selbständig angefertigt, die
benutzten Quellen und Hilfsmittel vollständig angegeben und die Stellen der Arbeit -
einschließlich Tabellen, Karten und Abbildungen -, die anderen Werken im Wortlaut
oder dem Sinn nach entnommen sind, in jedem Einzelfall als Entlehnung kenntlich
gemacht habe; daß diese Dissertation noch keiner anderen Fakultät oder Universität zur
Prüfung vorgelegen hat; daß sie - abgesehen von unten angegebenen Teilpublikationen –
noch nicht veröffentlicht worden ist sowie, daß ich eine solche Veröffentlichung vor
Abschluß des Promotionsverfahrens nicht vornehmen werde. Die Bestimmungen dieser
Promotionsordnung sind mir bekannt. Die von mir vorgelegte Dissertation ist von Prof.
Dr. Paul Schulze-Lefert betreut worden"
Köln, im May 2005
Ein Teil dieser Arbeit wurde bereits veröffentlicht
Koprek T, Zhao T, Zimmermann D, Schulze-Lefert P. (2003) Systematic Ac/Ds
transposon mutagenesis in barley. EUCARPIA Proceedings "From Biodiversity to
Genomics: Breeding Strategies for Small Grain Cereals in the Third Millennium". 453-
456.
Zhao T, Koprek T. (2004) Development of a Two-Componebt Ac/Ds System for
Functional Genomics in Barley. 9th International Barley Genetics Symposium, Brno,
Czech Republic, pp76.

129 ________________________________________________________________________
Lebenslauf
Persönliche Daten
Name Zhao Vorname Tiehan Geburtsdatum and ort: 27. 05. 1960 Nationalität Chinesisch Adresse Kolibriweg 14, 50829, Köln Ausbildung Seit 2001 Promotion am Max-Planck-Institut für Züchtungsforschung in Köln in der Abteilung von Prof. Paul Schulze-Lefert unter der
Betreuung von Dr. Thomas Koprek 1999-2001 Gastwissenschaftler, Department of Plant Pathology, Kansas State University, Manhattan, KS, USA. 1997-1998 Wissenschaftlicher Mitarbeiter, National Key Lab for Plant Cell & Chromosome Engineering, Institute of Genetics, Chinese Academy of Sciences, Beijing, China 1995-1997 Gastwissenschaftler, Institut für Pflanzenwissenschaften, ETH Zürich, Schweiz 1987-1995 Wissenschaftlicher Mitarbeiter, National Key Lab for Plant Cell & Chromosome Engineering, Institut für Genetik , Chinese Academy of Sciences , Beijing, China 1984-1987 Master’s Degree in Pflanzengenetik am Institut für Genetik, Chinese Academy of Sciences, Beijing, China 1983-1984 Biologielehrer an der High School, Liaoyun, China 1979-1983 Bachelor’s Degree in Biologie an der Northeast Normal University, Changchun, China