
DEVELOPMENT OF A METHOD FOR SPACECRAFT POTABLE WATER FINAL REPORT · 2013-08-31 · DEVELOPMENT OF...
37
DEVELOPMENT OF A METHOD FOR THE DETERMINATION OF IODINE IN SPACECRAFT POTABLE WATER FINAL REPORT ON Contract NAS9-11861 Prepared by George P. Whittle Principal Investigator E OFFICE OF PRIME RESPONSIBILITY , Dh Submitted to The National Aeronautics and Space Administration Manned Spacecraft Center Houston, Texas 77058 Submitted by University of Alabama College of Engineering Bureau of Engineering Research BER Report No. 147-14 University, Alabama 35486 March, 1972 https://ntrs.nasa.gov/search.jsp?R=19720015449 2020-02-09T21:13:36+00:00Z
Transcript of DEVELOPMENT OF A METHOD FOR SPACECRAFT POTABLE WATER FINAL REPORT · 2013-08-31 · DEVELOPMENT OF...

DEVELOPMENT OF A METHOD FOR
THE DETERMINATION OF IODINE IN
SPACECRAFT POTABLE WATER
FINAL REPORT
ON
Contract NAS9-11861
Prepared by
George P. WhittlePrincipal Investigator
E
OFFICE OF PRIME RESPONSIBILITY ,
Dh
Submitted to
The National Aeronautics and Space AdministrationManned Spacecraft CenterHouston, Texas 77058
Submitted by
University of AlabamaCollege of Engineering
Bureau of Engineering Research
BER Report No. 147-14
University, Alabama 35486March, 1972
https://ntrs.nasa.gov/search.jsp?R=19720015449 2020-02-09T21:13:36+00:00Z

DEVELOPMENT OF A METHOD FOR
THE DETERMINATION OF IODINE IN
SPACECRAFT POTABLE WATER
FINAL REPORT
On
Contract NAS9-11861
Prepared by
George P. WhittlePrincipal Investigator
Submitted to
The National Aeronautics and Space AdministrationManned Spacecraft CenterHouston, Texas 77058
Submitted by
University of Alabama;>. :-. College of EngineeringBureau of Engineering Research
BER Report No. 147-14
University, Alabama 35486
March, 1972

ABSTRACT
A one-reagent indicator solution has been prepared for the analysis of
iodine concentrations in the range of 0.5 to 12 mg/1 of ~L<^ for use on the
potable water proposed for the Skylab project. The indicator solution was
formulated to contain the minimum concentrations of reagents for optimum
analytical performance. Performance tests indicated that the reagent is
stable for at least six months and is reliable for the determination of 1^
under a variety of conditions of I" concentrations and sample temperatures.
Visual estimations as low as 0.5 mg/1 were obtained without difficulty and
the stability of the developed color allows visual determinations from 0.5
to 12 mg/1 of J.2 with a relatively small error.

TABLE .OF CONTENTS
Page
ABSTRACT . „ . . . . . « "i
TABLE OF CONTENTS , ii
LIST OF FIGURES iv
LIST OF TABLES . v
SECTION
I. INTRODUCTION . . . 1
1.1 Justification For Study 11.2 Background . 11.3 Objective of Study 2
II. TECHNICAL APPROACH 3
2.1 Theoretical"Considerations 32.2 Skylab Considerations 42.3 Experimental Design 5
III. EXPERIMENTAL. 7
3.1 Reagents ...... 73.2 Equipment 73.3 Measurement of Absorbance 73.4 Indicator Concentration 83.5 Evaluation of Complexing Agents 83.6 New Buffer Compositions 93.7 One-Reagent Method , 103.8 Sample To Indicator Ratios 103.9 Temperature Effects 103.10 Visual Estimation 10
RESULTS 11
4.1 Selection of Complexing Agent II4.2 Combined Indicator-Buffer Solutions. . 144.3 Evaluation of One-Reagent Indicators 144.4 Sample to Indicator Ratios 204.5 Temperature Effects 204.6 Stability of Developed Colors 204.7 ~ Visual Tests" 7 . ". 7. "". ~.' ~. . : . ~. V . . V .:; ~. ,~ . . 22-
ii

V. DISCUSSION OF RESULTS . - 23
5.1 One-Reagent Indicator. . . . . 23"5.2 Maximum Total I Concentration 2?5.3 Skylab Iodine Addition T55.4 Stability of Reagent ' 265.5 Stability of Developed Colors , 265.6 Effect of Temperature. . 2"65.7 Visual Estimation. . 27
VI. CONCLUSIONS 28
VII. RECOMMENDATIONS 29
REFERENCES AND BIBLIOGRAPHY. , 30
APPENDIX I 31Equipment Purchased with Contract Funds
iii
LIST OF FIGURES
Figure Page
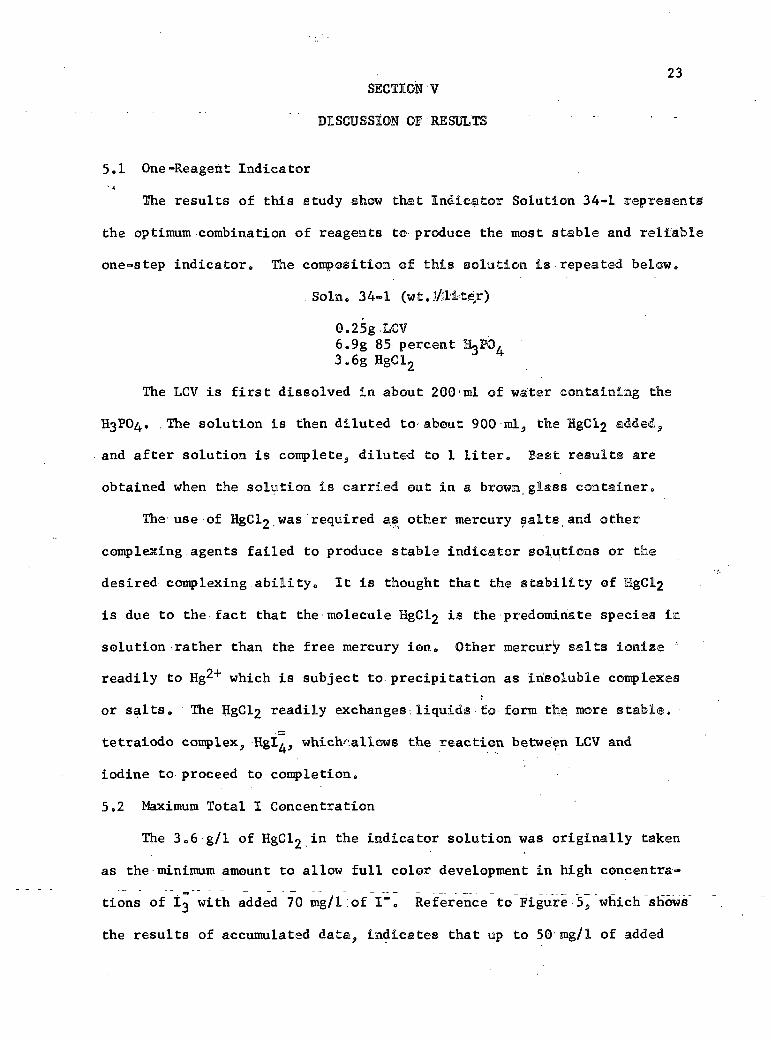
1. Minimum HgCl2 Concentration to Produce Complete ColorDevelopment for Various Iodide Ion Concentrations 12
i
2. Absorbance Curve for 12 Concentrations as a Function ofthe Acid Employed in the Indicator Preparation. Test Runat pH 4 16
3. Standard Absorbance Curve Employing Fresh and Six-MonthsOld Solution 34rl. 18
4. Absorbance Values Obtained as a Function of Added I"Concentrations Employing Solution 34-1 ... 19
5. Comparison of Absorbance Values ...Obtainedv.wi th <VariousI~ Concentrations. . . . 24
"iv"

LIST OF TABLES
Table Page
I Minimum HgCl-2 Concentration Required for Iodide IonConcentration. 12 (as I§) Concentration Range 0-12 mg/1 ... 11
II Stability of Mixed Indicator - Complexing Agent Systems. ... 13
III Indicator Stability Tests In Clear Glass Bottles "15
IV Effect of Sample pH and Sample to Indicator Ratioon 1.2 Recovery. Sample Volume, 50 ml 21
V Effect of Temperature on 12 Recovery ..... s 20
VI Stability of Developed Colors. Soln. 34-1 . 22
VII Visual Estimation . 22
VIII Expected Errors for l£ Concentrations - 70 mg/1 Added I~ . . . 25
SECTION I
INTRODUCTION
1.1 Justification For Study
For extended space flight anticipated.in the Skylab project, it is
essential that..the crew have available a method of: determining iodine in...
the concentration .range of 0.5 to 12 ing/1 of l£ in order that the potable
water be maintained in:a safe microbial condition at all-times. The
method must, be: (1) sensitivej accurate and reproducible; (2) insensitive
to constituents other than iodine; (3) easily manipulated and performed;
and (A) composed of stable reagents which possess a low toxicity and are
non-corrosive .to container materials.
1.2, Background
Two methods for iodine determination have been considered for
possible use in.Skylab. Both of these deperid .upon the development of:a
color, visible to the eye, the intensity•of: which is proportional to the
iodine concentration. The iodine concentration in each case is .estimated
by comparison of the developed color with appropriately colored standards.
The two methods are: (1) the starch-cadmium iodide method;,and (2) the
leuco crystal violet method (LCV). Initial investigations indicated
that the starch method is relatively insensitive to iodine concentrations
less than 1.5 mg/1 and, additionally, the intensity of the developed
.color ,is .a function of temperature. .On .the other hand, a preliminary
investigation of a^mbdified LCV method indicated that the presence of
1

2
iodide ion interferred with color development. While it is thought that
the starch {method may; not be greatly; improved because of inherent" pro.- "
perties, the. same is not true for the.LCV method which can be modified
in a variety of ways to meet the .stated criteria.
1.3 Objective of Study
The specific objective of this.study is to modify the leuco crystal
violet .procedure or otherwise develop a,new or modified^ procedure for
determining iodine residuals in spacecraft.potable water which will meet
the criteria cited in 1.1 above.

SECTION II
TECHNICAL APPROACH
2.1 Theoretical Considerations
On ...the addition of, elemental iodine .to water hydrolysis occurs with
the formation of hypoiodous acid, :HOI, ..hydrogen ,ion, ,,and ipdide ion.
I2 + .H20 T HOI + H+ 4- I' (1)
J^ = 3 x.10-13 at 25°C
In addition,'dissociation ofiHOI takes place with the formation of the
hypoiodite ion, OI~:
HOI ^ H++ IQ- (2)
' TOKa = 4.5 x.lO"13- at 25°C
At high pH values, conversion of HOI to iodate, lOl, may occur.
3HOI ;+ 20H- r H+ + 103 + 2I~ + 2H20 (3)
In distilled water or water with near neutral pH,. only Equation (1) ,is
of .interest_as the concentrations of OI~'and Oil will be insignificant.
In the colorimetric method for iodine proposed by Black-and
Whittle (1967), the oxidation of leuco crystal violet (LCV) to crystal
violet dye was postulated to occur through hypoiodous acid exclusively.
The mechanism of this reaction has.been .described previously (Black
and.Whittle, 1967 and Whittle, 1969). The oxidation of,.LCV by I2 is
slow as the production of iodide ion during the,course of ..the reaction
opposes the hydrolysis of I2 and, therefore, the .formation of HOI as
shown in Equation (!)• The addition of-mercury as the .soluble mercuric
chloride results in ..complexation ,of iodide ,ion. ,
" 2C1- " (4)

The stability of .the tetraiodide .complex is much greater .than of any
chloro complex.
2+,HgI4 ' ± Hg '+ 41 (5)
Kd = 10"31 at 25°C
HgCl2(s) .^ HgCl2(aq.) (6)
Ks = 2.7 x 10"1 at.25°C
HgClJ Z ±T Hg2+ + 4 Cl- - (7)4 •
Kd = 10~16 at 25°C
The reaction in Equation (4) when combined with the hydrolysis in
Equation (1) .results in the stoichiometric formation of HOI.
412 + 4H20 + HgCI2 = 4HOI + Hgl .* 2CI'I* ..AH* (8) -
The HOI instantaneously oxidizes LCV to the crystal.violet dye which in -
aqueous solution exhibits maximum - absprbance , at pH ,4.0 at 592 ftm'..
The formation of the very insoluble mercuric iodide,
HgI9 Z Hg2+ X- 2I~ (9)L2.'-28Ks = 1.2 x 10" ° at 25°G,
may be prevented .by controlling the .mercury-iodide ratio such that
complexation is . favored over precipitation.,
For .elemental iodine solutions, Beer's law :is followed in .the LGV
method over a wide range of iodine concentrations with ;a molar absorp-
tivity of 9 x 10 liter/mole-cm.
2.2 Skylab Considerations
The proposed procedure for disinfection of-water aboard Skylab
involves treating the .water prior to flight to.contain near 12. mg/1 as
I2. Because of the iodine depletion characteristics .during storage, it
will be necessary for the_flight_crew to_determine .iodine^concentrations .
and, if required, to maintain a certain minimum concentration by injection

5
of a concentrated stock'iodine..solution.. The limited solubility of
elemental .iodine in water,-will require .the use of .,a tri-iodide, ll,
solution which ;has been proposed to. contain a 1;2.'mole,ratio of to
I~ at a, total concentration of-,30,000 mg/1 as l£. During spacef light,
the I~ concentration will progressively .increase not only because ofr
injection of I,, but also because ..of the depletion or, reduction of l£. to
I~. In the LCV procedure, .the increasing concentration of I in theD
spacecraft potable water requires an additional'consideration of the
mercury complexation reaction outlined in previous equations;
The proposed one-reagent container aboard Skylab necessitates
redesign of:the presently proposed LCV method which now requires two
reagents,, an indicator and a.buffer solution. In addition, the pro-
posed 5:1 sampler.to reagent ratio proposed for Skylab .involves •„a
further modification of the LCV procedure which now employs a 50:1
sample-to reagent ratio. The approach to these -various modification
steps i;s outlined in the following sub-section.
2,3 Experimental Design
The following are the experimental procedures to be applied for
the design and selection of the optimum indicator system.
2.3.1 Reduction of Reagent Concentrations:
The proposed sample to reagent ratio of 5 to 1 indicates a 10-fold
reduction in reagent concentrations of the presently proposed LCV
reagents. Solutions containing reduced concentrations of LCV and HgCl2
will be evaluated for determining l£ with particular regard to estab-
lishing minimum reagent quantities required for the anticipated ~L-
I" concentrations.

2.3.2 Substitution of New Complexing Agents
Other iodide complexing agents will be evaluated in analytical
performance tests in an effort to replace the mercuric chloride salt
by a less toxic substance. Mercury salts other than the chloride will
also be evaluated for possible reduction of the required mercury
concentration.
2.3.3 One Reagent Addition
Efforts to produce a single analytical reagent will be directed
toward formulation of: (1) new buffer solutions; (2) combination indi-
cator - buffer systems; and (3) weak acid solutions of the indicator,
2.3.4 Performance Evaluation
All candidate reagent solutions will be evaluated for determining
iodine in the concentration range of 0.5 to.12 mg/1 of l£ as a function
of increased iodide concentrations. Performance criteria will be:
(1) adherence to Beer's law or good reproducibility of results under a
variety of conditions; (2) visual estimation of developed colors, par-
ticularly the detection of 0.5 mg/1 of ~L^\ (3) minimum complexing agent
concentration required for an anticipated I concentration; (A) stability
of the developed test solution; (5^ reproducibility of results for a
range of sample temperatures; and (6) stability of the indicator
solution (in glass) as a function of Sterage^tiineV
2.3.5 Selection of Analytical Procedure
The optimum indicator reagent will be selected and recommended for
consideration in the Skylab based upon the results of this study.

SECTION III
EXPERIMENTAL
3.1 Reagents
The leuco crystal violet reagent was purchased as Eastman Organic
Chemical EK 3651, 4, 41, 4" - methylidynetris(N,,N-diinethyaniline) . The
high quality of this product was such that no additional purification
was required.
All acids, salts and other reagents were of reagent grade quality.
The water employed was deionized by a Continental Water Conditioning
system to a range of specific resistances of 12 to. 18 megohm.„
3.2 Equipment
Iodine concentrations were determined employing a Wallace and
Tiernan amperometric titrator.
Absorbance values were measured using a Coleman Model 124 Spectro-
photometer and a Sargent Model SRG recorder. Absorption cells providing
a 10 mm light path length were employed for solutions having absorbance
values less than 2.0, and 5 mm cells for solutions having absorbance
values greater than 2.0.
3.3 Measurement of Absorbance
The procedure followed for relating absorbance values to iodine
concentration involved treating 50 ml of sample with 10 ml of indicator
solution. The absorbance of the color developed in the 60 ml total
sample was measured using 10 mm cells when the absorbance values were
.less than 2.0. For absorbance values greater than 2,0, the sample

8
was initially diluted to 100 ml with dilution water containing the appropriate
ratio of sample water to indicator solution. The absorbahce of;this
solution was obtained with 10 mm cells and the initial absorbance in the
60 ml sample was calculated, assuming Beer's law was followed„ Later
the use of 5 mm cells allowed a direct absorbance reading of the undiluted
sample, which was multiplied by two,, eliminating any dilution errors.
3.4 Indicator Concentration
For a 50/10 sample to indicator ratio it was calculated than an
LCV concentration of 0.25 g per liter would provide a 2.7-fold excess
of indicator for stoichiometric recovery of the highest "L^ concentration
of 12 mg/1. With the exception of a few trial runs, all indicator
solutions were prepared at the concentration of 0.25 g/1 of LCV.
A previous study (Black and Whittle, 1967) showed that for indicator-
solution stability, the pH of the final solution must be 1.6 or less.
3.5 Evaluation of Complexing Agents
For each of the candidate LCV-acid indicators prepared in 3.4 above,
the minimum complexing agent required to produce a maximum absorbance
value as a function of added I concentration was determined as follows,
with HgCK given as an example.
Erepare the following
HgCl solutions:
Solution 1 - 0.250 g/1 Solution 2 - 0.625 g/1
Solution 3 - 1.25 g/1 Solution 4-7.2 g/1
Pipet a 50-ml sample of standardized elemental J.2 solution (0.5 to
12 mg/1) into a 100-ml volumetric flask. Add various combinations of
HgCl« solutions-and a strong_acetic acid-sodium acetate, pH 4.0, buffer
such that the sum of volumes of these solutions equaled 5 ml. To this

9
was added 5 ml of the indicator solution containing 0".5 g LCV per liter.
This procedure was designed to simulate the addition of a mixed indicator
composed of LCV, complexing agent, and buffer in the sample/indicator ratio
of 5 to 1. For a given 1° concentration, the minimum quantity of HgCl
required to produce a maximum absorbance value was recorded.
In addition te. HgCl2, Hg(Cl04)2s Hg(C2H3Q2)2, HgCNO^, HgS04, and
other possible complexing agents including Sn(II)s Sn(IV), Cu(I), Pt(II),
and Pd(II) were evaluated.
New mixed indicator solutions were prepared incorporating the
minimum complexing agent required to prevent interference from an
assumed maximum concentration of I" of 70 mg/1. Standard absorbance
curves were obtained employing a stock I, solutions prepared on a 1/2
12 to I mole ratio and containing 30,000 mg/1 of I2«
A stock KI solution was prepared by dissolving 1.300 g of KI in
water and diluting to a liter (1 ml = 1 mg I"). Increments of the KI
solution were added to I solutions to contain various concentrations
of Io and added I ion. These solutions were then analyzed colori-
metrically and the maximum I concentration which produced no inter-
ference was recorded.
3.6 New Buffer Compositions
In the initial investigations^ ,all'.samples were treated separately
with a strong acetic acid-acetate buffer to produce a sample pH of 4.0,
the pH of maximum absorbance of 592r..nm. Other buffer compositions were
prepared to produce sample pH values of 1.0 to 3.1. The effect of pH
on the intensity and hue of the developed color was studied by pH
adjustment of solutions of crystal violet dye. Wavelength scans were
run to determine the wave length of maximum absorption at each solution
pH.

10
Combination indicator-buffer mixtures were^preparedito. produce
various pH environments in the test sample. Stability tests were initiated
to determine the stability toward color development in the indicator-
buffer solution and also the ability of the mixed .system to reproduce
I_ determinations as a function of the age of the indicator solution.
3.7 One-Reagent Method
Rather than combine the indicator with a buffer solution, solutions
of LCV in weak acids were prepared for use as single reagents. Solutions
of weak acids have some buffering capacity and if the sample to indicator
ratio is near constant, the pH of the final test solution will exhibit a
fixed value. Solutions of LCV, compelxing agent, phosphoric acid, and
citric acid were prepared and stability test initiated. Standard
absorbance curves were prepared as described previously and the maximum
l" interference was recorded.
3.8 Sample to Indicator Ratios
In an effort to improve performance toward iodide interference,
the sample to indicator ratios were varied from 50/20 to 50/50 and the
results evaluated.
3.9 Temperature Effects
Standardized ij solutions with added I= concentrations were heated
to 35 C and cooled to 5 C and an analysis performed. The performance
was evaluated by reference to the standard absorbance curve prepared
at room temperature.
3.10 Visual Estimation
The ability to detect as low as 0.5 mg/1 of l£ and the ability
.to. discriminate between adjacent high, .concentrations of .12- temporary
standards were evaluated by laboratory personnel for the more promising
candidate indicator systems.

11
SECTION IV
RESULTS
4.1 Selection of Completing Agent
In the investigation where the HgC^ solution was added separately
to the sample prior to the indicator and buffer solutions, the results
indicated Low HgCl2 concentrations were required for full color develop-
ment at relatively high added I" concentrations. This is illustrated
in Figure 1 where, for example,, only 0.3 g of HgCl^ per liter of mixed
indicator solution is required for an I2 solution containing 25 mg/1 of
l". This study was repeated employing an 1^ (1:2 12 to KI) solution
and a mixed indicator solutions containing various concentrations of
HgCl2. The results are shown in Table I below.
TABLE I
Minimum HgCl2 ConcentrationRequired for Iodide Ion Concentration.12 (as. 113) Concentration Range 0-12 mg/1
Added l", '.' Total I in HgCl2,mg/1 :.. , 12 ing/I I2, (1) s/1 (2)
0 24 0.7510 . 34 0.7520 44 0.7530 54 0.7550 74 1.2570 94 3.60
(1) Based on addition of a 1:2 molar ratio of I2 to KI.
(2) Based on addition of 5 volumes of sample :tb 1 volume of mixedindicator .'3.Avl..
This study indicated much higher mercury concentrations are required
when a single-step, mixed indicator is employed than when the
solution is added separately.

12
70
50
£v
40c/i
ae
e •H- 30
CM«Ho
20
10
10 15
Added I", mg/1
20 25 30
Figure 1. Minimum HgC^ Concentration to Produce Complete ColorDevelopment for Various Iodide Ion Concentrations

13
Although other mercury salts appeared promising in the initial
studies, all exhibited similar relationships with added I" as shown in
Table I. In addition, all mercury salts^ with the exception of HgC^i
produced unstable mixed indicator solutions with precipitation being the
primary p'boblem.
Palladium salts appeared-promising in elemental Ij> solution but
precipitation occurred on the addition of I"/ and solutions of these
salts produced a dark color on standing.
The results obtained with other complexing agents showed, in most
cases, an inability to complex iodide ion and precipitation in mixed
indicator solutions„
In Table II below, the results of attempts to formulate mixed
indicators are summarized.
••> TABLE .II
Stability of Mixed Indicator-Complexing Agent Systems
Complexing Agent Stability Results
Mercuric -Acetate Precipitation
Mercuric Nitrate Precipitation
Mercuric Perchlorate Precipitation
Mercuric Sulfate Insolubility
Stannous Chloride Lack of ComplexingAbility
Stannic Chloride Little ComplexingAbility
Platinum Salts Color Production inSolution
Palladium Salts Color Production inSolution
Cuprous Chloride Precipitation
Mercuric Chloride Stable

14
In this studyV only mercuric chloride exhibited the desired
complexing ability and stability in a mixed indicator system and in
subsequent studies no other complexing agents were considered further.
The concentration of 3.6 g of HgCl2 per liter of indicator solution was
adopted as the minimum mercury concentration for an anticipated total I•),
concentration of approximately 94 mg/1.
4.2 Combined Indicator-Buffer Solutions
Several combined indicator-buffer solutions were prepared and
evaluated in 13 determination tests and for stability as a function
ofastorage time. All solutions contained 3.6 g/1 of HgCl? and initially
produced good results for 13 concentrations up to, 12 mg/1 in the presence
of 70 mg/1 added I . Stability tests showed that all solutions with the
exception of one exhibited some instability in that a color was formed* in
the indicator solution with increased storage time. The results of
stability tests are summarized in Table III for storage in clear glass
bottles. Duplicate storage tests in bcown glass bottles showed slightly
less color development in all cases. The solution 34-1 was found to be
the most stable toward color development. During a total storage time -
of six months, this solution developed an absorbance of 0*020 which
produced a negligible blank correction when added to a sample in the
ratio of 5/1 sample to indicator solution.
4.3 Evaluation of One-Reagent Indicators
Because of the superior characteristics of Soln. 34-1^ most of the
remaining efforts were directed toward determining<.d'll:j>characteristics
of this indicator in the analysis for iodine. Several other acids were
investigated for the solution of LCV and Figure 2 shows a comparison of
the absorbance curves obtained with l PO ,, l SO and HN03 as the

16
00
vO
CM
•o•u
o EC,cvcO 4J
o c
cd co<u
co H
to •C CO O
C &<u atu )-iC P-.oO WioCM W
M (0U
h ^-1O T3M-I e
M0)> <uM JC3 AJO
CCU vlOC -O« Q)
XI >>M OO -Ico a,J3 B< W
CM
0)
CM
265 *TTO 'ma-

17
dissolving acids. In addition, solutions were-prepared using perchloric
-acid. As expected, HNC solutions were unstable toward oxidation of tCV*.
and were not considered further. The H SO and HCIO^ acid solutions
were stable but offered no advantages over the use of phosphoric acid.
In addition, these strong acids would have less buffering capacity for"
slight changes in sample pH than HoK), and, for these reasons, use of
these acids was not considered further.
In an early study, jthe effect of sample pH on -color and absorbance
was thought to be simulated by the use of crystal violet dye solutions.
It was found, however, that freshly prepared dye solutions adjusted to
pH values less than 4.0 did not correspond stoichiometrically to the
absorbance values obtained with l£ solutions at the same sample pH values.
In fact, it was observed that on aging the dye solutions increased in
absorbance values toward a maximum corresponding to the J.2 stoichiometric
value. This inusual and, at the moment, unknown behavior of dye%
solutions precluded their use in this study. The effect of small changes
in sample pH on absorbance values is shown later in this section.
Figure 3 shows the standard absorbance curve obtained with Soln. 34-1
on Io solutions (1:2 l£ to KI) for the concentration range of 0.5 to
.12.0 mg/1. The absorbance values obtained using the initially prepared
Solution 34-1, the same solution after 6 months storage, and a recently
prepared solution are shown in Figure 3.
The results obtained with fresh and aged Soln. 34-1 in analyses of
1^ containing added I" are shown graphically in Figure 4 where the
absorbance curve in Figure 3 is used as a reference. The significance of
the results shown in Figures 3 and 4 iss summarized in the following
section, Discussion of Results.

CM
C!O
18
idufl
•sa«M
TJ
O
CO
4JC
I
OJU
<r4
t
<N
CO
SO CN
31-4O
•O
QCO
cOf
CO
"SCO
CO<uM
00C
I"
0)
M
O
cuuC
MOCO
CO
"Scd4JCO
0)
am

19
'M I* 'M
§
O O DO
oo
COCO
CO1-14-1
dcuo
ocj
•o01
co
•r44-1O
§
co
sd •
•r-l f-HCO I4J ^J3 CO
° CCO O<U ^H3 4J•-I 3
CO ^H> O
CO<uO Mld cCO i-<
U3 psM OO i-HCO O,
J= 5< w
«»
01
<*> CM
Z6S '

20
The effect of slight changes in sample pH and the sample to indicator
ratio &s~ shown in Table IV. Under the heading Percent Relative Errors
the errors for changes in sample to indicator ratios are separated
from the errors due to changes in sample pH.
4.4 Sample to Indicator Ratios
In an effort to improve the performance of Soln. 34=15 iodine
determinations were performed using sample to indicator ratios of 50;205
50:50, and 50;5. For the low sample to indicator ratios some precipitation
of what appeared to be red Hgl2 occurred in solutions containing 70 mg'/l
of I~. For the high sample to indicator ratio,,, lower absorbance values
were obtained at high I" concentrations„•-.. '..• •./;.• «.,L •"-•:".u<;:v.i. ;. ': "..-•'.'• J: '--'-4.5 Temperature Effects
Samples of 13 with and without added I" were heated to 35°C (95°F)
and cooled to 5°C (41°F) and analyzed colorimetrically employing
Soln. 34-1. The results are shown in Table V.
TABLE V
Effect of Temperature On l£ Recovery
Titration12 . mg/i
0.83.23.411.211.60.52.610.810.8
Added1°. mg/1
50050070707000
SampleTemp., °C
35353535355555
GolorimetricAbs .
0.2200.7500.8712.8012,6510.1510.6622.7512.550
I?, mg/1
0.73.13.511.210 j 70^652*6511. 010.0
PercentRelative Error
-1.2-=3^0^+3.00.0
=10.0^ +3.0
+2.0+2.0-•8.0
4.6 Stability of Developed Colors
The absorbance of developed colors employing Soln. 34-1 were obtained
as a function of time. Typical results are presented in the 'foLliowing- .
Table VT.

21
M
W•-jPQ^3H
O•H4JCO
i-l rHo e4-1cfl Oo m
e o>M B
O rH4-1 0
^01rH O)P.rH
B P.CT3 ^
C/3 CTJen
*Oc •CO >,
HtU cuP. >
O0) O
rH 0)P. K
TO CMGO M
VM C0 0
4-1O0)
M-l14-1Cx3
Titra
tion-l2
P
erc
en
t R
ela
tive
E
rro
mg/1
V
olu
me
pH
TJ rH0) \4J CM Mo M g01 :}-J)-l 0)O Oo c
CO0) 43e M3 O
' rH CO0 43
rH-^
CM M
^H 60)>-l3 01U uCfl CO) COa 43
>-iOCO
0)rHP.JCe pCO
GO
rJO i— 11 i p3COa .
T3 Oe >M
. . CO . CO - - . . - • *I o
VO O CM+ + 1
o o- in
CM CM O m
+ + I
m m m m
CM CM CM CM
O vO 00r in <f
ICM CM CM
co mO*» ^- j—jVO VO 1 VD
• 0 •
0 O 0
o o <r o
CO CM CM CM
m in vo mvD VO CO O"*i — vo vo m
• • • •
o o o o
m om ^ co co
• • » •CM CM CM CM
VO OO O CMrH rH
VO - - - - - - - - - -
rH1
CO
vo
1
m
CM
oin«CM
0COvo
O
OOCO
•
CM
0ONm•0
mCM
•CM
**rH

22
TABLE VI
Stability of Developed ColorsSoln. 34=1
12,me/1
2.90
2.90
10.00
10.00
Added I"mg/1
0
70
0
70
1"5 min.Percent
60
0*630
0.630
2.300
2.350
Relative Error
-3.5
V7.0
-3oO
-6,0
AbsorbancersTime .'ini,0 5 10 15
0.700 0.695 0.690 0.680
0.690 0»685 0.670 0.660
2:.501 2.490 2.45 2.400
2.450 2.420 2.400 2.380
4.7 Visual Tests
A series of temporary 12 standards were prepared using Soln. 34=1
in the concentration range of 0.5 mg/1 to 12.0 mg/1 of !„ in increments""
of 1 mg/1. These solutions were placed in 15 mm diameter test tubes
and mounted on a white background. Iodine solutions were then prepared
colorimetrically and presented to several members of the laboratory staff
for visual determination.
TABLE VII
Visual Estimation
Visual Estimation, '1.2, mg/1l2"o!;mg/iL;(Unknown)
0.50.81.42.84.26.59.110.511.311.7
AddedI", mg/1
0707007070070070
(
:. ii0.50.71.53.04.06.09.09.512.010.0
Person2
0.50.61.53.04.06.08.59.211.011.0
3
0.50.91.52.74.06.09.010.011.511.0
23SECTION:V
DISCUSSION OF'RESULTS -• - - - • -
5.1 One-Reagent Indicator
The results of this study show that Indicator Solution 34-1 represents
the optimum combination of reagents to produce the most stable and reliable
one-step indicator. The composition of this solution is repeated below.
Soln. 34-1 (wt.J/ititer)
0.25g.LCV6.9g 85 percent HoPO,3.6g HgCl2
The LCV is first dissolved in about 200 ml of water containing the
H3P04. The solution is then diluted to about 900 m!5 the HgCl2 added^
and after solution is complete, diluted to 1 liter. Best results are
obtained when the solution is carried out in a brown glass container.
The use of HgC^.was required as other mercury salts and other
complexing agents failed to produce stable indicator solutions or the
desired complexing ability. It is thought that the stability of HgCl2
is due to the fact that the molecule HgCl2 is the predominate species ia
solution rather than the free mercury ion. Other mercury salts ionize ;
readily to Hg2+ which is subject to precipitation as insoluble complexesi
or salts. The HgCl2 readily exchanges liquids to form the more stable*
tetraiodo complex,, Hgl,, which .allows the reaction between LCV and
iodine to proceed to completion.
5.2 Maximum Total I Concentration
The 3.6 g/1 of HgC^ in the indicator solution was originally taken
as the minimum amount to allow full color development in high concentra-
tions of io with added 70 mg/1 of I". Reference to Figure 5} which shows
the results of accumulated data, indicates that up to 50 mg/1 of added

24
COeo
tM
O«n
iH,
or*.
00
•CM
CM
(0t-iucVuco
CO
o1-1(-1CO
T3OlC
COOlD
01-oc(0.a>4oCOXI
y-to
c:oto
CDa-o
<u
Pn
nra 265vmo--[

25
I" (74 ;mg/l total I' in a .12:.0 mg/1 of l£ as-Ip-may be.-safely taken as the
upper I~ concentration for full color development. Concentrations of;. 60
to.70 mg/1 of added I show somewhat less than-full color development.-
The area between the two curves-shown in Figure 5 represents the' relative
error expected with added I~ of 70 mg/1 (94 mg/1 total I at,12.0 mg/1 12
ad 13). The_relative error was. calculated to be'minus 10 percent. The^
expected;errors for selected l£.concentrations containing.70 mg/1 of
added I~ are shown in Table VIII.
TABLE VIII
Expected Errors For l£Concentrations - 70 mg/1 Added,I~
. 12 Expectedmg/1 ; Error, mg/1
0.5 -0.05
3.0 , -0.3-I
6:0 ; -0.6
10.0 -1..0
12;0 -1.2-
In solutions. C9ntaining added I~ of 50 mg/1 or-less, the relative
error .is estimated to be less - than-^ 2 percent when the abs'orbance is.
measured spectrophotometrically. The visual error is estimated to be
about JT 10 percent relative for l£ concentrations greater;than 10 mg/U
Below 10 mg/1 of 1~t visual error isrmuch less and is estimated to be1
about JT 5 percent relative.
5.3 Skylab Iodine Addition
The: value of 70. mg/1 added^I" corresponds to a total I..of 94 mg/1
when 12 mg/1 of I as 1^ is pres.erit.. The. effort to. develop a.reliable..

26
test for I_ under these conditions was based on three dosings of the
potable water to 12 mg/1 of l£ during the entire Skylab-project, assuming
that the 12 previously dosed had depleted completely to I". Under these
severe conditions, this would produce in the final mission a concentration
of 72 mg/1 total I,, The goal of 92 mg/1 total I would allow one additional
dosing to 12 mg/1 ~L^ or several smaller dosings to maintain the iodine
concentration at an acceptable level- The results of this-investigation
show that the developed LCV test is most reliable up to 74, mg/1 total I
which corresponds to three maximum dosings to 12 mg/l-l2<> Additional
dosings to a total of 94 mg/1 would produce a relative error of up to
-10 percent in the colorimetric test. Since the error is relative, theA
absolute magnitude of the error would be small in the lower critical In
concentrations of 0.5 to 6 mg/1.
5.4 Stability of Reagent
The results indicate that Soln. 34=1 is stable in glass toward color
change in the indicator and toward I2 analysis for a.period of at least six
months. The final proof of this was the duplication of analytical results
using a freshly prepared and a 6 months old reagent.
5.5 Stability of Developed Colors
Some instability of the test color was found by a slight decrease in
absorbance with time. No serious error is expected if the color is
estimated within 5 minutes with a maximum of =3 to -7 percent relative
error for a 15-minute waiting-period.
5.6 Effect of Temperature
The results indicate no significant effect of sample temperature on
J-2 recovery within the sample temperature range of 35°C (95°F) to 5°C

27
(41°F). The developed colors produced essentially the same percent
relative errors,and exhibited the same stability .as found with samples
analyzed at ...room, temperature.
5.7 Visual Estimation
Visual tests performed by laboratory personnel.indicated that as low
as,0.5 mg/1 of 12 (or lower).could be easily estimated. From 1.0 to 9.0
mg/1 of 12 the colors>were correctly, estimated within .± 0;5 mg/1 and:above
9.0 mg/1 most.estimations were within i 1.0 mg/1.
28
SECTION VI
CONCLUSIONS
A stable, one-reagent indicator solution.has been developed which
will allow accurate determination of 12 (as 13) concentrations in the
range of 0.5 to 12.0 mg/1. The composition of the solution on a weight
per liter of solution basis is given below.
Solution 34-1
0.25g LCV6.9g 85 percent H3P043.6g HgCl2
The presence of iodide ion does not interfere with the test up
to 50 rag/1 of added I" or a total of 74 mg/1 total I. Above 50 mg/1
of added 1°} the relative error is approximately -10 percent. The
test has been designed to produce no serious error due to I for up to
3 dosings from 0 to 12.0 mg/1 of I2 as 13 of the potable water aboard
Skylab.
The developed test colors are relatively stable and no significant
error will be obtained if the sample is estimated within 5 to 15 minutes
arter preparation.
Sample temperatures within the range of 35°C (95°F) and 5°C
(41°F) produced no significant effect on the developed test.
Visual estimation of as low as 0.5 mg/1 X2 was obtained without
difficulty. A visual error of . 0.5 mg/1 may be expected in the I2
concentration range of 1.0 to 6.0 mg/1 and _ 1.0 mg/1 in the concen-
tration range of 9.0 to 12.0 mg/1.

29
SECTION•VII
RECOMMENDATIONS
It is recommended that the proposed one°reagent indicator, Solution
34=1, be evaluated for stability and performance when stored in Skylab
container material for possible use as the analytical reagent for deter=
mining iodine during the Skylab project.

30
REFERENCES
Black, A, P. and Whittle, G. P. New Methods for the Colorimetric Detersaina-.tion,,of. Halogen Residuals: Part I. Iodine, Iodide, and lodate. . Journ.AWWA,' 59. (1967).
Black, A.»-P« and Whittle, Gs, Pu New Methods for the Colorimetric. Determina-tion , of'Halogen Residuals: Part II. Free and Total Chlorine. Journ.AWWA", 59, (1967).
Whittle, Gj. P;. Kinetic Studies of the Reaction of Aqueous Iodine WithOrganic Matter. Paper presented at the 157th National Meeting of theAmerican Chemical Society, Minneapolis, Minnesota, April 14-18, 1969.
BIBLIOGRAPHY
Sillen, L!. G. and Martell, A. E., Stability Constants of Metal-Ion Complexes,The Chemical Society, London, 1964.
Goldstein, Gerald, Equilibrium Distribution of Metal-Ion Complexes., OakRidge National Laboratory, ORNL-3620, UC-4-Chemistry, TID-4500 (34th ed.)National Bureau of Standards, Springfield, Virginia.
Butler, J;,, Ni. Ionic Equilibrium—A Mathematical Approach, 1964, Addison=Wesley Publishing Company, Reading, Massachusetts.

31
APPENDIX I
EQUIPMENT PURCHASED WITH CONTRACT FUNDS
L ea. S-7563L-15 Spectrophotometer,CoLeman Model 124
1 ea. S-72180-75 Recorder,Model SRL-G
1 ea. S-75643 Long Path CellHolder
1 ea. S-75646 Cell HolderTemperature Controlled
1 ea. Series A-790 AmperometrieTitrator
Sargent-Welch $3,289 „50Scientific CompanyBirmingham,- Ala.
Sargent-Welch - j .1,335.00Scientific CompanyBirmingham, Ala.
Sargent-Welch 114=75Scientific CompanyBirmingham, Ala",
Sargent-Welch- 263.50Scientific CompanyBirmingham, Ala.
Wallace &-Tiernan, Inc. 360.00Belleville,.. Nw.J. •
$5,362.75


![Structural Mechanics Computation of the Orion Spacecraft ... · Structural mechanics equations - Spatial Discretization Finite element method Parachute configuration [1] Mach number](https://static.fdocuments.net/doc/165x107/5e88c2d72665747f7a287fd3/structural-mechanics-computation-of-the-orion-spacecraft-structural-mechanics.jpg)

