The Study of the Spacecraft Telemetry Data Credibility ... fileThe Study of the Spacecraft Telemetry...
4
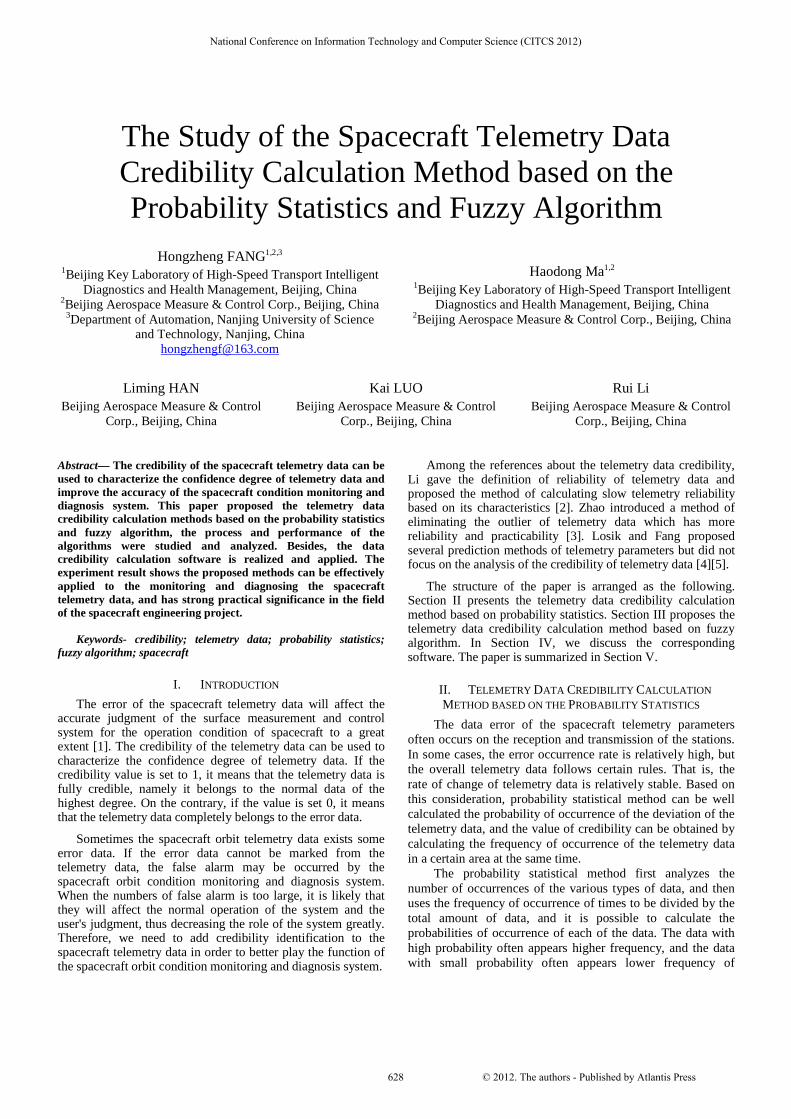
The Study of the Spacecraft Telemetry Data Credibility Calculation Method based on the Probability Statistics and Fuzzy Algorithm Hongzheng FANG 1,2,3 1 Beijing Key Laboratory of High-Speed Transport Intelligent Diagnostics and Health Management, Beijing, China 2 Beijing Aerospace Measure & Control Corp., Beijing, China 3 Department of Automation, Nanjing University of Science and Technology, Nanjing, China [email protected] Haodong Ma 1,2 1 Beijing Key Laboratory of High-Speed Transport Intelligent Diagnostics and Health Management, Beijing, China 2 Beijing Aerospace Measure & Control Corp., Beijing, China Liming HAN Beijing Aerospace Measure & Control Corp., Beijing, China Kai LUO Beijing Aerospace Measure & Control Corp., Beijing, China Rui Li Beijing Aerospace Measure & Control Corp., Beijing, China Abstract— The credibility of the spacecraft telemetry data can be used to characterize the confidence degree of telemetry data and improve the accuracy of the spacecraft condition monitoring and diagnosis system. This paper proposed the telemetry data credibility calculation methods based on the probability statistics and fuzzy algorithm, the process and performance of the algorithms were studied and analyzed. Besides, the data credibility calculation software is realized and applied. The experiment result shows the proposed methods can be effectively applied to the monitoring and diagnosing the spacecraft telemetry data, and has strong practical significance in the field of the spacecraft engineering project. Keywords- credibility; telemetry data; probability statistics; fuzzy algorithm; spacecraft I. INTRODUCTION The error of the spacecraft telemetry data will affect the accurate judgment of the surface measurement and control system for the operation condition of spacecraft to a great extent [1]. The credibility of the telemetry data can be used to characterize the confidence degree of telemetry data. If the credibility value is set to 1, it means that the telemetry data is fully credible, namely it belongs to the normal data of the highest degree. On the contrary, if the value is set 0, it means that the telemetry data completely belongs to the error data. Sometimes the spacecraft orbit telemetry data exists some error data. If the error data cannot be marked from the telemetry data, the false alarm may be occurred by the spacecraft orbit condition monitoring and diagnosis system. When the numbers of false alarm is too large, it is likely that they will affect the normal operation of the system and the user's judgment, thus decreasing the role of the system greatly. Therefore, we need to add credibility identification to the spacecraft telemetry data in order to better play the function of the spacecraft orbit condition monitoring and diagnosis system. Among the references about the telemetry data credibility, Li gave the definition of reliability of telemetry data and proposed the method of calculating slow telemetry reliability based on its characteristics [2]. Zhao introduced a method of eliminating the outlier of telemetry data which has more reliability and practicability [3]. Losik and Fang proposed several prediction methods of telemetry parameters but did not focus on the analysis of the credibility of telemetry data [4][5]. The structure of the paper is arranged as the following. Section II presents the telemetry data credibility calculation method based on probability statistics. Section III proposes the telemetry data credibility calculation method based on fuzzy algorithm. In Section IV, we discuss the corresponding software. The paper is summarized in Section V. II. TELEMETRY DATA CREDIBILITY CALCULATION METHOD BASED ON THE PROBABILITY STATISTICS The data error of the spacecraft telemetry parameters often occurs on the reception and transmission of the stations. In some cases, the error occurrence rate is relatively high, but the overall telemetry data follows certain rules. That is, the rate of change of telemetry data is relatively stable. Based on this consideration, probability statistical method can be well calculated the probability of occurrence of the deviation of the telemetry data, and the value of credibility can be obtained by calculating the frequency of occurrence of the telemetry data in a certain area at the same time. The probability statistical method first analyzes the number of occurrences of the various types of data, and then uses the frequency of occurrence of times to be divided by the total amount of data, and it is possible to calculate the probabilities of occurrence of each of the data. The data with high probability often appears higher frequency, and the data with small probability often appears lower frequency of National Conference on Information Technology and Computer Science (CITCS 2012) © 2012. The authors - Published by Atlantis Press 628
-
Upload
nguyenmien -
Category
Documents
-
view
220 -
download
0
Transcript of The Study of the Spacecraft Telemetry Data Credibility ... fileThe Study of the Spacecraft Telemetry...
The Study of the Spacecraft Telemetry Data Credibility Calculation Method based on the Probability Statistics and Fuzzy Algorithm
Hongzheng FANG1,2,3 1Beijing Key Laboratory of High-Speed Transport Intelligent
Diagnostics and Health Management, Beijing, China
2Beijing Aerospace Measure & Control Corp., Beijing, China 3Department of Automation, Nanjing University of Science
and Technology, Nanjing, China [email protected]
Haodong Ma1,2 1Beijing Key Laboratory of High-Speed Transport Intelligent
Diagnostics and Health Management, Beijing, China
2Beijing Aerospace Measure & Control Corp., Beijing, China
Liming HAN Beijing Aerospace Measure & Control
Corp., Beijing, China
Kai LUO Beijing Aerospace Measure & Control
Corp., Beijing, China
Rui Li Beijing Aerospace Measure & Control
Corp., Beijing, China
Abstract— The credibility of the spacecraft telemetry data can be used to characterize the confidence degree of telemetry data and improve the accuracy of the spacecraft condition monitoring and diagnosis system. This paper proposed the telemetry data credibility calculation methods based on the probability statistics and fuzzy algorithm, the process and performance of the algorithms were studied and analyzed. Besides, the data credibility calculation software is realized and applied. The experiment result shows the proposed methods can be effectively applied to the monitoring and diagnosing the spacecraft telemetry data, and has strong practical significance in the field of the spacecraft engineering project.
Keywords- credibility; telemetry data; probability statistics; fuzzy algorithm; spacecraft
I. INTRODUCTION
The error of the spacecraft telemetry data will affect the accurate judgment of the surface measurement and control system for the operation condition of spacecraft to a great extent [1]. The credibility of the telemetry data can be used to characterize the confidence degree of telemetry data. If the credibility value is set to 1, it means that the telemetry data is fully credible, namely it belongs to the normal data of the highest degree. On the contrary, if the value is set 0, it means that the telemetry data completely belongs to the error data.
Sometimes the spacecraft orbit telemetry data exists some error data. If the error data cannot be marked from the telemetry data, the false alarm may be occurred by the spacecraft orbit condition monitoring and diagnosis system. When the numbers of false alarm is too large, it is likely that they will affect the normal operation of the system and the user's judgment, thus decreasing the role of the system greatly. Therefore, we need to add credibility identification to the spacecraft telemetry data in order to better play the function of the spacecraft orbit condition monitoring and diagnosis system.
Among the references about the telemetry data credibility, Li gave the definition of reliability of telemetry data and proposed the method of calculating slow telemetry reliability based on its characteristics [2]. Zhao introduced a method of eliminating the outlier of telemetry data which has more reliability and practicability [3]. Losik and Fang proposed several prediction methods of telemetry parameters but did not focus on the analysis of the credibility of telemetry data [4][5].
The structure of the paper is arranged as the following. Section II presents the telemetry data credibility calculation method based on probability statistics. Section III proposes the telemetry data credibility calculation method based on fuzzy algorithm. In Section IV, we discuss the corresponding software. The paper is summarized in Section V.
II. TELEMETRY DATA CREDIBILITY CALCULATION
METHOD BASED ON THE PROBABILITY STATISTICS
The data error of the spacecraft telemetry parameters often occurs on the reception and transmission of the stations. In some cases, the error occurrence rate is relatively high, but the overall telemetry data follows certain rules. That is, the rate of change of telemetry data is relatively stable. Based on this consideration, probability statistical method can be well calculated the probability of occurrence of the deviation of the telemetry data, and the value of credibility can be obtained by calculating the frequency of occurrence of the telemetry data in a certain area at the same time.
The probability statistical method first analyzes the number of occurrences of the various types of data, and then uses the frequency of occurrence of times to be divided by the total amount of data, and it is possible to calculate the probabilities of occurrence of each of the data. The data with high probability often appears higher frequency, and the data with small probability often appears lower frequency of
National Conference on Information Technology and Computer Science (CITCS 2012)
© 2012. The authors - Published by Atlantis Press628
occurrence. A high probability of the data corresponding to its credibility is high. According to the rules of the telemetry data, its deviation fits the normal distribution in a certain extent. Given a deviation value, if we need to calculate the probability of its appearance, we can use the value calculation as the center value, and obtain the interval on the basis of the up-down certain value to statistic the number of occurrences of the data exist in the interval. If the data deviation is more in line with the normal distribution statistics, it is more appropriate to use three times of the standard deviation as the interval length to statistics the number of times it appears. So the probability statistical method can be used to calculate the value of the credibility of the corresponding telemetry parameters. As shown in Fig.1.
Figure 1. Credibility value calculation based on probability statistics method
As shown in Fig.2, we can find the curves of one temperature parameter (denoted as T4) of the spacecraft telemetry data, most of the data is a regular and normal, and small portion of data deviates from the normal state and belongs to error data.
Figure 2. T4 telemetry parameter data
From Fig.2, we can see that the normal telemetry data is regular, but it is more difficult to describe its own rules from a more detailed level. When the changes of the original telemetry data in adjacent two data point is relatively small, it is likely to be normal data; when the changes is relatively large, it is very likely to be error data. This is a characteristic of the spacecraft telemetry data, that is, when the error occurs, its deviation between values before the error and after the error is relatively large, so we can calculate the slope of the telemetry parameters values in order to obtain the laws of the processed data.
Assuming spacecraft telemetry parameters is x(k), the corresponding time is T(k), then the slope each result of the data can be calculated as
)1()(
)1()()(y
ktkt
kxkxk
(1)
Figure 3. Telemetry parameters processing diagram
The processed result of data in Fig.2 is shown in Fig.4.
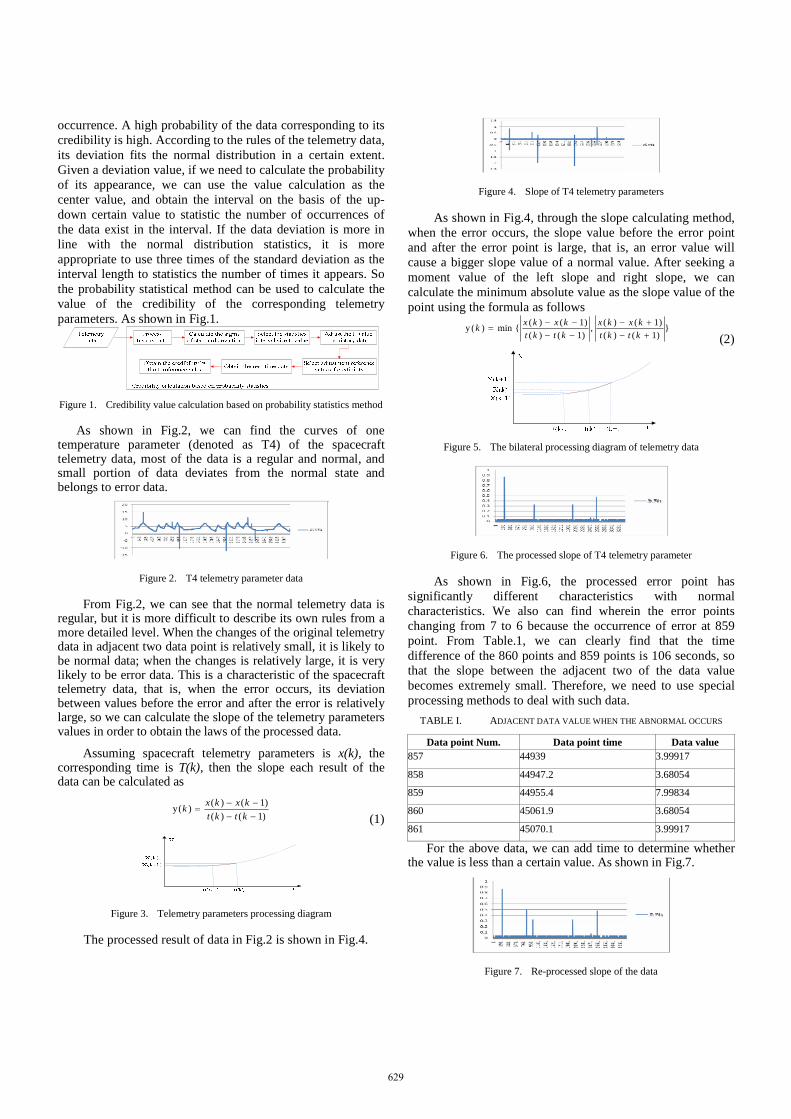
Figure 4. Slope of T4 telemetry parameters
As shown in Fig.4, through the slope calculating method, when the error occurs, the slope value before the error point and after the error point is large, that is, an error value will cause a bigger slope value of a normal value. After seeking a moment value of the left slope and right slope, we can calculate the minimum absolute value as the slope value of the point using the formula as follows
})1()(
)1()(,
)1()(
)1()({min)(y
ktkt
kxkx
ktkt
kxkxk
(2)
Figure 5. The bilateral processing diagram of telemetry data
Figure 6. The processed slope of T4 telemetry parameter
As shown in Fig.6, the processed error point has significantly different characteristics with normal characteristics. We also can find wherein the error points changing from 7 to 6 because the occurrence of error at 859 point. From Table.1, we can clearly find that the time difference of the 860 points and 859 points is 106 seconds, so that the slope between the adjacent two of the data value becomes extremely small. Therefore, we need to use special processing methods to deal with such data.
TABLE I. ADJACENT DATA VALUE WHEN THE ABNORMAL OCCURS
Data point Num. Data point time Data value 857 44939 3.99917
858 44947.2 3.68054
859 44955.4 7.99834
860 45061.9 3.68054
861 45070.1 3.99917
For the above data, we can add time to determine whether the value is less than a certain value. As shown in Fig.7.
Figure 7. Re-processed slope of the data
629

When the value of the processed data is obtained, we can select the occurrence points appeared in the L-times standard differential region of the midpoint of the interval to count the numbers of the points in the intervals. After a certain processing, the corresponding credibility confidence values can be obtained. Wherein the k value is calculated by the adjustment of the characteristic of the historical telemetry data credibility. The flow of the telemetry data credibility calculation can be described as the following steps:
1) When obtaining the credibility of the data m, calculates the minimum absolute value of the left slope and right slope (denoted as MD), and calculate the standard deviation sigma of the data.
2) Selects the count interval of the telemetry data m as [md-L/2*sigma, md+L/2*sigma].
3) Statistics the number of occurrences of processed telemetry data in the specified interval (denotes as totalnum).
4) Calculates r(m)=totoalnum/ n, where n is the total number of historical telemetry data.
5) According to the law in history telemetry data, makes a statistics of the possession of the errors, given missed alarm rate is rate_err.
6) Selects the reference credibility value of r(m), and selects ref =(2 to 5) * rat_err.
7) Amplifies the r(m), wherein r(m) = 1 if r (m)> ref; r(m) = r (m) / ref, others.
8) According to the calculated credibility value of the historical telemetry data, makes an analysis of the data credibility to judge whether or not more than 95% of the error is relatively low value to adjust the L-value selection.
9) Selects L value, and calculate the credibility value of the corresponding data, credibi (m)=r(m)/ref.
After the above steps, the T4 telemetry parameters value of the credibility of the historical data is shown in Fig.8.
Figure 8. Credibility of the telemetry data after the adjustment of the k value
After the calculation of credibility of the historical T4 temperature telemetry parameters, we can analyze the algorithm performance of the probabilistic method. The algorithm performance is represented by missed alarm rate of telemetry data errors and false alarm rate of normal data.
TABLE II. THE PERFORMANCE OF T4 PARAMETERS CREDIBILITY CALCULATING BASED ON PROBABILITY STATISTICS METHOD
Base line Missed alarm rate Missed alarm
rate Total Num.
Performance
0.1 0 1 3480 2.87*e-4
0.2 0 15 3480 0.004
From Table.2, we can find that the use of probability statistics method can calculate the value of the credibility of the telemetry data, but sometimes the difference between the
credibility value of some normal telemetry data point and the credibility of the error is small.
III. TELEMETRY DATA CREDIBILITY CALCULATION
METHOD BASED ON THE FUZZY ALGORITHM
The fuzzy algorithm can assign the corresponding data to the specified fuzzy sets through fuzzification of the data amount, which needs to set the corresponding membership function. This function can be established through the historical telemetry data. In the processing of the credibility of the telemetry data, the fuzzy sets can be set to {data deviation smaller, data deviation small, data deviation large, data deviation larger}. Then the corresponding rules statement can be used to generate the fuzzification credibility corresponding to different fuzzy variables. The rules statement can be described as the form of “if a then b”. This rule statement is obtained through the analysis of the law of the historical telemetry data. After the corresponding fuzzification credibility value is obtained, it can be calculated through the defuzzification method. The process is shown in Fig.9.
Figure 9. Credibility value calculation based on fuzzy algorithm.
When we use the fuzzy algorithm to calculate the credibility value of the parameter, the historical telemetry data need to be processed. Fig.9 is the processing result diagram of T4 parameter, and its processing formula is
})1()(
)1()(,
)1()(
)1()({min)(y
ktkt
kxkx
ktkt
kxkxk
(3)
In Eq(3), the x (k) is the telemetry parameter value of k time, t(k) is the specific time value of k time, and min() function is the representation for minimum value.
Figure 10. The processed T4 spacecraft telemetry parameter diagram
After the processing of the history telemetry data, we need to make a fuzzification on the processed deviation value to assign them to the corresponding fuzzy variable sets, and the fuzzy variable sets can be selected as {deviation smaller, deviation small, deviation large, deviation larger}.
After the definition of fuzzy variable set, each practical value will be converted to the corresponding fuzzy variables through the membership function. In the definition of membership function, we need to obtain the membership function of deviation smaller, deviation small, deviation large and deviation larger according to its corresponding law of data.
The membership function can be chosen for linear function or S- function forms. After the analysis of the
630

telemetry data, we find that the linear function can meet the requirements. In the fuzzification process, the historical telemetry data need to be used to calculate the coefficient corresponding to the membership function. For data in Fig.10, the membership function can be determined as follows:
1) Selection of smaller membership function: u1(y)=1-y/0.02, y<0.02 .
2) Selection of small membership function: u2(y)=y/0.02; y>0,y<0.02; at the same time u2(y) = (0.04-y)/0.02, y>0.02, y<0.04.
3) Selection of large membership function: u3 (y) = (y - 0.02) / 0.02; Y > 0.02; Y < 0.04; at the same time u3(y) = (0.06-y)/0.02, y>0.04, y<0.06.
4) Selection of larger membership function: u4(y)=1; y>0.06; At the same time u4(y) = (y-0.04)/0.02.
Figure 11. Membership function corresponding to the deviation value of T4
The rules statement use the form of “if a then b“to describe a rule, wherein “a” represents the prerequisite, “b” represents the conclusion. The conclusion represented by “b” is also a fuzzification conclusion. The fuzzification conclusion sets can be selected as {credibility smaller, credibility small, credibility large, credibility larger}. For the processed historical data in Fig.10, the membership functions of the fuzzification conclusion sets corresponding to the credibility value can be shown in Fig.12.
. Figure 12. Membership function of the conclusion set
After the fuzzification and working of the rules statement, the corresponding fuzzification conclusion can be obtained. Then we need to use the defuzzification method to obtain the accurate value. In this process, the center of gravity method is taken to calculate the accurate credibility value. For the calculation of the credibility value of the data in Fig.12, we can select the calculation method as:
credibi(y)=0*k1+0.33*k2+0.66*k3+k4. (4) Among them, k1, k2, k3, k4 respectively means the
probability of the smaller credibility, small credibility, large credibility and larger credibility, the results is shown in Fig.13.
Figure 13. Credibility of the T4 telemetry data based on fuzzy algorithm
After the calculation of credibility of the historical T4 temperature telemetry parameters, we can analyze the performance of the fuzzy algorithm. As shown in Table. 3.
Base line Missed alarm rateMissed alarm
rate Total Num.
Performance
0.1 0 1 3480 0
0.2 0 15 3480 0
From Table 3 and Fig.13, we can find the fuzzy algorithm can be very good to separate the credibility value of the error and credibility value of normal data, and the effect is good.
IV. DATA CREDIBILITY CALCULATION SOFTWARE
On the basis of the two methods, we realized the telemetry data credibility calculation software, which has the function of credibility calculation formula coefficient formation, historical data credibility mark, real-time computation of credibility, etc. The software has been applied in the actual project application, and can meet the practical needs of engineering.
Figure 14. The data credibility calculation software (temperature & voltage)
V. CONCLUSION
This paper puts forward the telemetry data credibility calculation methods based on the probability statistics and fuzzy algorithm. On the basis of the data test, the process and performance of the algorithms were analyzed and verified. The methods can provide the effcient technical basis of the spacecraft condition monitoring and diagnosis system, and has strong practical significance in spacecraft engineering project.
REFERENCES [1] P. Fortescue, J. Stark, G. Swinerd. "Spacecraft system engineering"(3rd
edition). John Willey & Sons Ltd. 2003.
[2] Y. Li, J. M. Luo. "Analysis and research on the reliability of spacecraft's telemetry data". Foreign Electronic Measurement Technology, June 2008, 27(6), pp. 7-8;49.
[3] S.Z. Zhao, C.W. Gao, X.L. Wu. "The research of eliminating the outlier in data processing of remote meausurement". Structrue & Enviroment Engineering, March 2005, 32(1), pp 9-13.
[4] H. Z. Fang, K. X. Zou, D. W. Yi, " Study of the long-term performance prediction methods using the spacecraft telemetry data”. In 2012 Prognostics&System Health Management Conference, 2012 Beijing.
[5] L. Losik, "Stopping launch pad delays, launch failures, satellite infant mortalities and on-orbit satellite failures using telemetry prognostic technology". Proceedings from the International Telemetry Conference, October 2007.
631