Deutsche Bank Containerboard - jrj.com.cnpg.jrj.com.cn/acc/Res/CN_RES/INVEST/2017/11/20/... ·...
16
China Containerboard Industrials Manufacturing Breaking News Asia China Industry China Containerboard Date 20 November 2017 Deutsche Bank Markets Research Imported OCC contaminants cap cut to 0.5%? Further margin squeeze in 2018 China intends to revise OCC contaminant threshold to 0.5% According to the Bureau of International Recycling (BIR), on November 15, China notified the WTO that it intends to control the percentage of contaminants in imported OCC to 0.5% with new rules due to be published on December 31, 2017 and implementation on March 1, 2018. (See "Environmental Protection Control Standard for Imported Solid Wastes as Raw Materials - Waste and Scrap of Paper or Paperboard (GB 16487.4 - 2017 ".) The contaminants percentage for imported OCC is currently 1.5%, based on Chinese regulations published in 2005, but was revised to 0.3% in the initial draft released in August 2017; however, such stringent requirements generated many protests globally. The protests led to speculation that China would revise the percentage to 1%, but this appears to have indeed just been speculation. If there are no further changes to the 0.5% standard, which differs a lot from what is currently followed by global recycling communities, this could lead to a significant cost push to Chinese paper producers since they will be forced to use more expensive higher imported OCC grades. While a cost push normally suggests higher domestic paper prices, China already boasts the most expensive paper prices globally, so further prices hikes should not be expected. On the contrary, this creates an opportunity for more finished paper imports into China in 2018. Imported OCC prices structurally higher for Chinese mills While the OCC contaminants threshold has yet to be determined, we know that imported OCC will need to be of a higher quality going forward, because the import of “unsorted waste paper” will also be banned, starting January 1, 2018. Based on Chinese standards, the benchmark US#11 OCC contains 1% contaminants and, according to DB's US paper analyst, many US recyclers are getting away with a 1.5% contaminant level for waste paper being shipped to China currently. In order to comply with the new standard of 0.5%, considerable sums will need to be invested so that assets can be upgraded accordingly. If the 0.5% contaminant level sticks, Chinese paper mills will be forced to import the more expensive US#12 waste paper, which fits the 0.5% standard and which is USD15-40/t more expensive. Even excluding the contaminant factor, we estimate 8mt, or 28% of imported OCC, will have to be upgraded or rearranged based on 2017 numbers, including 6.1mt of unsorted waste paper and 1.9mt sorted by paper mills with capacity of less than 300k. Paper mills' margins to be squeezed further next year In 2H17, large paper mills in China enjoyed an unprecedented advantage, given the surprise import ban since May 2017 and the subsequent crash in US OCC. Johnson Wan Research Analyst +852-2203 6163 Top picks Nine Dragons Paper (2689.HK),HKD12.80 Sell Lee & Man Paper (2314.HK),HKD8.86 Hold Source: Deutsche Bank Companies featured Nine Dragons Paper (2689.HK),HKD12.80 Sell 2017A 2018E 2019E P/E (x) 6.6 6.9 11.3 EV/EBITDA (x) 6.2 6.0 7.8 Price/book (x) 1.4 1.4 1.4 Lee & Man Paper (2314.HK),HKD8.86 Hold 2016A 2017E 2018E P/E (x) 8.9 7.2 9.1 EV/EBITDA (x) 8.5 6.6 7.7 Price/book (x) 1.6 1.9 1.7 Source: Deutsche Bank Deutsche Bank AG/Hong Kong Deutsche Bank does and seeks to do business with companies covered in its research reports. Thus, investors should be aware that the firm may have a conflict of interest that could affect the objectivity of this report. Investors should consider this report as only a single factor in making their investment decision. DISCLOSURES AND ANALYST CERTIFICATIONS ARE LOCATED IN APPENDIX 1. MCI (P) 083/04/2017. Distributed on: 20/11/2017 15:00:15 GMT 0bed7b6cf11c
Transcript of Deutsche Bank Containerboard - jrj.com.cnpg.jrj.com.cn/acc/Res/CN_RES/INVEST/2017/11/20/... ·...
20 November 2017
Manufacturing
China Containerboard
IndustrialsManufacturing Breaking News
AsiaChina
Industry
ChinaContainerboard
Date20 November 2017
Deutsche BankMarkets Research
Imported OCC contaminants cap cut to0.5%? Further margin squeeze in 2018China intends to revise OCC contaminant threshold to 0.5%According to the Bureau of International Recycling (BIR), on November 15, Chinanotified the WTO that it intends to control the percentage of contaminants inimported OCC to 0.5% with new rules due to be published on December 31,2017 and implementation on March 1, 2018. (See "Environmental ProtectionControl Standard for Imported Solid Wastes as Raw Materials - Waste and Scrapof Paper or Paperboard (GB 16487.4 - 2017".) The contaminants percentage forimported OCC is currently 1.5%, based on Chinese regulations published in 2005,but was revised to 0.3% in the initial draft released in August 2017; however,such stringent requirements generated many protests globally. The protests ledto speculation that China would revise the percentage to 1%, but this appears tohave indeed just been speculation. If there are no further changes to the 0.5%standard, which differs a lot from what is currently followed by global recyclingcommunities, this could lead to a significant cost push to Chinese paper producerssince they will be forced to use more expensive higher imported OCC grades.While a cost push normally suggests higher domestic paper prices, China alreadyboasts the most expensive paper prices globally, so further prices hikes shouldnot be expected. On the contrary, this creates an opportunity for more finishedpaper imports into China in 2018.
Imported OCC prices structurally higher for Chinese millsWhile the OCC contaminants threshold has yet to be determined, we knowthat imported OCC will need to be of a higher quality going forward, becausethe import of “unsorted waste paper” will also be banned, starting January 1,2018. Based on Chinese standards, the benchmark US#11 OCC contains 1%contaminants and, according to DB's US paper analyst, many US recyclers aregetting away with a 1.5% contaminant level for waste paper being shipped toChina currently. In order to comply with the new standard of 0.5%, considerablesums will need to be invested so that assets can be upgraded accordingly. If the0.5% contaminant level sticks, Chinese paper mills will be forced to import themore expensive US#12 waste paper, which fits the 0.5% standard and which isUSD15-40/t more expensive. Even excluding the contaminant factor, we estimate8mt, or 28% of imported OCC, will have to be upgraded or rearranged basedon 2017 numbers, including 6.1mt of unsorted waste paper and 1.9mt sorted bypaper mills with capacity of less than 300k.
Paper mills' margins to be squeezed further next yearIn 2H17, large paper mills in China enjoyed an unprecedented advantage, giventhe surprise import ban since May 2017 and the subsequent crash in US OCC.
Johnson Wan
Research Analyst
+852-2203 6163
Top picks
Nine Dragons Paper(2689.HK),HKD12.80
Sell
Lee & Man Paper (2314.HK),HKD8.86 HoldSource: Deutsche Bank
Companies featured
Nine Dragons Paper (2689.HK),HKD12.80 Sell
2017A 2018E 2019E
P/E (x) 6.6 6.9 11.3
EV/EBITDA (x) 6.2 6.0 7.8
Price/book (x) 1.4 1.4 1.4
Lee & Man Paper (2314.HK),HKD8.86 Hold
2016A 2017E 2018E
P/E (x) 8.9 7.2 9.1
EV/EBITDA (x) 8.5 6.6 7.7
Price/book (x) 1.6 1.9 1.7Source: Deutsche Bank
Deutsche Bank AG/Hong Kong
Deutsche Bank does and seeks to do business with companies covered in its research reports. Thus, investors should beaware that the firm may have a conflict of interest that could affect the objectivity of this report. Investors should considerthis report as only a single factor in making their investment decision. DISCLOSURES AND ANALYST CERTIFICATIONSARE LOCATED IN APPENDIX 1. MCI (P) 083/04/2017.
Distributed on: 20/11/2017 15:00:15 GMT
0bed7b6cf11c
20 November 2017
Manufacturing
China Containerboard
Small mills, which were only able to use domestic OCC, suffered while large millsbenefited. However, we believe this advantage will go away in 2018. Since thetrough in September 2017, imported US OCC #11 has rebounded from USD160/t to USD260/t and costs could become greater for large mills if they are forcedto use more expensive, higher-quality imports. While the argument is that higherOCC prices will lead to higher paper prices, we do not believe that will be the casein 2018. A sustainable Chinese paper price should be capped by imports, whichare still c.RMB1,500t more expensive than they are overseas at the moment. Withmore new containerboard supply becoming available in China this and next year,supply-demand for global OCC will also tighten, pushing costs higher. Reiteratingour Sell on NDP with a target price of HKD10.98/share and our Hold on LMP witha target price of HKD8.30/share.
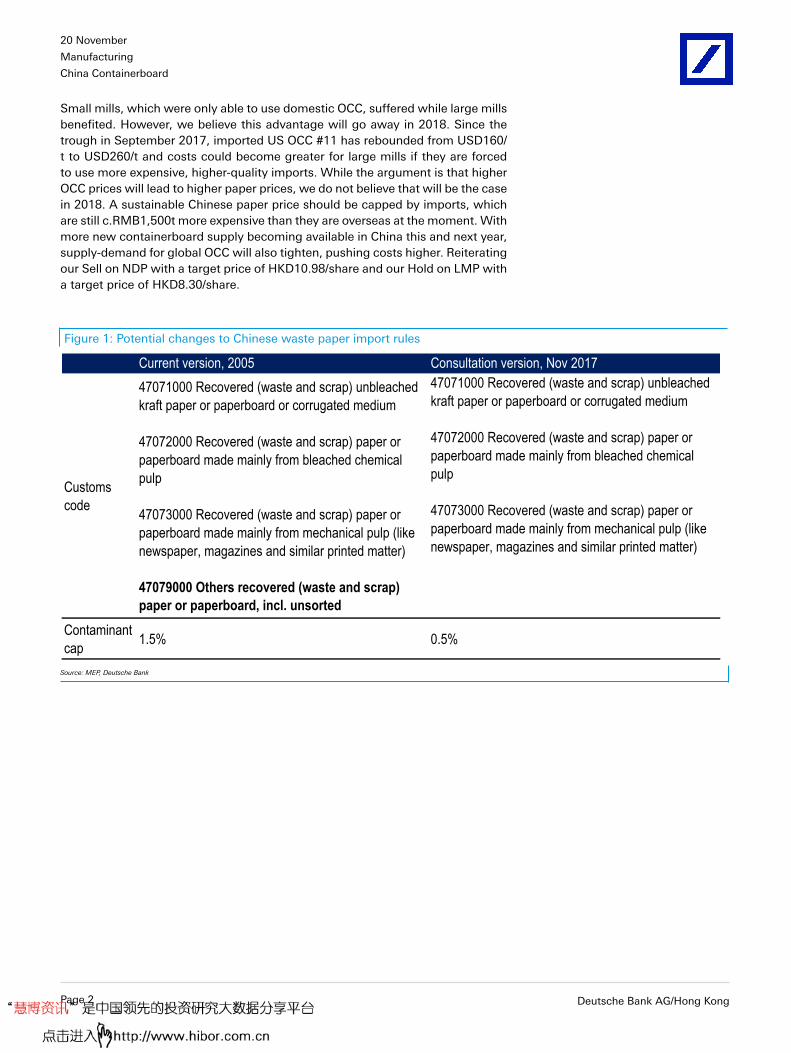
Figure 1: Potential changes to Chinese waste paper import rules
Current version, 2005 Consultation version, Nov 2017
Customs
code
47071000 Recovered (waste and scrap) unbleached
kraft paper or paperboard or corrugated medium
47072000 Recovered (waste and scrap) paper or
paperboard made mainly from bleached chemical
pulp
47073000 Recovered (waste and scrap) paper or
paperboard made mainly from mechanical pulp (like
newspaper, magazines and similar printed matter)
47079000 Others recovered (waste and scrap)
paper or paperboard, incl. unsorted
47071000 Recovered (waste and scrap) unbleached
kraft paper or paperboard or corrugated medium
47072000 Recovered (waste and scrap) paper or
paperboard made mainly from bleached chemical
pulp
47073000 Recovered (waste and scrap) paper or
paperboard made mainly from mechanical pulp (like
newspaper, magazines and similar printed matter)
Contaminant
cap1.5% 0.5%
Source: MEP, Deutsche Bank
Page 2 Deutsche Bank AG/Hong Kong
20 November 2017
Manufacturing
China Containerboard
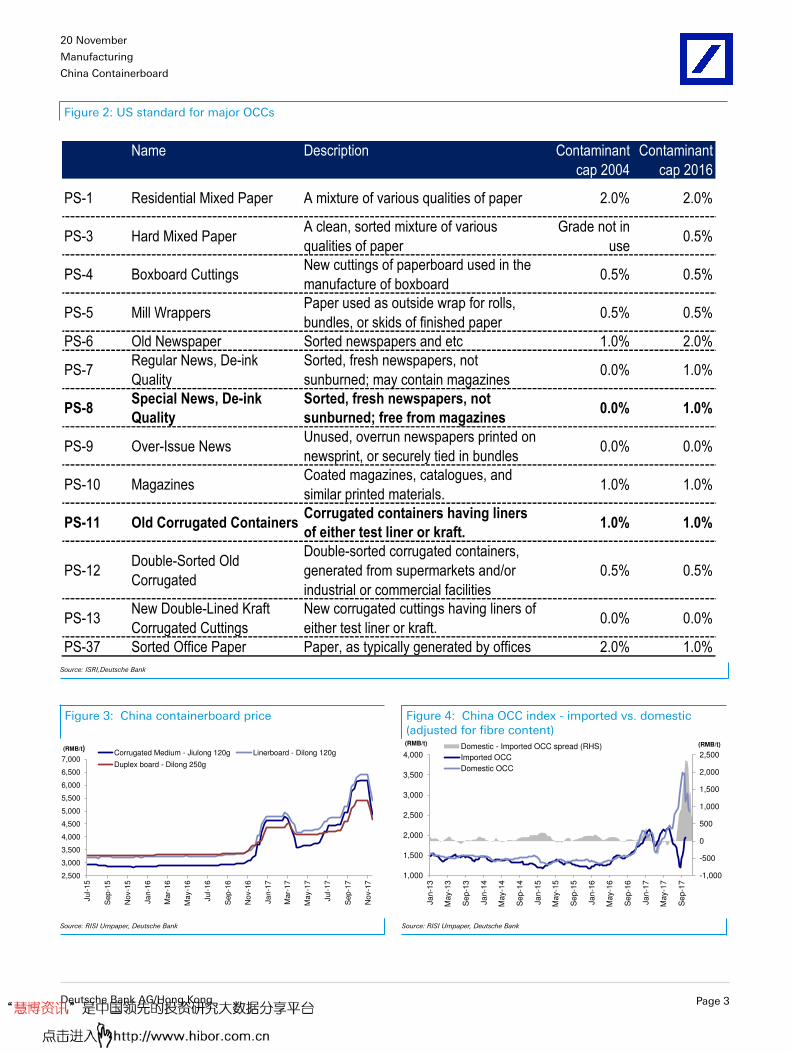
Figure 2: US standard for major OCCs
Name Description Contaminant
cap 2004
Contaminant
cap 2016
PS-1 Residential Mixed Paper A mixture of various qualities of paper 2.0% 2.0%
PS-3 Hard Mixed PaperA clean, sorted mixture of various
qualities of paper
Grade not in
use0.5%
PS-4 Boxboard CuttingsNew cuttings of paperboard used in the
manufacture of boxboard0.5% 0.5%
PS-5 Mill WrappersPaper used as outside wrap for rolls,
bundles, or skids of finished paper0.5% 0.5%
PS-6 Old Newspaper Sorted newspapers and etc 1.0% 2.0%
PS-7Regular News, De-ink
Quality
Sorted, fresh newspapers, not
sunburned; may contain magazines0.0% 1.0%
PS-8Special News, De-ink
Quality
Sorted, fresh newspapers, not
sunburned; free from magazines0.0% 1.0%
PS-9 Over-Issue NewsUnused, overrun newspapers printed on
newsprint, or securely tied in bundles0.0% 0.0%
PS-10 MagazinesCoated magazines, catalogues, and
similar printed materials.1.0% 1.0%
PS-11 Old Corrugated ContainersCorrugated containers having liners
of either test liner or kraft.1.0% 1.0%
PS-12Double-Sorted Old
Corrugated
Double-sorted corrugated containers,
generated from supermarkets and/or
industrial or commercial facilities
0.5% 0.5%
PS-13New Double-Lined Kraft
Corrugated Cuttings
New corrugated cuttings having liners of
either test liner or kraft.0.0% 0.0%
PS-37 Sorted Office Paper Paper, as typically generated by offices 2.0% 1.0%
Source: ISRI,Deutsche Bank
Figure 3: China containerboard price Figure 4: China OCC index - imported vs. domestic(adjusted for fibre content)
2,500
3,000
3,500
4,000
4,500
5,000
5,500
6,000
6,500
7,000
Ju
l-1
5
Se
p-1
5
Nov-1
5
Jan-1
6
Mar-
16
May-1
6
Jul-
16
Sep-1
6
Nov-1
6
Jan-1
7
Mar-
17
May-1
7
Ju
l-1
7
Se
p-1
7
Nov-1
7
(RMB/t)Corrugated Medium - Jiulong 120g Linerboard - Dilong 120g
Duplex board - Dilong 250g
-1,000
-500
0
500
1,000
1,500
2,000
2,500
1,000
1,500
2,000
2,500
3,000
3,500
4,000
Ja
n-1
3
May-1
3
Sep
-13
Jan-1
4
May-1
4
Se
p-1
4
Ja
n-1
5
Ma
y-1
5
Sep
-15
Jan-1
6
Ma
y-1
6
Se
p-1
6
Ja
n-1
7
Ma
y-1
7
Sep
-17
(RMB/t) (RMB/t)Domestic - Imported OCC spread (RHS)
Imported OCC
Domestic OCC
Source: RISI Umpaper, Deutsche Bank Source: RISI Umpaper, Deutsche Bank
Deutsche Bank AG/Hong Kong Page 3
20 November 2017
Manufacturing
China Containerboard
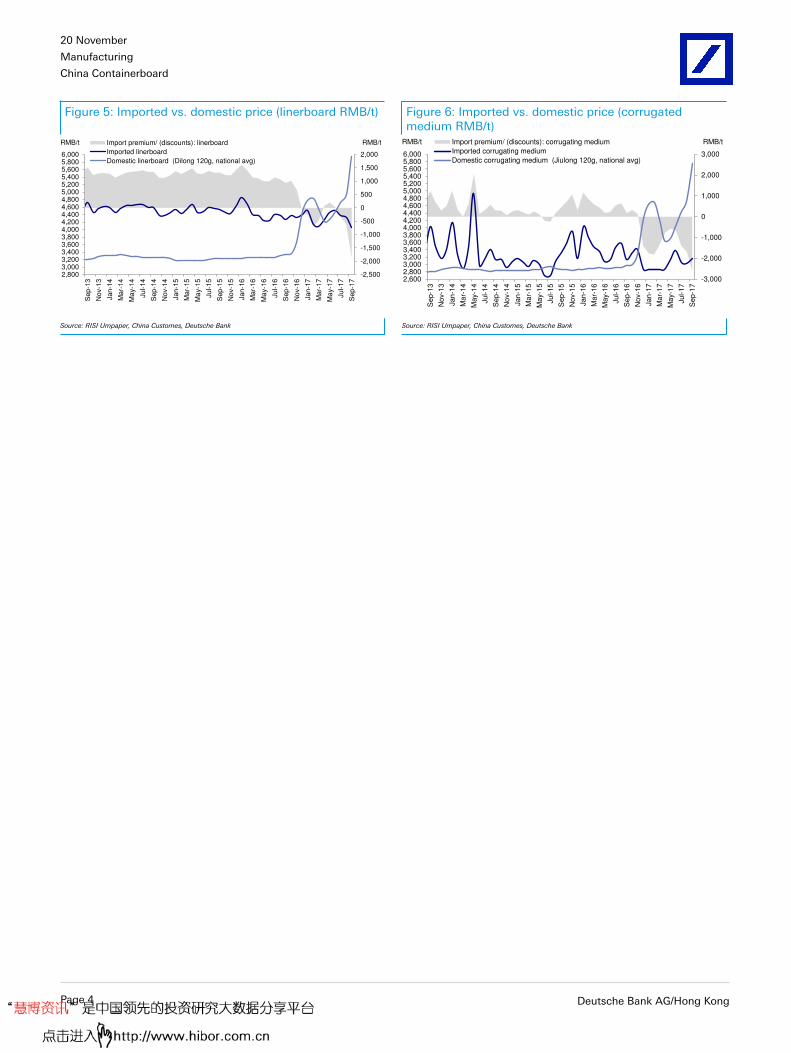
Figure 5: Imported vs. domestic price (linerboard RMB/t) Figure 6: Imported vs. domestic price (corrugatedmedium RMB/t)
-2,500
-2,000
-1,500
-1,000
-500
0
500
1,000
1,500
2,000
2,8003,0003,2003,4003,6003,8004,0004,2004,4004,6004,8005,0005,2005,4005,6005,8006,000
Sep
-13
No
v-1
3
Jan
-14
Ma
r-1
4
Ma
y-1
4
Jul-
14
Sep
-14
No
v-1
4
Jan
-15
Ma
r-1
5
Ma
y-1
5
Jul-
15
Sep
-15
No
v-1
5
Jan
-16
Ma
r-1
6
Ma
y-1
6
Jul-
16
Sep
-16
No
v-1
6
Jan
-17
Ma
r-1
7
Ma
y-1
7
Jul-
17
Sep
-17
Import premium/ (discounts): linerboard
Imported linerboard
Domestic linerboard (Dilong 120g, national avg)
RMB/t RMB/t
-3,000
-2,000
-1,000
0
1,000
2,000
3,000
2,6002,8003,0003,2003,4003,6003,8004,0004,2004,4004,6004,8005,0005,2005,4005,6005,8006,000
Sep
-13
No
v-1
3
Jan
-14
Ma
r-1
4
Ma
y-1
4
Jul-
14
Sep
-14
No
v-1
4
Jan
-15
Ma
r-1
5
Ma
y-1
5
Jul-
15
Sep
-15
No
v-1
5
Jan
-16
Ma
r-1
6
Ma
y-1
6
Jul-
16
Sep
-16
No
v-1
6
Jan
-17
Ma
r-1
7
Ma
y-1
7
Jul-
17
Sep
-17
Import premium/ (discounts): corrugating medium
Imported corrugating medium
Domestic corrugating medium (Jiulong 120g, national avg)
RMB/t RMB/t
Source: RISI Umpaper, China Customes, Deutsche Bank Source: RISI Umpaper, China Customes, Deutsche Bank
Page 4 Deutsche Bank AG/Hong Kong
20 November 2017
Manufacturing
China Containerboard
Model updated: 16 November 2017
Running the numbersAsiaChinaManufacturing
Lee & Man PaperReuters: 2314.HK Bloomberg: 2314 HK
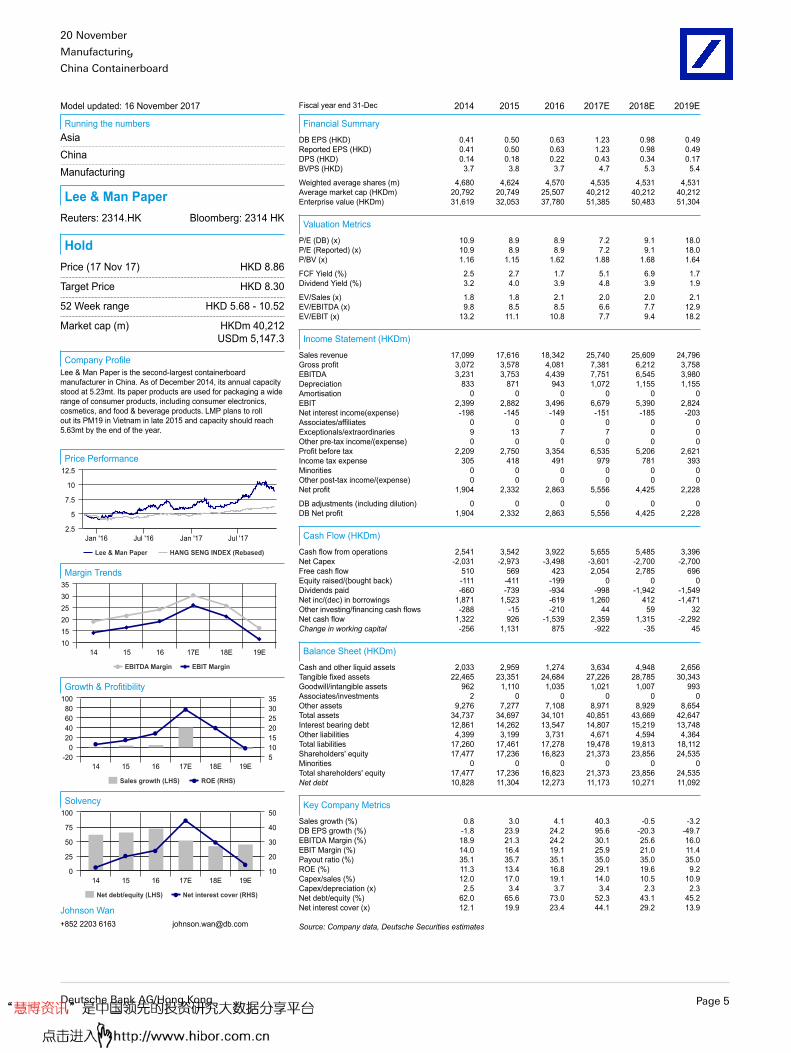
HoldPrice (17 Nov 17) HKD 8.86
Target Price HKD 8.30
52 Week range HKD 5.68 - 10.52
Market cap (m) HKDm 40,212 USDm 5,147.3
Company ProfileLee & Man Paper is the second-largest containerboardmanufacturer in China. As of December 2014, its annual capacitystood at 5.23mt. Its paper products are used for packaging a widerange of consumer products, including consumer electronics,cosmetics, and food & beverage products. LMP plans to rollout its PM19 in Vietnam in late 2015 and capacity should reach5.63mt by the end of the year.
Price Performance
Lee & Man Paper HANG SENG INDEX (Rebased)
Jan '16 Jan '17Jul '16 Jul '17
10
2.5
5
7.5
12.5
Margin Trends
EBITDA Margin EBIT Margin
14 15 16 17E 18E 19E101520253035
Growth & Profitibility
Sales growth (LHS) ROE (RHS)
14 15 16 17E 18E 19E
02040
-20
6080
100
5101520253035
Solvency
Net debt/equity (LHS) Net interest cover (RHS)
14 15 16 17E 18E 19E0
25
50
75
100
10
20
30
40
50
Johnson Wan+852 2203 6163 [email protected]
Fiscal year end 31-Dec 2014 2015 2016 2017E 2018E 2019E
Financial Summary
DB EPS (HKD) 0.41 0.50 0.63 1.23 0.98 0.49Reported EPS (HKD) 0.41 0.50 0.63 1.23 0.98 0.49DPS (HKD) 0.14 0.18 0.22 0.43 0.34 0.17BVPS (HKD) 3.7 3.8 3.7 4.7 5.3 5.4
Weighted average shares (m) 4,680 4,624 4,570 4,535 4,531 4,531Average market cap (HKDm) 20,792 20,749 25,507 40,212 40,212 40,212Enterprise value (HKDm) 31,619 32,053 37,780 51,385 50,483 51,304
Valuation Metrics
P/E (DB) (x) 10.9 8.9 8.9 7.2 9.1 18.0P/E (Reported) (x) 10.9 8.9 8.9 7.2 9.1 18.0P/BV (x) 1.16 1.15 1.62 1.88 1.68 1.64
FCF Yield (%) 2.5 2.7 1.7 5.1 6.9 1.7Dividend Yield (%) 3.2 4.0 3.9 4.8 3.9 1.9
EV/Sales (x) 1.8 1.8 2.1 2.0 2.0 2.1EV/EBITDA (x) 9.8 8.5 8.5 6.6 7.7 12.9EV/EBIT (x) 13.2 11.1 10.8 7.7 9.4 18.2
Income Statement (HKDm)
Sales revenue 17,099 17,616 18,342 25,740 25,609 24,796Gross profit 3,072 3,578 4,081 7,381 6,212 3,758EBITDA 3,231 3,753 4,439 7,751 6,545 3,980Depreciation 833 871 943 1,072 1,155 1,155Amortisation 0 0 0 0 0 0EBIT 2,399 2,882 3,496 6,679 5,390 2,824Net interest income(expense) -198 -145 -149 -151 -185 -203Associates/affiliates 0 0 0 0 0 0Exceptionals/extraordinaries 9 13 7 7 0 0Other pre-tax income/(expense) 0 0 0 0 0 0Profit before tax 2,209 2,750 3,354 6,535 5,206 2,621Income tax expense 305 418 491 979 781 393Minorities 0 0 0 0 0 0Other post-tax income/(expense) 0 0 0 0 0 0Net profit 1,904 2,332 2,863 5,556 4,425 2,228
DB adjustments (including dilution) 0 0 0 0 0 0DB Net profit 1,904 2,332 2,863 5,556 4,425 2,228
Cash Flow (HKDm)
Cash flow from operations 2,541 3,542 3,922 5,655 5,485 3,396Net Capex -2,031 -2,973 -3,498 -3,601 -2,700 -2,700Free cash flow 510 569 423 2,054 2,785 696Equity raised/(bought back) -111 -411 -199 0 0 0Dividends paid -660 -739 -934 -998 -1,942 -1,549Net inc/(dec) in borrowings 1,871 1,523 -619 1,260 412 -1,471Other investing/financing cash flows -288 -15 -210 44 59 32Net cash flow 1,322 926 -1,539 2,359 1,315 -2,292Change in working capital -256 1,131 875 -922 -35 45
Balance Sheet (HKDm)
Cash and other liquid assets 2,033 2,959 1,274 3,634 4,948 2,656Tangible fixed assets 22,465 23,351 24,684 27,226 28,785 30,343Goodwill/intangible assets 962 1,110 1,035 1,021 1,007 993Associates/investments 2 0 0 0 0 0Other assets 9,276 7,277 7,108 8,971 8,929 8,654Total assets 34,737 34,697 34,101 40,851 43,669 42,647Interest bearing debt 12,861 14,262 13,547 14,807 15,219 13,748Other liabilities 4,399 3,199 3,731 4,671 4,594 4,364Total liabilities 17,260 17,461 17,278 19,478 19,813 18,112Shareholders' equity 17,477 17,236 16,823 21,373 23,856 24,535Minorities 0 0 0 0 0 0Total shareholders' equity 17,477 17,236 16,823 21,373 23,856 24,535Net debt 10,828 11,304 12,273 11,173 10,271 11,092
Key Company Metrics
Sales growth (%) 0.8 3.0 4.1 40.3 -0.5 -3.2DB EPS growth (%) -1.8 23.9 24.2 95.6 -20.3 -49.7EBITDA Margin (%) 18.9 21.3 24.2 30.1 25.6 16.0EBIT Margin (%) 14.0 16.4 19.1 25.9 21.0 11.4Payout ratio (%) 35.1 35.7 35.1 35.0 35.0 35.0ROE (%) 11.3 13.4 16.8 29.1 19.6 9.2Capex/sales (%) 12.0 17.0 19.1 14.0 10.5 10.9Capex/depreciation (x) 2.5 3.4 3.7 3.4 2.3 2.3Net debt/equity (%) 62.0 65.6 73.0 52.3 43.1 45.2Net interest cover (x) 12.1 19.9 23.4 44.1 29.2 13.9
Source: Company data, Deutsche Securities estimates
Deutsche Bank AG/Hong Kong Page 5
20 November 2017
Manufacturing
China Containerboard
Investment Thesis
Outlook
LMP is venturing into the tissue business, a market that is highly fragmentedand competitive. Even though LMP has an inherent cost advantage through theownership of a 300kt pulp line, its expansion plans have far exceeded that of itsraw material supply. The containerboard business for LMP remains a cash cow,with its higher exposure to South China and better product mix in linerboardbeing an advantage in the current market. They will be less impacted by newcapacity additions versus that of its peer NDP. We rate the shares Hold.
Valuation
We value LMP based on 8.5x FY18 PER, a lower multiple versus the 10xmultiple based on their historical average. LMP is currently trading on 9.2x FY18earnings and 18.3x FY19 earnings. The lower multiple reflects the peak earningsthat is expected in 2018. Our target price of HKD8.30 also reflects 1.5x FY18PB on 19.6% ROE and 1.45x FY19 PB on 9.2% ROE. While the PB multiple for2018 appears low, the PB multiple on FY19 is almost too high since we expectearnings decline to persist over the next few years. Versus its peer NDP, webelieve LMP deserves a higher PB and PE multiple, given higher quality earningsgrowth and less cyclical earnings nature. LMP derives more than 51% of itsearnings from South China where supply-demand and market concentration isbetter, and its product mix, heavily skewed towards linerboard, is also morefavorable.
Risks
Upside risks: accelerated ramp-up & profitability of tissue paper business,deceleration of new supply in the sector, stronger-than-expected demand andpaper prices, unexpected OCC cost cuts. Downside risks are the converse.
Page 6 Deutsche Bank AG/Hong Kong
20 November 2017
Manufacturing
China Containerboard
Model updated: 16 November 2017
Running the numbersAsiaChinaManufacturing
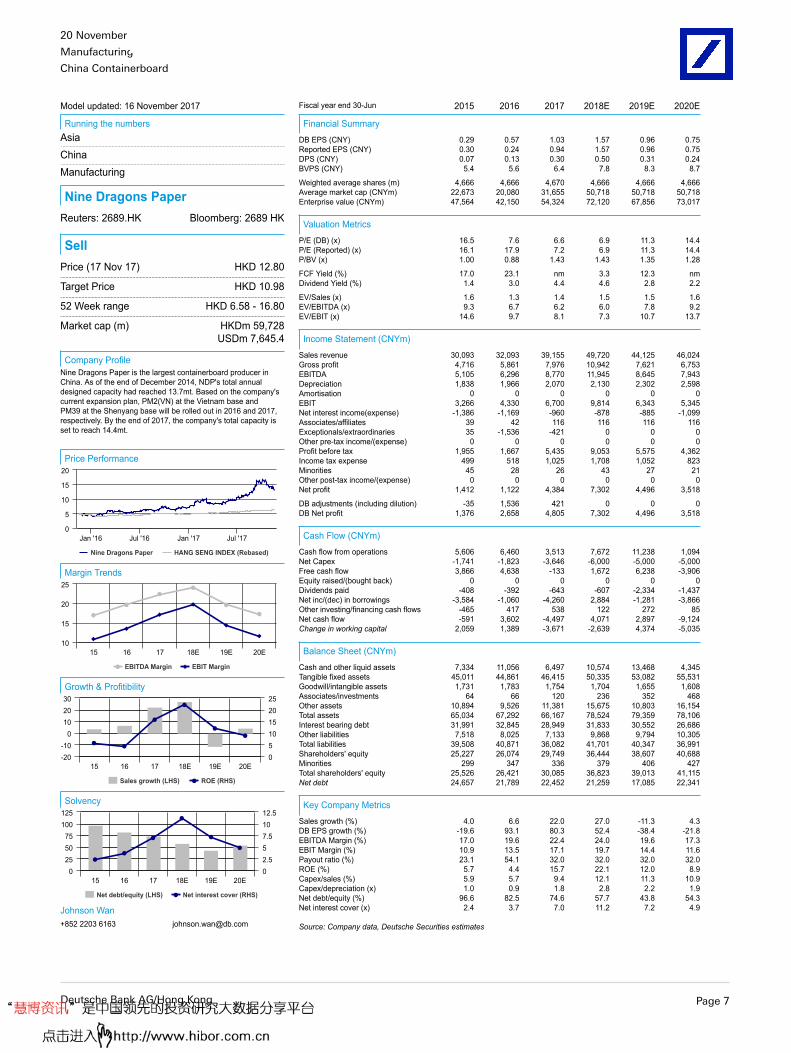
Nine Dragons PaperReuters: 2689.HK Bloomberg: 2689 HK
SellPrice (17 Nov 17) HKD 12.80
Target Price HKD 10.98
52 Week range HKD 6.58 - 16.80
Market cap (m) HKDm 59,728 USDm 7,645.4
Company ProfileNine Dragons Paper is the largest containerboard producer inChina. As of the end of December 2014, NDP's total annualdesigned capacity had reached 13.7mt. Based on the company'scurrent expansion plan, PM2(VN) at the Vietnam base andPM39 at the Shenyang base will be rolled out in 2016 and 2017,respectively. By the end of 2017, the company's total capacity isset to reach 14.4mt.
Price Performance
Nine Dragons Paper HANG SENG INDEX (Rebased)
Jan '16 Jan '17Jul '16 Jul '17
5
10
15
0
20
Margin Trends
EBITDA Margin EBIT Margin
15 16 17 18E 19E 20E10
15
20
25
Growth & Profitibility
Sales growth (LHS) ROE (RHS)
15 16 17 18E 19E 20E-20-10
0102030
0510152025
Solvency
Net debt/equity (LHS) Net interest cover (RHS)
15 16 17 18E 19E 20E0
255075
100125
02.557.51012.5
Johnson Wan+852 2203 6163 [email protected]
Fiscal year end 30-Jun 2015 2016 2017 2018E 2019E 2020E
Financial Summary
DB EPS (CNY) 0.29 0.57 1.03 1.57 0.96 0.75Reported EPS (CNY) 0.30 0.24 0.94 1.57 0.96 0.75DPS (CNY) 0.07 0.13 0.30 0.50 0.31 0.24BVPS (CNY) 5.4 5.6 6.4 7.8 8.3 8.7
Weighted average shares (m) 4,666 4,666 4,670 4,666 4,666 4,666Average market cap (CNYm) 22,673 20,080 31,655 50,718 50,718 50,718Enterprise value (CNYm) 47,564 42,150 54,324 72,120 67,856 73,017
Valuation Metrics
P/E (DB) (x) 16.5 7.6 6.6 6.9 11.3 14.4P/E (Reported) (x) 16.1 17.9 7.2 6.9 11.3 14.4P/BV (x) 1.00 0.88 1.43 1.43 1.35 1.28
FCF Yield (%) 17.0 23.1 nm 3.3 12.3 nmDividend Yield (%) 1.4 3.0 4.4 4.6 2.8 2.2
EV/Sales (x) 1.6 1.3 1.4 1.5 1.5 1.6EV/EBITDA (x) 9.3 6.7 6.2 6.0 7.8 9.2EV/EBIT (x) 14.6 9.7 8.1 7.3 10.7 13.7
Income Statement (CNYm)
Sales revenue 30,093 32,093 39,155 49,720 44,125 46,024Gross profit 4,716 5,861 7,976 10,942 7,621 6,753EBITDA 5,105 6,296 8,770 11,945 8,645 7,943Depreciation 1,838 1,966 2,070 2,130 2,302 2,598Amortisation 0 0 0 0 0 0EBIT 3,266 4,330 6,700 9,814 6,343 5,345Net interest income(expense) -1,386 -1,169 -960 -878 -885 -1,099Associates/affiliates 39 42 116 116 116 116Exceptionals/extraordinaries 35 -1,536 -421 0 0 0Other pre-tax income/(expense) 0 0 0 0 0 0Profit before tax 1,955 1,667 5,435 9,053 5,575 4,362Income tax expense 499 518 1,025 1,708 1,052 823Minorities 45 28 26 43 27 21Other post-tax income/(expense) 0 0 0 0 0 0Net profit 1,412 1,122 4,384 7,302 4,496 3,518
DB adjustments (including dilution) -35 1,536 421 0 0 0DB Net profit 1,376 2,658 4,805 7,302 4,496 3,518
Cash Flow (CNYm)
Cash flow from operations 5,606 6,460 3,513 7,672 11,238 1,094Net Capex -1,741 -1,823 -3,646 -6,000 -5,000 -5,000Free cash flow 3,866 4,638 -133 1,672 6,238 -3,906Equity raised/(bought back) 0 0 0 0 0 0Dividends paid -408 -392 -643 -607 -2,334 -1,437Net inc/(dec) in borrowings -3,584 -1,060 -4,260 2,884 -1,281 -3,866Other investing/financing cash flows -465 417 538 122 272 85Net cash flow -591 3,602 -4,497 4,071 2,897 -9,124Change in working capital 2,059 1,389 -3,671 -2,639 4,374 -5,035
Balance Sheet (CNYm)
Cash and other liquid assets 7,334 11,056 6,497 10,574 13,468 4,345Tangible fixed assets 45,011 44,861 46,415 50,335 53,082 55,531Goodwill/intangible assets 1,731 1,783 1,754 1,704 1,655 1,608Associates/investments 64 66 120 236 352 468Other assets 10,894 9,526 11,381 15,675 10,803 16,154Total assets 65,034 67,292 66,167 78,524 79,359 78,106Interest bearing debt 31,991 32,845 28,949 31,833 30,552 26,686Other liabilities 7,518 8,025 7,133 9,868 9,794 10,305Total liabilities 39,508 40,871 36,082 41,701 40,347 36,991Shareholders' equity 25,227 26,074 29,749 36,444 38,607 40,688Minorities 299 347 336 379 406 427Total shareholders' equity 25,526 26,421 30,085 36,823 39,013 41,115Net debt 24,657 21,789 22,452 21,259 17,085 22,341
Key Company Metrics
Sales growth (%) 4.0 6.6 22.0 27.0 -11.3 4.3DB EPS growth (%) -19.6 93.1 80.3 52.4 -38.4 -21.8EBITDA Margin (%) 17.0 19.6 22.4 24.0 19.6 17.3EBIT Margin (%) 10.9 13.5 17.1 19.7 14.4 11.6Payout ratio (%) 23.1 54.1 32.0 32.0 32.0 32.0ROE (%) 5.7 4.4 15.7 22.1 12.0 8.9Capex/sales (%) 5.9 5.7 9.4 12.1 11.3 10.9Capex/depreciation (x) 1.0 0.9 1.8 2.8 2.2 1.9Net debt/equity (%) 96.6 82.5 74.6 57.7 43.8 54.3Net interest cover (x) 2.4 3.7 7.0 11.2 7.2 4.9
Source: Company data, Deutsche Securities estimates
Deutsche Bank AG/Hong Kong Page 7
20 November 2017
Manufacturing
China Containerboard
Investment Thesis
Outlook
NDP should achieve record margins in 2017 through a change in sales strategyto produce less and keep supply tight in the market. This strategy may be veryeffective near term but it's unlikely to be sustainable. Smaller mills are gainingshare, imports of paper are rising and record margins are also attracting recordnew investment in 2017-20. As a nationwide player, NDP is sensitive to themarket impact of 18mt new capacity additions between 2018-20E versus ademand of only 48 mt in 2017, including its 2mt planned expansion. Sell
Valuation
We value NDP based on 8.5x CY18 earnings, a lower multiple verus the 10xmultiple based on their historical average. The lower multiple reflects the peakearnings that is expected in 2018. We have also had to create pro-formacalendar 2018 earnings for NDP given that they have a June year end but we feeljust blindly using FY18 would be inaccurate as it would include the abnormallyhigh earnings in CY2H17. Based on our proforma earnings for FY18 and FY19.NDP is currently trading on 10.7x FY18 earnings and 16.2x FY19 earnings. Ourtarget price of HKD10.98 reflects 1.28x proforma CY18 PB on 16% ROE and1.45x proforma CY19 PB on 9% ROE. While the PB multiple for 2018 appearslow, the PB multiple on FY19 is almost too high since we expect earnings declineto persist over the next few years.
Risks
Upside risks: unexpected increase in market share and output volume,deceleration of new supply in the sector, stronger-than-expected demand andpaper prices, unexpected OCC cost cuts.
Page 8 Deutsche Bank AG/Hong Kong
20 November 2017
Manufacturing
China Containerboard
Appendix 1
Important Disclosures
*Other information available upon request
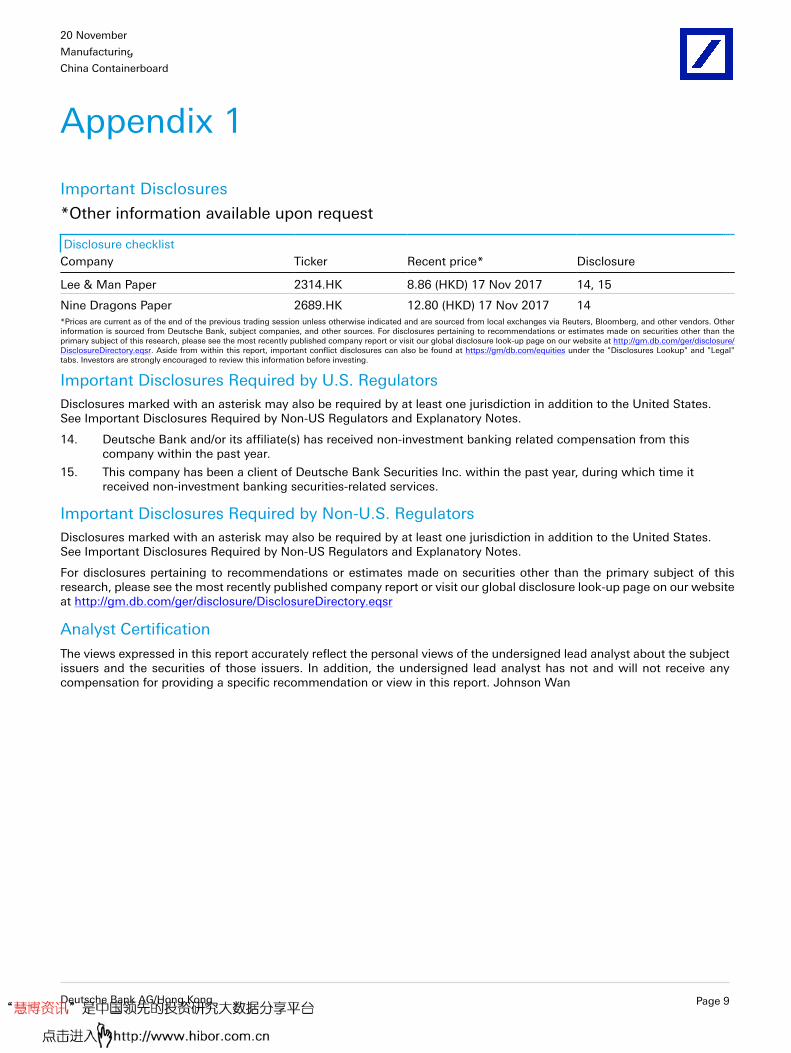
Disclosure checklistCompany Ticker Recent price* Disclosure
Lee & Man Paper 2314.HK 8.86 (HKD) 17 Nov 2017 14, 15
Nine Dragons Paper 2689.HK 12.80 (HKD) 17 Nov 2017 14*Prices are current as of the end of the previous trading session unless otherwise indicated and are sourced from local exchanges via Reuters, Bloomberg, and other vendors. Otherinformation is sourced from Deutsche Bank, subject companies, and other sources. For disclosures pertaining to recommendations or estimates made on securities other than theprimary subject of this research, please see the most recently published company report or visit our global disclosure look-up page on our website at http://gm.db.com/ger/disclosure/DisclosureDirectory.eqsr. Aside from within this report, important conflict disclosures can also be found at https://gm/db.com/equities under the "Disclosures Lookup" and "Legal"tabs. Investors are strongly encouraged to review this information before investing.
Important Disclosures Required by U.S. RegulatorsDisclosures marked with an asterisk may also be required by at least one jurisdiction in addition to the United States.See Important Disclosures Required by Non-US Regulators and Explanatory Notes.
14. Deutsche Bank and/or its affiliate(s) has received non-investment banking related compensation from thiscompany within the past year.
15. This company has been a client of Deutsche Bank Securities Inc. within the past year, during which time itreceived non-investment banking securities-related services.
Important Disclosures Required by Non-U.S. RegulatorsDisclosures marked with an asterisk may also be required by at least one jurisdiction in addition to the United States.See Important Disclosures Required by Non-US Regulators and Explanatory Notes.
For disclosures pertaining to recommendations or estimates made on securities other than the primary subject of thisresearch, please see the most recently published company report or visit our global disclosure look-up page on our websiteat http://gm.db.com/ger/disclosure/DisclosureDirectory.eqsr
Analyst Certification
The views expressed in this report accurately reflect the personal views of the undersigned lead analyst about the subjectissuers and the securities of those issuers. In addition, the undersigned lead analyst has not and will not receive anycompensation for providing a specific recommendation or view in this report. Johnson Wan
Deutsche Bank AG/Hong Kong Page 9
20 November 2017
Manufacturing
China Containerboard
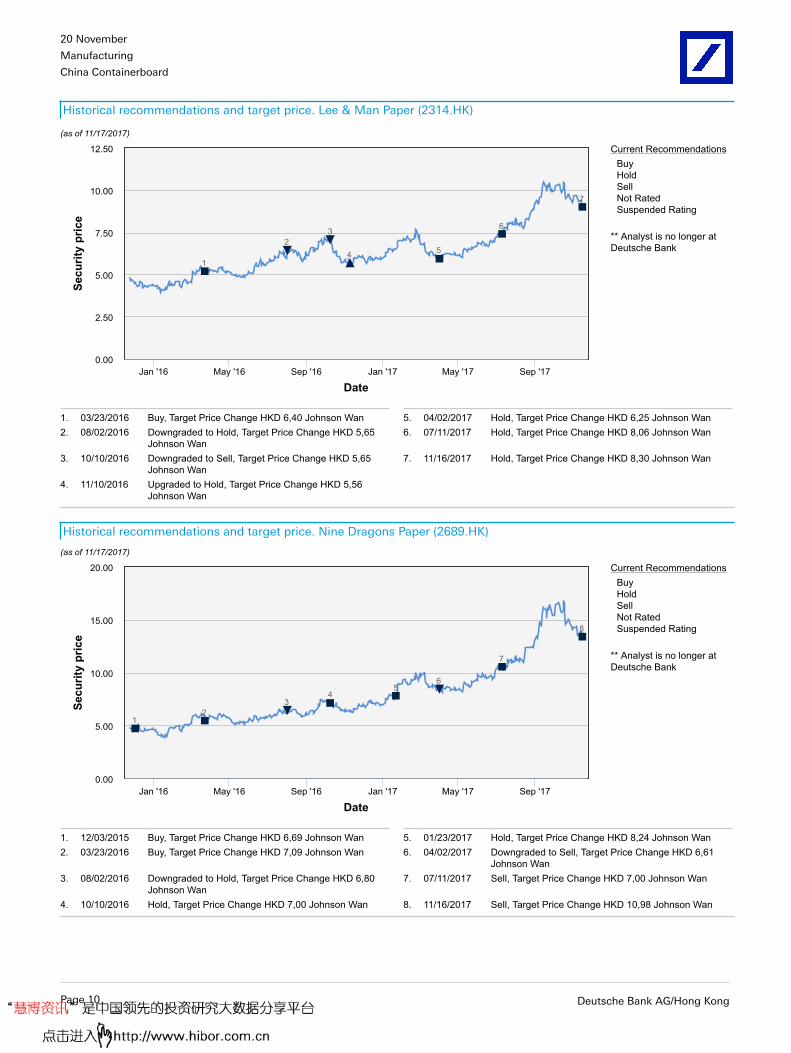
Historical recommendations and target price. Lee & Man Paper (2314.HK)
(as of 11/17/2017)
Current RecommendationsBuyHoldSellNot RatedSuspended Rating
** Analyst is no longer atDeutsche Bank
Date
Secu
rity
pric
e
1
23
4 5
6
7
Jan '16 May '16 Sep '16 Jan '17 May '17 Sep '170.00
2.50
5.00
7.50
10.00
12.50
1. 03/23/2016 Buy, Target Price Change HKD 6,40 Johnson Wan 5. 04/02/2017 Hold, Target Price Change HKD 6,25 Johnson Wan2. 08/02/2016 Downgraded to Hold, Target Price Change HKD 5,65
Johnson Wan6. 07/11/2017 Hold, Target Price Change HKD 8,06 Johnson Wan
3. 10/10/2016 Downgraded to Sell, Target Price Change HKD 5,65Johnson Wan
7. 11/16/2017 Hold, Target Price Change HKD 8,30 Johnson Wan
4. 11/10/2016 Upgraded to Hold, Target Price Change HKD 5,56Johnson Wan
§§§§$$$$$§§§§§
Historical recommendations and target price. Nine Dragons Paper (2689.HK)
(as of 11/17/2017)
Current RecommendationsBuyHoldSellNot RatedSuspended Rating
** Analyst is no longer atDeutsche Bank
Date
Secu
rity
pric
e
12
34
56
7
8
Jan '16 May '16 Sep '16 Jan '17 May '17 Sep '170.00
5.00
10.00
15.00
20.00
1. 12/03/2015 Buy, Target Price Change HKD 6,69 Johnson Wan 5. 01/23/2017 Hold, Target Price Change HKD 8,24 Johnson Wan2. 03/23/2016 Buy, Target Price Change HKD 7,09 Johnson Wan 6. 04/02/2017 Downgraded to Sell, Target Price Change HKD 6,61
Johnson Wan3. 08/02/2016 Downgraded to Hold, Target Price Change HKD 6,80
Johnson Wan7. 07/11/2017 Sell, Target Price Change HKD 7,00 Johnson Wan
4. 10/10/2016 Hold, Target Price Change HKD 7,00 Johnson Wan 8. 11/16/2017 Sell, Target Price Change HKD 10,98 Johnson Wan§§§§$$$$$§§§§§
Page 10 Deutsche Bank AG/Hong Kong
20 November 2017
Manufacturing
China Containerboard
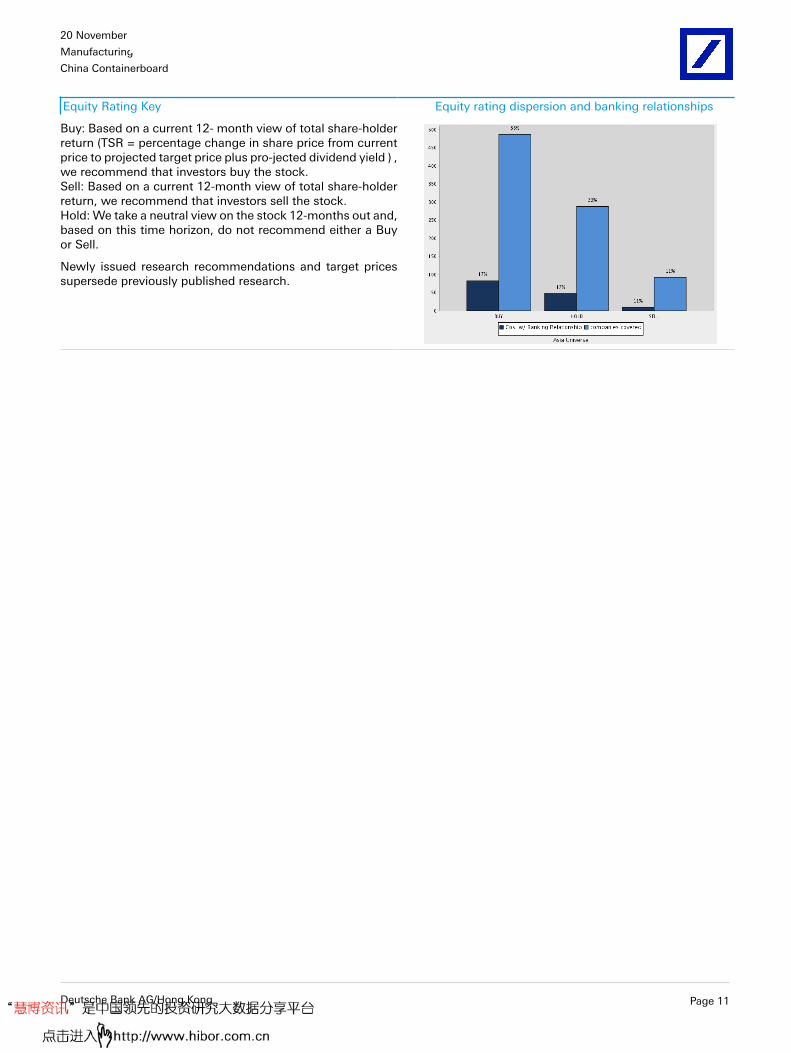
Equity Rating Key Equity rating dispersion and banking relationships
Buy: Based on a current 12- month view of total share-holderreturn (TSR = percentage change in share price from currentprice to projected target price plus pro-jected dividend yield ) ,we recommend that investors buy the stock.Sell: Based on a current 12-month view of total share-holderreturn, we recommend that investors sell the stock.Hold: We take a neutral view on the stock 12-months out and,based on this time horizon, do not recommend either a Buyor Sell.
Newly issued research recommendations and target pricessupersede previously published research.
Deutsche Bank AG/Hong Kong Page 11
20 November 2017
Manufacturing
China Containerboard
Additional Information
The information and opinions in this report were prepared by Deutsche Bank AG or one of its affiliates (collectively"Deutsche Bank"). Though the information herein is believed to be reliable and has been obtained from public sourcesbelieved to be reliable, Deutsche Bank makes no representation as to its accuracy or completeness. Hyperlinks to third-party websites in this report are provided for reader convenience only. Deutsche Bank neither endorses the content noris responsible for the accuracy or security controls of those websites.??If you use the services of Deutsche Bank in connection with a purchase or sale of a security that is discussed in this report,or is included or discussed in another communication (oral or written) from a Deutsche Bank analyst, Deutsche Bank mayact as principal for its own account or as agent for another person.??Deutsche Bank may consider this report in deciding to trade as principal. It may also engage in transactions, for itsown account or with customers, in a manner inconsistent with the views taken in this research report. Others withinDeutsche Bank, including strategists, sales staff and other analysts, may take views that are inconsistent with those takenin this research report. Deutsche Bank issues a variety of research products, including fundamental analysis, equity-linkedanalysis, quantitative analysis and trade ideas. Recommendations contained in one type of communication may differfrom recommendations contained in others, whether as a result of differing time horizons, methodologies, perspectivesor otherwise. Deutsche Bank and/or its affiliates may also be holding debt or equity securities of the issuers it writeson. Analysts are paid in part based on the profitability of Deutsche Bank AG and its affiliates, which includes investmentbanking, trading and principal trading revenues.??Opinions, estimates and projections constitute the current judgment of the author as of the date of this report. They donot necessarily reflect the opinions of Deutsche Bank and are subject to change without notice. Deutsche Bank providesliquidity for buyers and sellers of securities issued by the companies it covers. Deutsche Bank research analysts sometimeshave shorter-term trade ideas that may be inconsistent with Deutsche Bank's existing longer-term ratings. Trade ideasfor equities can be found at the SOLAR link at http://gm.db.com. A SOLAR idea represents a high-conviction belief by ananalyst that a stock will outperform or underperform the market and/or a specified sector over a time frame of no less thantwo weeks and no more than six months. In addition to SOLAR ideas, analysts may occasionally discuss with our clients,and with Deutsche Bank salespersons and traders, trading strategies or ideas that reference catalysts or events that mayhave a near-term or medium-term impact on the market price of the securities discussed in this report, which impactmay be directionally counter to the analysts' current 12-month view of total return or investment return as describedherein. Deutsche Bank has no obligation to update, modify or amend this report or to otherwise notify a recipient thereofif an opinion, forecast or estimate changes or becomes inaccurate. Coverage and the frequency of changes in marketconditions and in both general and company-specific economic prospects make it difficult to update research at definedintervals. Updates are at the sole discretion of the coverage analyst or of the Research Department Management, and themajority of reports are published at irregular intervals. This report is provided for informational purposes only and doesnot take into account the particular investment objectives, financial situations, or needs of individual clients. It is not anoffer or a solicitation of an offer to buy or sell any financial instruments or to participate in any particular trading strategy.Target prices are inherently imprecise and a product of the analyst ’ s judgment. The financial instruments discussedin this report may not be suitable for all investors, and investors must make their own informed investment decisions.Prices and availability of financial instruments are subject to change without notice, and investment transactions can leadto losses as a result of price fluctuations and other factors. If a financial instrument is denominated in a currency otherthan an investor's currency, a change in exchange rates may adversely affect the investment. Past performance is notnecessarily indicative of future results. Performance calculations exclude transaction costs, unless otherwise indicated.Unless otherwise indicated, prices are current as of the end of the previous trading session and are sourced from localexchanges via Reuters, Bloomberg and other vendors. Data is also sourced from Deutsche Bank, subject companies, andother parties.??The Deutsche Bank Research Department is independent of other business divisions of the Bank. Details regardingorganizational arrangements and information barriers we have established to prevent and avoid conflicts of interest withrespect to our research are available on our website under Disclaimer, found on the Legal tab.??
Page 12 Deutsche Bank AG/Hong Kong
20 November 2017
Manufacturing
China Containerboard
Macroeconomic fluctuations often account for most of the risks associated with exposures to instruments that promiseto pay fixed or variable interest rates. For an investor who is long fixed-rate instruments (thus receiving these cashflows), increases in interest rates naturally lift the discount factors applied to the expected cash flows and thuscause a loss. The longer the maturity of a certain cash flow and the higher the move in the discount factor, thehigher will be the loss. Upside surprises in inflation, fiscal funding needs, and FX depreciation rates are among themost common adverse macroeconomic shocks to receivers. But counterparty exposure, issuer creditworthiness, clientsegmentation, regulation (including changes in assets holding limits for different types of investors), changes in taxpolicies, currency convertibility (which may constrain currency conversion, repatriation of profits and/or liquidation ofpositions), and settlement issues related to local clearing houses are also important risk factors. The sensitivity of fixed-income instruments to macroeconomic shocks may be mitigated by indexing the contracted cash flows to inflation, toFX depreciation, or to specified interest rates – these are common in emerging markets. The index fixings may – byconstruction – lag or mis-measure the actual move in the underlying variables they are intended to track. The choice ofthe proper fixing (or metric) is particularly important in swaps markets, where floating coupon rates (i.e., coupons indexedto a typically short-dated interest rate reference index) are exchanged for fixed coupons. Funding in a currency that differsfrom the currency in which coupons are denominated carries FX risk. Options on swaps (swaptions) the risks typical tooptions in addition to the risks related to rates movements.??Derivative transactions involve numerous risks including market, counterparty default and illiquidity risk. Theappropriateness of these products for use by investors depends on the investors' own circumstances, including theirtax position, their regulatory environment and the nature of their other assets and liabilities; as such, investors shouldtake expert legal and financial advice before entering into any transaction similar to or inspired by the contents of thispublication. The risk of loss in futures trading and options, foreign or domestic, can be substantial. As a result of thehigh degree of leverage obtainable in futures and options trading, losses may be incurred that are greater than theamount of funds initially deposited – up to theoretically unlimited losses. Trading in options involves risk and is notsuitable for all investors. Prior to buying or selling an option, investors must review the "Characteristics and Risks ofStandardized Options”, at http://www.optionsclearing.com/about/publications/character-risks.jsp. If you are unable toaccess the website, please contact your Deutsche Bank representative for a copy of this important document.??Participants in foreign exchange transactions may incur risks arising from several factors, including: (i) exchange rates canbe volatile and are subject to large fluctuations; (ii) the value of currencies may be affected by numerous market factors,including world and national economic, political and regulatory events, events in equity and debt markets and changes ininterest rates; and (iii) currencies may be subject to devaluation or government-imposed exchange controls, which couldaffect the value of the currency. Investors in securities such as ADRs, whose values are affected by the currency of anunderlying security, effectively assume currency risk.??Deutsche Bank is not acting as a financial adviser, consultant or fiduciary to you or any of your agents with respect toany information provided in this report. Deutsche Bank does not provide investment, legal, tax or accounting advice, andis not acting as an impartial adviser. Information contained herein is being provided on the basis that the recipient willmake an independent assessment of the merits of any investment decision, and is not meant for retirement accounts orfor any specific person or account type. The information we provide is directed only to persons we believe to be financiallysophisticated, who are capable of evaluating investment risks independently, both in general and with regard to particulartransactions and investment strategies, and who understand that Deutsche Bank has financial interests in the offering ofits products and services. If this is not the case, or if you or your agent are an IRA or other retail investor receiving thisdirectly from us, we ask that you inform us immediately.
Unless governing law provides otherwise, all transactions should be executed through the Deutsche Bank entity in theinvestor's home jurisdiction. Aside from within this report, important risk and conflict disclosures can also be found athttps://gm.db.com on each company ’ s research page and under the "Disclosures Lookup" and "Legal" tabs. Investorsare strongly encouraged to review this information before investing.
United States: Approved and/or distributed by Deutsche Bank Securities Incorporated, a member of FINRA, NFA and SIPC.Analysts located outside of the United States are employed by non-US affiliates that are not subject to FINRA regulations,including those regarding contacts with issuer companies.??
Deutsche Bank AG/Hong Kong Page 13
20 November 2017
Manufacturing
China Containerboard
Germany: Approved and/or distributed by Deutsche Bank AG, a joint stock corporation with limited liability incorporatedin the Federal Republic of Germany with its principal office in Frankfurt am Main. Deutsche Bank AG is authorized underGerman Banking Law and is subject to supervision by the European Central Bank and by BaFin, Germany ’ s FederalFinancial Supervisory Authority.??United Kingdom: Approved and/or distributed by Deutsche Bank AG acting through its London Branch at WinchesterHouse, 1 Great Winchester Street, London EC2N 2DB. Deutsche Bank AG in the United Kingdom is authorised by thePrudential Regulation Authority and is subject to limited regulation by the Prudential Regulation Authority and FinancialConduct Authority. Details about the extent of our authorisation and regulation are available on request.??Hong Kong: Distributed by Deutsche Bank AG, Hong Kong Branch or Deutsche Securities Asia Limited.??India: Prepared by Deutsche Equities India Private Limited (DEIPL) having CIN: U65990MH2002PTC137431 and registeredoffice at 14th Floor, The Capital, C-70, G Block, Bandra Kurla Complex Mumbai (India) 400051. Tel: + 91 22 71804444. It is registered by the Securities and Exchange Board of India (SEBI) as a Stock broker bearing registrationnos.: NSE (Capital Market Segment) - INB231196834, NSE (F&O Segment) INF231196834, NSE (Currency DerivativesSegment) INE231196834, BSE (Capital Market Segment) INB011196830; Merchant Banker bearing SEBI Registrationno.: INM000010833 and Research Analyst bearing SEBI Registration no.: INH000001741. DEIPL may have receivedadministrative warnings from the SEBI for breaches of Indian regulations. Deutsche Bank and/or its affiliate(s) mayhave debt holdings or positions in the subject company. With regard to information on associates, please refer to the“Shareholdings” section in the Annual Report at: https://www.db.com/ir/en/annual-reports.htm.??Japan: Approved and/or distributed by Deutsche Securities Inc.(DSI). Registration number - Registered as a financialinstruments dealer by the Head of the Kanto Local Finance Bureau (Kinsho) No. 117. Member of associations: JSDA, TypeII Financial Instruments Firms Association and The Financial Futures Association of Japan. Commissions and risks involvedin stock transactions - for stock transactions, we charge stock commissions and consumption tax by multiplying thetransaction amount by the commission rate agreed with each customer. Stock transactions can lead to losses as a resultof share price fluctuations and other factors. Transactions in foreign stocks can lead to additional losses stemming fromforeign exchange fluctuations. We may also charge commissions and fees for certain categories of investment advice,products and services. Recommended investment strategies, products and services carry the risk of losses to principaland other losses as a result of changes in market and/or economic trends, and/or fluctuations in market value. Beforedeciding on the purchase of financial products and/or services, customers should carefully read the relevant disclosures,prospectuses and other documentation. "Moody's", "Standard & Poor's", and "Fitch" mentioned in this report are notregistered credit rating agencies in Japan unless Japan or "Nippon" is specifically designated in the name of the entity.Reports on Japanese listed companies not written by analysts of DSI are written by Deutsche Bank Group's analysts withthe coverage companies specified by DSI. Some of the foreign securities stated on this report are not disclosed accordingto the Financial Instruments and Exchange Law of Japan. Target prices set by Deutsche Bank's equity analysts are basedon a 12-month forecast period..??Korea: Distributed by Deutsche Securities Korea Co.??South Africa: Deutsche Bank AG Johannesburg is incorporated in the Federal Republic of Germany (Branch RegisterNumber in South Africa: 1998/003298/10).??Singapore: This report is issued by Deutsche Bank AG, Singapore Branch or Deutsche Securities Asia Limited, SingaporeBranch (One Raffles Quay #18-00 South Tower Singapore 048583, +65 6423 8001), which may be contacted in respectof any matters arising from, or in connection with, this report. Where this report is issued or promulgated by DeutscheBank in Singapore to a person who is not an accredited investor, expert investor or institutional investor (as defined in theapplicable Singapore laws and regulations), they accept legal responsibility to such person for its contents.??Taiwan: Information on securities/investments that trade in Taiwan is for your reference only. Readers shouldindependently evaluate investment risks and are solely responsible for their investment decisions. Deutsche Bank researchmay not be distributed to the Taiwan public media or quoted or used by the Taiwan public media without written consent.Information on securities/instruments that do not trade in Taiwan is for informational purposes only and is not to be
Page 14 Deutsche Bank AG/Hong Kong
20 November 2017
Manufacturing
China Containerboard
construed as a recommendation to trade in such securities/instruments. Deutsche Securities Asia Limited, Taipei Branchmay not execute transactions for clients in these securities/instruments.??Qatar: Deutsche Bank AG in the Qatar Financial Centre (registered no. 00032) is regulated by the Qatar Financial CentreRegulatory Authority. Deutsche Bank AG - QFC Branch may undertake only the financial services activities that fall withinthe scope of its existing QFCRA license. Its principal place of business in the QFC: Qatar Financial Centre, Tower, WestBay, Level 5, PO Box 14928, Doha, Qatar. This information has been distributed by Deutsche Bank AG. Related financialproducts or services are only available only to Business Customers, as defined by the Qatar Financial Centre RegulatoryAuthority.??Russia: The information, interpretation and opinions submitted herein are not in the context of, and do not constitute, anyappraisal or evaluation activity requiring a license in the Russian Federation.
Kingdom of Saudi Arabia: Deutsche Securities Saudi Arabia LLC Company (registered no. 07073-37) is regulated by theCapital Market Authority. Deutsche Securities Saudi Arabia may undertake only the financial services activities that fallwithin the scope of its existing CMA license. Its principal place of business in Saudi Arabia: King Fahad Road, Al OlayaDistrict, P.O. Box 301809, Faisaliah Tower - 17th Floor, 11372 Riyadh, Saudi Arabia.??United Arab Emirates: Deutsche Bank AG in the Dubai International Financial Centre (registered no. 00045) is regulatedby the Dubai Financial Services Authority. Deutsche Bank AG - DIFC Branch may undertake only the financial servicesactivities that fall within the scope of its existing DFSA license. Its principal place of business in the DIFC: DubaiInternational Financial Centre, The Gate Village, Building 5, PO Box 504902, Dubai, U.A.E. This information has beendistributed by Deutsche Bank AG. Related financial products or services are available only to Professional Clients, asdefined by the Dubai Financial Services Authority.??Australia: Retail clients should obtain a copy of a Product Disclosure Statement (PDS) relating to any financial productreferred to in this report and consider the PDS before making any decision about whether to acquire the product.Please refer to Australia-specific research disclosures and related information at https://australia.db.com/australia/content/research-information.html??Australia and New Zealand: This research is intended only for "wholesale clients" within the meaning of the AustralianCorporations Act and New Zealand Financial Advisors Act, respectively.??Additional information relative to securities, other financial products or issuers discussed in this report is available uponrequest. This report may not be reproduced, distributed or published without Deutsche Bank's prior written consent.Copyright © 2017 Deutsche Bank AG
Deutsche Bank AG/Hong Kong Page 15
David Folkerts-LandauGroup Chief Economist and Global Head of Research
Raj HindochaGlobal Chief Operating Officer
Research
Michael SpencerHead of APAC Research
Global Head of Economics
Steve PollardHead of Americas Research
Global Head of Equity Research
Anthony KlarmanGlobal Head ofDebt Research
Paul ReynoldsHead of EMEA
Equity Research
Dave ClarkHead of APAC
Equity Research
Pam FinelliGlobal Head of
Equity Derivatives Research
Andreas NeubauerHead of Research - Germany
Spyros MesomerisGlobal Head of Quantitative
and QIS Research
International locations
Deutsche Bank AGDeutsche Bank PlaceLevel 16Corner of Hunter & Phillip StreetsSydney, NSW 2000AustraliaTel: (61) 2 8258 1234
Deutsche Bank AGMainzer Landstrasse 11-1760329 Frankfurt am MainGermanyTel: (49) 69 910 00
Deutsche Bank AGFiliale HongkongInternational Commerce Centre,1 Austin Road West,Kowloon,Hong KongTel: (852) 2203 8888
Deutsche Securities Inc.2-11-1 NagatachoSanno Park TowerChiyoda-ku, Tokyo 100-6171JapanTel: (81) 3 5156 6770
Deutsche Bank AG London1 Great Winchester StreetLondon EC2N 2EQUnited KingdomTel: (44) 20 7545 8000
Deutsche Bank Securities Inc.60 Wall StreetNew York, NY 10005United States of AmericaTel: (1) 212 250 2500