Telecoms, Media & Technology abc -...
36
abc Global Research LED adoption in headlights to take off, doubling global auto LED sales by 2015 Korean, Taiwanese LED makers to gain; auto OP could surpass LCD BLU by 2015 Raise TPs of Epistar, Everlight and Seoul Semi; 2014 a good year for LED pricing The LED auto lighting market is set to grow 25-35% in 2014-15 as LED adoption in headlights rises to 12-15% of units (from less than 2% now). As LED headlight requires a substantial amount of LED, global auto LED revenue is likely to roughly double by 2015. Auto lighting is by far the most profitable of all applications for LED players, given the high entry barrier and long product life cycle. Industry structure favours LED adoption. Although the auto lighting market is only 25-30% the size of the global general lighting industry, market share is concentrated among a few top players (whereas general lighting is much more fragmented); this implies that adoption rates could surge rapidly, as relatively few decision makers are involved. Even entry-level vehicles, such as Toyota Corolla, are starting to adopt LED headlights, and we expect many to follow. Korean and Taiwanese LED makers stand to benefit from outsourcing by top LED makers and direct cooperation with global auto lighting suppliers. Although auto LED accounts for only 4% of sales in 2013e, we believe it could surpass LCD BLU in terms of operating profit contribution by 2015 and be on a par with general lighting by 2018, as margins are 20ppt+ higher than for general lighting. We raise our TP for Epistar to TWD76, for Everlight to TWD63, and for Seoul Semi to KRW39,000 (from TWD74, TWD56, KRW32,000) but keep it at KRW113,000 for LG Innotek. We reiterate our OW rating on Epistar, Everlight and LGI, but keep Seoul Semi at UW as we think positives are already priced in. Rising lighting and auto lighting demand should lead to a favourable pricing environment in 2014 while capacity additions should remain disciplined. Telecoms, Media & Technology Electronic Equipment Asia LED Auto lighting the next big driver 3 October 2013 Jerry Tsai* Analyst HSBC Securities (Taiwan) Corporation Limited +8862 6631 2863 [email protected] Brian Sohn* Analyst The Hongkong and Shanghai Banking Corporation Limited, Seoul Securities Branch +822 3706 8765 [email protected] Louis Cheng* Associate HSBC Securities (Taiwan) Corporation Limited +8862 6631 2865 [email protected] View HSBC Global Research at: http://www.research.hsbc.com *Employed by a non-US affiliate of HSBC Securities (USA) Inc, and is not registered/qualified pursuant to FINRA regulations Issuer of report: HSBC Securities (Taiwan) Corporation Limited Disclaimer & Disclosures This report must be read with the disclosures and the analyst certifications in the Disclosure appendix, and with the Disclaimer, which forms part of i t Financial and valuation summary Local TP HSBC ‘‘13e EPS _ ‘‘14e EPS _ ‘‘14e BVPS _ Target PB __ Company curr new/old rating New Old New Old New Old New Old Epistar TWD 76 / 74 OW 1.36 1.76 3.37 3.13 54.0 53.9 1.4x 2014e 1.4x 2H13e/ 1H14e Everlight TWD 63 / 56 OW 3.63 3.17 4.12 3.63 39.6 39.0 1.6x 2014e 1.4x 2H13e/ 1H14e LG Innotek KRW 113,000 OW 2,526 2,526 6,058 6,058 71,477 71,477 1.6x 2014e 1.6x 2014e Seoul Semi KRW 39,000 / 32,000 UW 1,083 1,079 1,619 1,291 12,806 11,332 3.0x 2014e 2.6x 2014e Aixtron † EUR 12.7 N(V) -0.94 -0.94 0.09 0.09 3.81 3.81 3.25x 2014e 3.25x 2014e † Covered by Christian Rath Key: OW = Overweight; UW = Underweight; N(V) = Neutral (Volatile) Source: HSBC estimates Financial and valuation summary Company Bloomberg ___ PE (x) ____ ___ PB (x) ____ __ ROE (%)___ ticker 2013e 2014e 2013e 2014e 2013e 2014e Epistar 2448 TT 41.2 16.7 1.1 1.0 2.7 6.4 Everlight 2393 TT 14.9 13.2 1.4 1.4 9.9 10.6 LG Innotek 011070 KS 35.0 14.6 1.4 1.2 3.9 8.9 Seoul Semi 046890 KS 38.4 25.7 3.7 3.2 10.0 13.4 Source: HSBC estimates
Transcript of Telecoms, Media & Technology abc -...
abcGlobal Research
LED adoption in headlights to take off,
doubling global auto LED sales by 2015
Korean, Taiwanese LED makers to gain; auto OP could surpass LCD BLU by 2015
Raise TPs of Epistar, Everlight and Seoul Semi; 2014 a good year for LED pricing
The LED auto lighting market is set to grow 25-35% in
2014-15 as LED adoption in headlights rises to 12-15% of
units (from less than 2% now). As LED headlight requires a
substantial amount of LED, global auto LED revenue is
likely to roughly double by 2015. Auto lighting is by far the
most profitable of all applications for LED players, given the
high entry barrier and long product life cycle.
Industry structure favours LED adoption. Although the
auto lighting market is only 25-30% the size of the global
general lighting industry, market share is concentrated
among a few top players (whereas general lighting is much
more fragmented); this implies that adoption rates could
surge rapidly, as relatively few decision makers are involved.
Even entry-level vehicles, such as Toyota Corolla, are starting
to adopt LED headlights, and we expect many to follow.
Korean and Taiwanese LED makers stand to benefit from
outsourcing by top LED makers and direct cooperation with
global auto lighting suppliers. Although auto LED accounts
for only 4% of sales in 2013e, we believe it could surpass
LCD BLU in terms of operating profit contribution by
2015 and be on a par with general lighting by 2018, as
margins are 20ppt+ higher than for general lighting.
We raise our TP for Epistar to TWD76, for Everlight to
TWD63, and for Seoul Semi to KRW39,000 (from TWD74,
TWD56, KRW32,000) but keep it at KRW113,000 for LG
Innotek. We reiterate our OW rating on Epistar, Everlight
and LGI, but keep Seoul Semi at UW as we think positives
are already priced in. Rising lighting and auto lighting demand
should lead to a favourable pricing environment in 2014
while capacity additions should remain disciplined.
Telecoms, Media & Technology Electronic Equipment
Asia LED
Auto lighting the next big driver
3 October 2013 Jerry Tsai* Analyst HSBC Securities (Taiwan) Corporation Limited +8862 6631 2863 [email protected]
Brian Sohn* Analyst The Hongkong and Shanghai Banking Corporation Limited, Seoul Securities Branch +822 3706 8765 [email protected]
Louis Cheng* Associate HSBC Securities (Taiwan) Corporation Limited +8862 6631 2865 [email protected]
View HSBC Global Research at: http://www.research.hsbc.com
*Employed by a non-US affiliate of HSBC Securities (USA) Inc, and is not registered/qualified pursuant to FINRA regulations
Issuer of report: HSBC Securities (Taiwan) Corporation Limited
Disclaimer & Disclosures This report must be read with the disclosures and the analyst certifications in the Disclosure appendix, and with the Disclaimer, which forms part of it
Financial and valuation summary
Local TP HSBC ‘‘13e EPS _ ‘‘14e EPS _ ‘‘14e BVPS _ Target PB __ Company curr new/old rating New Old New Old New Old New Old
Epistar TWD 76 / 74 OW 1.36 1.76 3.37 3.13 54.0 53.9 1.4x 2014e
1.4x 2H13e/1H14e
Everlight TWD 63 / 56 OW 3.63 3.17 4.12 3.63 39.6 39.0 1.6x 2014e
1.4x 2H13e/1H14e
LG Innotek
KRW 113,000 OW 2,526 2,526 6,058 6,058 71,477 71,477 1.6x 2014e
1.6x 2014e
Seoul Semi
KRW 39,000 / 32,000
UW 1,083 1,079 1,619 1,291 12,806 11,332 3.0x 2014e
2.6x 2014e
Aixtron† EUR 12.7 N(V) -0.94 -0.94 0.09 0.09 3.81 3.81 3.25x 2014e
3.25x 2014e
†Covered by Christian Rath Key: OW = Overweight; UW = Underweight; N(V) = Neutral (Volatile) Source: HSBC estimates
Financial and valuation summary
Company Bloomberg ___ PE (x) ____ ___ PB (x) ____ __ ROE (%)___ ticker 2013e 2014e 2013e 2014e 2013e 2014e
Epistar 2448 TT 41.2 16.7 1.1 1.0 2.7 6.4Everlight 2393 TT 14.9 13.2 1.4 1.4 9.9 10.6LG Innotek 011070 KS 35.0 14.6 1.4 1.2 3.9 8.9Seoul Semi 046890 KS 38.4 25.7 3.7 3.2 10.0 13.4
Source: HSBC estimates

2
Telecoms, Media & Technology Electronic Equipment 3 October 2013
abc
Global LCD TV panel, general lighting and auto lighting market sizes and top 8 player market shares
Global auto lighting revenue – LED versus non-LED
*LCD TV revenue refers only to panel portion; however, the top-8 rev refers to TV brands, which were the key decision makers driving the migration to LED
Source: HSBC estimates
Source: HSBC estimates
Gross margin comparison: auto LED the highest by far LED chip utilisation rate outlook positive
Source: HSBC Source: HSBC estimates
Asia LED operating profit breakdown by segment –-Auto could overtake BLU in 2015
Source: HSBC estimates
0
22
44
66
88
LCD TV PNL Lighting Auto lighting
Top 8 rev Outside top 8
(USDbn)
0
9
18
27
36
2001 2003 2005 2007 2009 2011 2013e 2015e
Non-LED auto-lighting revenue (USDbn) LED auto-lighting revenue(USDbn)
(USDbn)
0% 14% 28% 42% 56%
BLU
Lighting
Automotive 40-50%
20-30%
15-25%
GM (%)
Avg. opex of sales14.5%
0%
25%
50%
75%
100%
1Q09 4Q09 3Q10 2Q11 1Q12 4Q12 3Q13 2Q14
(%)
80%
0%
25%
50%
75%
100%
2013 2014 2015 2016 2017 2018
Auto lighting BLU Lighting Mobile Others
(%)

3
Telecoms, Media & Technology Electronic Equipment 3 October 2013
abc
LED auto lighting is set to grow 25-35% in 2014-15 30% the size of general lighting, but a much more addressable opportunity
We believe the next major catalyst for global LED
demand is automotive lighting, which has been
met by LCD backlight and general lighting in
recent years. We expect this to drive sales growth
and, even more, to boost operating profit for the
leading Taiwanese and Korean LED makers
beginning in 2014.
While the USD26bn market is around 25-30% the
size of general lighting business, its concentrated
industry structure means adoption could be much
faster once the critical point is reached.
Global automotive lighting is controlled by a
handful of players: the top eight makers have a
combined global share of their segment more than
80% versus just 40% for the top 8 players in the
global lighting market.
We believe this high concentration is the reason
why LED penetration in TV jumped from
low-single-digit levels in 2009 to 80%-plus
(in 2012) in three years. The top eight TV brands
account for 65% of global shares (the concentration
is even higher if we consider panel makers) and the
decision on migration to new technology is
controlled by a few players.
Next major wave of LED adoption imminent
LED auto headlight adoption has been low (less than 2%), but
should take off soon thanks to an aggressive push by auto lighting
and automobile makers
LED dollar content in auto lighting is high and offers the best
margin due to high barriers to entry and long product life
We expect LED auto lighting to grow 25-35% in 2014-15; industry
concentration means adoption levels could surge
Global LCD TV panel, lighting and auto lighting market size and top 8 player market shares
*LCD TV revenue refers only to panel portion; however, the top-8 rev refers to TV brands, which were the key decision makers driving the migration to LED Source: HSBC estimates
0
22
44
66
88
LCD TV PNL Lighting Auto lighting
Top 8 rev Outside top 8
(USDbn)

4
Telecoms, Media & Technology Electronic Equipment 3 October 2013
abc
The global lighting market is massive, but the tail
is very long, as lighting is a highly localised
business. We therefore believe automobile mobile
lighting could offer much more addressable
opportunities for LED makers, as each customer
and order win could have a much greater impact.
LED penetration within LED TV
Source: DisplaySearch, HSBC
Dollar content is high; ASP erosion likely the least among all applications
The price of LED is on a consistent downward
trend. Nevertheless, ASP erosion is less marked
for automotive lighting than for the other major
applications, owing to more favourable pricing
factors. While LED prices are typically declining
at rates of 13-20% per year for backlight and
lighting (assuming healthy supply and demand;
the level is much more if not), we expect an ASP
decline for auto lighting LED (especially those
used in headlights) of just 5% per annum.
To ensure consistency of colour and brightness,
clients tend to retain the LED supplier they
originally select for an auto lighting modules
throughout the product’s life. If we combine that
with the 5% ASP pressure and the annual cost
down of LED chip makers (at a rate much higher
than 5% a year), we believe the auto lighting
business is highly lucrative for LED makers.
Meanwhile the LED dollar content of automotive
lighting is high in terms of chip area, as headlight
consumes at least 10x more LED chips than a
typical LED bulb (60w replacement). Moreover,
given the harsh operating environment and
demanding durability standard, the chip is also
more expensive on a like-for-like basis (20-50%
we believe).
0%
22%
44%
66%
88%
1Q09 4Q09 3Q10 2Q11 1Q12 4Q12
(%)
Automotive lighting breakdown
Source: HSBC
LED segment comparison: factor of pricing pressure
Auto lighting Lighting Backlight Implications on pricing pressure/margin
Customization Very high Mid-high Low High customization means lower pricing pressure Product life cycle 2.5-3 yrs 1-1.5 yrs 1 yr Long product life cycle means better marginLED as % of BOM 14-18% 25-35% 10% Lower % suggests lower pricing pressureOperating requirement Very high High limited High requirement means lower pricing pressure
Source: HSBC

5
Telecoms, Media & Technology Electronic Equipment 3 October 2013
abc
Owing to the higher entry barrier we believe
Chinese LED makers have little chance to share
this opportunity. So far, all the LED chips found
on Chinese automobiles have come from
international LED makers. This makes irrational
behaviour in the segment less likely.
Adoption kicking into high gear LED: the next-generation light source for auto headlights
LED is the ideal light source for auto lighting, owing
to its low power consumption, fast switch-on/-off
and durability. However, blended adoption is still
low at around 7%. While the cost premium over
current technologies, such as HID (high intensity
discharge) and halogen plays a part in this, we
believe the conservative nature of the auto
component industry and the stringent certification
process are actually the greatest challenges to LED
adoption. Nevertheless auto lighting suppliers
becoming aggressive, so we expect the migration
will start to accelerate.
LED adoption of automotive lighting*
*Blended is based on lumens; the rest are in units
Source: HSBC estimates
The adoption of LED in rear exterior lighting
(brake, signal, tail light) is already as high as
25% already, but the amount of light needed in
these fixtures is only modest. In our view,
headlight are the truly untapped opportunity for
LED (only 1.5% adoption in 2013), and the
amount of light output required (corresponding
directly to LED usage) is 4-5x the level needed
for exterior lights found on the rear of vehicle.
The current mainstream light source for
headlights on regular vehicles is halogen, while
HID, which is twice as expensive as halogen, now
accounts for 20% of the market (mostly premium
vehicle). We believe LED, which is still more
than twice as expensive as HID, will reach a 12-
15% unit share in auto headlights in the next
three years.
LED to be adopted in headlights
Until very recently, LED headlights were found
only in high-end cars such as Lexus, Mercedes
and Audi. However, we are starting to see them
appearing on regular vehicles. Toyota’s new
Corolla, the best-selling vehicle in the world, will
adopt LED for its low-beam headlight. Meanwhile
Peugeot (308), Ford (Mondeo) and Spain’s SEAT
(Leon) are all making full LED headlights
available – the last two as a standard option.
While the target of a 12-15% share by 2015 may
look aggressive given the current low adoption
rate, we believe it is an achievable goal, as a
tipping point is approaching for new auto
headlight technology and LED cost reduction.
0%
8%
16%
24%
32%
Break light Tail light Parking light Head light Blended
(%)
Global auto lighting revenue – LED versus non-LED
Source: HSBC estimates
0
9
18
27
36
2001 2003 2005 2007 2009 2011 2013e 2015e
Non-LED auto-lighting revenue (USDbn) LED auto-lighting revenue(USDbn)
(USDbn)

6
Telecoms, Media & Technology Electronic Equipment 3 October 2013
abc
LED auto-lighting revenue breakdown
Source: HSBC estimates
Headlights undergoing a “smart” revolution –
and LED is the best light source
The value-added aspect is boosted by the fact that
major auto lighting makers are aggressively
promoting AFS (advanced front-lighting system),
which allows drivers to leave the high beam on
when driving (thereby extending visibility), but
can make an instantaneous adjustment when
oncoming traffic appears to avoid blinding the
oncoming driver. This plays to one of LED’s
strengths: fast switch-on/-off.
Vast improvement in cost, weight and heat
management
The first LED headlight to be commercially
produced was for the Lexus LS600h in 2007.
However, the cost was extremely high – reportedly
well over USD1,000. This is not attributable so
much to the LED itself – although high, its cost still
dwarfed by the total bill of materials (BOM) – as to
the heat emission from the LED. Lack of scale is
also a factor.
As the LED chips used to be much less efficient,
they previously generated considerable heat
(twice the level they emit today). The current
LED headlight module now uses a less complex
heat management system, which is a key reason
for the weight reduction of more than 60% for the
entire module in the past three to four years. As a
result, the price has come down significantly.
LED lumen per watt rising, reducing heat generation
Source: HSBC
The BOM for LED headlights is now 2-3 times that
of HID/halogen headlights, or less than USD100.
We believe that by 2015 the gap between LED
and HID – the current mainstream for high-end
vehicles – will be around 50%. In absolute terms
it will be less than USD20 on our estimates.
0
4
8
12
16
2001 2003 2005 2007 2009 2011 2013e 2015e
Back lights Daytime running lights Front lights
(USDbn)
0
50
100
150
200
2002 2004 2006 2008 2010 2012 2014 2016 2018 2020
(lm/w)
Lighting sources comparison
LED HID Halogen
Introduced 2007 1991 1961 Average life (hrs) 20,000 2,500 1,000
Cost Highest (4-5x) Medium to high (2x)
Lowest (1x)
Ignition time Instant <5 sec reaching
full intensity 15 sec reaching
full intensity Luminous efficacy 80-90 lm/W 60 lm/W 20-25 lm/W Power consumption
Lowest (35%) Medium (55%) High (100%)
Illumination colours Varying whites White-blue Slightly yellow
Source: HSBC
Headlight BOM cost comparison
HID-2013 LED-2013 LED-2015
Whole sale OEM ASP 56.8 120.0 83.0 BOM 41.5 80.0 54.0 Overhead 7.5 14.5 11.5 Labour 7.0 11.5 10.0 Main mechanical 7.0 12.0 8.0 Other mechanical/electrical 4.0 10.0 6.0 Optical/refractor 6.0 8.0 6.0 Heat management 8.0 4.0 light source 10.0 16.0 8.5
Source: HSBC estimates

7
Telecoms, Media & Technology Electronic Equipment 3 October 2013
abc
LED adoption driven by aggressive push from entire supply chain
We believe players in all segments have strong
incentives for migrating to LED headlight:
Automotive lighting makers
In addition to the higher ASP (2-5x) and margin
(potentially 10-15ppt above regular headlights on
our estimates), LED offers auto lighting suppliers
an opportunity to penetrate new customer bases.
The relationship between automobile makers and
automotive lighting makers is typically stable.
However LED auto lighting, which requires
completely new expertise in the optical design to
maximize the benefit from LED, could alter the
landscape as automobile makers will be keen to
work with new suppliers that have these strengths.
The transition from halogen to HID was less
revolutionary, since HID is still a bulb-based light
source, whereas LED packages will be arranged
as an array in the auto lighting module, giving
more room for design flexibility.
We believe this is why LED headlights are
showcased on the corporate webpages of all major
Japanese and European automotive lighting makers
despite the very small adoption rate to date.
Automakers
LED headlights distinguish the vehicle after dark,
since the LED array can be arranged to show a
unique pattern. The lights on Audi and Mercedes
vehicles have a distinctive look. According to the
JD Power survey in April, LED headlights are the
most desirable new car technology for consumers,
ahead of voice activation and wireless connectivity.
We believe there is also another added benefit: the
light source (HID/halogen bulb) of current
headlights can easily be replaced at local shops
when it fails. Since LED lighting consists of an
array, any repairs are more complex and will
probably have to be conducted at the dealership.
This represents incremental service revenue.
Daytime running light also a key driver
Daytime running light (DRL) was introduced more
than decade ago and we are now seeing a surge in
demand since the EU made this a mandatory feature
on all vehicles sold (February 2011 for passenger;
August 2012 for commercial vehicles). Outside
Europe, more and more auto makers are making
DRL, which has been proven to reduce accidents
by around 20%, a standard feature.
DRL has been a key catalyst for LED demand in
the automobile segment. Although some DRL
uses HID/halogen as a light source, we believe
LED currently accounts for most DRL installed in
new cars, owing to its strengths in the areas of
energy conservation and longevity. Meanwhile
the ASP is among the highest for any lamp type.
DRL shipments
Source: HSBC estimates
Current ASP comparison (blended average)
Source: HSBC estimates
0
23
46
69
92
2001 2003 2005 2007 2009 2011 2013e 2015e
(mn units)
0
8
16
24
32
HeadLight
DRL TailLight
FogLight
ParkingLight
Directionindicator
Brakelight
(USD)

8
Telecoms, Media & Technology Electronic Equipment 3 October 2013
abc
Global automotive lighting model
2008 2009 2010 2011 2012 2013e 2014e 2015e
Global auto-lighting market value (USDm) – Total 23,807 21,954 23,660 24,897 26,047 27,185 29,260 31,809 Head light 8,448 7,740 8,241 8,567 8,892 9,222 10,103 11,635 Tail light 6,193 5,776 6,256 6,610 6,902 7,111 7,363 7,548 Parking light 1,488 1,367 1,459 1,521 1,569 1,612 1,675 1,725 Direction indicator 3,596 3,292 3,502 3,640 3,744 3,905 4,116 4,287 Fog light 1,736 1,594 1,702 1,775 1,830 1,880 1,954 2,012 Brake light 1,770 1,650 1,787 1,888 1,972 2,045 2,132 2,195 Daytime running light 576 535 713 896 1,139 1,410 1,918 2,406 Global auto-lighting market value (USDm) – LED only 3,806 3,849 4,562 5,221 5,994 6,871 8,784 11,832 Head light 347 355 413 462 604 693 1,602 3,710 Tail light 2,037 2,067 2,409 2,714 3,001 3,244 3,496 3,705 Parking light 142 144 168 190 210 234 260 282 Direction indicator 162 164 191 215 238 385 530 661 Fog light 166 168 196 221 245 273 304 329 Brake light 582 591 688 776 857 951 1,047 1,129 Daytime running light 370 359 496 643 839 1,090 1,545 2,014 LED penetration rate by products (%) Head light 0.6% 0.7% 0.8% 0.9% 1.2% 1.6% 4.5% 13.5% Tail light 15.0% 16.9% 18.8% 20.6% 22.5% 25.0% 27.5% 30.0% Parking light 3.7% 4.1% 4.6% 5.0% 5.5% 6.3% 7.2% 8.0% Direction indicator 1.7% 1.9% 2.1% 2.3% 2.5% 4.2% 5.8% 7.5% Fog light 3.7% 4.1% 4.6% 5.0% 5.5% 6.3% 7.2% 8.0% Brake light 15.0% 16.9% 18.8% 20.6% 22.5% 25.7% 28.8% 32.0% Daytime running light 33.3% 37.5% 41.7% 45.8% 50.0% 56.7% 63.3% 70.0% Blended 6.5% 7.4% 8.2% 9.0% 9.9% 11.5% 14.3% 20.4% Global automotive lighting shipments breakdown by products (m units) Head light 334 300 312 318 321 326 329 333 Tail light 483 438 461 474 483 491 504 515 Parking light 238 215 227 233 237 241 248 253 Direction indicator 594 539 569 587 598 608 626 641 Fog light 196 178 188 194 198 202 208 213 Brake light 255 232 245 252 257 262 270 276 Daytime running light 22 20 26 32 40 49 66 83 Total 2,905 2,623 2,736 2,783 2,791 2,797 2,880 2,952
Source: HSBC estimates

9
Telecoms, Media & Technology Electronic Equipment 3 October 2013
abc
Asia LED makers positioned for outsourcing trend Automotive lighting accounts for about 6-7% of
global LED revenue (at the LED package level),
or USD800-850m. We expect the global auto
LED package revenue to almost double (+85%) in
the next two years, driven by adoption of LED
headlights and DRL.
While the majority of auto lighting LED packages
are supplied by the globally leading Japanese and
European LED makers – notably Nichia, Philips and
Osram (Three of the “Big Five” LED players
globally) – we see outsourcing manufacturing
opportunities for Asian names in the coming years.
The LED capex of most top-tiered LED makers
has been very modest, as many are adopting the
outsourcing model. As global LED chip shipment
still growing at a rate of 20% a year (driven by
rising lighting, while size/pixel migration is
underpinning BLU demand), new incremental
demand from auto segment should create further
supply tightness. We therefore expect outsourcing
orders to benefit Asian LED players.
Small revenue, big profit
The auto LED package market is worth just under USD1bn, but is
set to double by 2015; migration to LED should open doors to new
entrants
Global leaders to increase outsourcing to Asian makers; revenue
contribution is just 4% now, but OP to surpass BLU by 2015, and …
… to be on a par with general lighting by 2017-18 due to 20ppt+
higher margins, high operating leverage, and long product life cycle
Global LED package market value
Source: HSBC estimates
Global LED chip demand for all segments (2010 = 100)
Source: HSBC estimates
0
4
8
12
16
2005 2006 2007 2008 2009 2010 2011 2012 2013 2014 2015
Others Sign Mobile BLU Lighting Auto
(USDbn)
0
120
240
360
480
2010 2011 2012 2013e 2014e
(index as of 2010)
10
Telecoms, Media & Technology Electronic Equipment 3 October 2013
abc
Korean and Taiwanese LED makers have been the
key suppliers of LED for interior and rear exterior
lights, and are benefiting from rising DRL
demand. We expect the headlight opportunity to
materialise in 2014 and accelerate thereafter.
Although auto lighting usually accounts for only a
low 4% of the sales mix, the impact on operating
profit is far greater because operating leverage is
high. We estimate auto lighting already
contributes 8% of GP and 14% of OP for Asia
LED makers, with significant upside potential.
Gross margin comparison: auto LED highest by far
Source: HSBC
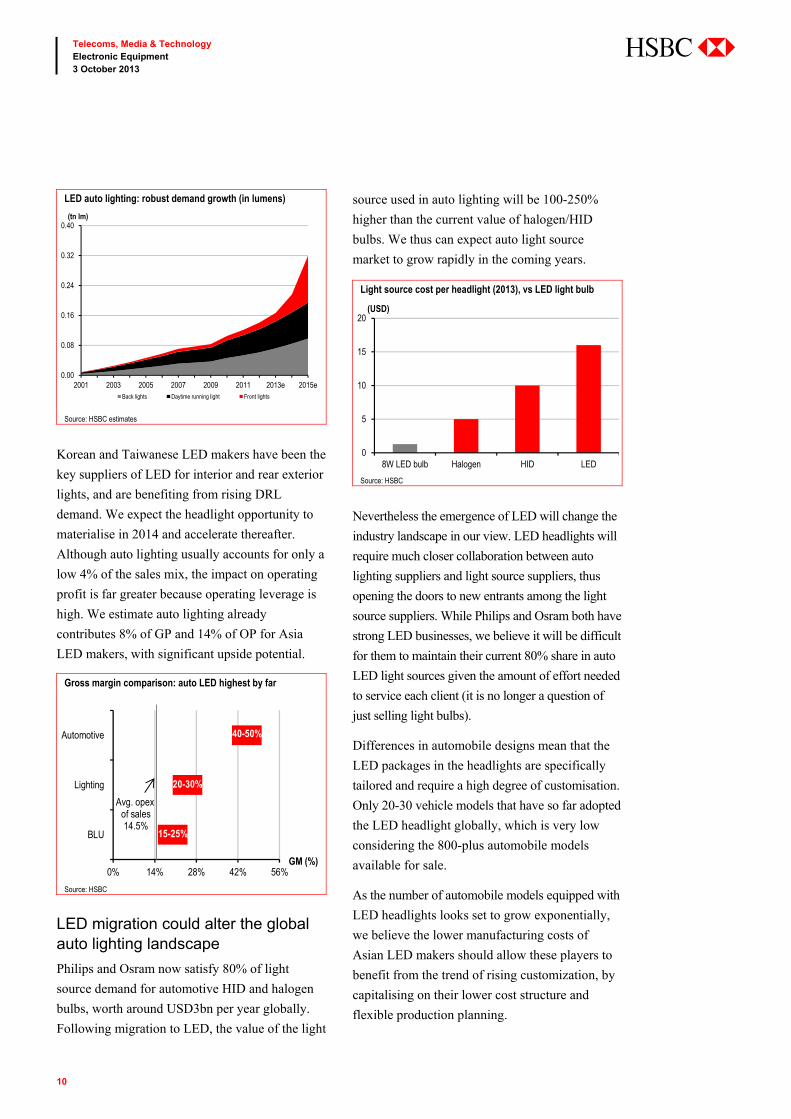
LED migration could alter the global auto lighting landscape
Philips and Osram now satisfy 80% of light
source demand for automotive HID and halogen
bulbs, worth around USD3bn per year globally.
Following migration to LED, the value of the light
source used in auto lighting will be 100-250%
higher than the current value of halogen/HID
bulbs. We thus can expect auto light source
market to grow rapidly in the coming years.
Nevertheless the emergence of LED will change the
industry landscape in our view. LED headlights will
require much closer collaboration between auto
lighting suppliers and light source suppliers, thus
opening the doors to new entrants among the light
source suppliers. While Philips and Osram both have
strong LED businesses, we believe it will be difficult
for them to maintain their current 80% share in auto
LED light sources given the amount of effort needed
to service each client (it is no longer a question of
just selling light bulbs).
Differences in automobile designs mean that the
LED packages in the headlights are specifically
tailored and require a high degree of customisation.
Only 20-30 vehicle models that have so far adopted
the LED headlight globally, which is very low
considering the 800-plus automobile models
available for sale.
As the number of automobile models equipped with
LED headlights looks set to grow exponentially,
we believe the lower manufacturing costs of
Asian LED makers should allow these players to
benefit from the trend of rising customization, by
capitalising on their lower cost structure and
flexible production planning.
0% 14% 28% 42% 56%
BLU
Lighting
Automotive 40-50%
20-30%
15-25%
GM (%)
Avg. opex of sales14.5%
LED auto lighting: robust demand growth (in lumens)
Source: HSBC estimates
Light source cost per headlight (2013), vs LED light bulb
Source: HSBC
0.00
0.08
0.16
0.24
0.32
0.40
2001 2003 2005 2007 2009 2011 2013e 2015eBack lights Daytime running light Front lights
(tn lm)
0
5
10
15
20
8W LED bulb Halogen HID LED
(USD)

11
Telecoms, Media & Technology Electronic Equipment 3 October 2013
abc
Auto lighting the long-term margin driver for Asia LED Auto could be a greater earnings driver than BLU by 2015
The revenue of Korean and Taiwanese LED
makers has a 4% exposure to the auto sector –a
step below the global average. This is
understandable, as Nichia, Philips and Osram
have high shares in this segment. Nevertheless we
expect a long-term growth rate of 30% for auto
LED in coming years, driven by increasing
outsourcing orders from the leaders.
Although we expect the contribution of auto LED
to the revenue mix of Korean and Taiwanese LED
makers to remain small – around 9% by 2016 and
15% by 2018 (practically the smallest of all
segments) – the contribution to profitability
should be far greater:
In terms of gross profit, the contribution of auto
LED for Korean/Taiwan LED makers should
be similar to that of backlights by 2016.
However, given the very high operating
leverage, auto LED could surpass BLU in terms
of its operating profit contribution by 2015.
By 2018, the operating profit contribution of
auto LED could be similar to that of general
lighting, if LED headlight adoption turns out
to be broader based (+40%).
As we mentioned earlier, LED chip demand
should still grow at a rate of more than 25% in the
coming years. However revenue growth has
always been much less impressive owing to ASP
erosion. As auto LED is likely the segment with
(1) by far the highest margin; and (2) by far the
least ASP erosion in the product life cycle, it is
one of the biggest drivers of incremental earnings
growth (along with LED lighting), despite the
small revenue base.
This is why we believe investors should focus less
on Asia’s LED revenue growth, which is
plateauing, and more on the margin expansion and
earnings growth story, as higher-margin segments
account for a larger share of the product mix.
Asia LED operating profit breakdown by segment – auto could overtake BLU in 2015
Source: HSBC estimates
Margin trend in Asia LED, assuming 30% growth for auto
Source: HSBC estimates
0%
25%
50%
75%
100%
2013 2014 2015 2016 2017 2018
Auto lighting BLU Lighting Mobile Others
(%)
0%
8%
16%
24%
32%
2013 2014 2015 2016 2017 2018
Gross margin (%) Operating margin (%)
(%)

12
Telecoms, Media & Technology Electronic Equipment 3 October 2013
abc
Our scenario analysis shows that, even if auto
lighting grows at a slower rate of 20%, there is
still a good chance that the auto segment will play
a more critical role than the BLU segment from
the profit perspective.
Opportunity in Korea The LED market in the auto lighting industry
is also an important opportunity for Korean
LED manufacturing companies, as (1) Korean
car companies are growing faster than other
auto makers, and (2) applications for LED
lights are expanding via premium strategies
and improvements in energy efficiency.
Only 1-2% of automobiles now have LED
headlights installed, but this market is
expected to grow as they begin to be installed
in small and medium-size vehicles, too.
For example, Hyundai Motors previously
installed LED headlamps only on luxury
models, but has now extended this option to
small and medium-size vehicles to promote
its differentiation strategy (eg it was first
installed in new models of Equus, Genesis,
and K9, and has now been extended into the
2014 Sonata and Avante models).
German and Japanese companies currently
dominate the LED headlight segment, while
Korean companies have solid positions in
back lights, fog lights, and indoor lights,
where safety issues are of lesser importance.
However, we forecast a gradual increase in
the Korean companies’ market shares as they
penetrate the LED headlamp segment.
Opportunity in Taiwan Taiwan has a very small domestic automobile
manufacturing base, with a global market
share of less than 1%. However, several
Taiwanese companies playing key roles in the
global auto lighting world in both the AM
(after-market) and OEM space.
Scenario analysis: gross profit contribution under different auto growth assumptions
Segment gross profit % of total gross profit _ 2013 2014 2015 2016 2017 2018
Base case Auto lighting 8% 10% 13% 16% 20% 23% BLU 25% 22% 19% 17% 14% 12% Lighting 26% 29% 31% 33% 34% 36% Mobile 15% 13% 11% 9% 7% 6% Others 26% 26% 26% 26% 25% 23% Bull case Auto lighting 8% 11% 14% 18% 22% 27% BLU 25% 22% 19% 16% 14% 11% Lighting 26% 28% 31% 32% 33% 34% Mobile 15% 13% 11% 9% 7% 6% Others 26% 26% 26% 25% 24% 22% Bear case Auto lighting 8% 10% 11% 13% 15% 17% BLU 25% 22% 20% 17% 15% 13% Lighting 26% 29% 31% 34% 36% 39% Mobile 15% 13% 11% 9% 8% 7% Others 26% 26% 27% 26% 26% 25%
Source: HSBC estimates
Scenario analysis assumptions summary
___ Revenue growth y-o-y _____ GM Opex/sales Base case Bull case Bear case
Auto lighting 45% 18% 30% 35% 20% BLU 20% 13% -10% -10% -10% Lighting 25% 15% 12% 12% 12% Mobile 18% 13% -12% -12% -12% Others 23% 17% 3% 3% 3%
Source: HSBC
Scenario analysis: operating profit contribution under different auto growth assumptions
___ Segment operating profit % of total OP ____ 2013 2014 2015 2016 2017 2018
Base case Auto lighting 14% 17% 21% 26% 30% 35% BLU 24% 21% 18% 15% 12% 10% Lighting 29% 31% 32% 33% 34% 34% Mobile 11% 9% 8% 6% 5% 4% Others 22% 21% 21% 20% 19% 17% Bull case Auto lighting 14% 18% 23% 28% 33% 39% BLU 24% 21% 18% 14% 12% 9% Lighting 29% 30% 32% 33% 33% 32% Mobile 11% 9% 8% 9% 5% 4% Others 22% 21% 20% 19% 18% 16% Bear case Auto lighting 14% 16% 19% 21% 24% 27% BLU 24% 21% 18% 16% 13% 11% Lighting 29% 31% 33% 35% 37% 39% Mobile 11% 10% 8% 7% 6% 5% Others 22% 22% 21% 21% 20% 19%
Source: HSBC estimates

13
Telecoms, Media & Technology Electronic Equipment 3 October 2013
abc
Meanwhile the industry has a unique
structure, in which many players specialise
solely in chip making, creating opportunities
for outsourcing opportunities. As some auto
light source/auto lighting players actually
have their own LED packaging divisions,
they may wish to source the LED chips from
these chip makers. Epistar is already
supplying the global light source leaders and
is also working directly with a top five auto
lighting supplier.
The structure of global auto lighting Auto lighting makers
Car makers mostly rely auto lighting makers to
design and manufacture various exterior lights. As
a rule of thumb, Japanese auto lighting makers
tend to have strong relations with the US and
Japanese automakers, while European firms rely
more on US and European car makers. However,
both Japanese and European players are active in
China, setting up joint ventures with various local
partners. Some of these JVs are sizeable:
Shanghai Koito has already reached annual
revenue of USD1bn.
As these lights are endorsed by the automakers,
they are deemed to be OEM auto parts. For
replacement purposes, the products of auto
lighting OEMs (known as original equipment
suppliers, or OESs, in this context) can also be
purchased through distributors, albeit at a very
high premium (2-3x, by our estimates) to the
wholesale price (the cost auto makers paid to
install the equipment on the new cars).
Lighting source suppliers
The biggest auto light source suppliers globally
are Osram and Philips. We estimate that they have
a combined global market share of 80%. The light
source generally accounts for some 15-20% of the
auto lighting module.
We have seen some small companies bundle LED
packages into a filament shape, and use this as
replacement bulb – the consumer can simply
replace the HID/halogen with the LED light
source. However, we believe this design does not
fully exploit the benefits of LED.
After market (AM)
The auto component industry also has an after-
market (AM) segment. Companies in this area
manufacture parts that will fit a vehicle, without
approval from the OEM or the car makers.
Although these products are 50%-plus cheaper
than if purchased from the OES, AM is typically
more common in developing countries, as
developed countries such as the US have more
stringent insurance policies, which require the
products of OES to be used for repairs.
Global automotive lighting market
Source: HSBC
New Car Original Equipment Manufacturer (OEM)
Original Equipment Supplier (OES)Replacement
Aftermarket Parts (AM)

14
Telecoms, Media & Technology Electronic Equipment 3 October 2013
abc
Global lighting supply chain
Company Ticker Nationality Main products Main customers 2012 auto-lighting revenue
Industry position
Auto lighting makers
Koito 7276 JP Japan Automotive lighting Toyota, Nissan, Honda, Mazda
USD4.8bn Global No.1 auto-lighting maker;The biggest automotive lighting maker in China (37% market share); 20% owned by Toyota
Hella unlisted Germany Automotive lighting, street lights, auto parts
VW, GM Shanghai, Hyundai USD3.6bn
Top 3 auto-lighting maker and top 100 German industrial company; family-owned company with 70 locations in more than 30 countries
Stanley 6923 JP Japan
Automotive lighting, Street lights, electric/applied products
Honda USD2.2bn Revenue breakdown: 70% auto lighting, 20% electric/applied products, 10% components; 5% owned by Honda
Automotive Lighting unlisted Italy Automotive lighting Fiat, Ford USD3.1bn
Automotive lighting division of Magneti Marelli, which is a subsidiary of Fiat Group
Valeo FR FP France Automotive lighting, electric/applied products
Audi, BMW, Hyundai, Aston Martin
USD2.4bn Established in 1923. 15% revenue from auto lighting; operating more than 120 production sites in 28 countries
Delphi DLPH US United States
Automotive lighting, electric/applied products, Auto parts
GM, Ford, VW USD1.6bn Spun off from General Motors in 1999. Operating more than 150 production sites in 38 countries
SL 005850 KS
Korea Automotive lighting, Chassis, Moulds
Hyundai Motors, GM USD545m 4% global lighting market share;Revenue breakdown: 53% headlight, 30% moulds, 17% chassis
Hyundai Mobis
012330 KS Korea Module, After-sale
Hyundai Motors, Kia Motors
USD27.3bn (total revenue)
Revenue breakdown: 79% module, 18% after-sale, 33% Korea headlight market share; 17% owned by Kia Motors
Lighting source suppliers
Philips PHG US Netherlands
Light bulb, LED, Consumer electronics, Domestic appliances
All auto lighting makers, retail USD1.1bn
Global No.1 lighting source supplier; Established in 1891; Operating in more than 60 countries
Osram OSR GR Germany
Light bulb, LED, Light engines, Lighting management systems
All lighting makers, retail
USD1.4bn
Global top 3 lighting source supplier; Spun off from Siemens in 2012; Supplying customers in more than 150 countries
AM market/OEM manufacturer
Depo 6605 TT Taiwan Automotive lighting GM, Chrysler, USD0.4bn
Top AM auto-lighting maker (no.1 in Taiwan) with owned brand DEPO; More than 90% of revenue comes from AM auto lighting; sales in North America are made through self-owned subsidiary, Maxzone
TYC 1522 TT Taiwan Automotive lighting, Street lights
Ford, Ducati, Suzuki, Isuzu, GM
USD0.5bn
Top AM auto-lighting maker (No.2 in Taiwan); Above 95% of revenue comes from auto-lighting; Revenue breakdown: 45% from North America, 15% from Europe, 10% from South America, 10% from Asia
Tayih 1521 TT Taiwan Automotive lighting Ford, Chrysler, Mazda, Suzuki USD1.1bn
Top auto-lighting maker with OEM focus; Revenue breakdown: 80% auto lighting, 10% mould, 10% components
LED auto lighting module maker
Laster Tech 3346 TT Taiwan
LED auto lighting module, LED chips, LED industrial lighting
Koito, TYC, Tokaidenso, Audi, GM, BYD
USD40.9m
Distributors for Philips and Osram LED; Revenue breakdown: 67% from auto lighting, 23% from LED chips, 10% from industrial/general lighting
Source: Company data, HSBC
15
Telecoms, Media & Technology Electronic Equipment 3 October 2013
abc
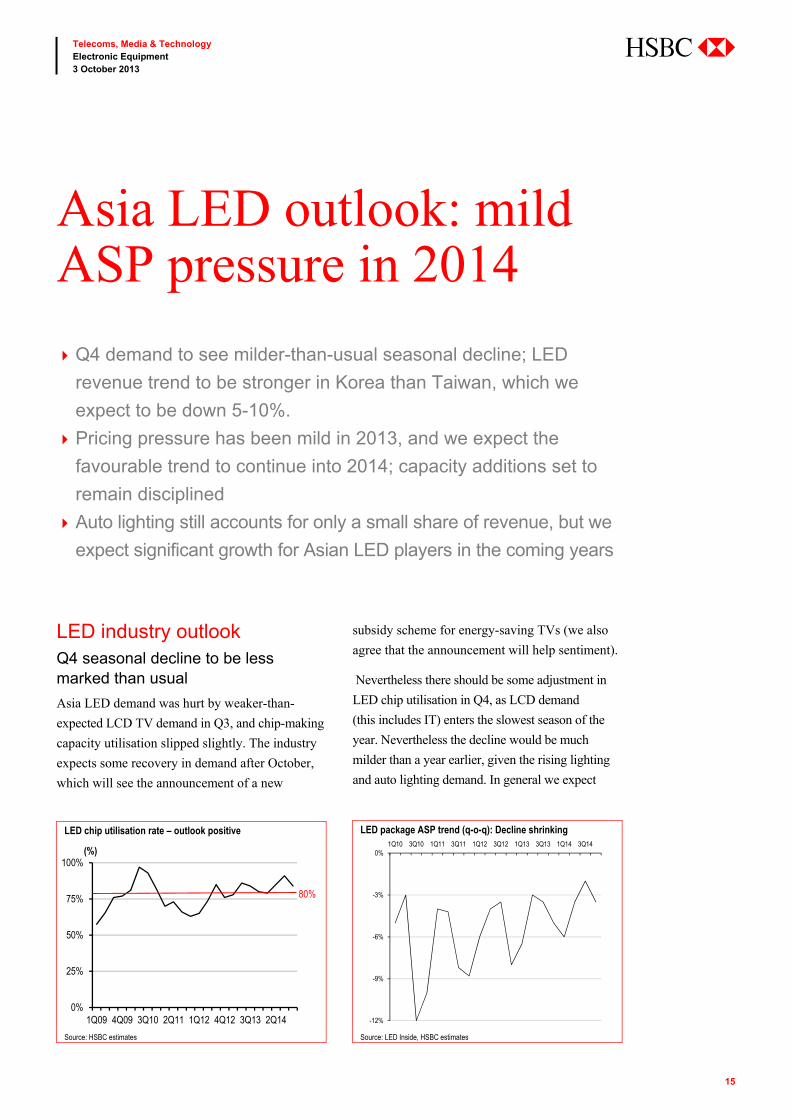
LED industry outlook Q4 seasonal decline to be less marked than usual
Asia LED demand was hurt by weaker-than-
expected LCD TV demand in Q3, and chip-making
capacity utilisation slipped slightly. The industry
expects some recovery in demand after October,
which will see the announcement of a new
subsidy scheme for energy-saving TVs (we also
agree that the announcement will help sentiment).
Nevertheless there should be some adjustment in
LED chip utilisation in Q4, as LCD demand
(this includes IT) enters the slowest season of the
year. Nevertheless the decline would be much
milder than a year earlier, given the rising lighting
and auto lighting demand. In general we expect
Asia LED outlook: mild ASP pressure in 2014
Q4 demand to see milder-than-usual seasonal decline; LED
revenue trend to be stronger in Korea than Taiwan, which we
expect to be down 5-10%.
Pricing pressure has been mild in 2013, and we expect the
favourable trend to continue into 2014; capacity additions set to
remain disciplined
Auto lighting still accounts for only a small share of revenue, but we
expect significant growth for Asian LED players in the coming years
LED chip utilisation rate – outlook positive
Source: HSBC estimates
LED package ASP trend (q-o-q): Decline shrinking
Source: LED Inside, HSBC estimates
0%
25%
50%
75%
100%
1Q09 4Q09 3Q10 2Q11 1Q12 4Q12 3Q13 2Q14
(%)
80%
-12%
-9%
-6%
-3%
0%1Q10 3Q10 1Q11 3Q11 1Q12 3Q12 1Q13 3Q13 1Q14 3Q14

16
Telecoms, Media & Technology Electronic Equipment 3 October 2013
abc
Korean firms to perform better than Taiwan LED
players, owing to the captive customer supports: flat
to slightly up versus a 5-10% decline for Taiwan.
Pricing pressure has been mild, and should remain so into 2014
We foresee some price erosion in Q4 (5-6%).
However, the LED chip makers that can improve
their product mix should still be able to achieve
margin expansion. We also expect the pricing
environment to be favourable for most of 2014 (with
a greater drop in Q1), as capacity expansions in the
industry (outside China) remained disciplined. We
continue to take the view that Chinese capacity will
be unable to serve most of the product segments,
owing to outdated technology and quality issues.
LG Innotek The auto lighting business still makes an
insignificant contribution to LG Innotek’s revenue.
However, we expect it to become meaningful
once LG Group’s EV component business takes
off from H2 2014, since LG Group selected this
business as a new growth catalyst and it is in the
process of product bundles with its related
businesses to supply to auto OEMs. The related
businesses include (1) LG Chemicals’ battery
business, (2) LG Electronics’ car audio, motors,
communication device and navigation business,
(3) LG U+’s telecommunication service, (4) LG
Innotek’s sensor and LED light chip business.
Seoul Semi Seoul Semi is consolidating its position in the
street light business via Achrich, an A/C type
LED, and is expected to extend the use of this
product to the automobile segment as well.
Currently, automotive LED contributes 7-8% of
the company’s total sales, and we believe
headlights will cause a greater improvement in
profitability than in revenues.
Seoul Semiconductor sales mix estimates
Source: HSBC estimates
Epistar While auto-related sales contribute only 3-4% to
revenue, we believe their GP/OP contribution is
well above that level owing to the extremely high
margin (likely the most profitable segment).
Management is suggesting the share of auto-related
revenue could rise to the 5-10% range in 2014.
0
400
800
1,200
1,600
2013e 2014e
Handset/Tablet TV General lighting and others Monitor Auto
(KRW bn)
Auto: 74bnAuto: 76bn
LG Innotek sales mix estimates
Source: HSBC estimates
Epistar sales mix estimates
Source: HSBC estimates
0
2,000
4,000
6,000
8,000
2013e 2014eLED DNCamera Module PCBPackage Substrate Material
(KRW bn)
Auto: 362bnAuto: 415bn
0
5
10
15
20
25
2013e 2014eOthers BLU Consumer Lighting Auto
(TWDbn)
Auto: TWD0.7bnAuto: TWD1.7bn

17
Telecoms, Media & Technology Electronic Equipment 3 October 2013
abc
Epistar is working with several auto lighting
leaders such as Stanley, which sources Epistar
chips for its auto-related LED packages. We
expect Epistar’s close ties with Toyoda Gosei
(a key subsidiary of Toyota) will allow it to
capture more opportunities in the future.
Everlight Everlight now generates a low-single-digit
percentage of its total revenue from auto-related
LED applications. Management suggests that the
segment should grow faster than the company as a
whole, as it continues to capture more customers
for interior and exterior auto lighting. Everlight is
working on headlight LED products. We believe
they have a chance to penetrate the AM market in
the coming year.
Everlight sales mix estimates
Source: HSBC estimates
0
7
14
21
28
2013e 2014eOthers BLU Consumer Lighting Auto
(TWDbn)
Auto: TWD0.7bn Auto: TWD1.2bn
18
Telecoms, Media & Technology Electronic Equipment 3 October 2013
abc
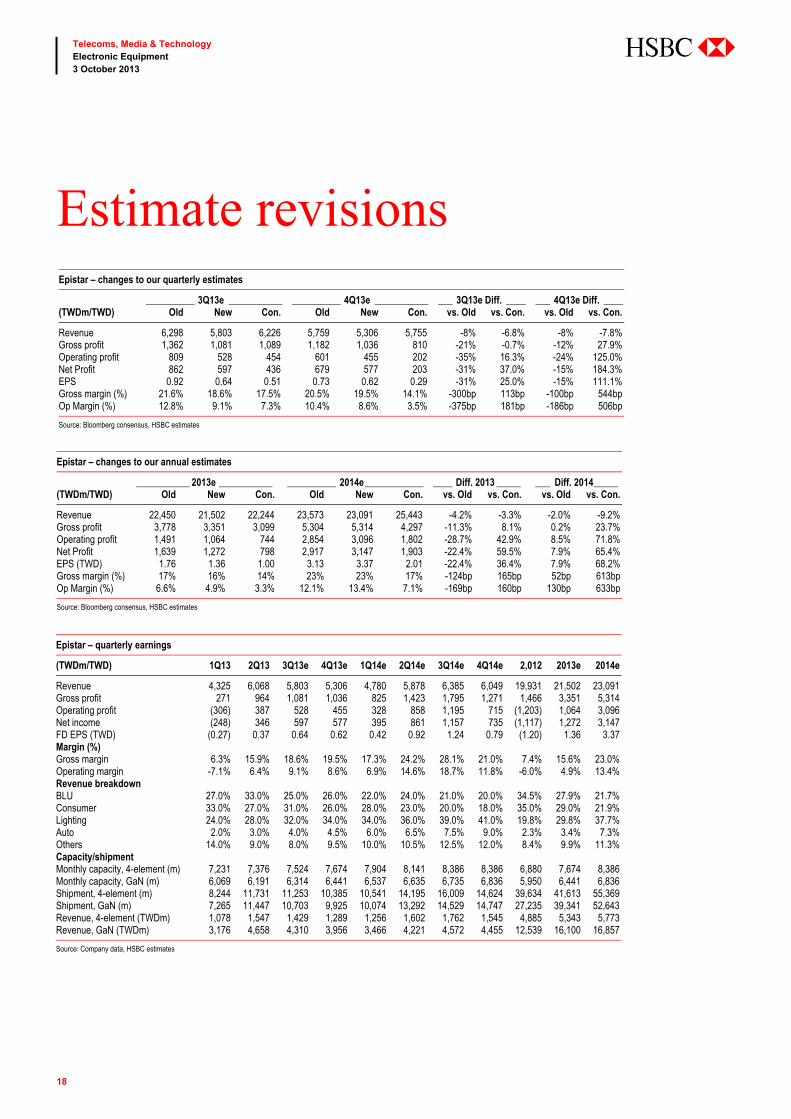
Epistar – changes to our annual estimates
___________ 2013e ___________ __________ 2014e ____________ ____ Diff. 2013 _____ ___ Diff. 2014 _____ (TWDm/TWD) Old New Con. Old New Con. vs. Old vs. Con. vs. Old vs. Con.
Revenue 22,450 21,502 22,244 23,573 23,091 25,443 -4.2% -3.3% -2.0% -9.2% Gross profit 3,778 3,351 3,099 5,304 5,314 4,297 -11.3% 8.1% 0.2% 23.7% Operating profit 1,491 1,064 744 2,854 3,096 1,802 -28.7% 42.9% 8.5% 71.8% Net Profit 1,639 1,272 798 2,917 3,147 1,903 -22.4% 59.5% 7.9% 65.4% EPS (TWD) 1.76 1.36 1.00 3.13 3.37 2.01 -22.4% 36.4% 7.9% 68.2% Gross margin (%) 17% 16% 14% 23% 23% 17% -124bp 165bp 52bp 613bp Op Margin (%) 6.6% 4.9% 3.3% 12.1% 13.4% 7.1% -169bp 160bp 130bp 633bp
Source: Bloomberg consensus, HSBC estimates
Estimate revisions
Epistar – quarterly earnings
(TWDm/TWD) 1Q13 2Q13 3Q13e 4Q13e 1Q14e 2Q14e 3Q14e 4Q14e 2,012 2013e 2014e
Revenue 4,325 6,068 5,803 5,306 4,780 5,878 6,385 6,049 19,931 21,502 23,091 Gross profit 271 964 1,081 1,036 825 1,423 1,795 1,271 1,466 3,351 5,314 Operating profit (306) 387 528 455 328 858 1,195 715 (1,203) 1,064 3,096 Net income (248) 346 597 577 395 861 1,157 735 (1,117) 1,272 3,147 FD EPS (TWD) (0.27) 0.37 0.64 0.62 0.42 0.92 1.24 0.79 (1.20) 1.36 3.37 Margin (%) Gross margin 6.3% 15.9% 18.6% 19.5% 17.3% 24.2% 28.1% 21.0% 7.4% 15.6% 23.0% Operating margin -7.1% 6.4% 9.1% 8.6% 6.9% 14.6% 18.7% 11.8% -6.0% 4.9% 13.4% Revenue breakdown BLU 27.0% 33.0% 25.0% 26.0% 22.0% 24.0% 21.0% 20.0% 34.5% 27.9% 21.7% Consumer 33.0% 27.0% 31.0% 26.0% 28.0% 23.0% 20.0% 18.0% 35.0% 29.0% 21.9% Lighting 24.0% 28.0% 32.0% 34.0% 34.0% 36.0% 39.0% 41.0% 19.8% 29.8% 37.7% Auto 2.0% 3.0% 4.0% 4.5% 6.0% 6.5% 7.5% 9.0% 2.3% 3.4% 7.3% Others 14.0% 9.0% 8.0% 9.5% 10.0% 10.5% 12.5% 12.0% 8.4% 9.9% 11.3% Capacity/shipment Monthly capacity, 4-element (m) 7,231 7,376 7,524 7,674 7,904 8,141 8,386 8,386 6,880 7,674 8,386 Monthly capacity, GaN (m) 6,069 6,191 6,314 6,441 6,537 6,635 6,735 6,836 5,950 6,441 6,836 Shipment, 4-element (m) 8,244 11,731 11,253 10,385 10,541 14,195 16,009 14,624 39,634 41,613 55,369 Shipment, GaN (m) 7,265 11,447 10,703 9,925 10,074 13,292 14,529 14,747 27,235 39,341 52,643 Revenue, 4-element (TWDm) 1,078 1,547 1,429 1,289 1,256 1,602 1,762 1,545 4,885 5,343 5,773 Revenue, GaN (TWDm) 3,176 4,658 4,310 3,956 3,466 4,221 4,572 4,455 12,539 16,100 16,857
Source: Company data, HSBC estimates
Epistar – changes to our quarterly estimates
__________ 3Q13e ___________ __________ 4Q13e ___________ ___ 3Q13e Diff. ____ ___ 4Q13e Diff. ____ (TWDm/TWD) Old New Con. Old New Con. vs. Old vs. Con. vs. Old vs. Con.
Revenue 6,298 5,803 6,226 5,759 5,306 5,755 -8% -6.8% -8% -7.8% Gross profit 1,362 1,081 1,089 1,182 1,036 810 -21% -0.7% -12% 27.9% Operating profit 809 528 454 601 455 202 -35% 16.3% -24% 125.0% Net Profit 862 597 436 679 577 203 -31% 37.0% -15% 184.3% EPS 0.92 0.64 0.51 0.73 0.62 0.29 -31% 25.0% -15% 111.1% Gross margin (%) 21.6% 18.6% 17.5% 20.5% 19.5% 14.1% -300bp 113bp -100bp 544bp Op Margin (%) 12.8% 9.1% 7.3% 10.4% 8.6% 3.5% -375bp 181bp -186bp 506bp
Source: Bloomberg consensus, HSBC estimates
19
Telecoms, Media & Technology Electronic Equipment 3 October 2013
abc
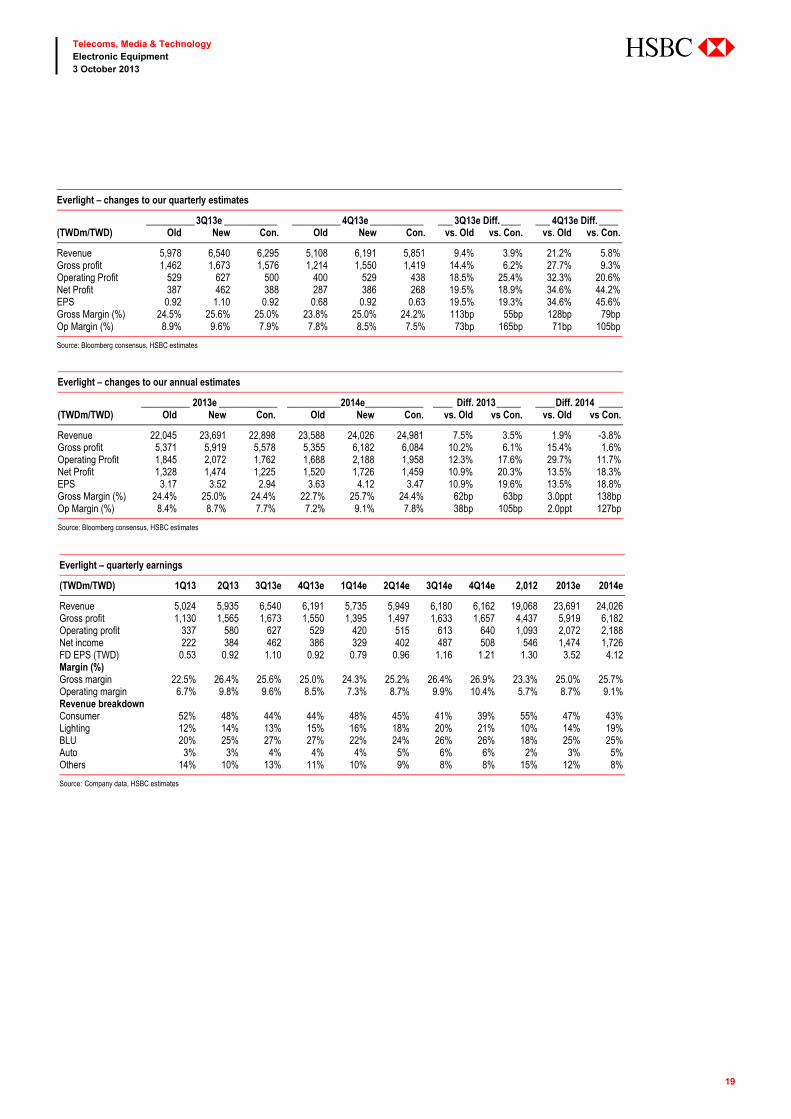
Everlight – quarterly earnings
(TWDm/TWD) 1Q13 2Q13 3Q13e 4Q13e 1Q14e 2Q14e 3Q14e 4Q14e 2,012 2013e 2014e
Revenue 5,024 5,935 6,540 6,191 5,735 5,949 6,180 6,162 19,068 23,691 24,026 Gross profit 1,130 1,565 1,673 1,550 1,395 1,497 1,633 1,657 4,437 5,919 6,182 Operating profit 337 580 627 529 420 515 613 640 1,093 2,072 2,188 Net income 222 384 462 386 329 402 487 508 546 1,474 1,726 FD EPS (TWD) 0.53 0.92 1.10 0.92 0.79 0.96 1.16 1.21 1.30 3.52 4.12 Margin (%) Gross margin 22.5% 26.4% 25.6% 25.0% 24.3% 25.2% 26.4% 26.9% 23.3% 25.0% 25.7% Operating margin 6.7% 9.8% 9.6% 8.5% 7.3% 8.7% 9.9% 10.4% 5.7% 8.7% 9.1% Revenue breakdown Consumer 52% 48% 44% 44% 48% 45% 41% 39% 55% 47% 43% Lighting 12% 14% 13% 15% 16% 18% 20% 21% 10% 14% 19% BLU 20% 25% 27% 27% 22% 24% 26% 26% 18% 25% 25% Auto 3% 3% 4% 4% 4% 5% 6% 6% 2% 3% 5% Others 14% 10% 13% 11% 10% 9% 8% 8% 15% 12% 8%
Source: Company data, HSBC estimates
Everlight – changes to our quarterly estimates
__________ 3Q13e ___________ __________ 4Q13e ___________ ___ 3Q13e Diff. ____ ___ 4Q13e Diff. ____ (TWDm/TWD) Old New Con. Old New Con. vs. Old vs. Con. vs. Old vs. Con.
Revenue 5,978 6,540 6,295 5,108 6,191 5,851 9.4% 3.9% 21.2% 5.8% Gross profit 1,462 1,673 1,576 1,214 1,550 1,419 14.4% 6.2% 27.7% 9.3% Operating Profit 529 627 500 400 529 438 18.5% 25.4% 32.3% 20.6% Net Profit 387 462 388 287 386 268 19.5% 18.9% 34.6% 44.2% EPS 0.92 1.10 0.92 0.68 0.92 0.63 19.5% 19.3% 34.6% 45.6% Gross Margin (%) 24.5% 25.6% 25.0% 23.8% 25.0% 24.2% 113bp 55bp 128bp 79bp Op Margin (%) 8.9% 9.6% 7.9% 7.8% 8.5% 7.5% 73bp 165bp 71bp 105bp
Source: Bloomberg consensus, HSBC estimates
Everlight – changes to our annual estimates
__________ 2013e ____________ ___________2014e ____________ ____ Diff. 2013 _____ ____ Diff. 2014 _____(TWDm/TWD) Old New Con. Old New Con. vs. Old vs Con. vs. Old vs Con.
Revenue 22,045 23,691 22,898 23,588 24,026 24,981 7.5% 3.5% 1.9% -3.8% Gross profit 5,371 5,919 5,578 5,355 6,182 6,084 10.2% 6.1% 15.4% 1.6% Operating Profit 1,845 2,072 1,762 1,688 2,188 1,958 12.3% 17.6% 29.7% 11.7% Net Profit 1,328 1,474 1,225 1,520 1,726 1,459 10.9% 20.3% 13.5% 18.3% EPS 3.17 3.52 2.94 3.63 4.12 3.47 10.9% 19.6% 13.5% 18.8% Gross Margin (%) 24.4% 25.0% 24.4% 22.7% 25.7% 24.4% 62bp 63bp 3.0ppt 138bp Op Margin (%) 8.4% 8.7% 7.7% 7.2% 9.1% 7.8% 38bp 105bp 2.0ppt 127bp
Source: Bloomberg consensus, HSBC estimates

20
Telecoms, Media & Technology Electronic Equipment 3 October 2013
abc
LG Innotek – quarterly earnings trend
(KRWbn) 1Q13 2Q13 3Q13e 4Q13e 1Q14e 2Q14e 3Q14e 4Q14e 2012 2013e 2014e
Sales LED 256.9 315.7 309.4 301.8 307.8 310.9 317.1 320.3 998.2 1,183.70 1,256.00 DN 180.8 173.9 182.6 188.1 191.8 195.7 199.6 203.6 904.9 725.3 790.6 Camera Module 641.1 557.4 641 660.3 647 666.5 693.1 707 1,661.50 2,499.80 2,713.60 PCB 102.8 75.5 81.5 101.9 109.1 110.2 116.8 117.9 430.4 361.8 453.9 Package Substrate 108.2 125.5 128 132.5 133.8 136.5 137.8 143.3 431.3 494.1 551.4 Material 177.1 186.6 205.3 211.4 213.5 217.8 220 228.8 505.9 780.4 880.1 Automotive 87.3 89.4 84 101.2 102.2 103.2 104.2 105.3 353.6 361.9 414.9 Total 1,554.20 1,524.00 1,631.80 1,697.10 1,705.20 1,740.60 1,788.60 1,826.10 5,285.80 6,407.00 7,060.60 Operating profit LED -28.3 -22.4 -24.8 -15.1 -9.2 -6.2 -3.2 3.2 -102 -90.5 -15.4 DN 5.9 8 8.1 10.7 9.2 10.1 9.6 10.6 29.7 32.7 39.5 Camera Module 24.4 26.2 44.9 44.9 35.6 40 38.1 42.4 55.6 140.3 156.1 PCB 1.9 -3.4 -4.1 -3.1 -2.2 -1.1 0 1.2 38.9 -8.7 -2.1 Package Substrate 2.2 13.1 13.2 10.7 7.2 7.8 7.6 8.8 11 39.1 31.4 Material 7.7 9.2 16.3 13.3 12 11.7 12.9 10.5 40 46.4 47.1 Automotive 2.1 5.1 1.8 1.5 1.5 1.7 1.4 1.3 1.8 10.5 6 Total 15.8 35.7 55.4 62.9 54.1 64 66.5 78 75 169.9 262.5 OP margin LED -11.0% -7.1% -8.0% -5.0% -3.0% -2.0% -1.0% 1.0% -10.2% -7.6% -1.2% DN 3.3% 4.6% 4.4% 5.7% 4.8% 5.2% 4.8% 5.2% 3.3% 4.5% 5.0% Camera Module 3.8% 4.7% 7.0% 6.8% 5.5% 6.0% 5.5% 6.0% 3.3% 5.6% 5.8% PCB 1.8% -4.5% -5.0% -3.0% -2.0% -1.0% 0.0% 1.0% 9.0% -2.4% -0.5% Package Substrate 2.0% 10.4% 10.3% 8.1% 5.4% 5.7% 5.5% 6.1% 2.6% 7.9% 5.7% Material 4.3% 4.9% 7.9% 6.3% 5.6% 5.4% 5.9% 4.6% 7.9% 5.9% 5.3% Automotive (not LED) 2.4% 5.7% 2.2% 1.5% 1.5% 1.7% 1.3% 1.2% 0.5% 2.9% 1.4% Total 1.0% 2.3% 3.4% 3.7% 3.2% 3.7% 3.7% 4.3% 1.4% 2.7% 3.7%
Source: Company data, HSBC estimate (DN: display & network, PCB: printed circuit board)
Seoul Semiconductor – quarterly earnings outlook
(KRWbn) 1Q13 2Q13 3Q13e 4Q13e 1Q14e 2Q14e 3Q14e 4Q14e 2012 2013e 2014e
Sales Handset/Tablets 35 40 41 43 41 46 47 49 128 159 183 TV 65 74 77 80 77 86 88 92 239 296 342 General lighting 95 109 113 117 115 128 132 137 351 433 511 Monitor 21 24 25 26 25 27 28 29 77 95 110 Auto 16 19 19 20 19 21 22 23 60 74 76 Total sales 231 266 276 285 274 305 315 328 855 1,057 1,223 Operating profit Handset 0.9 3.5 1.5 1.5 1.1 1.3 1.5 1.3 0.8 7.4 5.3 TV 3 7.2 6.3 5.5 5.5 6.8 5.6 5.7 1.6 21.9 23.6 General lighting and others 7.2 16.7 13.4 10.1 13.6 17.9 20.8 22.7 13 47.3 75 Home appliance and others 1 1.8 1.2 1.1 0.9 1.1 1.1 1.1 1.2 5.2 4.2 Total OP 12.2 29.2 22.4 18.2 21.2 27.1 29 30.9 16.5 81.9 108.1 OP margin Handset 2.90% 9.90% 5.00% 4.70% 3.70% 3.80% 4.30% 3.70% 0.70% 5.80% 3.90% TV 3.90% 8.30% 7.20% 6.20% 6.50% 7.40% 6.00% 6.00% 0.60% 6.50% 6.50% General lighting and others 7.40% 13.50% 10.30% 7.40% 10.30% 12.20% 13.40% 13.80% 3.50% 9.70% 12.60% Home appliance and others 3.60% 8.70% 4.20% 4.00% 3.20% 3.10% 3.30% 3.40% 1.00% 4.90% 3.30% Total OP margin 5.30% 11.00% 8.10% 6.40% 7.70% 8.90% 9.20% 9.40% 1.90% 7.70% 8.80%
Source: Company data, HSBC estimate
Seoul Semiconductor – changes to our earnings estimates
(KRWbn) _____________ Old _____________ ____________ New _____________ __________ % change ___________ 2013e 2014e 2015e 2013e 2014e 2015e 2013e 2014e 2015e
Sales 1,057 1,201 1,313 1,057 1,223 1,414 0.0% 1.8% 7.7% Operating profit 82 84 108 82 108 138 0.3% 28.2% 27.4% Net income 63 75 96 63 94 120 0.3% 25.4% 25.3% OP margin 7.70% 7.00% 8.20% 7.70% 8.80% 9.80% 0.0%pt 1.8%pt 1.5%pt NP margin 5.90% 6.30% 7.30% 6.00% 7.70% 8.50% 0.0%pt 1.5%pt 1.2%pt
Source: HSBC estimates
21
Telecoms, Media & Technology Electronic Equipment 3 October 2013
abc
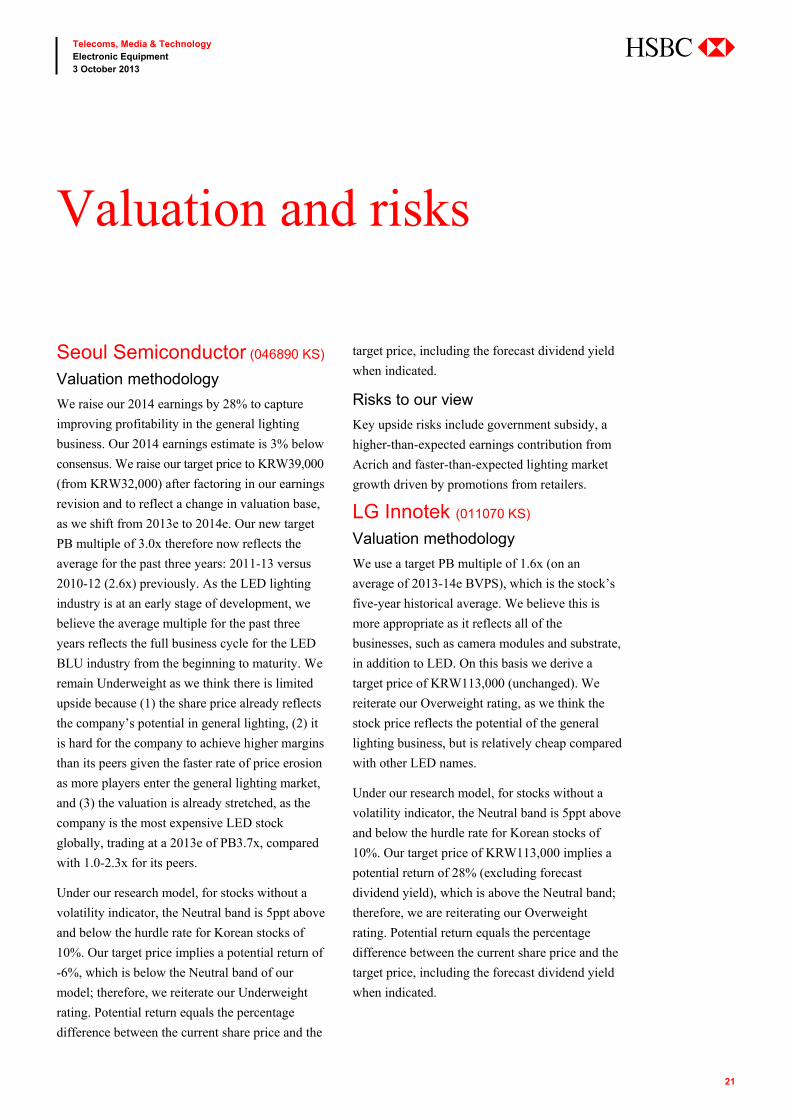
Seoul Semiconductor (046890 KS) Valuation methodology
We raise our 2014 earnings by 28% to capture
improving profitability in the general lighting
business. Our 2014 earnings estimate is 3% below
consensus. We raise our target price to KRW39,000
(from KRW32,000) after factoring in our earnings
revision and to reflect a change in valuation base,
as we shift from 2013e to 2014e. Our new target
PB multiple of 3.0x therefore now reflects the
average for the past three years: 2011-13 versus
2010-12 (2.6x) previously. As the LED lighting
industry is at an early stage of development, we
believe the average multiple for the past three
years reflects the full business cycle for the LED
BLU industry from the beginning to maturity. We
remain Underweight as we think there is limited
upside because (1) the share price already reflects
the company’s potential in general lighting, (2) it
is hard for the company to achieve higher margins
than its peers given the faster rate of price erosion
as more players enter the general lighting market,
and (3) the valuation is already stretched, as the
company is the most expensive LED stock
globally, trading at a 2013e of PB3.7x, compared
with 1.0-2.3x for its peers.
Under our research model, for stocks without a
volatility indicator, the Neutral band is 5ppt above
and below the hurdle rate for Korean stocks of
10%. Our target price implies a potential return of
-6%, which is below the Neutral band of our
model; therefore, we reiterate our Underweight
rating. Potential return equals the percentage
difference between the current share price and the
target price, including the forecast dividend yield
when indicated.
Risks to our view
Key upside risks include government subsidy, a
higher-than-expected earnings contribution from
Acrich and faster-than-expected lighting market
growth driven by promotions from retailers.
LG Innotek (011070 KS) Valuation methodology
We use a target PB multiple of 1.6x (on an
average of 2013-14e BVPS), which is the stock’s
five-year historical average. We believe this is
more appropriate as it reflects all of the
businesses, such as camera modules and substrate,
in addition to LED. On this basis we derive a
target price of KRW113,000 (unchanged). We
reiterate our Overweight rating, as we think the
stock price reflects the potential of the general
lighting business, but is relatively cheap compared
with other LED names.
Under our research model, for stocks without a
volatility indicator, the Neutral band is 5ppt above
and below the hurdle rate for Korean stocks of
10%. Our target price of KRW113,000 implies a
potential return of 28% (excluding forecast
dividend yield), which is above the Neutral band;
therefore, we are reiterating our Overweight
rating. Potential return equals the percentage
difference between the current share price and the
target price, including the forecast dividend yield
when indicated.
Valuation and risks

22
Telecoms, Media & Technology Electronic Equipment 3 October 2013
abc
Risks to our view
Downside risks include (1) a weaker-than-
expected overall TV and handset demand further
lowers its utilisation, (2) raw material prices
increase due to tight supply, and (3) unfavourable
FX rate reduces profit.
Epistar (2448 TT) Valuation methodology
Our new target price of TWD76.0 (previously
TWD74.0) is based on an unchanged multiple of
1.4x, but rolled forward to 2014e BVPS
(previously H2 2013e/H1 2014e). The 1.4x PB
multiple is at the point in the stock’s historical
trading band when ROE tends to reach c7%.
Under our research model, for stocks without a
volatility indicator, the Neutral band is 5ppt above
and below the hurdle rate for Taiwanese stocks of
9%. Our target price implies a potential return of
35%, above the Neutral band; therefore, we
reiterate our Overweight rating. Potential return
equals the percentage difference between the
current share price and the target price, including
the forecast dividend yield when indicated.
Risks to our view
The key downside risk is that Chinese competitors
could adopt an aggressive pricing strategy.
Everlight (2393 TT) Valuation methodology
Our new target price of TWD63.0 (previously
TWD56.0) is based on a 1.6x (previously 1.4x)
2014e BVPS (rolled forward from H2 2013e/H2
2014e). The new PB multiple of 1.6x is at the
point in its historical trading band where ROE
tends to reach double digits, as we are modelling
10.6% ROE in 2014 (prior 9.5%).
Under our research model, the Neutral band for
non-volatile stocks is 5ppt above and below the
hurdle rate for Taiwan stocks of 9%. Our target
price implies a potential return of 16%, which is
above the Neutral band; we therefore reiterate our
Overweight rating. Potential return equals the
percentage difference between the current share
price and the target price, including the forecast
dividend yield when indicated.
Risks to our view
The main downside risk is a severe LCD
inventory adjustment.
Epistar 12-month forward trading band, PB Everlight 12-month forward trading band, PB
Source: Company data, TEJ, HSBC estimates Source: Company data, TEJ, HSBC estimates
-30%
-10%
10%
30%
50%
0
40
80
120
160
Sep-03 Sep-05 Sep-07 Sep-09 Sep-11 Sep-13
RoE2.2x
1.4x
1.8x
1.0x
Epistar Share price (LHS, TWD) RoE (RHS, %)
1.6x2.0x
2.4x
2.8x
1.2x
-30%
-10%
10%
30%
50%
0
40
80
120
160
Sep-03 Sep-05 Sep-07 Sep-09 Sep-11 Sep-13
Everlight Share price (LHS,TWD) RoE (RHS, %)
ROE

Teleco
ms, M
edia &
Tech
no
log
y E
lectron
ic Eq
uip
men
t 3 O
ctob
er 2013
23
ab
c
HSBC global automobile demand model
Region 2001 2002 2003 2004 2005 2006 2007 2008 2009 2010 2011 2012 2013e 2014e 2015e
Western Europe 16,652 16,219 15,976 16,454 16,504 16,695 16,839 15,372 15,014 14,465 14,411 13,140 12,612 12,950 13,412 Germany 3,516 3,414 3,405 3,445 3,510 3,658 3,366 3,309 3,970 3,113 3,407 3,302 3,140 3,298 3,377 UK 2,706 2,830 2,882 2,896 2,762 2,666 2,735 2,421 2,181 2,253 2,202 2,284 2,472 2,472 2,447 Italy 2,644 2,579 2,456 2,488 2,455 2,543 2,728 2,379 2,359 2,151 1,938 1,518 1,382 1,405 1,575 France 2,681 2,544 2,385 2,415 2,482 2,436 2,523 2,505 2,673 2,666 2,631 2,280 2,105 2,171 2,291 Spain 1,706 1,590 1,672 1,841 1,909 1,904 1,882 1,323 1,062 1,101 913 777 805 824 901 Eastern Europe 1,492 1,484 1,825 2,465 2,729 3,061 3,863 4,219 2,285 2,912 3,894 4,112 4,082 4,237 4,348 Russia 1,149 1,128 1,224 1,447 1,612 1,944 2,594 2,952 1,468 1,899 2,678 2,934 2,822 2,921 2,936 Turkey 182 160 358 684 702 606 575 478 546 747 855 766 810 856 918 Ukraine 96 138 177 234 300 405 574 652 174 174 238 232 232 240 270 Others 65 58 66 100 115 106 120 137 96 92 123 179 219 220 224 Central Europe 1,072 1,093 1,206 1,246 1,272 1,352 1,551 1,539 1,082 1,009 971 924 868 929 994 Poland 350 328 383 354 271 281 347 378 362 374 320 312 297 316 335 Other EU 27 countries 265 285 311 378 468 541 646 605 354 302 317 290 273 286 304 Other Non-EU-27 countries 118 116 120 127 142 157 176 188 117 100 95 72 65 82 95 North America 19,587 19,483 19,195 19,502 19,689 19,324 18,923 15,920 12,653 13,970 15,268 17,161 18,415 18,683 18,900 USA 17,119 16,813 16,636 16,870 16,956 16,568 16,157 13,245 10,437 11,590 12,779 14,499 15,596 15,836 16,010 Canada 1,557 1,696 1,587 1,531 1,582 1,616 1,654 1,636 1,461 1,558 1,586 1,676 1,746 1,737 1,745 Mexico 912 974 972 1,101 1,151 1,140 1,112 1,039 755 822 903 986 1,073 1,110 1,145 South America 2,274 2,095 2,030 2,497 2,871 3,327 4,233 4,422 4,302 5,074 5,552 5,819 5,971 6,073 6,293 Brazil 1,467 1,391 1,321 1,524 1,616 1,833 2,353 2,660 3,004 3,317 3,412 3,628 3,647 3,714 3,859 Argentina 184 91 134 268 355 416 529 574 493 637 832 806 842 833 823 Middle East/Africa 2,363 2,499 2,716 3,078 3,725 4,097 4,378 4,468 4,206 4,870 5,018 4,621 4,527 4,661 4,917 Iran 352 504 614 804 1,072 1,132 1,140 1,158 1,420 1,635 1,665 1,026 815 927 1,076 Greater China 2,020 2,776 3,816 4,306 5,121 6,211 7,324 7,765 11,856 15,607 16,560 17,608 19,387 20,950 22,460 China 1,659 2,391 3,415 3,838 4,619 5,854 6,972 7,521 11,557 15,270 16,161 17,216 19,003 20,559 22,063 ASEAN + India 1,820 2,050 2,380 2,929 3,267 3,284 3,549 3,784 3,863 5,132 5,542 6,541 6,329 6,746 7,461 India 708 722 868 1,084 1,172 1,438 1,624 1,701 1,992 2,646 2,900 3,229 3,079 3,328 3,829 Others 7,868 8,058 7,775 7,642 7,736 7,618 7,440 7,094 6,865 7,402 6,642 7,834 7,547 7,437 7,401 Japan 5,628 5,585 5,497 5,541 5,536 5,416 5,088 4,847 4,472 4,801 4,048 5,164 4,816 4,633 4,572 South Korea 1,411 1,585 1,290 1,067 1,131 1,160 1,219 1,176 1,417 1,514 1,530 1,491 1,506 1,543 1,551 Oceania (Australia, New Zealand) 828 889 989 1,034 1,068 1,042 1,132 1,071 976 1,087 1,063 1,180 1,225 1,261 1,278 Global 55,148 55,759 56,919 60,120 62,913 64,969 68,099 64,583 62,127 70,442 73,858 77,760 79,740 82,667 86,187
Source: HSBC estimates
Appendix
24
Telecoms, Media & Technology Electronic Equipment 3 October 2013
abc
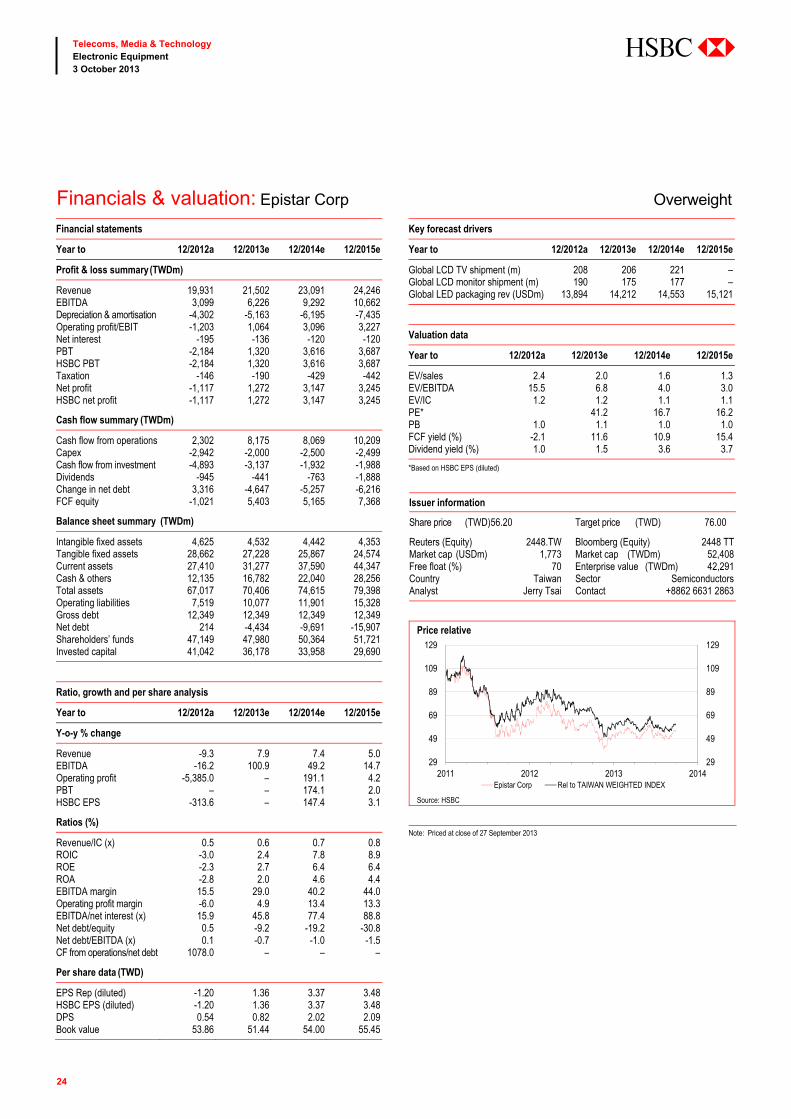
Financials & valuation: Epistar Corp Overweight Financial statements
Year to 12/2012a 12/2013e 12/2014e 12/2015e
Profit & loss summary (TWDm)
Revenue 19,931 21,502 23,091 24,246EBITDA 3,099 6,226 9,292 10,662Depreciation & amortisation -4,302 -5,163 -6,195 -7,435Operating profit/EBIT -1,203 1,064 3,096 3,227Net interest -195 -136 -120 -120PBT -2,184 1,320 3,616 3,687HSBC PBT -2,184 1,320 3,616 3,687Taxation -146 -190 -429 -442Net profit -1,117 1,272 3,147 3,245HSBC net profit -1,117 1,272 3,147 3,245
Cash flow summary (TWDm)
Cash flow from operations 2,302 8,175 8,069 10,209Capex -2,942 -2,000 -2,500 -2,499Cash flow from investment -4,893 -3,137 -1,932 -1,988Dividends -945 -441 -763 -1,888Change in net debt 3,316 -4,647 -5,257 -6,216FCF equity -1,021 5,403 5,165 7,368
Balance sheet summary (TWDm)
Intangible fixed assets 4,625 4,532 4,442 4,353Tangible fixed assets 28,662 27,228 25,867 24,574Current assets 27,410 31,277 37,590 44,347Cash & others 12,135 16,782 22,040 28,256Total assets 67,017 70,406 74,615 79,398Operating liabilities 7,519 10,077 11,901 15,328Gross debt 12,349 12,349 12,349 12,349Net debt 214 -4,434 -9,691 -15,907Shareholders’ funds 47,149 47,980 50,364 51,721Invested capital 41,042 36,178 33,958 29,690
Ratio, growth and per share analysis
Year to 12/2012a 12/2013e 12/2014e 12/2015e
Y-o-y % change
Revenue -9.3 7.9 7.4 5.0EBITDA -16.2 100.9 49.2 14.7Operating profit -5,385.0 – 191.1 4.2PBT – – 174.1 2.0HSBC EPS -313.6 – 147.4 3.1
Ratios (%)
Revenue/IC (x) 0.5 0.6 0.7 0.8ROIC -3.0 2.4 7.8 8.9ROE -2.3 2.7 6.4 6.4ROA -2.8 2.0 4.6 4.4EBITDA margin 15.5 29.0 40.2 44.0Operating profit margin -6.0 4.9 13.4 13.3EBITDA/net interest (x) 15.9 45.8 77.4 88.8Net debt/equity 0.5 -9.2 -19.2 -30.8Net debt/EBITDA (x) 0.1 -0.7 -1.0 -1.5CF from operations/net debt 1078.0 – – –
Per share data (TWD)
EPS Rep (diluted) -1.20 1.36 3.37 3.48HSBC EPS (diluted) -1.20 1.36 3.37 3.48DPS 0.54 0.82 2.02 2.09Book value 53.86 51.44 54.00 55.45
Key forecast drivers
Year to 12/2012a 12/2013e 12/2014e 12/2015e
Global LCD TV shipment (m) 208 206 221 –Global LCD monitor shipment (m) 190 175 177 –Global LED packaging rev (USDm) 13,894 14,212 14,553 15,121
Valuation data
Year to 12/2012a 12/2013e 12/2014e 12/2015e
EV/sales 2.4 2.0 1.6 1.3EV/EBITDA 15.5 6.8 4.0 3.0EV/IC 1.2 1.2 1.1 1.1PE* 41.2 16.7 16.2PB 1.0 1.1 1.0 1.0FCF yield (%) -2.1 11.6 10.9 15.4Dividend yield (%) 1.0 1.5 3.6 3.7
*Based on HSBC EPS (diluted)
Issuer information
Share price (TWD)56.20 Target price (TWD) 76.00 3
5.2
Reuters (Equity) 2448.TW Bloomberg (Equity) 2448 TTMarket cap (USDm) 1,773 Market cap (TWDm) 52,408Free float (%) 70 Enterprise value (TWDm) 42,291Country Taiwan Sector SemiconductorsAnalyst Jerry Tsai Contact +8862 6631 2863
Price relative
Source: HSBC Note: Priced at close of 27 September 2013
29
49
69
89
109
129
29
49
69
89
109
129
2011 2012 2013 2014Epistar Corp Rel to TAIWAN WEIGHTED INDEX
25
Telecoms, Media & Technology Electronic Equipment 3 October 2013
abc
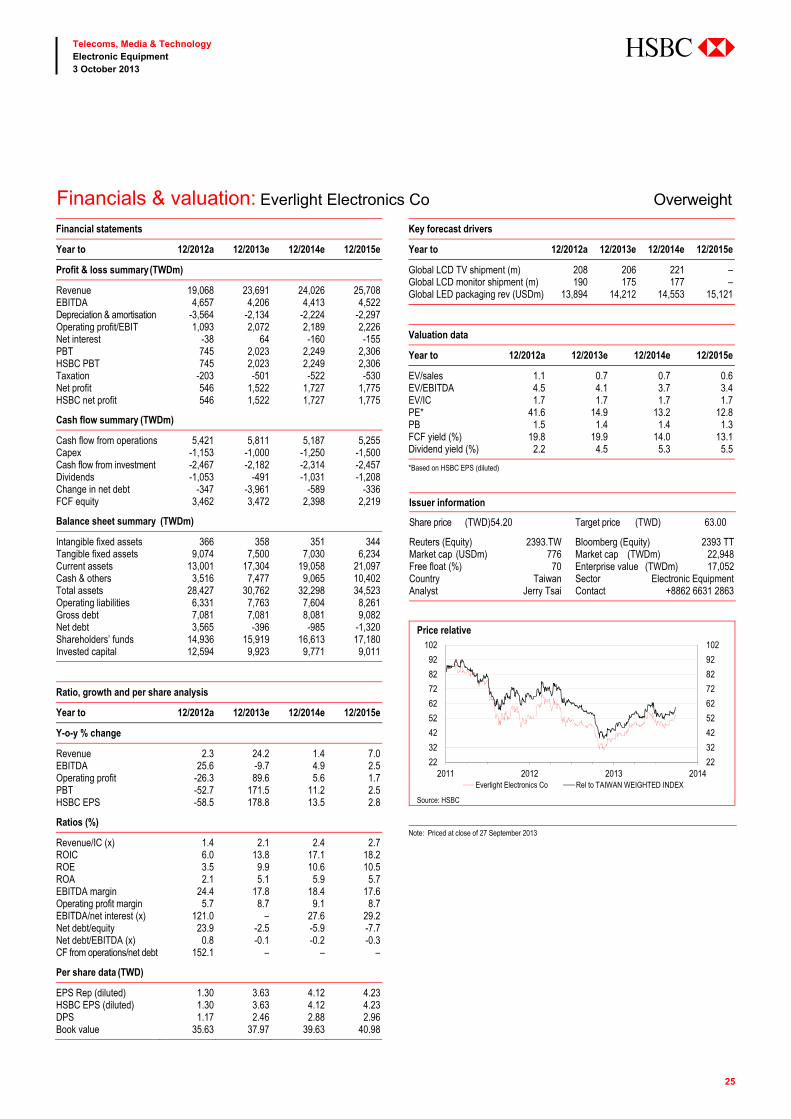
Financials & valuation: Everlight Electronics Co Overweight Financial statements
Year to 12/2012a 12/2013e 12/2014e 12/2015e
Profit & loss summary (TWDm)
Revenue 19,068 23,691 24,026 25,708EBITDA 4,657 4,206 4,413 4,522Depreciation & amortisation -3,564 -2,134 -2,224 -2,297Operating profit/EBIT 1,093 2,072 2,189 2,226Net interest -38 64 -160 -155PBT 745 2,023 2,249 2,306HSBC PBT 745 2,023 2,249 2,306Taxation -203 -501 -522 -530Net profit 546 1,522 1,727 1,775HSBC net profit 546 1,522 1,727 1,775
Cash flow summary (TWDm)
Cash flow from operations 5,421 5,811 5,187 5,255Capex -1,153 -1,000 -1,250 -1,500Cash flow from investment -2,467 -2,182 -2,314 -2,457Dividends -1,053 -491 -1,031 -1,208Change in net debt -347 -3,961 -589 -336FCF equity 3,462 3,472 2,398 2,219
Balance sheet summary (TWDm)
Intangible fixed assets 366 358 351 344Tangible fixed assets 9,074 7,500 7,030 6,234Current assets 13,001 17,304 19,058 21,097Cash & others 3,516 7,477 9,065 10,402Total assets 28,427 30,762 32,298 34,523Operating liabilities 6,331 7,763 7,604 8,261Gross debt 7,081 7,081 8,081 9,082Net debt 3,565 -396 -985 -1,320Shareholders’ funds 14,936 15,919 16,613 17,180Invested capital 12,594 9,923 9,771 9,011
Ratio, growth and per share analysis
Year to 12/2012a 12/2013e 12/2014e 12/2015e
Y-o-y % change
Revenue 2.3 24.2 1.4 7.0EBITDA 25.6 -9.7 4.9 2.5Operating profit -26.3 89.6 5.6 1.7PBT -52.7 171.5 11.2 2.5HSBC EPS -58.5 178.8 13.5 2.8
Ratios (%)
Revenue/IC (x) 1.4 2.1 2.4 2.7ROIC 6.0 13.8 17.1 18.2ROE 3.5 9.9 10.6 10.5ROA 2.1 5.1 5.9 5.7EBITDA margin 24.4 17.8 18.4 17.6Operating profit margin 5.7 8.7 9.1 8.7EBITDA/net interest (x) 121.0 – 27.6 29.2Net debt/equity 23.9 -2.5 -5.9 -7.7Net debt/EBITDA (x) 0.8 -0.1 -0.2 -0.3CF from operations/net debt 152.1 – – –
Per share data (TWD)
EPS Rep (diluted) 1.30 3.63 4.12 4.23HSBC EPS (diluted) 1.30 3.63 4.12 4.23DPS 1.17 2.46 2.88 2.96Book value 35.63 37.97 39.63 40.98
Key forecast drivers
Year to 12/2012a 12/2013e 12/2014e 12/2015e
Global LCD TV shipment (m) 208 206 221 –Global LCD monitor shipment (m) 190 175 177 –Global LED packaging rev (USDm) 13,894 14,212 14,553 15,121
Valuation data
Year to 12/2012a 12/2013e 12/2014e 12/2015e
EV/sales 1.1 0.7 0.7 0.6EV/EBITDA 4.5 4.1 3.7 3.4EV/IC 1.7 1.7 1.7 1.7PE* 41.6 14.9 13.2 12.8PB 1.5 1.4 1.4 1.3FCF yield (%) 19.8 19.9 14.0 13.1Dividend yield (%) 2.2 4.5 5.3 5.5
*Based on HSBC EPS (diluted)
Issuer information
Share price (TWD)54.20 Target price (TWD) 63.00 1
6.2
Reuters (Equity) 2393.TW Bloomberg (Equity) 2393 TTMarket cap (USDm) 776 Market cap (TWDm) 22,948Free float (%) 70 Enterprise value (TWDm) 17,052Country Taiwan Sector Electronic EquipmentAnalyst Jerry Tsai Contact +8862 6631 2863
Price relative
Source: HSBC Note: Priced at close of 27 September 2013
22
32
42
52
62
72
82
92
102
22
32
42
52
62
72
82
92
102
2011 2012 2013 2014Everlight Electronics Co Rel to TAIWAN WEIGHTED INDEX

26
Telecoms, Media & Technology Electronic Equipment 3 October 2013
abc
Financials & valuation: LG Innotek Co Overweight Financial statements
Year to 12/2012a 12/2013e 12/2014e 12/2015e
Profit & loss summary (KRWbn)
Revenue 5,316 6,380 7,016 7,597EBITDA 549 656 715 751Depreciation & amortisation -471 -486 -452 -425Operating profit/EBIT 77 170 263 326Net interest -103 -109 -107 -108PBT -18 66 157 219HSBC PBT -18 66 157 219Taxation -7 -15 -35 -49Net profit -25 51 122 170HSBC net profit -25 51 122 170
Cash flow summary (KRWbn)
Cash flow from operations 301 712 785 812Capex -350 -350 -350 -350Cash flow from investment -383 -381 -377 -380Dividends 0 0 0 -4Change in net debt 6 -202 -280 -299FCF equity -14 98 172 198
Balance sheet summary (KRWbn)
Intangible fixed assets 145 145 145 145Tangible fixed assets 2,631 2,499 2,401 2,330Current assets 2,073 2,689 3,174 3,661Cash & others 353 624 904 1,203Total assets 4,886 5,376 5,771 6,197Operating liabilities 1,450 1,819 2,091 2,352Gross debt 2,168 2,238 2,238 2,238Net debt 1,815 1,613 1,334 1,034Shareholders’ funds 1,268 1,319 1,441 1,607Invested capital 3,046 2,889 2,724 2,581
Ratio, growth and per share analysis
Year to 12/2012a 12/2013e 12/2014e 12/2015e
Y-o-y % change
Revenue 16.8 20.0 10.0 8.3EBITDA 46.8 19.6 9.0 5.0Operating profit – 119.9 54.6 24.3PBT – – 139.8 39.0HSBC EPS – – 139.8 39.0
Ratios (%)
Revenue/IC (x) 1.7 2.2 2.5 2.9ROIC 4.8 5.2 8.0 10.3ROE -1.9 3.9 8.9 11.1ROA 3.1 2.9 3.9 4.4EBITDA margin 10.3 10.3 10.2 9.9Operating profit margin 1.5 2.7 3.7 4.3EBITDA/net interest (x) 5.3 6.0 6.7 7.0Net debt/equity 143.1 122.3 92.5 64.4Net debt/EBITDA (x) 3.3 2.5 1.9 1.4CF from operations/net debt 16.6 44.1 58.9 78.5
Per share data (KRW)
EPS Rep (diluted) -1,239.94 2,526.05 6,058.17 8,418.56HSBC EPS (diluted) -1,239.94 2,526.05 6,058.17 8,418.56DPS 0.00 0.00 0.00 200.00Book value 62,892.66 65,418.79 71,477.16 79,696.00
Valuation data
Year to 12/2012a 12/2013e 12/2014e 12/2015e
EV/sales 0.7 0.5 0.4 0.4EV/EBITDA 6.5 5.1 4.3 3.7EV/IC 1.2 1.2 1.1 1.1PE* 35.0 14.6 10.5PB 1.4 1.4 1.2 1.1FCF yield (%) -0.8 5.6 9.9 11.5Dividend yield (%) 0.0 0.0 0.0 0.2
*Based on HSBC EPS (diluted)
Issuer information
Share price (KRW)88,500 Target price (KRW) 113,000 2
7.7
Reuters (Equity) 011070.KS Bloomberg (Equity) 011070 KSMarket cap (USDm) 1,660 Market cap (KRWbn) 1,785Free float (%) 47 Enterprise value (KRWbn) 3354Country Korea Sector Electronic EquipmentAnalyst Brian Sohn Contact +822 3706 8765
Price relative
Source: HSBC Note: Priced at close of 27 September 2013
45225
65225
85225
105225
125225
145225
45225
65225
85225
105225
125225
145225
2011 2012 2013 2014LG Innotek Co Rel to KOSPI INDEX

27
Telecoms, Media & Technology Electronic Equipment 3 October 2013
abc
Financials & valuation: Seoul Semiconductor Underweight Financial statements
Year to 12/2012a 12/2013e 12/2014e 12/2015e
Profit & loss summary (KRWbn)
Revenue 859 1,057 1,223 1,414EBITDA 57 120 146 178Depreciation & amortisation -39 -38 -37 -40Operating profit/EBIT 18 82 108 138Net interest -21 -21 -21 -21PBT 10 89 118 150HSBC PBT 10 89 118 150Taxation -3 -26 -24 -30Net profit 7 63 94 120HSBC net profit 7 63 94 120
Cash flow summary (KRWbn)
Cash flow from operations 66 115 130 152Capex -26 -50 -40 -50Cash flow from investment -6 -69 -61 -73Dividends 0 -6 -9 -9Change in net debt -61 -25 -45 -56FCF equity 30 2 25 35
Balance sheet summary (KRWbn)
Intangible fixed assets 25 25 25 25Tangible fixed assets 226 219 234 236Current assets 502 597 724 874Cash & others 50 76 121 177Total assets 862 967 1,128 1,302Operating liabilities 100 147 222 286Gross debt 157 157 157 157Net debt 106 81 36 -20Shareholders’ funds 604 661 747 858Invested capital 602 619 640 673
Ratio, growth and per share analysis
Year to 12/2012a 12/2013e 12/2014e 12/2015e
Y-o-y % change
Revenue 14.5 23.1 15.6 15.6EBITDA -3.4 112.5 21.0 22.1Operating profit -30.5 357.1 32.0 27.5PBT -58.1 801.8 32.2 26.9HSBC EPS -58.7 804.9 49.6 26.9
Ratios (%)
Revenue/IC (x) 1.4 1.7 1.9 2.2ROIC 2.9 10.3 14.7 17.7ROE 1.2 10.0 13.4 14.9ROA 3.1 9.1 11.2 11.7EBITDA margin 6.6 11.4 11.9 12.6Operating profit margin 2.1 7.7 8.8 9.8EBITDA/net interest (x) 2.7 5.7 6.9 8.4Net debt/equity 17.6 12.3 4.8 -2.3Net debt/EBITDA (x) 1.9 0.7 0.2 -0.1CF from operations/net debt 62.0 141.9 363.4 –
Per share data (KRW)
EPS Rep (diluted) 119.64 1082.71 1619.32 2054.77HSBC EPS (diluted) 119.64 1082.71 1619.32 2054.77DPS 0.00 100.00 150.00 150.00Book value 10,353.49 11,336.19 12,805.51 14,710.28
Valuation data
Year to 12/2012a 12/2013e 12/2014e 12/2015e
EV/sales 2.8 2.2 1.9 1.6EV/EBITDA 42.7 19.8 15.9 12.6EV/IC 4.0 3.8 3.6 3.3PE* 347.3 38.4 25.7 20.2PB 4.0 3.7 3.2 2.8FCF yield (%) 1.3 0.1 1.1 1.6Dividend yield (%) 0.0 0.2 0.4 0.4
*Based on HSBC EPS (diluted)
Issuer information
Share price (KRW)41550.00 Target price (KRW) 39,000 -
6.1
Reuters (Equity) 046890.KQ Bloomberg (Equity) 046890 KSMarket cap (USDm) 2,253 Market cap (KRWbn) 2,423Free float (%) 100 Enterprise value (KRWbn) 2,378Country Korea Sector Electronic EquipmentAnalyst Brian Sohn Contact +822 3706 8765
Price relative
Source: HSBC Note: Priced at close of 27 September 2013
15073
20073
25073
30073
35073
40073
45073
50073
15073
20073
25073
30073
35073
40073
45073
50073
2011 2012 2013 2014Seoul Semiconductor Rel to KOSPI INDEX

28
Telecoms, Media & Technology Electronic Equipment 3 October 2013
abc
Notes

29
Telecoms, Media & Technology Electronic Equipment 3 October 2013
abc
Notes

30
Telecoms, Media & Technology Electronic Equipment 3 October 2013
abc
Notes

31
Telecoms, Media & Technology Electronic Equipment 3 October 2013
abc
Disclosure appendix Analyst Certification The following analyst(s), economist(s), and/or strategist(s) who is(are) primarily responsible for this report, certifies(y) that the opinion(s) on the subject security(ies) or issuer(s) and/or any other views or forecasts expressed herein accurately reflect their personal view(s) and that no part of their compensation was, is or will be directly or indirectly related to the specific recommendation(s) or views contained in this research report: Jerry Tsai, Brian Sohn and Louis Cheng
Important disclosures
Equities: Stock ratings and basis for financial analysis HSBC believes that investors utilise various disciplines and investment horizons when making investment decisions, which depend largely on individual circumstances such as the investor’s existing holdings, risk tolerance and other considerations. Given these differences, HSBC has two principal aims in its equity research: (1) to identify long-term investment opportunities based on particular themes or ideas that may affect the future earnings or cash flows of companies on a 12-month horizon; and (2) from time to time to identify short-term investment opportunities that are derived from fundamental, quantitative, technical or event-driven techniques on a 0- to 3-month horizon and which may differ from our long-term investment rating. HSBC has assigned ratings for its long-term investment opportunities as described below.
This report addresses only the long-term investment opportunities of the companies referred to in the report. As and when HSBC publishes a short-term trading idea the stocks to which these relate are identified on the website at www.hsbcnet.com/research. Details of these short-term investment opportunities can be found under the Reports section of this website.
HSBC believes an investor’s decision to buy or sell a stock should depend on individual circumstances such as the investor’s existing holdings and other considerations. Different securities firms use a variety of ratings terms as well as different rating systems to describe their recommendations. Investors should carefully read the definitions of the ratings used in each research report. In addition, because research reports contain more complete information concerning the analysts’ views, investors should carefully read the entire research report and should not infer its contents from the rating. In any case, ratings should not be used or relied on in isolation as investment advice.
Rating definitions for long-term investment opportunities
Stock ratings HSBC assigns ratings to its stocks in this sector on the following basis:
For each stock we set a required rate of return calculated from the cost of equity for that stock’s domestic or, as appropriate, regional market established by our strategy team. The target price for a stock represents the value the analyst expects the stock to reach over our performance horizon. The performance horizon is 12 months. For a stock to be classified as Overweight, the potential return, which equals the percentage difference between the current share price and the target price, including the forecast dividend yield when indicated, must exceed the required return by at least 5ppt over the next 12 months (or 10ppt for a stock classified as Volatile*). For a stock to be classified as Underweight, the stock must be expected to underperform its required return by at least 5ppt over the next 12 months (or 10ppt for a stock classified as Volatile*). Stocks between these bands are classified as Neutral.
Our ratings are re-calibrated against these bands at the time of any ‘material change’ (initiation of coverage, change of volatility status or change in target price). Notwithstanding this, and although ratings are subject to ongoing management review, expected returns will be permitted to move outside the bands as a result of normal share price fluctuations without necessarily triggering a rating change.
*A stock will be classified as volatile if its historical volatility has exceeded 40%, if the stock has been listed for less than 12 months (unless it is in an industry or sector where volatility is low) or if the analyst expects significant volatility. However, stocks which we do not consider volatile may in fact also behave in such a way. Historical volatility is defined as the past month’s average of the daily 365-day moving average volatilities. In order to avoid misleadingly frequent changes in rating, however, volatility has to move 2.5ppt past the 40% benchmark in either direction for a stock’s status to change.

32
Telecoms, Media & Technology Electronic Equipment 3 October 2013
abc
Rating distribution for long-term investment opportunities
As of 2 October 2013, the distribution of all ratings published is as follows:
Overweight (Buy) 45% (33% of these provided with Investment Banking Services) Neutral (Hold) 38% (35% of these provided with Investment Banking Services) Underweight (Sell) 17% (26% of these provided with Investment Banking Services)
Share price and rating changes for long-term investment opportunities
LG Innotek Co (011070.KS) share price performance KRW vs HSBC rating history Recommendation & target price history
From To Date
Overweight (V) Neutral (V) 7 March 2011 Neutral (V) Neutral 17 June 2011 Neutral Neutral (V) 6 January 2012 Neutral (V) Overweight (V) 29 May 2012 Overweight (V) Overweight 7 April 2013 Target price Value Date
Price 1 185,000 5 October 2010 Price 2 170,000 7 January 2011 Price 3 130,000 7 March 2011 Price 4 100,000 17 June 2011 Price 5 74,000 20 October 2011 Price 6 110,000 15 March 2012 Price 7 108,000 29 May 2012 Price 8 113,000 24 July 2013 Source: HSBC
Source: HSBC Everlight Electronics Co (2393.TW) share price performance TWD vs HSBC rating history
Recommendation & target price history
From To Date
Underweight (V) Overweight (V) 10 November 2010 Overweight (V) Underweight 26 April 2011 Underweight Overweight 20 March 2013 Target price Value Date
Price 1 111.00 10 November 2010 Price 2 74.00 26 April 2011 Price 3 70.00 31 May 2011 Price 4 62.00 12 July 2011 Price 5 48.00 30 August 2011 Price 6 60.00 28 March 2012 Price 7 48.00 29 May 2012 Price 8 46.00 16 August 2012 Price 9 56.00 20 March 2013 Source: HSBC
Source: HSBC Epistar Corp (2448.TW) share price performance TWD vs HSBC rating history Recommendation & target price history
From To Date
Underweight (V) Overweight (V) 10 November 2010 Overweight (V) Underweight 26 April 2011 Underweight Underweight (V) 30 November 2011 Underweight (V) Overweight (V) 16 August 2012 Overweight (V) Overweight 9 August 2013 Target price Value Date
Price 1 133.00 10 November 2010 Price 2 138.00 18 March 2011 Price 3 86.00 26 April 2011 Price 4 68.00 23 May 2011 Price 5 62.00 12 July 2011 Price 6 48.00 22 August 2011 Price 7 60.00 28 March 2012 Price 8 74.00 16 August 2012 Price 9 72.00 30 October 2012 Price 10 75.00 20 March 2013 Price 11 74.00 9 August 2013 Source: HSBC
Source: HSBC
33301
53301
73301
93301
113301
133301
153301
173301
Oct
-08
Oct
-09
Oct
-10
Oct
-11
Oct
-12
Oct
-13
30
50
70
90
110
130
Oct
-08
Oct
-09
Oct
-10
Oct
-11
Oct
-12
Oct
-13
25
45
65
85
105
125
145
165
Oct
-08
Oct
-09
Oct
-10
Oct
-11
Oct
-12
Oct
-13

33
Telecoms, Media & Technology Electronic Equipment 3 October 2013
abc
Seoul Semiconductor (046890.KQ) share price performance KRW vs HSBC rating history
Recommendation & target price history
From To Date
Neutral (V) Overweight (V) 10 November 2010 Overweight (V) Overweight 28 January 2011 Overweight Neutral 28 April 2011 Neutral Neutral (V) 18 September 2011 Neutral (V) Underweight (V) 23 February 2012 Underweight (V) Neutral 20 March 2013 Neutral Underweight 14 May 2013 Target price Value Date
Price 1 51,000 10 November 2010 Price 2 54,000 7 March 2011 Price 3 49500.00 14 April 2011 Price 4 36,000 28 April 2011 Price 5 30,000 31 May 2011 Price 6 24,000 18 September 2011 Price 7 17500.00 29 May 2012 Price 8 31,000 20 March 2013 Price 9 30,000 14 May 2013 Price 10 32,000 13 August 2013 Source: HSBC
Source: HSBC
HSBC & Analyst disclosures Disclosure checklist
Company Ticker Recent price Price date Disclosure
LG INNOTEK CO 011070.KS 85,100 1-Oct-2013 4Source: HSBC
1 HSBC has managed or co-managed a public offering of securities for this company within the past 12 months. 2 HSBC expects to receive or intends to seek compensation for investment banking services from this company in the next
3 months. 3 At the time of publication of this report, HSBC Securities (USA) Inc. is a Market Maker in securities issued by this
company. 4 As of 31 August 2013 HSBC beneficially owned 1% or more of a class of common equity securities of this company. 5 As of 31 August 2013, this company was a client of HSBC or had during the preceding 12-month period been a client of
and/or paid compensation to HSBC in respect of investment banking services. 6 As of 31 August 2013, this company was a client of HSBC or had during the preceding 12-month period been a client of
and/or paid compensation to HSBC in respect of non-investment banking securities-related services. 7 As of 31 August 2013, this company was a client of HSBC or had during the preceding 12-month period been a client of
and/or paid compensation to HSBC in respect of non-securities services. 8 A covering analyst/s has received compensation from this company in the past 12 months. 9 A covering analyst/s or a member of his/her household has a financial interest in the securities of this company, as
detailed below. 10 A covering analyst/s or a member of his/her household is an officer, director or supervisory board member of this
company, as detailed below. 11 At the time of publication of this report, HSBC is a non-US Market Maker in securities issued by this company and/or in
securities in respect of this company HSBC and its affiliates will from time to time sell to and buy from customers the securities/instruments (including derivatives) of companies covered in HSBC Research on a principal or agency basis.
Analysts, economists, and strategists are paid in part by reference to the profitability of HSBC which includes investment banking revenue.
For disclosures in respect of any company mentioned in this report, please see the most recently published report on that company available at www.hsbcnet.com/research.
6730117301673021730267303173036730417304673051730
Oct
-08
Oct
-09
Oct
-10
Oct
-11
Oct
-12
Oct
-13

34
Telecoms, Media & Technology Electronic Equipment 3 October 2013
abc
Additional disclosures 1 This report is dated as at 3 October 2013. 2 All market data included in this report are dated as at close 27 September 2013, unless otherwise indicated in the report. 3 HSBC has procedures in place to identify and manage any potential conflicts of interest that arise in connection with its
Research business. HSBC’s analysts and its other staff who are involved in the preparation and dissemination of Research operate and have a management reporting line independent of HSBC’s Investment Banking business. Information Barrier procedures are in place between the Investment Banking and Research businesses to ensure that any confidential and/or price sensitive information is handled in an appropriate manner.

35
Telecoms, Media & Technology Electronic Equipment 3 October 2013
abc
Disclaimer *Legal entities as at 8 August 2012
‘UAE’ HSBC Bank Middle East Limited, Dubai; ‘HK’ The Hongkong and Shanghai Banking Corporation Limited, Hong Kong; ‘TW’ HSBC Securities (Taiwan) Corporation Limited; ‘CA’ HSBC Bank Canada, Toronto; HSBC Bank, Paris Branch; HSBC France; ‘DE’ HSBC Trinkaus & Burkhardt AG, Düsseldorf; 000 HSBC Bank (RR), Moscow; ‘IN’ HSBC Securities and Capital Markets (India) Private Limited, Mumbai; ‘JP’ HSBC Securities (Japan) Limited, Tokyo; ‘EG’ HSBC Securities Egypt SAE, Cairo; ‘CN’ HSBC Investment Bank Asia Limited, Beijing Representative Office; The Hongkong and Shanghai Banking Corporation Limited, Singapore Branch; The Hongkong and Shanghai Banking Corporation Limited, Seoul Securities Branch; The Hongkong and Shanghai Banking Corporation Limited, Seoul Branch; HSBC Securities (South Africa) (Pty) Ltd, Johannesburg; HSBC Bank plc, London, Madrid, Milan, Stockholm, Tel Aviv; ‘US’ HSBC Securities (USA) Inc, New York; HSBC Yatirim Menkul Degerler AS, Istanbul; HSBC México, SA, Institución de Banca Múltiple, Grupo Financiero HSBC; HSBC Bank Brasil SA – Banco Múltiplo; HSBC Bank Australia Limited; HSBC Bank Argentina SA; HSBC Saudi Arabia Limited; The Hongkong and Shanghai Banking Corporation Limited, New Zealand Branch incorporated in Hong Kong SAR
Issuer of report
HSBC Securities (Taiwan) Corporation Limited 13th Floor, 333 Keelung Road, Sec. 1,
Taipei, Taiwan
Telephone: + 886 2 2722 8458
Fax: + 886 2 2722 2056
Website: www.research.hsbc.com
This document has been issued by HSBC Securities (Taiwan) Corporation Limited in the conduct of its Taiwan regulated business for the information of its institutional and professional customers. It is not intended for and should not be distributed to retail customers in Taiwan. This recommendation material is for reference only. Investors should carefully consider their own investment risk. Investment results are the responsibility of the individual investor. HSBC Securities (Taiwan) Corporation Limited is regulated by the Securities and Futures Bureau. All enquires by recipients in Taiwan must be directed to your HSBC contact inTaiwan. If this report is received by a customer of an affiliate of HSBC, its provision to the recipient is subject to the terms of business in place between the recipient and such affiliate. This document is not and should not be construed as an offer to sell or the solicitation of an offer to purchase or subscribe for any investment. HSBC has based this document on information obtained from sources it believes to be reliable but which it has not independently verified; HSBC makes no guarantee, representation or warranty and accepts no responsibility or liability as to its accuracy or completeness. Expressions of opinion are those of the Research Division of HSBC only and are subject to change without notice. HSBC and its affiliates and/or their officers, directors and employees may have positions in any securities mentioned in this document (or in any related investment) and may from time to time add to or dispose of any such securities (or investment). HSBC and its affiliates may act as market maker or have assumed an underwriting commitment in the securities of companies discussed in this document (or in related investments), may sell them to or buy them from customers on a principal basis and may also perform or seek to perform investment banking or underwriting services for or relating to those companies. HSBC Research may not be distributed to the public media or quoted or used by the public media without the express written consent of HSBC Securities (Taiwan) Corporation Limited. Reports written by Taiwan-based analysts on non-Taiwan listed companies are not considered recommendations to buy or sell securities under Taiwan Stock Exchange Operational Regulations governing securities firms recommending trades in securities to customers and as such HSBC Securities (Taiwan) Corporation Limited may not execute transactions for clients in these securities/instruments. In the UK this report may only be distributed to persons of a kind described in Article 19(5) of the Financial Services and Markets Act 2000 (Financial Promotion) Order 2005. The protections afforded by the UK regulatory regime are available only to those dealing with a representative of HSBC Bank plc in the UK. HSBC Securities (USA) Inc. accepts responsibility for this research report prepared by its foreign affiliate. All U.S. persons receiving this report and wishing to effect transactions in any security discussed herein should do so with HSBC Securities (USA) Inc. in the United States and not with the foreign affiliate, the issuer of this report. Note, however, that HSBC Securities (USA) Inc. is not distributing this report and has not contributed to or participated in its preparation. In Korea, this publication is distributed by either The Hongkong and Shanghai Banking Corporation Limited, Seoul Securities Branch (“HBAP SLS”) or The Hongkong and Shanghai Banking Corporation Limited, Seoul Branch (“HBAP SEL”) for the general information of professional investors specified in Article 9 of the Financial Investment Services and Capital Markets Act (“FSCMA”). This publication is not a prospectus as defined in the FSCMA. It may not be further distributed in whole or in part for any purpose. Both HBAP SLS and HBAP SEL are regulated by the Financial Services Commission and the Financial Supervisory Service of Korea. In Singapore, this publication is distributed by The Hongkong and Shanghai Banking Corporation Limited, Singapore Branch for the general information of institutional investors or other persons specified in Sections 274 and 304 of the Securities and Futures Act (Chapter 289) (“SFA”) and accredited investors and other persons in accordance with the conditions specified in Sections 275 and 305 of the SFA. This publication is not a prospectus as defined in the SFA. It may not be further distributed in whole or in part for any purpose. The Hongkong and Shanghai Banking Corporation Limited Singapore Branch is regulated by the Monetary Authority of Singapore. Recipients in Singapore should contact a “Hongkong and Shanghai Banking Corporation Limited, Singapore Branch” representative in respect of any matters arising from, or in connection with this report. In Australia, this publication has been distributed by The Hongkong and Shanghai Banking Corporation Limited (ABN 65 117 925 970, AFSL 301737) for the general information of its “wholesale” customers (as defined in the Corporations Act 2001). Where distributed to retail customers, this research is distributed by HSBC Bank Australia Limited (AFSL No. 232595). These respective entities make no representations that the products or services mentioned in this document are available to persons in Australia or are necessarily suitable for any particular person or appropriate in accordance with local law. No consideration has been given to the particular investment objectives, financial situation or particular needs of any recipient. This publication is distributed in New Zealand by The Hongkong and Shanghai Banking Corporation Limited, New Zealand Branch incorporated in Hong Kong SAR. In Japan, this publication has been distributed by HSBC Securities (Japan) Limited. It may not be further distributed in whole or in part for any purpose.
In Canada, this document has been distributed by HSBC Bank Canada and/or its affiliates. Where this document contains market updates/overviews, or similar materials (collectively deemed “Commentary” in Canada although other affiliate jurisdictions may term “Commentary” as either “macro-research” or “research”), the Commentary is not an offer to sell, or a solicitation of an offer to sell or subscribe for, any financial product or instrument (including, without limitation, any currencies, securities, commodities or other financial instruments).
© Copyright 2013, HSBC Securities (Taiwan) Corporation Limited, ALL RIGHTS RESERVED. No part of this publication may be reproduced, stored in a retrieval system, or transmitted, on any form or by any means, electronic, mechanical, photocopying, recording, or otherwise, without the prior written permission of HSBC Securities (Taiwan) Corporation Limited. MICA (P) 118/04/2013, MICA (P) 068/04/2013 and MICA (P) 110/01/2013

abc
Global Stephen Howard Analyst, Global Sector Head +44 20 7991 6820 [email protected]
Europe Nicolas Cote-Colisson Analyst +44 20 7991 6826 [email protected]
Antonin Baudry Analyst +33 1 56 52 43 25 [email protected]
Dan Graham Analyst +44 20 7991 6326 [email protected]
Christopher Johnen Analyst +49 211 910 2852 [email protected]
Dominik Klarmann, CFA Analyst +49 211 910 2769 [email protected]
Luigi Minerva Analyst +44 20 7991 6928 [email protected]
Olivier Moral Analyst +33 1 5652 4322 [email protected]
Adam Rumley Analyst +44 20 7991 6819 [email protected]
Dhiraj Saraf, CFA Analyst +91 80 3001 3773 [email protected]
Americas Richard Dineen Analyst +1 212 525 6707 [email protected]
Global Emerging Markets (GEMs) Hervé Drouet Analyst +44 20 7991 6827 [email protected]
Jean Kaplan Analyst +44 20 7991 6831 [email protected]
Martin Mabbutt Analyst +44 20 7991 6457 [email protected]
Emerging Europe, Middle East & Africa (EMEA) Franca Di Silvestro Head of Research, SA +27 11 676 4223 [email protected]
Bülent Yurdagül Analyst +90 212 376 46 12 [email protected]
Asia Tucker Grinnan Analyst +852 2822 4686 [email protected]
Yogesh Aggarwal Analyst +91 22 2268 1246 [email protected]
Neale Anderson Analyst +852 2996 6716 [email protected]
Joyce Chen Analyst +8862 6631 2862 [email protected]
Luis Hilado Analyst +65 6658 0607 [email protected]
Hongsik Jo Analyst +822 3706 8774 [email protected]
Jenny Lai Head of Research, Taiwan +8862 6631 2860 [email protected]
Carrie Liu Analyst +8862 6631 2864 [email protected]
Steven C Pelayo Analyst +852 2822 4391 [email protected]
Ricky Seo Analyst +822 37068777 [email protected]
Rajiv Sharma Analyst +91 22 2268 1239 [email protected]
Brian Sohn Analyst +822 3706 8765 [email protected]
Jerry Tsai Analyst +8862 6631 2863 [email protected]
Chi Tsang Analyst +852 2822 2590 [email protected]
Rajesh Raman Analyst +65 6658 0608 [email protected]
Yolanda Wang Analyst +8862 6631 2867 [email protected]
Tse-yong Yao Analyst +8862 6631 2861 [email protected]
Specialist Sales
Tim Maunder-Taylor +44 20 7991 5006 [email protected]
Gareth Hollis +44 20 7991 5124 [email protected]
Kubilay Yalcin +49 211 9104880 [email protected]
Myles McMahon +852 2822 4676 [email protected]
Global Telecoms, Media & Technology Research Team