GLOBAL Commodities Comment -...
28
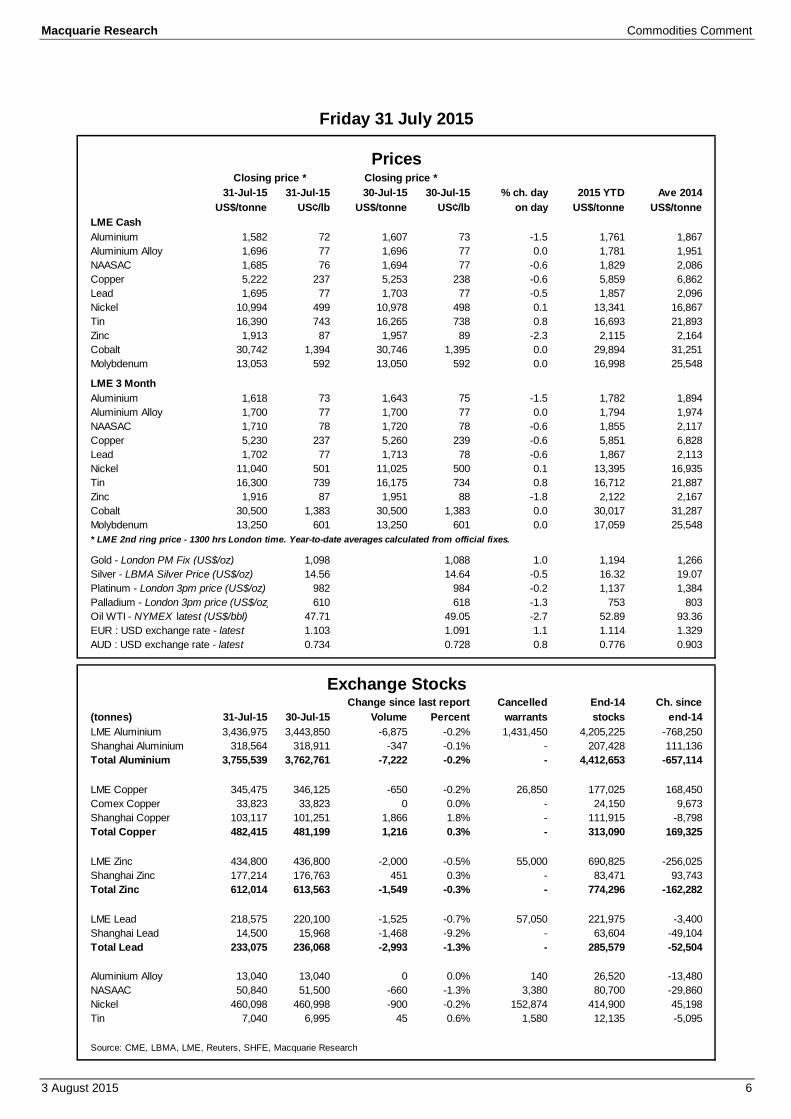
Please refer to page 26 for important disclosures and analyst certification, or on our website www.macquarie.com/research/disclosures . GLOBAL LME cash price % change US$/tonne day on day Aluminium 1,582 -1.5 Copper 5,222 -0.6 Lead 1,695 -0.5 Nickel 10,994 0.1 Tin 16,390 0.8 Zinc 1,913 -2.3 Cobalt 30,742 0.0 Molybdenum 13,053 0.0 Other prices % change day on day Gold (US$/oz) 1,098 1.0 Silver (US$/oz) 14.56 -0.5 Platinum (US$/oz) 982 -0.2 Palladium (US$/oz) 610 -1.3 Oil WTI 47.71 -2.7 USD:EUR exchange rate 1.103 1.1 AUD:USD exchange rate 0.734 0.8 LME/COMEX stocks Tonnes Change Aluminium 3,436,975 -6,875 LME copper 345,475 -650 Comex copper 33,823 0 Lead 218,575 -1,525 Nickel 460,098 -900 Tin 7,040 45 Zinc 434,800 -2,000 Source: LME, Comex, Nymex, SHFE, Metal Bulletin, Reuters, LBMA, Macquarie Research, July 2015 Articles of the Week Cutting deep into the cost curve Steel demand growth blunted, peak pig iron brought forward Trouble down pit: Copper mines begin to struggle Assessing the room for Chinese steel and aluminium export Analyst(s) Macquarie Capital Securities Limited Chen Shao +86 21 2412 9041 [email protected] Macquarie Capital (Europe) Limited Colin Hamilton +44 20 3037 4061 [email protected] Jim Lennon Senior Commodities Consultant +44 20 3037 4271 [email protected] Matthew Turner +44 20 3037 4340 [email protected] Stefan Ljubisavljevic +44 20 3037 4247 [email protected] Vivienne Lloyd +44 20 3037 4530 [email protected] 3 August 2015 Commodities Comment Chinese inventory overhang set to remain a problem over 3Q15 Weak demand from China has been a headwind for commodities in 1H15, and manifested itself in the form of rising industrial product inventories as we highlighted in February (here ) based on the NBS industrial enterprise database. With the NBS data for June coming out on Thursday, we review the situation in 2Q15. Industrial product inventory growth has slowed in April-June, but still ran much ahead of sales growth, suggesting downward pressure on industrial production and commodity demand from the ongoing inventory overhang will remain in place over 3Q15. Latest news After a week which included what was possibly the last FOMC meeting in nine years to keep interest rates unchanged, and US 2Q GDP with major revisions to previous quarters, it was a less well known US data series that caused the biggest impact on asset prices. Friday’s Employment Cost Index (ECI) showed total labour costs, adjusted for changes in the composition of the workforce, rose just 0.2% QoQ in 2Q, the slowest pace since records began in 1982. On that the dollar fell 1%, causing gold and other metals to rally strongly, as traders queried whether the Fed, which sees the labour costs as important and the ECI as a good indicator of them, could really raise rates in September as expected given such a backdrop. Some of the moves were faded as economists queried some aspects of the report. Nevertheless it means next Friday’s July Employment report, which provides information on wage growth (though not adjusted for compositional effects), will be more important than ever. Hot on the heels of First Quantum Minerals’ copper production downgrade, due to insufficient power supply from Zambian state utility Zesco, came the news on Friday that power distributor Copperbelt Energy Corp (which purchases power from Zesco) had informed miner customers including Vedanta, Glencore and Vale that supply would be reduced by 30% from midnight that day, local time. Later on Friday, however, it was reported that the planned supply cut had been delayed to allow talks to take place amid a government intervention. Total Zambian mine output is now (after FQM’s downgrade) expected to be around 838kt of copper this year, down from our initial, pre-disruption expectations of 984kt. We await further details to determine whether another downgrade to the country will be necessary. Antofagasta Minerals and Barrick Gold announced on Friday their agreement for the former to acquire 50% of the latter’s 120ktpa Zaldivar SXEW copper mine for $1bn. The acquisition will allow Antofagasta to maintain its position amongst the top ten copper miners to 2020, and we think more importantly, sustain and grow its position in the copper cathode market following the closure of its Michilla SXEW mine this year and declining output at its Centinela SXEW mine over the next few years. ANTO will assume operational control of the asset as part of the deal. The latest data from the China Iron and Steel Association shows crude steel output from its member mills over July 11-20 to have been 622mtpa – the lowest level since mid-May and 5.8% lower than the equivalent period in 2014. Meanwhile, inventories held by these mills also rose by 0.26mt to 16.64mt over the 10-day period, reflecting a likely drop in trader purchasing activity amid weaker end demand.
Transcript of GLOBAL Commodities Comment -...
Please refer to page 26 for important disclosures and analyst certification, or on our website
www.macquarie.com/research/disclosures.
GLOBAL
LME cash price
% change
US$/tonne day on day
Aluminium 1,582 -1.5
Copper 5,222 -0.6
Lead 1,695 -0.5
Nickel 10,994 0.1
Tin 16,390 0.8
Zinc 1,913 -2.3
Cobalt 30,742 0.0
Molybdenum 13,053 0.0
Other prices
% change
day on day
Gold (US$/oz) 1,098 1.0
Silver (US$/oz) 14.56 -0.5
Platinum (US$/oz) 982 -0.2
Palladium (US$/oz) 610 -1.3
Oil WTI 47.71 -2.7
USD:EUR exchange rate 1.103 1.1
AUD:USD exchange rate 0.734 0.8
LME/COMEX stocks
Tonnes Change
Aluminium 3,436,975 -6,875
LME copper 345,475 -650
Comex copper 33,823 0
Lead 218,575 -1,525
Nickel 460,098 -900
Tin 7,040 45
Zinc 434,800 -2,000
Source: LME, Comex, Nymex, SHFE, Metal
Bulletin, Reuters, LBMA, Macquarie Research,
July 2015
Articles of the Week
Cutting deep into the cost curve
Steel demand growth blunted, peak pig iron
brought forward
Trouble down pit: Copper mines begin to
struggle
Assessing the room for Chinese steel and
aluminium export
Analyst(s) Macquarie Capital Securities Limited Chen Shao +86 21 2412 9041 [email protected] Macquarie Capital (Europe) Limited Colin Hamilton +44 20 3037 4061 [email protected] Jim Lennon Senior Commodities Consultant +44 20 3037 4271 [email protected] Matthew Turner +44 20 3037 4340 [email protected] Stefan Ljubisavljevic +44 20 3037 4247 [email protected] Vivienne Lloyd +44 20 3037 4530 [email protected]
3 August 2015
Commodities Comment Chinese inventory overhang set to remain a problem over 3Q15 Weak demand from China has been a headwind for commodities in 1H15,
and manifested itself in the form of rising industrial product inventories as we
highlighted in February (here) based on the NBS industrial enterprise
database. With the NBS data for June coming out on Thursday, we review the
situation in 2Q15. Industrial product inventory growth has slowed in April-June,
but still ran much ahead of sales growth, suggesting downward pressure on
industrial production and commodity demand from the ongoing inventory
overhang will remain in place over 3Q15.
Latest news
After a week which included what was possibly the last FOMC meeting in
nine years to keep interest rates unchanged, and US 2Q GDP with major
revisions to previous quarters, it was a less well known US data series
that caused the biggest impact on asset prices. Friday’s Employment Cost
Index (ECI) showed total labour costs, adjusted for changes in the
composition of the workforce, rose just 0.2% QoQ in 2Q, the slowest pace
since records began in 1982. On that the dollar fell 1%, causing gold and
other metals to rally strongly, as traders queried whether the Fed, which
sees the labour costs as important and the ECI as a good indicator of
them, could really raise rates in September as expected given such a
backdrop. Some of the moves were faded as economists queried some
aspects of the report. Nevertheless it means next Friday’s July
Employment report, which provides information on wage growth (though
not adjusted for compositional effects), will be more important than ever.
Hot on the heels of First Quantum Minerals’ copper production downgrade,
due to insufficient power supply from Zambian state utility Zesco, came the
news on Friday that power distributor Copperbelt Energy Corp (which
purchases power from Zesco) had informed miner customers including
Vedanta, Glencore and Vale that supply would be reduced by 30% from
midnight that day, local time. Later on Friday, however, it was reported that
the planned supply cut had been delayed to allow talks to take place amid a
government intervention. Total Zambian mine output is now (after FQM’s
downgrade) expected to be around 838kt of copper this year, down from our
initial, pre-disruption expectations of 984kt. We await further details to
determine whether another downgrade to the country will be necessary.
Antofagasta Minerals and Barrick Gold announced on Friday their agreement
for the former to acquire 50% of the latter’s 120ktpa Zaldivar SXEW copper
mine for $1bn. The acquisition will allow Antofagasta to maintain its position
amongst the top ten copper miners to 2020, and we think more importantly,
sustain and grow its position in the copper cathode market following the
closure of its Michilla SXEW mine this year and declining output at its
Centinela SXEW mine over the next few years. ANTO will assume operational
control of the asset as part of the deal.
The latest data from the China Iron and Steel Association shows crude steel
output from its member mills over July 11-20 to have been 622mtpa – the
lowest level since mid-May and 5.8% lower than the equivalent period in
2014. Meanwhile, inventories held by these mills also rose by 0.26mt to
16.64mt over the 10-day period, reflecting a likely drop in trader purchasing
activity amid weaker end demand.

Macquarie Research Commodities Comment
3 August 2015 2
Inventory overhang to remain for China in 3Q15
Weak demand from China has been a headwind for commodities in 1H15, and manifested itself in
the form of rising industrial product inventories as we highlighted in February (here) based on the
NBS industrial enterprise database. With the NBS data for June coming out on Thursday, we
review the situation in 2Q15. Industrial product inventory growth has slowed in April-June, but still
ran much ahead of sales growth, suggesting downward pressure on industrial production and
commodity demand from the ongoing inventory overhang will remain in place over 3Q15.
The lack of reliable and comprehensive inventory data has been a major obstacle to analysts’
attempts to gauge China’s industrial product inventory. We’ve taken an innovative approach by
looking at the difference between inventory growth and sales growth of industrial sectors (referred
to as “relative inventory growth” in this note) with the straightforward theory that higher/lower
growth of inventory than sales conceptually corresponds to restocking/destocking.
The results have been supportive – we do see a strong negative correlation between relative
industrial inventory growth and Industrial Production (IP) growth (Fig 1); on a sectoral level, our
indicator also seems to reflect reality well, e.g. the relative inventory growth for ferrous mining
industry closely tracking a survey result of domestic iron ore mine inventory (Fig 2).
Fig 1 Relative inventory growth correlates well with the overall economy…
Fig 2 …and sectoral inventory indicators
Source: CEIC, Macquarie Research, July 2015 Source: CEIC, MySteel, Macquarie Research, July 2015
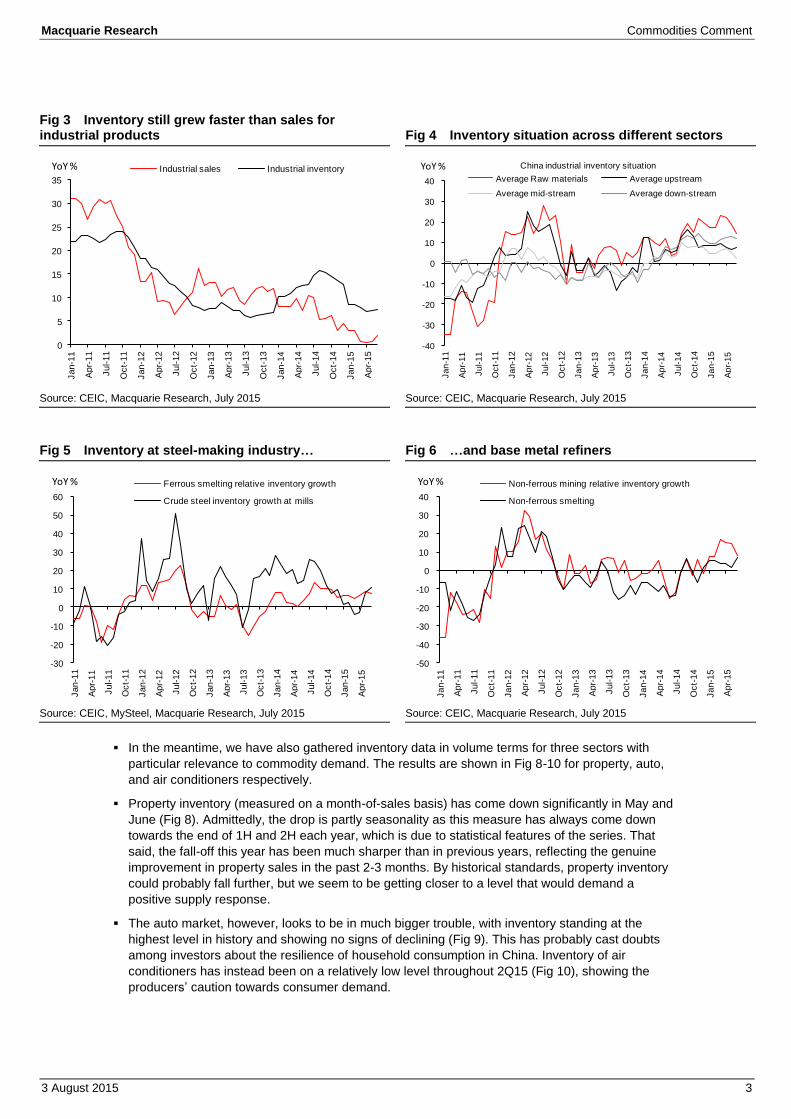
So as shown in Fig 1, relative industrial inventory growth remained positive in 2Q15, suggesting
industrial companies were still building up inventory compared with their sales. This is not to say
inventory growth per se was still rising; actually, both inventory and sales growth has been
declining, but the former still grew faster (Fig 3). In other words, real demand for industrial
products has been even weaker than the sluggish IP growth.
While the general trends are largely the same across different industrial sectors for relative
inventory growth, the further towards the upstream of industrial chains, the more volatile relative
inventory growth tends to be. In recent months, we have also seen a sharper drop in our inventory
indicator for raw materials than for other sectors (Fig 4), which is in line with the fact that the raw
material producers have seen larger price drops than other industrial sectors owing to the
whiplash effect from weaker downstream demand (and of course, lower prices).
More specifically, besides the falling relative inventory growth at iron ore mines, relative inventory
at ferrous smelting (which is largely steel-making) has remained low in 2Q15, and that at non-
ferrous smelting (i.e. base metal refining) hit a peak in January-February and slowed down since
then. Coal inventory at miners has largely stopped rising in absolute terms, but given double-digit
negative sales growth, the need for destocking remains (Fig 7). The conditions for a few other
sectors are shown at the end of this note.
-1.0
-0.5
0.0
0.5
1.0
1.5
2.0
-15
-10
-5
0
5
10
15
Ja
n-1
1
Apr-
11
Ju
l-11
Oct-
11
Ja
n-1
2
Apr-
12
Ju
l-12
Oct-
12
Ja
n-1
3
Apr-
13
Ju
l-13
Oct-
13
Ja
n-1
4
Apr-
14
Ju
l-14
Oct-
14
Ja
n-1
5
Apr-
15
Industrial inventory relative growth
Nominal IP, MoM - RHS
YoY % %
0
1
2
3
4
5
6
7
8
-20
-10
0
10
20
30
40
Ju
l-1
2
Sep
-12
No
v-1
2
Ja
n-1
3
Ma
r-13
Ma
y-1
3
Ju
l-1
3
Sep
-13
No
v-1
3
Ja
n-1
4
Ma
r-14
Ma
y-1
4
Ju
l-1
4
Sep
-14
Nov
-14
Ja
n-1
5
Ma
r-15
Ma
y-1
5
Ferrous mining relative inventory growth - LHS
Domestic iron mine inventory - days of consumption by domestic mills
YoY % Days
Macquarie Research Commodities Comment
3 August 2015 3
Fig 3 Inventory still grew faster than sales for industrial products
Fig 4 Inventory situation across different sectors
Source: CEIC, Macquarie Research, July 2015 Source: CEIC, Macquarie Research, July 2015
Fig 5 Inventory at steel-making industry… Fig 6 …and base metal refiners
Source: CEIC, MySteel, Macquarie Research, July 2015 Source: CEIC, Macquarie Research, July 2015
In the meantime, we have also gathered inventory data in volume terms for three sectors with
particular relevance to commodity demand. The results are shown in Fig 8-10 for property, auto,
and air conditioners respectively.
Property inventory (measured on a month-of-sales basis) has come down significantly in May and
June (Fig 8). Admittedly, the drop is partly seasonality as this measure has always come down
towards the end of 1H and 2H each year, which is due to statistical features of the series. That
said, the fall-off this year has been much sharper than in previous years, reflecting the genuine
improvement in property sales in the past 2-3 months. By historical standards, property inventory
could probably fall further, but we seem to be getting closer to a level that would demand a
positive supply response.
The auto market, however, looks to be in much bigger trouble, with inventory standing at the
highest level in history and showing no signs of declining (Fig 9). This has probably cast doubts
among investors about the resilience of household consumption in China. Inventory of air
conditioners has instead been on a relatively low level throughout 2Q15 (Fig 10), showing the
producers’ caution towards consumer demand.
0
5
10
15
20
25
30
35
Ja
n-1
1
Ap
r-11
Ju
l-11
Oct-
11
Jan
-12
Apr-
12
Jul-
12
Oct-
12
Ja
n-1
3
Ap
r-13
Ju
l-13
Oct-
13
Ja
n-1
4
Ap
r-14
Ju
l-14
Oct-
14
Jan
-15
Apr-
15
Industrial sales Industrial inventoryYoY %
-40
-30
-20
-10
0
10
20
30
40
Jan-1
1
Ap
r-1
1
Jul-1
1
Oc
t-1
1
Jan-1
2
Ap
r-1
2
Jul-1
2
Oc
t-1
2
Jan-1
3
Ap
r-1
3
Ju
l-1
3
Oc
t-1
3
Jan-1
4
Ap
r-1
4
Jul-1
4
Oc
t-1
4
Ja
n-1
5
Ap
r-1
5
Average Raw materials Average upstream
Average mid-stream Average down-stream
YoY % China industrial inventory situation
-30
-20
-10
0
10
20
30
40
50
60
Ja
n-1
1
Ap
r-1
1
Ju
l-1
1
Oc
t-1
1
Ja
n-1
2
Ap
r-1
2
Ju
l-1
2
Oc
t-1
2
Ja
n-1
3
Ap
r-1
3
Ju
l-1
3
Oc
t-1
3
Ja
n-1
4
Ap
r-1
4
Ju
l-1
4
Oc
t-1
4
Ja
n-1
5
Ap
r-1
5
Ferrous smelting relative inventory growth
Crude steel inventory growth at mills
YoY %
-50
-40
-30
-20
-10
0
10
20
30
40
Ja
n-1
1
Apr-
11
Ju
l-11
Oct-
11
Ja
n-1
2
Apr-
12
Ju
l-12
Oct-
12
Ja
n-1
3
Apr-
13
Ju
l-13
Oct-
13
Ja
n-1
4
Apr-
14
Ju
l-14
Oct-
14
Ja
n-1
5
Apr-
15
Non-ferrous mining relative inventory growth
Non-ferrous smelting
YoY %

Macquarie Research Commodities Comment
3 August 2015 4
Fig 7 Coal inventory still too high on a relative basis
Fig 8 Property inventory dropped significantly on stronger sales
Source: CEIC, Sxcoal, Macquarie Research, July 2015 Source: CEIC, Macquarie Research, July 2015
Fig 9 Auto makers have too much inventory… Fig 10 …while A/C makers are much more cautious
Source: Wind, Macquarie Research, July 2015 Source: Wind, Macquarie Research, July 2015
Coming back to a more general perspective, inventory levels tend to be pro-cyclical – weak/strong
end-user demand doesn’t only directly reduce/increase the need for finished product inventory as
a buffer for fluctuations of sales, but also suppresses/boosts prices and the market value of
inventory, which pushes companies to further lower/raise inventory levels.
The implication is that major inventory cycles tend to coincide with general economic cycles and
exacerbate the latter. In China’s current case, industrial companies are facing the double whammy
of weak demand and relatively high inventory, and such vicious cycles are usually not easy to
break.
Another implication is that inventory cycles could be indicative of the overall economic trends.
From this angle, Fig 1 suggests the current level of relative inventory growth is still too high to be a
positive factor for economic growth and commodity demand. As it takes time for relative inventory
growth to be dragged towards/below zero, it seems likely that the inventory overhang will remain a
negative factor for commodities’ outlook in 3Q15.
-60
-40
-20
0
20
40
60
80
100
120
-40
-30
-20
-10
0
10
20
30
40
50
Ja
n-1
1
Apr-
11
Ju
l-11
Oct-
11
Ja
n-1
2
Apr-
12
Ju
l-12
Oct-
12
Ja
n-1
3
Apr-
13
Ju
l-13
Oct-
13
Ja
n-1
4
Apr-
14
Ju
l-14
Oct-
14
Ja
n-1
5
Apr-
15
Coal ming relative inventory growth
Coal stock at key state-owned mines - RHS
YoY % YoY %
0
1
2
3
4
5
6
7
8
9
Jan
Fe
b
Mar
Ap
r
May
Jun
Ju
l
Aug
Sep
Oc
t
Nov
Dec
2012 2013 2014 2015
Ratio between property inventory and monthly sales
0.0
0.1
0.2
0.3
0.4
0.5
0.6
0.7
0.8
0.9
Ja
n
Fe
b
Ma
r
Apr
May
Jun
Jul
Au
g
Se
p
Oct
Nov
Dec
2012 2013 2014 2015
Ratio between auto inventory and monthly sales
0.0
0.2
0.4
0.6
0.8
1.0
1.2
1.4
1.6
Ja
n
Fe
b
Ma
r
Apr
May
Jun
Jul
Au
g
Se
p
Oct
Nov
Dec
2012 2013 2014 2015
Ratio between A/C inventory and monthly sales

Macquarie Research Commodities Comment
3 August 2015 5
Relative inventory growth of some other key sectors, %
Fig 11 Chemical products Fig 12 Metal and non-metal materials
Source: CEIC, Macquarie Research, July 2015 Source: CEIC, Macquarie Research, July 2015
Fig 13 Machinery Fig 14 Electronics and electric products
Source: CEIC, Macquarie Research, July 2015 Source: CEIC, Macquarie Research, July 2015
Fig 15 Auto and transport equipment Fig 16 Food and Furniture
Source: CEIC, Macquarie Research, July 2015 Source: CEIC, Macquarie Research, July 2015
-20
-15
-10
-5
0
5
10
15
Ja
n-1
1
Apr-
11
Ju
l-1
1
Oct-
11
Ja
n-1
2
Apr-
12
Ju
l-1
2
Oct-
12
Ja
n-1
3
Apr-
13
Ju
l-1
3
Oct-
13
Ja
n-1
4
Apr-
14
Ju
l-1
4
Oct-
14
Ja
n-1
5
Apr-
15
Chemical products Rubber and plasticYoY %
-30
-25
-20
-15
-10
-5
0
5
10
15
Ja
n-1
1
Apr-
11
Ju
l-1
1
Oct-
11
Ja
n-1
2
Apr-
12
Ju
l-1
2
Oct-
12
Ja
n-1
3
Apr-
13
Ju
l-1
3
Oct-
13
Ja
n-1
4
Apr-
14
Ju
l-1
4
Oct-
14
Ja
n-1
5
Apr-
15
Metal products Non-metal mining productsYoY %
-25
-20
-15
-10
-5
0
5
10
15
20
Ja
n-1
1
Apr-
11
Ju
l-11
Oct-
11
Ja
n-1
2
Apr-
12
Ju
l-12
Oct-
12
Ja
n-1
3
Apr-
13
Ju
l-13
Oct-
13
Ja
n-1
4
Apr-
14
Ju
l-14
Oct-
14
Ja
n-1
5
Apr-
15
General equipment Special equipmentYoY %
-20
-15
-10
-5
0
5
10
15
20
25
30
Ja
n-1
1
Ap
r-1
1
Ju
l-1
1
Oc
t-1
1
Ja
n-1
2
Ap
r-1
2
Ju
l-1
2
Oc
t-1
2
Ja
n-1
3
Ap
r-1
3
Ju
l-1
3
Oc
t-1
3
Ja
n-1
4
Ap
r-1
4
Ju
l-1
4
Oc
t-1
4
Ja
n-1
5
Ap
r-1
5
Electric equipment Computer and electronic productsYoY %
-30
-20
-10
0
10
20
30
Ja
n-1
1
Ap
r-1
1
Ju
l-1
1
Oc
t-1
1
Ja
n-1
2
Ap
r-1
2
Ju
l-1
2
Oc
t-1
2
Ja
n-1
3
Ap
r-1
3
Ju
l-1
3
Oc
t-1
3
Ja
n-1
4
Ap
r-1
4
Ju
l-1
4
Oc
t-1
4
Ja
n-1
5
Ap
r-1
5
Auto production Other transport equipmentYoY %
-25
-20
-15
-10
-5
0
5
10
15
20
Ja
n-1
1
Apr-
11
Ju
l-11
Oct-
11
Ja
n-1
2
Apr-
12
Ju
l-12
Oct-
12
Ja
n-1
3
Apr-
13
Ju
l-13
Oct-
13
Ja
n-1
4
Apr-
14
Ju
l-14
Oct-
14
Ja
n-1
5
Apr-
15
Food FurnitureYoY %
Macquarie Research Commodities Comment
3 August 2015 6
Closing price * Closing price *
31-Jul-15 31-Jul-15 30-Jul-15 30-Jul-15 % ch. day 2015 YTD Ave 2014
US$/tonne US¢/lb US$/tonne US¢/lb on day US$/tonne US$/tonne
LME Cash
Aluminium 1,582 72 1,607 73 -1.5 1,761 1,867
Aluminium Alloy 1,696 77 1,696 77 0.0 1,781 1,951
NAASAC 1,685 76 1,694 77 -0.6 1,829 2,086
Copper 5,222 237 5,253 238 -0.6 5,859 6,862
Lead 1,695 77 1,703 77 -0.5 1,857 2,096
Nickel 10,994 499 10,978 498 0.1 13,341 16,867
Tin 16,390 743 16,265 738 0.8 16,693 21,893
Zinc 1,913 87 1,957 89 -2.3 2,115 2,164
Cobalt 30,742 1,394 30,746 1,395 0.0 29,894 31,251
Molybdenum 13,053 592 13,050 592 0.0 16,998 25,548
LME 3 Month
Aluminium 1,618 73 1,643 75 -1.5 1,782 1,894
Aluminium Alloy 1,700 77 1,700 77 0.0 1,794 1,974
NAASAC 1,710 78 1,720 78 -0.6 1,855 2,117
Copper 5,230 237 5,260 239 -0.6 5,851 6,828
Lead 1,702 77 1,713 78 -0.6 1,867 2,113
Nickel 11,040 501 11,025 500 0.1 13,395 16,935
Tin 16,300 739 16,175 734 0.8 16,712 21,887
Zinc 1,916 87 1,951 88 -1.8 2,122 2,167
Cobalt 30,500 1,383 30,500 1,383 0.0 30,017 31,287
Molybdenum 13,250 601 13,250 601 0.0 17,059 25,548
* LME 2nd ring price - 1300 hrs London time. Year-to-date averages calculated from official fixes.
1,098 1,088 1.0 1,194 1,266
14.56 14.64 -0.5 16.32 19.07
982 984 -0.2 1,137 1,384
610 618 -1.3 753 803
47.71 49.05 -2.7 52.89 93.36
1.103 1.091 1.1 1.114 1.329
0.734 0.728 0.8 0.776 0.903
Change since last report Cancelled End-14 Ch. since
(tonnes) 31-Jul-15 30-Jul-15 Volume Percent warrants stocks end-14
LME Aluminium 3,436,975 3,443,850 -6,875 -0.2% 1,431,450 4,205,225 -768,250
Shanghai Aluminium 318,564 318,911 -347 -0.1% - 207,428 111,136
Total Aluminium 3,755,539 3,762,761 -7,222 -0.2% - 4,412,653 -657,114
LME Copper 345,475 346,125 -650 -0.2% 26,850 177,025 168,450
Comex Copper 33,823 33,823 0 0.0% - 24,150 9,673
Shanghai Copper 103,117 101,251 1,866 1.8% - 111,915 -8,798
Total Copper 482,415 481,199 1,216 0.3% - 313,090 169,325
LME Zinc 434,800 436,800 -2,000 -0.5% 55,000 690,825 -256,025
Shanghai Zinc 177,214 176,763 451 0.3% - 83,471 93,743
Total Zinc 612,014 613,563 -1,549 -0.3% - 774,296 -162,282
LME Lead 218,575 220,100 -1,525 -0.7% 57,050 221,975 -3,400
Shanghai Lead 14,500 15,968 -1,468 -9.2% - 63,604 -49,104
Total Lead 233,075 236,068 -2,993 -1.3% - 285,579 -52,504
Aluminium Alloy 13,040 13,040 0 0.0% 140 26,520 -13,480
NASAAC 50,840 51,500 -660 -1.3% 3,380 80,700 -29,860
Nickel 460,098 460,998 -900 -0.2% 152,874 414,900 45,198
Tin 7,040 6,995 45 0.6% 1,580 12,135 -5,095
Source: CME, LBMA, LME, Reuters, SHFE, Macquarie Research
Exchange Stocks
Prices
Gold - London PM Fix (US$/oz)
Silver - LBMA Silver Price (US$/oz)
Platinum - London 3pm price (US$/oz)
Palladium - London 3pm price (US$/oz)
Oil WTI - NYMEX latest (US$/bbl)
EUR : USD exchange rate - latest
AUD : USD exchange rate - latest
Friday 31 July 2015

Macquarie Research Commodities Comment
3 August 2015 7
Summary of changes, week ended 31 July LME metal prices (%) Cash 3-Month
Aluminium -1.3% -1.5%
Aluminium Alloy -1.1% -0.9%
NAASAC -0.1% 0.0%
Copper -0.5% -0.6%
Lead -0.5% -1.0%
Nickel -2.3% -2.3%
Tin 6.1% 5.8%
Zinc -1.7% -1.8%
Cobalt -1.0% -0.8%
Molybdenum 0.1% 0.0%
Other prices (%) Gold 1.6%
Silver 0.5% Platinum -0.3% Palladium -1.6% Oil WTI -0.6% EUR : USD exchange rate 0.5% AUD : USD exchange rate 0.8%
Exchange stocks tonnes %
LME aluminium -43,525 -1.3%
Shanghai aluminium -347 -0.1%
Total aluminium -43,872 -1.2%
LME copper 2,225 0.6%
Comex copper -338 -1.0%
Shanghai copper 1,866 1.8%
Total copper 3,753 0.8%
LME zinc -10,700 -2.4%
Shanghai zinc 451 0.3%
Total zinc -10,249 -1.6%
LME lead 6,850 3.2%
Shanghai lead -1,468 -9.2%
Total lead 5,382 2.4%
LME aluminium alloy 0 0.0%
LME NAASAC -2,980 -5.5%
LME nickel 6,768 1.5%
LME tin -95 -1.3%
Source: CME, LBMA, LME, Reuters, SHFE, Macquarie Research, July 2015

Macquarie Research Commodities Comment
3 August 2015 8
Macquarie metals and bulk commodity price forecasts
Source: LME, Platts, CRU, Metal Bulletin, Macquarie Research, July 2015
2014 2015 2015 2015 2015 2015 2016 2017 2018 2019 2020
Unit CY Q1 Q2 Q3 Q4 CY CY CY CY CY CY LT $2015
Copper $/tonne 6,862 5,818 6,043 5,850 5,900 5,903 6,013 6,475 7,263 8,050 8,413 6,944
Aluminium $/tonne 1,867 1,800 1,765 1,660 1,690 1,729 1,700 1,750 1,800 1,800 1,900 1,950
Zinc $/tonne 2,164 2,080 2,190 2,070 2,150 2,122 2,413 3,020 3,250 3,315 3,265 2,600
Nickel $/tonne 16,867 14,338 13,008 12,000 13,500 13,211 18,375 22,500 24,000 25,000 25,000 24,000
Lead $/tonne 2,096 1,806 1,942 1,880 1,900 1,882 1,955 2,103 1,988 1,980 2,070 1,950
Tin $/tonne 21,893 18,392 15,586 15,250 15,250 16,120 15,750 16,500 17,750 19,000 20,000 19,000
Manganese ore $/mtu CIF 4.5 3.7 2.8 2.8 3.0 3.1 3.3 3.5 4.0 4.3 4.5 4.3
FeCr (EU contract) c/lb 119 108 108 108 112 109 122 129 141 142 142 126
Molybdenum oxide $/lb 11 9 8 8 9 8 9 11 12 13 13 13
Cobalt (99.8%) $/lb 14 14 14 14 14 14 15 16 16 16 16 13
Steel - Average HRC $/tonne 598 481 429 434 426 443 455 474 493 503 513 590
Steel Scrap - average #1HMS $/tonne 327 244 245 227 247 240 239 217 237 237 237 252
Iron ore - Australian fines c/mtu fob 142 93 85 69 77 81 80 90 101 107 105 113
Iron ore - Australian lump c/mtu fob 166 120 106 90 98 103 102 112 126 132 130 133
Spot 62% Fe iron ore China $/t cfr 97 63 58 48 54 56 56 63 70 75 75 80
Thermal coal - Australian Spot $/t fob 71 66 60 55 53 58 55 59 65 70 70 70
Thermal coal - S.African Spot $/t fob 72 62 61 56 54 58 57 60 72 72 72 70
Thermal coal - JFY contract $/t fob 82 82 68 68 68 68 63 68 73 78 78 75
Hard coking coal $/t fob 126 117 110 93 95 104 100 110 125 135 145 145
Semi-soft coking coal $/t fob 93 86 81 74 69 78 68 74 84 91 98 95 LV PCI coal $/t fob 104 99 93 73 81 86 80 94 104 111 118 110
Coke - China export spot $/t fob 195 174 152 160 160 161 170 170 170 170 170 210
Gold $/oz 1,266 1,218 1,192 1,075 1,125 1,152 1,163 1,256 1,344 1,400 1,400 1,250
Silver $/oz 19 17 16 15 16 16 17 19 22 23 23 18
Platinum $/oz 1,384 1,192 1,125 1,225 1,300 1,211 1,363 1,438 1,475 1,475 1,475 1,450
Palladium $/oz 803 786 758 835 875 814 913 994 994 950 950 800
Uranium spot $/lb 33 38 37 36 36 37 39 44 48 53 53 50
Macquarie Research Commodities Comment
3 August 2015 9
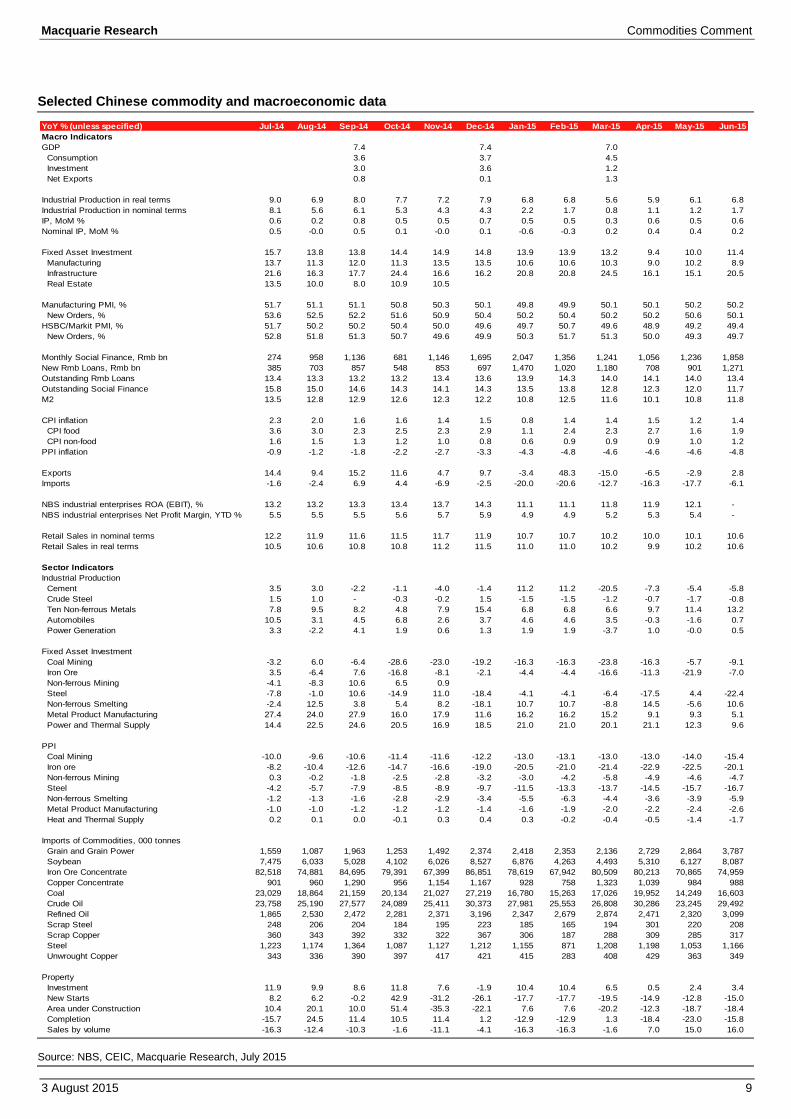
Selected Chinese commodity and macroeconomic data
Source: NBS, CEIC, Macquarie Research, July 2015
YoY % (unless specified) Jul-14 Aug-14 Sep-14 Oct-14 Nov-14 Dec-14 Jan-15 Feb-15 Mar-15 Apr-15 May-15 Jun-15
Macro Indicators
GDP 7.4 7.4 7.0
Consumption 3.6 3.7 4.5
Investment 3.0 3.6 1.2
Net Exports 0.8 0.1 1.3
Industrial Production in real terms 9.0 6.9 8.0 7.7 7.2 7.9 6.8 6.8 5.6 5.9 6.1 6.8
Industrial Production in nominal terms 8.1 5.6 6.1 5.3 4.3 4.3 2.2 1.7 0.8 1.1 1.2 1.7
IP, MoM % 0.6 0.2 0.8 0.5 0.5 0.7 0.5 0.5 0.3 0.6 0.5 0.6
Nominal IP, MoM % 0.5 -0.0 0.5 0.1 -0.0 0.1 -0.6 -0.3 0.2 0.4 0.4 0.2
Fixed Asset Investment 15.7 13.8 13.8 14.4 14.9 14.8 13.9 13.9 13.2 9.4 10.0 11.4
Manufacturing 13.7 11.3 12.0 11.3 13.5 13.5 10.6 10.6 10.3 9.0 10.2 8.9
Infrastructure 21.6 16.3 17.7 24.4 16.6 16.2 20.8 20.8 24.5 16.1 15.1 20.5
Real Estate 13.5 10.0 8.0 10.9 10.5
Manufacturing PMI, % 51.7 51.1 51.1 50.8 50.3 50.1 49.8 49.9 50.1 50.1 50.2 50.2
New Orders, % 53.6 52.5 52.2 51.6 50.9 50.4 50.2 50.4 50.2 50.2 50.6 50.1
HSBC/Markit PMI, % 51.7 50.2 50.2 50.4 50.0 49.6 49.7 50.7 49.6 48.9 49.2 49.4
New Orders, % 52.8 51.8 51.3 50.7 49.6 49.9 50.3 51.7 51.3 50.0 49.3 49.7
Monthly Social Finance, Rmb bn 274 958 1,136 681 1,146 1,695 2,047 1,356 1,241 1,056 1,236 1,858
New Rmb Loans, Rmb bn 385 703 857 548 853 697 1,470 1,020 1,180 708 901 1,271
Outstanding Rmb Loans 13.4 13.3 13.2 13.2 13.4 13.6 13.9 14.3 14.0 14.1 14.0 13.4
Outstanding Social Finance 15.8 15.0 14.6 14.3 14.1 14.3 13.5 13.8 12.8 12.3 12.0 11.7
M2 13.5 12.8 12.9 12.6 12.3 12.2 10.8 12.5 11.6 10.1 10.8 11.8
CPI inflation 2.3 2.0 1.6 1.6 1.4 1.5 0.8 1.4 1.4 1.5 1.2 1.4
CPI food 3.6 3.0 2.3 2.5 2.3 2.9 1.1 2.4 2.3 2.7 1.6 1.9
CPI non-food 1.6 1.5 1.3 1.2 1.0 0.8 0.6 0.9 0.9 0.9 1.0 1.2
PPI inflation -0.9 -1.2 -1.8 -2.2 -2.7 -3.3 -4.3 -4.8 -4.6 -4.6 -4.6 -4.8
Exports 14.4 9.4 15.2 11.6 4.7 9.7 -3.4 48.3 -15.0 -6.5 -2.9 2.8
Imports -1.6 -2.4 6.9 4.4 -6.9 -2.5 -20.0 -20.6 -12.7 -16.3 -17.7 -6.1
NBS industrial enterprises ROA (EBIT), % 13.2 13.2 13.3 13.4 13.7 14.3 11.1 11.1 11.8 11.9 12.1 -
NBS industrial enterprises Net Profit Margin, YTD % 5.5 5.5 5.5 5.6 5.7 5.9 4.9 4.9 5.2 5.3 5.4 -
Retail Sales in nominal terms 12.2 11.9 11.6 11.5 11.7 11.9 10.7 10.7 10.2 10.0 10.1 10.6
Retail Sales in real terms 10.5 10.6 10.8 10.8 11.2 11.5 11.0 11.0 10.2 9.9 10.2 10.6
Sector Indicators
Industrial Production
Cement 3.5 3.0 -2.2 -1.1 -4.0 -1.4 11.2 11.2 -20.5 -7.3 -5.4 -5.8
Crude Steel 1.5 1.0 - -0.3 -0.2 1.5 -1.5 -1.5 -1.2 -0.7 -1.7 -0.8
Ten Non-ferrous Metals 7.8 9.5 8.2 4.8 7.9 15.4 6.8 6.8 6.6 9.7 11.4 13.2
Automobiles 10.5 3.1 4.5 6.8 2.6 3.7 4.6 4.6 3.5 -0.3 -1.6 0.7
Power Generation 3.3 -2.2 4.1 1.9 0.6 1.3 1.9 1.9 -3.7 1.0 -0.0 0.5
Fixed Asset Investment
Coal Mining -3.2 6.0 -6.4 -28.6 -23.0 -19.2 -16.3 -16.3 -23.8 -16.3 -5.7 -9.1
Iron Ore 3.5 -6.4 7.6 -16.8 -8.1 -2.1 -4.4 -4.4 -16.6 -11.3 -21.9 -7.0
Non-ferrous Mining -4.1 -8.3 10.6 6.5 0.9
Steel -7.8 -1.0 10.6 -14.9 11.0 -18.4 -4.1 -4.1 -6.4 -17.5 4.4 -22.4
Non-ferrous Smelting -2.4 12.5 3.8 5.4 8.2 -18.1 10.7 10.7 -8.8 14.5 -5.6 10.6
Metal Product Manufacturing 27.4 24.0 27.9 16.0 17.9 11.6 16.2 16.2 15.2 9.1 9.3 5.1
Power and Thermal Supply 14.4 22.5 24.6 20.5 16.9 18.5 21.0 21.0 20.1 21.1 12.3 9.6
PPI
Coal Mining -10.0 -9.6 -10.6 -11.4 -11.6 -12.2 -13.0 -13.1 -13.0 -13.0 -14.0 -15.4
Iron ore -8.2 -10.4 -12.6 -14.7 -16.6 -19.0 -20.5 -21.0 -21.4 -22.9 -22.5 -20.1
Non-ferrous Mining 0.3 -0.2 -1.8 -2.5 -2.8 -3.2 -3.0 -4.2 -5.8 -4.9 -4.6 -4.7
Steel -4.2 -5.7 -7.9 -8.5 -8.9 -9.7 -11.5 -13.3 -13.7 -14.5 -15.7 -16.7
Non-ferrous Smelting -1.2 -1.3 -1.6 -2.8 -2.9 -3.4 -5.5 -6.3 -4.4 -3.6 -3.9 -5.9
Metal Product Manufacturing -1.0 -1.0 -1.2 -1.2 -1.2 -1.4 -1.6 -1.9 -2.0 -2.2 -2.4 -2.6
Heat and Thermal Supply 0.2 0.1 0.0 -0.1 0.3 0.4 0.3 -0.2 -0.4 -0.5 -1.4 -1.7
Imports of Commodities, 000 tonnes
Grain and Grain Power 1,559 1,087 1,963 1,253 1,492 2,374 2,418 2,353 2,136 2,729 2,864 3,787
Soybean 7,475 6,033 5,028 4,102 6,026 8,527 6,876 4,263 4,493 5,310 6,127 8,087
Iron Ore Concentrate 82,518 74,881 84,695 79,391 67,399 86,851 78,619 67,942 80,509 80,213 70,865 74,959
Copper Concentrate 901 960 1,290 956 1,154 1,167 928 758 1,323 1,039 984 988
Coal 23,029 18,864 21,159 20,134 21,027 27,219 16,780 15,263 17,026 19,952 14,249 16,603
Crude Oil 23,758 25,190 27,577 24,089 25,411 30,373 27,981 25,553 26,808 30,286 23,245 29,492
Refined Oil 1,865 2,530 2,472 2,281 2,371 3,196 2,347 2,679 2,874 2,471 2,320 3,099
Scrap Steel 248 206 204 184 195 223 185 165 194 301 220 208
Scrap Copper 360 343 392 332 322 367 306 187 288 309 285 317
Steel 1,223 1,174 1,364 1,087 1,127 1,212 1,155 871 1,208 1,198 1,053 1,166
Unwrought Copper 343 336 390 397 417 421 415 283 408 429 363 349
Property
Investment 11.9 9.9 8.6 11.8 7.6 -1.9 10.4 10.4 6.5 0.5 2.4 3.4
New Starts 8.2 6.2 -0.2 42.9 -31.2 -26.1 -17.7 -17.7 -19.5 -14.9 -12.8 -15.0
Area under Construction 10.4 20.1 10.0 51.4 -35.3 -22.1 7.6 7.6 -20.2 -12.3 -18.7 -18.4
Completion -15.7 24.5 11.4 10.5 11.4 1.2 -12.9 -12.9 1.3 -18.4 -23.0 -15.8
Sales by volume -16.3 -12.4 -10.3 -1.6 -11.1 -4.1 -16.3 -16.3 -1.6 7.0 15.0 16.0

Macquarie Research Commodities Comment
3 August 2015 10
Articles of the Week
Cutting deep into the cost curve
Like a hot knife through butter, most commodity prices are now slicing with relative ease into
industry cost curves. Given that for many metals and bulks there is an imminent need to take
capacity offline amid clear oversupply, this is natural at the current point in the cycle. Concepts of
cost support are thus less relevant in the short term where it is all about inflicting enough pain to
force hard decisions on capacity. However, cost structures still matter for through the cycle
equilibrium. Meanwhile, this reporting season has a common theme – further cost outs at metals
and mining companies. We review movements in cost curves and the factors driving the cost
reductions – many of which are unlikely to reverse anytime soon.
Figure 1 below shows the extent of the challenge for metals and mining. Versus the 90th
percentile (a measure we still consider flawed for modern markets – further details here) the vast
majority have lower current spot prices – significantly lower in certain cases. Or, looking at it
another way in figure 2, decent proportions of global supply across metals and bulks are currently
losing money on a cash plus sustaining capital basis - over a third in areas like met coal, nickel
and aluminium. The only mined market where everyone remains cash positive is potash, and
given the inherent overcapacity the spirit of producer discipline will be further tested in this market
over the coming year – we would expect a push into the cost curve sooner rather than later.
Fig 1 The vast majority of mined commodities are now trading well into the cost curve…
Fig 2 …with over a third of supply currently loss-making in met coal, nickel and aluminium
Source: LME, Platts, Wood Mackenzie, Macquarie Research, July 2015 Source: Platts, Wood Mackenzie, Macquarie Research, July 2015
That a significant proportion of supply is under pressure should not be a surprise, given prices are
at multi-year lows. Indeed, it could be said the surprise is that more isn’t lossmaking, or that we
haven’t seen more aggressive supply responses. The main reason for this is that cost structures
themselves are falling rapidly, and where potential for further cost gains can be shown, producers
will continue to keep capacity in the market and try and improve their own competitive position.
Unfortunately, when everyone is doing the same things, the fundamental imbalance is not solved.
The current reporting season is showing further evidence of aggressive cost outs at mining
companies, with Vale’s $15.8/t FOB for iron ore reported on Thursday just the latest in a series of
positive surprises. There are three core reasons why costs have been coming down:
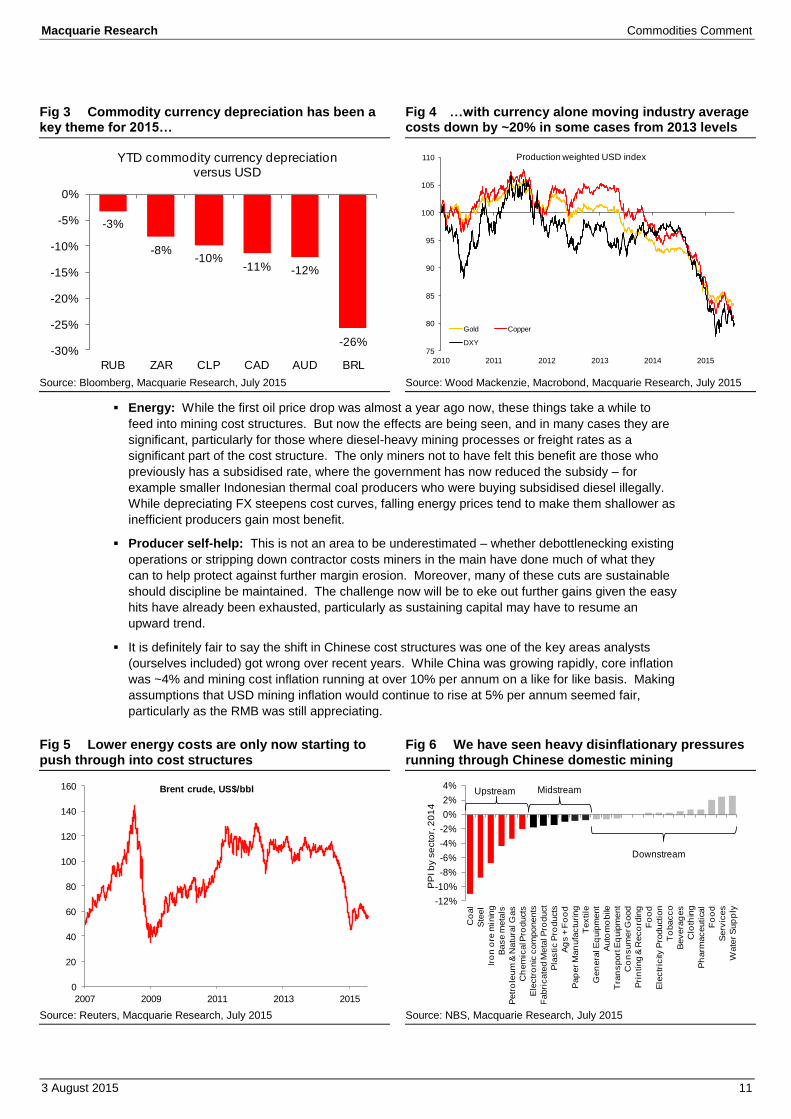
Currency: All currencies have been depreciating against the US dollar, but commodity currencies
more than most (as would be expected given falling commodity prices). With decent parts of
mining cost structures denominated in local currencies, the equivalent USD cost has of course
fallen. Figure 3 shows YTD performance of 6 key producer currencies – while the RUB may only
be down 3% this year, on a 12-month view it has almost halved, while the BRL has certainly
helped Vale’s cost structure. It should be noted that, with many curves having Chinese or US
producers at the top end, wider currency depreciation against the USD tends to steepen cost
curves.
-40%
-30%
-20%
-10%
0%
10%
20%
Po
tash
Go
ld
Zin
c
Co
pp
er
Th
erm
al C
oa
l
Ura
niu
m
PG
M b
aske
t
Iro
n O
re
Alu
min
ium
Ma
ng
an
ese
ore
Me
t Co
al
Nic
ke
l
Current spot price premium over 90th percentile
-40%
-30%
-20%
-10%
0%
10%
20%
30%
40%
50%
Po
tash
Go
ld
Zin
c
Co
pp
er
Th
erm
al C
oa
l
Ura
niu
m
Iro
n O
re
PG
M b
aske
t
Ma
ng
an
ese
ore
Me
t Co
al
Nic
ke
l
Alu
min
ium
Proportion of supply curve underwater
Macquarie Research Commodities Comment
3 August 2015 11
Fig 3 Commodity currency depreciation has been a key theme for 2015…
Fig 4 …with currency alone moving industry average costs down by ~20% in some cases from 2013 levels
Source: Bloomberg, Macquarie Research, July 2015 Source: Wood Mackenzie, Macrobond, Macquarie Research, July 2015
Energy: While the first oil price drop was almost a year ago now, these things take a while to
feed into mining cost structures. But now the effects are being seen, and in many cases they are
significant, particularly for those where diesel-heavy mining processes or freight rates as a
significant part of the cost structure. The only miners not to have felt this benefit are those who
previously has a subsidised rate, where the government has now reduced the subsidy – for
example smaller Indonesian thermal coal producers who were buying subsidised diesel illegally.
While depreciating FX steepens cost curves, falling energy prices tend to make them shallower as
inefficient producers gain most benefit.
Producer self-help: This is not an area to be underestimated – whether debottlenecking existing
operations or stripping down contractor costs miners in the main have done much of what they
can to help protect against further margin erosion. Moreover, many of these cuts are sustainable
should discipline be maintained. The challenge now will be to eke out further gains given the easy
hits have already been exhausted, particularly as sustaining capital may have to resume an
upward trend.
It is definitely fair to say the shift in Chinese cost structures was one of the key areas analysts
(ourselves included) got wrong over recent years. While China was growing rapidly, core inflation
was ~4% and mining cost inflation running at over 10% per annum on a like for like basis. Making
assumptions that USD mining inflation would continue to rise at 5% per annum seemed fair,
particularly as the RMB was still appreciating.
Fig 5 Lower energy costs are only now starting to push through into cost structures
Fig 6 We have seen heavy disinflationary pressures running through Chinese domestic mining
Source: Reuters, Macquarie Research, July 2015 Source: NBS, Macquarie Research, July 2015
-3%
-8%-10%
-11% -12%
-26%-30%
-25%
-20%
-15%
-10%
-5%
0%
RUB ZAR CLP CAD AUD BRL
YTD commodity currency depreciation versus USD
75
80
85
90
95
100
105
110
2010 2011 2012 2013 2014 2015
Production weighted USD index
Gold Copper
DXY
0
20
40
60
80
100
120
140
160
2007 2009 2011 2013 2015
Brent crude, US$/bbl
-12%
-10%
-8%
-6%
-4%
-2%
0%
2%
4%
Co
al
Ste
el
Iro
n o
re m
inin
g
Base m
eta
ls
Petr
ole
um
& N
atu
ral G
as
Ch
em
ical P
roducts
Ele
ctr
onic
com
ponents
Fabri
cate
d M
eta
l P
roduct
Pla
stic P
roducts
Ag
s +
Fo
od
Pap
er M
an
ufa
ctu
ring
Textile
Gen
era
l E
quip
ment
Auto
mo
bile
Tra
nsport
Eq
uip
ment
Co
nsum
er G
ood
Pri
nting &
Reco
rdin
g
Fo
od
Ele
ctr
icity P
roduction
To
bacco
Bevera
ges
Clo
thin
g
Ph
arm
aceutical
Fo
od
Serv
ices
Wate
r S
up
ply
PP
I b
y s
ecto
r, 2
01
4
Upstream
Downstream
Midstream

Macquarie Research Commodities Comment
3 August 2015 12
Instead, as China slowed, inflation bottlenecks gave way to overcapacity in all areas with
disinflationary pressures running through the whole economy. As shown in figure 6, upstream
sectors have indeed been worst hit with producer price inflation in 2014 ranging from -4% for base
metals to -11% for coal. As a result, Chinese cost structures have gone down, not up, adding
further downward pressure to the sharp end of global cost curves.
Of course, the nature of cost structures is very different across individual commodities. The drop
in energy prices has had a notable effect on iron ore, given ~30% of costs are more or less oil-
linked. The same is true for thermal coal, where the effect has also seen a reasonable flattening
of the curve, meaning everyone is feeling a bit of pain, but not really enough to invoke widespread
cuts. While the higher premium certainly helped in 2014, on a LME cash basis much of the curve
has been losing money for a considerable period of time, just not enough. For copper, aside from
a short period in 2009 prices have consistently traded at the top end or even out of the cost curve,
but not anymore – we feel a decent proportion of copper mine output is struggling at these price
levels. Unlike others however, we don’t think there needs to be significant copper supply cuts.
Fig 7 The move lower in the contestable iron ore cost curve has been dramatic…
Fig 8 …while for thermal coal, the cost curve has also flattened considerably
Source: SMM, Company Reports, Macquarie Research, July 2015 Source: Wood Mackenzie, Macquarie Research, July 2015
Fig 9 On a LME cash basis, aluminium has traded into the cost curve for a while…
Fig 10 …whereas copper has spent much of the past decade out the curve, but pressure has returned
Source: Wood Mackenzie, Macquarie Research, July 2015 Source: Wood Mackenzie, Macquarie Research, July 2015
In the very short term, cost curves are not important for setting the price in many markets. Rather,
they are important for determining how much balance sheet pain marginal producers can take
before liquidity is drained and hard decisions on capacity cuts have to be made. The more cost
structures fall, the more prices have to fall to force this point – figure 11 looks at the drop in
marginal costs across commodities over the past 2 years.
0
20
40
60
80
100
120
140
160
180
0 250 500 750 1000 1250 1500 1750 2000
$/t C
FR
Ch
ina, 6
2%
basis
million tonnes
Evolution of iron ore cost curve
2013
2014
2015
40
50
60
70
80
90
100
110
120
0 200 400 600 800 1000
60
00
kca
l NA
R C
FR
Ch
ina
($
/t)
Cumulative Volume (mt)
Seaborne thermal coal supply curve - CFR South China
2012 costs 2014 costs 2015 costs
400
800
1200
1600
2000
2400
2800
3200
3600
1984 1988 1992 1996 2000 2004 2008 2012
$/tAluminium costs and prices
Price Ninth Decile
Upper Quartile Median
Lower Quartile
0
40
80
120
160
200
240
280
320
360
400
440
1980 1984 1988 1992 1996 2000 2004 2008 2012
$/lb
Price Ninth Decile
Copper costs and pricesCopper costs and prices
YTD 2015price

Macquarie Research Commodities Comment
3 August 2015 13
However, assuming suitable cuts are made, cost structures will again be important for through the
cycle prices, particularly given general expectations of ongoing overcapacity. This may allow for
some price recovery in selected commodities, but in a low inflation world this is barely anything to
get excited about. Rather, raw material constraints (nickel, and eventually zinc and copper) still
offer the better hope of price upside in the coming years.
Fig 11 Marginal costs have fallen across all commodities over the past 24 months, but much more sharply for bulks
Source: LME, Platts, Wood Mackenzie, Macquarie Research, July 2015
-2%-7% -8%
-12%-15%
-22%
-32% -33% -33%
-52%-60%
-50%
-40%
-30%
-20%
-10%
0%
Zin
c
Co
pp
er
Go
ld
Nic
ke
l
Alu
min
ium
Ura
niu
m
Ma
ng
an
ese
ore
Me
t Co
al
Th
erm
al C
oa
l
Iro
n O
re
Change in marginal cost level over the past 24 months
Macquarie Research Commodities Comment
3 August 2015 14
Steel demand growth blunted, peak pig iron brought forward
If the Chinese economic slowdown has surprised in its severity, then the slowdown in steel
consumption has been even more acute. And when you are talking about an economy which
represents 50% of worldwide production and 45% of consumption then this becomes a global
problem. With China now poised to be a much larger net exporter of steel than we had previously
expected, we have taken the opportunity to update our global balance. The result is just 0.7%
CAGR in global steel demand through the end of the decade, and China losing its position as the
key consumption growth driver to India and other emerging Asian economies.
With a relatively negligible growth rate in steel production, and the available scrap pool continuing
to grow, 2014’s global pig iron production now looks to have marked the peak for the foreseeable
future. This has obvious implications for the raw materials, with required iron ore displacement
now larger and more pressure on marginal met coal supply to exit permanently.
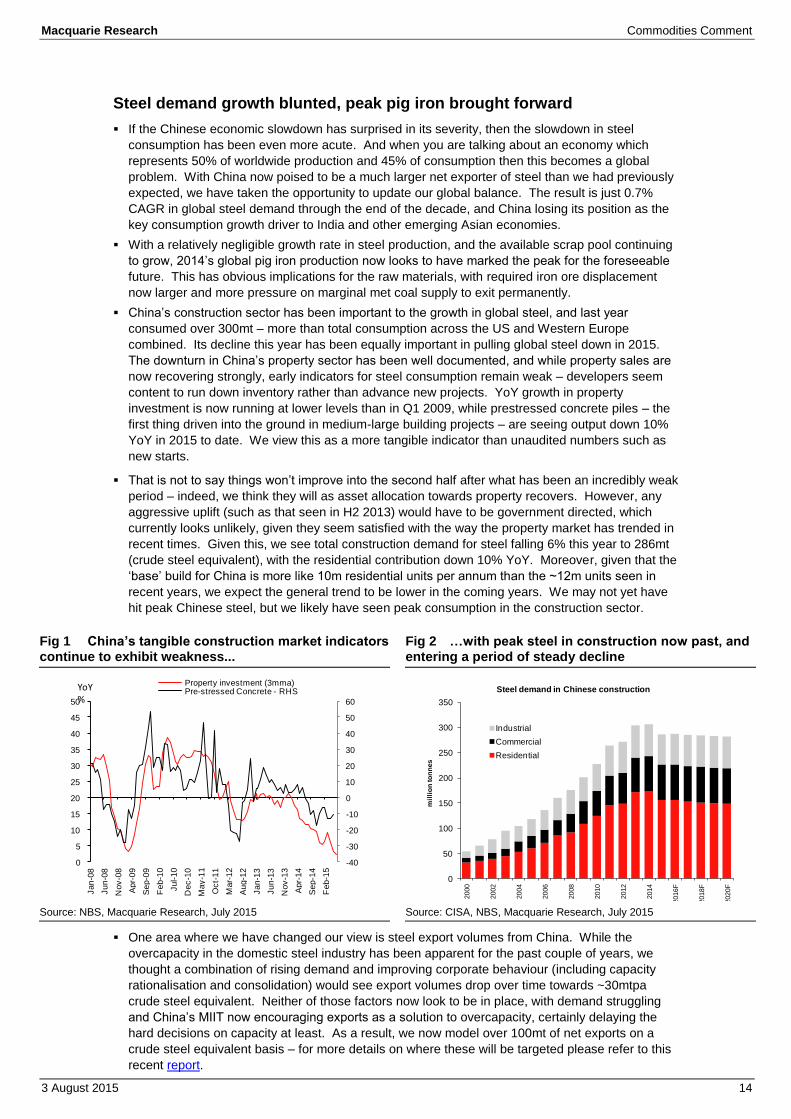
China’s construction sector has been important to the growth in global steel, and last year
consumed over 300mt – more than total consumption across the US and Western Europe
combined. Its decline this year has been equally important in pulling global steel down in 2015.
The downturn in China’s property sector has been well documented, and while property sales are
now recovering strongly, early indicators for steel consumption remain weak – developers seem
content to run down inventory rather than advance new projects. YoY growth in property
investment is now running at lower levels than in Q1 2009, while prestressed concrete piles – the
first thing driven into the ground in medium-large building projects – are seeing output down 10%
YoY in 2015 to date. We view this as a more tangible indicator than unaudited numbers such as
new starts.
That is not to say things won’t improve into the second half after what has been an incredibly weak
period – indeed, we think they will as asset allocation towards property recovers. However, any
aggressive uplift (such as that seen in H2 2013) would have to be government directed, which
currently looks unlikely, given they seem satisfied with the way the property market has trended in
recent times. Given this, we see total construction demand for steel falling 6% this year to 286mt
(crude steel equivalent), with the residential contribution down 10% YoY. Moreover, given that the
‘base’ build for China is more like 10m residential units per annum than the ~12m units seen in
recent years, we expect the general trend to be lower in the coming years. We may not yet have
hit peak Chinese steel, but we likely have seen peak consumption in the construction sector.
Fig 1 China’s tangible construction market indicators continue to exhibit weakness...
Fig 2 …with peak steel in construction now past, and entering a period of steady decline
Source: NBS, Macquarie Research, July 2015 Source: CISA, NBS, Macquarie Research, July 2015
One area where we have changed our view is steel export volumes from China. While the
overcapacity in the domestic steel industry has been apparent for the past couple of years, we
thought a combination of rising demand and improving corporate behaviour (including capacity
rationalisation and consolidation) would see export volumes drop over time towards ~30mtpa
crude steel equivalent. Neither of those factors now look to be in place, with demand struggling
and China’s MIIT now encouraging exports as a solution to overcapacity, certainly delaying the
hard decisions on capacity at least. As a result, we now model over 100mt of net exports on a
crude steel equivalent basis – for more details on where these will be targeted please refer to this
recent report.
-40
-30
-20
-10
0
10
20
30
40
50
60
0
5
10
15
20
25
30
35
40
45
50
Jan
-08
Jun
-08
No
v-0
8
Apr-
09
Se
p-0
9
Feb-1
0
Jul-10
Dec-1
0
May
-11
Oct-
11
Mar-
12
Au
g-1
2
Jan
-13
Jun
-13
Nov-1
3
Apr-
14
Se
p-1
4
Feb-1
5
Property investment (3mma)Pre-stressed Concrete - RHSYoY
%
0
50
100
150
200
250
300
350
2000
2002
2004
2006
2008
2010
2012
2014
2016F
2018F
2020F
mil
lio
n to
nn
es
Steel demand in Chinese construction
Industrial
Commercial
Residential

Macquarie Research Commodities Comment
3 August 2015 15
Increasing China’s production clearly has an impact on the global steel market – essentially
production expectations elsewhere have to drop, all other things being equal. Given the sustained
period of low steel industry margins expected over the coming years, we have essentially removed
any growth plans from the model from everywhere except India (where we have pared back
production growth slightly), and moderated capacity creep expectations. Areas like Japan and the
US will also have also seen production held at or below 2015 levels – the former due to China’s
impact on its key export markets and the latter due to a general lack of domestic industry
competitiveness amid dollar strength.
Fig 3 The growing gap between Chinese steel production and consumption...
Fig 4 …has led to net exports over 100mtpa on a crude steel basis, a level we now consider sustainable
Source: NBS, Mysteel, CISA, Macquarie Research, July 2015 Source: China Customs, Macquarie Research, July 2015
While China is set to remain over 50% of global production, on our new modelling it never reaches
50% of steel consumption. Indeed, India and other Asian countries are set to become the new
growth engines for the global steel economy. For 2014-2020, we now expect a global demand
CAGR of 0.7%, but following the 2.3% drop in the current year, this means a 1.3% CAGR from this
point forward. In terms of China, the equivalent 2014-2020 CAGR is zero, but post the 3.7% fall this
year the CAGR is 0.7%, with autos and machinery gains offsetting construction losses. Meanwhile,
we have India growing at a 7.5% CAGR – far and away the best among major economies.
Developed world consumption is essentially flat – there is some upside risk here should we see a
construction and infrastructure rebound, but given the fiscal pressures on many economies, these
would likely have to be private sector-led rather than getting government kickers.
Fig 5 China’s steel consumption is in the ‘peaking out’ phase...
Fig 6 …with India and other Asian countries now set to be the larger growth driver
Source: worldsteel, NBS, Macquarie Research, July 2015 Source: worldsteel, NBS, Macquarie Research, July 2015
-15%
-10%
-5%
0%
5%
10%
15%
20%
25%
Jan-13 Jan-14 Jan-15
YoY change in Chinese steel production and consumption
Real Demand Steel production-40
-20
0
20
40
60
80
100
120
140
160
Ja
n-0
6
Ma
y-0
6
Se
p-0
6
Ja
n-0
7
Ma
y-0
7
Se
p-0
7
Ja
n-0
8
Ma
y-0
8
Se
p-0
8
Ja
n-0
9
Ma
y-0
9
Se
p-0
9
Ja
n-1
0
Ma
y-1
0
Se
p-1
0
Ja
n-1
1
Ma
y-1
1
Se
p-1
1
Ja
n-1
2
Ma
y-1
2
Se
p-1
2
Ja
n-1
3
Ma
y-1
3
Se
p-1
3
Ja
n-1
4
Ma
y-1
4
Se
p-1
4
Ja
n-1
5
Ma
y-1
5
Ch
ine
se s
teel t
rad
e, c
rud
e b
asis
, an
nu
alis
ed, m
t
Chinese steel exports
Imports Exports Net Exports
414 273 344 366 360 360 381 377 381 381 378 374 370
473
529
607 655 675 729 756 728 735 739 747 752 755
450
386
451 483 494
496 503 497 514 531 548 565 583
-
100
200
300
400
500
600
700
800
900
1,000
1,100
1,200
1,300
1,400
1,500
1,600
1,700
1,800
1,900
2008
2009
2010
2011
2012
2013
2014e
2015f
2016f
2017f
2018f
2019f
2020f
mil
lio
n to
nn
es
Crude steel consumption
Developed China Emerging Markets
(10)
(5)
-
5
10
15
20
25
30
35
40
Ch
ina
Jap
an
Ind
ia
Oth
er A
sia
US
A
Latin
Am
eri
ca
Weste
rn E
uro
pe
CIS
Oth
er
million to
nnes
Change in steel consumption, 2020 vs. 2015

Macquarie Research Commodities Comment
3 August 2015 16
With a relatively negligible growth rate now projected for steel production, and the available scrap
pool continuing to grow, global blast furnace iron output is in an even more challenging situation
than steel. The leverage to China has been a benefit (and may well be again next year), but we
are now looking at global production of 1,220mt in 2014 marking the peak for the foreseeable
future, and have global pig iron production 40mt lower than this by the end of the decade.
Certainly, the scrap element does give some uncertainty to these forecasts, given that basic
oxygen furnace steel mills have a certain degree of flexibility to substitute between produced pig
iron and purchased scrap. The fixed asset element of the blast furnace and associated facilities
(sinter plant, coke ovens) also add a layer of complexity.
Presently, the equation is very much in favour of making pig iron using purchased raw materials to
the greatest extent possible. This has the potential to delay the scrap cycle; however, we do tend
to consider scrap inelastic in the long run such that any reprieve for pig iron output is likely to be a
temporary one.
Fig 7 Macquarie global steel production and consumption
Source: worldsteel, NBS, Macquarie Research, July 2015
Peak pig iron output naturally means increased challenges for raw materials. Not least, the
contestable iron ore market has hit saturation point, and is now in the ‘peaking out’ phase which
had previously been projected for nearer the end of the decade.
With Chinese domestic iron ore, having already lost ~100mtpa over the past two years, now
reaching the minimum expected volume, falling blast furnace output now means falling imports.
This will be gradual rather than a collapse, but after over 20 years of consecutive growth –
including 2008 and 2009 – is in itself a significant market event.
Steel Consumption - Crude Steel Basis (million tonnes) CAGR
2013 2014 2015f 2016f 2017f 2018f 2019f 2020f 2014-2020
China 729 756 728 735 739 747 752 755 0.7%
Japan 69 72 69 70 70 70 70 70 -0.5%
India 78 80 86 93 100 107 115 124 7.5%
Other Asia 152 158 155 161 166 169 173 176 1.8%
USA 105 117 114 114 114 112 110 108 -1.3%
Latin America 81 86 82 84 86 88 90 91 1.0%
Western Europe 169 173 177 178 178 177 175 173 0.0%
CIS 78 70 66 68 69 70 72 73 0.8%
Other 125 128 127 127 129 132 135 138 1.2%
Total World 1585 1640 1602 1630 1652 1672 1692 1708 1.3%
World, Ex-China 857 884 874 895 912 926 939 953 1.3%
Crude Steel Production (m tonnes) CAGR
2013 2014 2015f 2016f 2017f 2018f 2019f 2020f 2014-2020
Japan 111 111 105 104 104 104 100 100 -1.7%
China 789 839 841 849 842 849 855 858 0.4%
India 81 87 92 97 102 107 112 117 5.1%
Other Asia 102 109 106 106 110 113 113 113 0.5%
North America 119 121 111 113 113 112 112 111 -1.4%
Western Europe 179 180 177 179 180 180 181 181 0.1%
Brazil 34 34 34 35 35 35 35 36 0.8%
South/Central America 12 11 10 10 10 11 11 11 -0.8%
CIS 108 106 101 103 103 104 104 105 -0.2%
Other 81 83 84 84 84 85 85 86 0.5%
Total World 1617 1681 1661 1679 1683 1700 1708 1716 0.3%
World Ex-China 827 842 820 830 841 850 852 859 0.3%
China share 48.8% 49.9% 50.6% 50.5% 50.0% 50.0% 50.1% 50.0%

Macquarie Research Commodities Comment
3 August 2015 17
Fig 8 Peak pig iron is set to mean falling Chinese imports...
Fig 9 …and with the majors still ramping, continued displacement of marginal capacity
Source: Customs Statistics, NBS, Macquarie Research, July 2015 Source: Customs Statistics, NBS, Macquarie Research, July 2015
With the majors (BHP, Rio, Vale, FMG, Anglo and Roy Hill) continuing to grow output, the
pressure will continue to bear on marginal players to make way. Under our previous forecasts,
limited displacement was required from 2017 onwards, with growth from the majors matching
overall demand growth. With blast furnace output in a downtrend, even without growth from the
majors we will need displacement, and with the growth between 60-80mt will be required each
year through 2019 – not a pleasant environment for any iron ore producer.
Fig 10 Macquarie iron ore balance – more displacement to come
Source: worldsteel, Customs Statistics, Macquarie Research, July 2015
0
200
400
600
800
1000
1200
1400
1600
1800
2000
2001
2002
2003
2004
2005
2006
2007
2008
2009
2010
2011
2012
2013
2014
2015f
2016f
2017f
2018f
2019f
Destination of contestable iron ore supply
China imports
China domestic
Ex-China imports
0
100
200
300
400
500
600
700
800
1Q
13
2Q
13
3Q
13
4Q
13
1Q
14
2Q
14
3Q
14
4Q
14
1Q
15
2Q
15
3Q
15F
4Q
15F
1Q
16F
2Q
16F
3Q
16F
4Q
16F
1Q
17F
2Q
17F
3Q
17F
4Q
17F
1Q
18F
2Q
18F
3Q
18F
4Q
18F
Supply required ex-majors, mtpa
million tonnes
Pig iron + DRI production 2013 2014 2015F 2016F 2017F 2018F 2019F
China 716 749 737 743 725 717 707
Ex-China 464 471 466 469 475 480 480
Total 1180 1220 1202 1213 1200 1198 1187
Total ex-China seaborne iron ore demand 2013 2014 2015F 2016F 2017F 2018F 2019F
Europe 119 118 119 121 120 120 120
Japan 134 133 122 122 122 122 117
Korea 66 78 74 74 77 80 80
Other 69 103 114 106 105 106 106
Total 388 432 430 422 425 428 423
Total China iron ore demand 2013 2014 2015F 2016F 2017F 2018F 2019F
China demand 1144 1208 1169 1192 1162 1150 1133
Total iron ore demand (China + ex-China) 1531 1640 1599 1613 1587 1578 1556
Seaborne iron ore supply 2013 2014 2015F 2016F 2017F 2018F 2019F
Total majors 867 1011 1106 1194 1245 1296 1336
YoY 144 95 88 50 51 40
Total variable supply annualised (after disruption) 665 629 492 419 342 282 220
YoY delta (displacement) 71 (36) (137) (73) (77) (60) (62)

Macquarie Research Commodities Comment
3 August 2015 18
Our pig iron production downgrades also have bearish implications for our seaborne met coal
supply-demand balance, which we have updated below. The key points are as follows:
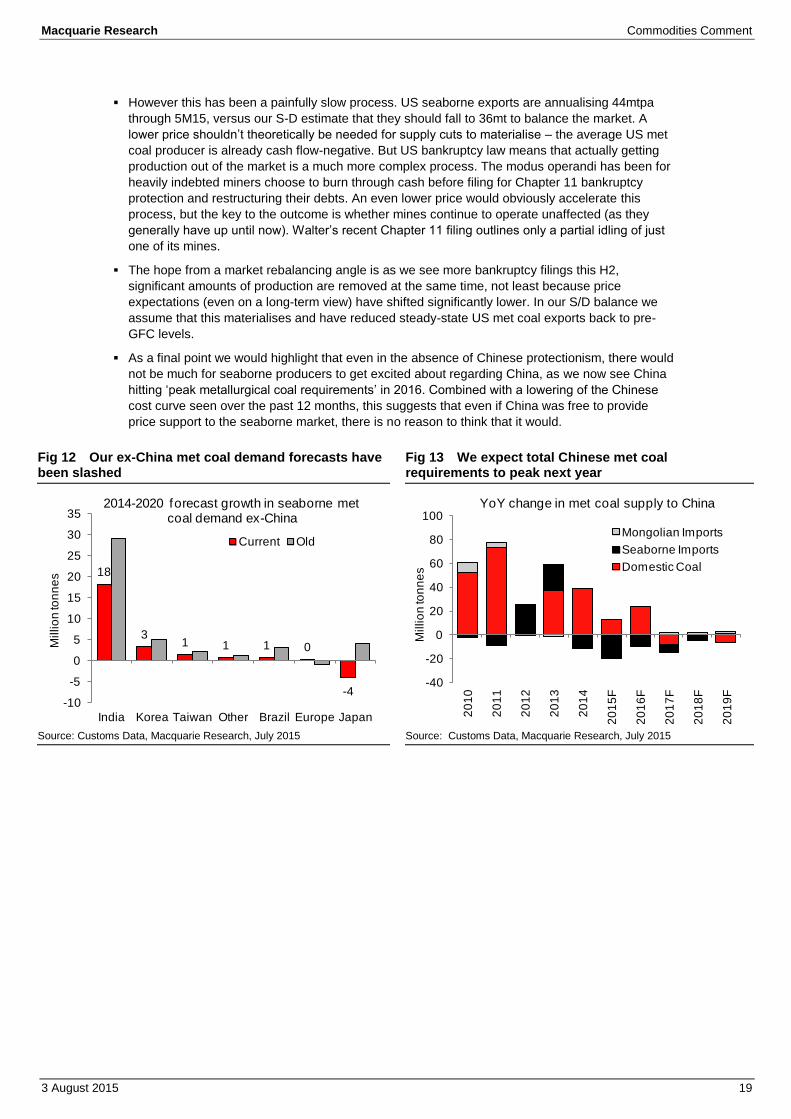
Ex-China met coal demand growth has been significantly reduced, from +43mt 2014-2020 to
just +20mt 2014-2020. Europe aside, import projections for all major seaborne importers have
been cut. India remains the only source of significant demand growth going forward.
Chinese imports, now a function of protectionist trade policy, have been reduced by 15-20%
from 2015 to 2018. This to reflect current import run-rates, which are below our previous
expectations. In addition, we see China hitting peak ‘metallurgical coal requirements’ in 2016.
The result of the former two points is that US export projections have been slashed. We now
see steady state exports as being under 30mt, versus ~40mt previously.
Fig 11 Metallurgical coal seaborne supply and demand
Source: Customs Data, Macquarie Research, July 2015
Our ex-China demand revisions put into focus just how reliant the seaborne met coal market is
going to be on Indian demand going forward. Unlike thermal coal, where concerns are building
that domestic production could sort itself out to the detriment of imports, Indian domestic met coal
qualities are poor and yields are low. India remains the market’s structural demand growth driver,
albeit our projections are more conservative than before. Meanwhile demand growth from all other
importers is, on our forecasts, going to be more-or-less flat over the next five years.
In previous years, this ‘displaced’ volume may have been able to find a home in China, by ‘pricing
in’. That is no longer possible with Chinese imports now effectively determined by protectionist
policy rather than supply-push, which was the main driver in previous years. New coal quality
standards introduced at the start of this year – trace element inspections in particular – have
helped keep seaborne coal out and the risk is that this protectionism increases further.
The implication is that we will need to see much larger supply cuts than we were previously
assuming, almost all of which we have attributed to the US. There is no disputing that US met coal
producers account for the marginal tonnes in the market and that if economics were to play out
freely, these would be the cuts addressing market oversupply.
Growth
Met coal demand (mt) 2012 2013 2014 2015F 2016F 2017F 2018F 2019F 2020F 2014-2020
Europe 54 53 56 55 56 57 57 57 57 0
Japan 57 57 55 53 53 53 53 51 51 -4
Korea 28 31 33 33 33 35 36 36 36 3
Taiw an 9 10 11 12 12 12 12 12 12 1
China 52 73 62 42 32 25 21 22 21 -41
India 38 40 47 52 54 57 60 62 65 18
Brazil 15 15 19 20 20 20 20 20 20 1
Other 5 9 11 11 11 11 11 11 11 1
Total Demand 258 289 294 277 271 269 269 271 273 -20
% change YoY 7.5% 12.0% 1.7% -5.5% -2.2% -0.7% - 0.6% 0.9%
Growth
Met coal supply (mt) 2012 2013 2014 2015F 2016F 2017F 2018F 2019F 2020F 2014-2020
Australia 145 170 186 188 187 185 183 183 183 -4
Canada 30 34 30 27 27 27 27 27 28 -3
USA 59 57 51 36 30 28 28 28 28 -23
China 1 1 1 1 1 1 1 1 1 -
Russia 10 14 13 13 13 13 13 13 14 1
Other 13 13 13 13 14 16 18 19 20 8-
Total Supply 258 289 294 277 271 269 269 271 273 -20
% change YoY 7.0% 12.0% 1.7% -5.5% -2.2% -0.7% - 0.6% 0.9%
Macquarie Research Commodities Comment
3 August 2015 19
However this has been a painfully slow process. US seaborne exports are annualising 44mtpa
through 5M15, versus our S-D estimate that they should fall to 36mt to balance the market. A
lower price shouldn’t theoretically be needed for supply cuts to materialise – the average US met
coal producer is already cash flow-negative. But US bankruptcy law means that actually getting
production out of the market is a much more complex process. The modus operandi has been for
heavily indebted miners choose to burn through cash before filing for Chapter 11 bankruptcy
protection and restructuring their debts. An even lower price would obviously accelerate this
process, but the key to the outcome is whether mines continue to operate unaffected (as they
generally have up until now). Walter’s recent Chapter 11 filing outlines only a partial idling of just
one of its mines.
The hope from a market rebalancing angle is as we see more bankruptcy filings this H2,
significant amounts of production are removed at the same time, not least because price
expectations (even on a long-term view) have shifted significantly lower. In our S/D balance we
assume that this materialises and have reduced steady-state US met coal exports back to pre-
GFC levels.
As a final point we would highlight that even in the absence of Chinese protectionism, there would
not be much for seaborne producers to get excited about regarding China, as we now see China
hitting ‘peak metallurgical coal requirements’ in 2016. Combined with a lowering of the Chinese
cost curve seen over the past 12 months, this suggests that even if China was free to provide
price support to the seaborne market, there is no reason to think that it would.
Fig 12 Our ex-China met coal demand forecasts have been slashed
Fig 13 We expect total Chinese met coal requirements to peak next year
Source: Customs Data, Macquarie Research, July 2015 Source: Customs Data, Macquarie Research, July 2015
18
31 1 1 0
-4-10
-5
0
5
10
15
20
25
30
35
India Korea Taiwan Other Brazil Europe Japan
Millio
n to
nn
es
2014-2020 forecast growth in seaborne met coal demand ex-China
Current Old
-40
-20
0
20
40
60
80
100
20
10
20
11
20
12
20
13
20
14
20
15
F
20
16
F
20
17
F
20
18
F
20
19
F
Millio
n to
nn
es
YoY change in met coal supply to China
Mongolian Imports
Seaborne Imports
Domestic Coal
Macquarie Research Commodities Comment
3 August 2015 20
Trouble down pit: Copper mines begin to struggle
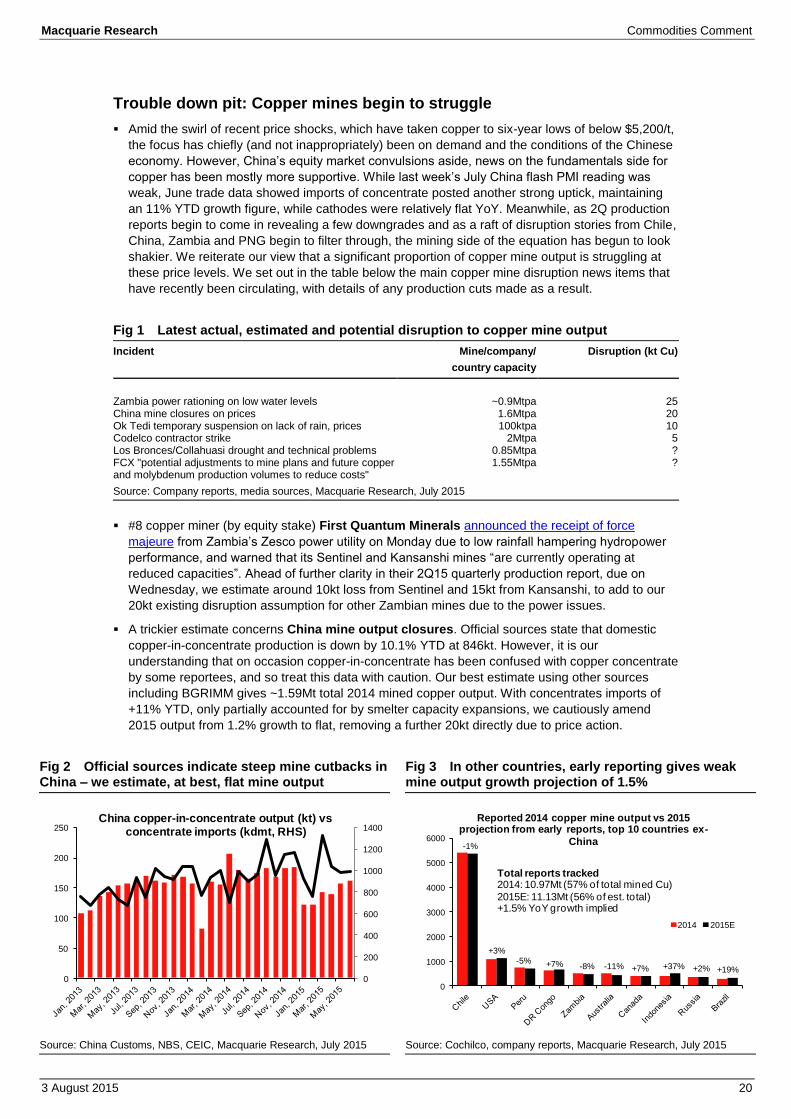
Amid the swirl of recent price shocks, which have taken copper to six-year lows of below $5,200/t,
the focus has chiefly (and not inappropriately) been on demand and the conditions of the Chinese
economy. However, China’s equity market convulsions aside, news on the fundamentals side for
copper has been mostly more supportive. While last week’s July China flash PMI reading was
weak, June trade data showed imports of concentrate posted another strong uptick, maintaining
an 11% YTD growth figure, while cathodes were relatively flat YoY. Meanwhile, as 2Q production
reports begin to come in revealing a few downgrades and as a raft of disruption stories from Chile,
China, Zambia and PNG begin to filter through, the mining side of the equation has begun to look
shakier. We reiterate our view that a significant proportion of copper mine output is struggling at
these price levels. We set out in the table below the main copper mine disruption news items that
have recently been circulating, with details of any production cuts made as a result.
Fig 1 Latest actual, estimated and potential disruption to copper mine output
Incident Mine/company/
country capacity
Disruption (kt Cu)
Zambia power rationing on low water levels ~0.9Mtpa 25 China mine closures on prices 1.6Mtpa 20 Ok Tedi temporary suspension on lack of rain, prices 100ktpa 10 Codelco contractor strike 2Mtpa 5 Los Bronces/Collahuasi drought and technical problems 0.85Mtpa ? FCX "potential adjustments to mine plans and future copper and molybdenum production volumes to reduce costs"
1.55Mtpa ?
Source: Company reports, media sources, Macquarie Research, July 2015
#8 copper miner (by equity stake) First Quantum Minerals announced the receipt of force
majeure from Zambia’s Zesco power utility on Monday due to low rainfall hampering hydropower
performance, and warned that its Sentinel and Kansanshi mines “are currently operating at
reduced capacities”. Ahead of further clarity in their 2Q15 quarterly production report, due on
Wednesday, we estimate around 10kt loss from Sentinel and 15kt from Kansanshi, to add to our
20kt existing disruption assumption for other Zambian mines due to the power issues.
A trickier estimate concerns China mine output closures. Official sources state that domestic
copper-in-concentrate production is down by 10.1% YTD at 846kt. However, it is our
understanding that on occasion copper-in-concentrate has been confused with copper concentrate
by some reportees, and so treat this data with caution. Our best estimate using other sources
including BGRIMM gives ~1.59Mt total 2014 mined copper output. With concentrates imports of
+11% YTD, only partially accounted for by smelter capacity expansions, we cautiously amend
2015 output from 1.2% growth to flat, removing a further 20kt directly due to price action.
Fig 2 Official sources indicate steep mine cutbacks in China – we estimate, at best, flat mine output
Fig 3 In other countries, early reporting gives weak mine output growth projection of 1.5%
Source: China Customs, NBS, CEIC, Macquarie Research, July 2015 Source: Cochilco, company reports, Macquarie Research, July 2015
0
200
400
600
800
1000
1200
1400
0
50
100
150
200
250China copper-in-concentrate output (kt) vs
concentrate imports (kdmt, RHS)
0
1000
2000
3000
4000
5000
6000
Reported 2014 copper mine output vs 2015 projection from early reports, top 10 countries ex-
China
2014 2015E
-1%
+3%
-5% +7% -8% -11% +7% +37% +2% +19%
Total reports tracked2014: 10.97Mt (57% of total mined Cu)
2015E: 11.13Mt (56% of est. total)+1.5% YoY growth implied

Macquarie Research Commodities Comment
3 August 2015 21
On Tuesday, Ok Tedi Mining Ltd announced a temporary shutdown mainly related to low rainfall,
which has put a stop to concentrate barge shipments down the Fly river to its seaport facilities.
The state-owned PNG miner noted however that it would at this time of production stoppage lay
off 30% of its expatriate workforce and 15% of its nationals, calling the redundancies “essential to
help position OTML to better cope with a low commodity price environment”. We expect the
stoppage to last a few weeks, and have shaved 10kt of production to allow 88kt Cu for 2015. No
further amendments have been made, but we expect this event to add further pressure to the
concentrates market and spot TCRCs, as this mine is a key custom supplier to the Asian smelters.
Noisier but at this stage less impactful for supply have been events at #1 miner Codelco, where a
contractor strike escalated into violent protests, the occupation of the 60ktpa El Salvador mine and
the police shooting of a worker last Friday. Later on Tuesday we learnt that strike action had
spread to the much larger 400ktpa Chuquicamata mine, with the CEO confirming work had
stopped in a statement. As this stage it is difficult to say how impactful these disturbances may be,
and have thus limited disruption estimate to 5kt until we see how the situation develops.
Elsewhere, while we lack the detail to make disruption amendments as yet, we note the warnings
on potential outages from #2 miner Freeport McMoran and #9 miner Anglo American. The
former announced on Tuesday a “comprehensive review of operating plans” which will
“incorporate potential adjustments to mine plans and future copper and molybdenum production
volumes to reduce costs and preserve valuable resources for anticipated improved market
conditions in the future”. Details of the review are expected this quarter, and may entail shutdowns
and/or curtailments, with the smaller Arizona mines most likely to be at risk given their size versus
the rest of the portfolio, lack of currency advantage (being based in the US) and FCX’s past
behaviours at these operations during times of low prices. For Anglo, the main problem is water
and the lack thereof. Drought conditions have begun to hamper output at Los Bronces, though the
company had made allowances for this in 2015 guidance and so no unexpected disruptions have
resulted. We identify this as a key risk going forward, however, with the company stating that “full
year production remains partially dependent on weather conditions in the second half”.
Meanwhile, some interest has been stirred up by #4 miner BHP Billiton’s announcement that
group copper output will fall to 1.5Mt in the financial year to June 2016, from 1.7Mt in Financial
Year 2015, but we point out that the company warned of significant grade declines at Escondida at
the end of 2015, thus we have not made a fresh downward revision due to their recent guidance.
Fig 4 Annualised disruption at 5.5% Fig 5 Price related shutdowns a key feature in 2015
Source: Wood Mac, Company reports, Macquarie Research, July 2015 Source: Company reports, Macquarie Research, July 2015
As a result of the estimates gathered so far in the last week and a half, we have removed 60kt
from a number of individual mines and mine profiles, and reduced the remaining disruption
allowance applied to the balance to 1.8%. This maintains the overall 5% disruption allowance for
the year, which compares to the annualised run rate of 5.5% to date. In absolute terms, we have
seen 600kt of disruption YTD, and allow for another 355kt in the remaining five months. This and
the annualised figure clearly imply that disruption has been high YTD, running ahead of the full
year allowance, providing the potential (but not yet the conviction) that we will have to raise
disruption once again, and thus tighten the balance.
0.0%
1.0%
2.0%
3.0%
4.0%
5.0%
6.0%
7.0%
8.0%
9.0%
0
200
400
600
800
1000
1200
1400
1600
2004 2005 2006 2007 2008 2009 2010 2011 2012 2013 2014 2015 YTD
Copper mine disruptions (kt)
Engineering/Technical Strikes/Stakeholder action
Slow ramp-up Weather
Ore Grades Price-related
Other Annual disruption rate %
Engineering/Technical
15%
Strikes/Stakeholder action
8%
Slow ramp-up
26%Weather
20%
Ore Grades6%
Price-related24%
Other1%
2015 copper mine disruptions, YTDTotal YTD - 600Kt

Macquarie Research Commodities Comment
3 August 2015 22
The key consideration must therefore be, where are the main supply-side risks for the
remainder of the year? What could push us into another disruption raise? We identify the
following themes as the “ones to watch”:
Chinese domestic mines due to low prices – the hardest to trace but the most marginal by
our reckoning. The sector accounts for ~1.6Mt of mined copper, making it the second largest
mining country after Chile in 2014. Aside from a handful of larger operations which make up
around a third of the total, the vast majority are extremely small (<10ktpa) and widely
perceived to be high cost, low margin operations. The key indicators to watch are concentrate
imports, spot TCRCs into China, and (with a hefty dose of caution) official mine data.
Smaller US operations due to low prices – lacking the currency advantage gifted by US
dollar strength that has been so helpful to miner’s margins elsewhere, we would expect US
operations to be more marginal pound-for-pound than ex-US counterparts. The US was the 4th
largest mining country in 2014 at 1.4Mt, with the bulk contributed by large scale operations.
~170ktpa of US output, however, comes from assets which produce <50ktpa.
Chilean operations due to weather (and in general) – the lack of rain driving extreme water
shortages has been a recurrent theme this year, and recent company statements indicate that
the problems persist. Meanwhile, strikes apparently remain a scourge even in times of low
prices. Chile’s huge porphyry copper mines dominate the global supply side, with the country
accounting for ~5.9Mt of mined copper in 2014. This year, however, we expect production to
flatline and peak around the 2014 level after recent strong growth (Fig. 6), and this is
supported by the early output reports from companies and state copper commission Cochilco
(Fig. 3). Projecting output forward from reported data (~56% of global mine output) using past
seasonal patterns indicates that Chilean production could fall by 1% this year, compared to
total global reported mine output growth of 1.5%. With momentum teetering, water outages
and price pressures could hasten the decline in this country.
African operations due to power: Both Zambia and the DR Congo have experienced
repeated power disruptions, and as FQM’s announcement demonstrates, this issue remains
at the forefront of risk to the operations in the African Copperbelt. We have as yet to discover
the full scale of the most recent interruptions.
Peruvian and Indonesian operations due to stakeholders: Besides Chile, both Peru and
Indonesia have experienced substantial disturbances to operations due to strikes, and we
note that labour contract renewals are due at Southern Copper Co’s two major Peruvian
operations at the end of August, and in Indonesia with Grasberg due at the end of September,
and at Newmont’s Batu Hijau at the end of November. Though not always the case, contract
negotiations have at times in the past proved a flashpoint for industrial actions.
Fig 6 Chilean mine output to peak around now
Fig 7 Most of the top copper mining countries have an Achilles heel
Source: Cochilco, company reports, WM, Macquarie Research, July 2015 Source: Cochilco, Wood Mac, CRU, ICSG, company reports, Macquarie
Research, July 2015
4.8
5.0
5.2
5.4
5.6
5.8
6.0Chilean mine output (Mt Cu)
0.0
1.0
2.0
3.0
4.0
5.0
6.0
7.0Top copper mining countries, 2015 (Mt Cu, before
disruption)

Macquarie Research Commodities Comment
3 August 2015 23
Assessing the room for Chinese steel and aluminium exports
The statement issued by China’s MIIT last week made the government stance on exports from
industries with overcapacity quite clear – high levels of refined metal exports to emerging regions
will not only be tolerated but actively encouraged. But is there scope to absorb Chinese exports at
the levels projected? We assess the key areas where this material may be targeted, and their
medium-term demand potential for both steel and aluminium.
For further detail on the MIIT statement, and the implications for the global steel market in
particular, please refer to our 23rd
July Commodities Comment “Steel under pressure from all
angles”.
Of course, there are multiple factors around how much excess capacity China will be looking to
place in international markets – not least Chinese demand itself. At least in steel, future Chinese
capacity additions will be limited in size. Even with this, unless Chinese banks decide to pull
financing, net exports of 100mt or above on a crude basis can be expected for the foreseeable
future. For ali, we still expect 6mt of new Chinese capacity to be added through the end of the
decade. Even with strong domestic demand growth, this will still allow for ~5mt of semis exports
by 2020. As such, there certainly is capability to export (though export economics is another
debate in itself).
There is also the other side of the equation – how much capacity will import nations targeted by
China add themselves? Much of that comes down to domestic policy, but in terms of pure
economics the answer is likely to be very little over and above current projects. With an extended
period of low steel and aluminium prices and margins, unless there is a compelling rationale for
development (access to cheap raw materials or power) the buy or build decision is heavily skewed
in favour of the former.
When considering where exports will be targeted, history often provides a good guide. The ramp-
up in aluminium semis exports from China has been gradual over time – indeed many of the
players who have been doing this trade for years are annoyed by the sudden focus on it.
Historically, destinations have been peer Asian countries. In particular, exports to Malaysia and
Vietnam have risen quickly, though many of these are believed to be pseudo-primary material for
re-export.
Steel exports display a similar profile, with Asia accounting for almost 60% of all exports (despite
the widespread talk of anti-dumping cases, Europe only accounts for 10% and North America 5%).
South East Asian countries have again been the key growth area, with 2015 currently annualising
at over 24mt over 2010 levels. Interestingly, relative to market size, exports to Africa, South
America and the Middle East have also grown sharply. These are the key areas China is exerting
its steel influence.
Fig 1 The growth in aluminium semis exports has been directed to the Asian market...
Fig 2 ...with Vietnam, Korea, Indian and Malaysia the largest destinations
Source: China Customs, Macquarie Research, July 2015 Source: China Customs, Macquarie Research, July 2015
0.0
0.5
1.0
1.5
2.0
2.5
3.0
2010 2011 2012 2013 2014 2015 YTD ann
MtChina aluminium semis exports by
destination
Africa AsiaEurope North AmericaSouth America Other
0%
5%
10%
15%
20%
25%
30%
2010 2011 2012 2013 2014 2015 YTD ann
Largest destinations for Chinese semis in Asia
India Indonesia
Korea, South Malaysia
Thailand Vietnam

Macquarie Research Commodities Comment
3 August 2015 24
Given this, we can consider the catch-up potential of these regions – Figures 5-6 look at
aluminium and steel per capita consumption in India, ASEAN, Latin America, Africa, Middle East
and countries with proximity to China’s Western borders (Afghanistan, Pakistan, Kazakhstan,
Bangladesh, Myanmar, Kyrgyzstan, Tajikistan, Laos) versus the global average.
Clearly, the Middle East is pretty well served for steel and particularly aluminium at present, and
given a relatively low population is unlikely to be a target for growth (though individual countries
like Iran may be). ASEAN and Latin America are at the stage where they should be accelerating
consumption, while Africa continues to offer key long run potential. Meanwhile, the Western
Border countries, with combined population of >500million, plentiful resources but limited refined
metal capacity, which could offer the best strategic potential for Chinese exports.
Meanwhile, for aluminium, many of the regions with potential are already long primary supply –
including Africa and, more recently, India. Other Asia looks to have potential to absorb some
more material, but it does look like there will be inevitable continued spill over of Chinese
aluminium semis into developed world markets.
Fig 3 The same is true of steel, with the majority of exports destined for Asia...
Fig 4 ...with particularly strong growth to South East Asian countries
Source: China Customs, Macquarie Research, July 2015 Source: China Customs, Macquarie Research, July 2015
Fig 5 Plenty of catch-up still required for Africa in aluminium consumption...
Fig 6 ...while countries in proximity to China’s Western borders remain highly under-developed
Source: IAI, CRU, Macquarie Research, July 2015 Source: worldsteel, Macquarie Research, July 2015
North America5%
CIS1%
Africa8%
East Asia18%
South East Asia31%
South Asia9%
Mid East9%
Oceania1%
South & Central America
8%
W Europe7%
Other Europe3%
Share of steel exports by destination - YTD 2015
3.85.2
0.1
5.98.0
24.3
4.8 5.5
-0.1
4.4
-5
0
5
10
15
20
25
30
No
rth A
merica
Euro
pe
CIS
Afr
ica
East A
sia
So
uth
East A
sia
So
uth
Asia
Mid
East
Oceania
So
uth
& C
entr
al
Am
erica
Growth in Chinese exports, 2015e-2010, mtpa
1.4
4.2
3.4
0.9
9.8
0.6
8.0
0.0
2.0
4.0
6.0
8.0
10.0
12.0
India ASEAN Latin America
Africa Middle East
Western Borders
Global average
Primary aluminium consumption, kg/capita
66
125
144
49
226
30
236
0
50
100
150
200
250
India ASEAN Latin America
Africa Middle East
Western Borders
Global average
Crude steel equiv. consumption, kg/capita

Macquarie Research Commodities Comment
3 August 2015 25
For steel, Chinese suppliers have already established a foothold in most of the key import regions.
India, which has added capacity over and above current consumption, will be generally off-limits at
present; however, it does offer some medium-term potential unless capacity additions are
accelerated. For other regions the question will be whether China has to commit to building steel
mills within individual countries – this is possible, but would only add to the global overcapacity
situation, and only then would there be a risk of higher exports (from currently installed Chinese
capacity) to developed markets.
Certainly, there is potential for elevated levels of Chinese exports to be absorbed, and indeed the
disinflationary pressures should help many developing countries as they seek to grow their own
economies. However, the challenge will always be managing this process, both through the
inevitable trade frictions and local concerns and the simple lack of direct economic return which
may be generated.
Fig 7 For aluminium, most ‘target’ regions are long primary material – except developing Asia...
Fig 8 ...while India is a net steel exporter at present, but without acceleration in projects this will reverse
Source: IAI, CRU, Macquarie Research, July 2015 Source: worldsteel, Macquarie Research, July 2015
-4000
-3000
-2000
-1000
0
1000
2000
3000
4000
So
uth
Am
eri
ca
Afr
ica
Ind
ia
Mid
dle
Ea
st
De
ve
lop
ing
Asia
Refined aluminium balances (kt)
2011 2012 2013 2014 2015F 2016F
-15
-10
-5
0
5
10
2005
2006
2007
2008
2009
2010
2011
2012
2013
2014
2015f
2016f
2017f
2018f
2019f
2020f
mil
lio
n to
nn
es
Indian net steel exports
Macquarie Research Commodities Comment
3 August 2015 26
Important disclosures:
Recommendation definitions
Macquarie - Australia/New Zealand Outperform – return >3% in excess of benchmark return Neutral – return within 3% of benchmark return Underperform – return >3% below benchmark return Benchmark return is determined by long term nominal GDP growth plus 12 month forward market dividend yield
Macquarie – Asia/Europe Outperform – expected return >+10% Neutral – expected return from -10% to +10% Underperform – expected return <-10%
Macquarie First South - South Africa Outperform – expected return >+10% Neutral – expected return from -10% to +10% Underperform – expected return <-10%
Macquarie - Canada
Outperform – return >5% in excess of benchmark return Neutral – return within 5% of benchmark return Underperform – return >5% below benchmark return
Macquarie - USA Outperform (Buy) – return >5% in excess of Russell 3000 index return Neutral (Hold) – return within 5% of Russell 3000 index return Underperform (Sell)– return >5% below Russell 3000 index return
Volatility index definition*
This is calculated from the volatility of historical price movements. Very high–highest risk – Stock should be
expected to move up or down 60–100% in a year – investors should be aware this stock is highly speculative. High – stock should be expected to move up or down at least 40–60% in a year – investors should be aware this stock could be speculative. Medium – stock should be expected to move up or down at least 30–40% in a year. Low–medium – stock should be expected to move up or down at least 25–30% in a year. Low – stock should be expected to move up or down at least 15–25% in a year. * Applicable to Asia/Australian/NZ/Canada stocks only
Recommendations – 12 months Note: Quant recommendations may differ from Fundamental Analyst recommendations
Financial definitions
All "Adjusted" data items have had the following adjustments made: Added back: goodwill amortisation, provision for catastrophe reserves, IFRS derivatives & hedging, IFRS impairments & IFRS interest expense Excluded: non recurring items, asset revals, property revals, appraisal value uplift, preference dividends & minority interests EPS = adjusted net profit / efpowa* ROA = adjusted ebit / average total assets ROA Banks/Insurance = adjusted net profit /average total assets ROE = adjusted net profit / average shareholders funds Gross cashflow = adjusted net profit + depreciation *equivalent fully paid ordinary weighted average number of shares All Reported numbers for Australian/NZ listed stocks are modelled under IFRS (International Financial Reporting Standards).
Recommendation proportions – For quarter ending 30 June 2015
AU/NZ Asia RSA USA CA EUR Outperform 46.23% 58.36% 47.27% 44.20% 60.65% 43.01% (for US coverage by MCUSA, 9.68% of stocks followed are investment banking clients)
Neutral 37.67% 25.65% 29.09% 49.29% 34.19% 40.93% (for US coverage by MCUSA, 5.53% of stocks followed are investment banking clients)
Underperform 16.10% 15.99% 23.64% 6.52% 5.16% 16.06% (for US coverage by MCUSA, 1.38% of stocks followed are investment banking clients)
Company-specific disclosures: Important disclosure information regarding the subject companies covered in this report is available at www.macquarie.com/disclosures.
Analyst certification: The views expressed in this research accurately reflect the personal views of the analyst(s) about the subject securities or issuers and no part of the compensation of the analyst(s) was, is, or will be directly or indirectly related to the inclusion of specific recommendations or views in this research. The analyst principally responsible for the preparation of this research receives compensation based on overall revenues of Macquarie Group Ltd ABN 94 122 169 279 (AFSL No. 318062) (MGL) and its related entities (the Macquarie Group) and has taken reasonable care to achieve and maintain independence and objectivity in making any recommendations. General disclaimers: Macquarie Securities (Australia) Ltd; Macquarie Capital (Europe) Ltd; Macquarie Capital Markets Canada Ltd; Macquarie Capital Markets North America Ltd; Macquarie Capital (USA) Inc; Macquarie Capital Securities Ltd and its Taiwan branch; Macquarie Capital Securities (Singapore) Pte Ltd; Macquarie Securities (NZ) Ltd; Macquarie First South Securities (Pty) Limited; Macquarie Capital Securities (India) Pvt Ltd; Macquarie Capital Securities (Malaysia) Sdn Bhd; Macquarie Securities Korea Limited and Macquarie Securities (Thailand) Ltd are not authorized deposit-taking institutions for the purposes of the Banking Act 1959 (Commonwealth of Australia), and their obligations do not represent deposits or other liabilities of Macquarie Bank Limited ABN 46 008 583 542 (MBL) or MGL. MBL does not guarantee or otherwise provide assurance in respect of the obligations of any of the above mentioned entities. MGL provides a guarantee to the Monetary Authority of Singapore in respect of the obligations and liabilities of Macquarie Capital Securities (Singapore) Pte Ltd for up to SGD 35 million. This research has been prepared for the general use of the wholesale clients of the Macquarie Group and must not be copied, either in whole or in part, or distributed to any other person. If you are not the intended recipient you must not use or disclose the information in this research in any way. If you received it in error, please tell us immediately by return e-mail and delete the document. We do not guarantee the integrity of any e-mails or attached files and are not responsible for any changes made to them by any other person. MGL has established and implemented a conflicts policy at group level (which may be revised and updated from time to time) (the "Conflicts Policy") pursuant to regulatory requirements (including the FCA Rules) which sets out how we must seek to identify and manage all material conflicts of interest. Nothing in this research shall be construed as a solicitation to buy or sell any security or product, or to engage in or refrain from engaging in any transaction. In preparing this research, we did not take into account your investment objectives, financial situation or particular needs. Macquarie salespeople, traders and other professionals may provide oral or written market commentary or trading strategies to our clients that reflect opinions which are contrary to the opinions expressed in this research. Macquarie Research produces a variety of research products including, but not limited to, fundamental analysis, macro-economic analysis, quantitative analysis, and trade ideas. Recommendations contained in one type of research product may differ from recommendations contained in other types of research, whether as a result of differing time horizons, methodologies, or otherwise. Before making an investment decision on the basis of this research, you need to consider, with or without the assistance of an adviser, whether the advice is appropriate in light of your particular investment needs, objectives and financial circumstances. There are risks involved in securities trading. The price of securities can and does fluctuate, and an individual security may even become valueless. International investors are reminded of the additional risks inherent in international investments, such as currency fluctuations and international stock market or economic conditions, which may adversely affect the value of the investment. This research is based on information obtained from sources believed to be reliable but we do not make any representation or warranty that it is accurate, complete or up to date. We accept no obligation to correct or update the information or opinions in it. Opinions expressed are subject to change without notice. No member of the Macquarie Group accepts any liability whatsoever for any direct, indirect, consequential or other loss arising from any use of this research and/or further communication in relation to this research. Clients should contact analysts at, and execute transactions through, a Macquarie Group entity in their home jurisdiction unless governing law permits otherwise. The date and timestamp for above share price and market cap is the closed price of the price date. #CLOSE is the final price at which the security is traded in the relevant exchange on the date indicated. Country-specific disclaimers: Australia: In Australia, research is issued and distributed by Macquarie Securities (Australia) Ltd (AFSL No. 238947), a participating organisation of the Australian Securities Exchange. New Zealand: In New Zealand, research is issued and distributed by Macquarie Securities (NZ) Ltd, a NZX Firm. Canada: In Canada, research is prepared, approved and distributed by Macquarie Capital Markets Canada Ltd, a participating organisation of the Toronto Stock Exchange, TSX Venture Exchange & Montréal Exchange. Macquarie Capital Markets North America Ltd., which is a registered broker-dealer and member of FINRA, accepts responsibility for the contents of reports issued by Macquarie Capital Markets Canada Ltd in the United States and sent to US persons. Any US person wishing to effect transactions in the securities described in the reports issued by Macquarie Capital Markets Canada Ltd should do so with Macquarie Capital Markets North America Ltd. The Research Distribution Policy of Macquarie Capital Markets Canada Ltd is to allow all clients that are entitled to have equal access to our research. United Kingdom: In the United Kingdom, research is issued and

Macquarie Research Commodities Comment
3 August 2015 27
distributed by Macquarie Capital (Europe) Ltd, which is authorised and regulated by the Financial Conduct Authority (No. 193905). Germany: In Germany, this research is issued and/or distributed by Macquarie Capital (Europe) Limited, Niederlassung Deutschland, which is authorised and regulated by the UK Financial Conduct Authority (No. 193905). and in Germany by BaFin. France: In France, research is issued and distributed by Macquarie Capital (Europe) Ltd, which is authorised and regulated in the United Kingdom by the Financial Conduct Authority (No. 193905). Hong Kong & Mainland China: In Hong Kong, research is issued and distributed by Macquarie Capital Securities Ltd, which is licensed and regulated by the Securities and Futures Commission. In Mainland China, Macquarie Securities (Australia) Limited Shanghai Representative Office only engages in non-business operational activities excluding issuing and distributing research. Only non-A share research is distributed into Mainland China by Macquarie Capital Securities Ltd. Japan: In Japan, research is Issued and distributed by Macquarie Capital Securities (Japan) Limited, a member of the Tokyo Stock Exchange, Inc. and Osaka Exchange, Inc. (Financial Instruments Firm, Kanto Financial Bureau (kin-sho) No. 231, a member of Japan Securities Dealers Association). India: In India, research is issued and distributed by Macquarie Capital Securities (India) Pvt. Ltd. (CIN: U65920MH1995PTC090696), formerly known as Macquarie Capital (India) Pvt. Ltd., 92, Level 9, 2 North Avenue, Maker Maxity, Bandra Kurla Complex, Bandra (East), Mumbai – 400 051, India, which is a SEBI registered Research Analyst having registration no. INH000000545. Malaysia: In Malaysia, research is issued and distributed by Macquarie Capital Securities (Malaysia) Sdn. Bhd. (Company registration number: 463469-W) which is a Participating Organisation of Bursa Malaysia Berhad and a holder of Capital Markets Services License issued by the Securities Commission. Taiwan: In Taiwan, research is issued and distributed by Macquarie Capital Securities Ltd, Taiwan Branch, which is licensed and regulated by the Financial Supervisory Commission. No portion of the report may be reproduced or quoted by the press or any other person without authorisation from Macquarie. Nothing in this research shall be construed as a solicitation to buy or sell any security or product. Research Associate(s) in this report who are registered as Clerks only assist in the preparation of research and are not engaged in writing the research. Thailand: In Thailand, research is produced, issued and distributed by Macquarie Securities (Thailand) Ltd. Macquarie Securities (Thailand) Ltd. is a licensed securities company that is authorized by the Ministry of Finance, regulated by the Securities and Exchange Commission of Thailand and is an exchange member of the Stock Exchange of Thailand. The Thai Institute of Directors Association has disclosed the Corporate Governance Report of Thai Listed Companies made pursuant to the policy of the Securities and Exchange Commission of Thailand. Macquarie Securities (Thailand) Ltd does not endorse the result of the Corporate Governance Report of Thai Listed Companies but this Report can be accessed at: http://www.thai-iod.com/en/publications.asp?type=4. South Korea: In South Korea, unless otherwise stated, research is prepared, issued and distributed by Macquarie Securities Korea Limited, which is regulated by the Financial Supervisory Services. Information on analysts in MSKL is disclosed at http://dis.kofia.or.kr/websquare/index.jsp?w2xPath=/wq/fundMgr/DISFundMgrAnalystStut.xml&divisionId=MDIS03002001000000&serviceId=SDIS03002001000. South Africa: In South Africa, research is issued and distributed by Macquarie First South Securities (Pty) Limited, a member of the JSE Limited. Singapore: In Singapore, research is issued and distributed by Macquarie Capital Securities (Singapore) Pte Ltd (Company Registration Number: 198702912C), a Capital Markets Services license holder under the Securities and Futures Act to deal in securities and provide custodial services in Singapore. Pursuant to the Financial Advisers (Amendment) Regulations 2005, Macquarie Capital Securities (Singapore) Pte Ltd is exempt from complying with sections 25, 27 and 36 of the Financial Advisers Act. All Singapore-based recipients of research produced by Macquarie Capital (Europe) Limited, Macquarie Capital Markets Canada Ltd, Macquarie First South Securities (Pty) Limited and Macquarie Capital (USA) Inc. represent and warrant that they are institutional investors as defined in the Securities and Futures Act. United States: In the United States, research is issued and distributed by Macquarie Capital (USA) Inc., which is a registered broker-dealer and member of FINRA. Macquarie Capital (USA) Inc, accepts responsibility for the content of each research report prepared by one of its non-US affiliates when the research report is distributed in the United States by Macquarie Capital (USA) Inc. Macquarie Capital (USA) Inc.’s affiliate’s analysts are not registered as research analysts with FINRA, may not be associated persons of Macquarie Capital (USA) Inc., and therefore may not be subject to FINRA rule restrictions on communications with a subject company, public appearances, and trading securities held by a research analyst account. Information regarding futures is provided for reference purposes only and is not a solicitation for purchases or sales of futures. Any persons receiving this report directly from Macquarie Capital (USA) Inc. and wishing to effect a transaction in any security described herein should do so with Macquarie Capital (USA) Inc. Important disclosure information regarding the subject companies covered in this report is available at www.macquarie.com/research/disclosures, or contact your registered representative at 1-888-MAC-STOCK, or write to the Supervisory Analysts, Research Department, Macquarie Securities, 125 W.55th Street, New York, NY 10019. © Macquarie Group
Auckland Tel: (649) 377 6433
Jakarta Tel: (62 21) 515 1818
Munich Tel: (089) 2444 31800
Sydney Tel: (612) 8232 9555
Bangkok Tel: (662) 694 7999
Johannesburg Tel: (2711) 583 2000
New York Tel: (1 212) 231 2500
Taipei Tel: (886 2) 2734 7500
Calgary Tel: (1 403) 294 9541
Kuala Lumpur Tel: (60 3) 2059 8833
Paris Tel: (33 1) 7842 3823
Tokyo Tel: (81 3) 3512 7900
Denver Tel: (303) 952 2800
London Tel: (44 20) 3037 2000
Perth Tel: (618) 9224 0888
Toronto Tel: (1 416) 848 3500
Frankfurt Tel: (069) 509 578 000
Manila Tel: (63 2) 857 0888
Seoul Tel: (82 2) 3705 8500
Vancouver Tel: (1 604) 605 3944
Geneva Tel: (41) 22 818 7777
Melbourne Tel: (613) 9635 8139
Shanghai Tel: (86 21) 6841 3355
Hong Kong Tel: (852) 2823 3588
Mumbai Tel: (91 22) 6653 3000
Singapore Tel: (65) 6601 1111
Available to clients on the world wide web at www.macquarieresearch.com and through Thomson Financial, FactSet, Reuters, Bloomberg, and CapitalIQ.

EMEA Research Heads of Equity Research
Peter Redhead (Global – Head) (852) 3922 4836
Shai Hill (Europe) (44 20) 3037 4232
George Brits (South Africa) (27 11) 583 2223
Consumer Staples
Food & Beverages Sreedhar Mahamkali (London) (44 20) 3037 4016
Consumer Discretionary
Retailing Sreedhar Mahamkali (London) (44 20) 3037 4016
Charlie Storey (London) (44 20) 3037 2327
Energy
Iain Reid (London) (44 20) 3037 2119
David Farrell (London) (44 20) 3037 4465
Giacomo Romeo (London) (44 20) 3037 4445
Kate Sloan (London) (44 20) 3037 4453
Aditya Suresh (Hong Kong) (852) 3922 1265
Gerhard Engelbrecht (Johannesburg) (27 11) 583 2407
Alternative Energy & Utilities
Shai Hill (London) (44 20) 3037 4232
Dominic Nash (London) (44 20) 3037 4239
Jose Ruiz (London) (44 20) 3037 1912
Peter Crampton (London) (44 20) 3037 4559
Gurpreet Gujral (London) (44 20) 3037 2249
Financials
Diversified Financials Neil Welch (London) (44 20) 3037 4272
Banks Edward Firth (London) (44 20) 3037 4077
Benjie Creelan-Sandford (London) (44 20) 3037 4081
Thomas Stoegner (London) (44 20) 3037 4172
Piers Brown (London) (44 20) 3037 4044
Sven Thordsen (Johannesburg) (27 11) 583 2218
Insurance Neil Welch (London) (44 20) 3037 4272
Industrials
Capital Goods Rowan Goeller (Johannesburg) (27 11) 583 2131
Christian Breitsprecher (Frankfurt) (49 69) 50957 8014
Transportation & Infrastructure Dominic Nash (London) (44 20) 3037 4239
Douglas McNeil (London) (44 20) 3037 2568
Rowan Goeller (Johannesburg) (27 11) 583 2131
Materials
Chemicals/Containers, Packaging/Paper &
Forest Products, Construction Materials
Rowan Goeller (Johannesburg) (27 11) 583 2131
Al Kabili (New York) (1 212) 231 0683
Global Metals & Mining Alon Olsha (London) (44 20) 3037 2637
Patrick Morton (London) (44 20) 3037 2014
Kieran Daly (Johannesburg) (27 11) 583 2208
James Oberholzer (Johannesburg) (27 11) 583 2367
Gerhard Engelbrecht (Johannesburg) (27 11) 583 2407
Hayden Bairstow (Perth) (618) 9224 0838
Pharmaceuticals
Ada Li (Johannesburg) (27 11) 583 2181
Real Estate
Property Trusts & Developers Leon Allison (Johannesburg) (27 11) 583 2209
Nazeem Samsodien (Cape Town) (27 21) 813 2771
TMET
Telecommunications
Guy Peddy (London) (44 20) 3037 4509
Mark Murphy (London) (44 20) 3037 5498
Media Tim Nollen (New York) (1 212) 231 0635
Commodities & Precious Metals
Colin Hamilton (Global) (44 20) 3037 4061
Jim Lennon (London) (44 20) 3037 4271
Matthew Turner (London) (44 20) 3037 4340
Stefan Ljubisavljevic (London) (44 20) 3037 4247
Vivienne Lloyd (London) (44 20) 3037 4530
Daryna Kovalska (London) (44 20) 3037 2732
Graeme Train (Shanghai) (86 21) 2412 9035
Angela Bi (Shanghai) (86 21) 2412 9086
Chen Shao (Shanghai) (86 21) 2412 9041
European Macro Group
Economics & Strategy Peter Eadon-Clarke (Global) (813) 3512 7850
Elna Moolman (Johannesburg) (27 11) 583 2570
Strategy George Brits (South Africa) (27 11) 583 2223
Quantitative Gurvinder Brar (Global) (44 20) 3037 4036
Giuliano De Rossi (London) (44 20) 3037 1997
Ioan Mirciov (London) (44 20) 3037 1939
Jakub Kolodziej (London) (44 20) 3037 2016
Josiah Rudolph (Johannesburg) (27 11) 583 2210
Find our research at
Macquarie: www.macquarie.com.au/research
Thomson: www.thomson.com/financial
Reuters: www.knowledge.reuters.com
Bloomberg: MAC GO
Factset: http://www.factset.com/home.aspx
CapitalIQ www.capitaliq.com
Contact Gareth Warfield for access (612) 8232 3207
Email addresses
Equities
Stevan Vrcelj (Global Head) (612) 8232 5999
Dipesh Patel (London) (44 20) 3037 4978
Sarah-Jane Wagg (Johannesburg) (27 11) 583 2000
European Execution Services
Andreas Bergmann (London) (44 20) 3037 4680
Robert Tappin (London) (44 20) 3037 4827
Wayne Drayton (London) (44 20) 3037 4980
Jon Knapman (London) (44 20) 3037 1704
KC O'Rourke (London) (44 20) 3037 4910
Danny Want (London) (44 20) 3037 4847
Peter Homan (London) (44 20) 3037 4740
Gregorio Esmelian (London) (44 20) 3037 4973
Will Rogers (London) (44 20) 3037 1721
Richard McGlashan (London) (44 20) 3037 4824
Robert Lenihan (London) (44 20) 3037 4908
Richard Bateson (London) (44 20) 3037 4821
David Hemming (London) (44 20) 3037 4909
Nick Bryan (London) (44 20) 3037 4768
Chris Charbonnier (London) (44 20) 3037 4760
Marc Crome (London) (44 20) 3037 4778
George Sampson (London) (44 20) 3037 1732
Katie Ramsey (London) (44 20) 3037 4919
ETF Sales Trading
Robin Quinnell (London) (44 20) 3023 8885
Bachir Binebine (Hong Kong) (852) 3922 2089
Chris Johnson (New York) (1 212) 231 0881
US Sales Trading
Chris Reale (New York) (1 212) 231 2555
EU Cash Sales
Sam Bygott-Webb (London) (44 20) 3037 4767
Richard Alderman (London) (44 20) 3037 4875
Luke Ahern (London) (44 20) 3037 4960
John Gilbert (London) (44 20) 3037 4933
James Lumby (London) (44 20) 3037 4846
Awais Khan (London) (44 20) 3037 4967
Claire Elsdon (London) (44 20) 3037 4787
Jonathan Mathews (London) (44 20) 3037 4869
Markus Geisbuesch (Frankfurt) (49 69) 50957 8709
Holger Hoepfner (Geneva) (41 22) 818 7777
Jan Halaska (Boston) (1 617) 598 2503
Chris Carr (New York) (1 212) 231-6398
Doug Stone (New York) (1 212) 231 2606
Andrea Duguet (New York) (1 212) 231 0977
South Africa Equity Syndication
Franco Lorenzani (Johannesburg) (27 11) 583 2014
South Africa Sales
Roland Wood (Cape Town) (27 21) 813 2611
Sven Forssman (Johannesburg) (27 11) 583 2369
Ed Southey (Johannesburg) (27 11) 583 2026
Khensani Mokoena (Johannesburg) (27 11) 583 2016
Jesse Ushewokunze (New York) (1 212) 231 2504
South Africa Sales Trading
Harry Ioannou (Johannesburg) (27 11) 583 2015
Welcome Plessie (Johannesburg) (27 11) 583 2058
Martin Hughes (Johannesburg) (27 11) 583 2019
Marcello Damilano (Johannesburg) (27 11) 583 2018
Commodity Hedge Fund Sales
Chris Looney (New York) (1 212) 231 0836
Iain Lindsay (London) (44 20) 3037 4825
Guy Keller (Singapore) (65) 6601 0303
Commodity Corporate Sales
Nael Noueiri (London) (44 20) 3037 4913
Rohan Khurana (Singapore) (65) 6601 0308
Commodity Investor Products
Arun Assumall (London) (44 20) 3037 4953
Catherine Littlefield (New York) (1 212) 231 6348