DEUTERIUM ARRAY MEMO MASSACHUSETTS … · DEUTERIUM ARRAY MEMO #069 MASSACHUSETTS INSTITUTE OF...
27
DEUTERIUM ARRAY MEMO #069 MASSACHUSETTS INSTITUTE OF TECHNOLOGY HAYSTACK OBSERVATORY WESTFORD, MASSACHUSETTS 01886 August 2, 2007 Telephone: 978-692-4764 Fax: 781-981-0590 To: Deuterium Array Group From: Alan E.E. Rogers, K.A. Dudevoir and B.J. Fanous Subject: RFI mitigation techniques used in the observations of the 327 MHz Deuterium Line Observations of the 327 MHz line from the ground-state spin-flip transition of Deuterium were made with an array of 24 electronically steered multi-beam radio telescopes. These observations were made at the MIT Haystack Observatory facility in Westford Massachusetts which is only about 30 km from metropolitan Boston and is also the site of high power radars at 440 and 1295 MHz and a digisonde whose transmitter sweeps through the HF band to probe the ionosphere. As a result of the presence of these high power signals we found it necessary to filter the signal prior to the low noise amplifier to prevent the generation of intermodulation products. Next we found that we needed more than 100 dB of out-of-band filtering to avoid images of strong signals in the 327 MHz band. In order to avoid the self-generation of RFI by the array we placed the electronics in completely sealed shielded boxes. The heat from the electronics was removed by conduction through the box walls. The A.C. power to the boxes was filtered by 2 line filters, each with 60 dB attenuation, in series to limit the radiation from the electronics into the nearby antenna elements. Fiber optics were used for the communication with the 2 motherboards inside each box. To monitor RFI in the observing band we built a 14 channel RFI monitoring system with Yagis pointed every 30 degrees and 2 polarizations of a broad beam antenna pointed at zenith. Fortunately the critical observing band was only 250 kHz wide centered at 327.4 MHz but even so we found a large number of interfering signals in this band most of which were being generated from harmonics of the clocks in various electronics like digital answering machines, sound cards, and GPS receivers located within a km of the array. We minimized the horizon response of the telescope sub-arrays to -10 dBi compared with the 22 dBi gain of the sub-array beam. At the distance of one km a signal from a transmitter at the limit of the FCC part 15 specification would generate a signal about 50 dB stronger than the 0.3 mK observed at the peak of the deuterium line. In most cases we were able to remove or exchange the local interferers all of which were well within the FCC part 15 specification. The remaining interferers were mostly transient. In the case of a very strong transient we excised all the data from all the telescopes for this period. In the case of weaker narrow band signals we only excluded those contaminated frequencies from the spectral accumulation. The spectral exclusion was possible because typically the RFI would only occupy one or two 244 Hz resolution channels and the data could be smoothed using weighted least squares to the few kHz resolution needed for the 327 MHz line whose typical width was about 20 kHz. In addition to using the RFI monitor for data excision and spectral exclusion we also used the data from each telescope to remove RFI that resulted from the use of a cell phone right next to a telescope or a receiver malfunction that was not detected by the RFI monitor. We also occasionally observed and excised continuum RFI which produced a curvature or ripple in the spectrum due to multipath.
Transcript of DEUTERIUM ARRAY MEMO MASSACHUSETTS … · DEUTERIUM ARRAY MEMO #069 MASSACHUSETTS INSTITUTE OF...

DEUTERIUM ARRAY MEMO #069 MASSACHUSETTS INSTITUTE OF TECHNOLOGY
HAYSTACK OBSERVATORY WESTFORD, MASSACHUSETTS 01886
August 2, 2007 Telephone: 978-692-4764
Fax: 781-981-0590 To: Deuterium Array Group
From: Alan E.E. Rogers, K.A. Dudevoir and B.J. Fanous
Subject: RFI mitigation techniques used in the observations of the 327 MHz Deuterium Line
Observations of the 327 MHz line from the ground-state spin-flip transition of Deuterium were made with an array of 24 electronically steered multi-beam radio telescopes. These observations were made at the MIT Haystack Observatory facility in Westford Massachusetts which is only about 30 km from metropolitan Boston and is also the site of high power radars at 440 and 1295 MHz and a digisonde whose transmitter sweeps through the HF band to probe the ionosphere. As a result of the presence of these high power signals we found it necessary to filter the signal prior to the low noise amplifier to prevent the generation of intermodulation products. Next we found that we needed more than 100 dB of out-of-band filtering to avoid images of strong signals in the 327 MHz band. In order to avoid the self-generation of RFI by the array we placed the electronics in completely sealed shielded boxes. The heat from the electronics was removed by conduction through the box walls. The A.C. power to the boxes was filtered by 2 line filters, each with 60 dB attenuation, in series to limit the radiation from the electronics into the nearby antenna elements. Fiber optics were used for the communication with the 2 motherboards inside each box. To monitor RFI in the observing band we built a 14 channel RFI monitoring system with Yagis pointed every 30 degrees and 2 polarizations of a broad beam antenna pointed at zenith. Fortunately the critical observing band was only 250 kHz wide centered at 327.4 MHz but even so we found a large number of interfering signals in this band most of which were being generated from harmonics of the clocks in various electronics like digital answering machines, sound cards, and GPS receivers located within a km of the array. We minimized the horizon response of the telescope sub-arrays to -10 dBi compared with the 22 dBi gain of the sub-array beam. At the distance of one km a signal from a transmitter at the limit of the FCC part 15 specification would generate a signal about 50 dB stronger than the 0.3 mK observed at the peak of the deuterium line. In most cases we were able to remove or exchange the local interferers all of which were well within the FCC part 15 specification. The remaining interferers were mostly transient. In the case of a very strong transient we excised all the data from all the telescopes for this period. In the case of weaker narrow band signals we only excluded those contaminated frequencies from the spectral accumulation. The spectral exclusion was possible because typically the RFI would only occupy one or two 244 Hz resolution channels and the data could be smoothed using weighted least squares to the few kHz resolution needed for the 327 MHz line whose typical width was about 20 kHz. In addition to using the RFI monitor for data excision and spectral exclusion we also used the data from each telescope to remove RFI that resulted from the use of a cell phone right next to a telescope or a receiver malfunction that was not detected by the RFI monitor. We also occasionally observed and excised continuum RFI which produced a curvature or ripple in the spectrum due to multipath.

RFI mitigation techniques used in the observations of the 327 MHz Deuterium Line
Alan E.E. RogersMIT Haystack Observatory, Westford, MA 01886
• RFI mitigation
• Excision of transients
• Exclusion of frequencies with continuous narrow-band RFI
• Hardware
• Digital receiver
• Active antenna design with filter before LNA to eliminate intermodulation
• Closed box shielding of digital hardware
• Double filtering of AC power
• Fiber optic communication
Location
Alan RogersURSI 2007 23 July 2007
Haystack
MillstoneFirepond
Westford
MillstoneHill Rd.
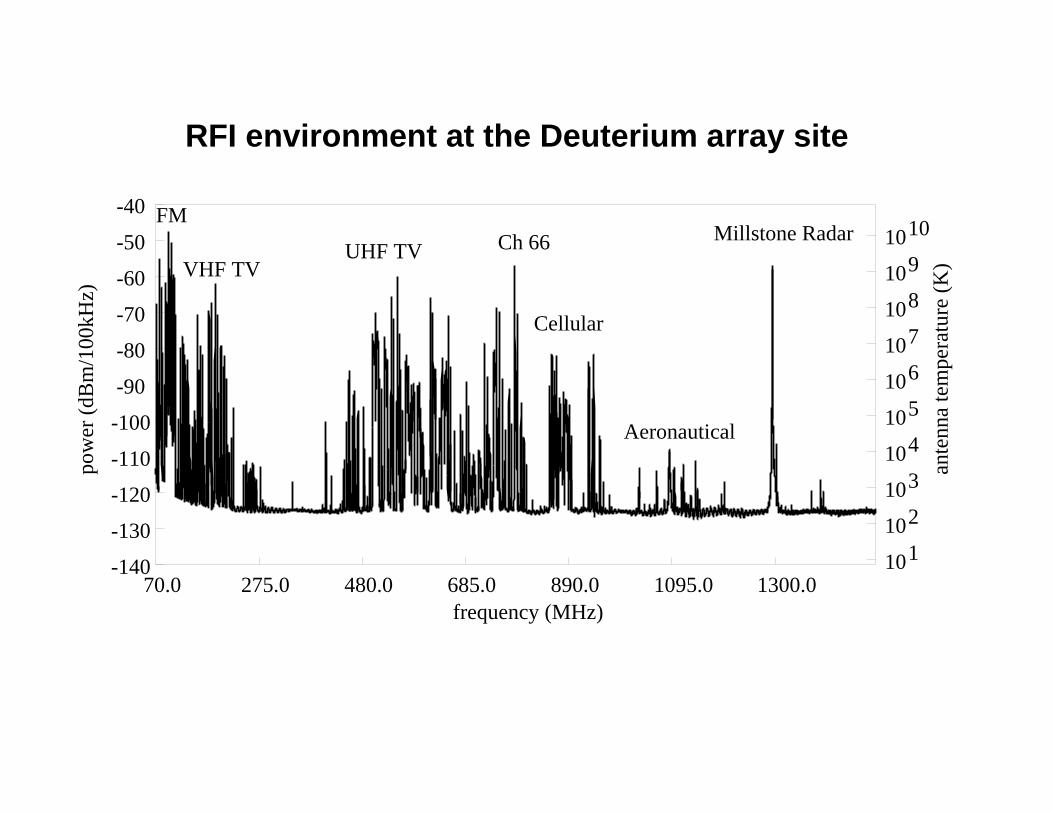
70.0 275.0 480.0 685.0 890.0 1095.0 1300.0-140
-130
-120
-110
-100
-90
-80
-70
-60
-50
-40
1011021031041051061071081091010
pow
er (
dBm
/100
kHz)
ante
nna
tem
pera
ture
(K
)
frequency (MHz)
FM
VHF TVUHF TV Ch 66
Cellular
Aeronautical
Millstone Radar
RFI environment at the Deuterium array site

D1 ARRAY of 24 STATIONS EACH WITH 24 CROSSED-DIPOLES

STATION D00 WITH RFI MONITOR IN BACKGROUND
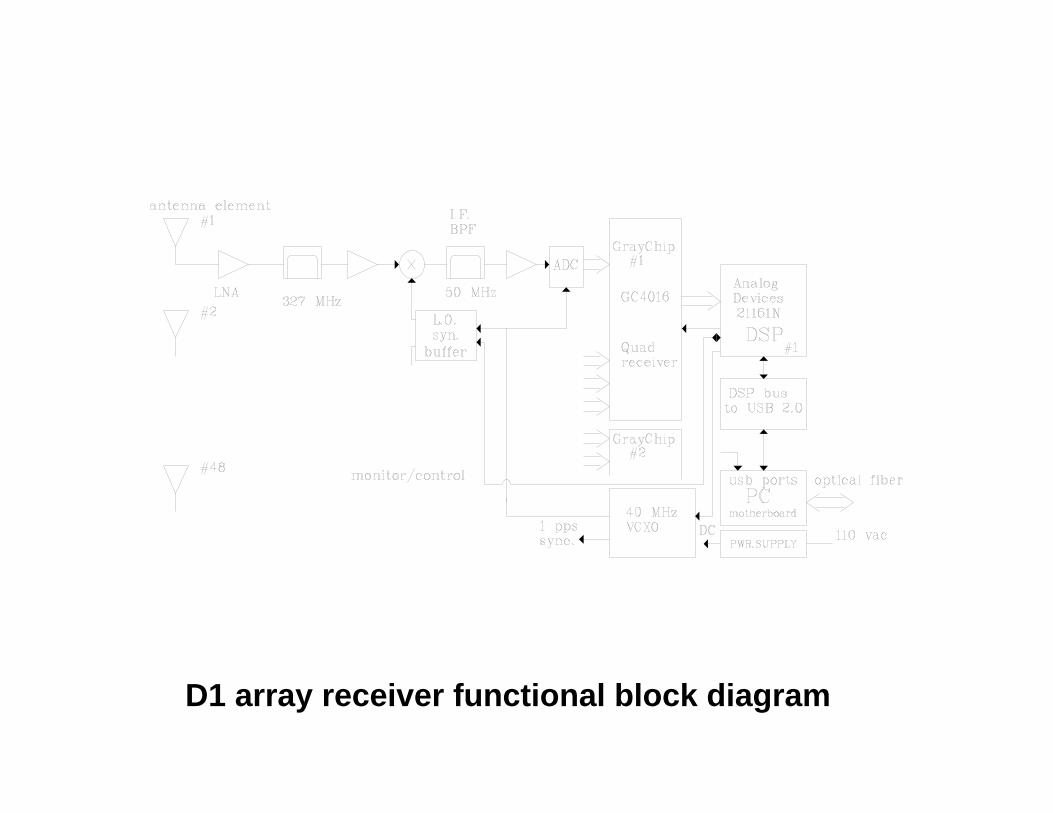
D1 array receiver functional block diagram

48 channel receiver for each station of the array – shown with cover removed
Analog down convertersLocal Oscillator Digital boards

Deuterium array sensitivity
Tsys: 110 K (40 K recvr + 70 K sky)Number antenna sub-arrays: 24Number of polarizations: 2For a resolution of 10 km/s ~ 10 kHz1-sigma noise in 30 days: ~ 100 μK(about 6 months observing a given point in sky)For D/H ~ 2x10⁻⁵ signal only ~ 300 μK(towards Galactic anti-center)

Deuterium array RFI challenges
• Observing extremely weak signals:1 mK in 10kHz ~ -189 dBme.g. signals from Westford ~ 1K
• Ensuring adequate IP2 e.g. mix with TV signals (~ -159 dBm)
(i.e. paging @ 152 + ch7 TV @ 175 = 327)
• Elimination of interference from the receiver electronics

FCC part 15 devices
FCC part 15 limit = 200uV/m at 3m = -49 dBm EIRP
D1 line strength = 300 uK in 10 kHz (in station beam)= -194 dBm
= -122 dBm EIRP at 100m in -10 dBi sidelobe of dipole
i.e. Any part 15 device with 100m of array needs to be~ 73 dB below part 15 limitAny part 15 device 5 km away at limit will be~ 39 dB stronger than the D1 line

Sensitivity to detect* CW RFI(in EIRP at 100m from array)
• RFI monitor active 12 dBi Yagi (Tsys = 200K) in 24 hours - 127 dBm
• Array active dipole (Tsys = 100K,-10 dBi at horizon) in 24 hours - 108 dBm
• Average of all 24x48 dipoles - 123 dBm• All dipoles in 10 days - 128 dBm
* assumes 10 sigma detection and resolution of 244 Hz
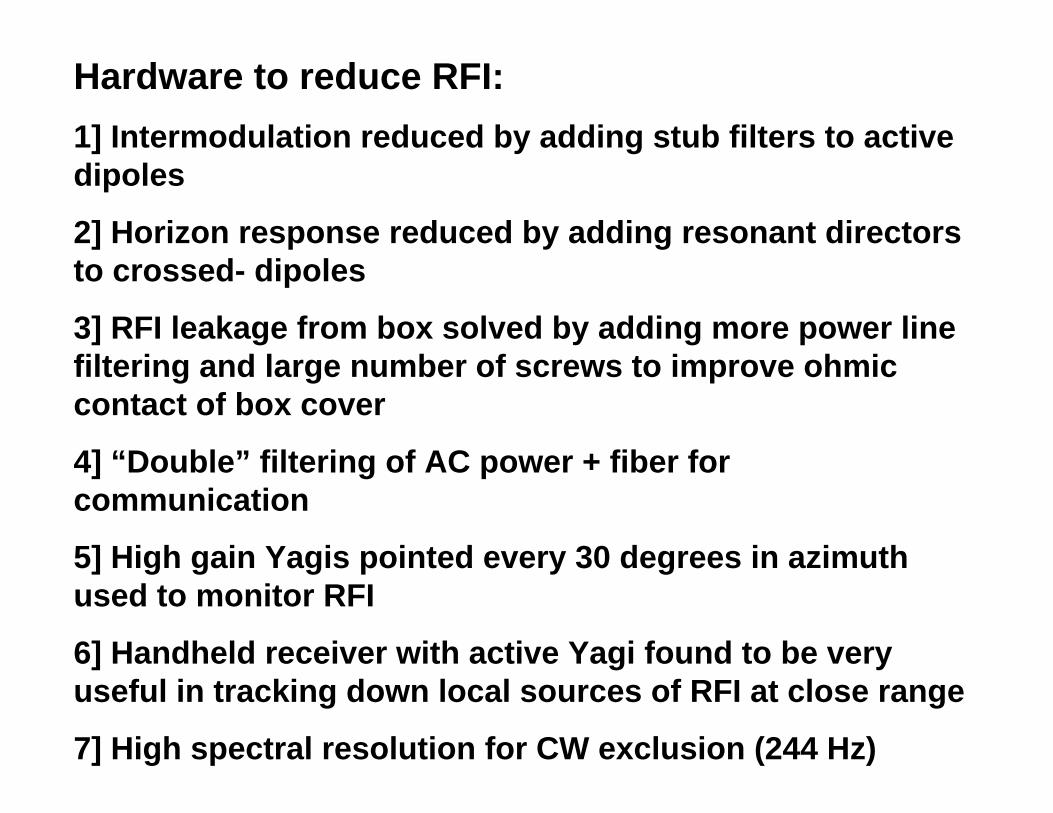
Hardware to reduce RFI:1] Intermodulation reduced by adding stub filters to active dipoles
2] Horizon response reduced by adding resonant directors to crossed- dipoles
3] RFI leakage from box solved by adding more power line filtering and large number of screws to improve ohmiccontact of box cover
4] “Double” filtering of AC power + fiber for communication
5] High gain Yagis pointed every 30 degrees in azimuth used to monitor RFI
6] Handheld receiver with active Yagi found to be very useful in tracking down local sources of RFI at close range
7] High spectral resolution for CW exclusion (244 Hz)

Coaxial stub filters form an integral part of the low noise active dipole antenna
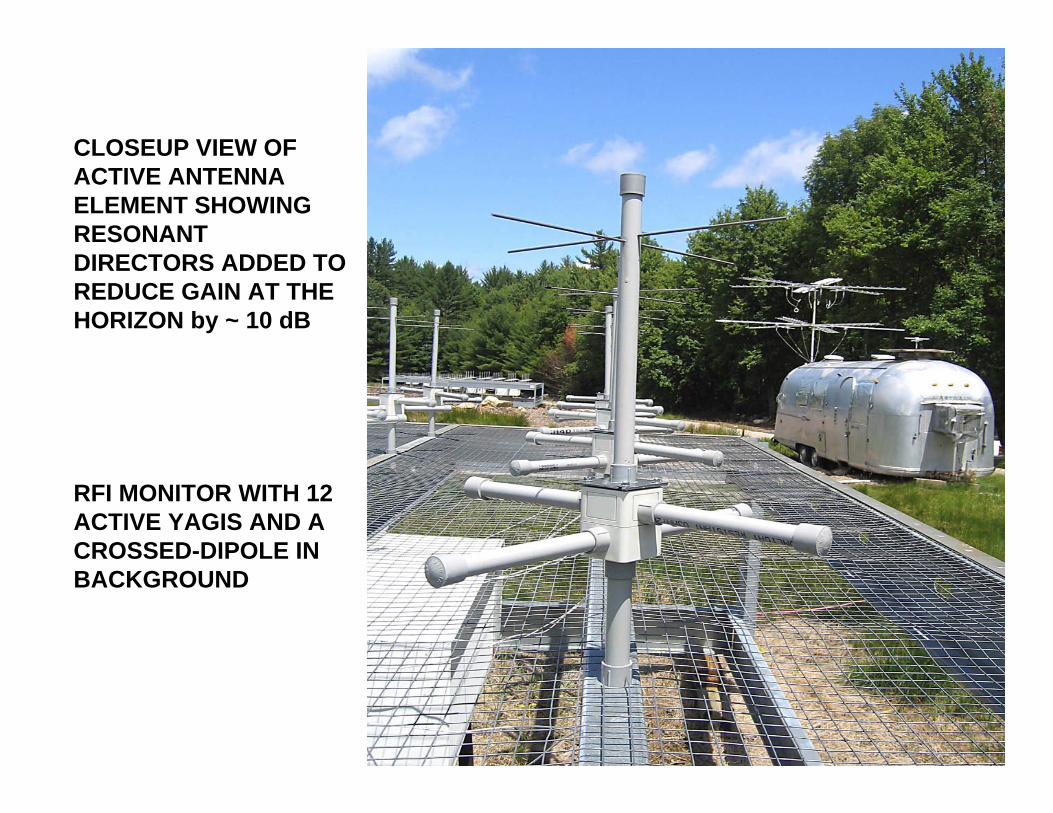
CLOSEUP VIEW OF ACTIVE ANTENNA ELEMENT SHOWING RESONANT DIRECTORS ADDED TO REDUCE GAIN AT THE HORIZON by ~ 10 dB
RFI MONITOR WITH 12 ACTIVE YAGIS AND A CROSSED-DIPOLE IN BACKGROUND


Sources of CW RFI:Almost all RFI has been identified as “local” i.e. within 2 km
RFI examples and fixes:
1] Litespan 2000 harmonics of 1.544 MHz i.e. 212x1.544 = 327.327 MHz
shielded by adding missing cabinet doors and shield on building
2] IR camera electronics spur at 327.275 MHz – equipment removed
3] Emission from receiver box leaking out of power cable – added double
power filtering
4] Panasonic answering machine emission at 327.410 MHz at Westford
machine removed, modem on antenna shut-down
5] With cooperation of neighbors removed signals from various
answering machines in the 327 MHz band.
6] GPS receiver 4.092 x 80 = 327.36 MHz – antenna moved
7] Surround sound 11.2896 x 29 = 327. 3984 MHz – frequency excluded

Other sources of RFI at 327 MHz
• PC motherboard > 100 dB shielding needed• Fiber optic ethernet converter > 100 dB req.• Other PC and electronics within 500 m.• Continuum transients mostly of unknown
origin. These have spectral features due to multipath.

327.275 327.291 327.306 327.322 327.337 327.353 327.369 327.384 327.400 327.416 327.431 327.447 327.462 327.478 327.494 327.509
Example of RFI spectrum from modem about 180m from RFI monitor
Frequency MHz
500mK
0
Sample spectra from Deuterium array RFI monitor

327.275 327.291 327.306 327.322 327.337 327.353 327.369 327.384 327.400 327.416 327.431 327.447 327.462 327.478 327.494 327.509
az0
az30
az60
az90
az120
az150
az180
az210
az240
az270
az300
az330
Example of finding direction from RFI monitor Yagis

Data processing to reduce RFI:1] Excise all transients by excluding all time spans for which there is a greater than 8 sigma detection in 100 seconds of RFI monitor data from any Yagi or greater than 8 sigma detection in any 500 seconds of beam data.
2] Excise all transients for which there is a greater than 10 sigma curvature or third order polynomial coefficient in 100 seconds of RFI monitor data, beam data or average of all 24 channels. [This is useful in removing continuum ripple from multi-path-ed continuum data.]
3] Exclude all 244 Hz frequency channels with a greater than 8 sigma detection in 24 hours of RFI monitor data.
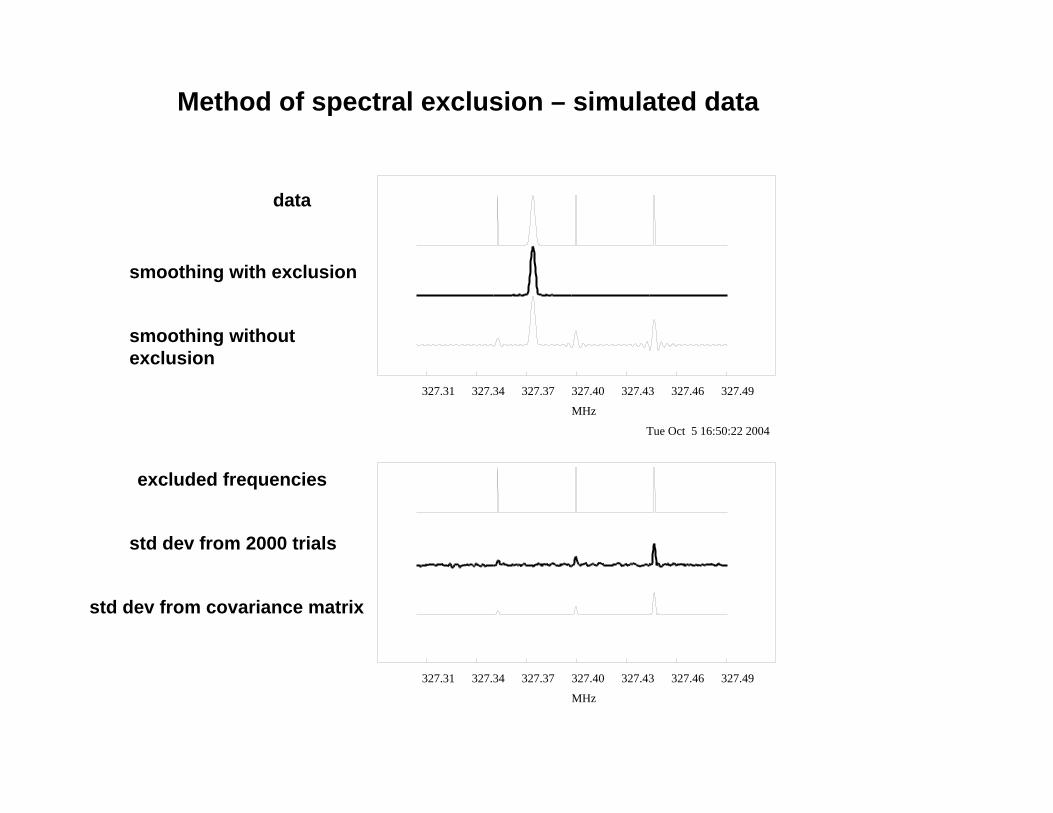
4] Perform weighted least squares fitting of 128 coefficient Fourier series to smooth spectrum giving the excluded channels zero weight. Estimate the standard deviation from the transform of the covariance matrix. Alternately make weighted least squares fit to expected D1 profile and average profile amplitudes.

327.275 327.291 327.306 327.322 327.337 327.353 327.369 327.384 327.400 327.416 327.431 327.447 327.462 327.478 327.494 327.509port num 0 int 138000 sec delta 2.63e-03 rms 3.51e-04 theory 6.09e-05 slope 3.5e-04 pwr 5.39e+04 maxf 327.299414 maxi 100
327.275 327.291 327.306 327.322 327.337 327.353 327.369 327.384 327.400 327.416 327.431 327.447 327.462 327.478 327.494 327.509port num 0 int 111600 sec delta 6.96e-04 rms 8.35e-05 theory 6.77e-05 slope 2.7e-04 pwr 5.45e+04 maxf 327.299414 maxi 100
327.275 327.291 327.306 327.322 327.337 327.353 327.369 327.384 327.400 327.416 327.431 327.447 327.462 327.478 327.494 327.509port num 0 int 58000 sec delta 5.09e-04 rms 9.16e-05 theory 9.40e-05 slope 4.3e-04 pwr 5.85e+04 maxf 327.308691 maxi 138
D1 Array vlsr= 39.4 s=G183 file: /data/d04/2004_099_00.d04b Thu Apr 15 22:45:17 2004
2630 ppm p-p continuum transient without excision
696 ppm p-p partially excised
509 ppm p-p fully excised using all 24 channels to detect
Example of excision of multi-path-ed RFI transient
327.31 327.34 327.37 327.40 327.43 327.46 327.49
MHz
327.31 327.34 327.37 327.40 327.43 327.46 327.49
MHz
Tue Oct 5 16:50:22 2004
Method of spectral exclusion – simulated data
data
smoothing with exclusion
smoothing without exclusion
excluded frequencies
std dev from 2000 trials
std dev from covariance matrix

No excision
Days 2004_167 thru 2004_180 of array data – average of spectra from ALL elements as a test of RFI amelioration
CW not detected by RFI monitor
327.275 327.291 327.306 327.322 327.337 327.353 327.369 327.384 327.400 327.416 327.431 327.447 327.462 327.478 327.494 327.509
rms 3 ppm integ 30.9 yr
17 ppm p-p
rms 4 ppm integ 31.9 yr
24 ppm p-p
rms 5 ppm integ 31.9 yr
32 ppm p-p
transients excised
transients and CW removed
continuum transients produce baseline ripple

res. 6 km/s
-60.0 -50.0 -40.0 -30.0 -20.0 -10.0 0.0 10.0 20.0 30.0 40.0 50.0LSR velocity (km/s)
-2.0 -0.2 -1.0 -0.1 0.0 0.0 1.0 0.1 2.0 0.2 3.0 0.3 4.0 0.4 5.0 0.5 6.0 0.6
7.0 0.7
ampl
itude
(ppm
)
ante
nna
tem
pera
ture
(mK
)
integ. 113.7 yrReference
res. 6 km/s
-2.0 -0.2 -1.0 -0.1 0.0 0.0 1.0 0.1 2.0 0.2 3.0 0.3 4.0 0.4 5.0 0.5 6.0 0.6
7.0 0.7
ampl
itude
(ppm
)
ante
nna
tem
pera
ture
(mK
)
best fit ampl. 3.0 ppm D/H=24 ppm SNR 8.2 integ. 17.5 yrG171
res. 6 km/s
-2.0 -0.2 -1.0 -0.1 0.0 0.0 1.0 0.1 2.0 0.2 3.0 0.3 4.0 0.4 5.0 0.5 6.0 0.6
7.0 0.7
ampl
itude
(ppm
)
ante
nna
tem
pera
ture
(mK
)
best fit ampl. 3.1 ppm D/H=18 ppm SNR 7.1 integ. 15.1 yrG183
res. 6 km/s
-2.0 -0.2 -1.0 -0.1 0.0 0.0 1.0 0.1 2.0 0.2 3.0 0.3 4.0 0.4 5.0 0.5 6.0 0.6
7.0 0.7
ampl
itude
(ppm
)
ante
nna
tem
pera
ture
(mK
)
best fit ampl. 2.4 ppm D/H=18 ppm SNR 3.9 integ. 7.3 yrG195
Observations of the D line in the region of the Galactic anti-center

RFI reduction – summary of steps
• Eliminate all local signals sources• Constantly monitor and issue an alert for
new sources using RFI monitor azimuth information start a search for the new source using handheld receiver + Yagiantenna
• Use RFI monitor and array data to excise transient signals and exclude persistent CW signals

Summary of data loss due to RFI
RFI equivalent loss of integration
transient excision : 5%
CW exclusion: 15%

SUMMARY• RFI/intermod issues have been the dominant
challenge• Most of the RFI was of local origin• Excision of all the data for short periods of time
and the exclusion of frequencies with continuous RFI was found to be sufficient to achieve integrations many years
• We were able to observe the Deuterium line consistent with D/H ~ 20 ppm in the region of the Galactic anti-center