Design of a Single Pilot Cockpit for Airline...
53
DESIGN OF A SINGLE PILOT COCKPIT FOR AIRLINE OPERATIONS PRELIMINARY PROJECT REPORT AUTHORED BY Jonathan Graham Christopher Hopkins Andrew Loeber Soham Trivedi SPONSORED BY Mr. Andrew Lacher of the MITRE Corporation Dr. Lance Sherry of the Center for Aviation Systems Research Dr. Immanuel Barshi of the NASA Ames Research Center George Mason University
Transcript of Design of a Single Pilot Cockpit for Airline...
DESIGN OF A SINGLE PILOT COCKPIT FOR AIRLINE
OPERATIONS
PRELIMINARY PROJECT REPORT
AUTHORED BYJonathan Graham
Christopher HopkinsAndrew LoeberSoham Trivedi
SPONSORED BYMr. Andrew Lacher of the MITRE Corporation
Dr. Lance Sherry of the Center for Aviation Systems ResearchDr. Immanuel Barshi of the NASA Ames Research Center
George Mason UniversityDepartment of Systems Engineering & Operations Research
4400 University Drive Fairfax, Virginia 22030
1 December 2013

Table of ContentsTable of Figures.......................................................................................................................................4
1.0 Context Analysis................................................................................................................................5
1.1 Historical Perspective..................................................................................................................9
1.2 The Two-Pilot Cockpit........................................................................................................................9
2.0 Stakeholder Analysis............................................................................................................................10
2.1 Commercial Air Carriers...................................................................................................................11
2.2 FAA..................................................................................................................................................12
2.3 Customer Base.................................................................................................................................12
2.4 Aviation Workforce..........................................................................................................................13
2.6 Aviation Infrastructure.....................................................................................................................14
2.7 Stakeholder Win-Win.......................................................................................................................15
3.0 Problem and Need Statement.............................................................................................................16
4.0 Requirements......................................................................................................................................19
5.0 Design Alternatives..............................................................................................................................20
5.1 Two Pilot Cockpit.............................................................................................................................21
5.2 Single Pilot No Support....................................................................................................................21
5.3 Onboard Procedure Support System...............................................................................................22
5.4 Ground Pilot Terminal.....................................................................................................................22
6.0 Simulation Methodology.....................................................................................................................23
6.1 Procedure Model.............................................................................................................................23
6.1.1 Procedure Simulation...............................................................................................................26
6.1.2 Procedure Simulation Design of Experiment............................................................................29
6.2 Business Case...............................................................................................................................30
6.2.1 Business Case Design of Experiment.........................................................................................31
7.0 Results.................................................................................................................................................31
8.0 Recommendation and Conclusion.......................................................................................................31
9.0 Project Management...........................................................................................................................32
9.1 Work Breakdown Structure.............................................................................................................32
9.2 Schedule..........................................................................................................................................33
2

9.3 Budget.............................................................................................................................................35
9.4 Risk and Mitigation Plan..................................................................................................................35
9.5 Performance....................................................................................................................................36
10.0 References.........................................................................................................................................38
Table of Figures
Figure 1: Profit/Loss and Net Income for commercial air carriers. Overlayed are bankruptcy filling events. Note: values are adjusted for inflation to 2012 dollars...............................................................................5Figure 2: Yearly operating expense for large US air carriers domestic operations with projected expense based on exponential fit. Note: adjusted for inflation to 2012 dollars........................................................6Figure 3: Operating revenue and expense for major US carrier’s domestic operations..............................7Figure 4: Percentage of major commercial airlines’ operating expense by category..................................7Figure 5: Total and domestic passenger miles based on a regression fit of R^2=0.86 and R^2=0.78 respectively.................................................................................................................................................8Figure 7: Sequence diagram for a "Windshear Detection Procedure" out of the RJ100 FCOM.................10Figure 8: Stakeholder interaction chart.....................................................................................................11Figure 9: Notional Win-Win single pilot cockpit system implementation roadmap..................................15Figure 10: Projected yearly operating expense based on a regression fit. Note: values are inflation adjusted to 2012 dollars and expense through 2022 are in present value................................................17Figure 11: Projected pilot labor growth based on FAA Forecast 2013-2033 pilot growth rate..................18Figure 12: Operating revenue to expense ratio from 1990-2012. Assume red dotted line is the profitability target fixed based on historical levels....................................................................................18Figure 13: Physical process diagram..........................................................................................................21Figure 14: Snapshot of tasks from the RJ100 FCOM..................................................................................23Figure 15: Task completion physical and mental actions...........................................................................25Figure 16: XML schema used to parse Excel sheet....................................................................................26Figure 17: Formulas for the procedure simulation....................................................................................29Figure 18: Value hierarchy for recommendations.....................................................................................32Figure 19: Single Pilot Cockpit WBS...........................................................................................................33Figure 20: Representation of WBS tasks with critical path(s) in red..........................................................34Figure 21: EVM and Budget.......................................................................................................................36Figure 22: CPI and SPI................................................................................................................................37
3
1.0 Context Analysis
Commercial air transportation is an immensely complex system and an equally
complex business. Transportation is a large percentage of the US economy with commercial
aviation accounting for 4.9 %−5.2 %of total US GDP [1]. Moving cargo and passengers
around the world is a vital service with far reaching impact to consumers and businesses.
Successfully operating such a complex system is dependent on a business’ ability to
efficiently meet transportation demand by balancing operating constraints and financial
goals. As major stewards of economic growth, commercial aviation is responsible for
balancing flight demand with profitability driving business decisions.
Despite air transportation’s importance, the industry has historically had extremely
poor financial performance over the course of its existence, which has intensified in recent
years. Between 2000 and 2012 thirty percent of all United States based airline companies
have filed for chapter eleven bankruptcy.
19901992
19941996
19982000
20022004
20062008
20102012
-40,000,000,000.00
-30,000,000,000.00
-20,000,000,000.00
-10,000,000,000.00
0.00
10,000,000,000.00
20,000,000,000.00
Profit/Loss
Profit/LossNet Income
Year
Dol
lars
(Bill
ions
)
*BTS Schedule P1.2
Bank-ruptcy Filed
Figure 1: Profit/Loss and Net Income for commercial air carriers. Overlayed are bankruptcy filling events. Note: values are adjusted for inflation to 2012 dollars.
Figure 1 illustrates the volatile nature of the industries finances in the last two decades.
The chart specifically demonstrates the financial performance of major US based air
carriers, which, for the purposes of this study, will be defined as any agency with operating
4

revenue greater than twenty million dollars. A portion of this volatility can be correlated
with major market trends at the time, such as the dotcom bubble of March 2000, which
acted as a catalyst in exposing some of the underlying issues plaguing the industry. The
crash in 2000 ended the period of relative financial stability that had lasted through most
of the previous decade.
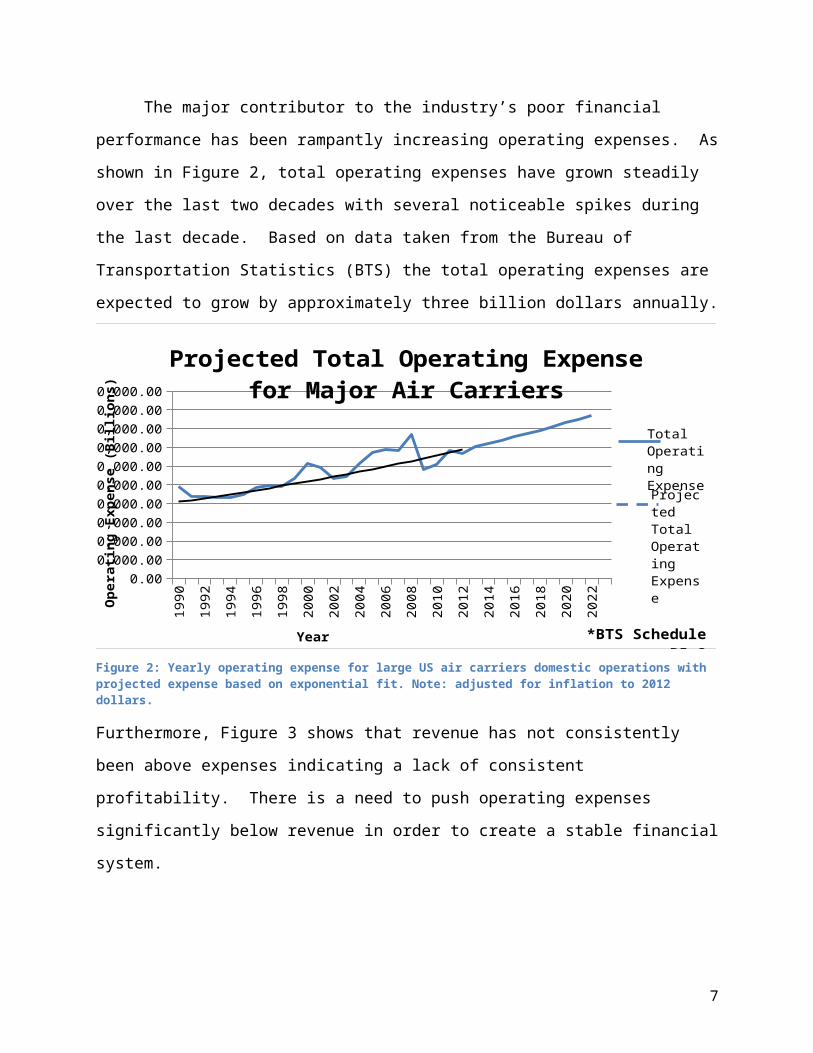
The major contributor to the industry’s poor financial performance has been
rampantly increasing operating expenses. As shown in Figure 2, total operating expenses
have grown steadily over the last two decades with several noticeable spikes during the
last decade. Based on data taken from the Bureau of Transportation Statistics (BTS) the
total operating expenses are expected to grow by approximately three billion dollars
annually.
1990
1992
1994
1996
1998
2000
2002
2004
2006
2008
2010
2012
2014
2016
2018
2020
2022
0.0020,000,000,000.0040,000,000,000.0060,000,000,000.0080,000,000,000.00
100,000,000,000.00120,000,000,000.00140,000,000,000.00160,000,000,000.00180,000,000,000.00200,000,000,000.00
Projected Total Operating Expense for Major Air Carriers
Year
Ope
rati
ng E
xpen
se (B
illio
ns)
Total Operat-ing Ex-pensePro-jected Total Operat-ing Ex-pense
*BTS Schedule P5.2
Figure 2: Yearly operating expense for large US air carriers domestic operations with projected expense based on exponential fit. Note: adjusted for inflation to 2012 dollars.
Furthermore, Figure 3 shows that revenue has not consistently been above expenses
indicating a lack of consistent profitability. There is a need to push operating expenses
significantly below revenue in order to create a stable financial system.
5

19901992
19941996
19982000
20022004
20062008
20102012
0.00
20,000,000,000.00
40,000,000,000.00
60,000,000,000.00
80,000,000,000.00
100,000,000,000.00
120,000,000,000.00
140,000,000,000.00
160,000,000,000.00
180,000,000,000.00
Operating Revenue and Expense
Operating RevenueOperating Expense
Year
Re
ven
ue
(B
illio
ns)
*BTS Schedule P5.2
Figure 3: Operating revenue and expense for major US carrier’s domestic operations.
Eighty percent of total operating expenses can be decomposed into four major
categories: fuel costs, airline operations, pilot labor costs, and direct maintenance costs. As
illustrated by Figure 4 airline operations, pilot labor, and direct maintenance costs have all
remained relatively static over the past two decades. Fuel costs, however, have rapidly
risen since the end of the 1990’s. Fuel costs are variable, and dictated by entities outside of
the airline industry. Other costs, like pilot labor are within the jurisdiction of airline
management and can therefore be manipulated to beneficially affect the industry’s total
operating expense. Pilot labor costs make up fewer than six percent of total operating
expense. Although pilot labor costs have remained relatively constant over the last two
decades it is beginning to slowly increase.
19
90
19
91
19
92
19
93
19
94
19
95
19
96
19
97
19
98
19
99
20
00
20
01
20
02
20
03
20
04
20
05
20
06
20
07
20
08
20
09
20
10
20
11
20
120.00
10.00
20.00
30.00
40.00
50.00
60.00
% Operations Expense for Major Air Carriers
% Pilot% Fuel% Dir Maint% Air Ops
Year
% O
pe
rati
on
s C
ost
*BTS Schedule P5.2
Figure 4: Percentage of major commercial airlines’ operating expense by category.
6
According to the FAA’s Aerospace Forecast FY 2013-2033 a 3% yearly increase in
revenue passenger miles is projected over the period of 2012-2022 [2]. That is equivalent
to a 30 % increase in passenger demand by the end of the next decade. Using BTS data as
the baseline for comparing passenger miles demand with operating expense, it is shown
that there is an 26.95 % increase in passenger miles (slightly less than FAA forecasts) from
2012-2022 [6]. Since the scope of the analysis is concerned with domestic operations, the
total increase in demand for domestic passenger miles is projected to increase 33.28 %
based on the same BTS data when fitted for domestic passenger miles only. As it is shown
in Figure 5, domestic passenger demand comprises the majority of passenger miles flown.
19961998
20002002
20042006
20082010
20122014
20162018
20202022
0
200,000,000
400,000,000
600,000,000
800,000,000
1,000,000,000
1,200,000,000
Projected Passenger Miles
DomesticTotal
Year
Pas
sen
ger
Mile
s (B
illio
ns)
*BTS T-100 Market & Segment
Figure 5: Total and domestic passenger miles based on a regression fit of R^2=0.86 and R^2=0.78 respectively.
Rising expenses and declining revenues have motivated airlines to operate aircraft
that have reduced crew requirements enabled by technological innovations. With advances
in technology, the systems benefit with increased reliability, safety, and affordability [3].
Fundamentally, the dynamics of aircraft flight haven’t changed but advancements in flight
control technologies, imposed by the need to reign in operating expenses, have significantly
shaped the way systems operate, or more appropriately, how pilots fly the aircraft.
A core component in any aircraft and air transportation system are the pilots who
fly the aircraft. As the need for reduced operating expense has lead to advanced
technologies in the aircraft, the roles and functional need of pilots change. The goal of this
project is to design a system that supports a level of automation that would enable the
7

flight of an aircraft by one pilot to support decreased operating expense while maintaining
or increasing system safety and reliability.
1.1 Historical Perspective
Removing pilots from the cockpit has been a strategy used in the past to help save on
labor costs, as aircraft that require fewer pilots decrease the cost associated with flying the
aircraft.. Originally, a cockpit contained five pilots, each filling a distinct role. Over time, the
roles of navigators, flight engineers, and radio operators have been eliminated due to
technological innovations in their respective functional areas [4]. With the current need for
increased financial stability and a solution for the looming pilot shortage, moving from the
current two-pilot paradigm to a single pilot cockpit may be the next logical step.
1.2 The Two-Pilot Cockpit
In most major aircrafts there are two pilot roles filled by the captain and co-pilot:
they are the pilot flying (PF) and the pilot not flying (PNF). Both the captain and co-pilot
can fill either role as needed and often switch to fulfill training/certification requirements.
The major responsibilities of the PF include flying the aircraft, confirming callouts and
inspecting instruments. The PNF handles of interactions with ATC, performs cockpit
callouts, inspects and manipulates instruments and, if needed, takes over the responsibility
of flying the aircraft. All of their responsibilities are described within an official FAA
approved document called the Flight Crew Operating Manual (FCOM). An FCOM details
flight procedures for all potential situations that a plane may be in for both on the ground
and in the air operations. For the purposes of this project the team has analyzed the
procedures described within the FCOM for a Swiss Airlines owned and operated RJ100
aircraft.
Flight procedures detail the established processes followed to operate an aircraft and
the responsible pilot. A procedure is decomposed into a series of tasks within the FCOM.
An example procedure is illustrated in the sequence diagram below Figure 6. The
procedure shown is one that is completed when a wind shear has been detected. The four
standard actors within this procedure and a majority of others are the PF, PNF, Aircraft and
ATC. Each message represents a task, in this case the PF completes a series of physical
8

tasks before performing a cockpit callout at which point the PNF takes over several
physical and cognitive tasks before interacting with the ATC.
Figure 6: Sequence diagram for a "Windshear Detection Procedure" out of the RJ100 FCOM
2.0 Stakeholder Analysis
Commercial aviation is a major provider of transportation services. Since aviation is
a large part of the US economy, major advancements in the forms of new systems have a
large impact for all persons regardless of personal air transportation utilization. The
commercial aviation industry has a diverse range of stakeholders involved in its continued
operation, each with its own motives, resources, and functions. The various involved
parties and the relationships that they have with one another are detailed in Figure 8 and
Table 1 below. The involved entities can be divided into four main categories: regulatory
agencies (FAA, DoT), aviation workforce (pilots, air traffic controllers, and the unions
representing them), aviation infrastructure (airports, aircraft manufacturers, and
insurance agencies), and the customer base. While airline companies have a vested interest
in increasing their profitability by implementing a single pilot cockpit solution, many of the
other agencies in the industry may have serious reservations about moving away from the
existing two-pilot system, especially regulatory agencies.
9

Figure 7: Stakeholder interaction chart.
2.1 Commercial Air Carriers
Commercial air carriers are primarily driven by their business objectives. Airline
managers are entrusted to operate and monitor the business in accordance with their
predefined business objectives. Just like any other business, air carriers must make
decisions around how profitability and costs are affected.
Implementing a single pilot cockpit to reduce the need for pilot labor will be a
favorable option for commercial air carriers due to the potential cost savings. However,
they would run into serious conflicts with many of the aviation industry’s stakeholders,
presenting a series of potential challenges in moving forward with implementation. In any
market, ignoring the needs of consumers is bad for profitability. Commercial aviation
would not survive if it ignored customers, employees, or regulators.
10
Support SPC
Reserved about SPC
Oppose SPC

2.2 FAA
As a regulatory body, the FAA’s primary objective is to create and enact policy with
the express purpose of maintaining or improving aviation safety. The agency is granted the
power to regulate aviation and create policy in line with its mission to create a safe and
efficient airspace [5]. As such, the FAA holds the reins on whether or not a single pilot
cockpit system would be approved and allowed to operate. The agency would be very
skeptical of a single pilot cockpit because it represents such a significant departure from
current aviation systems. A single pilot cockpit is inherently counter to the FAA’s objectives
because it lowers aircraft reliability by reducing a human pilot by a machine.
Action to resolve conflicts between air carriers and the FAA would be very laborious
and time consuming. Rigorous testing and analysis would have to be completed to
demonstrate to the FAA that the single pilot cockpit is feasible from a safety and reliability
standpoint, as well as prove that the established minimum reliability standards will be met.
System design alternatives will have to meet regulatory standards and include long term
impact to pilot certification, air traffic control, aircraft certification, and airports. The FAA
would be the authority on any impact to the National Airspace System (NAS) in addition to
its regulatory role. Objectives may greatly vary from each segment of the NAS. Even if all
other stakeholders are brought into agreement on a particular single pilot system, the FAA
will be the ultimate hurdle for aviation companies to overcome, as they are required to give
the legal authorization to operate such a system.
2.3 Customer Base
The customer base for commercial aviation are mostly concerned about getting
from point A to point B as cheaply, comfortably, safely, and timely as possible. They may be
concerned about both cost and safety and may be skeptical of flying on aircraft with only
one pilot, when they have become so accustomed to flying on planes with two or more
pilots onboard. Over time, the fact that one pilot is flying would become less controversial
just like any other instance of technology replacing pilots (navigator, radio operator, and
engineer). Passengers may take longer to become accustomed to the single pilot system
due to the perceived lack of failover capability, such as the fear that the one pilot in the
11
cockpit may become incapacitated without a co-pilot to provide backup would cause a
major aircraft accident. Air carriers can also counteract passengers’ initial safety concerns
about single pilot air transport by offering reduced rates compared to their competitors,
which would be easier to accomplish with the resultant cost savings following from labor
cost reduction.
2.4 Aviation Workforce
The aviation workforce is comprised of pilots, air traffic controllers, and the unions
that represent them. They are primarily interested in preserving existing job and wage
stability, as well as ensuring that current levels of workload and safety conditions are
maintained. The notion that only a single pilot would be needed for air carrier operations
would be a serious point of contention between air carriers and pilots. Pilots and unions
alike would be extremely worried that a reduction in pilot labor demand from moving to a
single pilot system would immediately put thousands of pilots out of work, likely leading
them to applying a lot of pushback against the efforts of air carriers to implement such a
system.
Air Traffic Controllers (ATC) has immense responsibility to ensure the National
Airspace System is safe and well managed. ATC’s objectives are much like the pilot’s in that
they want to maintain employment, bring home a stable salary, maintain workload, work in
a safe environment, and have career growth opportunities. Air traffic controllers will also
likely oppose a single pilot system initially, but for slightly different reasons than pilots.
ATC will be primarily concerned that their operational procedures would significantly
change under a new system. In addition to changing their procedures, increasing ATC task
load would be unacceptable from their standpoint. Systems that seamlessly integrate
existing procedures and ATC protocol may be acceptable, though some initial skepticism is
expected.
12

2.6 Aviation InfrastructureAviation infrastructure includes aviation insurance companies, airports, and aircraft
manufacturers. In general, these agencies are primarily driven by maintaining consistent
revenue, market predictability, and a low risk profile, as well as holding onto and
expanding on their current customer base.
Aircraft manufacturers have a vested interest in selling and leasing their airplanes
to airlines. They are constantly seeking new ways to better their product lineups and take
them to market. The move to a single pilot cockpit could prove to be a good opportunity to
develop a new, unique product that can be sold or leased for an increased profit compared
to older models. As long as the R&D costs involved in redesigning the firm’s existing plane
models doesn’t outstrip the potential for a higher profitability, aircraft manufactures would
likely be the only stakeholder besides the airlines themselves to push for implementing a
single pilot system.
Aviation insurance companies will be keenly aware of the increased level of risk that
introducing a single pilot system would have on flight safety. As such, they will likely
require a probationary period for testing a plane newly-developed to operate under the
single pilot paradigm in order to collect enough data to make the appropriate adjustments
to their premiums. As long as insurance agencies are given enough time to adapt their
insurance plans to the shifting aviation landscape, they are not likely to have much of an
issue with the move to a single pilot cockpit.
Airports serve as departing and arrival junctions for air transportation. The
infrastructure required to meet these needs is very complex and requires significant capital
investment. Changes to the system would greatly impact operations and may be a
significant bottleneck in terms of system operations. Airport’s objectives are to maintain its
infrastructure and keep cost of existing or new systems as low as possible. Airports may
develop conflicts with the airline companies because they are balancing operations for all
sizes of air carriers, different schedules/capacities, and are pressured to ensure there are
no gaps in service. Implementing new systems would be perceived as risky and costly
regardless of long run benefits or intent, so airports would need to be assured that the
added complexity from implementing a new system would not be significant enough to
overcomplicate their business operations.
13

Stakeholder Group Primary Objectives Tension with Single Pilot Cockpit
Regulatory Agencies(FAA, DoT)
• Maximize:• Flight safety• Consumer protection
A SPC would inherently introduce new risks and decrease overall flight safety, leading regulatory agencies to withhold their approval
Aviation Workforce (Pilots, Pilots’ Unions, ATC, ATC Unions)
• Maintain:• Job Stability• Wage Stability• Safety level• Workload
View SPC as a major potential threat to job stability, leading to a high risk of pushback
Customer Base • Minimize:• Travel time• Flight risk• Ticket expenses
May have reservations about flying in a plane with only one pilot, leading them to avoid flying with an airline that uses a single pilot cockpit
Aviation Industry(Air Carriers, Management, Manufactures, Insurance, & Airports)
• Maintain:• Consistent revenues• Customer base• Market predictability• Low risk profile
Want to increase profitability through sales/service, but don’t want to increase expenses commit to long term investments without noticeable return
Table 1: Table displaying major objective conflicts between stakeholders
2.7 Stakeholder Win-Win
Given the complicated stakeholder relationship for the single pilot cockpit system, a
win-win will not be established by selecting a particular alternative, rather it will be an
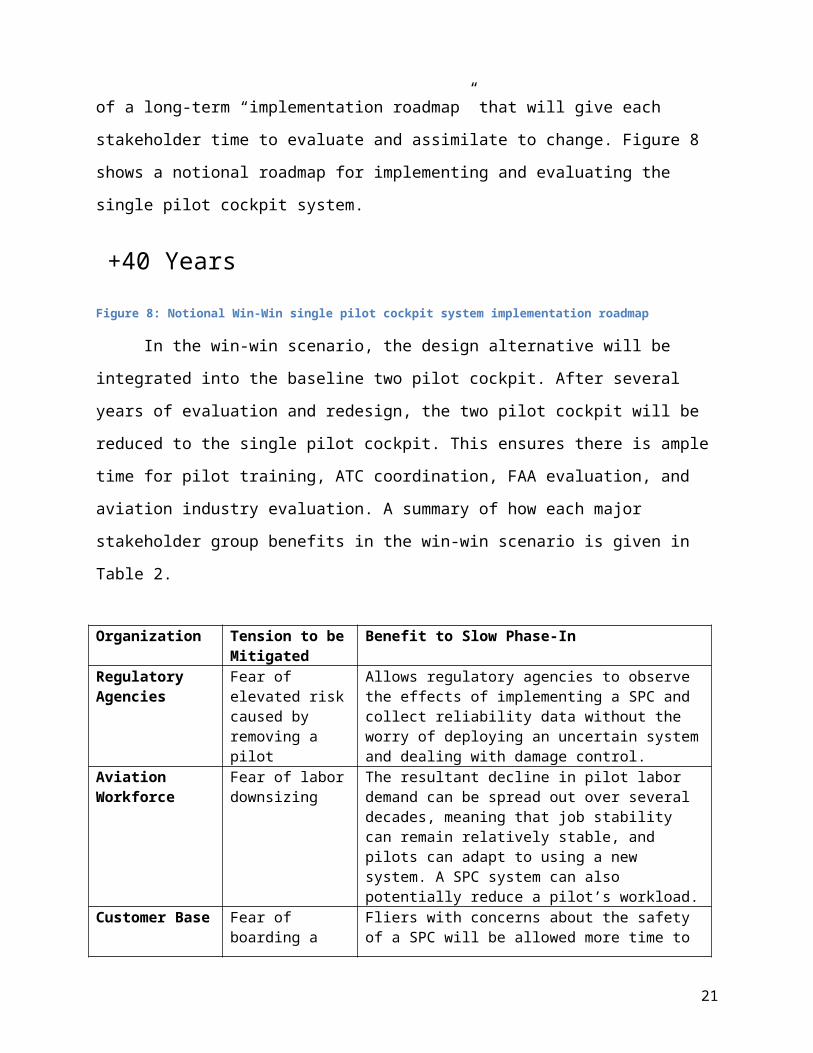
outcome of a long-term “implementation roadmap” that will give each stakeholder time to
evaluate and assimilate to change. Figure 8 shows a notional roadmap for implementing
and evaluating the single pilot cockpit system.
Figure 8: Notional Win-Win single pilot cockpit system implementation roadmap
14
Two Pilot
Cockpit
Two Pilot
Cockpit with
Alternative
Single Pilot
Cockpit
Evaluation of
Alternative
Today
+10-15 Years
+20-30 Years
+40 Years

In the win-win scenario, the design alternative will be integrated into the baseline
two pilot cockpit. After several years of evaluation and redesign, the two pilot cockpit will
be reduced to the single pilot cockpit. This ensures there is ample time for pilot training,
ATC coordination, FAA evaluation, and aviation industry evaluation. A summary of how
each major stakeholder group benefits in the win-win scenario is given in Table 2.
Organization Tension to be Mitigated
Benefit to Slow Phase-In
Regulatory Agencies
Fear of elevated risk caused by removing a pilot
Allows regulatory agencies to observe the effects of implementing a SPC and collect reliability data without the worry of deploying an uncertain system and dealing with damage control.
Aviation Workforce Fear of labor downsizing
The resultant decline in pilot labor demand can be spread out over several decades, meaning that job stability can remain relatively stable, and pilots can adapt to using a new system. A SPC system can also potentially reduce a pilot’s workload.
Customer Base Fear of boarding a plane being flown by a single pilot
Fliers with concerns about the safety of a SPC will be allowed more time to acclimate to the new technology. Also, the majority viewpoint will shift due to changing generational attitudes regarding automation in general.
Aviation Industry Fear of costs/changes needed to adapt to new system
Airports and aircraft manufacturers will be given additional time to adapt their operations, products, and business plans to the current phase of SPC deployment, keeping them from wasting resources on developing unutilized solutions.
Table 2: Win-Win analysis table
3.0 Problem and Need Statement
Commercial aviation is projected to have increasing operating expense from 2013 to
2022 at an increase of 30% based on an exponential regression fit. Growing operating
expenses are presumed to relate to growing demand for air transportation. Figure 5 shows
the projected demand in terms of yearly revenue passenger miles. Although passenger
transportation is not the only demand data point, is arguably the largest.
15

1990
1992
1994
1996
1998
2000
2002
2004
2006
2008
2010
2012
2014
2016
2018
2020
2022
0.0020,000,000,000.0040,000,000,000.0060,000,000,000.0080,000,000,000.00
100,000,000,000.00120,000,000,000.00140,000,000,000.00160,000,000,000.00180,000,000,000.00200,000,000,000.00
Projected Total Operating Expense for Major Air Carriers
Year
Ope
rati
ng E
xpen
se (B
illio
ns)
Total Operat-ing Ex-pensePro-jected Total Operat-ing Ex-pense
*BTS Schedule P5.2
Figure 9: Projected yearly operating expense based on a regression fit. Note: values are inflation adjusted to 2012 dollars and
expenses through 2022 are in present value.
The Federal Aviation Administration (FAA) has predicted a six percent growth in
demand for pilots between 2012 and 2022 [2]. Unfortunately, due to factors such as a
change in flight hour requirements for co-pilots, increased mandatory rest time, and a
decreased retirement age from 65 to 60 there is an increasing gap between forecasted
supply and demand. Figure 10 graphically depict the historic pilot labor force with the
projected labor supply and demand. A single pilot cockpit system may help reduce the
impact to a projected pilot shortage and bring some stability for future labor supply.
The projected shortage of pilots will ultimately cost the airlines in terms of lost flight hours
and increasing pilot pay. As the number of available pilots decreases, the cost for pilot labor
increases and consequently, increases the overall operating expense. A single pilot cockpit
could potentially mitigate the effects of a pilot labor shortage by reducing crew
requirements allowing the existing labor pool to be spread more evenly.
16
1990
1991
1992
1993
1994
1995
1996
1997
1998
1999
2000
2001
2002
2003
2004
2005
2006
2007
2008
2009
2010
2011
2012
2013
2014
2015
2016
2017
2018
2019
2020
2021
2022
0
10000
20000
30000
40000
50000
60000
70000
80000
Projected Pilots
Year
Pilo
ts (T
hous
ands
)
Total Pilots
Pro-jected Supply
Pro-jected Pilot De-mand
*BTS Schedule P10
Figure 10: Projected pilot labor growth based on FAA Forecast 2013-2033 pilot growth rate.
Increasing demand for air transportation, a projected pilot labor shortage, and
rising operating expenses will continue to negatively impact commercial aviation’s ability
to attain stable financial performance. Commercial aviation needs to implement systems
that will reduce operating expense so that operating revenue will be larger than operating
expense.
19901991
19921993
19941995
19961997
19981999
20002001
20022003
20042005
20062007
20082009
20102011
20120
0.2
0.4
0.6
0.8
1
1.2
1.4
GAP (Operating Revenue:Expense)
Ratio
Year
Rati
o
Tar-get Ratio
Figure 11: Operating revenue to expense ratio from 1990-2012. Assume red dotted line is the profitability target fixed based
on historical levels.
17

The GAP in Figure 11 graphically describes the problem: operating revenue as a
ratio to operating expense is smaller or close to one over the past twelve years. Assuming
that the ratio is an indicator of profitability, bringing the ratio back to the levels of the
1990’s would produce a financially stable industry. Measures that reduce targeted
portions of operating expense, i.e. pilot labor, would have an impact on decreasing the gap.
Referring back to Error: Reference source not found, it is shown that operating expense on
items like fuel and pilot labor are two significant line items that account for a large portion
of yearly operating expenses. If a two pilot cockpit is reduced to a one pilot cockpit via
automation, the total operating expense of air carriers can be reduced and increase
operating revenue. This reduction would impact commercial aviation’s ability to reduce
long term operating expense and attain less extreme deviations in profitability.
4.0 Requirements
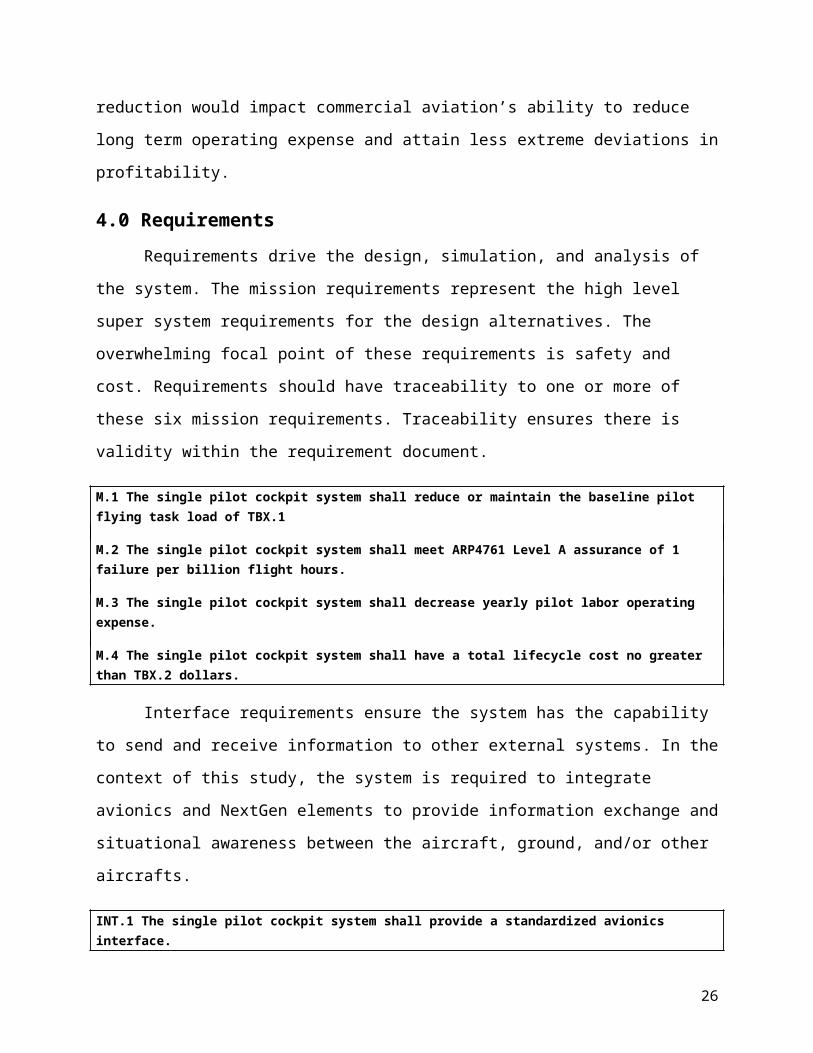
Requirements drive the design, simulation, and analysis of the system. The mission
requirements represent the high level super system requirements for the design
alternatives. The overwhelming focal point of these requirements is safety and cost.
Requirements should have traceability to one or more of these six mission requirements.
Traceability ensures there is validity within the requirement document.
M.1 The single pilot cockpit system shall reduce or maintain the baseline pilot flying task load of TBX.1
M.2 The single pilot cockpit system shall meet ARP4761 Level A assurance of 1 failure per billion flight hours.
M.3 The single pilot cockpit system shall decrease yearly pilot labor operating expense.
M.4 The single pilot cockpit system shall have a total lifecycle cost no greater than TBX.2 dollars.
Interface requirements ensure the system has the capability to send and receive
information to other external systems. In the context of this study, the system is required to
integrate avionics and NextGen elements to provide information exchange and situational
awareness between the aircraft, ground, and/or other aircrafts.
INT.1 The single pilot cockpit system shall provide a standardized avionics interface.
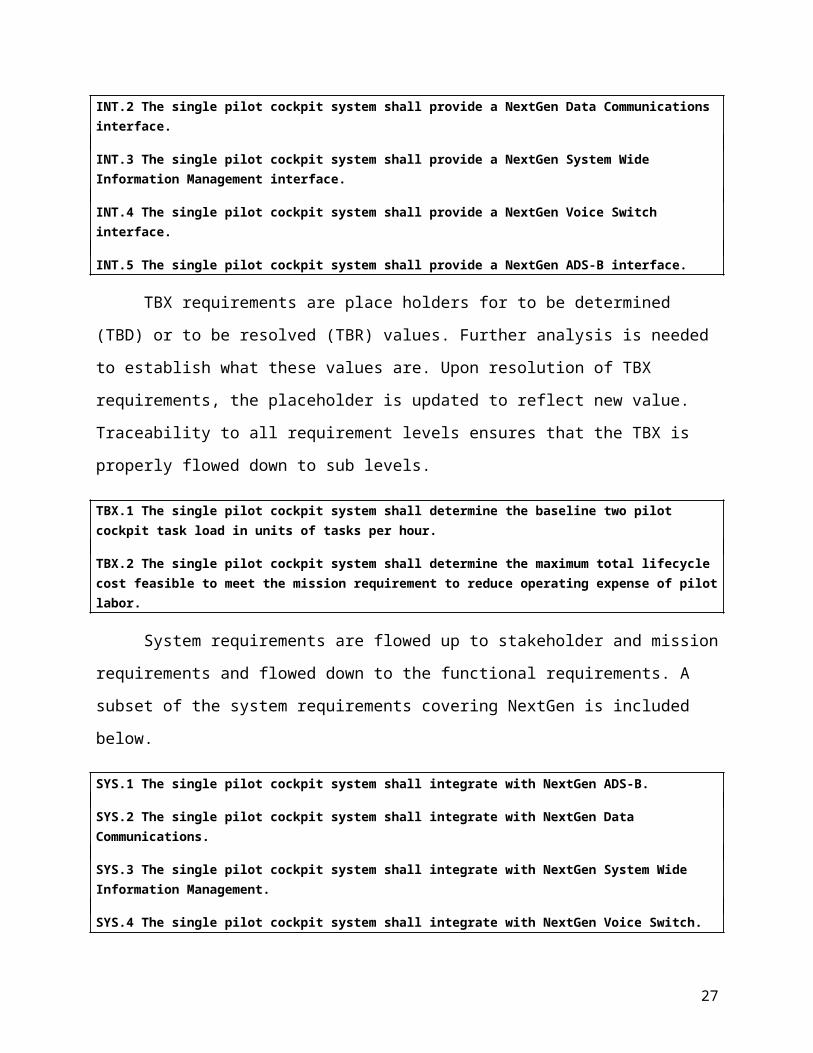
INT.2 The single pilot cockpit system shall provide a NextGen Data Communications interface.
18
INT.3 The single pilot cockpit system shall provide a NextGen System Wide Information Management interface.
INT.4 The single pilot cockpit system shall provide a NextGen Voice Switch interface.
INT.5 The single pilot cockpit system shall provide a NextGen ADS-B interface.
TBX requirements are place holders for to be determined (TBD) or to be resolved
(TBR) values. Further analysis is needed to establish what these values are. Upon
resolution of TBX requirements, the placeholder is updated to reflect new value.
Traceability to all requirement levels ensures that the TBX is properly flowed down to sub
levels.
TBX.1 The single pilot cockpit system shall determine the baseline two pilot cockpit task load in units of tasks per hour.
TBX.2 The single pilot cockpit system shall determine the maximum total lifecycle cost feasible to meet the mission requirement to reduce operating expense of pilot labor.
System requirements are flowed up to stakeholder and mission requirements and
flowed down to the functional requirements. A subset of the system requirements covering
NextGen is included below.
SYS.1 The single pilot cockpit system shall integrate with NextGen ADS-B.
SYS.2 The single pilot cockpit system shall integrate with NextGen Data Communications.
SYS.3 The single pilot cockpit system shall integrate with NextGen System Wide Information Management.
SYS.4 The single pilot cockpit system shall integrate with NextGen Voice Switch.
SYS.5 The single pilot cockpit system shall integrate with aircraft avionics.
5.0 Design Alternatives
System design alternatives are described as a black box system. The nature of the
design and analysis relies on the fact these technologies are largely absent within the
current scope and context (outside of the baseline case). Although the component
technologies are available, the integration of these components specifically for task
automation/pilot replacement is unfounded. It is the assumption that the feasibility of such
designs is derived from the task hierarchy and task performance associated with each
alternative.
19

Figure 12: Physical process diagram
The physical process diagram shown in Figure 12 describes the basic operation of the
aircraft based on pilots following standardized operating procedures. The design
alternatives will be augmenting the procedures and tasks which impact how the pilot(s) fly
the aircraft.
5.1 Two Pilot Cockpit
The baseline cockpit system shall be the two pilot cockpits. The majority of aircraft
used for air transport require, at a minimum, two pilots to fly. Some aircraft may have
requirements for larger crew sizes, but the scope of this analysis is domestic operations;
which presumably eliminates aircraft that may require more than two crew because of
aircraft size or flight time.
The RJ100 FCOM will be used as the baseline procedural model for the two pilot
cockpits. These procedures will be manipulated per the technological capabilities of each
subsequent alternative.
5.2 Single Pilot No Support
Evaluating a system where only a single pilot flies the aircraft with no support for
the pilot not flying roles is necessary to see what the change in workload will be for a pilot
20
SystemStart Aircraft State
Procedures
Target Aircraft State
Flight Goal
Pilots
with and without some sort of technology to replace the flying and support role of the pilot
not flying. Procedures where the pilot interacts with the co-pilot will be dropped, but some
of the actions performed by the pilot not flying will be transitioned to the pilot flying.
Potentially, the component tasks of the procedures maybe reduced. Costs would certainly
be reduced by simply transitioning to the single unsupported pilot, though the load from
the procedures will more than likely be unsuitable relative to the baseline case.
5.3 Onboard Procedure Support System
Noting that the technology does not exist currently, a “black box” system will be
designed to implement automation that handles the task load of a co-pilot. This system
design alternative takes flight state data and input from ground based entities and the
single pilot. The data is used to execute predefined tasks such as those designated in a flight
crew operating manual (FCOM). Automated tasks will fill the void left by the absence of a
co-pilot. Feasibility for the task automation system is evaluated in terms of task load on the
pilot flying and total lifecycle cost. If safety is impacted i.e. increased pilot task load or full
lifecycle cost is too high, the system won’t be a viable alternative. Error: Reference source
not found shows the functional flow of the task automation system.
5.4 Ground Pilot Terminal
If UAVs can be flown via ground based command and control, can the co-pilot role
be moved to a ground based pilot terminal? The design alternative will communicate with
flight hardware to give a “virtual” representation of flight dynamics to the ground co-pilot.
The avionics are extended from the aircraft to the ground through a command downlink
(CDL) with a ground based command uplink (CUL) to the aircraft. The design assumes the
ground terminal can be assigned to multiple flights. Just like an air traffic controller or
flight dispatcher tracks and hands off flights, the ground based terminal will have the
ability to be net-centric and handoff flight control.
The system will have to augment procedures to account for queuing of multiple
flights. The procedure simulation and business model will determine what the thresholds
are in terms of performance and cost. Other factors maybe added into the simulation
through scenarios such as CDL link loss or complete ground failure. In any alternative, the
21

ability for a pilot to perform with automation failure should be addressed within the scope
of the simulation and its assumptions.
6.0 Simulation Methodology
The design alternatives provide a mechanism to augment the pilot role being
replaced for the single pilot cockpit system. Two important factors are analyzed: how the
procedures change relative to the baseline two pilot case, and how does each alternative
impact airline operating expense. The single pilot cockpit is driven by market forces in both
the commercial aviation industry, and the commercial pilot labor market. A design
alternative that can improve the outlook in both areas will be evaluated.
6.1 Procedure Model
Procedure models offer insight into how users operate a system. In a cockpit
scenario, procedure models can help isolate pilot performance bottlenecks and sources of
error [7]. Analysis of flight crew operating procedures is done to create a baseline two-pilot
performance for comparing design alternative’s performance. Procedure performance is
assumed to be directly related to safety and reliability for the purpose of determining
design feasibility.
The procedure model represents the standard operating procedure for flying a
sophisticated jet aircraft. The procedures are derived from an RJ-100 Flight Crew
Operators Manual (FCOM) and modeled to capture the actions required to complete a
procedure which is decomposed by tasks and actions. We first extract each procedure
specification sections from the manual into an Excel spreadsheet to identify the responsible
entities to execute a task. An example snapshot of the spreadsheet is in Figure 13.
Figure 13: Snapshot of tasks from the RJ100 FCOM.
22

The tasks are composed of functions that require specific physical and/or mental
actions to be performed by one or both pilots. Responsible entities are identified as: Pilot
Flying (PF), Pilot Not Flying (PNF), Co-Pilot (COPI), Pilot Occupying the Left Seat (PIC), and
Both Pilots (B/P). Each task has one or more identified actions associated with its
execution. Actions are described in Table 3. The use of actions to describe the task is driven
by the need to assign a performance measure to the overall structure. Figure 14 shows the
frequency of actions relative to each entity. These frequencies are derived from the initial
Excel spreadsheet data. The XML procedure model is expected to grow the number of
actions as more fidelity is added to each subtask in the hierarchy model. The ability to
design a full human factors experiment with live pilots as experimental subjects is outside
the scope of this systems design and analysis. Simplifications are made to facilitate a high
level representation of psychomotor and cognitive performance. The procedure simulation
section will discuss limitations in greater detail, to include experimental design and input
modeling.
Name Description Example
Physical Instrument Manipulation
Classifies tasks that require an entity interact physically with avionics or controls
Pushing Throttle Forward
Verbal Cockpit Callout Tasks that require specific verbal messages to be broadcasted for all crew to hear
Announce Checklist is Completed
Physical Flight Computer Interaction
Extended interaction with the flight computer comprises several defined actions so it is described by its own category
Inputting Flight Plan
Accepting New Plan ATC
Auditory Reception Tasks requiring directed interaction and listening states fall into this category
Listening to Radio
Memory Action Actions that are to be preformed based on abnormal and emergency scenarios
Emergency Task
Visual Instrument Inspection
Observing and checking an instrument has a target value
Check Warning Light On
Visual Environment Inspection
Observing the outside of the airplane (flight environment)
Look Out for Runway on Approach
Verbal External Communication
Extended periods of conversation requiring specific focus
ATC Comms
Table 3: Table lists the basic physical and mental actions that are required for each task.
23

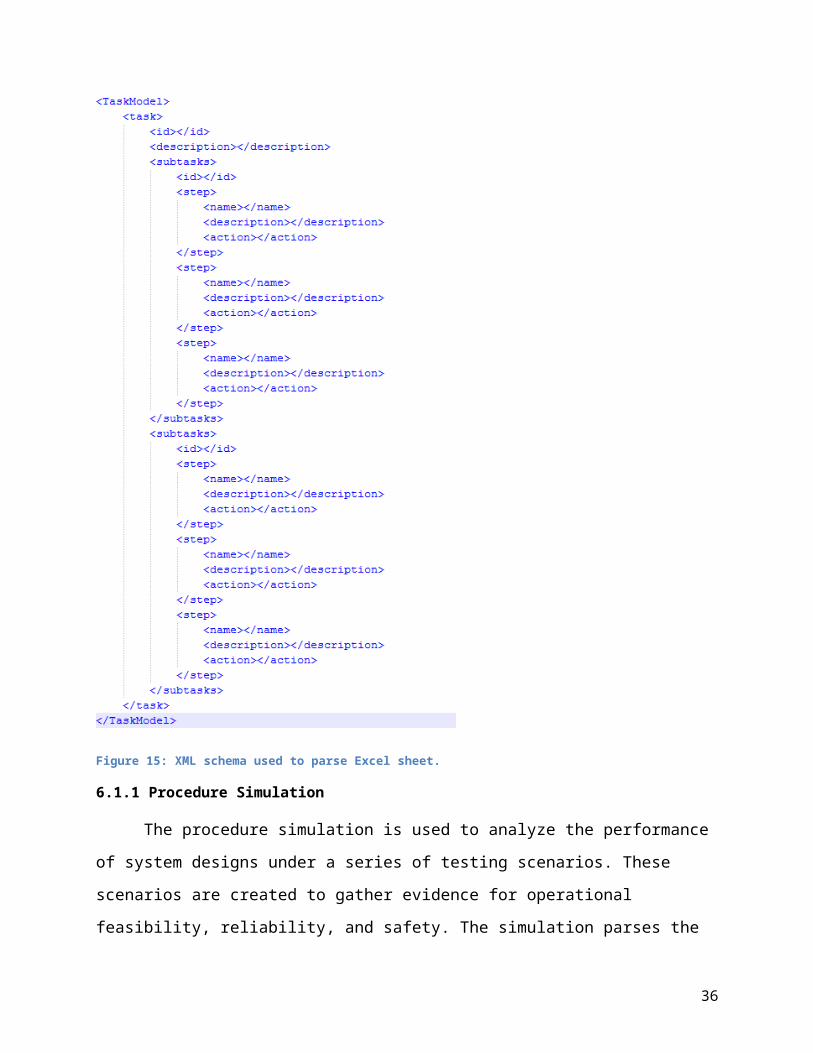
The procedure model is decomposed further into a custom XML schema so that it
can later be easily parsed into the simulation program. The base schema is shown in Figure
15. Tasks are decomposed based on the entity responsible and their responsible subtasks.
Each subtask is decomposed further into a set of steps and actions that characterize the
parent subtask. For the task model, we assume that the tree is executed sequentially and
any cross dependency will be captured by hierarchical arrangements.
Physical
Instrument M
anipulation
Verbal C
ockpit C
allout
Physical
Flight C
omputer Inter
action
Auditory
Reception
Memory
Action
Visual I
nstrument In
spection
Visual E
nvironment In
spection
Verbal E
xternal C
ommunication
020406080
100
Frequency of Actions
PFPNFB/PPICCOPI
Task Related Actions
Freq
uenc
y Cou
nt
Figure 14: Task completion physical and mental actions.
The procedure model is assumed to be authoritative when instantiated for specific
flight scenarios, that is, behavior (if any) outside the scope of the FCOM will not be
considered. An individual procedure model is created for each design alternative before
being input into the simulation program. The procedure model abstracts the capabilities of
each technology in the form of functional performance. The functionality manipulates
which component tasks and actions can be handled by a new system replacing a pilot. The
remaining pilot in each procedure model will have changes to their procedure based on
hypothetical interaction with each design alternative.
24

Figure 15: XML schema used to parse Excel sheet.
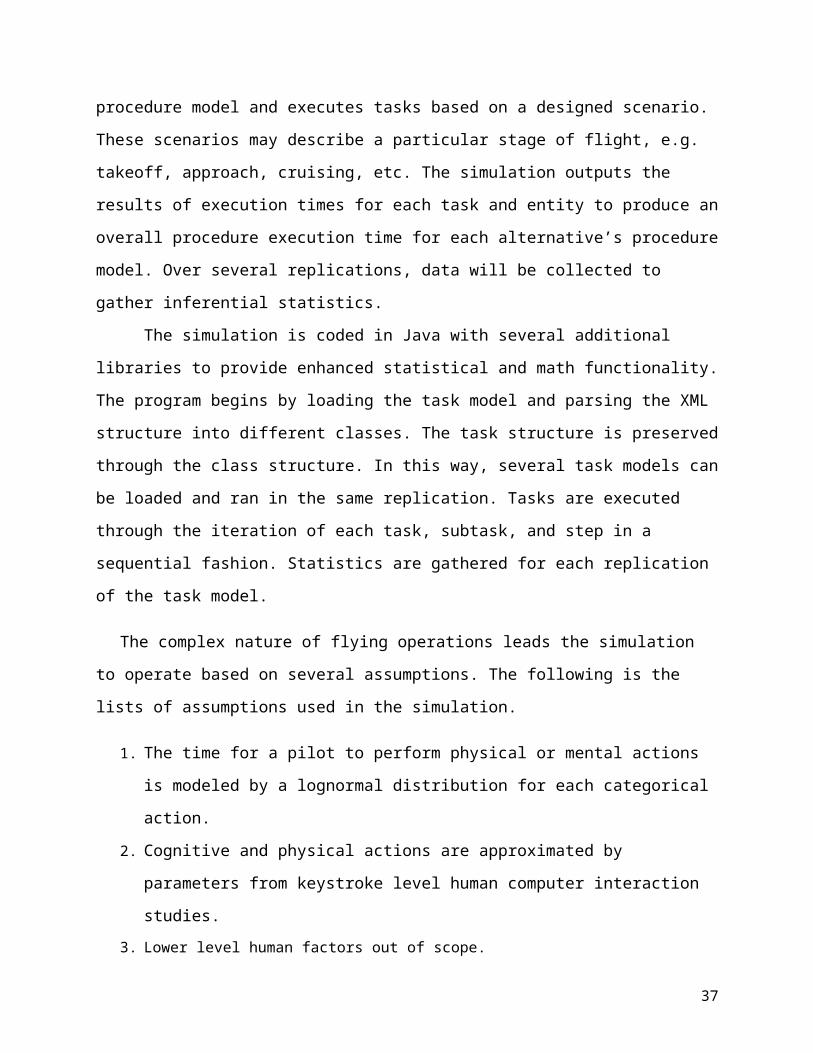
6.1.1 Procedure Simulation
The procedure simulation is used to analyze the performance of system designs
under a series of testing scenarios. These scenarios are created to gather evidence for
operational feasibility, reliability, and safety. The simulation parses the procedure model
and executes tasks based on a designed scenario. These scenarios may describe a particular
stage of flight, e.g. takeoff, approach, cruising, etc. The simulation outputs the results of
25
execution times for each task and entity to produce an overall procedure execution time for
each alternative’s procedure model. Over several replications, data will be collected to
gather inferential statistics.
The simulation is coded in Java with several additional libraries to provide
enhanced statistical and math functionality. The program begins by loading the task model
and parsing the XML structure into different classes. The task structure is preserved
through the class structure. In this way, several task models can be loaded and ran in the
same replication. Tasks are executed through the iteration of each task, subtask, and step in
a sequential fashion. Statistics are gathered for each replication of the task model.
The complex nature of flying operations leads the simulation to operate based on
several assumptions. The following is the lists of assumptions used in the simulation.
1. The time for a pilot to perform physical or mental actions is modeled by a lognormal
distribution for each categorical action.
2. Cognitive and physical actions are approximated by parameters from keystroke
level human computer interaction studies.
3. Lower level human factors out of scope.
4. RJ100 FCOM used to model procedures are representative for other two pilot jet airliners.
5. Procedure model is a complete representation of flight
6. Ignore company specific tasks outside of FCOM.
Based on the assumptions above, distributions must be used to generate random
variates within the simulation. These variates describe the time it takes to perform a
physical and/or mental action within the task execution process. Table 4 shows the
notional representation of the stochastic action times. The parameters of the distributions
are approximated using keystroke level model functions. For example, mental actions take
1.2s, button pushes take 0.1s with a sequence of 2 mental actions and 4 button pushes
taking 2.8s. The total time to complete the task based on the actions required will be
treated as the estimator for the mean and variance of the distribution.
The random variables at the action level of the procedural model represent the bottom
most structure of the overall tree. The procedure model is decomposed by tasks and
component actions. Each alternative will manipulate the number of tasks and actions in a
26
procedure. The simulation iterates through the tree and replicates the simulation results in
a Monte Carlo simulation fashion governed by the equations in Figure 14.
Name Parameters Distribution
Physical Instrument Manipulation
μ̂=∑k
ln (xk )n , σ̂2=∑
k
ln (xk−μ )2
nActionTime Lognormal
Verbal Cockpit Callout
μ̂=∑k
ln (xk )n , σ̂2=∑
k
ln (xk−μ )2
nActionTime Lognormal
Physical Flight Computer Interaction
μ̂=∑k
ln (xk )n , σ̂2=∑
k
ln (xk−μ )2
nActionTime Lognormal
Auditory Reception μ̂=∑k
ln (xk )n , σ̂2=∑
k
ln (xk−μ )2
nActionTime Lognormal
Memory Action μ̂=∑k
ln (xk )n , σ̂2=∑
k
ln (xk−μ )2
nActionTime Lognormal
Visual Instrument Inspection
μ̂=∑k
ln (xk )n , σ̂2=∑
k
ln (xk−μ )2
nActionTime Lognormal
Visual Environment Inspection
μ̂=∑k
ln (xk )n , σ̂2=∑
k
ln (xk−μ )2
nActionTime Lognormal
Verbal External Communication
μ̂=∑k
ln (xk )n , σ̂2=∑
k
ln (xk−μ )2
nActionTime Lognormal
Table 4: Distribution table for physical and mental performance times
The alternative processing time is an expected value generated from several
replications of the simulation for a target confidence interval. The processing time is the
weighted summation of the procedures as defined by each alternative’s unique procedure
model. Statistical tests are used to determine if there is a significant difference in the
expected alternative processing time relative to the two pilot cockpit baseline system
design. The design of experiment in 6.1.2 Procedure Simulation Design of Experiment
details the inputs and outputs of the simulation. Because system dynamics are out of scope
of the research, the simulation makes simplifications for the processing time of each
alternative in the form of a uniform and triangular distribution.
27

Figure 16: Formulas for the procedure simulation
6.1.2 Procedure Simulation Design of Experiment
Inputs OutputsAlternativ
eProcedure
s Tasks Actions Alternative Processing Time
Two Pilot P1…Pn T1m…Tnm Lognormal~A1r…Amr TBD
Single Pilot No
SupportP1…Pn T1o…Tno Lognormal~A1r…Aor TBD
Procedure Support System
P1…Pn T1p…Tnp Lognormal~A1r…
Apr Uniform~A1r…Apr TBD
Ground Pilot
Terminal P1…Pn T1q…Tnq
Lognormal~A1r…Aqr
Triangular~A1r…Aqr TBD
28
6.2 Business Case
The business model aims to determine the cost feasibility of each design alternative.
Based on a set of input assumptions, how do the operating costs of major air carriers
respond to the decrease of pilot labor? To answer this question, a business case is
developed to evaluate each design alternative against. If the expected lifecycle cost is less
than the two pilot baseline case, then the design may be evaluated as a suitable system
depending on factors such as significance and sensitivity to change.
The lifecycle model is based on the operating cost of the most popular commercial
jet airliner – the Boeing 737-300 [8]. Random variables are used for each of the costs and
are derived from triangular distributions based on historical BTS data as shown in the
design of experiment Table 5. A Monte Carlo simulation is used to produce the expected
lifecycle cost based on several thousand replications for a target confidence interval.
E [ALC ]=CAlt
(1+d )t+∑
t=1
N CPilot
(1+d )t+∑
t=1
N COthLabor
(1+d )t+∑
t=1
N CMaint
(1+d )t+∑
t=1
N CEquip
(1+d )t
Calt=alternativeunit cost
COthLabor=other labor costs
CEquipment=equipment costs
CMaint=maintenance costs
CDirectLabor=labor costs
The above equation is used to generate the lifecycle cost for a period of t years where t will
be the average fleet age of the Boeing 737-300’s reported through Form 41 fillings to the
US DOT. The cost for each alternative is estimated using a triangular distribution which
picks a best, worst, and most likely case. The parameters are unknown due to the
undeveloped state of most of the alternatives, but historical avionics systems will be used
where appropriate to estimate the unit cost of the alternative.
29
6.2.1 Business Case Design of Experiment
Inputs Outputs
Alternative Alternative Cost Other Labor & Maintenance Expected Aircraft Lifecycle Cost
Baseline Two Pilot -- Triangular(a,b,c) TBD
Single Pilot No Support
Triangular(a,b,c) Triangular(a,b,c) TBD
Procedure Support Triangular(a,b,c) Triangular(a,b,c) TBD
Ground Pilot Terminal Triangular(g,h,i) Triangular(a,b,c) TBD
Table 5: Design of experiment for the business model and simulation
7.0 Results
Results are currently pending simulation completion and outputs. At this time, the
procedure support system is predicted to be the best performing alternative with respect
to cost and procedure processing time.
8.0 Recommendation and Conclusion
Pending sensitivity analysis of the results, recommendations will be made in line
with a value hierarchy developed to support the win-win of the stakeholders. The value
hierarchy is shown in Figure 17. Each alternative will have a utility cost function created to
evaluate each design.
30

Figure 17: Value hierarchy for recommendations
9.0 Project Management
9.1 Work Breakdown Structure
The work breakdown structure for the projects is comprised of twelve root level
tasks which are decomposed further into several subtasks for a total of one hundred and
twenty tasks. The WBS serves as the basis for scheduling and cost estimation. Tasks are
defined in an iterative and sequential manner rather than intertwining dependencies
across each section. The independence of each root level category is designed in such a
manner that the WBS is a combination of twelve distinct sub-plans.
31

Figure 18: Single Pilot Cockpit WBS
9.2 Schedule
Based on the WBS as defined in 9.1 Work Breakdown Structure, the schedule consists of all
component subtasks and milestones that make up the overall project. The critical path for the
project is through the 10.0 Deliverable Preparation & Assembly tasks. Because so much time is
dedicated to preparing for preliminary and final deliverables, the most important part of the overall
schedule is described by the work under 10.0 Figure 19 shows the tasks involved in completing
WBS 10.0 Though there are not the most concentrated in terms of frequency, they take the most
amount of time and resources to complete. It is important to note that the 8.0 Modeling and
Simulation task hierarchy is a close second to the established critical path. Most of our risks arise in
section 8.0
32

Figure 19: Representation of WBS tasks with critical path(s) in red
33

9.3 Budget
The budget to complete the project is based on a $50.00 hourly rate per person with
a GMU overhead factor of 47 % for a total billing rate of $106.38 per hour. The estimated
hours required to complete the project is 701 hours. The planned budgeted value of the
project is $74,574.47
9.4 Risk and Mitigation Plan
Risks to the project have been identified with all but one (busy co-sponsor) affecting
critical path tasks. Steps have been identified to mitigate the identified project risks.
Risk Description Mitigation Rating
Simulation Complexity
There is a chance that the complexity of the
simulation and task model will cause scheduling
delays which may impact the ability to produce
results for the IEEE paper due in February.
Plan to devote significant work to simulation
during the winter break period. Simulation coding
started ahead of schedule.
Likelihood: LikelyImpact: Major
Procedure Complexity
The number of tasks to be modeled is very large and takes significant resources due to manual nature of
input.
Plan to make scope changes to simulation to target a subset of tasks should risk become an
issue.
Likelihood: LikelyImpact: Major
Busy Co-SponsorNASA Ames researcher has
been unavailable to support project.
Working with other sponsors to get
additional resources.
Likelihood: LikelyImpact: Minor
Input Data
Serious assumptions were made in regards to task performance modeling. Further information is
required to find additional data to validate
assumption or provide actual performance data.
Soliciting feedback from professors, sponsor, and
professional pilots. Professors will provide insight into stochastic
modeling and sponsor/pilots to provide
input data.
Likelihood: Very Likely
Impact: Major
Table 6: Risk and risk mitigation planning table
34

9.5 Performance
Earned Value is used to track the performance of the project. We have started over
budget due to front-end work on deliverables, but expect to fall below the planned value as
milestones are passed. To estimate work completion rate, the ratio of number of subtasks
completed to total tasks in a WBS category is used.
1 3 5 7 9 11 13 15 17 19 21 23 25 27 29 31 33 35 37-$10,000.00
$10,000.00
$30,000.00
$50,000.00
$70,000.00
$90,000.00
$110,000.00
EVM
EVPVACWorst CaseBest Case
Week
Dolla
rs
Figure 20: EVM and Budget
Figure 21 shows the CPI and SPI indexes for the project by week. The schedule and cost
increases are shown to reflect the EVM and budget from Figure 20. At the current state of
the project, the group is approaching target budget and schedule. A worst case and best
case budget have been created to show performance margin. The budgets are created
based on ±25% of the planned budget.
35
1 2 3 4 5 6 7 8 9 100.00
0.20
0.40
0.60
0.80
1.00
1.20
1.40
CPI / SPI
CPISPI
Week
Ratio
Figure 21: CPI and SPI
10.0 References
36
[1] "The Economic Impact of Civil Aviation on the US Economy," FAA, Washington, DC, 2011.
[2] FAA Aerospace Forecast Fiscal Years 2013-2033, Washington, DC: FAA, 2013.
[3] "US Air Carrier Traffic Statistics Through June 2013," Bureau of Transportation Statistics, June 2013. [Online]. Available: http://apps.bts.gov/xml/air_traffic/src/index.xml#MonthlySystem. [Accessed September 2013].
[4] H. K. Y. K. Julian Archer, "Effects of Automation in the Aircraft Cockpit Environment: Skill Degradation, Situation Awareness, Workload," Purdue University, West Lafayette, Indiana, 2012.
[5] R. Koteskey, "Single Pilot Operations TIM," 10-12 April 2012. [Online]. Available: http://human-factors.arc.nasa.gov/groups/FDDRL/SPO/download/presentations/RobKoteskey%20SPO%20TIM%20CRM%20Presentation-Shared.pdf. [Accessed 15 September 2013].
[6] "Mission," FAA, 23 April 2010. [Online]. Available: http://www.faa.gov/about/mission/. [Accessed 27 September 2013].
[7] T. M. A. L. Jan-Patrick Osterloh, "WP3 - Preparation of the Virtual Simulation Platform," 7 June 2009. [Online]. Available: http://www.human.aero/wp-content/uploads/2009/08/d34-virtualsimulationplatform.pdf. [Accessed 13 October 2013].
[8] "Air Carrier Financial : Schedule P-10," Bureau of Transportation Statistics, 2012. [Online]. Available: http://www.transtats.bts.gov/Fields.asp?Table_ID=302. [Accessed September 2013].
[9] "Review of Accident Data," National Transportation Safety Board, 6 August 2013. [Online]. Available: http://www.ntsb.gov/data/aviation_stats.html. [Accessed 15 September 2013].
[10] J. Durso, "An Introduction to DOT Form 41," 30 December 2007. [Online]. Available: http://ntl.bts.gov/lib/26000/26700/26745/An_Introduction_to_DOT_Form_41_Web_Resources_Durso0.pdf. [Accessed 25 September 2013].
[11] "Data Profile: Air Carrier Financial Reports (Form 41 Financial Data)," Bureau of Transportation Statistics, 27 September 2013. [Online]. Available: http://www.transtats.bts.gov/DatabaseInfo.asp?DB_ID=135&Link=0. [Accessed 27 September 2013].
[12] "Air Carrier Financial : Schedule P-5.2," Bureau of Transportation Statistics, March 2013. [Online]. Available: http://www.transtats.bts.gov/Fields.asp?Table_ID=297. [Accessed September 2013].
[13] "Electronic Code of Federal Regulations," Government Printing Office, 25 September 2013. [Online]. Available: http://www.ecfr.gov/cgi-bin/text-idx?c=ecfr&tpl=/ecfrbrowse/Title14/14tab_02.tpl. [Accessed 27
37

September 2013].
[14] "Regions and Aeronautical Center Operations," FAA, 3 August 2012. [Online]. Available: http://www.faa.gov/about/office_org/headquarters_offices/arc/. [Accessed 13 October 2013].
[15] "NextGen Implementation Plan," FAA, Washington, DC, 2013.
[16] N. A. Parimal Kopardekar, "Beyond NextGen: AutoMax Overview and Update," NASA, Irvine, CA, 2013.
[17] J. W. Ramsey, "Integrated Modular Avionics: Less is More," Avionics Today, 1 February 2007.
[18] J. N. A. P. Susan Carey, "Airlines Face Acute Shortage of Pilots," 12 November 2012. [Online]. Available: http://online.wsj.com/news/articles/SB10001424052970203937004578079391643223634#articleTabs%3Darticle. [Accessed October 2013].
[19] M. Shaaban, "Flanking the Price War," The Motley Fool, 6 December 2012. [Online]. Available: http://beta.fool.com/pirlo0o/2012/12/06/flanking-price-war/17959/. [Accessed 29 November 2013].
38