Design and Implementation of an Adaptive Underwater...
62
UNIVERSITY OF CALIFORNIA, SAN DIEGO Design and Implementation of an Adaptive Underwater Acoustic Modem and Test Platform A Thesis submitted in partial satisfaction of the requirements for the degree Master of Science in Computer Science by Jennifer Trezzo Committee in charge: Ryan Kastner, Chair Joseph Pasquale Curt Schurgers Alex Snoeren 2013
Transcript of Design and Implementation of an Adaptive Underwater...
UNIVERSITY OF CALIFORNIA, SAN DIEGO
Design and Implementation of an Adaptive Underwater Acoustic Modem and
Test Platform
A Thesis submitted in partial satisfaction of the requirements for the degreeMaster of Science
in
Computer Science
by
Jennifer Trezzo
Committee in charge:
Ryan Kastner, ChairJoseph PasqualeCurt SchurgersAlex Snoeren
2013

Copyright
Jennifer Trezzo, 2013
All rights reserved.

The Thesis of Jennifer Trezzo is approved, and it is acceptable in quality and form for
publication on microfilm and electronically:
Chair
University of California, San Diego
2013
iii

TABLE OF CONTENTS
Signature Page . . . . . . . . . . . . . . . . . . . . . . . . . . . . . . . . . . . . . . . . . . . . iii
Table of Contents . . . . . . . . . . . . . . . . . . . . . . . . . . . . . . . . . . . . . . . . . . iv
List of Figures . . . . . . . . . . . . . . . . . . . . . . . . . . . . . . . . . . . . . . . . . . . . v
List of Tables . . . . . . . . . . . . . . . . . . . . . . . . . . . . . . . . . . . . . . . . . . . . vi
Acknowledgements . . . . . . . . . . . . . . . . . . . . . . . . . . . . . . . . . . . . . . . . vii
Abstract of the Thesis . . . . . . . . . . . . . . . . . . . . . . . . . . . . . . . . . . . . . . . ix
Chapter 1. Introduction . . . . . . . . . . . . . . . . . . . . . . . . . . . . . . . . . . . . . . 1
Chapter 2. Underwater Acoustic Communication . . . . . . . . . . . . . . . . . . . . . 42.1. Channel Characteristics . . . . . . . . . . . . . . . . . . . . . . . . . . . . . . . 42.2. Modulation Schemes . . . . . . . . . . . . . . . . . . . . . . . . . . . . . . . . . 7
Chapter 3. Related Work . . . . . . . . . . . . . . . . . . . . . . . . . . . . . . . . . . . . . 93.1. Commercial Modems . . . . . . . . . . . . . . . . . . . . . . . . . . . . . . . . . 93.2. Research Modems . . . . . . . . . . . . . . . . . . . . . . . . . . . . . . . . . . . 13
Chapter 4. Proposed System . . . . . . . . . . . . . . . . . . . . . . . . . . . . . . . . . . . 174.1. System Design . . . . . . . . . . . . . . . . . . . . . . . . . . . . . . . . . . . . . 17
4.1.1. Digital Modem Design . . . . . . . . . . . . . . . . . . . . . . . . . . . 184.2. Simulation and Ocean Testing . . . . . . . . . . . . . . . . . . . . . . . . . . . 20
4.2.1. Simulation Results . . . . . . . . . . . . . . . . . . . . . . . . . . . . . 214.2.2. Ocean Test Results . . . . . . . . . . . . . . . . . . . . . . . . . . . . . 24
Chapter 5. Implementation . . . . . . . . . . . . . . . . . . . . . . . . . . . . . . . . . . . . 285.1. Development Platform . . . . . . . . . . . . . . . . . . . . . . . . . . . . . . . . 295.2. FSK Transmitter and Receiver Design . . . . . . . . . . . . . . . . . . . . . . 34
5.2.1. FSK Transmitter . . . . . . . . . . . . . . . . . . . . . . . . . . . . . . . 355.2.2. FSK Receiver . . . . . . . . . . . . . . . . . . . . . . . . . . . . . . . . . 36
5.3. Channel Estimation . . . . . . . . . . . . . . . . . . . . . . . . . . . . . . . . . . 395.4. Results . . . . . . . . . . . . . . . . . . . . . . . . . . . . . . . . . . . . . . . . . . 41
Chapter 6. Conclusion . . . . . . . . . . . . . . . . . . . . . . . . . . . . . . . . . . . . . . . 48
Bibliography . . . . . . . . . . . . . . . . . . . . . . . . . . . . . . . . . . . . . . . . . . . . . 50
iv

LIST OF FIGURES
Figure 1.1: Autonomous Underwater Drifting Sensor Network . . . . . . . . . . . . 3
Figure 4.1: System Block Diagram . . . . . . . . . . . . . . . . . . . . . . . . . . . . . . 17Figure 4.2: Adaptable Modem Block Diagram . . . . . . . . . . . . . . . . . . . . . . . 19Figure 4.3: Modem FSM . . . . . . . . . . . . . . . . . . . . . . . . . . . . . . . . . . . . . 20Figure 4.4: AcTUP Simulation Environment . . . . . . . . . . . . . . . . . . . . . . . . 22Figure 4.5: Multipath Amplitude and Delay Profile of Links 1 and 5 . . . . . . . . . 22Figure 4.6: Map of Ocean Test Sites . . . . . . . . . . . . . . . . . . . . . . . . . . . . . . 25Figure 4.7: Ocean Test Channel Characteristics . . . . . . . . . . . . . . . . . . . . . . 27
Figure 5.1: Zedboard . . . . . . . . . . . . . . . . . . . . . . . . . . . . . . . . . . . . . . . 29Figure 5.2: Toyon Chilipepper FMC . . . . . . . . . . . . . . . . . . . . . . . . . . . . . 29Figure 5.3: Development Platform Block Diagram . . . . . . . . . . . . . . . . . . . . 32Figure 5.4: Binary FSK Modulation Example . . . . . . . . . . . . . . . . . . . . . . . 35Figure 5.5: FSK Transmitter Block Diagram . . . . . . . . . . . . . . . . . . . . . . . . 35Figure 5.6: FSK Receiver Block Diagram . . . . . . . . . . . . . . . . . . . . . . . . . . 37Figure 5.7: Packet Header Structure For Channel Estimation . . . . . . . . . . . . . . 40Figure 5.8: LPF Output of Received Signal for Antenna and Cable Modes . . . . . 44Figure 5.9: 1KHz and 2KHz Generated Sine Waves . . . . . . . . . . . . . . . . . . . 45Figure 5.10: Sync Offset . . . . . . . . . . . . . . . . . . . . . . . . . . . . . . . . . . . . . 46
v

LIST OF TABLES
Table 3.1: Commercial Underwater Acoustic Modems . . . . . . . . . . . . . . . . . . 11Table 3.2: Research Underwater Acoustic Modems . . . . . . . . . . . . . . . . . . . . 13
Table 4.1: Chirp, FSK, and DSSS Signal Parameters . . . . . . . . . . . . . . . . . . . 21Table 4.2: Optimal Data Rates For Simulated Channel Links . . . . . . . . . . . . . . 23Table 4.3: Ocean Test BERs for Site1/Site2 . . . . . . . . . . . . . . . . . . . . . . . . . 26
Table 5.1: ZedBoard Specifications . . . . . . . . . . . . . . . . . . . . . . . . . . . . . . 30Table 5.2: Device Utilization . . . . . . . . . . . . . . . . . . . . . . . . . . . . . . . . . . 42Table 5.3: Test Results . . . . . . . . . . . . . . . . . . . . . . . . . . . . . . . . . . . . . . 43
vi

ACKNOWLEDGEMENTS
I am extremely thankful for all the encouragement and support I have received
during my time as a Master’s student at the University of California, San Diego (UCSD).
In this section I would like to take the opportunity to individually thank some of the
people and organizations that have helped me get to where I am now.
First, I would like to thank Lingjuan (Nancy) Wu for being such a great col-
league. We did a lot of simulation and ocean testing together and had fun hanging
hydrophones off the Scripps Pier and doing testing by the pool in the beautiful San
Diego sunshine. After her time at UCSD was finished, I missed her help and cheery
personality around the office. I hope she continues to enjoy her life back in China.
Professor Ryan Kastner has been a great advisor over the past couple of years.
He introduced me to the underwater modem project and helped me shape the project into
an interesting research endeavor. He also encouraged me to apply for the NSF Graduate
Research Fellowship Program, and with his help I was able to put together a competitive
research proposal and application that led me to be selected for the fellowship.
Dr. Diba Mirza dedicated her time to this project as a Post Doctoral Scholar
through countless weekly meetings. I truly value her advice and assistance throughout
the entire process. I wish her the best with her newborn son, Aman.
Without the hard work and assistance of Dr. Bridget Benson, my research would
not have come together as it did today. Her PhD research provided a base modem
platform that I was able to enhance in order to realize my goal of designing an adaptable
underwater acoustic modem. Her friendship over the years has also meant a lot to me.
My colleagues in Professor Kastner’s research group have also provided me with
support over the past couple of years. I would like to especially thank Magnus Delight,
Janarbek Matai, and Perry Naughtun.
I am also very grateful to my committee members, Joseph Pasquale, Alex Sno-
eren, and Curt Schurgers, for taking the time to review my thesis.
Last but not least, I am so lucky to have the support of my family and friends.
vii

Thanks to my mom and dad for giving me such great guidance throughout my entire
life, and to my older brother Chris for reminding me that whatever stress or challenge I
am currently facing, he went through the same thing 3 years ago. I am also so thankful
for the love and support from my significant other, Ali, who is always there for me and
makes me a better person every day.
The text of Chapter 4.2 is, in part, based on the material as it appears in "Design-
ing an Adaptive Acoustic Modem for Underwater Sensor Networks", IEEE Embedded
Systems Letters, vol. 3, issue 3, December 2011. The thesis author was a co-primary re-
searcher and author (with Lingjuan Wu). The other co-authors listed on this publication
[1] directed and supervised the research which forms the basis for Chapter 4.2.
This material is based upon work supported by the National Science Foundation
Graduate Research Fellowship under Grant No. (DGE-1144086).
viii

ABSTRACT OF THE THESIS
Design and Implementation of an Adaptive Underwater Acoustic Modem and
Test Platform
by
Jennifer Trezzo
Master of Science in Computer Science
University of California, San Diego, 2013
Ryan Kastner, Chair
Underwater wireless sensor networks are crucial in understanding certain phe-
nomena that take place within our vast oceans. They can be used as an integral tool
in countless environmental monitoring applications like understanding the growth and
spread of algal blooms and monitoring the health of coral reefs. These networks often
rely on acoustic communication, which poses a number of challenges for reliable data
transmission. Three of these key challenges are high power consumption when transmit-
ting, frequency selective fading, and high variability in the communication channel over
time due to factors like multipath delay spread, doppler shift, and noise interference due
to low SNRs. Current modems are traditionally configured for specific environments
and must withstand the worst anticipated channel conditions. This tendency limits po-
tential performance of the modem when the channel improves. This thesis introduces
the design of a low cost underwater acoustic modem that can measure the underwater
communication channel and adapt its bit rate and modulation scheme to maintain re-
ix

liable data transmission while optimizing data rates and effectively minimizing power
consumption.
x

Chapter 1.
Introduction
Every day oceanographers and marine biologists are reminded how much still re-
mains unknown about our oceans and the phenomena that take place within them. With
the encroaching impact of environmental changes, namely global warming, it becomes
more and more important that we can understand these phenomena and do everything
in our power to preserve the overwhelming diversity of marine life. The first step in
growing our understanding is to equip ourselves with the necessary tools to observe and
study the underwater environment.
A subset of these tools involve the use of underwater sensor networks in or-
der to propagate data throughout the observed area, oftentimes reaching a surface sink
node or base station for further processing. Previously, sensor networks were connected
by physical cables, which limited placement of sensors and had the potential to cause
damage to fragile environments like coral reefs. Therefore, one crucial step forward in
underwater sensor networks is the use of wireless communication.
Unfortunately, underwater wireless communication is plagued with many chal-
lenges. One of the most prevalent issues is frequency selective fading in the underwater
environment. This issue causes certain frequencies to attenuate at a faster rate than oth-
ers. As a result, radio frequencies tend to suffer from high attenuation over very short
distances. Underwater wireless communication over distances greater than a few feet
1
2
is therefore restricted to the acoustic range. In addition, the acoustic communication
channel is highly variable due to the effects of variables like multipath delay spread,
doppler shift, and SNR. The channel also varies across water columns where there are
significant differences in temperature and salinity. Consequently, reliable communica-
tion in reverberant shallow waters over different directional planes requires robustness
to a wide variety of channel conditions.
Current off the shelf underwater acoustic modems are expensive and often times
tailored to a specific application. This one-time customization is not ideal for dense sen-
sor networks in highly variable shallow water environments. Unfortunately, many of the
phenomena that researchers are interested in observing, like the health of coral reefs, oil
spill expansion, and the dynamics of planktonic communities, require exactly this type
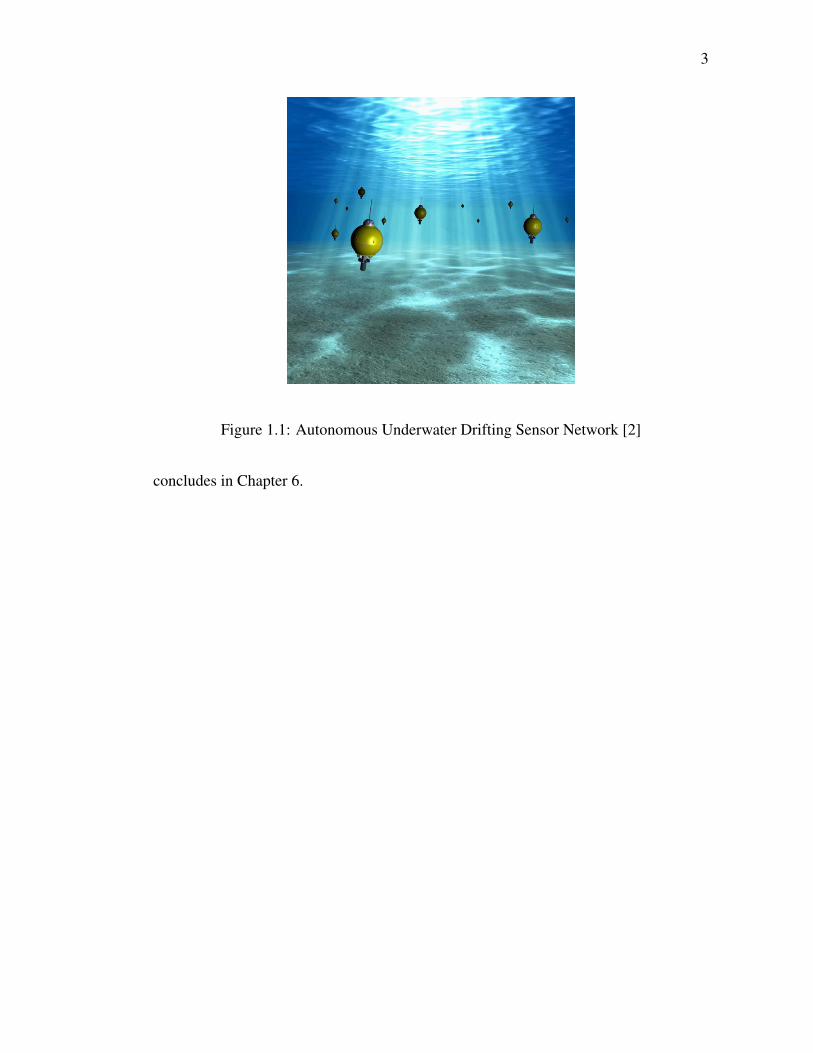
of dense monitoring, often times in shallow waters. For this reason, Principle Investiga-
tors, Jules Jaffe and Peter Franks from the SCRIPPS Institution of Oceanography (SIO)
are developing a system made up of autonomous buoyancy-controlled subsurface floats
with sensors for data collection, as pictured in Figure 1.1 [2]. These floats are designed
to act as sensor nodes in an ad-hoc network that can relay data to surface stations for
analysis. The goal of this system is to gather ocean data with high temporal and spatial
resolution in a cost effective manner. Underwater wireless sensor networks, like this
one, are in need of a low cost acoustic modem that can function reliably in an extremely
dynamic environment at short ranges, typically 100s of meters.
The major contribution of this thesis is the design of a low cost adaptive under-
water acoustic modem intended for applications like the SIO autonomous underwater
drifting sensor network. This modem is intended to measure the underwater acoustic
communication channel and adapt its modulation scheme and bit rate in order to ensure
power efficient and robust communication.
This thesis is outlined as follows. In Chapter 2, the challenges of underwater
acoustic communication are discussed, followed by a related works section in Chapter
3. Chapter 4 presents the proposed adaptable modem at the system level, and Chapter
5 includes a description of the implemented design and its test platform. The thesis
3
Figure 1.1: Autonomous Underwater Drifting Sensor Network [2]
concludes in Chapter 6.

Chapter 2.
Underwater Acoustic Communication
Though the challenges in the underwater communication channel are similar
in nature to those in the terrestrial RF channel, they tend to be a bit more difficult to
mitigate. This chapter describes the characteristics of the underwater acoustic environ-
ment along with the challenges those characteristics present. The chapter then goes into
a discussion of different modulation schemes that are commonly used and how these
modulation schemes hold up in this communication environment.
2.1. Channel Characteristics
Several physical layer wireless communication techniques including optical, ra-
dio frequency, and acoustic signals have been considered for short-range, dense under-
water wireless sensor networks [3]. Optical signals perform poorly underwater due to
scattering caused by high particulate matter in the ocean as well as the need for precise
alignment between the sender and receiver. Radio frequency waves are electromagnetic
waves in the frequency range from 300GHz to as low as 3KHz. Radio frequency waves
attenuate quickly and can only travel short distances in bodies of salt water, due to the
higher conductivity of salt water when compared with fresh water and air. For these
reasons, most underwater wireless modems use acoustic communication [3]. The next
4
5
few paragraphs describe the various characteristics of the underwater acoustic channel
and discuss how they effect communication.
Multipath delay spread: Due to reflections off of the surface and the ocean floor,
a single transmission can arrive at a receiving node through multiple paths and at differ-
ent times. Multipath delay spread is defined as the time between the arrival of the first
and the last discernible sound waves that have traveled along these multiple paths [4].
If the multipath delay spread is too large, the received transmission can be difficult to
demodulate due to inter-symbol interference.
Doppler shift: Doppler shift is caused by the movement of transmitting or re-
ceiving nodes in the network as well as by ocean swells and currents. This can have a
significant effect on certain frequency-dependent modulation schemes.
Low and variable signal to noise ratio (SNR): The underwater communication
channel suffers from significant ambient noise which can be attributed to four main
sources; turbulence, shipping, breaking waves, and thermal noise. In addition, surface
motion due to wind-driven waves specifically affects signals in the acoustic range [5].
This type of interference leads to relatively low SNRs and often times, less reliable
communication.
High and variable propagation delay: One of the most defining characteristics
of the underwater acoustic communication channel is high and variable propagation de-
lay. Underwater acoustic signals travel five orders of magnitude slower than RF signals
in terrestrial networks. A typical propagation speed for an acoustic transmission is ap-
proximately 0.67s/km [6]. To make matters worse, the speed of sound through water
can vary significantly with changes in salinity and temperature.
Frequency selective fading: Frequency selective fading is a characteristic that
has the effect of varying degrees of attenuation across different frequencies and trans-
mission distances. For longer distances over several 10s of kilometers, the useable fre-
quency bandwidth is typically limited to a few kHz. Short range communication needed
in dense underwater sensor networks has slightly more frequency bandwidth compared
to long range communication, but is still limited to 20-50 KHz [6].

6
High transmission power consumption: Power consumption is an important is-
sue for underwater acoustic sensor networks because the nodes are battery powered and
would ideally be deployed for several months at a time. Unlike terrestrial transceivers,
underwater acoustic transceivers consume a significant amount of power when trans-
mitting, mainly due to the physical characteristics of underwater acoustic transducers.
The WHOI Micro Modem 1 transceiver consumes 50W when transmitting at distances
of 2-3Km at a center frequency of 25KHz [7], and an underwater acoustic transceiver
designed for short range communication at the University of California, San Diego con-
sumes 6.9W when transmitting at a maximum distance of 350m with a center frequency
of 40KHz [3]. Due to the high power consumption that occurs during transmission, ad-
justing the data rate of an underwater acoustic modem can have significant impact on
overall power consumption through increases or decreases in total transmit time. There-
fore, a majority of the focus on power consumption in the proposed modem presented
in this thesis pertains to maximizing the modem’s data rate while maintaining robust
communication.
The characteristics described in this section present many challenges for under-
water acoustic communication. In addition, mobile nodes in an ad hoc shallow water
sensor network will also experience changes in the channel characteristics over time and
space. For example, the communication channel across a horizontal plane is often times
very different than it is across a vertical plane. This is mostly due to differences in multi-
path reflections as well as changes in propagation speed when the channel spans multiple
water columns with varying temperatures or salinity. The channel naturally varies over
time with differences in ambient noise, temperature, and ocean currents. Keeping these
characteristics in mind, the next section describes how modulation schemes can be used
to mitigate some of the major challenges.

7
2.2. Modulation Schemes
Due to the high variability of the underwater acoustic communication channel,
several different modulation schemes have been used across the research community.
These modulation schemes are also used to mitigate channel-deteriorating characteris-
tics in terrestrial networks. The most commonly used modulation schemes and tech-
niques for underwater communication are discussed in this section.
Frequency Shift Keying (FSK): Frequency Shift Keying is a non-coherent mod-
ulation scheme that can maintain reliable communication in harsh conditions. Many
researchers use variations of FSK due to its robustness and its simple receiver design
[8]. However, one major drawback with FSK is its slow bit rates when compared to
other modulation schemes. For high data rate applications such as autonomous under-
water vehicle (AUV) control and audio or video streaming, FSK is not ideal.
Phase Shift Keying (PSK): Contrastingly, PSK is a slightly more complex co-
herent modulation scheme. Coherent modulation schemes in general do not do well
in multipath environments [8]. This can often times be counteracted with the use of a
receiver array, but receiver arrays are not plausible for all applications.
Orthogonal Frequency Division Multiplexing (OFDM): OFDM is a modula-
tion technique that divides the frequency band into different orthogonal sub-carrier fre-
quencies. Each sub-carrier frequency can implement its own conventional modulation
scheme. OFDM is very sensitive to doppler shift, but offers high data rates and can do
well in environments with frequency selective fading and high multipath. Issues related
to doppler shift can be mitigated with a complex receiver using non-uniform doppler
compensation [9]. OFDM is therefore gaining more and more popularity as receiver
technology advances.
Direct Sequence Spread Spectrum (DSSS): DSSS is a technique that spreads
modulated data across a wider frequency band. This technique can be advantageous in
withstanding channels with frequency selective fading and high multipath. Time guards
are frequently used in DSSS to further reduce the chance of inter symbol interference.

8
Since DSSS is a spread spectrum technique, data is first modulated by a traditional
modulation scheme, such as PSK, then the modulated signal is spread across a certain
frequency band using DSSS.
The modulation schemes described in this section address a wide range of chan-
nel characteristics as a whole, but no single modulation technique is able to mitigate the
effects of all channel characteristic on its own. For a highly variable environment that a
mobile underwater sensor network would be exposed to, selecting an optimal modula-
tion scheme and bit rate for robust and power efficient communication can be difficult.
The next chapter describes a number of commercial and research-based modem designs
that try to address the issues caused by the channel characteristics described in this
chapter.

Chapter 3.
Related Work
There are several existing underwater acoustic modems that are either commer-
cially available or developed by the research community. The modems most suited for
a dense underwater sensor network deployed in shallow waters are described and com-
pared in this chapter. This related work study is partly drawn from Dr. Bridget Benson’s
PhD Thesis [3]. However, updates have been made to ensure the study is as current and
relevant as possible.
3.1. Commercial Modems
Table 3.1 shows a number of commercial modems that are well suited for dense
shallow water sensor networks. This table compares various features of the modems.
As a majority of these modems can be customized for a specific application by the man-
ufacturer, some of the information is given in ranges. This comparison is intended to
give a sense of the general capabilities of commercial modems. In the table, NS is used
to represent information that was not specified by the manufacturer. The characteristics
of the adaptable modem proposed in this thesis are also included in the table for com-
parison. The range, transmit power and receiver power are based on the characteristics
of an analog transceiver and home made transducer that were designed and originally
9

10
used in Dr. Bridget Benson’s PhD Thesis [3].
Some modems were excluded from this list due to issues like prohibitively large
housings and undesirable transmission ranges or deployment setups. One important
aspect to consider is the cost of each of the modems. A vast majority of commercial
modems are typically priced upwards of a few thousand dollars, which limits the num-
ber of researchers and organizations that have the necessary funds to purchase enough
modems to form a dense sensor network. This cost data was gathered from sales rep-
resentatives at a number of companies that did not want to disclose specific pricing
information. In order to make the use of dense underwater sensor networks more ac-
cessible, one of the goals of the proposed modem in this thesis is to offer a competitive
design for a much more practical cost.
The AquaModem 1000 by Aquatec Group Limited [10] is a viable option with
a sufficient range and bit rate. The AquaModem 1000 is customizable for the intended
application. The modem can be set to utilize either FSK or differential PSK spread
spectrum depending on the environment. The configurable settings of the AquaModem
1000 are updated according to advances in Aquatec Group Limited’s Research and De-
velopment group. The most recent projects involve shallow water communications in
the Baltic Sea.
The UWM2000H is the recommended modem for the target application out of
the various models developed by LinkQuest [11]. This modem has a high bit rate of 17.8
kbps and a relatively low transmit power of 2 or 8 W depending on the desired trans-
mission distance. Details of the modulation scheme are not available since the modem
uses LinkQuest’s proprietary Broadband Acoustic Spread Spectrum Technology. Some
of the additional features of this modem include channel equalization to combat mul-
tipath, error correction coding, and automatic rate adaptation to combat varying noise
conditions.
EvoLogic’s most suitable model is the S2C R 48/78 [12]. A range of transmit
powers leads to better application flexibility. The modem also has an optimal range and a
relatively high bit rate. The modulation scheme used is a patented Sweep Spread Carrier

11
Tabl
e3.
1:C
omm
erci
alU
nder
wat
erA
cous
ticM
odem
s
Com
pany
Mod
emFr
eque
ncy
(kH
z)Tx
Pow
er(W
)M
axR
ange
(Km
)R
xPo
wer
(W)
Mod
ulat
ion
Bit
Rat
e(b
ps)
Aqu
aTec
Aqu
aMod
em10
007.
5-12
2020
0.6
FSK
/D
PSK
-SS
300-
2000
Link
Que
stU
WM
2000
H26
.77-
44.6
22
or8
1.2
0.8
Prop
rieta
rySS
17,8
00Ev
oLog
ics
S2C
R48
/78
48-7
85,
8,18
or60
11.
1S2
C3,
200
Trite
chM
icro
nD
ata
Mod
em20
-28
7.92
0.5
0.72
SS40
DSP
Com
mA
quaC
omm
16-3
0C
onfig
urab
le3
0.42
DSS
S/
OFD
M10
0/4
80
Tele
dyne
Ben
thos
SMA
RTM
odem
9-14
,16-
21or
22-2
7N
S2-
6N
Sm
ultip
leFS
K/
PSK
140-
1536
0A
quaS
eNT
Aqu
aSeN
TM
odem
14-2
05-
204
0.7
OFD
M32
00
UC
SDPr
opos
edM
odem
401.
3-7.
00.
40.
42A
dapt
able
Ada
ptab
le
12
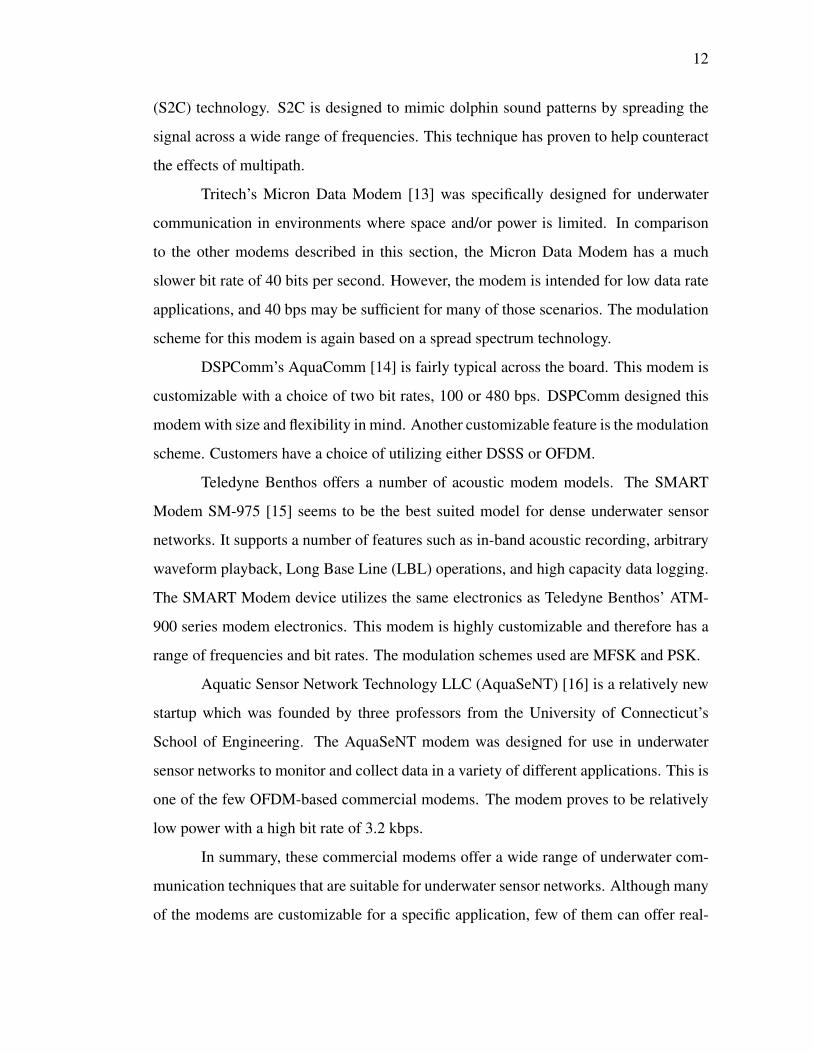
(S2C) technology. S2C is designed to mimic dolphin sound patterns by spreading the
signal across a wide range of frequencies. This technique has proven to help counteract
the effects of multipath.
Tritech’s Micron Data Modem [13] was specifically designed for underwater
communication in environments where space and/or power is limited. In comparison
to the other modems described in this section, the Micron Data Modem has a much
slower bit rate of 40 bits per second. However, the modem is intended for low data rate
applications, and 40 bps may be sufficient for many of those scenarios. The modulation
scheme for this modem is again based on a spread spectrum technology.
DSPComm’s AquaComm [14] is fairly typical across the board. This modem is
customizable with a choice of two bit rates, 100 or 480 bps. DSPComm designed this
modem with size and flexibility in mind. Another customizable feature is the modulation
scheme. Customers have a choice of utilizing either DSSS or OFDM.
Teledyne Benthos offers a number of acoustic modem models. The SMART
Modem SM-975 [15] seems to be the best suited model for dense underwater sensor
networks. It supports a number of features such as in-band acoustic recording, arbitrary
waveform playback, Long Base Line (LBL) operations, and high capacity data logging.
The SMART Modem device utilizes the same electronics as Teledyne Benthos’ ATM-
900 series modem electronics. This modem is highly customizable and therefore has a
range of frequencies and bit rates. The modulation schemes used are MFSK and PSK.
Aquatic Sensor Network Technology LLC (AquaSeNT) [16] is a relatively new
startup which was founded by three professors from the University of Connecticut’s
School of Engineering. The AquaSeNT modem was designed for use in underwater
sensor networks to monitor and collect data in a variety of different applications. This is
one of the few OFDM-based commercial modems. The modem proves to be relatively
low power with a high bit rate of 3.2 kbps.
In summary, these commercial modems offer a wide range of underwater com-
munication techniques that are suitable for underwater sensor networks. Although many
of the modems are customizable for a specific application, few of them can offer real-
13
time flexibility in the field for a sensor network, like the SIO underwater drifting sensor
network, that will be met with a number of different environments. In addition, the high
cost of many of the modems makes them inaccessible for many research groups to use
as part of a dense underwater sensor network. These two drawbacks provide motivation
for a low cost adaptable modem.
3.2. Research Modems
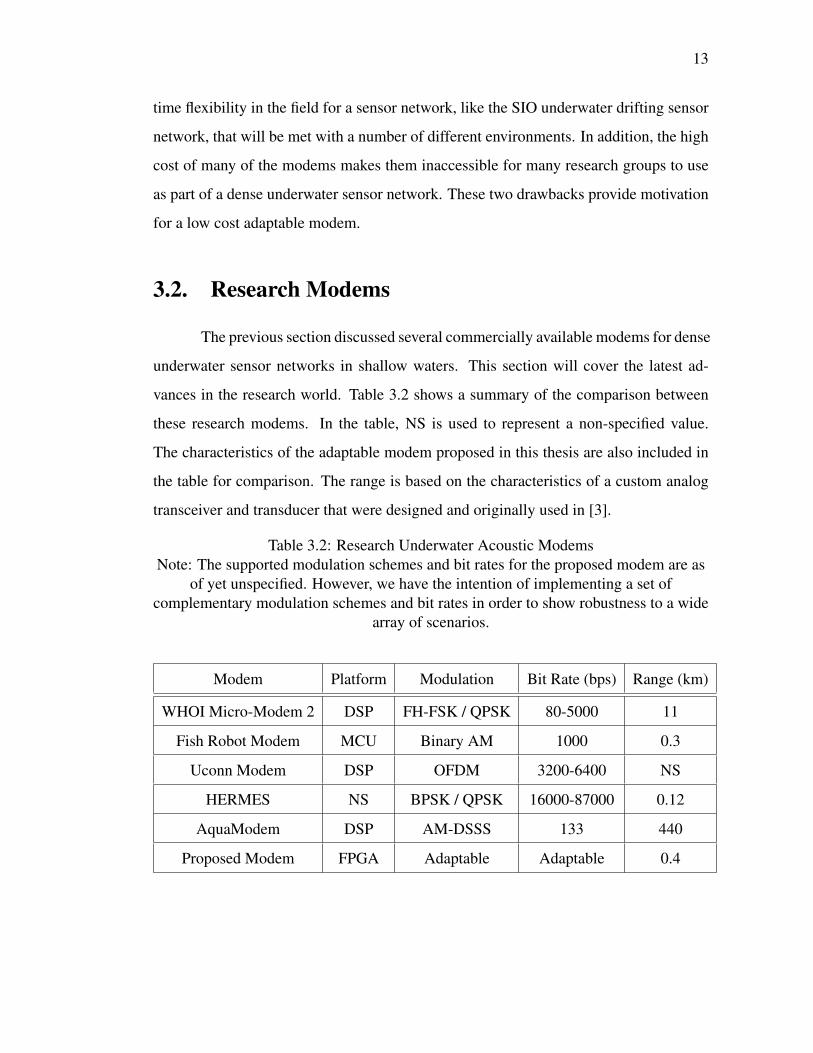
The previous section discussed several commercially available modems for dense
underwater sensor networks in shallow waters. This section will cover the latest ad-
vances in the research world. Table 3.2 shows a summary of the comparison between
these research modems. In the table, NS is used to represent a non-specified value.
The characteristics of the adaptable modem proposed in this thesis are also included in
the table for comparison. The range is based on the characteristics of a custom analog
transceiver and transducer that were designed and originally used in [3].
Table 3.2: Research Underwater Acoustic ModemsNote: The supported modulation schemes and bit rates for the proposed modem are as
of yet unspecified. However, we have the intention of implementing a set ofcomplementary modulation schemes and bit rates in order to show robustness to a wide
array of scenarios.
Modem Platform Modulation Bit Rate (bps) Range (km)
WHOI Micro-Modem 2 DSP FH-FSK / QPSK 80-5000 11
Fish Robot Modem MCU Binary AM 1000 0.3
Uconn Modem DSP OFDM 3200-6400 NS
HERMES NS BPSK / QPSK 16000-87000 0.12
AquaModem DSP AM-DSSS 133 440
Proposed Modem FPGA Adaptable Adaptable 0.4
14
The Woods Hole Oceanographic Institute (WHOI) is very active in the underwa-
ter sensor network research area. The Micro-modem 2 [17] is their latest open source
modem, designed in 2009, and intended to provide a flexible test platform for underwa-
ter acoustic communication research. The modem is implemented on a Blackfin ADSP-
BF548. Some of the new features that were not on the original modem are an adaptive
decision feedback equalizer and error-correction software. This modem has 3 modes;
active, low-power detect, and hibernate. The modem can be configured to use either
frequency-hopped FSK or PSK with a range of bit rates from 80-5000 bps. The per-
formance of the Micro-Modem 2 was tested in the Mariana Trench [18] where reliable
transmissions were possible at a rate of 200bps with ranges up to 11km.
A number of universities in South Korea in conjunction with the Korea Institute
of Industrial Technology have developed a bio-inspired fish robot for use in a mobile
underwater communication system [19]. This type of sensor network is intended for
high mobility and real time monitoring in shallow water environments.The fish robot’s
acoustic communication technology was designed to be simple and robust in order to
minimize the size of the modem. Due to this simplicity, the modem is implemented
on a microcontroller (MCU). With this goal in mind, the modem uses non-coherent
binary amplitude modulation with a time guard between symbols to reduce the effects
of multipath. The modem can transmit at 1kbps with a bit error rate (BER) of less than
10-4 for up to 300 meters. These characteristics were observed during testing in the
Han River, which is approximately 500 meters wide with a maximum depth of about 15
meters.
The University of Connecticut has designed a modem that uses OFDM [20].
Both single-input single-output (SISO) and multiple-input multiple-output (MIMO) ver-
sions of the modem have been implemented on both a fixed point and a floating point
TMS320C6713 DSP board. The goal of this modem was to take advantage of po-
tentially high data rates with OFDM and to experiment with the potential benefits of
SISO and MIMO configurations. The University of Connecticut formed a startup called
AquaSeNT (introduced in the Commercial Modem Section), which was based on a ver-

15
sion of this modem.
HERMES [21] is a high-speed, high-frequency underwater acoustic modem de-
veloped by Florida Atlantic University. The modem has two underwater communication
links; a very high bit rate broadband data uplink and a low bit rate command downlink.
HERMES can transmit high resolution uncompressed acoustic images at approximately
86.9 Kbps at a range of 120 m. The goal was to make the modem smaller than the orig-
inal HS-HFAM modem off of which it was based and to extend the original maximum
range of 100 m. This modem uses a commercial transducer developed by Jetasonics.
The frequency band 260-380 Khz, which is significantly higher than most other acous-
tic modems. HERMES can be configured to use BPSK or QPSK with DSSS and can
achieve rates from 16 to 87 Kbps uncoded, depending on packet specifications. Since
the image transmissions in this application can tolerate higher BERs than traditional
textual data, transmission is considered successful up to 120 m with 71.8% of packets
detected and authenticated, and a 5.3% average BER. At a range of 95m, the percent-
age of packets detected and authenticated comes much closer to 100% and the BER
decreases to a much more desirable value for non-image transmissions.
The UCSB AquaModem was designed for use in an ad hoc sensor network for
eco-sensing applications. This modem uses amplitude modulated DSSS with a compos-
ite walsh/m-sequence format, as described in the modem’s main publication [22]. The
spread signal has 5 Khz of bandwidth for robustness to multipath and can achieve a data
rate of 133 bps. The modulation algorithm also includes a time guard in order to elim-
inate the need for equalization. The modem is implemented on a TI F2812 fixed-point
DSP with a custom amplifier and transducer. Testing shows that the maximum transmit
power is approximately 12 W RMS.
The research modems described above utilize a range of platforms and mod-
ulation techniques. Some of the modems can be configured to operate with different
modulation schemes, bit rates, and power levels. However, none of these modems take
advantage of the benefits of adapting their modulation techniques according to the time-
varying communication channel in real time. A dense underwater wireless sensor net-

16
work with mobile nodes can experience a wide variety of communication environments
throughout its deployment period. Solutions that force the user to configure the modems
to one specific environment before deploying them are limiting their performance.
Research has been performed concerning the prediction of channel characteris-
tics by estimating the channel multiple times over certain intervals [23]. Although no
current modems have incorporated this technique into their designs, this type of pre-
diction would be useful in future versions of the proposed modem. In this thesis, the
adaptive behavior of the proposed modem is based on channel estimation alone.
The next chapter presents one of the major contributions of this thesis by intro-
ducing a low power adaptable modem that can measure the channel characteristics and
adapt its modulation scheme and bit rate to optimize power and data rates in real time,
while ensuring the most reliable communication possible.

Chapter 4.
Proposed System
This chapter describes in detail the proposed adaptable modem for applications
like the Scripps Institution of Oceanography (SIO) autonomous drifting sensor network
[2]. The first section describes the entire proposed system, going into detail for the dig-
ital portion of the adaptive modem design, and the second section describes simulation
and ocean testing of the conceptual design.
4.1. System Design
Figure 4.1: System Block Diagram
As shown in Figure 4.1, the system is made up of an underwater acoustic trans-
ducer, an analog transceiver, and the digital portion of the adaptable modem. Typically,
transducers tend to be the most expensive component of an underwater acoustic mo-
dem. In order to mitigate this cost, the transducer that the original UCSD modem was
17

18
intended for is an in-house custom transducer consisting of a potted piezo-ceramic ring
[3]. This transducer is a viable option to the proposed system due to its low cost and
power requirements in comparison to commercial off-the-shelf transducers. A custom
transceiver was also designed for the original UCSD modem and is sufficient as a proof
of concept for the proposed design [3]. Lastly, the main contribution of this thesis comes
from the digital design of the proposed adaptive modem. This design is described in
greater detail in the following subsection.
4.1.1. Digital Modem Design
In order to illustrate the adaptive nature of the modem, the following is an ex-
ample of a simple point-to-point exchange between two nodes, A and B, where node
A wishes to send data to node B. This example is based on the notion of channel reci-
procity. First, node A will send a Request To Send (RTS) packet to node B. This packet
will include a series of chirp signals that can be used for measuring the channel. Upon
hearing the RTS packet, the receiver will calculate the multipath delay spread, doppler
shift, and SNR via its channel estimation module and determine the ideal bit rate and
modulation scheme with which to communicate. Node B will then send a Clear To Send
(CTS) packet intended for node A. This CTS packet will include the desired parameters
that node B would like to communicate with. Node B will adjust its parameters to the
ones specified in the CTS packet, followed by node A once it has received the packet.
Node A will then begin transmitting its data to node B. In order to ensure all nodes can
communicate with each other, control packets like the RTS and CTS packets will always
be transmitted at a set of known and robust parameters.
In order to explain how this point to point exchange would take place within the
modem architecture, please refer to Figure 4.2. The Receiver (Data) and the Transmit-
ter, represent the adaptive modules in that their modulation scheme and bit rate can be
selected from a set of pre-defined choices. In this figure, one can see how the analog
to digital (ADC) input is routed to the Channel Estimation, Receiver (Control), and Re-

19
ceiver (Data) modules in parallel. The channel estimation module is made up of three
submodules used to calculate the three targeted channel characteristics; multipath delay
spread, doppler shift, and SNR. The Receiver (Control) module is a receiver module that
is always set to the control packet modulation scheme and bit rate. The Receiver (Data)
module is the adaptive receiver module that can change its modulation scheme and bit
rate according to the control signals from the processor. The processor will function
as a State Machine, as pictured in Figure 4.3. The processor will transition between
the transmit and receive modes based on whether or not it has sensor data to transmit.
Referring back to Figure 4.2, the last module is the adaptive Transmitter module. This
module represents the transmit functionality of the modem. When data is ready to be
sent, the bitstream will be sent from the processor and modulated according to the spec-
ified modulation scheme and bit rate.
Figure 4.2: Adaptable Modem Block Diagram

20
Figure 4.3: Processor State Machine
4.2. Simulation and Ocean Testing
We performed simulations and ocean tests in order to evaluate the plausibility
and performance of the proposed adaptive modem. For these experiments, two mod-
ulation schemes were used; FSK and amplitude-modulated DSSS. These modulation
schemes were chosen due to their potential in providing valuable information regarding
the performance of different modulation schemes in different communication environ-
ments. The FSK transmitter and receiver is based on the UCSD modem in Dr. Bridget
Benson’s PhD Thesis [3] and is implemented in Verilog HDL. The DSSS transmitter
and receiver is based on the UCSB AquaModem algorithm [22], which was discussed
in the related works section and is implemented in Matlab.
We initially executed a set of simulations in order to find the best data rates for
different links in a network and to understand the potential benefits of modifying data
rates on a per link basis. We then performed ocean tests in order to evaluate the perfor-
mance of the major components of the proposed adaptive modem in a real environment.
The parameters for the Linear Frequency Modulated (LFM) Chirp, and FSK and DSSS
modulation schemes used in both simulation and ocean tests are shown in Table 4.1.

21
The LFM Chirp was used for channel estimation, as described by Feng Tong et al. [24].
This LFM Chirp was also used for synchronization of DSSS packets, and both the LFM
Chirp and a 15-bit reference Gold Code were used for synchronization of FSK packets.
Table 4.1: Chirp, FSK, and DSSS Signal Parameters
Chirp Signal Parameters
Sweep Mode up-chirp
Initial Frequency 8kHz
Maximum Frequency 12kHz
Sweep Duration 50ms
FSK and DSSS Signal Parameters
FSK/DSSS carrier frequency 9kHz
FSK/DSSS sampling frequency 192kHz
FSK space frequency 10kHz
FSK mark frequency 11kHz
4.2.1. Simulation Results
The simulation platform used in these experiments is an underwater acoustic
propagation modeling software called the Acoustic Toolbox User interface and Post pro-
cessor (AcTUP) [25]. This software allows the user to adjust the simulation environment
in order to define attributes like bathymetric data, the positioning of the transmitting and
receiving nodes, and the sound speed profile. Once the simulation environment is de-
fined, AcTUP generates the amplitude and delay profile of the channel over the specified
link. The AcTUP simulation environment was defined for five different transmitter and
receiver pairs which were placed at different locations in the water column as shown in
Figure 4.4. The amplitude and delay profiles for links 1 and 5 are shown in Figure 4.5.
By looking at this figure, you can see that the two links have significantly different pro-
files. The multipath delay spread of link 5 is much shorter than that of link 1. However,
link 5 has stronger individual multipath components than link 1. This reinforces the fact
that different links in an underwater sensor network are likely to experience different
channel characteristics.

22
Figure 4.4: AcTUP Simulation Environment
Figure 4.5: Multipath Amplitude and Delay Profile of Links 1 and 5

23
Once we collected the amplitude and delay profiles from AcTUP, we constructed
a channel filter in Matlab for each link. Modulated data was then passed through the
filters in order to simulate received data for each link. The simulated received data
could then be demodulated and analyzed by calculating the bit error rate (BER) of the
data. For each of these experiments, the simulation data consisted of 10 packets of 102
bits each. The demodulated data with the highest data rate whose BER was smaller
than 10-2 was considered as the best rate for a specific link and modulation scheme. We
chose 10-2 as our threshold because it represents the maximum tolerable BER for our
purposes. The simulation results with the optimal data rates for each modulation scheme
over each link are shown in Table 4.2.
Table 4.2: Optimal Data Rates For Simulated Channel Links
AcTUP Setup Parameters (m) Data Rate (bps)
Link Tx depth Rx depth Distance FSK DSSS
1 20 40 200 200 1900
2 20 40 150 400 1900
3 20 60 200 100 1900
4 60 60 200 300 600
5 60 60 50 40 800
Though the optimal data rates in these tests are higher for DSSS when compared
with FSK, this is not an indication of better performance of a particular modulation
scheme, mainly due to the difference in implementation platforms. The DSSS Matlab
implementation has much better data precision and higher order filters than the FSK
Verilog implementation. This implementation difference is simply due to the fact that
the Matlab implementation was not designed with the available resources of a specific
embedded device in mind. A better analysis of the results would involve looking at the
performace of each modulation scheme individually.
24
Taking the above explanation into consideration, the results show that the op-
timal data rate varies for each of the different links. These optimal data rates change
from 40 bps to 400 bps for FSK, and from 600 bps to 1900 bps for DSSS. The results
also show that rate adaptation can save considerable energy. For example, in the case
of FSK modulated transmissions, if we consider the optimal fixed data rate that allows
reliable communication under the worst channel conditions, all the links must commu-
nicate at 40 bps. The total energy consumed for all 5 links transmitting one bit at 40
bps is 0.125 ∗Pt, where Pt is the transmitting power. Alternatively if the nodes perform
rate adaptation and communicate at their optimal data rate, the total energy consumed
is 0.0458 ∗ Pt. Therefore, if rate adaptation were used in this simulation environment,
an energy saving of 63.4% could be achieved. Similarly, an energy saving of 45.8%
could be achieved through rate adaptation in this simulation for DSSS modulated pack-
ets. As an additional benefit, faster data rates decrease the network’s total congestion,
and therefore decrease the probability of collisions, which, depending on the network’s
MAC protocol, can lead to a reduction in retransmissions and power. These results re-
inforce the initial motivations for the use of an adaptive modem in underwater sensor
networks.
4.2.2. Ocean Test Results
In order to evaluate the performance of the major components of the proposed
adaptive modem in a more realistic environment, we carried out experiments off the
coast of San Diego, California in May 2011. In addition to analyzing the performance
of modulation scheme and bit rate combinations, the chirp signal described in Table 4.1
and a 15-bit FSK-modulated gold code were evaluated for their effectiveness in packet
synchronization.
The deployment setup is shown in Figure 4.6. The transmitter was hanging off
the UC San Diego Scripps Pier, as pictured by the red transmitter pin, approximately 20
feet below the water surface in 25 feet of water. The receiver was attached to the hull of

25
a boat. Transmissions were received at two different sites, marked by yellow pins and
labeled as Site 1 and Site 2. Site 1 and Site 2 are 265m and 638m from the transmitter,
respectively. For each site, we transmitted FSK and DSSS data at six different data rates.
For each of these data rates, we transmitted 20 packets with 102 bits each.
Figure 4.6: Map of Ocean Test Sites
After performing analysis on the received signals, it was clear that the chirp sig-
nal had better synchronization performance when compared to the Gold code. While
the chirp was able to successfully synchronize with the start of the data sequence for all
data packets, the Gold code only synchronized successfully with 68% of the packets at
Site 1 and 70% of the packets at Site 2. This indicates that the chirp is a good candidate
for channel estimation as well as symbol synchronization. This is an important find-
ing to keep in mind when designing future transmitter and receiver pairs with different
modulation schemes.
The BERs for FSK and DSSS modulated data were calculated with the chirp
signal used for packet synchronization. Again, the purpose of these tests were not to
compare the performance of FSK versus DSSS, since the differences in their implemen-
tation does not lend to a fair comparison, but to analyze their performance at different

26
Table 4.3: Ocean Test BERs for Site1/Site2
Data Rate BER for FSK (%) BER for DSSS (%)
50 9.67 / 7.99 0.22 / 2.36
100 19.33 / 16.62 1.47 / 1.86
200 12.58 / 27.39 1.53 / 6.40
300 21.86 / 27.78 0.78 / 7.07
400 21.67 / 31.75 3.56 / 13.58
500 35.26 / 40.60 16.97 / 32.30
bit rates. The results are summarized in Table 4.3. As shown, the BER increases with
the data rate. This is most likely due to inter-symbol interference and ambient noise
occurring within the frequency band, possibly caused by surface movement. The results
also show that the average BER at Site 2 is higher than that at Site 1. To explain this,
the channel for both sites, as shown in Figure 4.7, was measured. The figure shows that
the Doppler shift and the multipath delay spread are both higher for Site 2 compared
to Site 1. These ocean test results correspond with the AcTUP simulation results in
the sense that BER varies significantly with both the data rate as well as the channel
characteristics between the sender and receiver.
The ocean tests and simulations described in this chapter help motivate the need
for a real-time adaptive underwater acoustic modem. We can see from the simulation
and ocean test data that the two modulation schemes react differently to the channel
conditions across different bit rates. We have also shown that having an adaptive bit rate
has the potential to save power consumption through reduced transmission time.
The text of this chapter is, in part, based on the material as it appears in "Design-
ing an Adaptive Acoustic Modem for Underwater Sensor Networks", IEEE Embedded
Systems Letters, vol. 3, issue 3, December 2011. The thesis author was a co-primary re-
searcher and author (with Lingjuan Wu). The other co-authors listed on this publication

27
Figure 4.7: Ocean Test Channel Characteristics
[1] directed and supervised the research which forms the basis for this chapter.

Chapter 5.
Implementation
We implemented the transmitter and receiver portions of the proposed modem on
a field programmable gate array (FPGA) in order to provide a test platform for different
communication techniques. This test platform was designed for in-air transmissions in
order to simplify the testing environment and allow for rapid prototyping of communi-
cation protocols. Ideally, this platform can be used to test implementations of different
modulation schemes, and will eventually support the integration of additional modules
such as the channel estimation module.
The ZedBoard [26] was selected as the hardware device for the test platform.
We then connected the Chilipepper FPGA mezzanine card (FMC), developed by Toyon
[27], to the ZedBoard via the ZedBoard’s FMC header and used it as a radio-frequency
front end for our design. As a sample modulation scheme, we chose to implement
the FSK transmitter and receiver used in the ocean tests on our test platform. Once
the implementation was completed, the test platform could successfully transmit data
between two boards at a user-specified bit rate. Currently bit rates of 200bps and 400bps
are supported.
The rest of this chapter is outlined as follows. Section 5.1 describes the specifi-
cations of the ZedBoard and Chilipepper FMC as well as the high level system design
of the test platform. Section 5.2 goes into detail about the implementation of the FSK
28

29
Figure 5.1: ZedBoard Figure 5.2: Toyon Chilipepper FMC
transmitter and receiver, and Section 5.3 describes the Matlab implementation of the
channel estimation module.
5.1. Development Platform
We analyzed a number of boards in order to select an appropriate test platform
for the proposed modem. The ZedBoard was chosen due to its state-of-the-art Xilinx
Zynq 7020 All Programable SoC, and its ability to integrate with the necessary periph-
erals. Detailed specifications of the ZedBoard are shown in Table 5.1. The Chilipepper
FMC is one of the recommended radio frequency front ends for the ZedBoard, and the
majority of labs and tutorials for the Chilipepper FMC are integrated with the ZedBoard.
The two boards are pictured in Figures 5.1 and 5.2.
The Chilipepper FMC seamlessly connects to the ZedBoard’s FMC header. This
FMC is a radio front end meant for rapid prototyping of physical layer waveforms. The
main chip on the Chilipepper FMC is the Lime Microsystems RF-IC. It supports Multi-
band operation, including full duplex operation around 2.1 GHz, time duplex in the 2.4
GHz band, broadband reception for waveforms such as GPS, and a modifiable design
to accommodate frequencies in a range of UHF, L-band, and S-bands. In addition,
the board hosts an onboard MCU to handle calibration and configuration tasks. The
Chilipepper FMC also includes a standard SMA antenna connector.
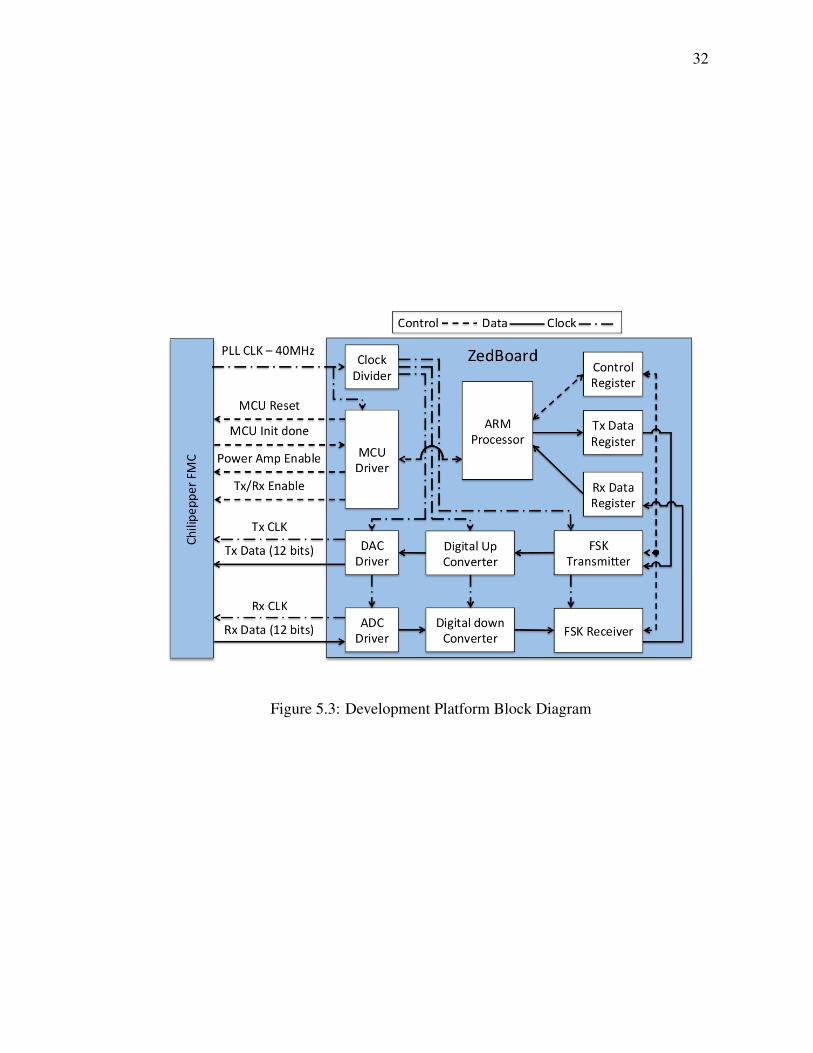
A block diagram of the entire testing platform is shown in Figure 5.3. In order for

30
Table 5.1: ZedBoard Specifications
Processor
Dual ARM Cortex-A9 MPCore
Up to 667 MHz operation
NEON Processing / FPU Engines
Memory
512 MB DDR3 memory
256 Mb Quad SPI Flash
SD/MMC card cage
Connectivity10/100/1000 Ethernet
USB OTG and UART
ExpansionFMC (Low Pin Count)
5 Pmod headers
Video/Display
HDMI output (1080p60 + audio)
VGA connector
128 x 32 OLED
9 User LEDs
User Inputs8 Slide switches
7 Push button switches
Audio
24-bit stereo audio CODEC
Stereo line in/out
Microphone input and Headphone
Analog
Xilinx XADC header
Supports 4 analog inputs
2 Differential / 4 Single-ended
Debug/ProgrammingOn-board USB JTAG programming port
ARM Debug Access Port (DAP)
Power 12V DC input @ 3.0 A (max)
Dimensions 6.3 inches x 5.3 inches
31
the Chilipepper FMC to interface with the FPGA and ARM Processor on the ZedBoard,
drivers for the FMC’s microcontroller (MCU), digital-to-analog converter (DAC), and
analog-to-digital converter (ADC) must be added to the hardware design on the Zed-
Board. In addition, there are a number of different clock domains utilized in this design.
These different clock domains are necessary in order to preserve the sampling frequency
and carrier frequencies of the FSK transmitter and receiver, while meeting the require-
ments of the Chilipepper FMC. It is important to preserve these frequencies on the FSK
transmitter and receiver, because the end goal is to use those blocks in an actual under-
water modem. Therefore, this testing platform should act as a shell in which underwater
modem modules can be easily swapped in and out, without needing to make significant
changes. The functions of each module are described in the next few paragraphs. Please
note that all analog-to-digital and digital-to-analog conversions happen on the Chilipep-
per FMC. Therefore, any modulated inputs or outputs at the FMC-ZedBoard interface
are the digital representations of the desired analog signal.
We designed a software application for the ARM processor in order to send
control signals to the FPGA and to send or receive a user-specified message. When a
message is ready to be sent, its binary representation is written to the tx data register. All
control signals, such as enabling or disabling the transmitter or receiver and controlling
the bit rate, are written to the control register.
When the FSK transmitter module is enabled, it reads the user-specified message
from the tx data register and modulates it. The modulated signal is sampled at 192KHz
with a carrier frequency of 41-42KHz. These characteristics are optimized for use with
the transducer that will be used in the proposed modem. The Chilipepper FMC requires
two modulated inputs, I and Q. These two signals are identical except for a 90 degree
phase shift. Consequently, the FSK transmitter generates its modulated signal from both
a sine wave and a cosine wave. These two modulated signals, I and Q, are then sent to
the digital up converter module for further processing. The FSK transmitter is described
in greater detail in the next section.
The digital up converter module is necessary in up sampling and up converting
32
Figure 5.3: Development Platform Block Diagram
33
the two modulated signals from the FSK transmitter. The Chilipepper FMC supports
modulated baseband signals between 750KHz and 20MHz. In order to meet these spec-
ifications, this module up samples the signals from 192KHz to 19.2MHz and up con-
verts the signals from 40KHz to 800KHz. Up sampling is performed using a cascaded
integrator-comb (CIC) Filter. The up conversion is done by multiplying the modulated
signals with a 760KHz sine wave, and passing the product through a high pass filter.
The DAC driver interleaves the I and Q data signals from the digital up converter
in order to conserve pins at the FMC interface. As a result, this module must be clocked
at a rate of 2x the sample rate of the modulated input. In this case, I and Q are sampled
at 19.2MHz, which requires the DAC driver to be clocked at 38.4MHz. This driver is
responsible for sending the digital baseband modulated signals and transmit clock from
the ZedBoard to the FMC.
The ADC driver is also clocked at 38.4MHz to match the sampling frequency of
the digital modulated signals coming from the Chilipepper FMC. This driver separates
the interleaved I and Q modulated signals and passes them to the digital down converter
for further processing.
The digital down converter module is responsible for down converting and down-
sampling the received signal back to the original requirements of the FSK receiver. Since
the FSK receiver only requires one modulated signal for demodulation, the Q signal is
discarded at this point. Similar to the digital up converter, the down conversion is done
by multiplying the input modulated signal with a 760KHz sine wave, and passing the
product through a low pass filter. The down sampling is again performed using a CIC
filter.
The FSK receiver receives a modulated signal as input from the digital down
converter module. When a packet is detected, it synchronizes with the packet and de-
modulates the data. The demodulated data is then written to the rx data register for
the ARM processor to read. The FSK receiver is described in greater detail in the next
section.
When the test platform is in receive mode and it has detected a packet, the re-

34
ceived message is written to the rx data register and a control signal is set to indicate
that a message has been received. The software application will then read the message
from the register and print it to the console for the user to see.
The MCU driver is clocked at 40MHz and allows the ARM processor to pass
control signals to and from the MCU on the Chilipepper FMC. These control signals are
responsible for status communication and enabling/disabling the receiver and transmit-
ter on the FMC.
The clock divider module generates each of the necessary clocks from a 40MHz
PLL reference clock provided by the Chilipepper FMC. It generates a 38.4MHz clock
for the DAC and ADC drivers, a 19.2MHz clock for the digital up converter and digital
down converter modules, and two clocks, 192KHz and 16KHz, for the FSK transmitter
and receiver.
Now that the basic functionalities of the modules that make up the test platform
have been explained, the next section will go into detail about the implementation of the
FSK transmitter and receiver.
5.2. FSK Transmitter and Receiver Design
The FSK transmitter and receiver implemented on this test platform are orig-
inally based on the FSK transmitter and receiver from Dr. Bridget Benson’s Thesis
[3]. Modifications have been made to the original Verilog code in order to dynamically
change the bit rate of the modem. This FSK transmitter and receiver pair use binary
FSK with a carrier frequency of 40KHz. The mark, a binary 1, and space, a binary 0,
frequencies are 42KHz and 41KHz respectively. An example of how the FSK trans-
mitter would modulate a bit stream is shown in Figure 5.4. The implementation of the
transmitter and receiver are described in the next sections.

35
Figure 5.4: Binary FSK Modulation Example
5.2.1. FSK Transmitter
A block diagram of the FSK transmitter is shown in Figure 5.5. The transmitter
has three main modules; Carrier Generator, Modulator, and Sin/Cos Generator. The
FSK transmitter requires an enable signal and a data bitstream as inputs, and outputs the
corresponding modulated data. One small change that was made to the original FSK
transmitter in order to make it compatible with the test platform is the addition of a
second modulated data output in order to generate both the I and Q signals discussed in
the previous section.
Figure 5.5: FSK Transmitter Block Diagram

36
The transmitter requires two clocks; a symbol clock and a sample clock. The
symbol clock has a period equal to the specified bit rate. This clock is predominantly
used by the modulator module and is aligned with the data bitstream to indicate when
the next bit has arrived. The sample clock has a period equal to the sample rate of the
modem. In this case, the sample rate is fixed to 192KHz. This rate was chosen in the
original design as part of a hardware restriction for a data acquisition device. Since the
rate is sufficiently fast according to the Nyquist Sampling Theorem, the sample rate was
not changed.
The carrier generator module is in charge of generating the mark and space theta
values that are used to construct the sinusoid used in FSK modulation. Both of these
theta values are passed to the modulator block which outputs the correct mark or space
theta value that matches with the binary 1 or 0 coming from the data bitstream. This
final theta value is sent to the sine/cosine generator module which largely consists of a
sine and cosine lookup table, matching the theta value to the actual sine/cosine signal
value. The output of this module is the modulated data that will be sent to the digital up
converter module for further processing.
5.2.2. FSK Receiver
A block diagram of the FSK receiver is shown in Figure 5.6. The receiver has
five main modules; down converter, sync shaper, sync correlator, sync aligner, and FSK
demodulator. It takes as input the received signal from the Chilipepper FMC, called
rx data. The receiver outputs the final demodulated data as a binary bitstream. Packet
synchronization is done by aligning the incoming packet with a known 15 bit gold code
which is present in the packet header.
The receiver requires three clocks; a 4x symbol clock, a sample clock and a
baseband sample clock. The rate of the 4x symbol clock is four times as fast as the
symbol clock from the FSK transmitter. The sample clock is the same 192KHz clock
that is connected to the FSK transmitter. This clock is only connected to the down

37
Figure 5.6: FSK Receiver Block Diagram
converter module. The rest of the modules in the receiver are clocked by the baseband
sample clock. This clock has a period of 16KHz. These modules are clocked at a
slower rate because the output of the down converter is a 0-5KHz signal, and a slower
processing clock rate is more suitable. The individual modules of the FSK receiver are
described below.
The down converter module down converts the rx data signal by multiplying the
signal with a continuous 40KHz signal generated from a cosine lookup table and then
passing the product through a 5KHz low pass filter. The mark and space frequencies
will then be represented by 2KHz and 1KHz signals respectively. These signals are
re-sampled at the rate of the baseband sample clock. This down converted and down
sampled rx data signal is then passed to both the FSK demodulator and the sync shaper
for further processing.
The sync shaper module shapes the baseband rx data signal into a square-like
waveform. This is done by first passing the baseband rx data signal through both a
1KHz and a 2KHz band pass filter in parallel. The absolute values of the outputs of each

38
of the band pass filters are summed over one period of the 4x symbol clock. The 1KHz
band pass filter sum is then subtracted from the 2KHz band pass filter sum which results
in either a positive or negative value. In this case, a positive value would represent a
binary 1 and a negative value would represent a binary 0. This difference result is then
passed to the sync correlator for further processing.
The sync correlator module essentially correlates the difference result from the
sync shaper module with the 15-bit gold code used for packet synchronization. This is
done with a 60-bit shift register that acts as a sliding window for the difference result. It
is 60 bits wide because the window must cover the length of the 15-bit gold code. Since
the difference result is sampled at four times a symbol period, the 15-bit gold code must
also be oversampled by 4. This results in a 60-sample gold code. The cross-correlation
between the difference result and the gold code is calculated for one window period
and the result is sent to the sync aligner to search for correlation peaks. In parallel,
the orthogonal correlation is also calculated by finding the cross-correlation with the
difference result and a 15-bit gold code that is orthogonal to the reference gold code, in
the same manner. This orthogonal correlation is used as a dynamic threshold in the sync
aligner module.
The sync aligner module aligns the incoming packet with the highest peak in
a a two-window sized period. This detection period begins when the first peak occurs
above the dynamic threshold. This two-window alignment period is necessary in order
to avoid finding false peaks if the data within the packet has a high correlation with
the gold code. Once the highest peak has been found, this index is sent to the FSK
demodulator module, along with a synchronized symbol clock which is generated from
the 4x symbol clock.
The FSK demodulator block demodulates the baseband rx data signal into binary
1s and 0s which are output as the demodulated data and sent to the ARM processor. This
process is implemented as a classic matched filter demodulator. The rx data signal is
passed through another set of 1KHz and 2KHz band pass filters in parallel. The output
of each of the band pass filters is squared and summed over a period of one symbol.

39
If the resulting product of the 1KHz band pass filter is larger than the 2KHz band pass
filter, then the demodulated bit is a binary 0. Otherwise, the demodulated bit is a binary
1.
The modules described in this section make up the FSK receiver which includes
gold code synchronization and demodulation. The FSK transmitter, along with all its
modules, was described in the previous section. This concludes the description of the
modules implemented on the ZedBoard as part of the test platform. The next section
describes the channel estimation implementation in Matlab and how it can be integrated
into the test platform in the future.
5.3. Channel Estimation
The channel estimation module for the proposed modem has been implemented
in Matlab. Although the module has not been implemented as part of the test platform at
this point, the structure of the channel estimation code lends itself to a straight-forward
hardware implementation. This task has been allocated to future work. This module is
key in the design of the proposed modem in that it allows the modem to make decisions
based on the current channel characteristics, and thus adapt its bit rate and modulation
scheme in real time. Once this module is added to the ZedBoard design, the user will
no longer need to specify a bit rate in order to demonstrate the adaptive capabilities of
the modem. The Matlab implementation can be described as follows.
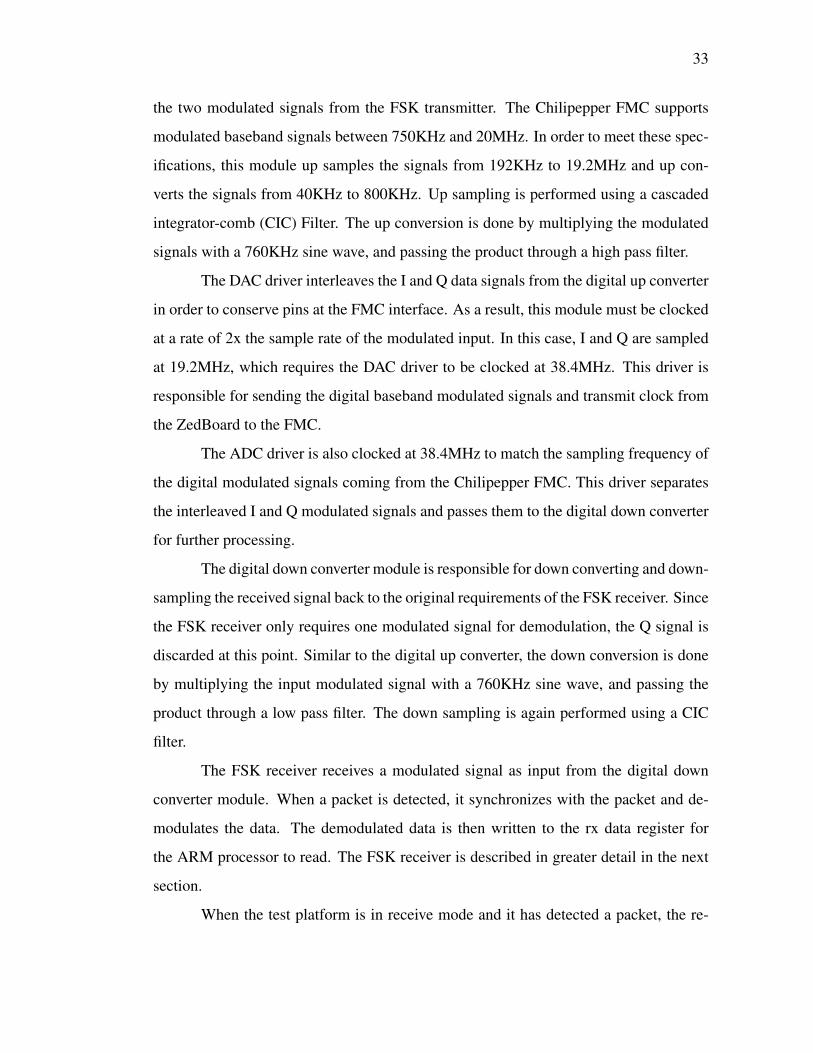
Upon receiving a series of chirp signals which have been included in a request-
to-send (RTS) packet, as shown in Figure 5.7, the three sub modules within the channel
estimation module will calculate the multipath delay spread, doppler shift, and SNR.
These modules are described in detail below.
Multipath delay spread can be defined as the time between the arrival of the first
significant path and the last multipath component. This delay spread is commonly calcu-
lated by finding the root mean squared (RMS) delay spread of the received signal [28].
For this implementation, the multipath delay spread is calculated by cross-correlating
40
the received chirp signal with the original chirp signal in order to generate an amplitude
delay profile of the received chirp. The RMS of the amplitude delay profile is used as a
threshold to differentiate strong multipath components from insignificant ones. The de-
lay spread is then computed by calculating the time between the path with the maximum
amplitude (usually the line of sight path) and the last path whose amplitude is greater
than the RMS threshold.
Doppler shift is typically caused by ocean swells and relative motion between
transmitting and receiving nodes. This shift results in a perceived shift in frequency at
the receiving node. Doppler shift is relative to the frequency of the original signal and
can be defined by f̂ = δ∗f where f̂ is the Doppler shift, δ is the Doppler scaling factor of
the channel, and f is the carrier frequency of the transmitted signal. The Doppler scaling
factor can be defined as δ = τrx/τtx − 1, where τ represents the measured time between
the start of two signals, or in this case chirps, as shown in Figure 5.7. Specifically, τtx
is the time between the start of two chirps as defined by the packet header structure and
sent by the transmitter, and τrx is the time between the start of two chirps as observed in
the received packet header.
Figure 5.7: Packet Header Structure For Channel Estimation
SNR is a much simpler calculation and can be defined as:
snr = var(received_signal)/var(ambient_noise) (5..1)
where the function var(x) is the variance of x. Using the packet header structure from
Figure 5.7, the variance of the ambient noise can be calculated during the time guard
between the two chirps, and the variance of the signal can be calculated during the
transmission of one of the chirps.
41
The channel characteristics that are estimated in these three channel estimation
submodules can be used to select a modulation scheme and bit rate combination that
is expected to perform well given the observed channel. Since the channel varies over
time, this channel estimation processes will occur at the beginning of every series of
data packets that will be sent across a link.
This concludes the explanation of the implementation of the test platform. This
platform consists of a Chilipepper FMC (radio front end) and a ZedBoard (digital mo-
dem). The platform is intended for prototyping modulation schemes and bit rates in-
tended for underwater communication in a real environment. Once the channel esti-
mation module and an additional transmitter and receiver pair with a second example
modulation scheme is added to the design, the test platform will be fully capable of
demonstrating the adaptive capabilities of the proposed modem in real time. For now,
the adaptive capabilities are restricted to a user-modified bit rate. The next section dis-
cusses the implementation results for this test platform.
5.4. Results
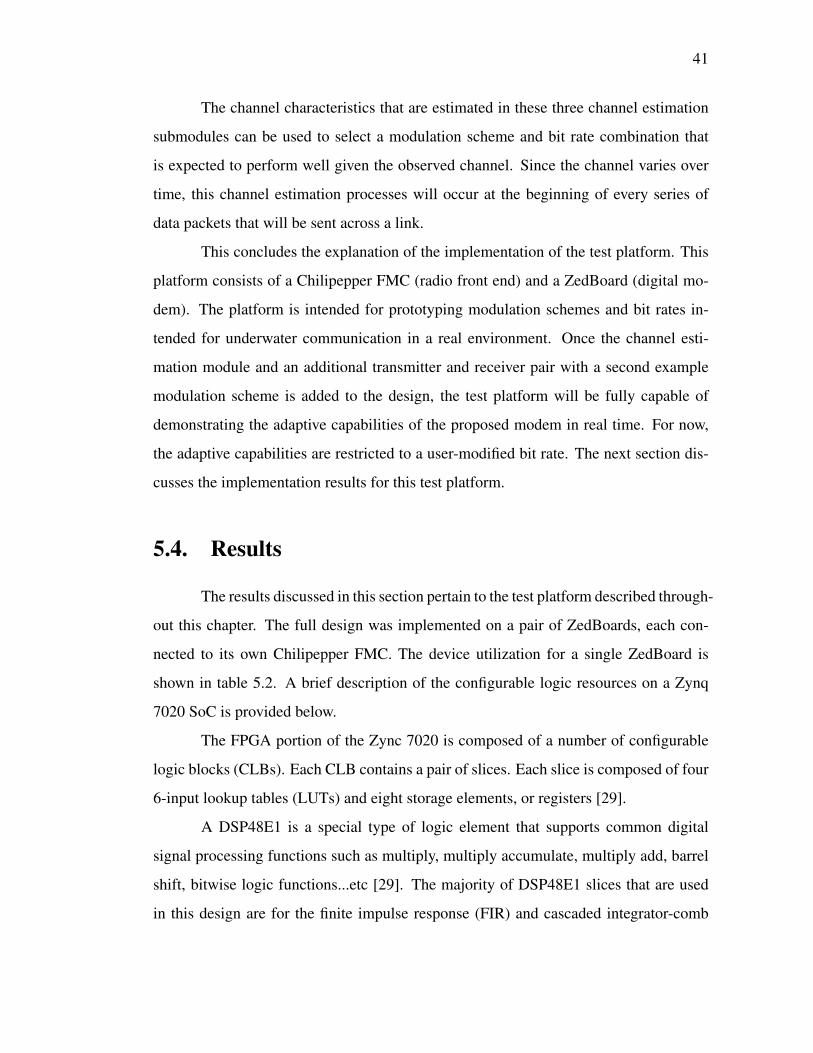
The results discussed in this section pertain to the test platform described through-
out this chapter. The full design was implemented on a pair of ZedBoards, each con-
nected to its own Chilipepper FMC. The device utilization for a single ZedBoard is
shown in table 5.2. A brief description of the configurable logic resources on a Zynq
7020 SoC is provided below.
The FPGA portion of the Zync 7020 is composed of a number of configurable
logic blocks (CLBs). Each CLB contains a pair of slices. Each slice is composed of four
6-input lookup tables (LUTs) and eight storage elements, or registers [29].
A DSP48E1 is a special type of logic element that supports common digital
signal processing functions such as multiply, multiply accumulate, multiply add, barrel
shift, bitwise logic functions...etc [29]. The majority of DSP48E1 slices that are used
in this design are for the finite impulse response (FIR) and cascaded integrator-comb
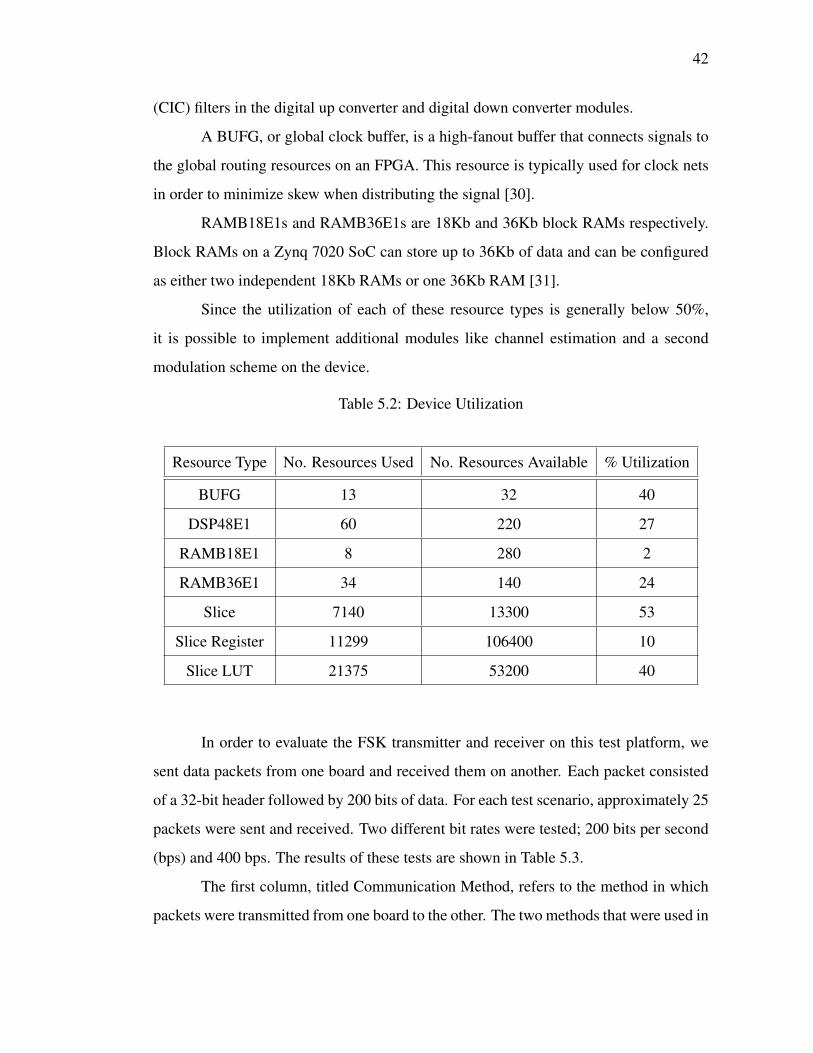
42
(CIC) filters in the digital up converter and digital down converter modules.
A BUFG, or global clock buffer, is a high-fanout buffer that connects signals to
the global routing resources on an FPGA. This resource is typically used for clock nets
in order to minimize skew when distributing the signal [30].
RAMB18E1s and RAMB36E1s are 18Kb and 36Kb block RAMs respectively.
Block RAMs on a Zynq 7020 SoC can store up to 36Kb of data and can be configured
as either two independent 18Kb RAMs or one 36Kb RAM [31].
Since the utilization of each of these resource types is generally below 50%,
it is possible to implement additional modules like channel estimation and a second
modulation scheme on the device.
Table 5.2: Device Utilization
Resource Type No. Resources Used No. Resources Available % Utilization
BUFG 13 32 40
DSP48E1 60 220 27
RAMB18E1 8 280 2
RAMB36E1 34 140 24
Slice 7140 13300 53
Slice Register 11299 106400 10
Slice LUT 21375 53200 40
In order to evaluate the FSK transmitter and receiver on this test platform, we
sent data packets from one board and received them on another. Each packet consisted
of a 32-bit header followed by 200 bits of data. For each test scenario, approximately 25
packets were sent and received. Two different bit rates were tested; 200 bits per second
(bps) and 400 bps. The results of these tests are shown in Table 5.3.
The first column, titled Communication Method, refers to the method in which
packets were transmitted from one board to the other. The two methods that were used in
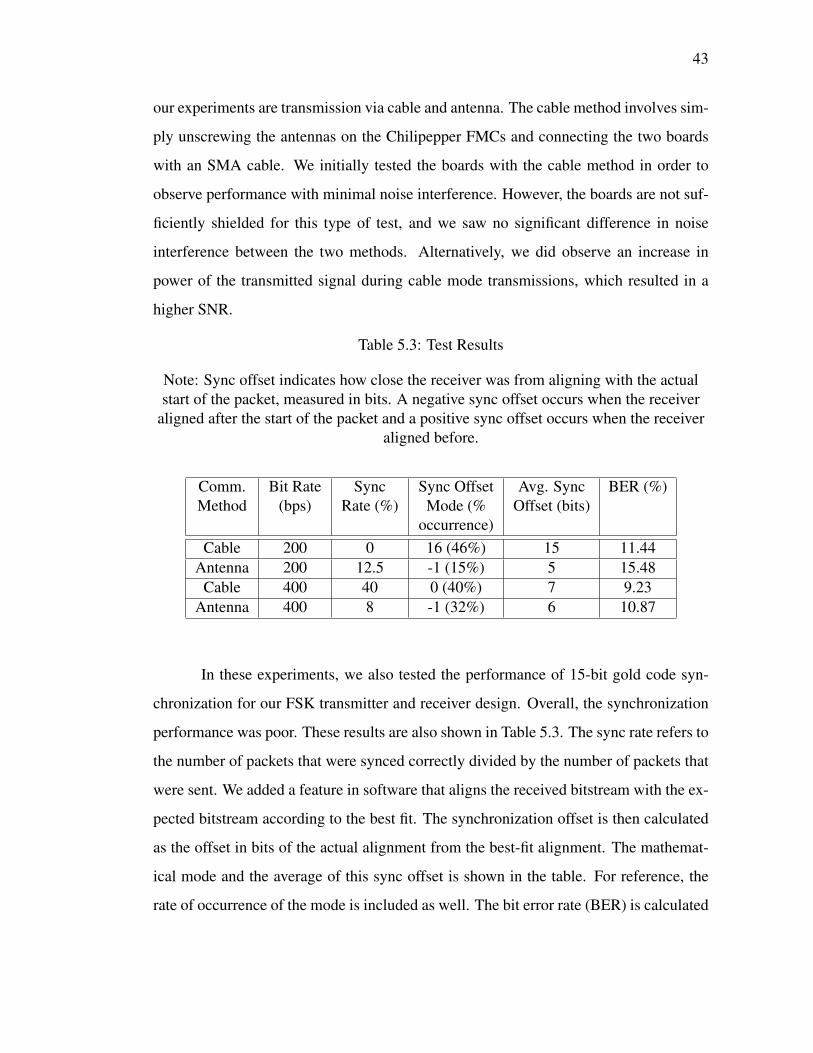
43
our experiments are transmission via cable and antenna. The cable method involves sim-
ply unscrewing the antennas on the Chilipepper FMCs and connecting the two boards
with an SMA cable. We initially tested the boards with the cable method in order to
observe performance with minimal noise interference. However, the boards are not suf-
ficiently shielded for this type of test, and we saw no significant difference in noise
interference between the two methods. Alternatively, we did observe an increase in
power of the transmitted signal during cable mode transmissions, which resulted in a
higher SNR.
Table 5.3: Test Results
Note: Sync offset indicates how close the receiver was from aligning with the actualstart of the packet, measured in bits. A negative sync offset occurs when the receiver
aligned after the start of the packet and a positive sync offset occurs when the receiveraligned before.
Comm.Method
Bit Rate(bps)
SyncRate (%)
Sync OffsetMode (%
occurrence)
Avg. SyncOffset (bits)
BER (%)
Cable 200 0 16 (46%) 15 11.44Antenna 200 12.5 -1 (15%) 5 15.48
Cable 400 40 0 (40%) 7 9.23Antenna 400 8 -1 (32%) 6 10.87
In these experiments, we also tested the performance of 15-bit gold code syn-
chronization for our FSK transmitter and receiver design. Overall, the synchronization
performance was poor. These results are also shown in Table 5.3. The sync rate refers to
the number of packets that were synced correctly divided by the number of packets that
were sent. We added a feature in software that aligns the received bitstream with the ex-
pected bitstream according to the best fit. The synchronization offset is then calculated
as the offset in bits of the actual alignment from the best-fit alignment. The mathemat-
ical mode and the average of this sync offset is shown in the table. For reference, the
rate of occurrence of the mode is included as well. The bit error rate (BER) is calculated

44
according to the best-fit alignment for all packets that were received.
As expected, the cable method shows a lower BER in comparison to the antenna
method. This statistic is most likely a result of the difference in SNR between the
two methods. The signal strength discrepancy can be seen in Figure 5.8 by looking at
the difference in amplitude between the two signals, once most of the noise has been
filtered away. These figures show close to a 100x increase in signal strength from the
antenna mode to the cable mode. These signals were captured using Chipscope during
the transmission of a packet sent at 200bps. As a point of reference, Figure 5.9 shows
the ideal output of the receiver’s low pass filter (LPF) for both a binary 1 and a binary 0.
0 0.5 1 1.5 2 2.5 3 3.5 4 4.5 5
-3000-2000-1000
0100020003000
Time (ms)
Am
plitu
de
Cable Mode LPF Output
0 0.5 1 1.5 2 2.5 3 3.5 4 4.5 5
-60
-40
-20
0
20
40
Time (ms)
Am
plitu
de
Antenna Mode LPF Output
Figure 5.8: LPF Output of Received Signal for Antenna and Cable Modes
Note: These graphs show a small window of the actual received signal. The signalshould be either a 1KHz or 2KHz sine wave, representing a binary 0 or 1 respectively.Since the captured window is not synchronized with the incoming signal, a resultingsine wave with a frequency somewhere between 1KHz and 2KHz is possible if the
window falls during a transition between bits.

45
0 0.5 1 1.5 2 2.5 3 3.5 4 4.5 5
-2000
-1000
0
1000
2000
1KHz Sine Wave
TIme (ms)
Am
plitu
de
0 0.5 1 1.5 2 2.5 3 3.5 4 4.5 5
-2000
-1000
0
1000
2000
30002KHz Sine Wave
Time (ms)
Am
plitu
de
Figure 5.9: 1KHz and 2KHz Generated Sine Waves
Note: These figures portray an ideal output from the FSK receiver’s LPF, in which a1KHz sine wave represents a binary 0 and a 2KHz sine wave represents a binary 1.
The results also indicate that packets transmitted at 400bps have a slightly lower
BER when compared with packets transmitted at 200bps. This difference in BER is
most likely attributed to alignment resolution. If you recall from the description of the
sync correlator module in the FSK receiver discussed in Section 5.2.2, the 60-bit shift
register that is used for cross correlation with the gold code samples the shaped signal at
4 times the symbol period. Therefore, our sampling rate for the sync correlator module
increases with the bit rate. This characteristic translates to faster bit rates having a higher
alignment resolution when compared with slower bit rates. Since 400bps is 2x faster
than 200bps, it will have 2 times the alignment resolution, resulting in a potentially more
accurate alignment and a higher probability of having a lower BER when compared with
packets transmitted at 200bps.

46
Now that we’ve concluded analyzing the BERs for each of the experiments, we
will now move on to discuss the performance of the 15-bit gold code synchronization.
Figure 5.10 shows the sync offsets for every packet that was received in each of the
experiments. The alignment resolution issue discussed in the previous paragraph will
also have an effect on the sync offset. The higher the alignment resolution, the more
accurate the correlation result will be. This condition most likely explains the increase
in sync rate between the experiments using the cable method with bit rates of 200bps
and 400bps.
Figure 5.10: Sync Offset
One notable characteristic of the test results for both cable experiments is that a
majority of the sync offsets are divided between 0 and 16. Specifically, 80% of the sync
offsets in the cable method test with a bit rate of 200bps are between 15 and 17, with
46% of the sync offsets equal to 16. If the sync offset is 16 bits, the highest correlation
peak would have occurred at bit 16 of the packet header. For these tests, the packet
header consisted of 15 bits of zero-padding, 15 bits of gold code, and 2 additional bits
of zero-padding. The correlation shift register will be full of the modulated equivalent of

47
binary 0s by bit 15 of the packet header. It is possible that since the alignment resolution
is so poor for the 200bps case that the Sync Correlator module is simply finding a peak
when any modulated signal has filled the shift register. For the case of the 400bps test,
40% of the packets aligned correctly, and 35% of the packets had a sync offset between
15 and 17. These results may show a correlation with the improved alignment resolution
(over the 200bps case).
The two antenna test cases are also subject to the same alignment resolution
characteristics. However, the results show a decrease in sync rate from the 200bps case
to the 400bps case. Since the antenna transmission method results in a lower SNR, it
is possible that the correlation result at the 15th bit of the packet header (the point at
which the shift register fills) does not pass the peak threshold, and the chance of early
alignment is reduced.
After analyzing the results in detail it is apparent that this particular implementa-
tion of 15-bit gold code synchronization is insufficient for proper communication. One
way of improving the design would be to separate the synchronization module from the
FSK receiver and implement a modulation-scheme and bit rate independent synchro-
nization technique using the chirp signal described in section 4.2. This improvement
would also have the benefit of saving implementation time and device resources since
each modulation scheme would not need to implement its own synchronization module.
It is also important to note that the BERs are generally higher than desired for
reliable communication. We can expect some improvement with a better synchroniza-
tion technique. In addition, no attempts have been made to reduce the BER by using
an error-correcting code. This issue of high BERs along with its solutions points out
the need for such a test platform in identifying problems and making improvements to a
digital underwater modem design. Therefore, we believe that this test platform will be
useful in future prototyping of underwater modem protocols.
Chapter 6.
Conclusion
In this thesis I present my work on the design of an adaptable underwater acous-
tic modem and the implementation of a test platform for rapid prototyping of underwater
modems in a real environment. I also discuss simulation and ocean test results that help
show potential benefits of an adaptive modem through the theoretical possibility of re-
duced power consumption and increased robustness to the underwater communication
channel.
The proposed adaptable modem will have the capability of measuring the com-
munication channel and estimating a set of channel characteristics. These characteristics
will be used to adapt the modulation scheme and bit rate of the modem in real time in
order to improve reliability and power efficiency through optimized data rates. In addi-
tion, the components of the modem will be designed with cost in mind in order to ensure
a low-cost device. The goal of this modem is to provide a cost-effective and improved
solution to acoustic communication within underwater wireless sensor networks.
We conducted simulations in AcTUP across five different communication links.
The results of these experiments show that the characteristics of the communication
channel can change significantly depending on the location of the transmitting and re-
ceiving nodes. We also show how using an adaptive bit rate has the potential to reduce
total power consumption while staying below a bit error rate (BER) threshold.
48
49
We performed ocean tests using two different modulation schemes, FSK and
DSSS, across a range of different bit rates. The ocean tests confirm our findings from
the simulations that channel characteristics can change depending on the location of the
transmitting and receiving nodes, and that the BER is effected by both the bit rate and
the changing channel characteristics.
The conclusions that we draw from these simulations and ocean tests support
our hypothesis that an adaptable modem which can change its bit rate and modulation
scheme depending on measured channel characteristics can be beneficial in underwater
wireless sensor networks with mobile nodes in shallow water environments.
We also present our implementation of a test platform which is designed in such
a way that modulator and demodulator modules can be rapidly prototyped and tested.
Our implementation currently supports FSK modulation with modulated gold code syn-
chronization and two bit rate options. Future improvements of the test platform, like the
addition of a channel estimation module and a second modulation scheme, will allow
for testing of the proposed adaptable modem design.

Bibliography
[1] L. Wu, J. Trezzo, D. Mirza, P. Roberts, J. Jaffe, Y. Wang, and R. Kastner, “De-signing an adaptive acoustic modem for underwater sensor networks,” EmbeddedSystems Letters, IEEE, vol. 4, no. 1, pp. 1–4, 2012.
[2] P. Roberts. (2009, July) Autonomous underwater explorer: Jaffe laboratory forunderwater imaging. [Online]. Available: http://jaffeweb.ucsd.edu/node/81
[3] B. Benson, “Design of a low-cost underwater acoustic modem for short-range sen-sor networks,” Ph.D. dissertation, The University of California, San Diego, 2010.
[4] A. Goldsmith, Wireless Communications. 40 West 20th Street, New York, NY:Cambridge University Press, 2005.
[5] M. Stojanovic, “On the relationship between capacity and distance in an underwa-ter acoustic communication channel,” ACM SIGMOBILE Mobile Computing andCommunications Review, vol. 11, no. 4, pp. 34–43, 2007.
[6] I. F. Akyildiz, D. Pompili, and T. Melodia, “Challenges for efficient communica-tion in underwater acoustic sensor networks,” in ACM SIGBED Review, 2004.
[7] L. Freitag, M. Grund, S. Singh, J. Partan, P. Koski, and K. Ball, “The whoi micro-modem: An acoustic communications and navigation system for multiple plat-forms,” in IEEE Oceans Conference, Washington, DC, 2005.
[8] J. Partan, J. Kurose, and B. N. Levine, “A survey of practical issues in underwaternetworks,” SIGMOBILE Mob. Comput. Commun. Rev., vol. 11, no. 4, pp. 23–33,Oct. 2007. [Online]. Available: http://doi.acm.org/10.1145/1347364.1347372
[9] B. Li, S. Zhou, M. Stojanovic, L. Freitag, and P. Willett, “Non-uniform dopplercompensation for zero-padded ofdm over fast-varying underwater acoustic chan-nels,” in IEEE Oceans 2007 - Europe, Aberdeen, Scotland, June 2007.
[10] (2013, June) Aquamodem 1000 data sheet. Aquatec Group Limited. [Online].Available: http://www.aquatecgroup.com/images/datasheets/aquamodem1000.pdf
[11] (2013, June) Linkquest underwater acoustic modems uwm2000h specifications.LinkQuest. [Online]. Available: http://www.link-quest.com/html/uwm2000h.htm
50

51
[12] (2013, June) S2c 48/78 underwater acoustic modem. EvoLogic. [Online].Available: http://www.evologics.de/en/products/acoustics/s2cr_48_78.html
[13] (2013, June) Micron data modem - underwater acoustic modem. Tritech. [Online].Available: http://www.tritech.co.uk/media/products/micron-data-modem.pdf
[14] (2013, June) Aquacomm: Underwater wireless modem. DSPComm. [Online].Available: http://www.dspcomm.com/products_aquacomm.html
[15] (2013, June) Teledyne benthos smart products - sm-975. Teledyne Benthos.[Online]. Available: http://www.benthos.com/index.php/product/smart_products/sm-975
[16] (2013, June) Aquasent modem. AquaSeNT. [Online]. Available: http://www.aquasent.com/
[17] E. Gallimore, J. Partan, I. Vaughn, S. Singh, J. Shusta, and L. Freitag, “The whoimicromodem-2: A scalable system for acoustic communications and networking,”in OCEANS 2010, 2010, pp. 1–7.
[18] S. Singh, S. Webster, L. Freitag, L. Whitcomb, K. Ball, J. Bailey, and C. Tay-lor, “Acoustic communication performance of the whoi micro-modem in sea trialsof the nereus vehicle to 11,000 m depth,” in OCEANS 2009, MTS/IEEE Biloxi -Marine Technology for Our Future: Global and Local Challenges, 2009, pp. 1–6.
[19] J.-H. Jeon, N.-Y. Yun, H. Nam, C.-G. Hong, S.-J. Park, S.-H. Park, S. An,C.-H. Kim, G.-H. Yang, and Y.-S. Ryuh, “A moving underwater communicationsystem with bio-inspired fish robots,” in Proceedings of the Seventh ACMInternational Conference on Underwater Networks and Systems, ser. WUWNet’12. New York, NY, USA: ACM, 2012, pp. 15:1–15:7. [Online]. Available:http://doi.acm.org/10.1145/2398936.2398956
[20] H. Yan, S. Zhou, Z. Shi, J.-H. Cui, L. Wan, J. Huang, and H. Zhou, “Dsp imple-mentation of siso and mimo ofdm acoustic modems,” in OCEANS 2010 IEEE -Sydney, 2010, pp. 1–6.
[21] P.-P. Beaujean, E. Carlson, J. Spruance, and D. Kriel, “Hermes - a high-speedacoustic modem for real-time transmission of uncompressed image and statustransmission in port environment and very shallow water,” in OCEANS 2008, 2008,pp. 1–9.
[22] R. A. Iltis, H. Lee, R. Kastner, D. Doonan, T. Fu, R. Moore, and M. Chin, “Anunderwater acoustic telemetry modem for eco-sensing,” in Oceans, 2005. Pro-ceedings of MTS/IEEE, Washington, DC, September 2005.

52
[23] A. Radosevic, T. Duman, J. Proakis, and M. Stojanovic, “Channel prediction foradaptive modulation in underwater acoustic communications,” in OCEANS, 2011IEEE - Spain, 2011, pp. 1–5.
[24] F. Tong, B. Benson, Y. Li, and R. Kastner, “Channel equalization based on datareuse lms algorithm for shallow water acoustic communication,” Sensor Networks,Ubiquitous, and Trustworthy Computing, International Conference on, vol. 0, pp.95–98, 2010.
[25] A. Maggi and A. Duncan. (2013, May) Centre for marine science and technology -underwater acoustic propagation modelling software - actup. [Online]. Available:http://cmst.curtin.edu.au/products/actoolbox.cfm
[26] (2013, June) Zedboard. [Online]. Available: http://www.zedboard.org
[27] (2013, June) Chilipepper fmc. Toyon. [Online]. Available: http://www.toyon.com/chilipepper.php
[28] H. Li, Z. Bi, D. Liu, J. Li, and P. Stoica, “Channel order and rms delay spreadestimation for ac power line communications,” in Statistical Signal and Array Pro-cessing, 2000. Proceedings of the Tenth IEEE Workshop on, 2000, pp. 229–233.
[29] (2013, August) 7 series fpgas configurable logic block user guide. Xilinx.[Online]. Available: http://www.xilinx.com/support/documentation/user_guides/ug474_7Series_CLB.pdf
[30] (2012, January) 7 series fpga libraries guide for hdl designs. Xilinx. [Online].Available: http://www.xilinx.com/support/documentation/sw_manuals/xilinx13_4/7series_hdl.pdf
[31] (2012, October) 7 series fpgas memory resources user guide. Xilinx.[Online]. Available: http://www.xilinx.com/support/documentation/user_guides/ug473_7Series_Memory_Resources.pdf