Implementation and evaluation of the underwater crack ...
9
* Corresponding author: [email protected] Implementation and evaluation of the underwater crack repair in the hollow concrete block of the gravity wharf Hao Gu 1,2,* , and Ping Sun 2 1 College of Harbour, Coastal and Offshore Engineering, Hohai University, Nanjing, 210024, China 2 Nanjing Hydraulic Research Institute, Nanjing, 210029, China Abstract. Concrete block quay wall is the most popular type of structures in the gravity wharf. The concrete block can be generally categorized into two types: solid and hollow concrete blocks. Compared to the solid concrete block, the hollow concrete block can reduce the usage of concrete significantly and increase the resistance to sliding and overturning. This paper studied the application of hollow concrete blocks in the gravity wharf of Qingdao Port. It was discovered that in the application, the main problem was the crack development in the hollow concrete blocks. The paper first analysed the reason of crack development in the structure by conducting laboratory model tests. It was found that the contact conditions between two hollow concrete blocks was the key of the crack development. In order to improve the performance of the structure of hollow concrete blocks, an effective scheme, which can repair the cracks in the underwater environment and increase the bearing capacity of the gravity wharf, is proposed. The scheme contains two main procedures. The first step is to use the invented mending material to fill up the cracks. The next is to use the grouting technique to bond the rockfill inside the block holes and the hollow concrete blocks together. The model tests, field tests in 1980s and 2010 have proved the effectiveness of the scheme. This paper provides reference for the construction of similar structures. 1 Introduction In recent years, there has been an increasing demand in the construction of ports and harbors around the world since the global trade is growing fast and causes increased shipping traffic [1-4]. To guarantee the daily operation of the ports and harbors, the stability of the quay walls is of great concern. Generally speaking, the principal types of quay wall can be categorized into three types: the gravity structure, the sheet pile structure and pile supported platform structures [5]. The gravity-type structures rely mainly on their weight to resist any adverse load combinations. The advantages of these structures are their simple geometry and adaption to any kinds of environmental conditions, such as foundation conditions, salt water, large waves, etc. The sheet pile structures normally do not exceed 18-20 m. The platform types of structure are generally used if the soil conditions are poor and/or reclamation is very expensive. The structures derive their stability from the piles. Among these three types of quay wall, the gravity structures are the most widely used in ports and harbors [6, 7]. Currently, about 70% of the quay walls constructed all over the world are gravity structures [5]. The gravity structures usually have three types: block quay wall, caisson quay wall and counterfort quay wall. The block quay wall is usually the gravity retaining walls that consist of blocks of concrete or natural stone placed from the water side on a foundation consisting of a layer of gravel or crushed stone on top of each other [8]. The caisson quay wall uses caissons to form a foundation. The caisson is a large box sunk into the ground to some desired depth. It is used as a breakwater to prevent waves and a quay to anchor ships [9-11]. As to the counterfort quay wall, a counterfort retaining wall is a cantilever wall with counterforts, or buttresses, attached to the inside face of the wall to further resist lateral thrust [12, 13]. Among the three types of gravity quay wall, the block quay has its own advantages. The geometry is simple and can be prefabricated. Compared to the caisson quay wall, it is easy to be maintained and fixed, and has longer durability. The consumption of steel of the caisson wall is much larger than that of the block quay wall. The counterfort quay wall is usually utilized for lower water depth. The obvious disadvantage of the counterfort wall is the need to use rather complex and expensive forms for casting of wall units [9, 14, 15]. Because of the advantages of the block quay wall, it has been used world widely. In addition, concrete is the most commonly used construction material throughout the world [16], therefore, the concrete block quay wall becomes the most popular type of block quay walls [17]. The block quay wall generally contains two types: solid and hollow concrete block. Concerning the solid concrete block quay wall, there are many researches have been done, such as Pitilakis and Moutsakis [18], Madanipour et al. [19] and Francois et al. [20]. Compared to the solid concrete block quay wall, the advantages of the hollow concrete block quay wall are the less usage of concrete and the use of local materials, e.g. rocks, stones, etc. Under the same usage of concrete, the cross-section of the hollow concrete block quay wall E3S Web of Conferences 276, 02017 (2021) https://doi.org/10.1051/e3sconf/202127602017 WCHBE 2021 © The Authors, published by EDP Sciences. This is an open access article distributed under the terms of the Creative Commons Attribution License 4.0 (http://creativecommons.org/licenses/by/4.0/).
Transcript of Implementation and evaluation of the underwater crack ...

* Corresponding author: [email protected]
Implementation and evaluation of the underwater crack repair in the hollow concrete block of the gravity wharf
Hao Gu1,2,*, and Ping Sun2 1 College of Harbour, Coastal and Offshore Engineering, Hohai University, Nanjing, 210024, China 2 Nanjing Hydraulic Research Institute, Nanjing, 210029, China
Abstract. Concrete block quay wall is the most popular type of structures in the gravity wharf. The concrete block can be generally categorized into two types: solid and hollow concrete blocks. Compared to the solid concrete block, the hollow concrete block can reduce the usage of concrete significantly and increase the resistance to sliding and overturning. This paper studied the application of hollow concrete blocks in the gravity wharf of Qingdao Port. It was discovered that in the application, the main problem was the crack development in the hollow concrete blocks. The paper first analysed the reason of crack development in the structure by conducting laboratory model tests. It was found that the contact conditions between two hollow concrete blocks was the key of the crack development. In order to improve the performance of the structure of hollow concrete blocks, an effective scheme, which can repair the cracks in the underwater environment and increase the bearing capacity of the gravity wharf, is proposed. The scheme contains two main procedures. The first step is to use the invented mending material to fill up the cracks. The next is to use the grouting technique to bond the rockfill inside the block holes and the hollow concrete blocks together. The model tests, field tests in 1980s and 2010 have proved the effectiveness of the scheme. This paper provides reference for the construction of similar structures.
1 Introduction In recent years, there has been an increasing demand in the construction of ports and harbors around the world since the global trade is growing fast and causes increased shipping traffic [1-4]. To guarantee the daily operation of the ports and harbors, the stability of the quay walls is of great concern. Generally speaking, the principal types of quay wall can be categorized into three types: the gravity structure, the sheet pile structure and pile supported platform structures [5]. The gravity-type structures rely mainly on their weight to resist any adverse load combinations. The advantages of these structures are their simple geometry and adaption to any kinds of environmental conditions, such as foundation conditions, salt water, large waves, etc. The sheet pile structures normally do not exceed 18-20 m. The platform types of structure are generally used if the soil conditions are poor and/or reclamation is very expensive. The structures derive their stability from the piles.
Among these three types of quay wall, the gravity structures are the most widely used in ports and harbors [6, 7]. Currently, about 70% of the quay walls constructed all over the world are gravity structures [5]. The gravity structures usually have three types: block quay wall, caisson quay wall and counterfort quay wall. The block quay wall is usually the gravity retaining walls that consist of blocks of concrete or natural stone placed from the water side on a foundation consisting of a layer of gravel or crushed stone on top of each other [8]. The caisson quay wall uses caissons to form a
foundation. The caisson is a large box sunk into the ground to some desired depth. It is used as a breakwater to prevent waves and a quay to anchor ships [9-11]. As to the counterfort quay wall, a counterfort retaining wall is a cantilever wall with counterforts, or buttresses, attached to the inside face of the wall to further resist lateral thrust [12, 13]. Among the three types of gravity quay wall, the block quay has its own advantages. The geometry is simple and can be prefabricated. Compared to the caisson quay wall, it is easy to be maintained and fixed, and has longer durability. The consumption of steel of the caisson wall is much larger than that of the block quay wall. The counterfort quay wall is usually utilized for lower water depth. The obvious disadvantage of the counterfort wall is the need to use rather complex and expensive forms for casting of wall units [9, 14, 15].
Because of the advantages of the block quay wall, it has been used world widely. In addition, concrete is the most commonly used construction material throughout the world [16], therefore, the concrete block quay wall becomes the most popular type of block quay walls [17]. The block quay wall generally contains two types: solid and hollow concrete block. Concerning the solid concrete block quay wall, there are many researches have been done, such as Pitilakis and Moutsakis [18], Madanipour et al. [19] and Francois et al. [20]. Compared to the solid concrete block quay wall, the advantages of the hollow concrete block quay wall are the less usage of concrete and the use of local materials, e.g. rocks, stones, etc. Under the same usage of concrete, the cross-section of the hollow concrete block quay wall
E3S Web of Conferences 276, 02017 (2021) https://doi.org/10.1051/e3sconf/202127602017WCHBE 2021
© The Authors, published by EDP Sciences. This is an open access article distributed under the terms of the Creative Commons Attribution License 4.0 (http://creativecommons.org/licenses/by/4.0/).

is larger, which increases the resistance to sliding and overturning. Therefore, the research of applying the hollow concrete block in the gravity wharf is necessary.
Based on Qingdao Port, this paper studied a real case of applying the hollow concrete block in the wharf. In this paper, the problem occurred in the application of hollow concrete block was first presented. Then, the reason of the problem was investigated by using laboratory model tests. Later, a useful scheme was proposed which could solve the problem and improve the performance of the structure formed by the hollow concrete blocks. The effectiveness was proved by laboratory tests and field tests in 1980s and 2010.
2 Basic information of the wharf The 52nd wharf in Qingdao Port was constructed from the early 1980s and went into service in 1986. It is a gravity wharf built of hollow concrete blocks. The cross-section of the 52nd wharf is shown in Fig. 1. It can be seen from Fig. 1 that there are three layers of hollow concrete block overlying two layers of solid concrete blocks. The hollow space of the concrete block was initially filled with rocks in the construction period. The diameter of the rock is from 15 cm to 20 cm, and the porosity of the rockfill is approximately 30%-40%. On top of the hollow concrete blocks, it is the relieving slab and the breast wall. The final elevation of the wharf is 5.6 m.
Fig. 1. Cross-section of the 52nd wharf in Qingdao Port (length
unit: cm, elevation unit: m).
The length of each hollow concrete block is 5 m, the width is 5 m and the height is 2.2 m. There are two holes in the block. Fig. 2 shows the geometry of the hollow concrete block. The positions of the two holes are symmetrical and each hole is 3.8 m long, 1.3 m wide and 2.2 m high. The concrete grade is C20.
Fig. 2. Geometry of the hollow concrete block, (a) top view; (b)
3D view.
3 Deficiency in the application of the hollow concrete blocks in the gravity wharf
During the construction period of the wharf, several cracks in the hollow concrete blocks, which had already been placed in position, were found in 1983. After the completion of the wharf, the further development of the cracks had been detected. The following Table 1 shows the development of the cracks in the three layers of the hollow concrete blocks in 1983, 1987-1989. Table 2 shows the total number of blocks carrying different number of cracks.
Table 1. Number of cracks in the three layers of hollow concrete blocks.
Year Layer 1983 1987 1988 1989 Total
Upper 8 9 1 6 24 Middle 10 18 4 4 36 Lower 17 25 5 8 55
Table 2. Number of blocks having different number of cracks till 1989.
Number of Cracks
Layer 1 2 3
Total
Number of blocks with cracks/ Total
number of blocks in that layer
Upper 10 7 0 17 47.2% Middle 18 9 0 27 71.7% Lower 9 14 6 29 76.3%
From Tables 1 and 2, it can be found that the cracks emerged during the construction of the wharf. Later, after the wharf going to service, the number of cracks kept increasing. In addition, the length and width of those cracks increased as well. The length of some cracks was up to 2 m. Till 1989, for each layer, many blocks had been detected with cracks, and the ratio for each layer was 47.2%, 71.7% and 76.3% from the upper layer to the bottom layer. For the lower layer, the situation was the worst. There were six blocks detected with 3 cracks.
In the summer of 1991, by using the underwater inspection, the width of some of the cracks was found to increase to 3-4 cm. More seriously, several concrete fragments were collected, which had a length of 20 cm and a width of 10-15 cm.
2
E3S Web of Conferences 276, 02017 (2021) https://doi.org/10.1051/e3sconf/202127602017WCHBE 2021
4 Reason of crack development in the hollow concrete blocks of the gravity wharf Since the cracks posed a serious threat to the stability of the gravity wharf, it was necessary to find out the reason of crack development. From the appearance of the cracks (Fig. 3), it was found that most of the cracks were approximately vertical and close to the middle part of the hollow concrete block. It was postulated that the main reason for the cracks may be because the block surface was not smooth. This induced that the contact between two hollow concrete blocks became point contact rather than the supposed plane contact. The point contact worsens the supporting and loading conditions of the hollow concrete blocks.
Fig. 3. Appearance of the cracks in the hollow concrete blocks
observed by underwater inspection. The roughness was caused by the production of the
hollow concrete blocks. At that time, there were no regulations concerning about the flatness of the surface of the hollow concrete block. Normally, the regulations for solid concrete blocks were used for the hollow concrete blocks, which was ±1 cm allowed for the surface irregularity. Moreover, in practice, the irregularity (±1 cm) could be magnified due to the manufacturing technology for such a large concrete block (5 m×5 m×2.2 m). Fig. 4 shows the possible point contact between different blocks. The contact of two hollow concrete blocks changes from plane contact to point contact. In this situation, the stress conditions of the hollow concrete blocks are much worse than that assumed in the design process.
Fig. 4. Possible contact conditions of the hollow concrete
blocks. In order to verify the postulation, model tests had
been undertaken. In the model tests, the geometric scale was 1:5, which meant the size of the model was 100 cm×100 cm×44 cm and the two holes in the model block
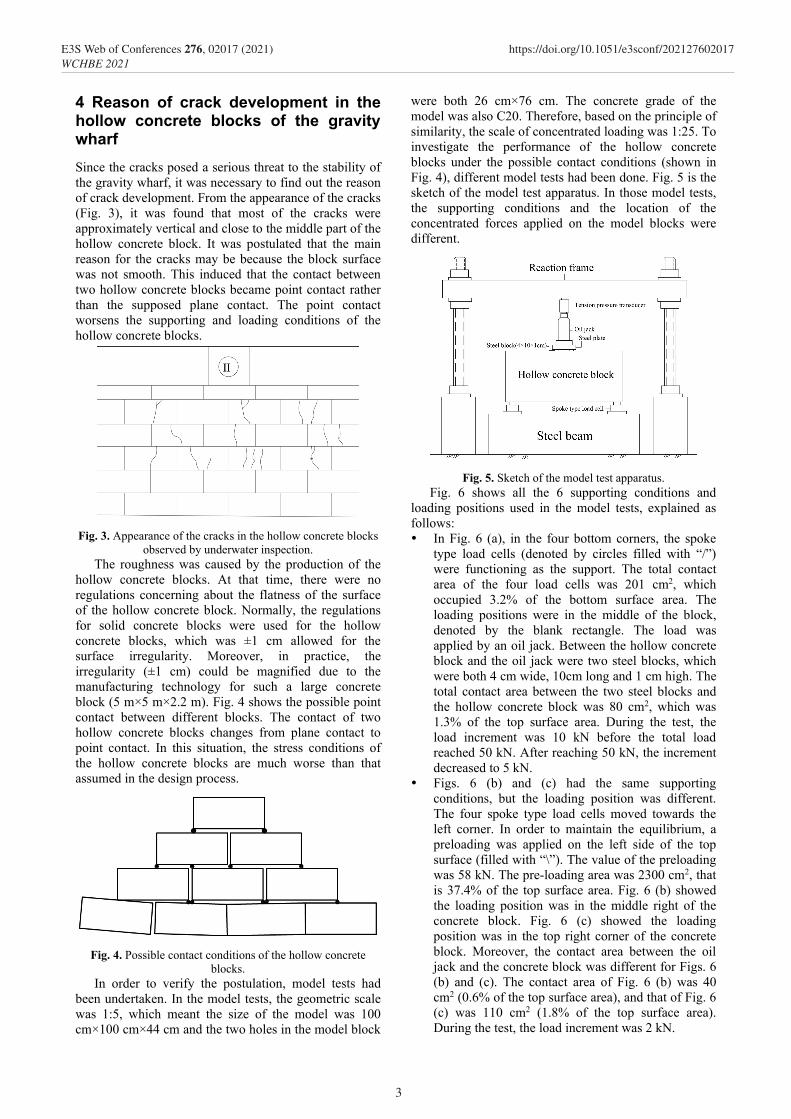
were both 26 cm×76 cm. The concrete grade of the model was also C20. Therefore, based on the principle of similarity, the scale of concentrated loading was 1:25. To investigate the performance of the hollow concrete blocks under the possible contact conditions (shown in Fig. 4), different model tests had been done. Fig. 5 is the sketch of the model test apparatus. In those model tests, the supporting conditions and the location of the concentrated forces applied on the model blocks were different.
Fig. 5. Sketch of the model test apparatus.
Fig. 6 shows all the 6 supporting conditions and loading positions used in the model tests, explained as follows: In Fig. 6 (a), in the four bottom corners, the spoke
type load cells (denoted by circles filled with “/”) were functioning as the support. The total contact area of the four load cells was 201 cm2, which occupied 3.2% of the bottom surface area. The loading positions were in the middle of the block, denoted by the blank rectangle. The load was applied by an oil jack. Between the hollow concrete block and the oil jack were two steel blocks, which were both 4 cm wide, 10cm long and 1 cm high. The total contact area between the two steel blocks and the hollow concrete block was 80 cm2, which was 1.3% of the top surface area. During the test, the load increment was 10 kN before the total load reached 50 kN. After reaching 50 kN, the increment decreased to 5 kN.
Figs. 6 (b) and (c) had the same supporting conditions, but the loading position was different. The four spoke type load cells moved towards the left corner. In order to maintain the equilibrium, a preloading was applied on the left side of the top surface (filled with “\”). The value of the preloading was 58 kN. The pre-loading area was 2300 cm2, that is 37.4% of the top surface area. Fig. 6 (b) showed the loading position was in the middle right of the concrete block. Fig. 6 (c) showed the loading position was in the top right corner of the concrete block. Moreover, the contact area between the oil jack and the concrete block was different for Figs. 6 (b) and (c). The contact area of Fig. 6 (b) was 40 cm2 (0.6% of the top surface area), and that of Fig. 6 (c) was 110 cm2 (1.8% of the top surface area). During the test, the load increment was 2 kN.
3
E3S Web of Conferences 276, 02017 (2021) https://doi.org/10.1051/e3sconf/202127602017WCHBE 2021
Figs. 6 (d), (e) and (f) had the similar supporting conditions. The hollow concrete block was supported at three spots. As can be seen, the main difference between Figs. 6 (d) and (e) was the position of the third spoken load cell. Similar to Figs. 6 (b) and (c), a preloading was applied on the left side of the top surface (filled with “\”). The value of the preloading was 36 kN. The preloading area was 1200 cm2, that is 19.5% of the top surface area. The loading position was in the right corner of the concrete block. In Fig. 6 (f), the difference was that three steel plates were placed between the spoken type load cell and the hollow concrete block, so that the supporting conditions were different. The steel plate was 20 cm long, 20 cm wide and 4 cm high. The total contact area of the three steel plates was 1045.5 cm2, i.e. 17.0% of the bottom surface area. During the test, the load increment was 2 kN.
There were 9 blocks tested in total. For blocks 1, 2 and 3, the conditions of Fig. 6 (a) were used. For blocks 4 and 5, the conditions of Figs. 6 (b) and (c) were used, respectively. For blocks 6 and 7, the conditions of Fig. 6 (d) were used. Lastly, the conditions of Figs. 6 (e) and (f) were used for blocks 8 and 9, respectively.
Fig. 6. Different supporting and loading positions used in the
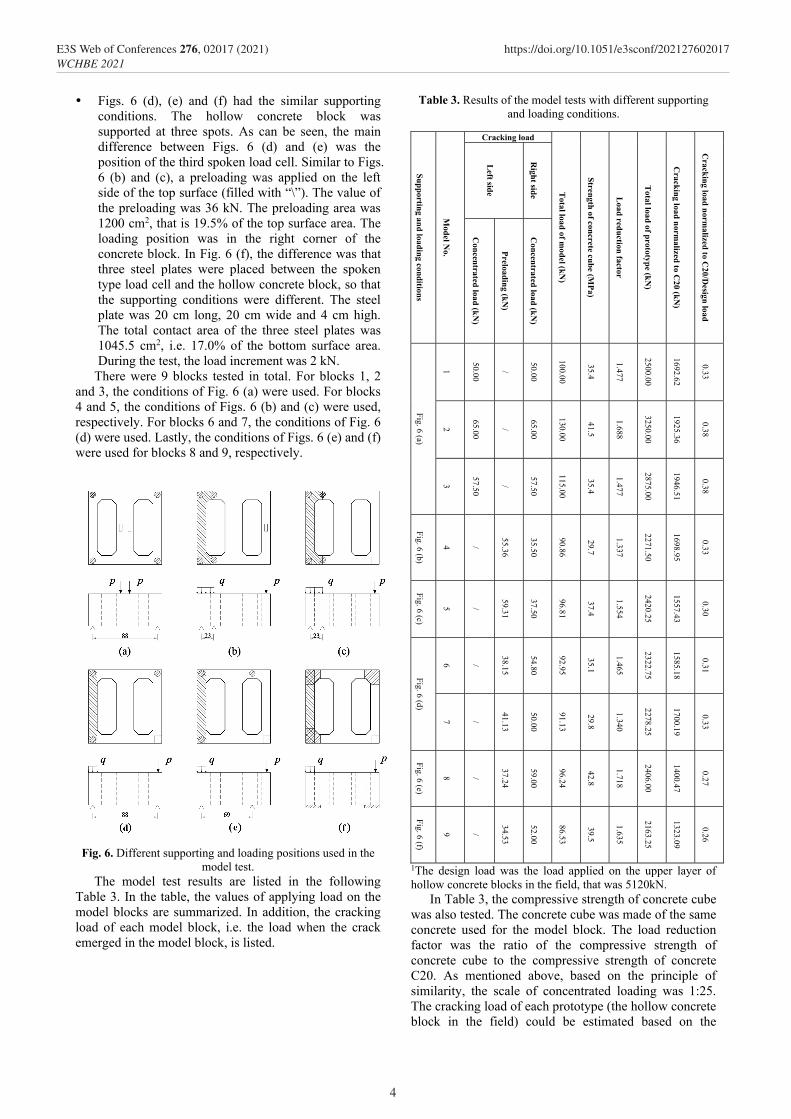
model test. The model test results are listed in the following
Table 3. In the table, the values of applying load on the model blocks are summarized. In addition, the cracking load of each model block, i.e. the load when the crack emerged in the model block, is listed.
Table 3. Results of the model tests with different supporting and loading conditions.
Supporting and loading conditions
Model N
o.
Cracking load
Total load of model (kN
)
Strength of concrete cube (MPa)
Load reduction factor
Total load of prototype (kN)
Cracking load norm
alized to C20 (kN
)
Cracking load norm
alized to C20/D
esign load
Left side
Right side
Concentrated load (kN
)
Preloading (kN)
Concentrated load (kN
)
Fig. 6 (a)
1
50.00
/
50.00
100.00
35.4
1.477
2500.00
1692.62
0.33
2
65.00
/
65.00
130.00
41.5
1.688
3250.00
1925.36
0.38
3
57.50
/
57.50
115.00
35.4
1.477
2875.00
1946.51
0.38
Fig. 6 (b)
4 /
55.36
35.50
90.86
29.7
1.337
2271.50
1698.95
0.33
Fig. 6 (c)
5 /
59.31
37.50
96.81
37.4
1.554
2420.25
1557.43
0.30
Fig. 6 (d)
6 /
38.15
54.80
92.95
35.1
1.465
2322.75
1585.18
0.31
7 /
41.13
50.00
91.13
29.8
1.340
2278.25
1700.19
0.33
Fig. 6 (e)
8 /
37.24
59.00
96.24
42.8
1.718
2406.00
1400.47
0.27
Fig. 6 (f)
9 /
34.53
52.00
86.53
39.5
1.635
2163.25
1323.09
0.26
1The design load was the load applied on the upper layer of hollow concrete blocks in the field, that was 5120kN.
In Table 3, the compressive strength of concrete cube was also tested. The concrete cube was made of the same concrete used for the model block. The load reduction factor was the ratio of the compressive strength of concrete cube to the compressive strength of concrete C20. As mentioned above, based on the principle of similarity, the scale of concentrated loading was 1:25. The cracking load of each prototype (the hollow concrete block in the field) could be estimated based on the
4
E3S Web of Conferences 276, 02017 (2021) https://doi.org/10.1051/e3sconf/202127602017WCHBE 2021
cracking load of the model block. Then, the cracking load of each prototype normalized to concrete C20 could be acquired based on the load reduction factor. In the field, the design load applied on the upper layer of hollow concrete block was 5120 kN. From the column ‘Cracking load normalized to C20/Design load’ of Table 3, it could be concluded that the safety limit of the load applied on the hollow concrete block was much lower than the design value, which was approximately 30% of the design load.
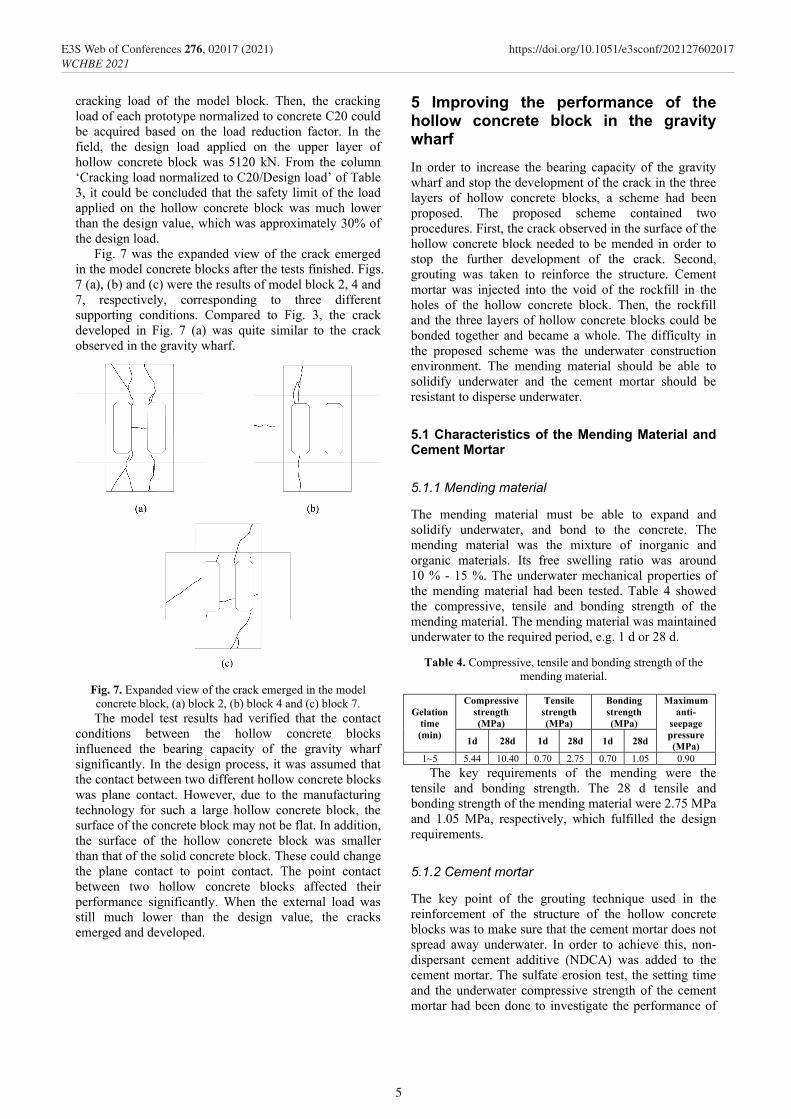
Fig. 7 was the expanded view of the crack emerged in the model concrete blocks after the tests finished. Figs. 7 (a), (b) and (c) were the results of model block 2, 4 and 7, respectively, corresponding to three different supporting conditions. Compared to Fig. 3, the crack developed in Fig. 7 (a) was quite similar to the crack observed in the gravity wharf.
Fig. 7. Expanded view of the crack emerged in the model concrete block, (a) block 2, (b) block 4 and (c) block 7. The model test results had verified that the contact
conditions between the hollow concrete blocks influenced the bearing capacity of the gravity wharf significantly. In the design process, it was assumed that the contact between two different hollow concrete blocks was plane contact. However, due to the manufacturing technology for such a large hollow concrete block, the surface of the concrete block may not be flat. In addition, the surface of the hollow concrete block was smaller than that of the solid concrete block. These could change the plane contact to point contact. The point contact between two hollow concrete blocks affected their performance significantly. When the external load was still much lower than the design value, the cracks emerged and developed.
5 Improving the performance of the hollow concrete block in the gravity wharf In order to increase the bearing capacity of the gravity wharf and stop the development of the crack in the three layers of hollow concrete blocks, a scheme had been proposed. The proposed scheme contained two procedures. First, the crack observed in the surface of the hollow concrete block needed to be mended in order to stop the further development of the crack. Second, grouting was taken to reinforce the structure. Cement mortar was injected into the void of the rockfill in the holes of the hollow concrete block. Then, the rockfill and the three layers of hollow concrete blocks could be bonded together and became a whole. The difficulty in the proposed scheme was the underwater construction environment. The mending material should be able to solidify underwater and the cement mortar should be resistant to disperse underwater.
5.1 Characteristics of the Mending Material and Cement Mortar
5.1.1 Mending material
The mending material must be able to expand and solidify underwater, and bond to the concrete. The mending material was the mixture of inorganic and organic materials. Its free swelling ratio was around 10 % - 15 %. The underwater mechanical properties of the mending material had been tested. Table 4 showed the compressive, tensile and bonding strength of the mending material. The mending material was maintained underwater to the required period, e.g. 1 d or 28 d.
Table 4. Compressive, tensile and bonding strength of the mending material.
Gelation time (min)
Compressive strength (MPa)
Tensile strength (MPa)
Bonding strength (MPa)
Maximum anti-
seepage pressure (MPa) 1d 28d 1d 28d 1d 28d
1~5 5.44 10.40 0.70 2.75 0.70 1.05 0.90 The key requirements of the mending were the
tensile and bonding strength. The 28 d tensile and bonding strength of the mending material were 2.75 MPa and 1.05 MPa, respectively, which fulfilled the design requirements.
5.1.2 Cement mortar
The key point of the grouting technique used in the reinforcement of the structure of the hollow concrete blocks was to make sure that the cement mortar does not spread away underwater. In order to achieve this, non-dispersant cement additive (NDCA) was added to the cement mortar. The sulfate erosion test, the setting time and the underwater compressive strength of the cement mortar had been done to investigate the performance of
5
E3S Web of Conferences 276, 02017 (2021) https://doi.org/10.1051/e3sconf/202127602017WCHBE 2021
the cement mortar with NDCA. The following tables showed the test results.
Table 5. Corrosion resistance coefficient of the cement with and without NDCA.
Cement type Additive Corrosion resistance coefficient
525# ordinary cement / 0.82 NDCA 0.83
425# slag cement / 0.73 NDCA 0.85
Table 6. Setting time of the cement mortar.
Type of cement mortar
Content of additive (%) Setting time
NDCA Compounded additive
Initial set (h: min)
Final set (h: min)
Cement mortar
using 525# ordinary cement
/ / 2: 45 6: 15
1.2 / 7: 30 10: 50
1.2 0.5 1: 05 2: 45
1.2 0.9 0: 45 1: 40
Cement mortar
using 425# slag
cement
/ / 2: 30 5: 45
1.2 / 2: 20 5: 00
Table 7. Underwater and open-air compressive strength of the cement mortar with NDCA.
Environment
Compressive strength Ratio of the open-air strength to the
underwater strength (28 d)
Cement type 7 d 28 d
Open-air / 29.5 72%
425# ordinary cement Underwater / 21.3
Open-air 14.0 23.5 85% 425# slag
cement Underwater 12.5 20.0
Open-air 36.2 45.1 83%
525# ordinary cement Underwater 30.8 37.5
From Table 5, it can be seen that the addition of NDCA had no apparent influence on the durability of the cement mortar. The corrosion resistance coefficient with and without NDCA had no large differences. For slag cement, the corrosion resistance coefficient even increased a bit. It proved that the cement mortar with NDCA could be functional for a long time. Table 6 showed that the addition of the NDCA would increase the setting time of the cement mortar using the ordinary cement. However, by adding the compounded additive into the cement mortar, the setting time would be finally acceptable. Table 7 showed the most important index, i.e. the underwater compressive strength of the cement mortar. The cement mortar with 525# cement had the highest strength. Then, the same cement mortar using 525# cement had been sampled to make a concrete cube, and the open-air compressive strength of the cube was 20.9 MPa (28 d) and 17.8 MPa (28 d). The strength was close to the C20 concrete. The test results demonstrated the necessity of using high grade cement.
5.2 Laboratory Tests of the Effect of the Proposed Scheme
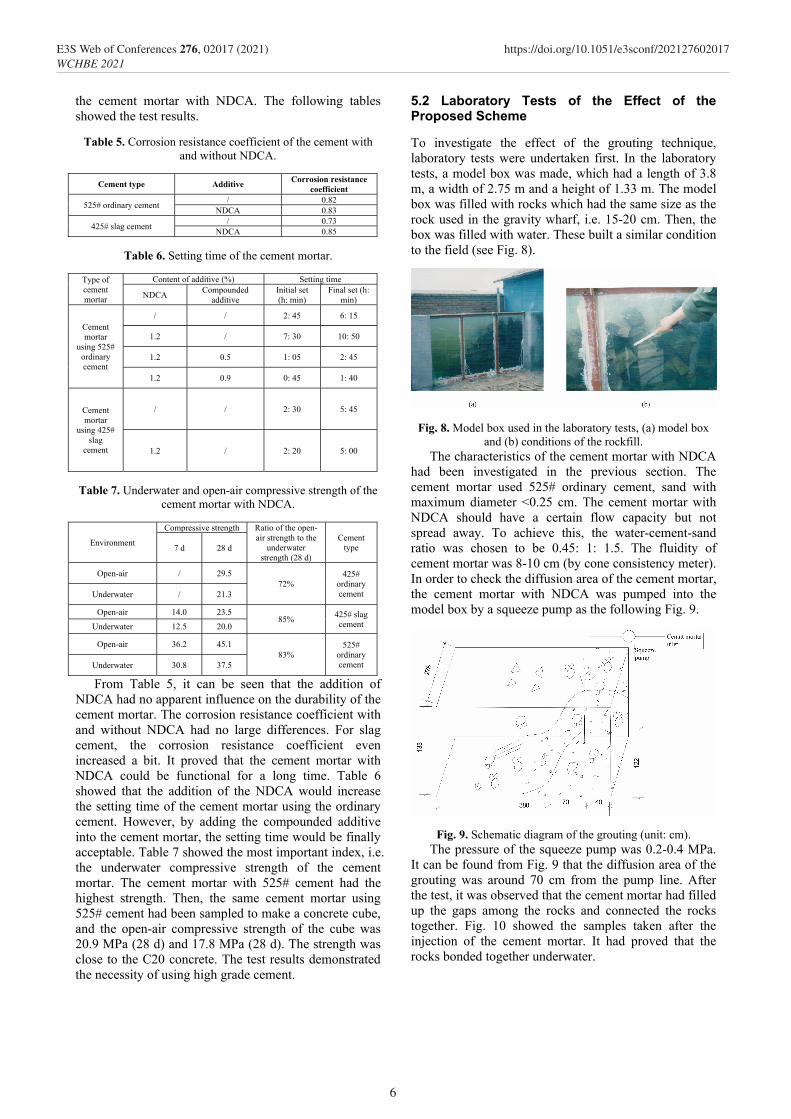
To investigate the effect of the grouting technique, laboratory tests were undertaken first. In the laboratory tests, a model box was made, which had a length of 3.8 m, a width of 2.75 m and a height of 1.33 m. The model box was filled with rocks which had the same size as the rock used in the gravity wharf, i.e. 15-20 cm. Then, the box was filled with water. These built a similar condition to the field (see Fig. 8).
Fig. 8. Model box used in the laboratory tests, (a) model box and (b) conditions of the rockfill.
The characteristics of the cement mortar with NDCA had been investigated in the previous section. The cement mortar used 525# ordinary cement, sand with maximum diameter <0.25 cm. The cement mortar with NDCA should have a certain flow capacity but not spread away. To achieve this, the water-cement-sand ratio was chosen to be 0.45: 1: 1.5. The fluidity of cement mortar was 8-10 cm (by cone consistency meter). In order to check the diffusion area of the cement mortar, the cement mortar with NDCA was pumped into the model box by a squeeze pump as the following Fig. 9.
Fig. 9. Schematic diagram of the grouting (unit: cm).
The pressure of the squeeze pump was 0.2-0.4 MPa. It can be found from Fig. 9 that the diffusion area of the grouting was around 70 cm from the pump line. After the test, it was observed that the cement mortar had filled up the gaps among the rocks and connected the rocks together. Fig. 10 showed the samples taken after the injection of the cement mortar. It had proved that the rocks bonded together underwater.
6
E3S Web of Conferences 276, 02017 (2021) https://doi.org/10.1051/e3sconf/202127602017WCHBE 2021

Fig. 10. Samples taken from the model box.
Later, the effect of the grouting on the reinforcement of the concrete blocks had been studied. The model block 3 used in the model test had been taken and placed on top of two unbroken model blocks (see Fig. 11). The supporting conditions of the model block 3 were the same as Fig. 6 (a).
Then, the proposed scheme was used to fix the model block 3. First, the mending material was used to fill up the cracks. Then, the grouting technique was used to reinforce the whole structure. The setup of the injection of the cement mortar was shown in the following Fig. 12.
After the injection, the structure was cured by water for the first 7 days. Concentrated load was applied to the structure after 10 days and 20 days. The loading position was the same as model block 3 in the model tests, i.e. the middle of the block. In the 10th day, the concentrated load was 200 kN, and there were no new cracks emerged in the upper block. Compared to its previous bearing capacity (115 kN in Table 3), the strength of the model block increased significantly. In the 20th day, the concentrated load increased to 295 kN, three new cracks emerged in the upper block, whereas the old cracks did not develop again, shown in Fig. 13. The test results proved that the bearing capacity of the model block reinforced by the proposed scheme had increased 153%, which was a significant improvement.
5.3 Field Test of the Proposed Scheme
In order to examine the in-situ effect of the proposed scheme, field tests had been done as well. In the gravity wharf, a small area was chosen to conduct the field tests. This area had a span of two hollow concrete blocks. Eight holes were drilled first, four of them were for the grouting and the other four were for inspection (Fig. 14). The diameter of the drill holes was 9-12 cm, and the depth of each drill hole was 12 m. The proposed scheme was used in the field to reinforce the hollow concrete blocks. In the inspection hole, DR-501 nuclear density gauge (produced in the U.S.) was utilized to measure the density of the rockfill before and after the injection of the cement mortar.
The comparison of the density of the rockfill before and after the grouting was shown in Fig. 15. The density of the rockfill after the injection of the cement mortar increased compared to the density before the grouting.
Moreover, the increasement in the lower layer of the hollow concrete block was generally the largest.
Fig. 11. Model blocks placement for the laboratory test (unit:
cm).
Fig. 12. Injection of the cement mortar into the rockfill of the
model block.
Fig. 13. New cracks emerged in the upper block.
Half a year later, two samples were taken from the wharf. One was taken from 5.5 m deep to the ground, the other one was from 8.5 deep, shown in Fig. 16. It can be observed from the appearance of the samples, the cement mortar bonded to the rocks tightly. The two samples were shaped to conduct tests of compressive strength. The size of them were 12.8×10 cm and 10.8×7.5 cm. The results were 43.9 MPa and 20.4 MPa, respectively.
7
E3S Web of Conferences 276, 02017 (2021) https://doi.org/10.1051/e3sconf/202127602017WCHBE 2021
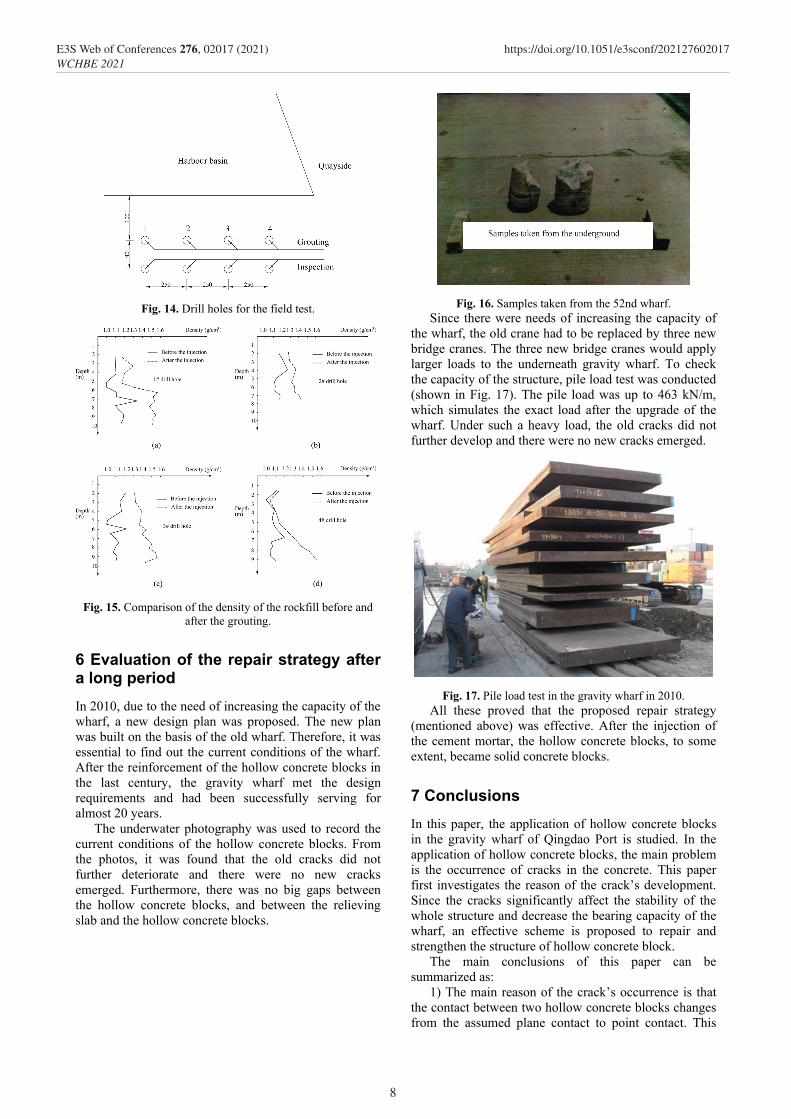
Fig. 14. Drill holes for the field test.
Fig. 15. Comparison of the density of the rockfill before and
after the grouting.
6 Evaluation of the repair strategy after a long period In 2010, due to the need of increasing the capacity of the wharf, a new design plan was proposed. The new plan was built on the basis of the old wharf. Therefore, it was essential to find out the current conditions of the wharf. After the reinforcement of the hollow concrete blocks in the last century, the gravity wharf met the design requirements and had been successfully serving for almost 20 years.
The underwater photography was used to record the current conditions of the hollow concrete blocks. From the photos, it was found that the old cracks did not further deteriorate and there were no new cracks emerged. Furthermore, there was no big gaps between the hollow concrete blocks, and between the relieving slab and the hollow concrete blocks.
Fig. 16. Samples taken from the 52nd wharf.
Since there were needs of increasing the capacity of the wharf, the old crane had to be replaced by three new bridge cranes. The three new bridge cranes would apply larger loads to the underneath gravity wharf. To check the capacity of the structure, pile load test was conducted (shown in Fig. 17). The pile load was up to 463 kN/m, which simulates the exact load after the upgrade of the wharf. Under such a heavy load, the old cracks did not further develop and there were no new cracks emerged.
Fig. 17. Pile load test in the gravity wharf in 2010.
All these proved that the proposed repair strategy (mentioned above) was effective. After the injection of the cement mortar, the hollow concrete blocks, to some extent, became solid concrete blocks.
7 Conclusions In this paper, the application of hollow concrete blocks in the gravity wharf of Qingdao Port is studied. In the application of hollow concrete blocks, the main problem is the occurrence of cracks in the concrete. This paper first investigates the reason of the crack’s development. Since the cracks significantly affect the stability of the whole structure and decrease the bearing capacity of the wharf, an effective scheme is proposed to repair and strengthen the structure of hollow concrete block.
The main conclusions of this paper can be summarized as:
1) The main reason of the crack’s occurrence is that the contact between two hollow concrete blocks changes from the assumed plane contact to point contact. This
8
E3S Web of Conferences 276, 02017 (2021) https://doi.org/10.1051/e3sconf/202127602017WCHBE 2021

change induces the deterioration of the supporting and loading conditions of the hollow concrete blocks.
2) The proposed scheme is useful in repairing the cracks and strengthening the structure of hollow concrete blocks underwater. The invented mending material can solidify and expand underwater. Moreover, the grouting technique is able to fill up the gaps between rocks and make the hollow concrete blocks and the rockfill a whole. The key point of the grouting is that the cement mortar has sufficient compressive strength and a certain flow capacity but not spread away underwater. In order to achieve this, the cement is chosen to be 525# ordinary cement, and the diameter of sand is not larger than 0.25 cm. The water-cement-sand ratio was chosen to be 0.45: 1: 1.5.
3) Through laboratory model tests, the bearing capacity of the block with cracks can increase significantly after the injection of the cement mortar. The samples taken from the laboratory model tests and field tests in 1980s prove that the rocks bonded together after the injection of the cement mortar. The pile load tests in 2010, which is 20 years later, further proves that the proposed scheme is useful in strengthening the structure of hollow concrete blocks.
This paper finds out the reason of cracks emerged in the hollow concrete blocks and proposes a useful, easy-to-implement method to deal with the problems occurred in the application of hollow concrete blocks in the gravity wharf. It provides reference for the construction of similar works.
References 1. Q. Dong, T. Tang, Z.B. Wei., Analysis on the
security threat of caisson gravity wharf. International Conference on Materials Science 123, 500-505 (2017)
2. G.S.P. Madabhushi, J.I. Boksmati, S.G. Torres, Modelling the behaviour of large gravity wharf structure under the effects of earthquake-induced liquefaction. Coastal Engineering 147, 107-114 (2019)
3. G.S.P. Madabhushi, J.I. Boksmati, S.G. Torres, Numerical and centrifuge modeling of gravity wharf structures subjected to seismic loading. Journal of Waterway, Port, Coastal, and Ocean Engineering 146(4), 04020007 (2020)
4. A.D. Nguyen, Y.S. Kim, G.O. Kang, H.J. Kim, Numerical analysis of static behavior of caisson-type quay wall deepened by grouting rubble-mound. International Journal of Geo-Engineering 12(1), 1-16 (2021)
5. J.G. De Gijt, A history of quay walls: techniques, types, costs and future. Delft University of Technology, The Netherlands (2010)
6. S. Han, J. Gong,; Y. Zhang, Seismic rotational displacements of gravity quay walls considering excess pore pressure in backfill soils. Journal of Earthquake Engineering 21(5-6), 985-1009 (2016)
7. J. Zhang, B. Li, Study on stability analysis of gravity wharf structure in Fujian. E3S Web of Conferences 136, 04082 (2019)
8. H. Karakuş, New seismic design approaches for block type quay walls. Middle East Technical University, Turkey (2007)
9. P. Buring, Flexible Quay Wall Structures for Container Vessels. Delft University of Technology, the Netherlands (2013)
10. A. Ghalandarzadeh, S. Rahimi, A. Kavand, Dynamic pore water pressure of submerged backfill on caisson quay walls: 1 g shake table tests. Soil Dynamics and Earthquake Engineering 132 (2020)
11. Z. Xiao, Y.M. Lu, Y.Z. Wang, Y.H. Tian, Y.B. Zhao, D.F. Fu, D.H. Zhang, Investigation into the influence of caisson installation process on its capacities in clay. Applied Ocean research 104, 102370 (2020)
12. M. Alexander, Marine Concrete Structures: design, durability and performance. Woodhead Publishing: Sawston, Cambridge, UK (2016)
13. H.T. Öztürk, T. Dede, E. Türker, Optimum design of reinforced concrete counterfort retaining walls using TLBO, Jaya algorithm. Structures 25, 285-296. (2020)
14. G. Tsinker, Handbook of port and harbors engineering: geotechnical and structural aspects. Springer-Science+Business Media, B.V., New York, (1997)
15. A.M. Green, Geometric Optimisation of Earth Retaining Quay Walls for the Marine Environment through the use of Ground Anchors. Stellenbosch University, South Africa (2018)
16. F. Moradi-Marani, M. Shekarchi, A. Dousti, B. Mobasher, Investigation of corrosion damage and repair system in a concrete jetty structure. Journal of Performance of Constructed Facilities 24(4), 294-301 (2010)
17. H. Sarhan, R. Fatemeh, Design of Concrete Gravity Quay Walls - British Standards vs. Eurocode. International Petroleum Exhibition & Conference, Abu Dhabi, UAE, SPE-183334-MS (2016)
18. K. Pitilakis, A. Moutsakis, Seismic analysis and behaviour of gravity retaining walls: the case of kalamata harbour quay wall. Soils and Foundations 29(1), 1-17 (1989)
19. P. Madanipour, M. Dehghanirenani, H. Zafarani, Parametric study of the behavior of concrete block quay walls, considering near-field records, the case of Pars petrochemical port. World Congress on Advances in Structural Engineering and Mechanics (ASEM3), Jeju, Korea, 1131-1145 (2013)
20. S. Francois, L. Lesage, H. Verbraken, M. Schevenels, Optimal design of block quay walls. Frontiers in Built Environment 6, 75 (2020)
9
E3S Web of Conferences 276, 02017 (2021) https://doi.org/10.1051/e3sconf/202127602017WCHBE 2021