Alan J. Drake 1 , Xiaobin Yuan 2 , Pawel Owczarczyk 2 , Marshall Tiner 2
Upload
harry-hudsonCategory
view
225download
0
Dependence of SMOS/MIRAS brightness temperatures on wind speed and foam model
Xiaobin Yin, Jacqueline Boutin
LOCEAN & ARGANS

Introduction
Martin et al. JGR, 2014
• CAROLS flights => slightly lower wind influence than model 1 at high WS
• Comparison with other ESL empirical models also suggest overestimate of model 1 at high WS
• In model 1 previous development we empirically derive foam coverage from SMOS Tbs assuming Stogryn 1972 empirical foam emissivity model (fn of frequency and incidence angle). Since that model was developped for freq>13GHz, we review the SMOS foam model 1 (emissivity+coverage)
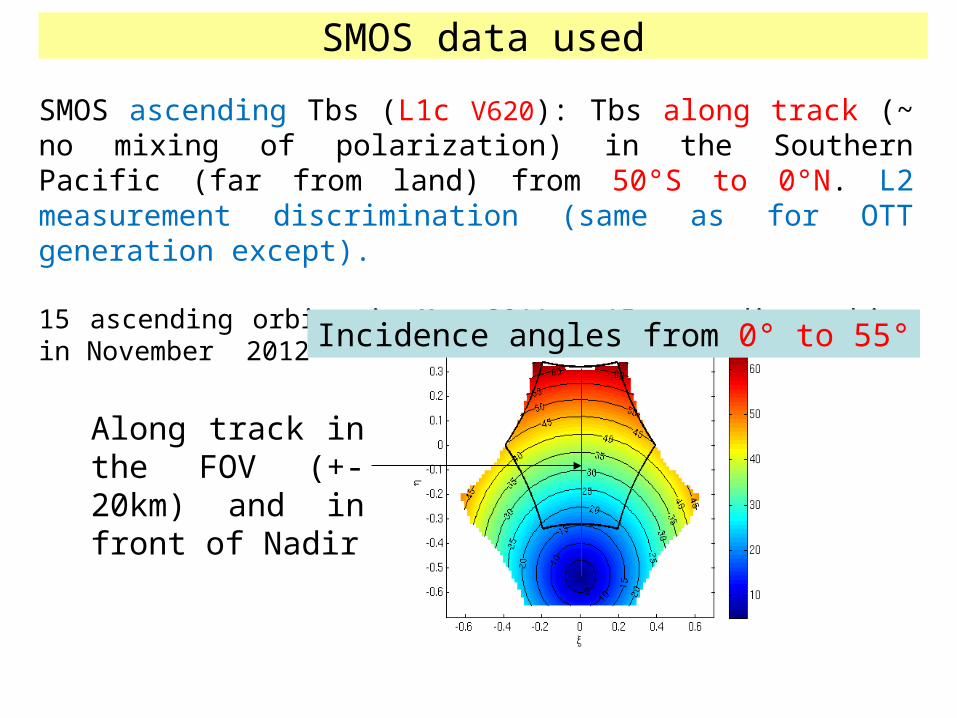
Along track in the FOV (+-20km) and in front of Nadir
SMOS ascending Tbs (L1c V620): Tbs along track (~ no mixing of polarization) in the Southern Pacific (far from land) from 50°S to 0°N. L2 measurement discrimination (same as for OTT generation except).
15 ascending orbits in May 2011 + 15 ascending orbits in November 2012
SMOS data used
Incidence angles from 0° to 55°

Modeling of SMOS Tbs• Tb = Tbatm↑ + Rsea (Tbatm↓ + Tbsky) exp(-atm) + Tbsea exp(-atm)
Ocean
Atmosphere
Tbsea= (Tbflat+Tbrough) (1-F) + F Tbfoam
=Tbflat+Tbwind
Tbwind derived from SMOS Tbs after correcting for all other effects
Tbsea=esea SST
esea =eflat + ewind
Rsea =1- esea
Wind induced components from the SMOS TB

Data fitting
Wind induced component of emissivity deduced
(0-55° in step of 5°)
Tbwind=(1-F)Tbrough + F(Tbfoam-Tbflat)
100.225log ( /2)23 *
0*
1.25( )
kku
S k a kg
3m/s<U<7m/sa0 (prior=0.004 – 0.008)
8m/s<U<22m/sCoverage F(U) &
emissivity efoam(U)
a0 =0.005 (same as Yin et al., 2012)
Spectrum(proportional to Durden and Vesecky wave spectrum)
Foam
Thickness(U)

ef = mUefU + mDefD + mw Foam emissivity upward e downward e reflected transmitted water e
Microwave emissivity of sea foam layers with vertically inhomogeneous dielectric properties
Air
Foam
Sea water
Thickness
Ulaby et al., 1981, 2013,
Anguelova and Gaiser, 2013
Void fraction

Dependence of foam emissivity on foam layer thickness Z for different frequencies
Thickness is a key point for the foam emissivity at L band (it varies from 0.35 to close to 1 with thickness varying from 0.01cm to 2cm) In the following, we assume ‘effective’ foam thickness = fn(U)

L band foam thickness, foam coverage & Void Fraction derived from SMOS multi-angular TBs using a Levenberg & Marquardt
minimisation scheme
Thickness(U)
(‘effective’)
Foam coverage(U)
Fitted Void Fraction (percentage of air in a bubble) at the air-foam interface is always around 98%.

Foam emissivity VS wind speed (thickness)
Foam emissivity (different U) VS incidence angle

Tbwind VS wind speed
Much better fit to SMOS Tbs at high U and much closer to Guimbard et al. 2012 fit...except at 55°Vpol ? What happens at 55° V-pol? Latitudinal drift? Permittivity?

No latitudinal drift in Thwind at 7m/s1K latitudinal drift from 50S to 0 in Tvwind at 7m/s at 55 incidence angles
HPOL VPOL
?
Latitudinal profiles of Tbwind at 7m/sTbwind averaged over 1° latitudinal bin

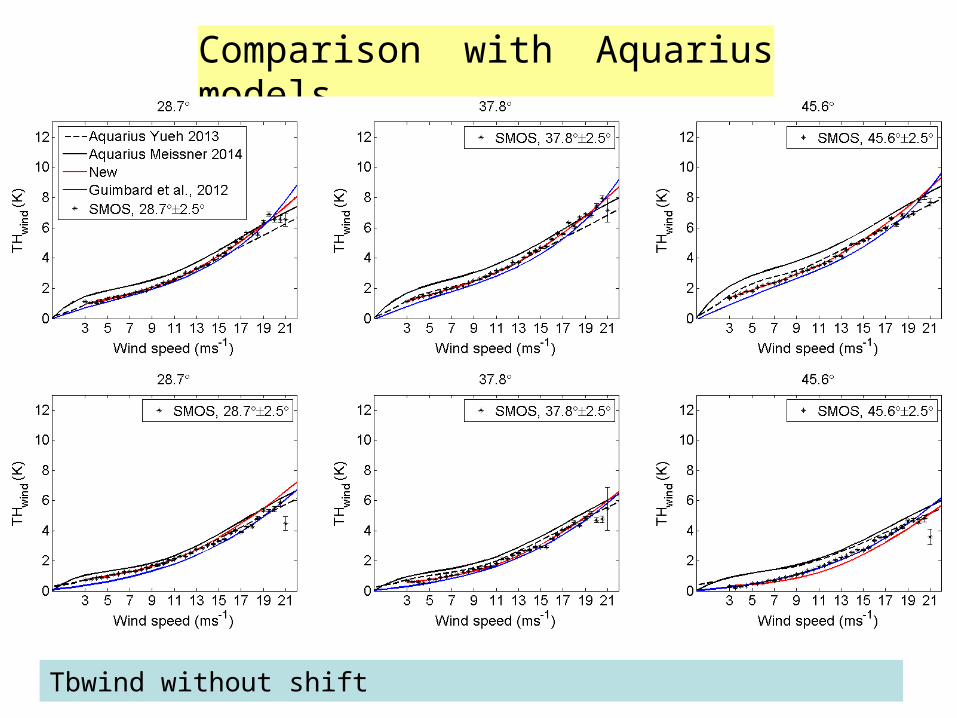
Comparison with AQUARIUS models
Tbwind from SMOS is higher than Tbwind from Aquarius. Different WS used (Aquarius team uses SSMI, NCEP & WINDSAT)

Yin et al., RSE, 2013

Conclusions and Perspectives
1) Foam thickness is one key point for the foam emissivity at L band, which varies from 0.35 to close to 1 with thickness varying from ~1mm (U~7m/s) to > 2cm.
2) A much better agreement with SMOS data is obtained when introducing a foam emissivity as a function of wind speed (foam ‘effective’ thickness). But still disagreement at 55°V-pol ???
3) SMOS Tbwind is different to Aquarius Tbwind at wind speed above 15m/s (likely an effect of differences between ECWMF and SSMIS at high WS)
4) A larger set of V6 SMOS L1c TB will be used for validating and/or improving model.

Tbwind VS wind speed
Comparison with Aquarius models
Tbwind without shift