
Dem&sup(1)
40
Fall ‘ 97 Principles of Microeconomics slide 1 This is a PowerPoint presentation on elementary supply and demand. A left mouse click or the enter key will add and element to a slide or move you to the next slide. The back space key will take you back an element or slide. If you wish to exit the presentation, the escape key will do it! R. Larry Reynolds 1997
Transcript of Dem&sup(1)

Fall ‘ 97 Principles of Microeconomics
slide 1
This is a PowerPoint presentation on elementary supply and demand. A left mouse click or the enter key will add and element to a slide or move you to the next slide. The back space key will take you back an element or slide. If you wish to exit the presentation, the escape key will do it!
R. Larry Reynolds 1997

Fall ‘ 97 Principles of Microeconomics
slide 2
Demand and Supply· Markets as allocative mechanism require:
· nonattenuated property rights [exclusive, enforceable, transferable]
· “voluntary” transactions· Markets include all “potential buyers and
sellers”· behavior of buyers is represented by “demand”
[benefits side of model]
· behavior of sellers is represented by “supply” [cost side of model]

Fall ‘ 97 Principles of Microeconomics
slide 3
Markets, Supply and Demand
· markets include all potential buyers and sellers· geographic boundaries of market· markets defined by nature of product
and characteristics of buyers· conditions of entry into market· markets, competition and substitutes

Fall ‘ 97 Principles of Microeconomics
slide 4
Demand· Definition: “A schedule of the quantities
of a good that buyers are willing and able to purchase at each possible price during a period of time, ceteris paribus. [all other things held constant]”
· Demand can also be perceived as a schedule of the maximum prices buyers are willing and able to pay for each unit of a good.

Fall ‘ 97 Principles of Microeconomics
slide 5
Demand Function· Is the functional relationship between the
price of the good and the quantity of that good purchased in a given time period [UT], income, other prices and preferences being held constant.
· A change in income, prices of other goods or preferences will alter [‘shift’] the demand function.

Fall ‘ 97 Principles of Microeconomics
slide 6
Quantity demanded· A change in the price of the good under
consideration will change the “quantity demanded.”
· Q = f (P, holding M, Pr , preferences constant); where: M = income
Pr = prices of related goods • ∆P causes a change in X [∆Q], this is a “change in
quantity demanded”

Fall ‘ 97 Principles of Microeconomics
slide 7
Change in demand· If M, Pr, or preferences change, the demand
function [relationship between P and Q] will change.
· These are sometimes called “demand shifters”· Be sure to understand difference between a
“change in demand” and a “change in quantity demanded”· change in demand --- shift of the function· change in quantity demanded --- move on the function

Fall ‘ 97 Principles of Microeconomics
slide 8
“Law of Demand”
· Theory and empirical evidence suggest that the relationship between Price and Quantity is an inverse or negative relationship
· At higher prices, quantity purchased is smaller, or at lower prices the quantity purchased is greater.

Fall ‘ 97 Principles of Microeconomics
slide 9
An example of hot chocolate:There is a coffee cart in the building that primarily serves the individuals who work in the building. The market is defined to some extent by the geography of the building. Individuals who buy the hot chocolate rarely come from other buildings to purchase a cup. During the time period [UT]under consideration [8:00-9:00am on a week day ] the incomes and preferences of buyers are unlikely to change. The prices of coffee, lattes, etc. can be controlled by the vendor and the price of soft drinks from the machines remains constant. The number of workers in the building remain at a constant level.
Under these circumstances, we observe the number of cups of hot chocolate [H] sold each morning as the price [P] is changed. From these observations the demand relationship is estimated.

Fall ‘ 97 Principles of Microeconomics
slide 10
Cups of Hot Chocolate [H] purchased
each day between 8 -9 am
price per cup
cups
purchased
A 0 20 .
B $ . 5 0 15 .
C $ . 7 5 12 . 5
D $ 1 . 0 0 10 .
E $ 1 . 2 5 7 . 5
F $ 1 . 5 0 5 .
G $ 1 . 7 5 2 . 5
H $ 2 . 0 0 0
The demand relationship can be demonstrated as atable:
Demand is a schedule ofquantities that will be purchased at a schedule
of prices during a given time period, cet. par.As the price is increased,the quantity purchased decreases.
∆Q < 0[-7.5]
∆P > 0[+.75]
This demand relationship can be expressed as an equation:P = 2 - .1Q or Q = 20 - 10P: [Q = f (P, . . .) but we graph P onthe Y axis and Q on the X axis.]

Fall ‘ 97 Principles of Microeconomics
slide 11
The demand relationship can be expressed as a table(previous slide) or an equation [either P = 2 - .1Q or Q = 20 - 10P]
The data from the table or equation can be graphed:
QUANTITY{CUPS/UT}
PRIC
E
2 4 6 8 10 12 14 16 18 20 22 24
.25
.50
.75
1.001.251.50
1.75 2.00 2.25
$
.....
.
Demand
P = $2, Then Q = 0 P = $1.75, then Q = 2.5
P = $1.50, then Q = 5P = $1.25, Q = 7.5
P = $1, then Q = 10P = 0, then Q = 20
The demand function can be represented as a table, an equation or a graph.

Fall ‘ 97 Principles of Microeconomics
slide 12
QUANTITY
{CUPS/ UT}
PRIC
E
2 4 6 8 10 12 14 16 18 20 22 24
.25
.50
.75
1.001.251.50
1.75 2.00 2.25
The demand equation P = 2 - .1Q was graphed
Demand [P = 2 - .1Q]
A change in “quantity demanded” is a movement on the demand function caused by a change in the independent variable [ price].
∆P from $1.50 to $1 causes ∆Q from 5 to 10 units
5
..A
Β
A change in quantity demanded is a move from point A to B “on the demand function”
caused by a change in the price!
Fall ‘ 97 Principles of Microeconomics
slide 13
QUANTITY{CUPS/UT}
PRIC
E
2 4 6 8 10 12 14 16 18 20 22 24
.25
.50
.75
1.001.251.50
1.75 2.00 2.25
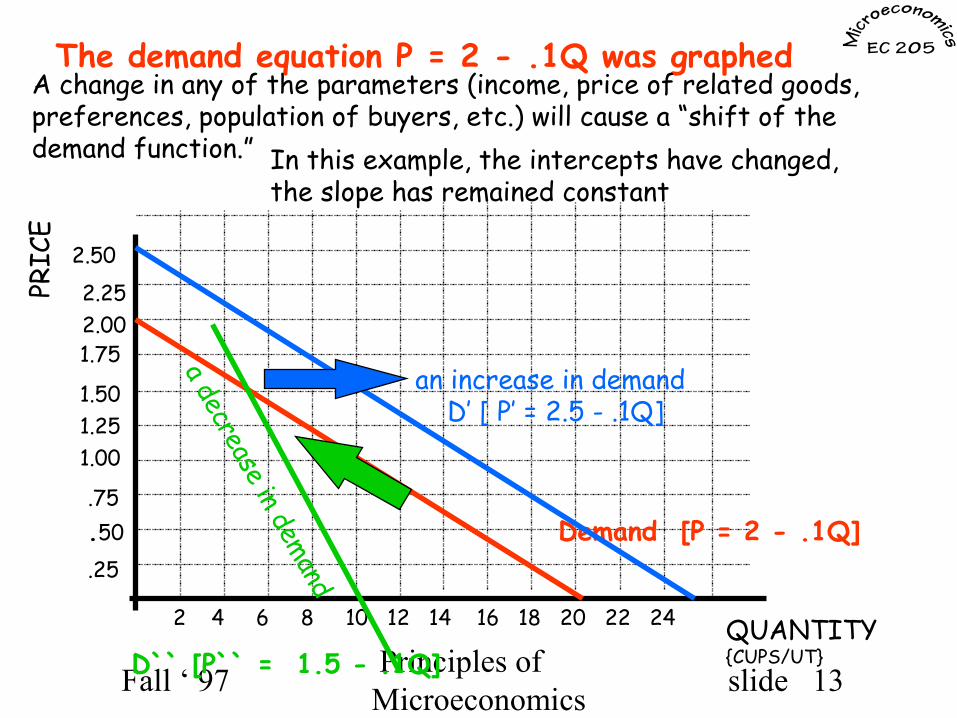
The demand equation P = 2 - .1Q was graphed
Demand [P = 2 - .1Q]
A change in any of the parameters (income, price of related goods,preferences, population of buyers, etc.) will cause a “shift of the demand function.”
2.50
an increase in demand D’ [ P’ = 2.5 - .1Q]
In this example, the intercepts have changed,the slope has remained constant
a decrease in demandD`` [P`` = 1.5 - .1Q]

Fall ‘ 97 Principles of Microeconomics
slide 14
QUANTITY{CUPS/UT}
PRIC
E
2 4 6 8 10 12 14 16 18 20 22 24
.25
.50
.75
1.001.251.50
1.75 2.00 2.25
2.50
Demand [P = 2 - .1Q]
A change in the parameters [income, Pr, preferences, population, etc.] might alter the relationship by changing the slope
an increase in the slope P = 2 - .25Q
buyersare lessresponsiveto ∆P
a decrease in the slope
P` = 2- .048076923Q
buyers are more responsive to ∆P
A change in demand refers to a movement or shift of the entire demand function

Fall ‘ 97 Principles of Microeconomics
slide 15
Demand [P = 2 - .1Q]
An increase in demand
QUANTITY{CUPS/UT}
PRIC
E
2 4 6 8 10 12 14 16 18 20 22 24
.25
.50
.75
1.001.251.50
1.75 2.00 2.25
2.50
D2 [an increase in demand]
increase
results in a larger quantity beingpurchased at each price
Q = 7.5
In this case, an increase in demand resultsin an increase in the amount that will be purchased at a price of $1.25. At this price the Quantity purchased increases from 7.5to 18. An increase in demand!

Fall ‘ 97 Principles of Microeconomics
slide 16
QUANTITY[steak /UT]
PRIC
E
2 4 6 8 10 12 14 16 18 20 22 24
.25
.50
.75
1.001.251.50
1.75 2.00 2.25
2.50
Demand [P = 2 - .1Q]
Effect of a change in the price of a substitute
If the price of a substitute, like chicken, increasesbuyers will buy more steak at each price of steak
Demand for steak increases when
the price of chicken increases
If the price of chicken decreases, the buyers will want less steak at each possible price of steak; the demand for steak decreases!
D2
a decrease
in the demand
for steak

Fall ‘ 97 Principles of Microeconomics
slide 17
Complementary goodsTwo goods may be complimentary, i.e. the two goods are “used together. [tennis rackets and tennis balls or CD’s and CD Players]An increase in the price of CD’s will tend to reduce the demand [shift the demand function to the left] for CD Players
CD’s/UT
PCD’s
Dcd
CD Playersper UT
Pplayers
Dplayer
P2
P1
Y1Y
As the price of CD’s increases from P1 to P2, the quantity of CD’s decreases from Y1
to Y.
As people buy fewerCD’s, the demand forCD players decreases.
D’player
At the same price, Ppl , the demand
is reducedfrom Dto D’.
X1X
Ppl

Fall ‘ 97 Principles of Microeconomics
slide 18
Compliments and Substitutes
· Substitutes:· if the price of a substitute increases, the
demand for the good increases.· if the price of a substitute decreases, the
demand for the good decreases.· Compliments:
· if the price of a compliment increases, the demand for the good decreases.
· if the price of a compliment decreases, the demand for the good increases.

Fall ‘ 97 Principles of Microeconomics
slide 19
Demand Summary· “Law of Demand” holds that usually as the
price of a good increases, individuals will buy less of it.
· The nature of this relationship is influenced by a variety of other variables;· income, preferences, prices of related
goods, and other circumstances· as these circumstances change, the
demand relationship changes or “shifts.”

Fall ‘ 97 Principles of Microeconomics
slide 20
Demand Summary [cont. . . ]
· A “change in demand” means the relationship between price and quantity was altered by a change in some other variable [a demand “shifter”] The demand “shifts.”
· A “change in quantity demanded” is a change in the quantity bought that was caused by a change in the price of the good. There is a movement on the demand function.

Fall ‘ 97 Principles of Microeconomics
slide 21
Supply· Supply is defined as a schedule of
quantities of a good that will be produced and offered for sale at a schedule of prices during a given time [UT], ceteris paribus.
· Generally, producers are willing to offer greater quantities of a good for sale at higher prices; a positive relationship between price and quantity supplied.

Fall ‘ 97 Principles of Microeconomics
slide 22
Supply Schedule
Observation Price QuantitySupplied
A $1 6
B $2 10
C $3 14
D $4 18
E
F $5 22
Q
P
2 4 6 8 10 12 14
$1
$2
$3
$4$5
A supply schedule can be displayed as a table.
The information can be representedon a graph by plotting each price quantity combination.
. . . .supply
Both the graph and the tablerepresent a supply relationship: Q = 2 + 4P

Fall ‘ 97 Principles of Microeconomics
slide 23
Change in Quantity Supplied
· A change in the price of the good causes a change in the “quantity supplied.”
· The change in the price of the good causes a “movement on the supply function,” not a change or “shift of the supply function.”

Fall ‘ 97 Principles of Microeconomics
slide 24
Supply Schedule
Observation Price QuantitySupplied
A $1 6
B $2 10
C $3 14
D $4 18
E
F $5 22
supply
Q/ut
P
$1
$2
$3
$4
$5
2 4 6 8 10 12 14 16
A change in the price “causes” achange in the “quantity supplied.”This can be represented by a “movement” on the supply function in the graph
∆P from $1 to $3
∆P “causes” the quantity suppliedto increase from 6 to 14.
∆P$1
$3“CAUSES” ∆Q
This is a change in “quantitysupplied.” Not to beconfused with a “change insupply!”

Fall ‘ 97 Principles of Microeconomics
slide 25
“Change in Supply”· A change in supply [like a change in demand]
refers to a change in the relationship between the price and quantity supplied.
· A change in supply is “caused” by a change in any variable, other than price, that influences supply
· A change in supply can be represented by a shift of the supply function on a graph

Fall ‘ 97 Principles of Microeconomics
slide 26
“Change in Supply” [cont. . . ]
· There are many factors that infuence the willingness of producers to supply a good.· technology· prices of inputs· returns in alternative choices· taxes, expectations, weather, number of
sellers, . . .· Qs = fs (P, Pinputs, technology, . . .)

Fall ‘ 97 Principles of Microeconomics
slide 27
“Change in Supply” [cont. . . ]
· Qs = fs (P, Pinputs, technology, number of sellers, taxes, . . .)
· A change in the price [P] causes a “change in quantity supplied;”
· a change in any other variable causes a “change in supply”

Fall ‘ 97 Principles of Microeconomics
slide 28
Supply Schedule
Observation Price QuantitySupplied
A $1 6
B $2 10
C $3 14
D $4 18
E
F $5 22
Q
P
$1
$2
$3
$4
$5
2 4 6 8 10 12 14 16
Given the supply schedule,
supply
An increase in the pricesof inputs would make itmore expensive to produceeach unit of output, therefore, the supply decreases
481216
20
The decreased quantityat each price “shifts” thesupply curve to the left!
new
supp
ly fu
nctio
n a shift to the leftis a decrease in supply
The development of a “new”technology that reduces thecost of production will “shift”the supply function to the right
an in
crea
se in
su
pply

Fall ‘ 97 Principles of Microeconomics
slide 29
Equilibrium
· Equilibrium: 1. a state of rest or balance due to the equal action of opposing forces. 2. equal balance between any powers, influences, [Webster’s Encyclopedic Unabridged Dictionary of the English Language]
· In a market an equilibrium is said to exist when the forces of supply [sellers] and demand [buyers] are in balance: the actions of sellers and buyers are coordinated. The quantity supplied equals the quantity demanded!

Fall ‘ 97 Principles of Microeconomics
slide 30
10 20 30 40 50 60 70 80 90 100 110 120 130
10
20304050
60
708090
100Px
[Pr
ice]
Qx/ UT
Given a demandfunction [whichrepresents thebehavior or choicesof buyers,
Demandand a supply functionthat represents the
behavior of sellers,
Supp
lyWhere the quantity that people want to buy is equal to the quantity that the producers want to sell, there is an equilibrium quantity.
60
The price that coordinates the preferences of the buyers and sellersis the equilibrium price.
$70
At the equilibrium price of $70, the quantity supplied is equal tothe quantity demanded.

Fall ‘ 97 Principles of Microeconomics
slide 31
10 20
30 40
50 60
70 80
90 100 1
10 120 1
30
2030
4050
6070
8090
100
Px
[Pric
e]
Qx/ UT
DemandSu
pply
When the price is greater than the equilibrium price, the amount that sellers want to sell at that price [quantity supplied] exceeds the amount that buyers are willing to purchase [quantitydemanded] at that price. The price is “too high.”
60
$70
equi
libri
um p
rice
equilibrium quantity
At a Price of $90 the quantity supplied is 80,
$90
80
the quantity demanded is 35
35
At $90 there is a surplusof 45 units [80-35=45]
surplus = 45

Fall ‘ 97 Principles of Microeconomics
slide 32
10 20
30 40
50 60
70 80 9
0 100 1
10 120 1
30
1020
3040
5060
7080
9010
0
Px
[Price
]
Qx/ UT
DemandSu
pply
60
$70
$90
8035
At a price of $90 a surplusof 45 units exists
surplus = 45
Suppliers have more to sell than buyers will purchase at a price of $90.
To get rid of these unsold units [inventory], the
sellers lower the price.
lower price
As the price of the good is reduced, the quantity supplied decreases.
Quantitysupplieddecreases
The quantity demanded increases as the price falls.
Quantitydemandedincreases
As the price moves toward equilibrium, quantity supplied and quantity demanded are brought into equilibrium.
.
.
Fall ‘ 97 Principles of Microeconomics
slide 33
10 20 30 40 50 60 70 80 90 100 110 120 130
10
20304050
60
708090
100Px
[ P
r ice
]
Qx/ UT
Demand
Supp
ly
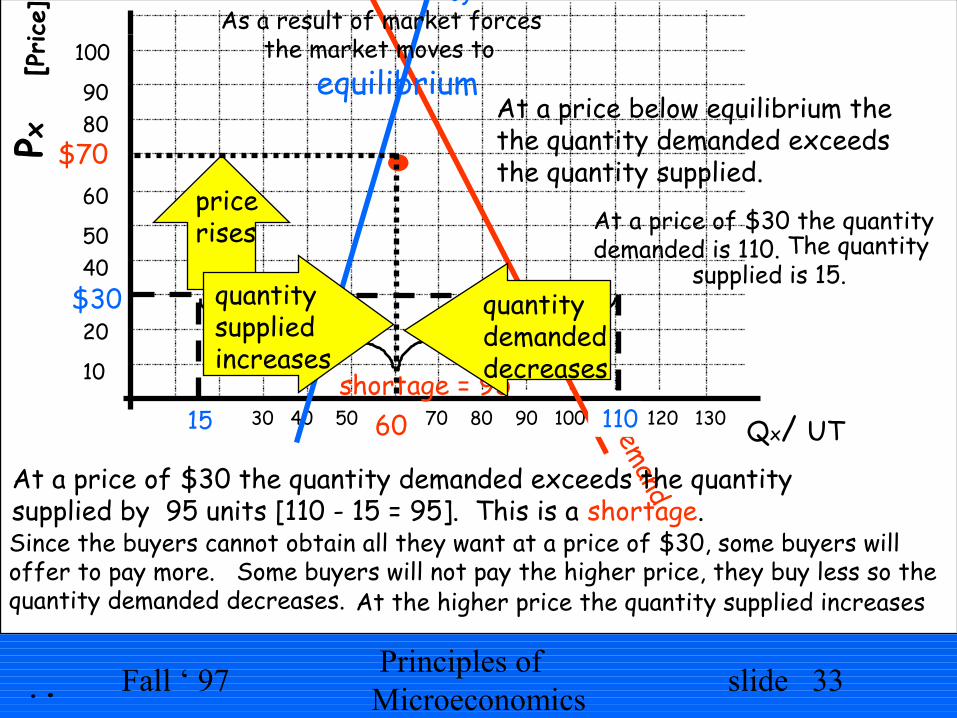
At a price below equilibrium thethe quantity demanded exceedsthe quantity supplied.
.
At a price of $30 the quantitydemanded is 110.
$30
110
The quantity supplied is 15.
15
At a price of $30 the quantity demanded exceeds the quantity supplied by 95 units [110 - 15 = 95]. This is a shortage.
shortage = 95
.
Since the buyers cannot obtain all they want at a price of $30, some buyers will offer to pay more. Some buyers will not pay the higher price, they buy less so the quantity demanded decreases.
pricerises
quantity demandeddecreases
At the higher price the quantity supplied increases
quantitysupplied increases
As a result of market forces the market moves to
equilibrium.
60
$70

Fall ‘ 97 Principles of Microeconomics
slide 34
10 20 3
0 40 5
0 60 7
0 80 9
0 100 11
0 120 13
0
1020
3040
5060
7080
90100
Px
[Pric
e]
Qx/ UT
DemandSu
pply
60
$70
The market for good X is in equilibrium at Px = $70
An increase in the price of a substitute [good Y] causes the demand for good X to increase.
demand increases
D2
As a result of the increased demand,market forces push Px up.
pricerises
$89
equilibriumquantityincreases
80
The increase in the demand for good X results in an increase in both the equilibrium price and quantity.
Identify other factors that couldincrease demand!
Fall ‘ 97 Principles of Microeconomics
slide 35
Demand
10 20 30 40 50 60 70 80 90 100 110 120 130
10
20304050
60
708090
100Px
[P
r ice
]
Qx/ UTSu
pply
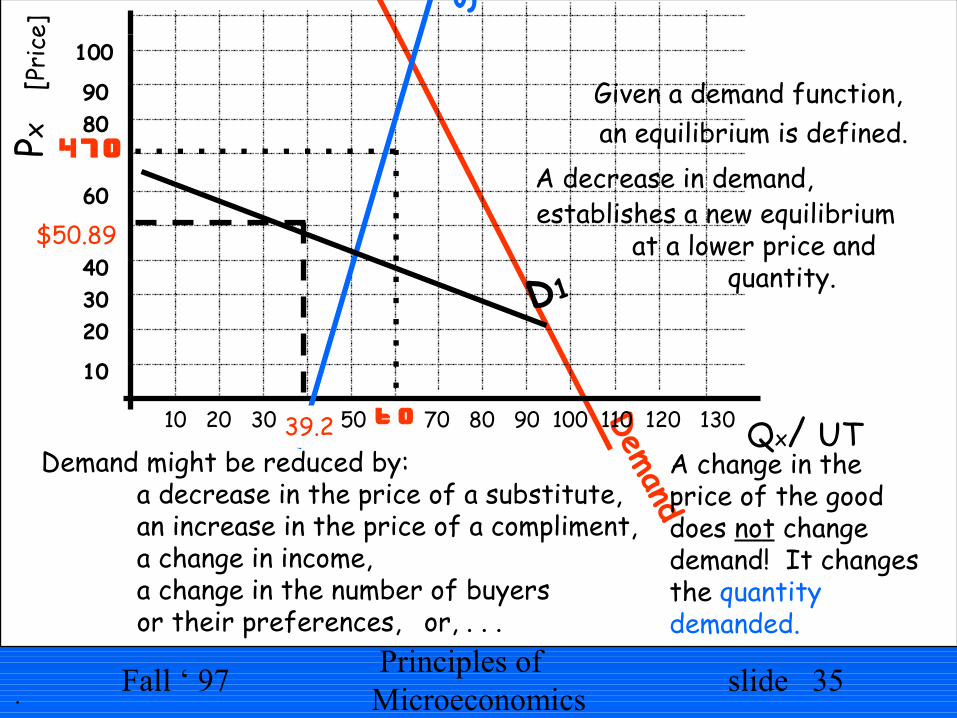
Given a demand function,an equilibrium is defined.
6 0
$70A decrease in demand,
D1
$50.89
39.2
establishes a new equilibriumat a lower price and
quantity.
Demand might be reduced by:a decrease in the price of a substitute,an increase in the price of a compliment,a change in income,a change in the number of buyers or their preferences, or, . . .
.
A change in the price of the gooddoes not changedemand! It changesthe quantity demanded.

Fall ‘ 97 Principles of Microeconomics
slide 36
10 20 3
0 40 5
0 60 7
0 80 9
0 100 11
0 120 13
0
1020
3040
5060
7080
9010
0
Px
[Pric
e]
Qx/ UT
DemandSu
pply
60
$70
Given an equilibrium condition in a market,
supplyincreases
an increase in supply willincrease the equilibriumquantity and decreaseequilibrium P.
S2
price falls$50
Quantity increases
86Identify factors that increase supply: 1. fall in price of inputs 2. improved technology 3. increase in number of sellers 4. fall in return in alternative
uses of inputs 5. or, . . .

Fall ‘ 97 Principles of Microeconomics
slide 37
10 20 30 40 50 60 70 80 90 100 110 120 130
10
20304050
60
708090
100
Px
Qx/ UT
Demand
Supp
ly
6 0
$70
A decrease in supply
decrease in supply
S1
price rises
$90
quantitydecreases
35
causes the equilibrium price to increaseand equilibrium quantity to decrease. What forces might cause the
supply to decrease?1. an increase in the prices
of inputs2. increase in returns from
alternative actions3. problems in technology [regulations, . . . ]4. decrease in number of sellers or producers

Fall ‘ 97 Principles of Microeconomics
slide 38
Qx/ UT10 20 30 40 50 60 70 80 90 100 110 120 130
10
20304050
60
708090
100Px
When demand and supply both shift, the resultant effect on eitherequilibrium price or quantity will be indeterminate.
DemandSu
pply
6 0
$70
demandincreases
D2results ina market force to increase Q
and increase price
supplyincreases
S2
results ina market force to increase Q
and decrease price
Both the increase in demand and supply increase quantity;
increase
increase
100
equilibrium Q increases.
The increase in demand pushes price up.
+∆P
The increase in supply pushes price down.
price mightgo up or downor stay the same -∆P
The change in price may be positive or negative, it depends on the magnitude of the shifts in and slopes of demand and supply.
If both supply and demand decrease,the ∆P will be indeterminate and the equilibrium Q will decrease.

Fall ‘ 97 Principles of Microeconomics
slide 39
10 20 30 40 50 60 70 80 90 100 110 120
10
20304050
60
708090
100
Qx/ UT
Demand
Supp
ly60
$70
Price
A decrease in supply
decrease in supplyS1
pushesprice up
reducesquantity
35
tends to increase P and reduce Q.
An increase in demand
an increase indemand tends D2
to pushprice up
and increaseQ
tends to increase both P and Q.Result is that Price will rise, Quantity may increase, decrease or stay the samedepending on the magnitudes of the shifts and slopes of supply and demand.
In this example,the price increases to$105.
$105
49the quantity decreases to 49
When supplyincreases anddemand decreases,the price willfall but thechange in Q will beindeterminate!

Fall ‘ 97 Principles of Microeconomics
slide 40
Supply and Demand Analysis· Supply and demand is a simplistic model that
provides insights into the effects of events that are related to a specific market.
· Whether an event will tend to cause the price of a good to increase or decrease is of importance to decision makers.
· To estimate the magnitude of price and quantity changes more sophisticated models are needed.


![Tic Normal Sup Informe Final[1]](https://static.fdocuments.net/doc/165x107/5563443fd8b42a5c7b8b552e/tic-normal-sup-informe-final1.jpg)

