December 31, 2015 - PFM Funds fileperiod ended December 31, 2015. Safety of principal and liquidity...
32
PFM Funds Semi-Annual Report December 31, 2015 PFM Funds
Transcript of December 31, 2015 - PFM Funds fileperiod ended December 31, 2015. Safety of principal and liquidity...
PFM FundsSemi-Annual Report
December 31, 2015
PFM Funds
table of contents
1 MESSAGE FROM THE INVESTMENT MANAGER
3 PRIME SERIES FINANCIAL HIGHLIGHTS
6 PRIME SERIES FINANCIAL STATEMENTS
11 GOVERNMENT SERIES FINANCIAL HIGHLIGHTS
12 GOVERNMENT SERIES FINANCIAL STATEMENTS
16 NOTES TO FINANCIAL STATEMENTS
25 PFM FUNDS BOARD OF TRUSTEES, OFFICERS AND ADVISORY BOARD
28 INFORMATION ABOUT FUND EXPENSES
For further information on the PFM Funds, call 1-800-338-3383 or visit us online atwww.pfmfunds.com
PFM Funds (the “Trust”) files its complete schedule of portfolioholdings with the SEC for the Trust’s first and third fiscal quarters onForm N-Q. The Trust’s Form N-Q filings are available on the SEC’swebsite at http://www.sec.gov. The Trust’s Form N-Q filings may bereviewed and copied at the SEC’s public reference room inWashington, D.C. Information on the operation of the SEC’s publicreference room may be obtained by calling the SEC at (800) SEC-0330.
This semi-annual report is not authorized for distribution toprospective investors unless preceded or accompanied by a currentprospectus. The prospectuses can be obtained from PFM FundDistributors, Inc., the Trust’s Distributor. The prospectuses providemore complete information including charges and expenses. Pleaseread the prospectus carefully before investing.
You can obtain a free copy of the Trust’s proxy voting guidelines eitherby calling 1-800-338-3383 or visiting the SEC’s website athttp://www.sec.gov. In addition, you may obtain a free report on theTrust’s proxy voting record during the 12 months ended June 30,2015 either by calling 1-800-338-3383 or visiting the SEC’s websiteat http://www.sec.gov.
PFM Funds Semi-Annual Report | December 31, 2015 1
MESSAGE FROM THE INVESTMENT MANAGER (UNAUDITED)
We are pleased to present the Semi-Annual Report for PFM Funds (the “Trust”) for the
period ended December 31, 2015. Safety of principal and liquidity remain our top
priorities when managing the Trust’s portfolios. Despite a continued low-interest-rate
environment, the Trust’s portfolios continue to generate relatively competitive yields.
Economic Update
Over the past year, the U.S. economy continued on the path of modest growth. The
progress has been uneven, but overall the rate of expansion was faster than that in other
advanced economies. The U.S. labor market continued to improve, with the pace of new
job creation averaging more than 200,000 jobs per month over the past year and the
unemployment rate dipping to 5.0% — its lowest rate in eight years. Economic
expansion was driven by growth in consumption, and was focused on the services sector,
while manufacturing and energy showed weakness.
The sharp decline in oil and commodity prices has been a significant force in the global
economy — strengthening the U.S. dollar, dampening inflation in the U.S., and boosting
inflation in emerging markets. Some have attributed this to slowing of the Chinese
economy; however, the reality is that over-supply and not slowing demand were the
major factors as the Organization of Petroleum Exporting Countries (“OPEC”)
maintained its production ceiling in the face of expanding production from other
countries, including the United States.
Interest Rates
The Federal Open Market Committee (“FOMC”) raised the target federal funds rate by
25 basis points at its December 2015 meeting. The new target range is 0.25% to 0.50%
percent, up from zero to 0.25%, where it had been for seven years. Federal Reserve
(“Fed”) governors urged investors not to look to history for guidance on the pace of
tightening or the final resting point for overnight rates, stressing that rates will be raised
at a gradual pace.
Fund Strategy
Yields on the Trust’s portfolios rose modestly in the second half of 2015 as we took
advantage of increases in money market rates in anticipation of tightening by the FOMC.
We also shortened the weighted average maturity (“WAM”) of the Trust’s portfolios in
an attempt to better protect their net asset values against declines in a rising interest rate
environment. With the first tightening in December, markets adjusted further and we
sought to incorporate higher-yielding investments in the portfolios while maintaining a
defensive WAM.
In the Trust’s Prime Series, we will continue to capitalize on the yield advantage
available in high-grade commercial paper, negotiable certificates of deposit (“CDs”), and
other money-market instruments.
PFM Funds Semi-Annual Report | December 31, 20152
We’re pleased to assist investors in benefitting from the first rise in short-term rates in
more than seven years, and we are cautiously optimistic that continued recovery from
the Great Recession will support the gradual return of interest rates to normal levels. We
look forward to continuing our work as Investment Adviser to the Trust in developing
and implementing effective investment strategies to address your financial objectives.
Respectfully,
PFM Asset Management LLC
December 31, 2015
PFM Funds Semi-Annual Report | December 31, 2015 3
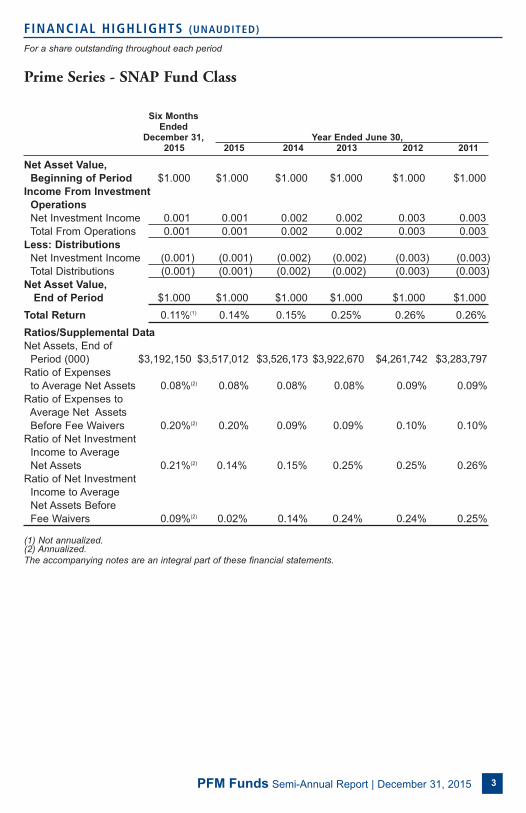
Prime Series - SNAP Fund Class
FINANCIAL HIGHLIGHTS (UNAUDITED)
For a share outstanding throughout each period
Six MonthsEnded
December 31, Year Ended June 30,2015 2015 2014 2013 2012 2011
Net Asset Value,
Beginning of Period $1.000 $1.000 $1.000 $1.000 $1.000 $1.000
Income From Investment
Operations
Net Investment Income 0.001 0.001 0.002 0.002 0.003 0.003
Total From Operations 0.001 0.001 0.002 0.002 0.003 0.003
Less: Distributions
Net Investment Income (0.001) (0.001) (0.002) (0.002) (0.003) (0.003)
Total Distributions (0.001) (0.001) (0.002) (0.002) (0.003) (0.003)
Net Asset Value,
End of Period $1.000 $1.000 $1.000 $1.000 $1.000 $1.000
Total Return 0.11%(1) 0.14% 0.15% 0.25% 0.26% 0.26%
Ratios/Supplemental Data
Net Assets, End of
Period (000) $3,192,150 $3,517,012 $3,526,173 $3,922,670 $4,261,742 $3,283,797
Ratio of Expenses
to Average Net Assets 0.08%(2) 0.08% 0.08% 0.08% 0.09% 0.09%
Ratio of Expenses to
Average Net Assets
Before Fee Waivers 0.20%(2) 0.20% 0.09% 0.09% 0.10% 0.10%
Ratio of Net Investment
Income to Average
Net Assets 0.21%(2) 0.14% 0.15% 0.25% 0.25% 0.26%
Ratio of Net Investment
Income to Average
Net Assets Before
Fee Waivers 0.09%(2) 0.02% 0.14% 0.24% 0.24% 0.25%
(1) Not annualized.(2) Annualized.The accompanying notes are an integral part of these financial statements.

PFM Funds Semi-Annual Report | December 31, 20154
Prime Series - Institutional Class
FINANCIAL HIGHLIGHTS (UNAUDITED)
For a share outstanding throughout each period
Six Months
Ended
December 31, Year Ended June 30,
2015 2015 2014 2013 2012 2011
Net Asset Value,
Beginning of Period $1.000 $1.000 $1.000 $1.000 $1.000 $1.000
Income From
Investment Operations
Net Investment Income 0.001 0.001 0.001 0.002 0.002 0.002
Total From Operations 0.001 0.001 0.001 0.002 0.002 0.002
Less: Distributions
Net Investment Income (0.001) (0.001) (0.001) (0.002) (0.002) (0.002)
Total Distributions (0.001) (0.001) (0.001) (0.002) (0.002) (0.002)
Net Asset Value,
End of Period $1.000 $1.000 $1.000 $1.000 $1.000 $1.000
Total Return 0.07%(1) 0.07% 0.08% 0.17% 0.18% 0.18%
Ratios/Supplemental Data
Net Assets, End
of Period (000) $1,828,588 $1,815,312 $2,052,845 $2,110,672 $1,947,637 $1,724,797
Ratio of Expenses to
Average Net Assets 0.16%(2) 0.15% 0.16% 0.16% 0.16% 0.16%
Ratio of Expenses to
Average Net Assets
Before Fee Waivers 0.18%(2) 0.18% 0.16% 0.16% 0.16% 0.16%
Ratio of Net Investment
Income to Average
Net Assets 0.13%(2) 0.07% 0.07% 0.17% 0.17% 0.18%
Ratio of Net Investment
Income to Average
Net Assets Before
Fee Waivers 0.11%(2) 0.04% 0.07% 0.17% 0.17% 0.18%
(1) Not annualized.(2) Annualized.The accompanying notes are an integral part of these financial statements.

PFM Funds Semi-Annual Report | December 31, 2015 5
FINANCIAL HIGHLIGHTS (UNAUDITED)
For a share outstanding throughout each period
Six Months July 14,Ended 2011(1)
December 31, Year Ended June 30, through2015 2015 2014 2013 June 30, 2012
Net Asset Value,
Beginning of Period $1.000 $1.000 $1.000 $1.000 $1.000
Income From Investment
Operations
Net Investment Income 0.001 0.001 0.001 0.002 0.002
Total From Operations 0.001 0.001 0.001 0.002 0.002
Less: Distributions
Net Investment Income (0.001) (0.001) (0.001) (0.002) (0.002)
Total Distributions (0.001) (0.001) (0.001) (0.002) (0.002)
Net Asset Value, End of Period $1.000 $1.000 $1.000 $1.000 $1.000
Total Return 0.08%(2) 0.10% 0.11% 0.21% 0.22%(2)
Ratios/Supplemental Data
Net Assets, End of Period (000) $349,273 $453,198 $758,692 $398,048 $161,424
Ratio of Expenses to
Average Net Assets 0.13%(3) 0.13% 0.12% 0.12% 0.12%(3)
Ratio of Expenses to Average
Net Assets Before Fee Waivers 0.17%(3) 0.17% 0.15% 0.16% 0.17%(3)
Ratio of Net Investment Income
to Average Net Assets 0.16%(3) 0.10% 0.10% 0.19% 0.25%(3)
Ratio of Net Investment Income
to Average Net Assets
Before Fee Waivers 0.12%(3) 0.06% 0.07% 0.15% 0.20%(3)
(1) The Colorado Investors Class of Prime Series commenced operations on July 14, 2011. (2) Not annualized.(3) Annualized.The accompanying notes are an integral part of these financial statements.
Prime Series - Colorado Investors Class

PFM Funds Semi-Annual Report | December 31, 20156
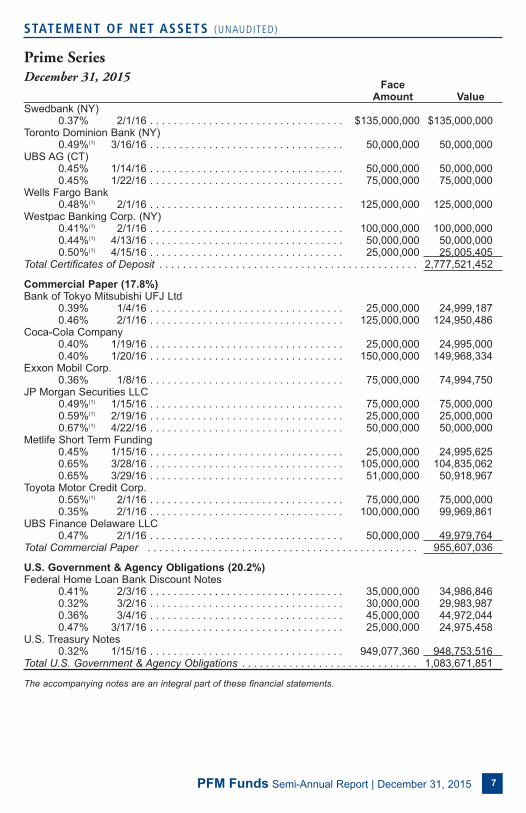
STATEMENT OF NET ASSETS (UNAUDITED)
Prime SeriesDecember 31, 2015
FaceAmount Value
Asset Backed Commercial Paper (1.2%)Old Line Funding LLC
0.74% 4/18/16 . . . . . . . . . . . . . . . . . . . . . . . . . . . . . . . . . $ 65,000,000 $ 64,855,700Total Asset Backed Commercial Paper. . . . . . . . . . . . . . . . . . . . . . . . . . . . . . . . . . . . 64,855,700
Certificates of Deposit (51.7%)Bank of America
0.40% 1/8/16 . . . . . . . . . . . . . . . . . . . . . . . . . . . . . . . . . 100,000,000 100,000,000 0.50% 4/11/16 . . . . . . . . . . . . . . . . . . . . . . . . . . . . . . . . . 75,000,000 75,000,000
Bank of Nova Scotia (Houston)0.73%(1) 3/23/16 . . . . . . . . . . . . . . . . . . . . . . . . . . . . . . . . . 45,000,000 45,003,792
Bank of the West0.40% 2/1/16 . . . . . . . . . . . . . . . . . . . . . . . . . . . . . . . . . 125,000,000 125,000,000
Bank of Tokyo Mitsubishi (NY)0.64%(1) 4/21/16 . . . . . . . . . . . . . . . . . . . . . . . . . . . . . . . . . 30,000,000 30,006,195
BMO Harris Bank0.45%(1) 2/1/16 . . . . . . . . . . . . . . . . . . . . . . . . . . . . . . . . . 50,000,000 50,000,000 0.57%(1) 2/19/16 . . . . . . . . . . . . . . . . . . . . . . . . . . . . . . . . . 50,000,000 50,000,000 0.65%(1) 4/21/16 . . . . . . . . . . . . . . . . . . . . . . . . . . . . . . . . . 75,000,000 75,000,000
Canadian Imperial Bank of Commerce (NY)0.34% 1/4/16 . . . . . . . . . . . . . . . . . . . . . . . . . . . . . . . . . 50,000,000 50,000,000
CitiBank0.37% 1/11/16 . . . . . . . . . . . . . . . . . . . . . . . . . . . . . . . . . 50,000,000 50,000,000
Credit Agricole Corp. & Investment Bank (NY)0.48% 3/1/16 . . . . . . . . . . . . . . . . . . . . . . . . . . . . . . . . . 100,000,000 100,000,000 0.66% 4/1/16 . . . . . . . . . . . . . . . . . . . . . . . . . . . . . . . . . 75,000,000 75,000,000
Credit Suisse (NY)0.56%(1) 1/4/16 . . . . . . . . . . . . . . . . . . . . . . . . . . . . . . . . . 75,000,000 75,000,000 0.41% 2/1/16 . . . . . . . . . . . . . . . . . . . . . . . . . . . . . . . . . 100,000,000 100,000,000
HSBC Bank USA (NY)0.45% 2/1/16 . . . . . . . . . . . . . . . . . . . . . . . . . . . . . . . . . 100,000,000 100,000,000 0.40%(1) 2/3/16 . . . . . . . . . . . . . . . . . . . . . . . . . . . . . . . . . 60,000,000 60,000,000
Mizuho Corporate Bank (NY)0.50% 3/9/16 . . . . . . . . . . . . . . . . . . . . . . . . . . . . . . . . . 125,000,000 125,000,000 0.65% 3/17/16 . . . . . . . . . . . . . . . . . . . . . . . . . . . . . . . . . 50,000,000 50,000,000
Nordea Bank Finland (NY)0.51%(1) 1/21/16 . . . . . . . . . . . . . . . . . . . . . . . . . . . . . . . . . 25,000,000 25,001,667
Norinchukin Bank (NY)0.66% 4/5/16 . . . . . . . . . . . . . . . . . . . . . . . . . . . . . . . . . 172,000,000 172,000,000
Rabobank Nederland NV (NY)0.22% 1/11/16 . . . . . . . . . . . . . . . . . . . . . . . . . . . . . . . . . 60,500,000 60,501,100
Royal Bank of Canada (NY)0.42%(1) 1/7/16 . . . . . . . . . . . . . . . . . . . . . . . . . . . . . . . . . 50,000,000 50,000,000
Skandinaviska Enskilda Banken (NY)0.45%(1) 2/8/16 . . . . . . . . . . . . . . . . . . . . . . . . . . . . . . . . . 50,000,000 50,003,293
Societe Generale (NY)0.64% 4/1/16 . . . . . . . . . . . . . . . . . . . . . . . . . . . . . . . . . 175,000,000 175,000,000
State Street Bank & Trust Co.0.55%(1) 3/21/16 . . . . . . . . . . . . . . . . . . . . . . . . . . . . . . . . . 75,000,000 75,000,000 0.53%(1) 4/15/16 . . . . . . . . . . . . . . . . . . . . . . . . . . . . . . . . . 50,000,000 50,000,000
Sumitomo Mitsui Bank (NY)0.40% 2/1/16 . . . . . . . . . . . . . . . . . . . . . . . . . . . . . . . . . 50,000,000 50,000,000 0.65% 3/18/16 . . . . . . . . . . . . . . . . . . . . . . . . . . . . . . . . . 125,000,000 125,000,000
The accompanying notes are an integral part of these financial statements.
PFM Funds Semi-Annual Report | December 31, 2015 7
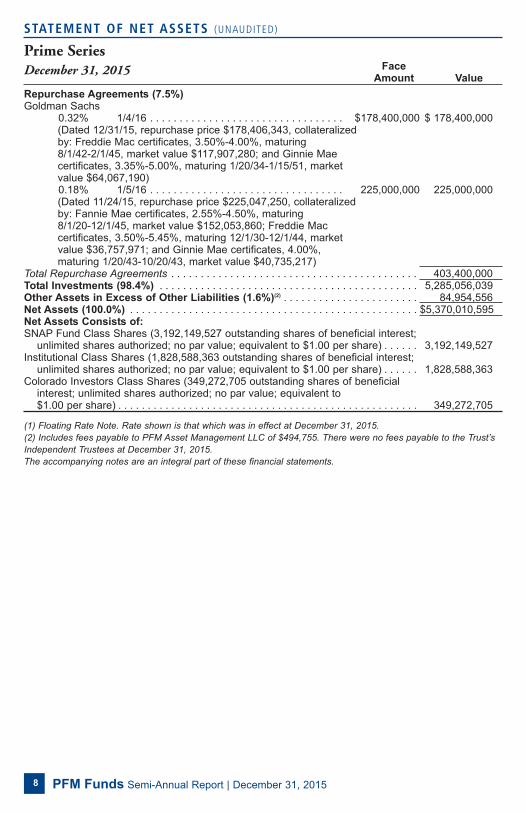
STATEMENT OF NET ASSETS (UNAUDITED)
Prime SeriesDecember 31, 2015
FaceAmount Value
Swedbank (NY)0.37% 2/1/16 . . . . . . . . . . . . . . . . . . . . . . . . . . . . . . . . . $135,000,000 $135,000,000
Toronto Dominion Bank (NY)0.49%(1) 3/16/16 . . . . . . . . . . . . . . . . . . . . . . . . . . . . . . . . . 50,000,000 50,000,000
UBS AG (CT)0.45% 1/14/16 . . . . . . . . . . . . . . . . . . . . . . . . . . . . . . . . . 50,000,000 50,000,000 0.45% 1/22/16 . . . . . . . . . . . . . . . . . . . . . . . . . . . . . . . . . 75,000,000 75,000,000
Wells Fargo Bank0.48%(1) 2/1/16 . . . . . . . . . . . . . . . . . . . . . . . . . . . . . . . . . 125,000,000 125,000,000
Westpac Banking Corp. (NY)0.41%(1) 2/1/16 . . . . . . . . . . . . . . . . . . . . . . . . . . . . . . . . . 100,000,000 100,000,000 0.44%(1) 4/13/16 . . . . . . . . . . . . . . . . . . . . . . . . . . . . . . . . . 50,000,000 50,000,000 0.50%(1) 4/15/16 . . . . . . . . . . . . . . . . . . . . . . . . . . . . . . . . . 25,000,000 25,005,405
Total Certificates of Deposit . . . . . . . . . . . . . . . . . . . . . . . . . . . . . . . . . . . . . . . . . . . . 2,777,521,452
Commercial Paper (17.8%)Bank of Tokyo Mitsubishi UFJ Ltd
0.39% 1/4/16 . . . . . . . . . . . . . . . . . . . . . . . . . . . . . . . . . 25,000,000 24,999,187 0.46% 2/1/16 . . . . . . . . . . . . . . . . . . . . . . . . . . . . . . . . . 125,000,000 124,950,486
Coca-Cola Company0.40% 1/19/16 . . . . . . . . . . . . . . . . . . . . . . . . . . . . . . . . . 25,000,000 24,995,000 0.40% 1/20/16 . . . . . . . . . . . . . . . . . . . . . . . . . . . . . . . . . 150,000,000 149,968,334
Exxon Mobil Corp.0.36% 1/8/16 . . . . . . . . . . . . . . . . . . . . . . . . . . . . . . . . . 75,000,000 74,994,750
JP Morgan Securities LLC0.49%(1) 1/15/16 . . . . . . . . . . . . . . . . . . . . . . . . . . . . . . . . . 75,000,000 75,000,000 0.59%(1) 2/19/16 . . . . . . . . . . . . . . . . . . . . . . . . . . . . . . . . . 25,000,000 25,000,000 0.67%(1) 4/22/16 . . . . . . . . . . . . . . . . . . . . . . . . . . . . . . . . . 50,000,000 50,000,000
Metlife Short Term Funding0.45% 1/15/16 . . . . . . . . . . . . . . . . . . . . . . . . . . . . . . . . . 25,000,000 24,995,625 0.65% 3/28/16 . . . . . . . . . . . . . . . . . . . . . . . . . . . . . . . . . 105,000,000 104,835,062 0.65% 3/29/16 . . . . . . . . . . . . . . . . . . . . . . . . . . . . . . . . . 51,000,000 50,918,967
Toyota Motor Credit Corp.0.55%(1) 2/1/16 . . . . . . . . . . . . . . . . . . . . . . . . . . . . . . . . . 75,000,000 75,000,000 0.35% 2/1/16 . . . . . . . . . . . . . . . . . . . . . . . . . . . . . . . . . 100,000,000 99,969,861
UBS Finance Delaware LLC0.47% 2/1/16 . . . . . . . . . . . . . . . . . . . . . . . . . . . . . . . . . 50,000,000 49,979,764
Total Commercial Paper . . . . . . . . . . . . . . . . . . . . . . . . . . . . . . . . . . . . . . . . . . . . . . 955,607,036
U.S. Government & Agency Obligations (20.2%)Federal Home Loan Bank Discount Notes
0.41% 2/3/16 . . . . . . . . . . . . . . . . . . . . . . . . . . . . . . . . . 35,000,000 34,986,846 0.32% 3/2/16 . . . . . . . . . . . . . . . . . . . . . . . . . . . . . . . . . 30,000,000 29,983,987 0.36% 3/4/16 . . . . . . . . . . . . . . . . . . . . . . . . . . . . . . . . . 45,000,000 44,972,044 0.47% 3/17/16 . . . . . . . . . . . . . . . . . . . . . . . . . . . . . . . . . 25,000,000 24,975,458
U.S. Treasury Notes0.32% 1/15/16 . . . . . . . . . . . . . . . . . . . . . . . . . . . . . . . . . 949,077,360 948,753,516
Total U.S. Government & Agency Obligations . . . . . . . . . . . . . . . . . . . . . . . . . . . . . . 1,083,671,851
The accompanying notes are an integral part of these financial statements.
PFM Funds Semi-Annual Report | December 31, 20158
STATEMENT OF NET ASSETS (UNAUDITED)
Prime SeriesDecember 31, 2015 Face
Amount Value
Repurchase Agreements (7.5%)Goldman Sachs
0.32% 1/4/16 . . . . . . . . . . . . . . . . . . . . . . . . . . . . . . . . . $178,400,000 $ 178,400,000(Dated 12/31/15, repurchase price $178,406,343, collateralized by: Freddie Mac certificates, 3.50%-4.00%, maturing 8/1/42-2/1/45, market value $117,907,280; and Ginnie Mae certificates, 3.35%-5.00%, maturing 1/20/34-1/15/51, market value $64,067,190)0.18% 1/5/16 . . . . . . . . . . . . . . . . . . . . . . . . . . . . . . . . . 225,000,000 225,000,000(Dated 11/24/15, repurchase price $225,047,250, collateralized by: Fannie Mae certificates, 2.55%-4.50%, maturing 8/1/20-12/1/45, market value $152,053,860; Freddie Mac certificates, 3.50%-5.45%, maturing 12/1/30-12/1/44, market value $36,757,971; and Ginnie Mae certificates, 4.00%, maturing 1/20/43-10/20/43, market value $40,735,217)
Total Repurchase Agreements . . . . . . . . . . . . . . . . . . . . . . . . . . . . . . . . . . . . . . . . . . 403,400,000Total Investments (98.4%) . . . . . . . . . . . . . . . . . . . . . . . . . . . . . . . . . . . . . . . . . . . . 5,285,056,039Other Assets in Excess of Other Liabilities (1.6%)(2) . . . . . . . . . . . . . . . . . . . . . . . 84,954,556Net Assets (100.0%) . . . . . . . . . . . . . . . . . . . . . . . . . . . . . . . . . . . . . . . . . . . . . . . . . $5,370,010,595Net Assets Consists of:SNAP Fund Class Shares (3,192,149,527 outstanding shares of beneficial interest;
unlimited shares authorized; no par value; equivalent to $1.00 per share) . . . . . . 3,192,149,527Institutional Class Shares (1,828,588,363 outstanding shares of beneficial interest;
unlimited shares authorized; no par value; equivalent to $1.00 per share) . . . . . . 1,828,588,363Colorado Investors Class Shares (349,272,705 outstanding shares of beneficial
interest; unlimited shares authorized; no par value; equivalent to $1.00 per share) . . . . . . . . . . . . . . . . . . . . . . . . . . . . . . . . . . . . . . . . . . . . . . . . . . . 349,272,705
(1) Floating Rate Note. Rate shown is that which was in effect at December 31, 2015.(2) Includes fees payable to PFM Asset Management LLC of $494,755. There were no fees payable to the Trust’sIndependent Trustees at December 31, 2015.The accompanying notes are an integral part of these financial statements.
PFM Funds Semi-Annual Report | December 31, 2015 9
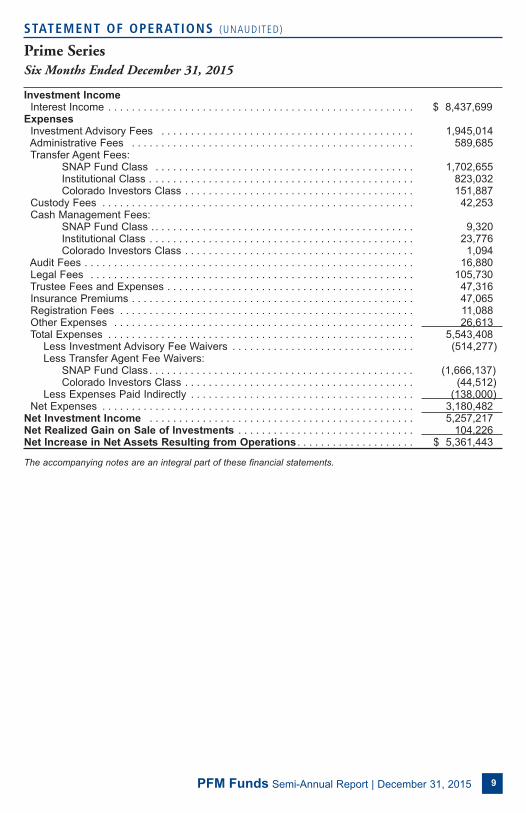
STATEMENT OF OPERATIONS (UNAUDITED)
Prime SeriesSix Months Ended December 31, 2015
Investment IncomeInterest Income . . . . . . . . . . . . . . . . . . . . . . . . . . . . . . . . . . . . . . . . . . . . . . . . . . . . $ 8,437,699
ExpensesInvestment Advisory Fees . . . . . . . . . . . . . . . . . . . . . . . . . . . . . . . . . . . . . . . . . . . 1,945,014Administrative Fees . . . . . . . . . . . . . . . . . . . . . . . . . . . . . . . . . . . . . . . . . . . . . . . . 589,685Transfer Agent Fees:
SNAP Fund Class . . . . . . . . . . . . . . . . . . . . . . . . . . . . . . . . . . . . . . . . . . . . 1,702,655Institutional Class . . . . . . . . . . . . . . . . . . . . . . . . . . . . . . . . . . . . . . . . . . . . . 823,032Colorado Investors Class . . . . . . . . . . . . . . . . . . . . . . . . . . . . . . . . . . . . . . . 151,887
Custody Fees . . . . . . . . . . . . . . . . . . . . . . . . . . . . . . . . . . . . . . . . . . . . . . . . . . . . . 42,253Cash Management Fees:
SNAP Fund Class . . . . . . . . . . . . . . . . . . . . . . . . . . . . . . . . . . . . . . . . . . . . . 9,320Institutional Class . . . . . . . . . . . . . . . . . . . . . . . . . . . . . . . . . . . . . . . . . . . . . 23,776Colorado Investors Class . . . . . . . . . . . . . . . . . . . . . . . . . . . . . . . . . . . . . . . 1,094
Audit Fees . . . . . . . . . . . . . . . . . . . . . . . . . . . . . . . . . . . . . . . . . . . . . . . . . . . . . . . . 16,880Legal Fees . . . . . . . . . . . . . . . . . . . . . . . . . . . . . . . . . . . . . . . . . . . . . . . . . . . . . . . 105,730Trustee Fees and Expenses . . . . . . . . . . . . . . . . . . . . . . . . . . . . . . . . . . . . . . . . . . 47,316Insurance Premiums . . . . . . . . . . . . . . . . . . . . . . . . . . . . . . . . . . . . . . . . . . . . . . . . 47,065Registration Fees . . . . . . . . . . . . . . . . . . . . . . . . . . . . . . . . . . . . . . . . . . . . . . . . . . 11,088Other Expenses . . . . . . . . . . . . . . . . . . . . . . . . . . . . . . . . . . . . . . . . . . . . . . . . . . . 26,613Total Expenses . . . . . . . . . . . . . . . . . . . . . . . . . . . . . . . . . . . . . . . . . . . . . . . . . . . . 5,543,408
Less Investment Advisory Fee Waivers . . . . . . . . . . . . . . . . . . . . . . . . . . . . . . . (514,277)Less Transfer Agent Fee Waivers:
SNAP Fund Class . . . . . . . . . . . . . . . . . . . . . . . . . . . . . . . . . . . . . . . . . . . . . (1,666,137)Colorado Investors Class . . . . . . . . . . . . . . . . . . . . . . . . . . . . . . . . . . . . . . . (44,512)
Less Expenses Paid Indirectly . . . . . . . . . . . . . . . . . . . . . . . . . . . . . . . . . . . . . . (138,000)Net Expenses . . . . . . . . . . . . . . . . . . . . . . . . . . . . . . . . . . . . . . . . . . . . . . . . . . . . . 3,180,482
Net Investment Income . . . . . . . . . . . . . . . . . . . . . . . . . . . . . . . . . . . . . . . . . . . . . 5,257,217Net Realized Gain on Sale of Investments . . . . . . . . . . . . . . . . . . . . . . . . . . . . . . 104,226Net Increase in Net Assets Resulting from Operations . . . . . . . . . . . . . . . . . . . . $ 5,361,443
The accompanying notes are an integral part of these financial statements.
PFM Funds Semi-Annual Report | December 31, 201510
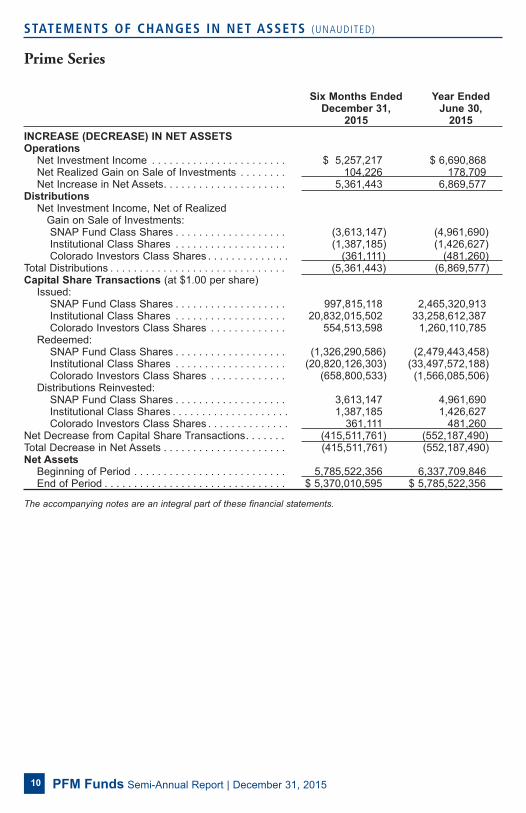
Six Months Ended Year EndedDecember 31, June 30,
2015 2015
INCREASE (DECREASE) IN NET ASSETSOperations
Net Investment Income . . . . . . . . . . . . . . . . . . . . . . . $ 5,257,217 $ 6,690,868Net Realized Gain on Sale of Investments . . . . . . . . 104,226 178,709Net Increase in Net Assets. . . . . . . . . . . . . . . . . . . . . 5,361,443 6,869,577
DistributionsNet Investment Income, Net of Realized
Gain on Sale of Investments: SNAP Fund Class Shares . . . . . . . . . . . . . . . . . . . (3,613,147) (4,961,690)Institutional Class Shares . . . . . . . . . . . . . . . . . . . (1,387,185) (1,426,627)Colorado Investors Class Shares . . . . . . . . . . . . . . (361,111) (481,260)
Total Distributions . . . . . . . . . . . . . . . . . . . . . . . . . . . . . . (5,361,443) (6,869,577)Capital Share Transactions (at $1.00 per share)
Issued:SNAP Fund Class Shares . . . . . . . . . . . . . . . . . . . 997,815,118 2,465,320,913Institutional Class Shares . . . . . . . . . . . . . . . . . . . 20,832,015,502 33,258,612,387Colorado Investors Class Shares . . . . . . . . . . . . . 554,513,598 1,260,110,785
Redeemed:SNAP Fund Class Shares . . . . . . . . . . . . . . . . . . . (1,326,290,586) (2,479,443,458)Institutional Class Shares . . . . . . . . . . . . . . . . . . . (20,820,126,303) (33,497,572,188)Colorado Investors Class Shares . . . . . . . . . . . . . (658,800,533) (1,566,085,506)
Distributions Reinvested:SNAP Fund Class Shares . . . . . . . . . . . . . . . . . . . 3,613,147 4,961,690Institutional Class Shares . . . . . . . . . . . . . . . . . . . . 1,387,185 1,426,627Colorado Investors Class Shares . . . . . . . . . . . . . . 361,111 481,260
Net Decrease from Capital Share Transactions. . . . . . . (415,511,761) (552,187,490)Total Decrease in Net Assets . . . . . . . . . . . . . . . . . . . . . (415,511,761) (552,187,490)Net Assets
Beginning of Period . . . . . . . . . . . . . . . . . . . . . . . . . . 5,785,522,356 6,337,709,846End of Period . . . . . . . . . . . . . . . . . . . . . . . . . . . . . . . $ 5,370,010,595 $ 5,785,522,356
The accompanying notes are an integral part of these financial statements.
STATEMENTS OF CHANGES IN NET ASSETS (UNAUDITED)
Prime Series
PFM Funds Semi-Annual Report | December 31, 2015 11
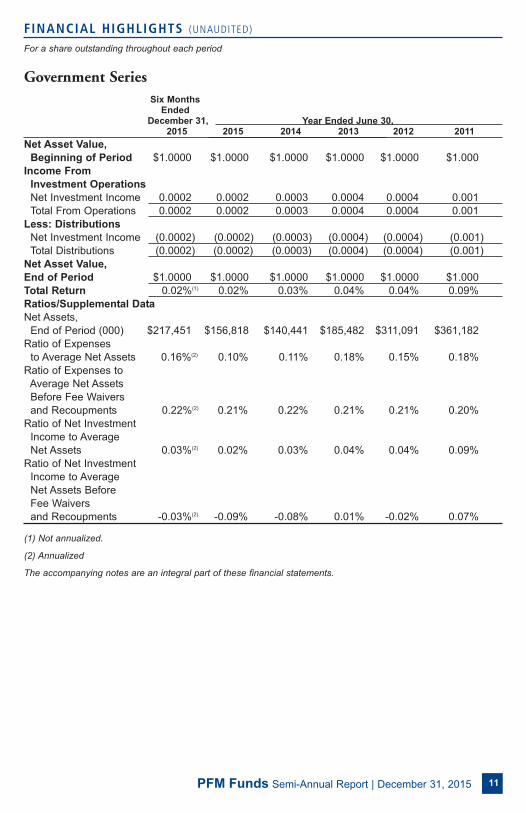
Government Series
FINANCIAL HIGHLIGHTS (UNAUDITED)
For a share outstanding throughout each period
Six Months Ended
December 31, Year Ended June 30,2015 2015 2014 2013 2012 2011
Net Asset Value,
Beginning of Period $1.0000 $1.0000 $1.0000 $1.0000 $1.0000 $1.000
Income From
Investment Operations
Net Investment Income 0.0002 0.0002 0.0003 0.0004 0.0004 0.001
Total From Operations 0.0002 0.0002 0.0003 0.0004 0.0004 0.001
Less: Distributions
Net Investment Income (0.0002) (0.0002) (0.0003) (0.0004) (0.0004) (0.001)
Total Distributions (0.0002) (0.0002) (0.0003) (0.0004) (0.0004) (0.001)
Net Asset Value,
End of Period $1.0000 $1.0000 $1.0000 $1.0000 $1.0000 $1.000
Total Return 0.02%(1) 0.02% 0.03% 0.04% 0.04% 0.09%
Ratios/Supplemental Data
Net Assets,
End of Period (000) $217,451 $156,818 $140,441 $185,482 $311,091 $361,182
Ratio of Expenses
to Average Net Assets 0.16%(2) 0.10% 0.11% 0.18% 0.15% 0.18%
Ratio of Expenses to
Average Net Assets
Before Fee Waivers
and Recoupments 0.22%(2) 0.21% 0.22% 0.21% 0.21% 0.20%
Ratio of Net Investment
Income to Average
Net Assets 0.03%(2) 0.02% 0.03% 0.04% 0.04% 0.09%
Ratio of Net Investment
Income to Average
Net Assets Before
Fee Waivers
and Recoupments -0.03%(2) -0.09% -0.08% 0.01% -0.02% 0.07%
(1) Not annualized.
(2) Annualized
The accompanying notes are an integral part of these financial statements.
PFM Funds Semi-Annual Report | December 31, 201512
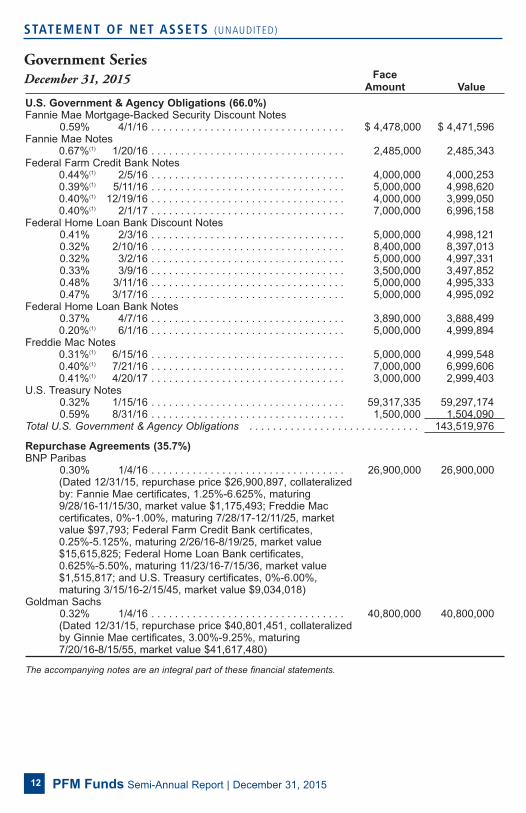
STATEMENT OF NET ASSETS (UNAUDITED)
Government SeriesDecember 31, 2015 Face
Amount Value
U.S. Government & Agency Obligations (66.0%)Fannie Mae Mortgage-Backed Security Discount Notes
0.59% 4/1/16 . . . . . . . . . . . . . . . . . . . . . . . . . . . . . . . . . $ 4,478,000 $ 4,471,596Fannie Mae Notes
0.67%(1) 1/20/16 . . . . . . . . . . . . . . . . . . . . . . . . . . . . . . . . . 2,485,000 2,485,343Federal Farm Credit Bank Notes
0.44%(1) 2/5/16 . . . . . . . . . . . . . . . . . . . . . . . . . . . . . . . . . 4,000,000 4,000,253 0.39%(1) 5/11/16 . . . . . . . . . . . . . . . . . . . . . . . . . . . . . . . . . 5,000,000 4,998,620 0.40%(1) 12/19/16 . . . . . . . . . . . . . . . . . . . . . . . . . . . . . . . . . 4,000,000 3,999,050 0.40%(1) 2/1/17 . . . . . . . . . . . . . . . . . . . . . . . . . . . . . . . . . 7,000,000 6,996,158
Federal Home Loan Bank Discount Notes0.41% 2/3/16 . . . . . . . . . . . . . . . . . . . . . . . . . . . . . . . . . 5,000,000 4,998,121 0.32% 2/10/16 . . . . . . . . . . . . . . . . . . . . . . . . . . . . . . . . . 8,400,000 8,397,013 0.32% 3/2/16 . . . . . . . . . . . . . . . . . . . . . . . . . . . . . . . . . 5,000,000 4,997,331 0.33% 3/9/16 . . . . . . . . . . . . . . . . . . . . . . . . . . . . . . . . . 3,500,000 3,497,852 0.48% 3/11/16 . . . . . . . . . . . . . . . . . . . . . . . . . . . . . . . . . 5,000,000 4,995,333 0.47% 3/17/16 . . . . . . . . . . . . . . . . . . . . . . . . . . . . . . . . . 5,000,000 4,995,092
Federal Home Loan Bank Notes0.37% 4/7/16 . . . . . . . . . . . . . . . . . . . . . . . . . . . . . . . . . 3,890,000 3,888,499 0.20%(1) 6/1/16 . . . . . . . . . . . . . . . . . . . . . . . . . . . . . . . . . 5,000,000 4,999,894
Freddie Mac Notes0.31%(1) 6/15/16 . . . . . . . . . . . . . . . . . . . . . . . . . . . . . . . . . 5,000,000 4,999,548 0.40%(1) 7/21/16 . . . . . . . . . . . . . . . . . . . . . . . . . . . . . . . . . 7,000,000 6,999,606 0.41%(1) 4/20/17 . . . . . . . . . . . . . . . . . . . . . . . . . . . . . . . . . 3,000,000 2,999,403
U.S. Treasury Notes0.32% 1/15/16 . . . . . . . . . . . . . . . . . . . . . . . . . . . . . . . . . 59,317,335 59,297,174 0.59% 8/31/16 . . . . . . . . . . . . . . . . . . . . . . . . . . . . . . . . . 1,500,000 1,504,090
Total U.S. Government & Agency Obligations . . . . . . . . . . . . . . . . . . . . . . . . . . . . . 143,519,976
Repurchase Agreements (35.7%)BNP Paribas
0.30% 1/4/16 . . . . . . . . . . . . . . . . . . . . . . . . . . . . . . . . . 26,900,000 26,900,000(Dated 12/31/15, repurchase price $26,900,897, collateralized by: Fannie Mae certificates, 1.25%-6.625%, maturing 9/28/16-11/15/30, market value $1,175,493; Freddie Mac certificates, 0%-1.00%, maturing 7/28/17-12/11/25, market value $97,793; Federal Farm Credit Bank certificates, 0.25%-5.125%, maturing 2/26/16-8/19/25, market value $15,615,825; Federal Home Loan Bank certificates, 0.625%-5.50%, maturing 11/23/16-7/15/36, market value $1,515,817; and U.S. Treasury certificates, 0%-6.00%, maturing 3/15/16-2/15/45, market value $9,034,018)
Goldman Sachs0.32% 1/4/16 . . . . . . . . . . . . . . . . . . . . . . . . . . . . . . . . . 40,800,000 40,800,000(Dated 12/31/15, repurchase price $40,801,451, collateralized by Ginnie Mae certificates, 3.00%-9.25%, maturing 7/20/16-8/15/55, market value $41,617,480)
The accompanying notes are an integral part of these financial statements.
PFM Funds Semi-Annual Report | December 31, 2015 13
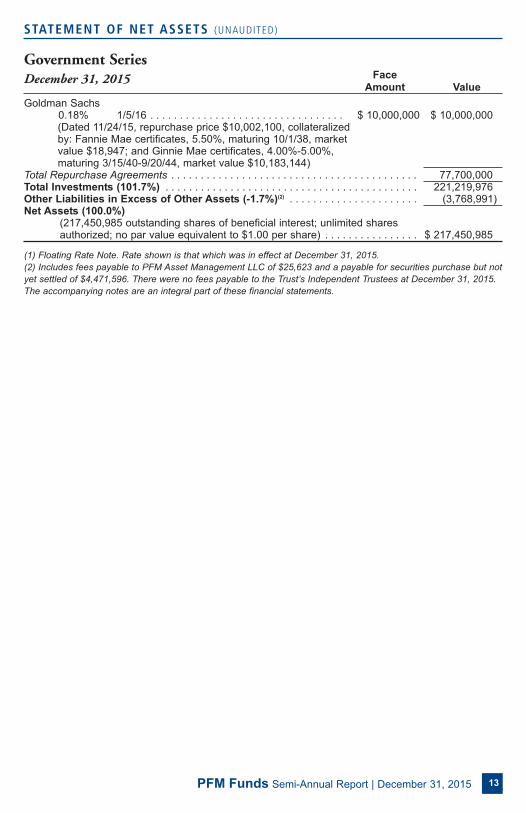
FaceAmount Value
Goldman Sachs0.18% 1/5/16 . . . . . . . . . . . . . . . . . . . . . . . . . . . . . . . . . $ 10,000,000 $ 10,000,000(Dated 11/24/15, repurchase price $10,002,100, collateralized by: Fannie Mae certificates, 5.50%, maturing 10/1/38, market value $18,947; and Ginnie Mae certificates, 4.00%-5.00%, maturing 3/15/40-9/20/44, market value $10,183,144)
Total Repurchase Agreements . . . . . . . . . . . . . . . . . . . . . . . . . . . . . . . . . . . . . . . . . . 77,700,000Total Investments (101.7%) . . . . . . . . . . . . . . . . . . . . . . . . . . . . . . . . . . . . . . . . . . . 221,219,976Other Liabilities in Excess of Other Assets (-1.7%)(2) . . . . . . . . . . . . . . . . . . . . . . (3,768,991)Net Assets (100.0%)
(217,450,985 outstanding shares of beneficial interest; unlimited shares authorized; no par value equivalent to $1.00 per share) . . . . . . . . . . . . . . . . $ 217,450,985
(1) Floating Rate Note. Rate shown is that which was in effect at December 31, 2015.(2) Includes fees payable to PFM Asset Management LLC of $25,623 and a payable for securities purchase but notyet settled of $4,471,596. There were no fees payable to the Trust’s Independent Trustees at December 31, 2015.The accompanying notes are an integral part of these financial statements.
STATEMENT OF NET ASSETS (UNAUDITED)
Government SeriesDecember 31, 2015

PFM Funds Semi-Annual Report | December 31, 201514
STATEMENT OF OPERATIONS (UNAUDITED)
Government SeriesSix Months Ended December 31, 2015
Investment IncomeInterest Income . . . . . . . . . . . . . . . . . . . . . . . . . . . . . . . . . . . . . . . . . . . . . . $ 163,022
ExpensesInvestment Advisory Fees . . . . . . . . . . . . . . . . . . . . . . . . . . . . . . . . . . . . . . 61,251Administrative Fees . . . . . . . . . . . . . . . . . . . . . . . . . . . . . . . . . . . . . . . . . . . 17,500Transfer Agent Fees. . . . . . . . . . . . . . . . . . . . . . . . . . . . . . . . . . . . . . . . . . . 70,002Custody Fees . . . . . . . . . . . . . . . . . . . . . . . . . . . . . . . . . . . . . . . . . . . . . . . 5,834Cash Management Fees . . . . . . . . . . . . . . . . . . . . . . . . . . . . . . . . . . . . . . . 2,857Audit Fees . . . . . . . . . . . . . . . . . . . . . . . . . . . . . . . . . . . . . . . . . . . . . . . . . . 12,575Legal Fees . . . . . . . . . . . . . . . . . . . . . . . . . . . . . . . . . . . . . . . . . . . . . . . . . 2,975Trustee Fees and Expenses . . . . . . . . . . . . . . . . . . . . . . . . . . . . . . . . . . . . 1,434Insurance Premiums . . . . . . . . . . . . . . . . . . . . . . . . . . . . . . . . . . . . . . . . . . 1,396Registration Fees . . . . . . . . . . . . . . . . . . . . . . . . . . . . . . . . . . . . . . . . . . . . . 9,000Other Expenses . . . . . . . . . . . . . . . . . . . . . . . . . . . . . . . . . . . . . . . . . . . . . . 4,909Total Expenses. . . . . . . . . . . . . . . . . . . . . . . . . . . . . . . . . . . . . . . . . . . . . . . 189,733
Less Investment Advisory Fee Waivers . . . . . . . . . . . . . . . . . . . . . . . . . (21)Administrative Fee Waivers . . . . . . . . . . . . . . . . . . . . . . . . . . . . . . . . (3,255)Transfer Agent Fee Waivers. . . . . . . . . . . . . . . . . . . . . . . . . . . . . . . . (51,014)
Net Expenses. . . . . . . . . . . . . . . . . . . . . . . . . . . . . . . . . . . . . . . . . . . . . . . . 135,443Net Investment Income . . . . . . . . . . . . . . . . . . . . . . . . . . . . . . . . . . . . . . . 27,579Net Realized Net Loss on Sale of Investments . . . . . . . . . . . . . . . . . . . . 1,762Net Increase in Net Assets Resulting from Operations . . . . . . . . . . . . . $ 29,341
The accompanying notes are an integral part of these financial statements.
PFM Funds Semi-Annual Report | December 31, 2015 15
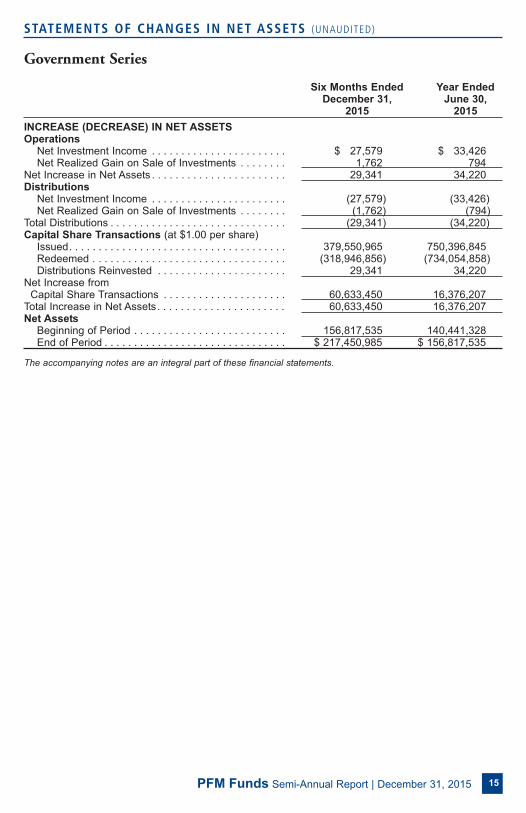
STATEMENTS OF CHANGES IN NET ASSETS (UNAUDITED)
Government Series
Six Months Ended Year Ended December 31, June 30,
2015 2015
INCREASE (DECREASE) IN NET ASSETSOperations
Net Investment Income . . . . . . . . . . . . . . . . . . . . . . . $ 27,579 $ 33,426Net Realized Gain on Sale of Investments . . . . . . . . 1,762 794
Net Increase in Net Assets . . . . . . . . . . . . . . . . . . . . . . . 29,341 34,220Distributions
Net Investment Income . . . . . . . . . . . . . . . . . . . . . . . (27,579) (33,426)Net Realized Gain on Sale of Investments . . . . . . . . (1,762) (794)
Total Distributions . . . . . . . . . . . . . . . . . . . . . . . . . . . . . . (29,341) (34,220)Capital Share Transactions (at $1.00 per share)
Issued. . . . . . . . . . . . . . . . . . . . . . . . . . . . . . . . . . . . . 379,550,965 750,396,845Redeemed . . . . . . . . . . . . . . . . . . . . . . . . . . . . . . . . . (318,946,856) (734,054,858)Distributions Reinvested . . . . . . . . . . . . . . . . . . . . . . 29,341 34,220
Net Increase from Capital Share Transactions . . . . . . . . . . . . . . . . . . . . . 60,633,450 16,376,207
Total Increase in Net Assets. . . . . . . . . . . . . . . . . . . . . . 60,633,450 16,376,207Net Assets
Beginning of Period . . . . . . . . . . . . . . . . . . . . . . . . . . 156,817,535 140,441,328End of Period . . . . . . . . . . . . . . . . . . . . . . . . . . . . . . . $ 217,450,985 $ 156,817,535
The accompanying notes are an integral part of these financial statements.
PFM Funds Semi-Annual Report | December 31, 201516
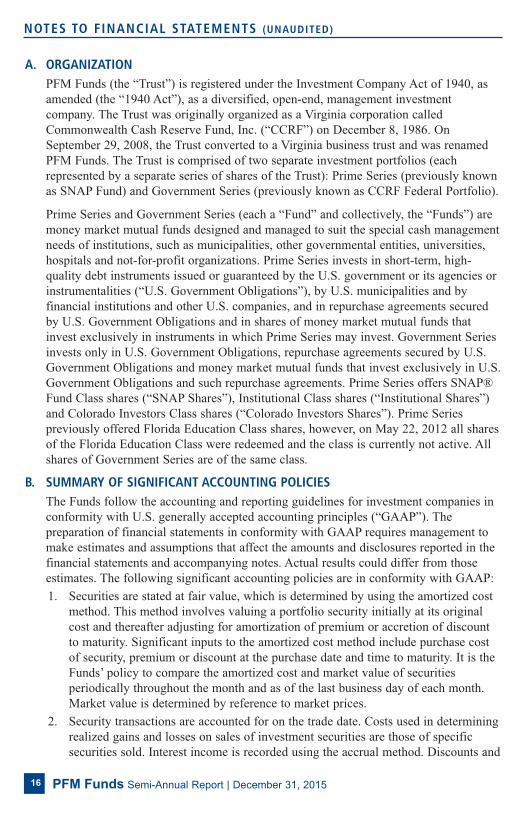
NOTES TO FINANCIAL STATEMENTS (UNAUDITED)
A. ORGANIZATIONPFM Funds (the “Trust”) is registered under the Investment Company Act of 1940, as
amended (the “1940 Act”), as a diversified, open-end, management investment
company. The Trust was originally organized as a Virginia corporation called
Commonwealth Cash Reserve Fund, Inc. (“CCRF”) on December 8, 1986. On
September 29, 2008, the Trust converted to a Virginia business trust and was renamed
PFM Funds. The Trust is comprised of two separate investment portfolios (each
represented by a separate series of shares of the Trust): Prime Series (previously known
as SNAP Fund) and Government Series (previously known as CCRF Federal Portfolio).
Prime Series and Government Series (each a “Fund” and collectively, the “Funds”) are
money market mutual funds designed and managed to suit the special cash management
needs of institutions, such as municipalities, other governmental entities, universities,
hospitals and not-for-profit organizations. Prime Series invests in short-term, high-
quality debt instruments issued or guaranteed by the U.S. government or its agencies or
instrumentalities (“U.S. Government Obligations”), by U.S. municipalities and by
financial institutions and other U.S. companies, and in repurchase agreements secured
by U.S. Government Obligations and in shares of money market mutual funds that
invest exclusively in instruments in which Prime Series may invest. Government Series
invests only in U.S. Government Obligations, repurchase agreements secured by U.S.
Government Obligations and money market mutual funds that invest exclusively in U.S.
Government Obligations and such repurchase agreements. Prime Series offers SNAP®
Fund Class shares (“SNAP Shares”), Institutional Class shares (“Institutional Shares”)
and Colorado Investors Class shares (“Colorado Investors Shares”). Prime Series
previously offered Florida Education Class shares, however, on May 22, 2012 all shares
of the Florida Education Class were redeemed and the class is currently not active. All
shares of Government Series are of the same class.
B. SUMMARY OF SIGNIFICANT ACCOUNTING POLICIESThe Funds follow the accounting and reporting guidelines for investment companies in
conformity with U.S. generally accepted accounting principles (“GAAP”). The
preparation of financial statements in conformity with GAAP requires management to
make estimates and assumptions that affect the amounts and disclosures reported in the
financial statements and accompanying notes. Actual results could differ from those
estimates. The following significant accounting policies are in conformity with GAAP:
1. Securities are stated at fair value, which is determined by using the amortized cost
method. This method involves valuing a portfolio security initially at its original
cost and thereafter adjusting for amortization of premium or accretion of discount
to maturity. Significant inputs to the amortized cost method include purchase cost
of security, premium or discount at the purchase date and time to maturity. It is the
Funds’ policy to compare the amortized cost and market value of securities
periodically throughout the month and as of the last business day of each month.
Market value is determined by reference to market prices.
2. Security transactions are accounted for on the trade date. Costs used in determining
realized gains and losses on sales of investment securities are those of specific
securities sold. Interest income is recorded using the accrual method. Discounts and
PFM Funds Semi-Annual Report | December 31, 2015 17
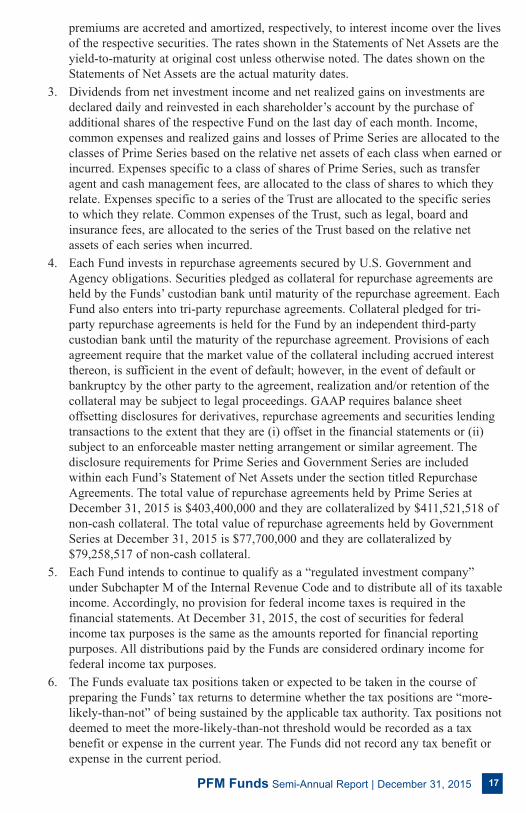
premiums are accreted and amortized, respectively, to interest income over the lives
of the respective securities. The rates shown in the Statements of Net Assets are the
yield-to-maturity at original cost unless otherwise noted. The dates shown on the
Statements of Net Assets are the actual maturity dates.
3. Dividends from net investment income and net realized gains on investments are
declared daily and reinvested in each shareholder’s account by the purchase of
additional shares of the respective Fund on the last day of each month. Income,
common expenses and realized gains and losses of Prime Series are allocated to the
classes of Prime Series based on the relative net assets of each class when earned or
incurred. Expenses specific to a class of shares of Prime Series, such as transfer
agent and cash management fees, are allocated to the class of shares to which they
relate. Expenses specific to a series of the Trust are allocated to the specific series
to which they relate. Common expenses of the Trust, such as legal, board and
insurance fees, are allocated to the series of the Trust based on the relative net
assets of each series when incurred.
4. Each Fund invests in repurchase agreements secured by U.S. Government and
Agency obligations. Securities pledged as collateral for repurchase agreements are
held by the Funds’ custodian bank until maturity of the repurchase agreement. Each
Fund also enters into tri-party repurchase agreements. Collateral pledged for tri-
party repurchase agreements is held for the Fund by an independent third-party
custodian bank until the maturity of the repurchase agreement. Provisions of each
agreement require that the market value of the collateral including accrued interest
thereon, is sufficient in the event of default; however, in the event of default or
bankruptcy by the other party to the agreement, realization and/or retention of the
collateral may be subject to legal proceedings. GAAP requires balance sheet
offsetting disclosures for derivatives, repurchase agreements and securities lending
transactions to the extent that they are (i) offset in the financial statements or (ii)
subject to an enforceable master netting arrangement or similar agreement. The
disclosure requirements for Prime Series and Government Series are included
within each Fund’s Statement of Net Assets under the section titled Repurchase
Agreements. The total value of repurchase agreements held by Prime Series at
December 31, 2015 is $403,400,000 and they are collateralized by $411,521,518 of
non-cash collateral. The total value of repurchase agreements held by Government
Series at December 31, 2015 is $77,700,000 and they are collateralized by
$79,258,517 of non-cash collateral.
5. Each Fund intends to continue to qualify as a “regulated investment company”
under Subchapter M of the Internal Revenue Code and to distribute all of its taxable
income. Accordingly, no provision for federal income taxes is required in the
financial statements. At December 31, 2015, the cost of securities for federal
income tax purposes is the same as the amounts reported for financial reporting
purposes. All distributions paid by the Funds are considered ordinary income for
federal income tax purposes.
6. The Funds evaluate tax positions taken or expected to be taken in the course of
preparing the Funds’ tax returns to determine whether the tax positions are “more-
likely-than-not” of being sustained by the applicable tax authority. Tax positions not
deemed to meet the more-likely-than-not threshold would be recorded as a tax
benefit or expense in the current year. The Funds did not record any tax benefit or
expense in the current period.
PFM Funds Semi-Annual Report | December 31, 201518
7. The Funds have evaluated subsequent events prior to the issuance of these financial
statements. No events have taken place that meet the definition of a subsequent
event that requires disclosure in these financial statements.
C. FAIR VALUE MEASUREMENTSIn accordance with the authoritative guidance on fair value measurements and
disclosures under U.S. GAAP, the Funds disclose the fair values of their investments in
a hierarchy that prioritizes the inputs to valuation techniques used to measure fair value.
The hierarchy gives the highest priority to valuations based upon unadjusted quoted
prices in active markets for identical assets or liabilities (level 1 measurement) and the
lowest priority to valuations based upon unobservable inputs that are significant to the
valuation (level 3 measurements). The guidance establishes three levels of the fair value
hierarchy as follows:
Level 1 – Quoted prices in active markets for identical assets.
Level 2 – Inputs other than quoted prices that are observable for the asset,
including quoted prices for similar investments based on interest rates, credit risk
and like factors.
Level 3 – Unobservable inputs for the assets, including the Funds’ own
assumptions for determining fair value.
Portfolio investments are assigned a level based upon the observability of the inputs
which are significant to the overall valuation. The inputs or methodology used for
valuing securities are not necessarily an indication of the risk associated with investing
in those securities. The fair value of investments in money market funds is based on the
published net asset values per share of those funds. Money market securities are valued
using amortized cost, in accordance with Rule 2a-7 under the 1940 Act. Generally,
amortized cost approximates the current fair values of money market securities held by
the Funds, but since the values are not obtained from a quoted price in an active market,
such securities held by Prime Series and Government Series are categorized as Level 2.
There were no transfers between levels during the six months ended December 31,
2015.
D. FEES AND CHARGESPFM Asset Management LLC (“PFM”) is an investment adviser registered under the
Investment Advisers Act of 1940. The Trust has entered into agreements with PFM to
provide investment advisory, administration, and transfer agent services to the Funds.
PFM is an indirect, wholly-owned subsidiary of PFM I, LLC (“PFM I”). Effective as of
June 30, 2014, the senior management of PFM I acquired all of the equity interest in
PFM I and became the sole owners of PFM I (the “Transaction”). The Transaction
resulted in a change in control of PFM and thus resulted in the automatic termination of
the previous investment advisory agreements of the Funds (the “Previous Advisory
Agreements”) in accordance with their terms. In order for PFM to continue to provide
investment advisory services to the Funds after the Transaction, new investment
advisory agreements (the “New Advisory Agreements”), having the advisory fees
described below, were unanimously approved by the Board, including the separate vote
of a majority of the Trustees who are not “interested persons,” as defined by the 1940
Act, of the Trust (the “Independent Trustees”). Except for the fees payable under and
the date of effectiveness of the New Advisory Agreements, the New Advisory
Agreements are the same in all material respects as the Previous Advisory Agreements.
PFM Funds Semi-Annual Report | December 31, 2015 19
The New Advisory Agreements were approved by shareholders of Prime Series and
Government Series, respectively, at a special meeting of shareholders held on June 23,
2014 and became effective on July 1, 2014 following consummation of the Transaction.
The investment advisory fees payable by each Fund under the New Advisory
Agreements are calculated at the following annual percentage rates of such Fund’s
average daily net assets:
Fund Net Assets Applicable Rate
First $2 billion 0.07%
Next $3 billion 0.065%
Next $5 billion 0.06%
Over $10 billion 0.05%
PFM provides administration and transfer agency services to the Funds pursuant to an
Administration Agreement and a Transfer Agent Agreement with the Trust. Amendments
to these agreements were approved by the Board, including the separate vote of a
majority of the Independent Trustees, on May 9, 2014 and became effective on July 1,
2014. Effective as of such date, fees for administrative services provided by PFM to
each Fund are calculated at the annual rate of 0.02% of the average daily net assets of
such Fund, and fees for transfer agency services provided by PFM to each Fund are
calculated at the following annual rates of the average daily net assets of the Fund or
applicable share class thereof:
Fund/Class Applicable Rate
Prime Series – SNAP Fund Class 0.10%
Prime Series – Institutional Class 0.08%
Prime Series – Colorado Investors Class 0.07%
Government Series 0.08%
Effective November 1, 2013, the Trust entered into a Fee Reduction Agreement with
PFM, on behalf of Prime Series (the “Prime Fee Reduction Agreement”) pursuant to
which PFM may, but is not obligated to, temporarily reduce fees payable by Prime
Series, or any class thereof, to PFM under the Trust’s agreements with PFM at any time
the monthly distribution yield to shareholders of any class of Prime Series for the
preceding calendar month has been less than 1.00% per annum. Pursuant to the Prime
Fee Reduction Agreement, if PFM has reduced its fees as contemplated by that
agreement, Prime Series will be obligated to pay PFM, upon PFM’s request, the amount
of any fees not previously paid to PFM as a result of the fee reduction, but only if the
monthly distribution yield of the class of Prime Series making the payment was in
excess of 1.00% per annum for the calendar month preceding the payment, and subject
to the limitations that: (i) the amount to be paid to PFM in any calendar month may not
exceed 15% of the aggregate fees that would otherwise have been payable by the
respective class of Prime Series to PFM under its agreements with the Trust, as in effect
on the effective date of the Prime Fee Reduction Agreement; and (ii) any fees reduced
pursuant to the Prime Fee Reduction Agreement may only be paid to PFM during the
three-year period following the calendar month to which they relate. Any fees waived
prior to November 1, 2013 or waived pursuant to PFM’s agreement relating to the
SNAP® Program are not subject to future payment by the Funds to PFM pursuant to the
Prime Fee Reduction Agreement.
PFM Funds Semi-Annual Report | December 31, 201520
Effective January 28, 2010, the Trust entered into a Fee Reduction Agreement with
PFM, on behalf of Government Series (the “Government Fee Reduction Agreement”),
pursuant to which PFM may, but is not obligated to, temporarily reduce fees payable by
Government Series to PFM under the Trust’s agreements with PFM at any time the
monthly distribution yield to shareholders of Government Series for the preceding
calendar month has been less than 1.00% per annum. Pursuant to the Government Fee
Reduction Agreement, if PFM has reduced its fees as contemplated by that agreement,
Government Series will be obligated to pay PFM, upon PFM’s request, the amount of
any fees not previously paid to PFM as a result of the fee reduction, but only if the
monthly distribution yield of Government Series for the calendar month preceding the
payment was in excess of 1.00% per annum, and subject to the limitations that: (i) the
amount to be paid to PFM in any calendar month may not exceed 15% of the aggregate
fees that would otherwise have been payable by Government Series to PFM under its
agreements with the Trust, as in effect on the effective date of the Government Fee
Reduction Agreement; and (ii) any fees pursuant subject to the Government Fee
Reduction Agreement may only be paid to PFM during the three-year period following
the calendar month to which they relate.
In conjunction with the Transaction, PFM and the Trust entered into Fee Deferral
Agreements on behalf of Prime Series (the “Prime Fee Deferral Agreement”) and
Government Series (the “Government Fee Deferral Agreement”) to maintain in effect
the fee reduction arrangements under the Prime Fee Reduction Agreement and the
Government Fee Reduction Agreement, respectively. The Prime Fee Deferral Agreement
and the Government Fee Deferral Agreement are the same in all material respects as the
Prime Fee Reduction Agreement and Government Fee Reduction Agreement,
respectively. At such time, PFM and the Trust also entered into a fee waiver agreement
relating to Prime Series that provides that during the two-year period following June 30,
2014, aggregate fees paid to PFM by each of the SNAP Fund Class, Institutional Class
and Colorado Investors Class of Prime Series will not exceed the aggregate fees that
would have been paid to PFM by such class under the fee structure in place prior to July
1, 2014. Any fees waived by PFM pursuant to this agreement are not recoverable by
PFM under the Prime Fee Deferral Agreement. For the six months ended December 31,
2015, PFM waived $514,277 of investment advisory fees payable by Prime Series and
$1,666,137 of transfer agent fees payable by the SNAP Fund Class of Prime Series
which are not recoverable by PFM pursuant to the Prime Fee Deferral Agreement.
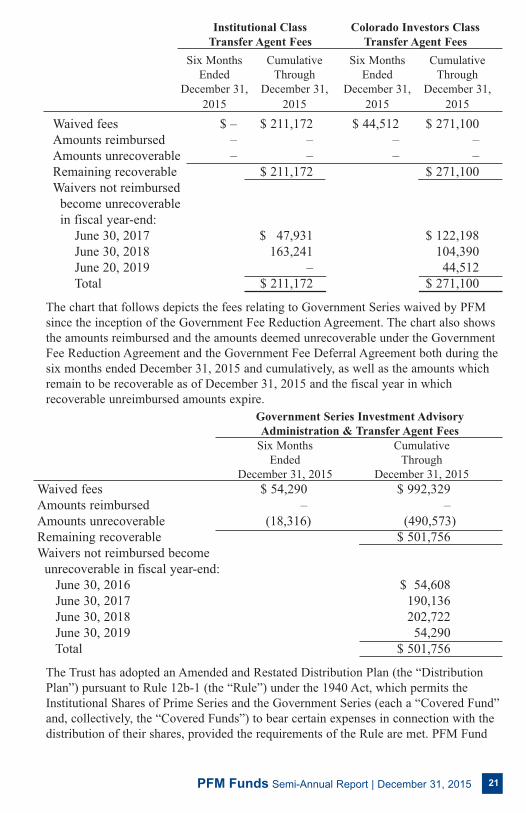
The chart that follows depicts fees relating to Prime Series waived by PFM since the
inception of the Prime Fee Reduction Agreement. The chart also shows the amounts
reimbursed and the amounts deemed unrecoverable under the Prime Fee Reduction
Agreement and the Prime Fee Deferral Agreement both during the six months ended
December 31, 2015 and cumulatively, as well as the amounts which remain recoverable
as of December 31, 2015 and the fiscal year in which recoverable unreimbursed
amounts expire.
PFM Funds Semi-Annual Report | December 31, 2015 21
Institutional Class Colorado Investors Class
Transfer Agent Fees Transfer Agent Fees
Six Months Cumulative Six Months Cumulative
Ended Through Ended Through
December 31, December 31, December 31, December 31,
2015 2015 2015 2015
Waived fees $ – $ 211,172 $ 44,512 $ 271,100
Amounts reimbursed – – – –
Amounts unrecoverable – – – –
Remaining recoverable $ 211,172 $ 271,100
Waivers not reimbursed
become unrecoverable
in fiscal year-end:
June 30, 2017 $ 47,931 $ 122,198
June 30, 2018 163,241 104,390
June 20, 2019 – 44,512
Total $ 211,172 $ 271,100
The chart that follows depicts the fees relating to Government Series waived by PFM
since the inception of the Government Fee Reduction Agreement. The chart also shows
the amounts reimbursed and the amounts deemed unrecoverable under the Government
Fee Reduction Agreement and the Government Fee Deferral Agreement both during the
six months ended December 31, 2015 and cumulatively, as well as the amounts which
remain to be recoverable as of December 31, 2015 and the fiscal year in which
recoverable unreimbursed amounts expire.
Government Series Investment Advisory
Administration & Transfer Agent Fees
Six Months Cumulative
Ended Through
December 31, 2015 December 31, 2015
Waived fees $ 54,290 $ 992,329
Amounts reimbursed – –
Amounts unrecoverable (18,316) (490,573)
Remaining recoverable $ 501,756
Waivers not reimbursed become
unrecoverable in fiscal year-end:
June 30, 2016 $ 54,608
June 30, 2017 190,136
June 30, 2018 202,722
June 30, 2019 54,290
Total $ 501,756
The Trust has adopted an Amended and Restated Distribution Plan (the “Distribution
Plan”) pursuant to Rule 12b-1 (the “Rule”) under the 1940 Act, which permits the
Institutional Shares of Prime Series and the Government Series (each a “Covered Fund”
and, collectively, the “Covered Funds”) to bear certain expenses in connection with the
distribution of their shares, provided the requirements of the Rule are met. PFM Fund
PFM Funds Semi-Annual Report | December 31, 201522
Distributors, Inc. (the “Distributor”) serves as the distributor of shares of the Funds
pursuant to a distribution agreement with the Trust. The Distributor is a wholly-owned
subsidiary of PFM. The Distribution Plan authorizes each Covered Fund to reimburse
the Distributor for expenses incurred by the Distributor in connection with the sale,
promotion and distribution of shares of each Covered Fund, in an amount not to exceed
0.25% of the Covered Fund’s average daily net asset value in any year. Any payments
made under the Plan shall be made only as determined from time to time by the Board.
For the six month period ended December 31, 2015, there were no expenses paid by the
Covered Funds pursuant to the Distribution Plan.
The Trust pays fees to its Independent Trustees and reimburses expenses incurred by
them in connection with the discharge of their duties. The Trust also pays cash
management fees and custody fees to its depository and custodian banks, audit fees,
registration fees and other expenses. During the six months ended December 31, 2015,
cash management fees payable by Prime Series were reduced by $138,000 as a result of
earnings credits from cash balances maintained with its depository bank.
The Trust has entered into agreements with various of its service providers which
provide for indemnification against losses, costs, claims and liabilities arising from the
performance of their obligations under such agreements, except for gross negligence or
bad faith. The Trust has had no claims or payments pursuant to these or prior
agreements, and the Trust’s management believes the likelihood of a claim being made
is remote.
E. GOVERNMENTAL ACCOUNTING STANDARDSUnder Governmental Accounting Standards ("GAS"), state and local governments and
other municipal entities are required to disclose credit risk, concentration of credit risk,
and interest rate risk for investment portfolios. Although the Funds are not subject to
GAS, the following risk disclosures of their investment portfolios as of December 31,
2015 have been provided for the information of shareholders.
Credit Risk
The Funds’ investment policies are outlined in the Prospectuses and are further
described in the Statements of Additional Information. The Funds may only purchase
securities that are permitted under Virginia law for counties, cities, towns, political
subdivisions and public bodies of the Commonwealth of Virginia. A Fund may not buy
any voting securities, any instrument or security from any issuer which, by its nature,
would constitute characteristics of equity ownership and equity risks, any commodities
or commodity contracts, any mineral related programs or leases, any warrants, or any
real estate or any non-liquid interests in real estate trusts. Government Series’
investment policy further prohibits investing in commercial paper, corporate notes and
bonds, obligations of banks and municipal notes and bonds, other than those guaranteed
by the U.S. government or agencies or instrumentalities thereof.
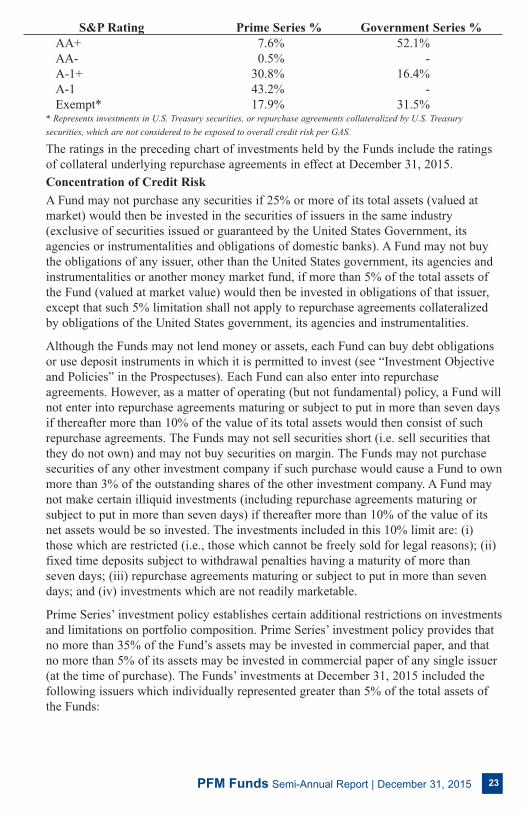
As of December 31, 2015, the Funds’ investment portfolios were comprised of
investments which were, in aggregate, rated by Standard and Poor’s (“S&P”) as follows:
PFM Funds Semi-Annual Report | December 31, 2015 23
S&P Rating Prime Series % Government Series %
AA+ 7.6% 52.1%
AA- 0.5% -
A-1+ 30.8% 16.4%
A-1 43.2% -
Exempt* 17.9% 31.5%* Represents investments in U.S. Treasury securities, or repurchase agreements collateralized by U.S. Treasurysecurities, which are not considered to be exposed to overall credit risk per GAS.
The ratings in the preceding chart of investments held by the Funds include the ratings
of collateral underlying repurchase agreements in effect at December 31, 2015.
Concentration of Credit Risk
A Fund may not purchase any securities if 25% or more of its total assets (valued at
market) would then be invested in the securities of issuers in the same industry
(exclusive of securities issued or guaranteed by the United States Government, its
agencies or instrumentalities and obligations of domestic banks). A Fund may not buy
the obligations of any issuer, other than the United States government, its agencies and
instrumentalities or another money market fund, if more than 5% of the total assets of
the Fund (valued at market value) would then be invested in obligations of that issuer,
except that such 5% limitation shall not apply to repurchase agreements collateralized
by obligations of the United States government, its agencies and instrumentalities.
Although the Funds may not lend money or assets, each Fund can buy debt obligations
or use deposit instruments in which it is permitted to invest (see “Investment Objective
and Policies” in the Prospectuses). Each Fund can also enter into repurchase
agreements. However, as a matter of operating (but not fundamental) policy, a Fund will
not enter into repurchase agreements maturing or subject to put in more than seven days
if thereafter more than 10% of the value of its total assets would then consist of such
repurchase agreements. The Funds may not sell securities short (i.e. sell securities that
they do not own) and may not buy securities on margin. The Funds may not purchase
securities of any other investment company if such purchase would cause a Fund to own
more than 3% of the outstanding shares of the other investment company. A Fund may
not make certain illiquid investments (including repurchase agreements maturing or
subject to put in more than seven days) if thereafter more than 10% of the value of its
net assets would be so invested. The investments included in this 10% limit are: (i)
those which are restricted (i.e., those which cannot be freely sold for legal reasons); (ii)
fixed time deposits subject to withdrawal penalties having a maturity of more than
seven days; (iii) repurchase agreements maturing or subject to put in more than seven
days; and (iv) investments which are not readily marketable.
Prime Series’ investment policy establishes certain additional restrictions on investments
and limitations on portfolio composition. Prime Series’ investment policy provides that
no more than 35% of the Fund’s assets may be invested in commercial paper, and that
no more than 5% of its assets may be invested in commercial paper of any single issuer
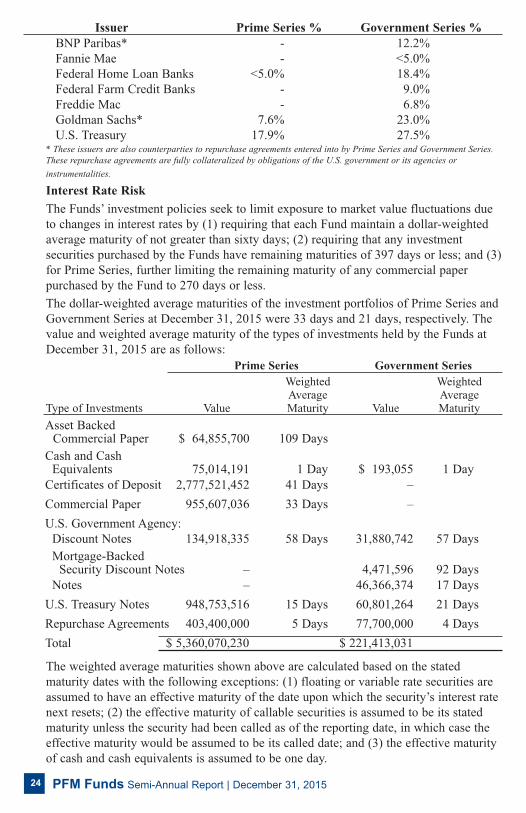
(at the time of purchase). The Funds’ investments at December 31, 2015 included the
following issuers which individually represented greater than 5% of the total assets of
the Funds:
PFM Funds Semi-Annual Report | December 31, 201524
Issuer Prime Series % Government Series %
BNP Paribas* - 12.2%
Fannie Mae - <5.0%
Federal Home Loan Banks <5.0% 18.4%
Federal Farm Credit Banks - 9.0%
Freddie Mac - 6.8%
Goldman Sachs* 7.6% 23.0%
U.S. Treasury 17.9% 27.5%* These issuers are also counterparties to repurchase agreements entered into by Prime Series and Government Series.These repurchase agreements are fully collateralized by obligations of the U.S. government or its agencies orinstrumentalities.
Interest Rate Risk
The Funds’ investment policies seek to limit exposure to market value fluctuations due
to changes in interest rates by (1) requiring that each Fund maintain a dollar-weighted
average maturity of not greater than sixty days; (2) requiring that any investment
securities purchased by the Funds have remaining maturities of 397 days or less; and (3)
for Prime Series, further limiting the remaining maturity of any commercial paper
purchased by the Fund to 270 days or less.
The dollar-weighted average maturities of the investment portfolios of Prime Series and
Government Series at December 31, 2015 were 33 days and 21 days, respectively. The
value and weighted average maturity of the types of investments held by the Funds at
December 31, 2015 are as follows:
Prime Series Government Series
Weighted WeightedAverage Average
Type of Investments Value Maturity Value Maturity
Asset Backed Commercial Paper $ 64,855,700 109 Days
Cash and Cash Equivalents 75,014,191 1 Day $ 193,055 1 Day
Certificates of Deposit 2,777,521,452 41 Days –
Commercial Paper 955,607,036 33 Days –
U.S. Government Agency:
Discount Notes 134,918,335 58 Days 31,880,742 57 Days
Mortgage-Backed Security Discount Notes – 4,471,596 92 Days
Notes – 46,366,374 17 Days
U.S. Treasury Notes 948,753,516 15 Days 60,801,264 21 Days
Repurchase Agreements 403,400,000 5 Days 77,700,000 4 Days
Total $ 5,360,070,230 $ 221,413,031
The weighted average maturities shown above are calculated based on the stated
maturity dates with the following exceptions: (1) floating or variable rate securities are
assumed to have an effective maturity of the date upon which the security’s interest rate
next resets; (2) the effective maturity of callable securities is assumed to be its stated
maturity unless the security had been called as of the reporting date, in which case the
effective maturity would be assumed to be its called date; and (3) the effective maturity
of cash and cash equivalents is assumed to be one day.

PFM Funds Semi-Annual Report | December 31, 2015 25
PFM FUNDS BOARD OF TRUSTEES, OFFICERS AND ADVISORY BOARD(UNAUDITED)
Under the Trust’s Declaration of Trust, each Trustee holds office until his successor is
elected and qualified or until earlier resignation or removal. Vacancies on the Board may
be filled by the remaining Board members subject to restrictions imposed by the 1940
Act, which are described in the Funds’ Statements of Additional Information.
The following table sets forth information about the Trust’s Trustees, Officers and
Advisory Board Members.
Name, Position Held with Trust, Principal Occupation(s) During the Past Five Years (Number of Portfolios(Served Since), Birthyear, Other in Fund Complex Overseen by Independent Trustee)Directorships Held
INDEPENDENT TRUSTEES
Robert R. SedivyTrustee (1996), Chairman of the Board (2008)Birthyear: 1946Other directorships: Wakefield School
Jeffrey A. LaineTrustee (1986), Chairman of the Audit Committee (2008)Birthyear: 1957 Other directorships: None
Michael P. FlanaganTrustee (2008), Chairman of the Nominating and Governance Committee (2009)Birthyear: 1949 Other directorships: Michigan Virtual University, Michigan Public School Employees Retirement System, RegionalEducational Laboratory Midwest (Chairman)
Larry W. DavenportTrustee (2012), Advisory Board Member (1995-2012)Birthyear: 1946Other directorships: None
Brian M. MarcelTrustee (2008)Birthyear: 1962Other directorships: Michigan LiquidAsset Fund Plus
Joseph W. WhiteTrustee (2008)Birthyear: 1958Other directorships: None
Retired, 2008; Vice President-Finance and Treasurer, The CollegiateSchool, Richmond, Virginia, 1988 to 2008; (2)
President, Commonwealth Financial Group, 1994 to present;President, Laine Financial Group, Inc. (an investment advisory firm)1992 to present; former President and Treasurer of the Trust (1986to 2008); (2)
Retired State Superintendent of Education, State of Michigan,2005 to 2015; (2)
Retired Director of Finance, Hampton Roads Transit, Virginia, 2004to 2010; (2)
Assistant Superintendent Business Services, WashtenawIntermediate School District, 1994 to present; (2)
Chief Accounting Officer, Molina Healthcare, Inc., 2003 to present;(2)

PFM Funds Semi-Annual Report | December 31, 201526
President, Manager and Managing Director, PFM Asset Management LLC,2001 to present; President and Director, PFM Fund Distributors, Inc., 2001to present; Treasurer and Director, Public Financial Management, Inc. (afinancial advisory firm) 1986 to present; Vice President and Manager, PFMI, LLC, 2009 to present; (2)
Managing Director, PFM Asset Management LLC, 2001 to present; (2)
Secretary and Managing Director, PFM Asset Management LLC, 2001 topresent; Secretary, PFM Fund Distributors, Inc., 2001 to present; (2)
Managing Director, PFM Asset Management LLC, 2001 to present; (2)
Chief Compliance Officer and Managing Director, PFM Asset ManagementLLC, 2011 to present; Vice President – Chief Compliance Officer, PrudentialInvestment Management, 2008 to 2011; (2)
OFFICERS AND AFFILIATED TRUSTEES
Martin P. MargolisTrustee (1996) & President (2008)Birthyear: 1944 Other directorships: None
Barbara L. FavaVice President (2008)Birthyear: 1959Other directorships: None
Debra J. GoodnightTreasurer (2007)Birthyear: 1955 Other directorships: None
Daniel R. HessSecretary (2012)and Assistant Treasurer (2007)Birthyear: 1974 Other directorships: None
Leo J. KarwejnaChief Compliance Officer (2012)Birthyear: 1976 Other directorships: None
Name, Position Held with Trust, Principal Occupation(s) During the Past Five Years (Number of Portfolios(Served Since), Birthyear, Other in Fund Complex Overseen by Officer/Affiliated Trustee/Advisory BoardDirectorships Held Member)
ADVISORY BOARD MEMBER
Bruce A. Lebsack, CGMAAdvisory Board Member (2012)Birthyear: 1953Other directorships: None
Director of Finance and Administration and Chief Financial Officer,Highlands Ranch Metropolitan Districts and Centennial Water andSanitation District, Colorado, 1981 to present; (2)
PFM Funds Semi-Annual Report | December 31, 2015 27
Each Trustee who is not an “interested person,” as defined by the 1940 Act, of the
Trust (an “Independent Trustee”) receives from the Trust an annual retainer of
$8,000 plus $750 for each meeting attended in person and $500 for each meeting
attended by telephone. The Chairman of the Trust and the Chairman of each
committee of the Board receives an additional $1,500 retainer. The Trust does not
pay retirement or pension benefits to any of its officers or the Trustees and does not
pay compensation to officers of the Trust affiliated with the Adviser or the
Distributor. Members of the Advisory Board receive no compensation from the
Trust.
The Board has established an Audit Committee, which consists solely of Independent
Trustees, and which operates in accordance with the Committee's charter. The Audit
Committee is designed to: oversee the accounting and financial reporting policies and
practices and internal controls of the Trust and, as appropriate, the internal controls of
certain service providers to the Trust; oversee the quality and objectivity of the Trust’s
financial statements and the independent audit thereof; act as a liaison between the
Trust’s independent registered public accounting firm and the full Board; and undertake
such other functions as the Board may deem appropriate from time to time. The Audit
Committee met once during the six months ended December 31, 2015.
The Board has established a Nominating and Governance Committee, which operates in
accordance with the Committee’s charter and consists solely of Independent Trustees.
The Nominating and Governance Committee’s function is to oversee the composition
and governance of the Board and its various committees. The Nominating and
Governance Committee met once during the six months ended December 31, 2015.
The mailing address of each Trustee, Officer and Advisory Board Member is One
Keystone Plaza, Suite 300, North Front & Market Streets, Harrisburg, PA 17101.
The Funds’ Statements of Additional Information (“SAI”) include additional information
about the Trustees, Officers and Advisory Board Members, and are available, without
charge, upon request by calling (800) 338-3383.
PFM Funds Semi-Annual Report | December 31, 201528
INFORMATION ABOUT FUND EXPENSES (UNAUDITED)
As a shareholder of a Fund, it is important for you to understand the costs associated
with your investment. Mutual fund costs can generally be categorized as two types:
(1) transaction costs, including sales charges (loads) on purchase payments,
redemption fees and exchange fees; and (2) ongoing costs, including management
fees, distribution (12b-1) fees and other fund expenses. The Funds do not charge
their shareholders transaction-based fees; however, as with all mutual funds, the
Funds do incur operating expenses. So when invested in a Fund, you will incur
ongoing costs, including management fees and other operating expenses of the Fund.
The example in the table that follows is intended to help you understand your ongoing
costs (in dollars) of investing in the Funds and to compare these costs with the ongoing
costs of investing in other mutual funds. This example is based on an investment of
$1,000 invested at the beginning of the period and held for the six months ended
December 31, 2015. This example illustrates the Funds’ expenses in two ways:
Actual Returns and Expenses The first section of the table below provides information
to help you estimate the actual dollar amount of ongoing expenses (but not transaction
costs) you paid on a $1,000 investment in a Fund using that Fund’s actual return during
the period. Simply divide your account value by $1,000, then multiply the result by the
number in the line under the heading titled “Expenses Paid per $1,000 During Period”
to estimate the expenses you paid on your account with the Fund during this period.
Hypothetical 5% Returns and Actual Expenses The second section of the table below
is intended to help you compare your Fund’s ongoing expenses (but not transaction
costs) with those of other mutual funds using the Fund’s actual expense ratio and a
hypothetical rate of return of 5% per year before expenses. This is not the Fund’s actual
rates of return, but is useful in making comparisons of the costs of investing in the
Funds and other mutual funds. To do so, compare this 5% hypothetical cost with the
actual fund expenses and 5% hypothetical cost examples that appear in the shareholder
reports of other mutual funds.
PFM Funds Semi-Annual Report | December 31, 2015 29
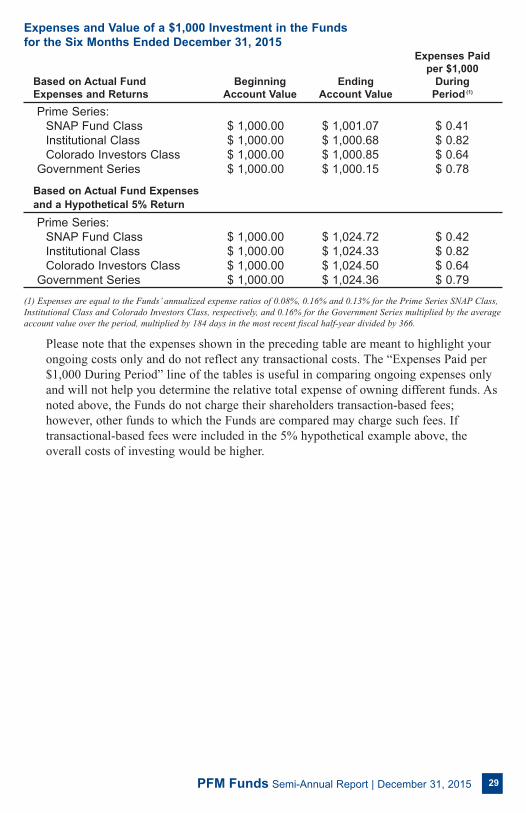
Expenses and Value of a $1,000 Investment in the Fundsfor the Six Months Ended December 31, 2015
Expenses Paidper $1,000
Based on Actual Fund Beginning Ending DuringExpenses and Returns Account Value Account Value Period (1)
Prime Series: SNAP Fund Class $ 1,000.00 $ 1,001.07 $ 0.41Institutional Class $ 1,000.00 $ 1,000.68 $ 0.82Colorado Investors Class $ 1,000.00 $ 1,000.85 $ 0.64
Government Series $ 1,000.00 $ 1,000.15 $ 0.78
Based on Actual Fund Expenses
and a Hypothetical 5% Return
Prime Series: SNAP Fund Class $ 1,000.00 $ 1,024.72 $ 0.42Institutional Class $ 1,000.00 $ 1,024.33 $ 0.82Colorado Investors Class $ 1,000.00 $ 1,024.50 $ 0.64
Government Series $ 1,000.00 $ 1,024.36 $ 0.79
(1) Expenses are equal to the Funds’ annualized expense ratios of 0.08%, 0.16% and 0.13% for the Prime Series SNAP Class,Institutional Class and Colorado Investors Class, respectively, and 0.16% for the Government Series multiplied by the averageaccount value over the period, multiplied by 184 days in the most recent fiscal half-year divided by 366.
Please note that the expenses shown in the preceding table are meant to highlight your
ongoing costs only and do not reflect any transactional costs. The “Expenses Paid per
$1,000 During Period” line of the tables is useful in comparing ongoing expenses only
and will not help you determine the relative total expense of owning different funds. As
noted above, the Funds do not charge their shareholders transaction-based fees;
however, other funds to which the Funds are compared may charge such fees. If
transactional-based fees were included in the 5% hypothetical example above, the
overall costs of investing would be higher.
PFM Funds
Investment Adviser,
Administrator &
Transfer AgentPFM Asset Management LLCOne Keystone Plaza, Suite 300
North Front & Market Streets
Harrisburg, Pennsylvania 17101-2044
DistributorPFM Fund Distributors, Inc.One Keystone Plaza, Suite 300
North Front & Market Streets
Harrisburg, Pennsylvania 17101-2044
CustodianWells Fargo Bank, N.A.608 2nd Avenue South
Minneapolis, Minnesota 55479
Depository BankU.S. Bank, N.A. 60 Livingston Avenue
St. Paul, Minnesota 55107
Independent Registered
Public Accounting FirmErnst & Young LLPOne Commerce Square, Suite 700
2005 Market Street
Philadelphia, Pennsylvania 19103
Legal CounselSchulte Roth & Zabel LLP919 Third Avenue
New York, New York 10022
One Keystone Plaza, Suite 300
North Front & Market Streets
Harrisburg, Pennsylvania 17101-2044
1-800-338-33834694 • 2/16