December 15, 2010 | Fourth Quarter Fiscal 2010 Investor Presentation Nordson Corporation Precision...
25
December 15, 2010 | Fourth Quarter Fiscal 2010 Investor Presentation Nordson Corporation Precision Technology Solutions Dispensing - Test & Inspection - Surface Preparation : NDSN
-
Upload
grant-jennings -
Category
Documents
-
view
214 -
download
0
Transcript of December 15, 2010 | Fourth Quarter Fiscal 2010 Investor Presentation Nordson Corporation Precision...
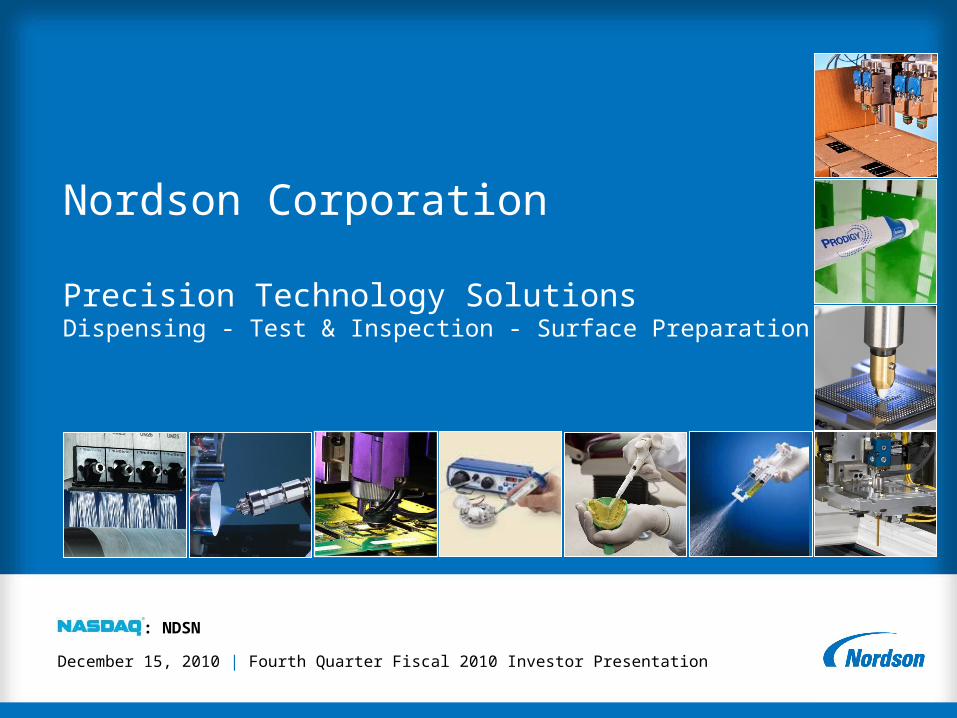
December 15, 2010 | Fourth Quarter Fiscal 2010 Investor Presentation
Nordson Corporation
Precision Technology SolutionsDispensing - Test & Inspection - Surface Preparation
: NDSN
2
Safe Harbor Statement Under the Private Securities Litigation Reform Act of 1995
Information in this presentation may contain “forward-looking statements,” as defined by this Reform Act. These statements are identified by words or phrases such as “are expected to,” “will likely result,” “is anticipated,” “estimates,” “will continue,” “outlook,” “project,” or similar expressions.
These forward looking statements are based on current expectations and involve risks and uncertainties. Consequently, Nordson Corporation’s actual results could differ materially from the expectations expressed in the forward-looking statements. Factors that could cause the Company’s actual results to differ materially from the expected results include, but are not limited to: fluctuations in currency exchange rates; a sales mix different from assumptions; deferral of orders; customer-requested delays in system installations; and unanticipated delays.
DISCONTINUED OPERATIONSAll numbers for years prior to FY 2006 in this presentation include results from discontinued operations unless otherwise noted.
3
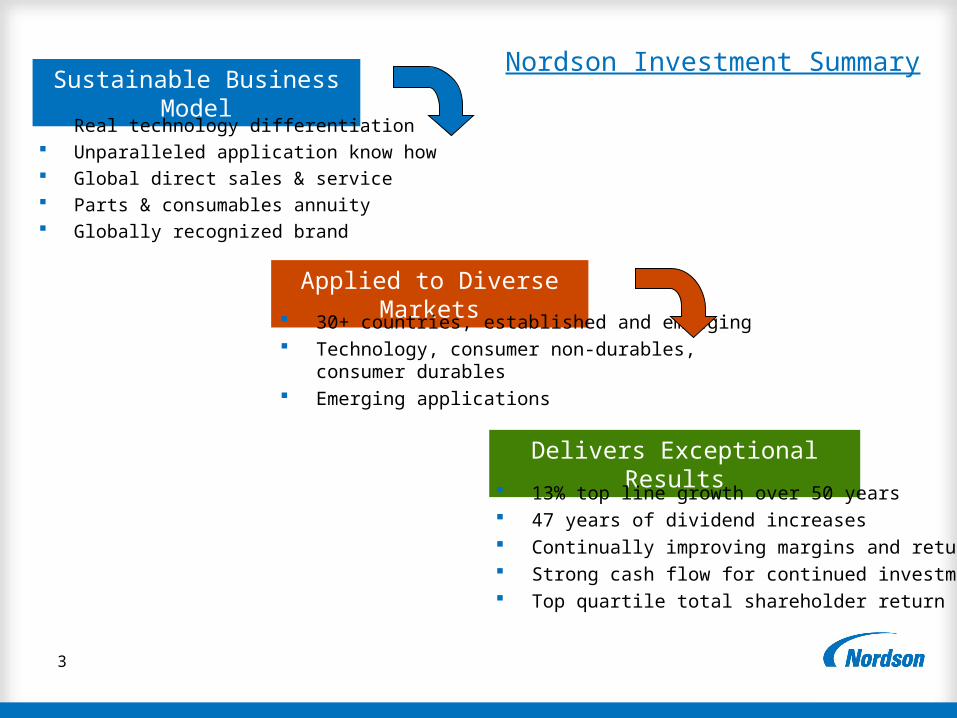
Nordson Investment SummarySustainable Business Model
Real technology differentiation Unparalleled application know how Global direct sales & service Parts & consumables annuity Globally recognized brand
Applied to Diverse Markets
30+ countries, established and emerging Technology, consumer non-durables,
consumer durables Emerging applications
Delivers Exceptional Results
13% top line growth over 50 years 47 years of dividend increases Continually improving margins and returns Strong cash flow for continued investment Top quartile total shareholder return
4
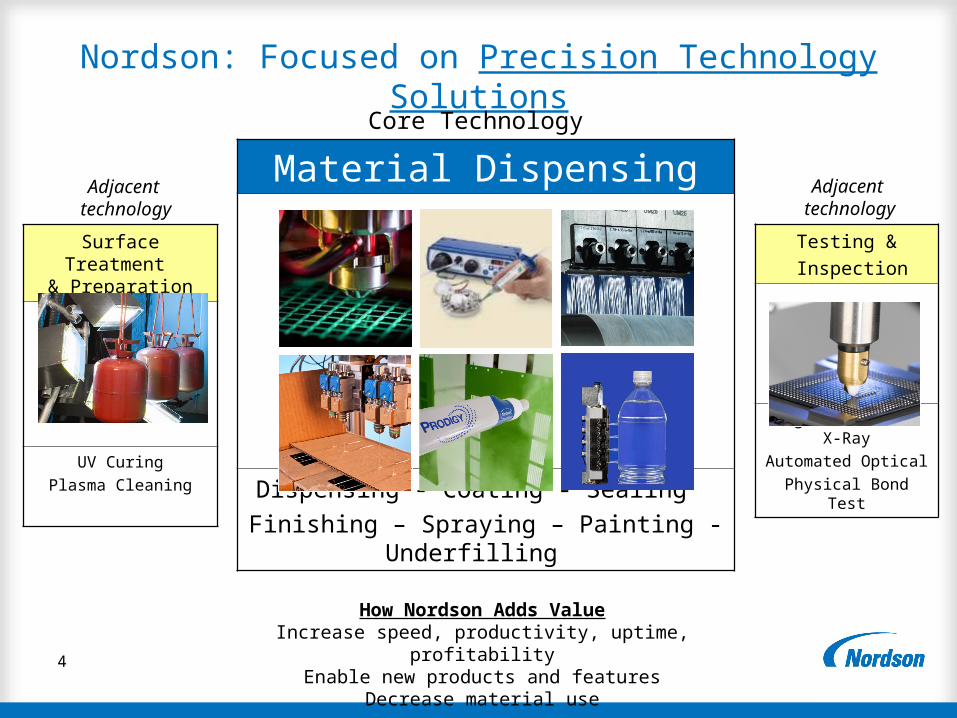
Nordson: Focused on Precision Technology Solutions
Surface Treatment & Preparation
UV Curing
Plasma Cleaning
Material Dispensing
Dispensing - Coating - Sealing
Finishing – Spraying – Painting - Underfilling
Core Technology
Adjacent technology
Adjacent technology
Testing &
Inspection
High Resolution X-Ray
Automated Optical
Physical Bond Test
How Nordson Adds ValueIncrease speed, productivity, uptime, profitability
Enable new products and featuresDecrease material use
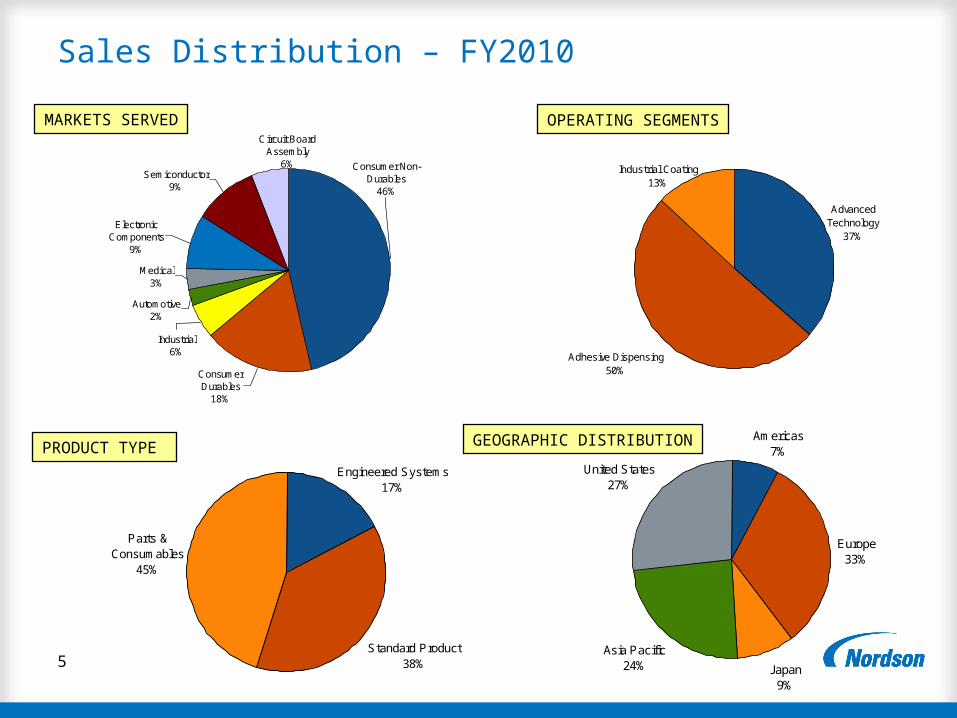
5Standard Product
38%
Parts & Consumables
45%
Engineered Systems17%
Sales Distribution – FY2010
Europe33%
Japan9%
Asia Pacific24%
United States27%
Americas7%
Adhesive Dispensing50%
Industrial Coating13%
Advanced Technology
37%
OPERATING SEGMENTS
PRODUCT TYPE GEOGRAPHIC DISTRIBUTION
Consumer Non-Durables
46%
Automotive2%
Consumer Durables
18%
Industrial6%
Medical3%
Electronic Components
9%
Semiconductor9%
Circuit Board Assembly
6%
MARKETS SERVED
6
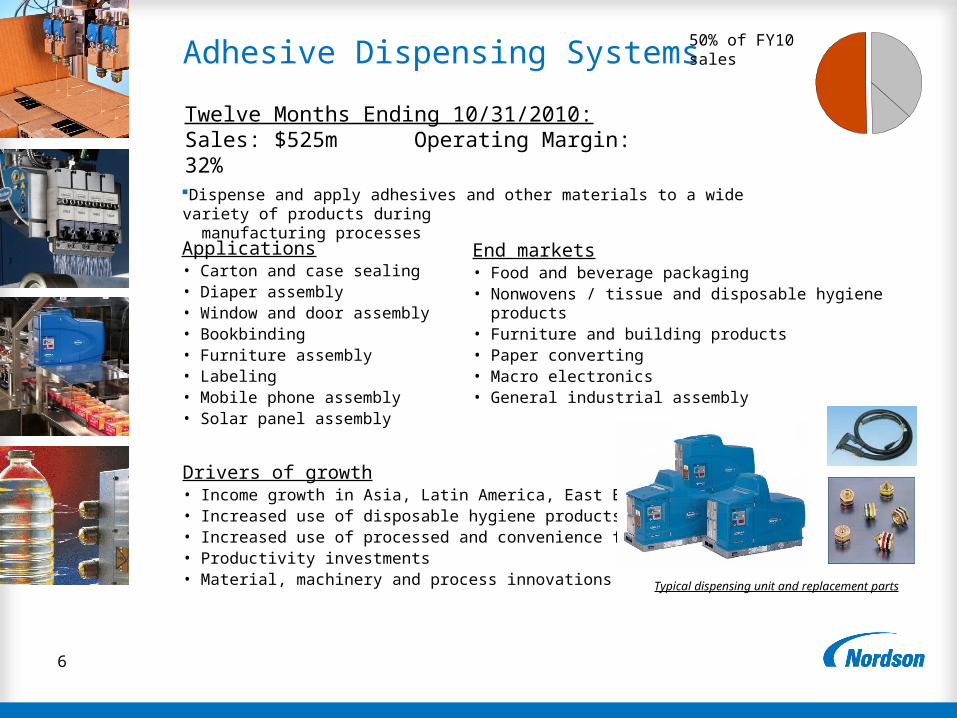
Adhesive Dispensing Systems
End markets• Food and beverage packaging• Nonwovens / tissue and disposable hygiene products• Furniture and building products• Paper converting• Macro electronics• General industrial assembly
Applications• Carton and case sealing• Diaper assembly• Window and door assembly• Bookbinding• Furniture assembly• Labeling• Mobile phone assembly• Solar panel assembly
50% of FY10 sales
Twelve Months Ending 10/31/2010:Sales: $525m Operating Margin: 32%
Drivers of growth• Income growth in Asia, Latin America, East Europe• Increased use of disposable hygiene products • Increased use of processed and convenience foods• Productivity investments• Material, machinery and process innovations
Dispense and apply adhesives and other materials to a wide variety of products during manufacturing processes
Typical dispensing unit and replacement parts
7
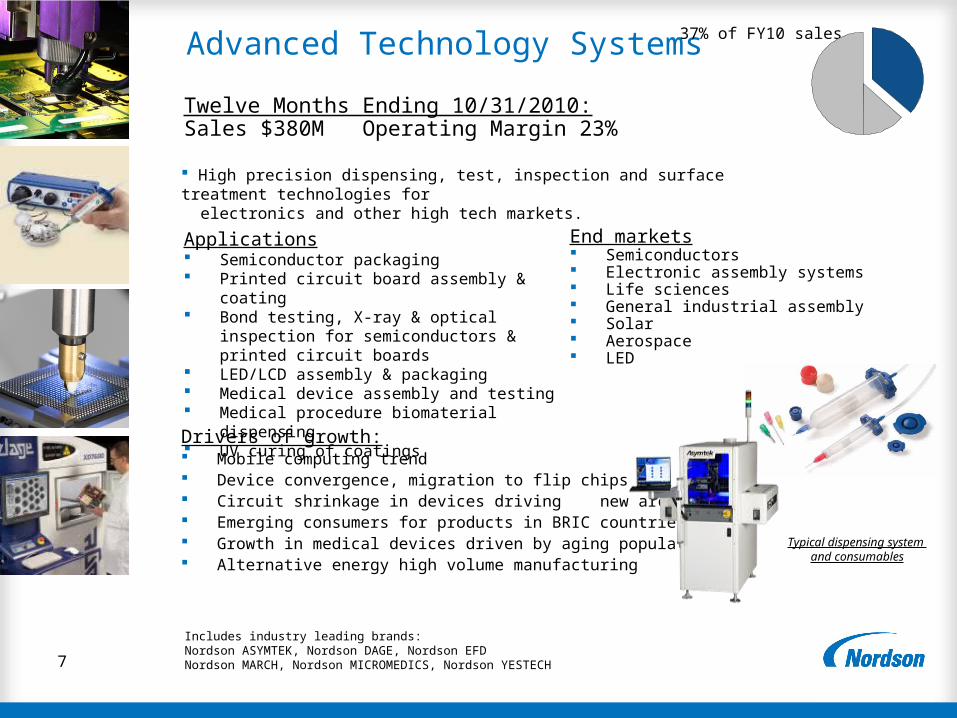
Advanced Technology Systems
End markets Semiconductors Electronic assembly systems Life sciences General industrial assembly Solar Aerospace LED
Applications Semiconductor packaging Printed circuit board assembly & coating Bond testing, X-ray & optical inspection for
semiconductors & printed circuit boards LED/LCD assembly & packaging Medical device assembly and testing Medical procedure biomaterial dispensing UV curing of coatings
Twelve Months Ending 10/31/2010: Sales $380M Operating Margin 23%
Drivers of growth: Mobile computing trend Device convergence, migration to flip chips Circuit shrinkage in devices driving new architectures Emerging consumers for products in BRIC countries Growth in medical devices driven by aging population Alternative energy high volume manufacturing
High precision dispensing, test, inspection and surface treatment technologies for electronics and other high tech markets.
Typical dispensing system
and consumables
37% of FY10 sales
Includes industry leading brands:Nordson ASYMTEK, Nordson DAGE, Nordson EFDNordson MARCH, Nordson MICROMEDICS, Nordson YESTECH

8
Industrial Coating Systems
End markets: Appliance Office furniture Outdoor products Automobile assembly Food & beverage containers Disposable batteries
Applications: Powder finishing Liquid finishing Metal container inside coating Battery inside coating Automobile sealing & bonding
13% of FY10 sales
Twelve Months Ending 10/31/2010:Sales $136m Operating margin 9%
Drivers of growth: Environmental advantages of powder coatings Productivity investments Lean manufacturing Quick color change Growth in emerging markets
Equipment and systems to apply paints, sealants, coatings and other materials to a
wide range of products
Typical products, systems and replacement parts
9
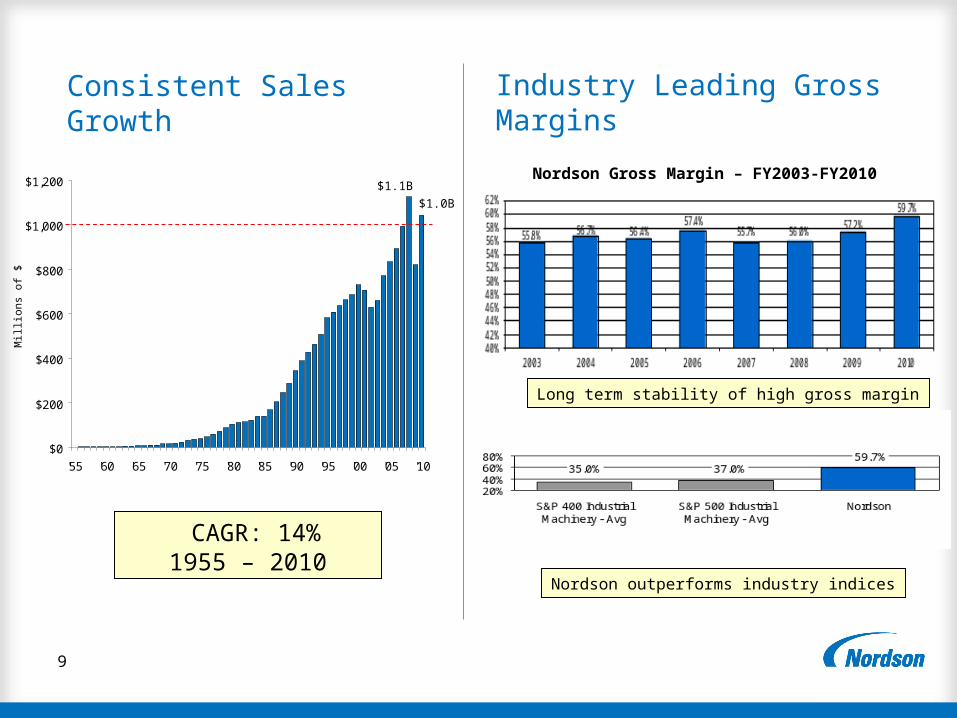
Consistent Sales Growth
$0
$200
$400
$600
$800
$1,000
$1,200
'55 '60 '65 '70 '75 '80 '85 '90 '95 '00 '05 '10
CAGR: 14%1955 – 2010
$1.1B
$1.0B
Nordson Gross Margin – FY2003-FY2010
Industry Leading Gross Margins
Long term stability of high gross margin
Nordson outperforms industry indices
Mill
ions
of
$

10
Operating Margin 2002-2010
0%
5%
10%
15%
20%
25%
30%
2002 2003 2004 2005 2006 2007 2008 2009* 2010 Q1 09 Q2 09 Q3 09 Q409*
Q1 10 Q2 10 Q3 10 Q4 10
FY 2009Continuous Improvement
FY 2010Continuous Improvement
23%
25%
9%
*FY09 excludes non-cash charges for impairment of goodwill and other long-lived assets.
11
$0
$50,000
$100,000
$150,000
$200,000
$250,000
$300,000
2003 2004 2005 2006 2007 2008 2009 2010
$0
$10,000
$20,000
$30,000
$40,000
$50,000
$60,000
$70,000
2003 2004 2005 2006 2007 2008 2009*
2010
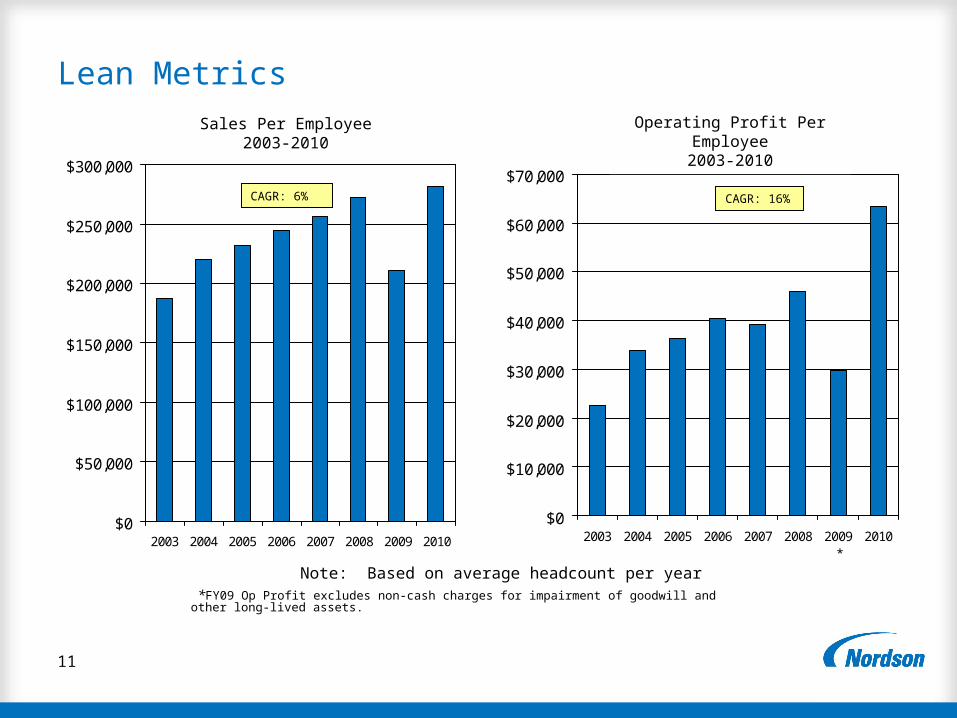
Lean Metrics
Note: Based on average headcount per year
CAGR: 6% CAGR: 16%
*FY09 Op Profit excludes non-cash charges for impairment of goodwill and other long-lived assets.
Sales Per Employee2003-2010
Operating Profit Per Employee2003-2010
12
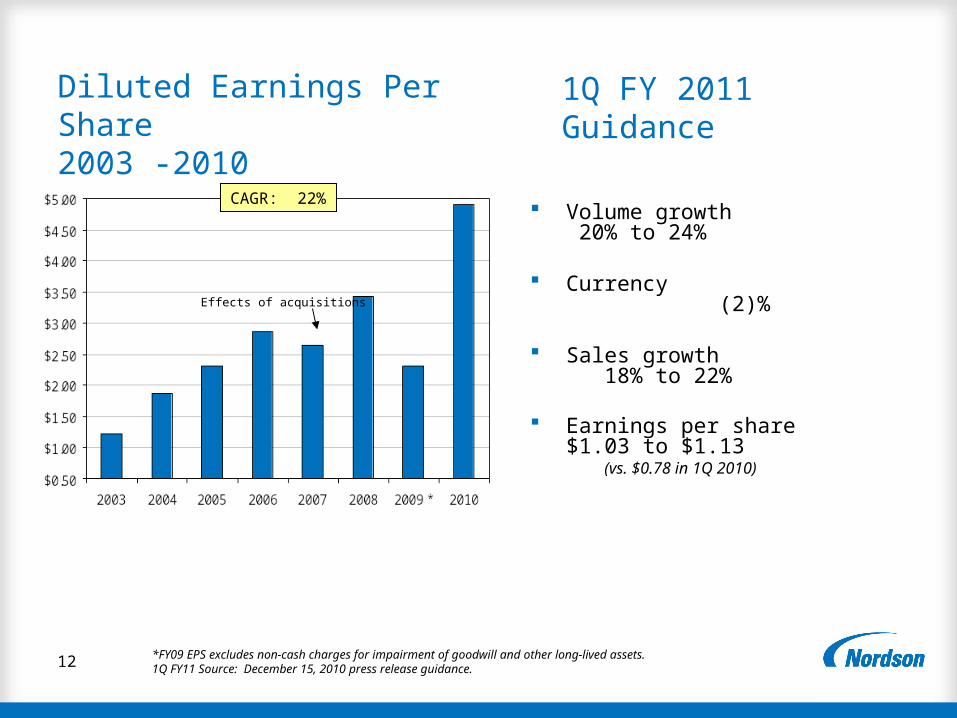
Diluted Earnings Per Share2003 -2010
CAGR: 22%
Effects of acquisitions
*FY09 EPS excludes non-cash charges for impairment of goodwill and other long-lived assets.1Q FY11 Source: December 15, 2010 press release guidance.
Volume growth 20% to 24%
Currency (2)%
Sales growth 18% to 22%
Earnings per share $1.03 to $1.13 (vs. $0.78 in 1Q 2010)
1Q FY 2011Guidance
13
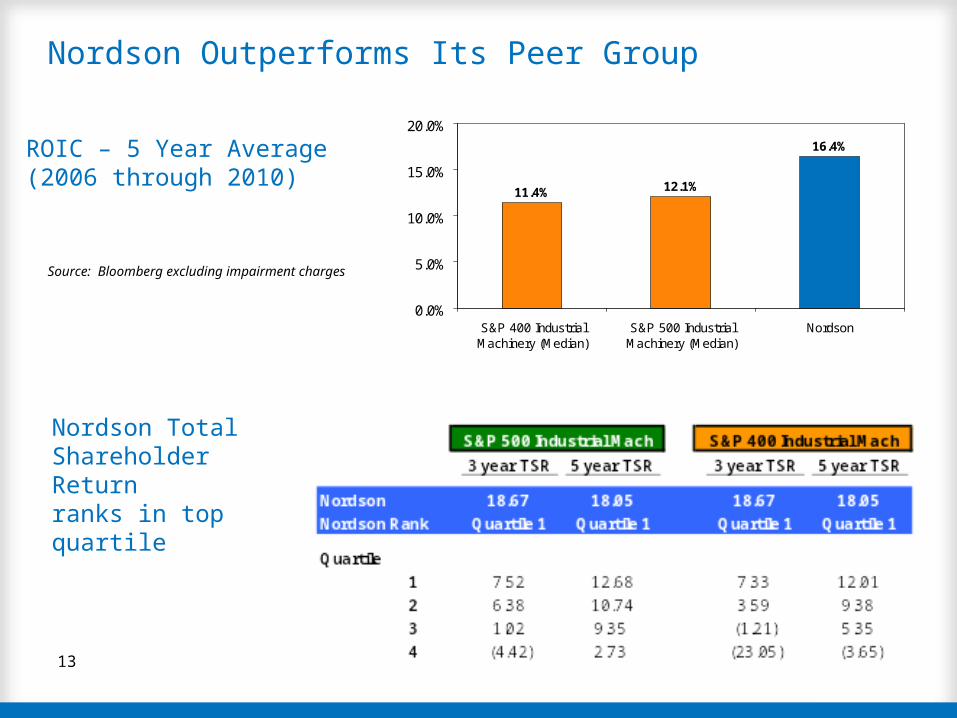
Nordson Outperforms Its Peer Group
Nordson Total Shareholder Return ranks in top quartile
11.4% 12.1%
16.4%
0.0%
5.0%
10.0%
15.0%
20.0%
S&P 400 IndustrialMachinery (Median)
S&P 500 IndustrialMachinery (Median)
Nordson
Source: Bloomberg excluding impairment charges
ROIC – 5 Year Average (2006 through 2010)
14
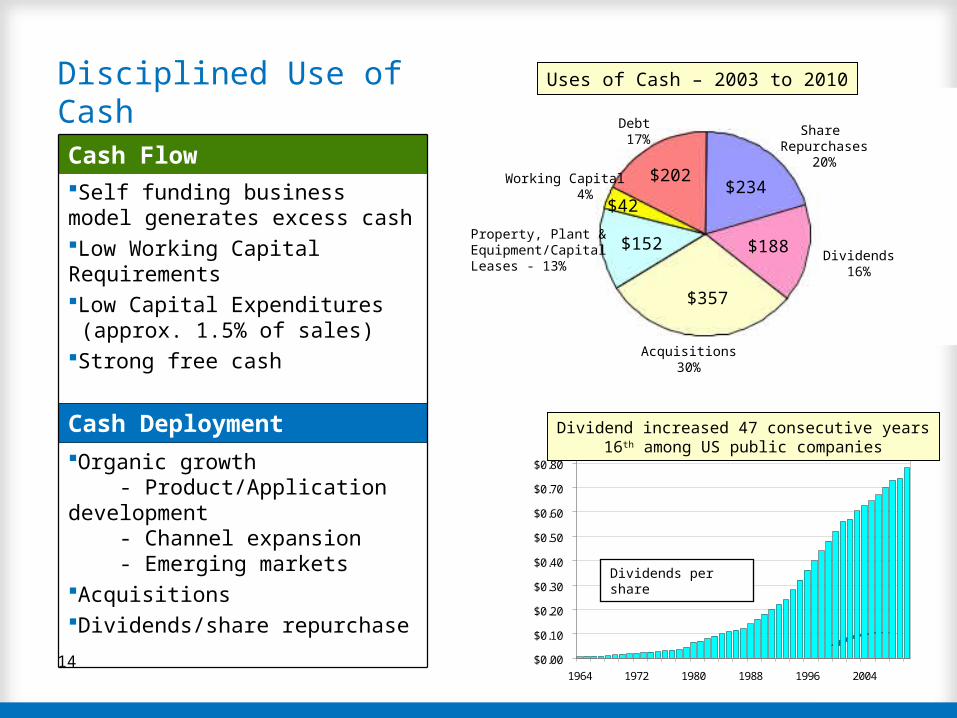
Cash FlowSelf funding business model generates excess cashLow Working Capital RequirementsLow Capital Expenditures (approx. 1.5% of sales)Strong free cash
Cash DeploymentOrganic growth - Product/Application development - Channel expansion - Emerging marketsAcquisitionsDividends/share repurchase
$0.00
$0.10
$0.20
$0.30
$0.40
$0.50
$0.60
$0.70
$0.80
1964 1972 1980 1988 1996 2004
Dividends per share
Uses of Cash – 2003 to 2010
Dividends16%
Property, Plant & Equipment/CapitalLeases - 13%
Acquisitions30%
Share Repurchases
20%
Debt 17%
Working Capital 4% $234
$188
$357
$152
$42
$202
Dividend increased 47 consecutive years16th among US public companies
Disciplined Use of Cash
15
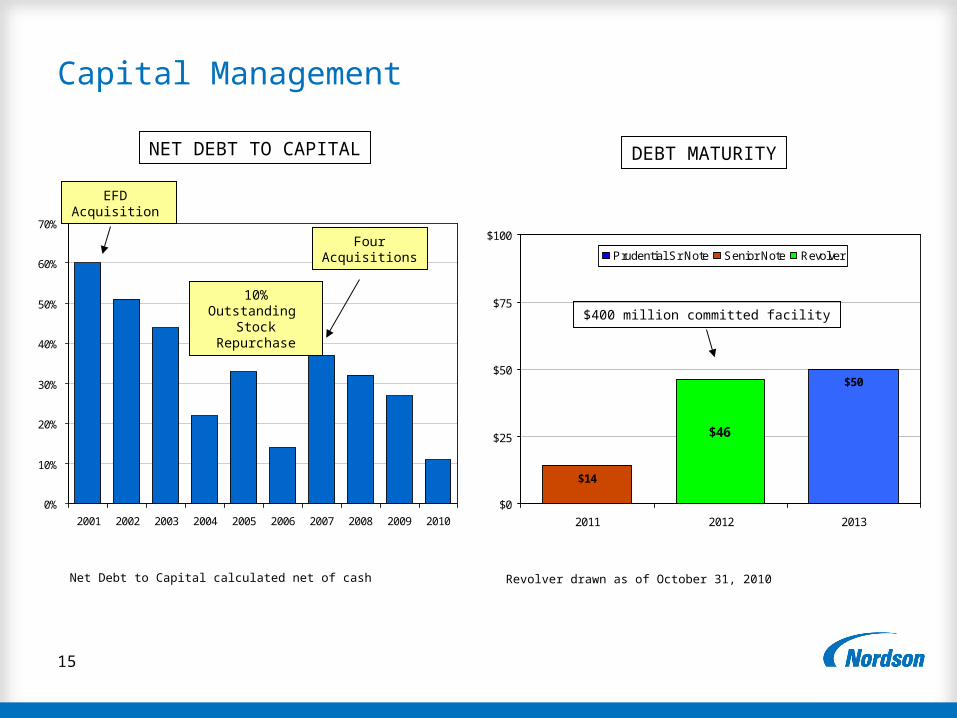
Capital Management
0%
10%
20%
30%
40%
50%
60%
70%
2001 2002 2003 2004 2005 2006 2007 2008 2009 2010
FourAcquisitions
10% Outstanding Stock Repurchase
$50
$14
$46
$0
$25
$50
$75
$100
2011 2012 2013
Prudential Sr Note Senior Note Revolver
DEBT MATURITYNET DEBT TO CAPITAL
EFD Acquisition
$400 million committed facility
Net Debt to Capital calculated net of cash Revolver drawn as of October 31, 2010
16
2011 Priorities
Expand capability in emerging markets Expand emerging applications (LED, solar, life sciences) Accelerate and extend innovation/differentiation Continue to develop more robust M&A pipeline
Maintain structural improvements Augment with next phase of continuous improvement Improve performance over cycle - reduce cyclicality Enhanced acquisition process Improve talent management program
Growth
Performance
17
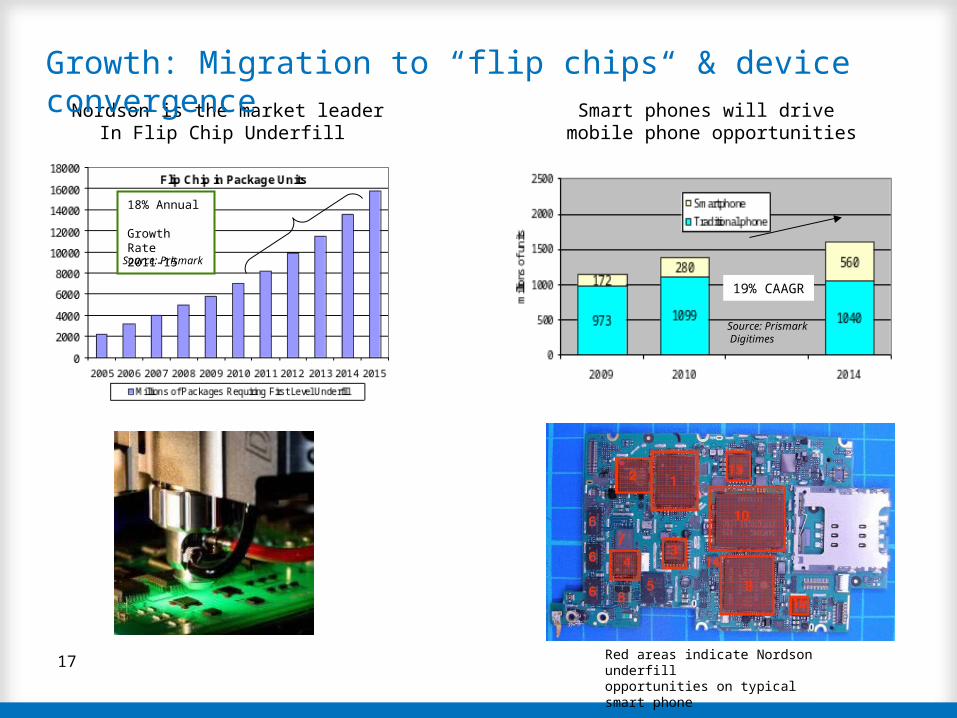
Nordson is the market leaderIn Flip Chip Underfill
18% Annual Growth Rate2011-15
Source: Prismark
Growth: Migration to “flip chips“ & device convergence
19% CAAGR
Source: Prismark Digitimes
Red areas indicate Nordson underfill
opportunities on typical smart phone
Smart phones will drive mobile phone opportunities
18
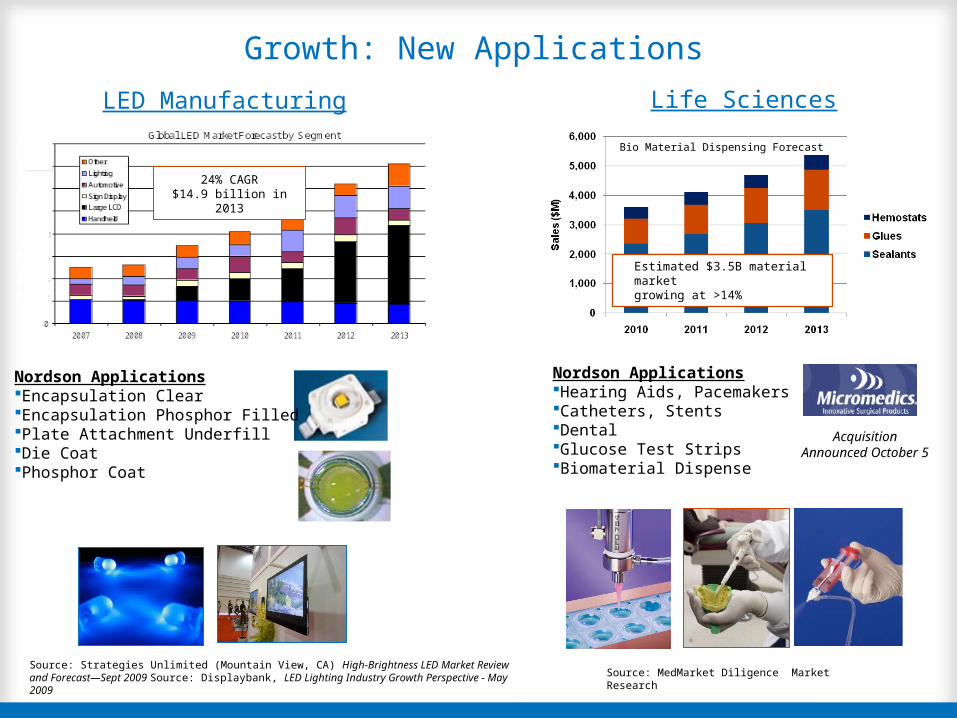
Growth: New Applications
LED Manufacturing
24% CAGR$14.9 billion in 2013
Source: Strategies Unlimited (Mountain View, CA) High-Brightness LED Market Review and Forecast—Sept 2009 Source: Displaybank, LED Lighting Industry Growth Perspective - May 2009
Nordson ApplicationsEncapsulation ClearEncapsulation Phosphor FilledPlate Attachment UnderfillDie CoatPhosphor Coat
Life Sciences
Estimated $3.5B material market
growing at >14%
Bio Material Dispensing Forecast
Nordson ApplicationsHearing Aids, PacemakersCatheters, StentsDentalGlucose Test StripsBiomaterial Dispense
Source: MedMarket Diligence Market Research
AcquisitionAnnounced October 5
19
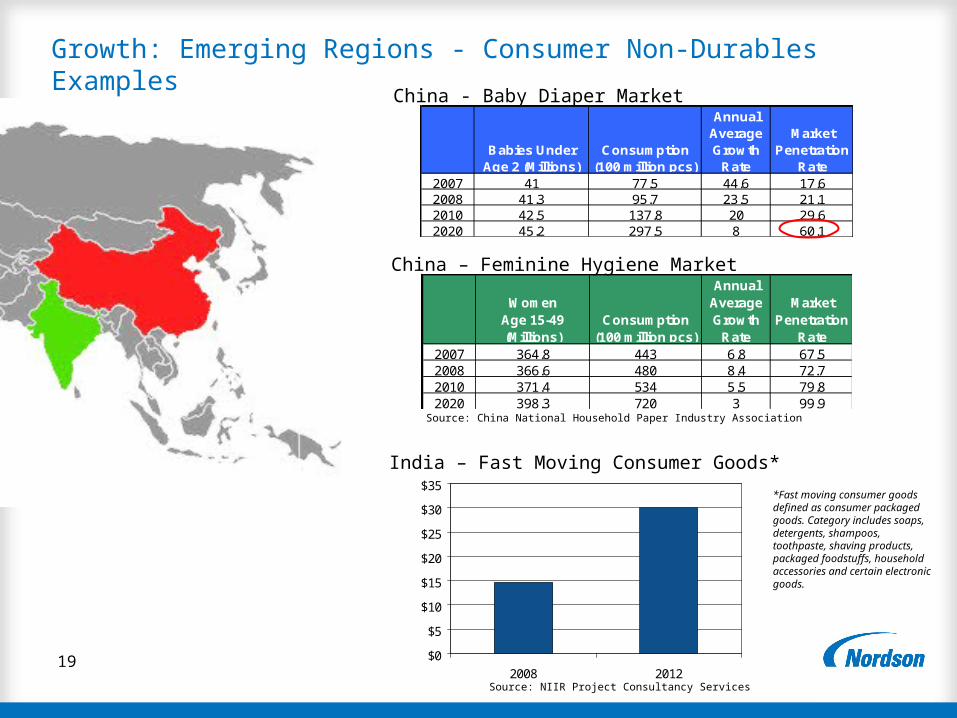
Growth: Emerging Regions - Consumer Non-Durables Examples
Babies Under Age 2 (Millions)
Consumption (100 million pcs)
Annual Average Growth
Rate
Market Penetration
Rate2007 41 77.5 44.6 17.62008 41.3 95.7 23.5 21.12010 42.5 137.8 20 29.62020 45.2 297.5 8 60.1
China - Baby Diaper Market
Source: China National Household Paper Industry Association
Women Age 15-49 (Millions)
Consumption (100 million pcs)
Annual Average Growth
Rate
Market Penetration
Rate2007 364.8 443 6.8 67.52008 366.6 480 8.4 72.72010 371.4 534 5.5 79.82020 398.3 720 3 99.9
China – Feminine Hygiene Market
Source: NIIR Project Consultancy Services
India – Fast Moving Consumer Goods*
$0
$5
$10
$15
$20
$25
$30
$35
2008 2012
*Fast moving consumer goods defined as consumer packaged goods. Category includes soaps, detergents, shampoos, toothpaste, shaving products, packaged foodstuffs, household accessories and certain electronic goods.
20
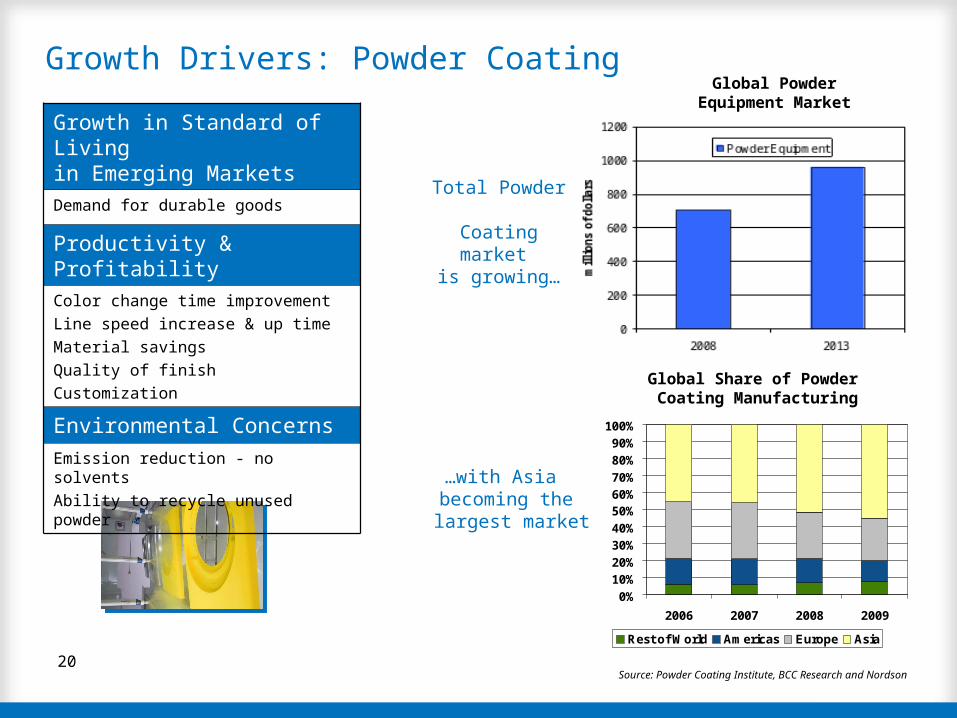
Growth Drivers: Powder Coating
Total Powder Coating market
is growing…
Source: Powder Coating Institute, BCC Research and Nordson
…with Asia becoming the
largest market
Global Share of Powder Coating Manufacturing
Global Powder Equipment Market
0%
10%
20%
30%
40%
50%60%
70%
80%
90%
100%
2006 2007 2008 2009
Rest of World Americas Europe Asia
Growth in Standard of Living in Emerging Markets
Demand for durable goods
Productivity & Profitability
Color change time improvement
Line speed increase & up time
Material savings
Quality of finish
Customization
Environmental Concerns
Emission reduction - no solvents
Ability to recycle unused powder
21
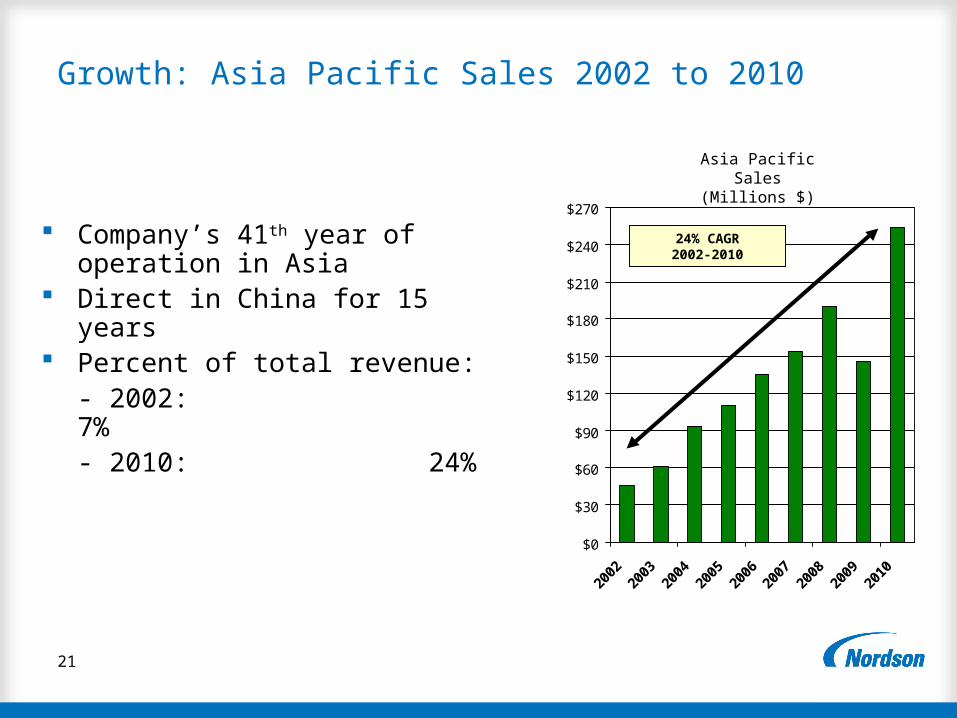
Growth: Asia Pacific Sales 2002 to 2010
Company’s 41th year of operation in Asia
Direct in China for 15 years Percent of total revenue:
- 2002: 7%- 2010: 24%
$0
$30
$60
$90
$120
$150
$180
$210
$240
$270
2002
2003
2004
2005
2006
2007
2008
2009
2010
Asia Pacific Sales(Millions $)
24% CAGR2002-2010
22
Building on Excellence - 3 to 5 Year Goals
Maintain organic growth at mid-to-high single digits Acquisitions bring core growth to double digits Improve operating margins by two percentage points on
current portfolio Maintain ROIC well above the cost of capital Continue to drive lean/six sigma to the bottom line
Continue to deliver top quartile performance for our shareholders

23
Nordson Investment SummarySustainable Business Model
Real technology differentiation Unparalleled application know how Global direct sales & service Parts & consumables annuity Globally recognized brand
Applied to Diverse Markets
30+ countries, established and emerging Technology, consumer non-durables,
consumer durables Emerging applications
Delivers Exceptional Results
13% top line growth over 50 years 47 years of dividend increases Continually improving margins and returns Strong cash flow for continued investment Top quartile total shareholder return
24
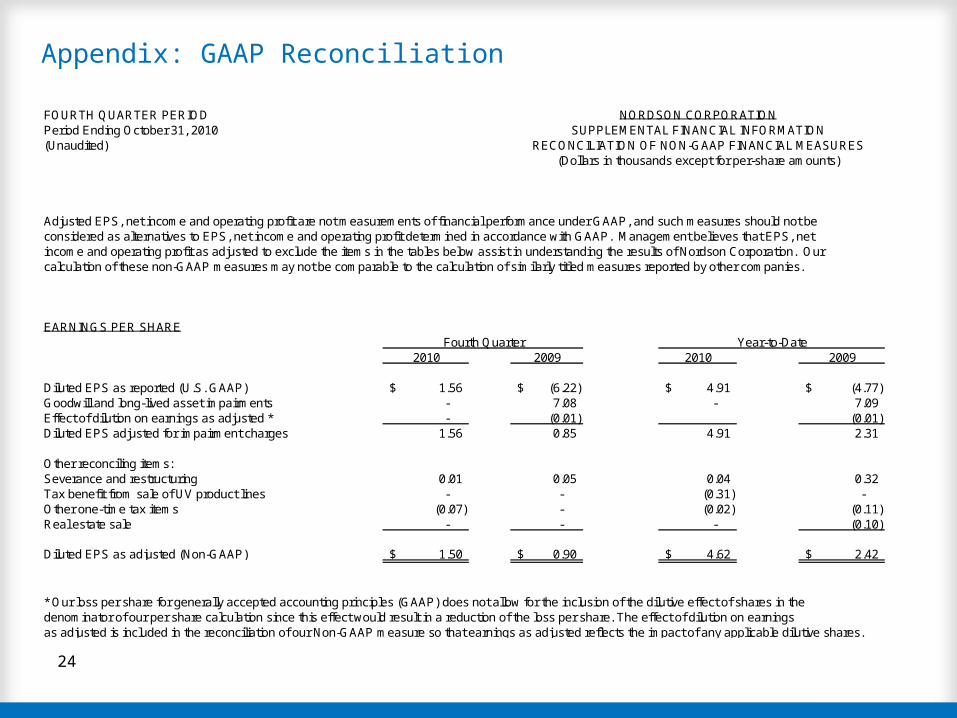
Appendix: GAAP Reconciliation
FOURTH QUARTER PERIOD NORDSON CORPORATIONPeriod Ending October 31, 2010 SUPPLEMENTAL FINANCIAL INFORMATION(Unaudited) RECONCILIATION OF NON-GAAP FINANCIAL MEASURES
(Dollars in thousands except for per-share amounts)
Adjusted EPS, net income and operating profit are not measurements of financial performance under GAAP, and such measures should not beconsidered as alternatives to EPS, net income and operating profit determined in accordance with GAAP. Management believes that EPS, netincome and operating profit as adjusted to exclude the items in the tables below assist in understanding the results of Nordson Corporation. Our calculation of these non-GAAP measures may not be comparable to the calculation of similarly titled measures reported by other companies.
EARNINGS PER SHAREFourth Quarter Year-to-Date
2010 2009 2010 2009
Diluted EPS as reported (U.S. GAAP) 1.56$ (6.22)$ 4.91$ (4.77)$ Goodwill and long-lived asset impairments - 7.08 - 7.09 Effect of dilution on earnings as adjusted * - (0.01) (0.01) Diluted EPS adjusted for impairment charges 1.56 0.85 4.91 2.31
Other reconciling items:Severance and restructuring 0.01 0.05 0.04 0.32 Tax benefit from sale of UV product lines - - (0.31) - Other one-time tax items (0.07) - (0.02) (0.11) Real estate sale - - - (0.10)
Diluted EPS as adjusted (Non-GAAP) 1.50$ 0.90$ 4.62$ 2.42$
* Our loss per share for generally accepted accounting principles (GAAP) does not allow for the inclusion of the dilutive effect of shares in the denominator of our per share calculation since this effect would result in a reduction of the loss per share. The effect of dilution on earningsas adjusted is included in the reconciliation of our Non-GAAP measure so that earnings as adjusted reflects the impact of any applicable dilutive shares.
25
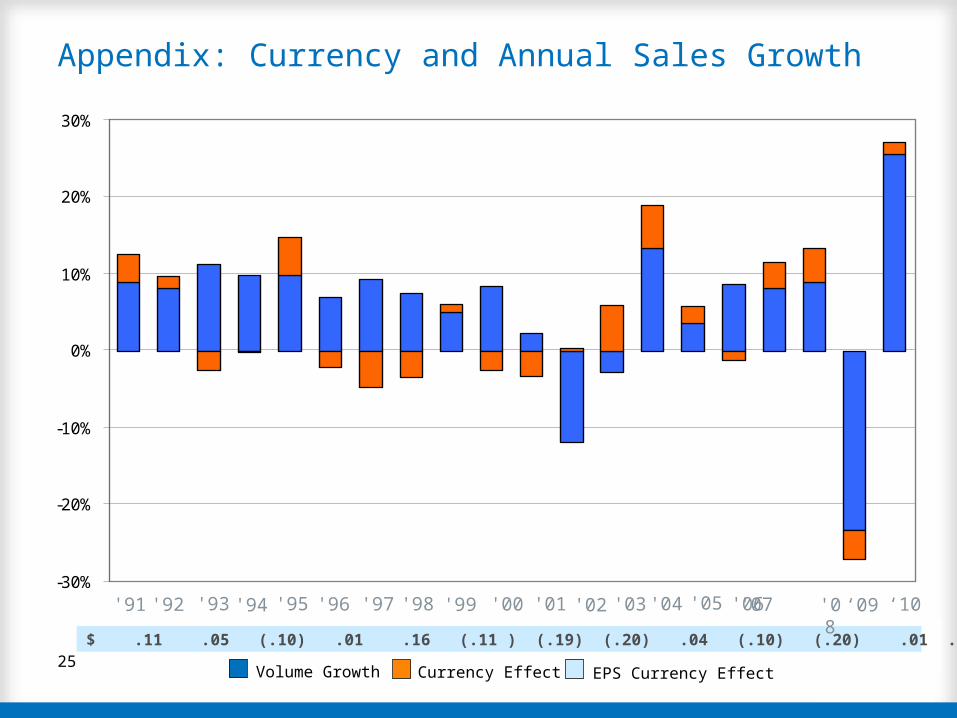
-30%
-20%
-10%
0%
10%
20%
30%
$ .11 .05 (.10) .01 .16 (.11 ) (.19) (.20) .04 (.10) (.20) .01 .30 . 27 .11 (.10) .18 .29 (.23) .15
Appendix: Currency and Annual Sales Growth
Volume Growth Currency Effect EPS Currency Effect
'91 '92 '93 '94 '95 '96 '97 '99 '00 '01'98 '02 '03 '04 '05 '06'07 '08 ‘09 ‘10