
Date: October 7, 2013 - OCAT - Ontario Campaign for … October 7, 2013 1 Flavoured Tobacco Use...
13
FLAVOURED TOBACCO USE AMONG CANADIAN YOUTH: EVIDENCE FROM CANADA’S 2010/2011 YOUTH SMOKING SURVEY Date: October 7, 2013
Transcript of Date: October 7, 2013 - OCAT - Ontario Campaign for … October 7, 2013 1 Flavoured Tobacco Use...

FLAVOURED TOBACCO USE
AMONG CANADIAN YOUTH:
EVIDENCE FROM CANADA’S
2010/2011 YOUTH SMOKING SURVEY
Date: October 7, 2013

1 Flavoured Tobacco Use among Canadian Youth
Suggested citation
Manske SR, Rynard V, Minaker L. 2013 (October). Flavoured Tobacco Use among Canadian Youth: Evidence from Canada’s 2010/2011 Youth Smoking Survey. Waterloo: Propel Centre for Population Health Impact, 1‐2. www.yss.uwaterloo.ca/index.cfm?section=5&page=288
_____________
The Youth Smoking Survey is a product of the pan‐Canadian capacity building project funded through a contribution agreement between Health Canada and the Propel Centre for Population Health Impact from 2004 to 2007 and a contract between Health Canada and the Propel Centre for Population Health Impact from 2008‐2011. The YSS consortium includes Canadian tobacco control researchers from all provinces and provided training opportunities for university students at all levels. The views expressed herein do not necessarily represent the views of Health Canada.
For further information regarding this project, please contact:
Steve Manske Senior Scientist Propel Centre for Population Health Impact Lyle S. Hallman Institute University of Waterloo 200 University Avenue West Waterloo, ON N2L 3G1 519‐888‐4518 [email protected] www.yss.uwaterloo.ca

2 Flavoured Tobacco Use among Canadian Youth
BACKGROUND
The biennial Youth Smoking Survey (YSS) is a classroom‐based survey of a representative sample of schools in the ten Canadian provinces. The 2010/2011 cycle of the YSS did not include the province of New Brunswick1. In October 2010 to June 20112, 426 schools and 50,949 students participated in YSS. Table 1 reports participating students by province. Survey weights are applied to the data in order to derive meaningful population estimates. These weights ensure results reflect the total population being considered and adjust for the sampling method and response rate. Tables with results suppress data that do not reflect reliable estimates of the population.
Table 1: Participating Students by Province, 2010/2011 YSS
Province # Students
Participating Response Rate
(%)
NL 5010 86
PE 2830 77
NS 6240 65
QC 4266 89
ON 9817 56
MB 7471 82
SK 3284 71
AB 4500 62
BC 7531 80
Canada 50949 73
The main objective of the YSS is to provide benchmark tobacco use prevalence rates at national and provincial levels for students in grades 6 through 12. The 2010/2011 YSS questionnaire (the most recent cycle with released data) included questions about multiple forms of tobacco product, including whether students used flavoured tobacco products. Details of the implementation of YSS are available in the online User Guide (www.yss.uwaterloo.ca/results/yss10_user_guide.pdf).
Of particular interest for this report are questions asked on the YSS questionnaire that determine tobacco usage in the last 30 days. Table 2 indicates the specific wording of items used in the subsequent analyses.
1 Participation to the 2010/2011 YSS was declined by the province of New Brunswick. Based on the comparative analysis conducted using the 2008/2009 survey date, there were no statistically significant differences in cigarette smoking rates in national estimates with and without New Brunswick. 2 Most data were collected in the period January – May, 2011.
3 Flavoured Tobacco Use among Canadian Youth
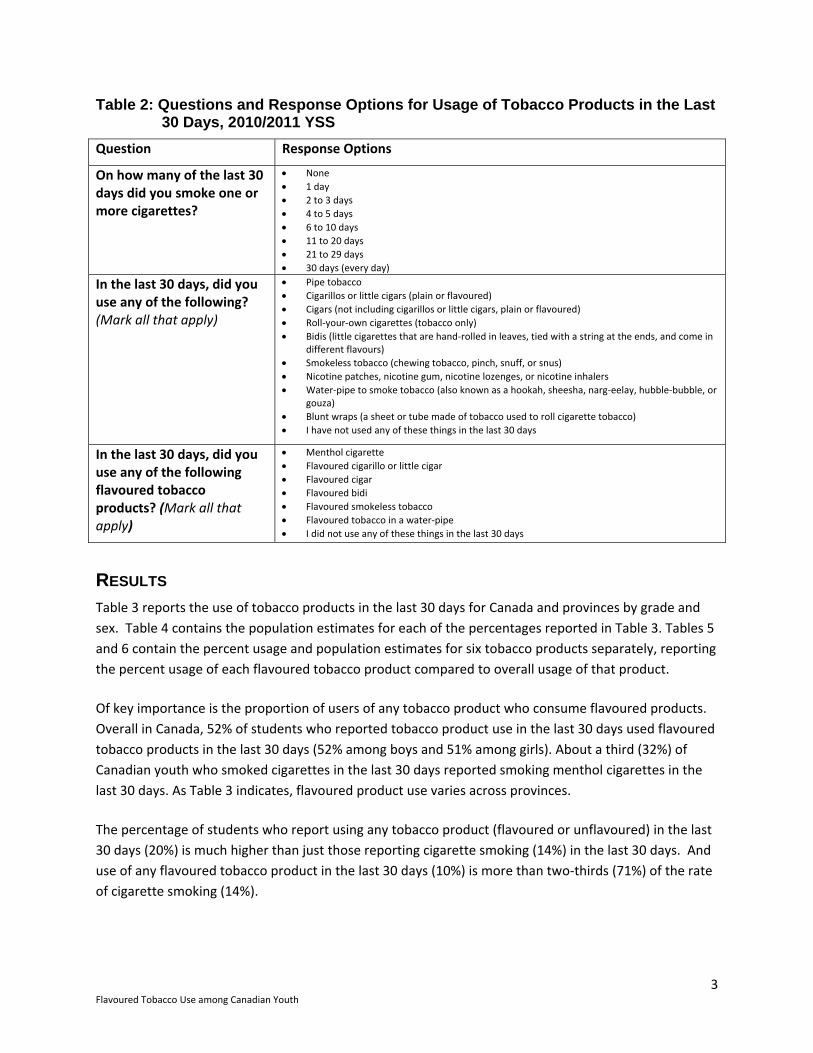
Table 2: Questions and Response Options for Usage of Tobacco Products in the Last 30 Days, 2010/2011 YSS
Question Response Options
On how many of the last 30 days did you smoke one or more cigarettes?
None
1 day
2 to 3 days
4 to 5 days
6 to 10 days
11 to 20 days
21 to 29 days
30 days (every day)
In the last 30 days, did you use any of the following? (Mark all that apply)
Pipe tobacco
Cigarillos or little cigars (plain or flavoured)
Cigars (not including cigarillos or little cigars, plain or flavoured)
Roll‐your‐own cigarettes (tobacco only)
Bidis (little cigarettes that are hand‐rolled in leaves, tied with a string at the ends, and come in different flavours)
Smokeless tobacco (chewing tobacco, pinch, snuff, or snus)
Nicotine patches, nicotine gum, nicotine lozenges, or nicotine inhalers
Water‐pipe to smoke tobacco (also known as a hookah, sheesha, narg‐eelay, hubble‐bubble, or gouza)
Blunt wraps (a sheet or tube made of tobacco used to roll cigarette tobacco)
I have not used any of these things in the last 30 days
In the last 30 days, did you use any of the following flavoured tobacco products? (Mark all that apply)
Menthol cigarette
Flavoured cigarillo or little cigar
Flavoured cigar
Flavoured bidi
Flavoured smokeless tobacco
Flavoured tobacco in a water‐pipe
I did not use any of these things in the last 30 days
RESULTS Table 3 reports the use of tobacco products in the last 30 days for Canada and provinces by grade and
sex. Table 4 contains the population estimates for each of the percentages reported in Table 3. Tables 5
and 6 contain the percent usage and population estimates for six tobacco products separately, reporting
the percent usage of each flavoured tobacco product compared to overall usage of that product.
Of key importance is the proportion of users of any tobacco product who consume flavoured products.
Overall in Canada, 52% of students who reported tobacco product use in the last 30 days used flavoured
tobacco products in the last 30 days (52% among boys and 51% among girls). About a third (32%) of
Canadian youth who smoked cigarettes in the last 30 days reported smoking menthol cigarettes in the
last 30 days. As Table 3 indicates, flavoured product use varies across provinces.
The percentage of students who report using any tobacco product (flavoured or unflavoured) in the last
30 days (20%) is much higher than just those reporting cigarette smoking (14%) in the last 30 days. And
use of any flavoured tobacco product in the last 30 days (10%) is more than two‐thirds (71%) of the rate
of cigarette smoking (14%).

4 Flavoured Tobacco Use among Canadian Youth
Table 3: Percent Usage of Tobacco Products in the Last 30 Days, by Grade, Sex, Region, 2010/2011 YSS
Cigarette smoking last 30 days†
% [95% CI]^
Used any form of tobacco, last
30 days‡ % [95% CI]
Used any form of flavoured tobacco, last 30 days§ % [95% CI]
% of last 30 day tobacco users who
used flavoured tobacco in last
30 days % [95% CI]
% of last 30 day cigarette smokers† who
smoked menthol in last
30 days % [95% CI]
Canada*, Grades 9‐12** 14 [13‐16] 20 [18‐22] 10 [9‐12] 52 [48‐55] 32 [28‐35]
Canada, Boys, Gr. 9‐12** 16 [14‐18] 24 [22‐25] 12 [10‐14] 52 [46‐58] 32 [26‐37]
Canada, Girls, Gr. 9‐12** 13 [11‐15] 16 [14‐18] 8 [7‐9] 51 [48‐55] 32 [28‐36]
Canada, Gr. 9††, both sexes 10 [8‐11] 13 [11‐15] 7 [5‐8] 51 [46‐57] 32 [26‐37]
Canada, Gr. 10††, both sexes 12 [11‐14] 17 [16‐19] 9 [7‐10] 51 [45‐57] 33 [26‐40]
Canada, Gr. 11††, both sexes 16 [13‐18] 22 [19‐24] 12 [10‐14] 56 [52‐60] 34 [29‐39]
Canada, Gr. 12††, both sexes 21 [18‐23] 28 [26‐31] 14 [11‐17] 49 [42‐55] 29 [24‐35]
Atlantic*, Gr. 9‐12, both sexes 20 [18‐22] 25 [23‐26] 12 [11‐13] 49 [46‐51] 37 [33‐40]
Atlantic, Gr. 9‐12, boys 23 [20‐25] 29 [27‐32] 15 [14‐17] 52 [49‐56] 38 [34‐42]
Atlantic, Gr. 9‐12, girls 17 [16‐19] 20 [18‐21] 9 [8‐10] 43 [39‐47] 34 [29‐39]
Quebec, Sec III‐V both sexes 15 [12‐18] 21 [17‐24] 12 [9‐15] 59 [50‐68] 26¶ [15‐37]
Quebec, Sec III‐V boys 16 [12‐19] 22 [17‐27] 13¶ [7‐18] 59 [43‐74] #
Quebec, Sec III‐V girls 14 [10‐18] 19 [15‐24] 12 [9‐15] 60 [53‐68] #
Ontario, Gr. 9‐12, both sexes 11 [8‐14] 16 [14‐19] 8 [5‐10] 46 [39‐54] 28 [20‐36]
Ontario, Gr. 9‐12, boys 13 [11‐16] 21 [19‐23] 10 [8‐13] 49 [38‐61] 29¶ [18‐40]
Ontario, Gr. 9‐12, girls 9¶ [5‐12] 11 [8‐14] 4¶ [3‐6] 40 [33‐47] 26¶ [16‐36]
Manitoba, Gr. 9‐12, both sexes 13 [10‐16] 18 [13‐22] 9¶ [6‐12] 49 [44‐55] 34 [27‐40]
Manitoba, Gr. 9‐12, boys 16 [11‐20] 22 [16‐29] 11¶ [7‐16] 51 [44‐58] 32 [23‐41]
Manitoba, Gr. 9‐12, girls 11 [9‐12] 13 [10‐16] 6 [4‐8] 47 [42‐51] 36 [28‐44]
Saskatchewan, Gr. 9‐12, both sexes 28¶ [14‐42] 34¶ [20‐47] 18 [14‐23] 54 [43‐65] 36 [27‐45]
Saskatchewan, Gr. 9‐12, boys 32¶ [21‐43] 42 [32‐52] 25 [21‐29] 60 [50‐69] 36¶ [23‐48]
Saskatchewan, Gr. 9‐12, girls # # 11¶ [5‐18] 44 [34‐54] 36 [29‐42]
Alberta, Gr. 9‐12, both sexes 18 [13‐22] 23 [19‐28] 13 [10‐16] 56 [52‐60] 37 [28‐45]
Alberta, Gr. 9‐12, boys 17¶ [12‐23] 25 [20‐31] 12¶ [8‐17] 49 [40‐57] 25¶ [13‐36]
Alberta, Gr. 9‐12, girls 18 [14‐22] 21 [17‐26] 14 [11‐17] 65 [56‐74] 48¶ [32‐64]
British Columbia, Gr. 9‐12, both sexes 17 [15‐19] 23 [20‐26] 12 [10‐15] 53 [46‐59] 36 [32‐40]
British Columbia, Gr. 9‐12, boys 17 [15‐19] 25 [23‐28] 13 [11‐15] 52 [48‐56] 35 [31‐40]
British Columbia, Gr. 9‐12, girls 17 [14‐20] 20 [17‐23] 11 [8‐14] 54 [43‐66] 37 [33‐40]
Canada Grades 6‐12, both sexes‡‡ 10 [9‐11] 13 [12‐14] 7 [6‐7] 50 [47‐54] 30 [27‐34]
Canada , Gr. 6‐12, Boys‡‡ 11 [10‐12] 16 [15‐17] 8 [7‐9] 50 [46‐55] 30 [25‐35]
Canada , Gr. 6‐12, Girls‡‡ 9 [8‐10] 11 [10‐12] 5 [5‐6] 50 [46‐54] 31 [27‐34]
Canada, Gr. 6, both sexes 1¶ [1‐1] 1¶ [1‐2] 1¶ [0‐1] 35¶ [20‐51] #
Canada, Gr. 7§§ both sexes 2 [1‐3] 3 [2‐4] 1¶ [1‐1] 36 [27‐45] 19¶ [11‐28]

5 Flavoured Tobacco Use among Canadian Youth
Cigarette smoking last 30 days†
% [95% CI]^
Used any form of tobacco, last
30 days‡ % [95% CI]
Used any form of flavoured tobacco, last 30 days§ % [95% CI]
% of last 30 day tobacco users who
used flavoured tobacco in last
30 days % [95% CI]
% of last 30 day cigarette smokers† who
smoked menthol in last
30 days % [95% CI]
Canada, Gr. 8§§ both sexes 6 [4‐8] 8 [6‐9] 3 [2‐4] 42 [34‐49] 22 [15‐28]
Atlantic, Gr. 6‐12, both sexes 14 [13‐15] 17 [16‐18] 8 [7‐9] 47 [44‐49] 35 [32‐38]
Quebec, Gr. 6‐Sec V, both sexes 10 [8‐12] 14 [11‐16] 8 [6‐9] 55 [49‐62] 25¶ [16‐35]
Ontario, Gr. 6‐12, both sexes 7 [5‐9] 11 [9‐12] 5 [4‐6] 45 [38‐53] 28 [20‐35]
Manitoba, Gr. 6‐12, both sexes 10 [8‐12] 13 [10‐16] 6 [4‐8] 45 [40‐50] 32 [26‐37]
Saskatchewan, Gr 6‐12, both sexes 18¶ [10‐27] 23¶ [14‐31] 12 [9‐15] 53 [43‐63] 34 [26‐43]
Alberta, Gr. 6‐12, both sexes 12 [9‐14] 15 [13‐18] 8 [7‐10] 55 [52‐58] 34 [27‐42]
British Columbia Gr. 6‐12, both sexes 12 [10‐14] 16 [15‐18] 8 [7‐10] 52 [43‐60] 34 [29‐39]
^ 95% confidence intervals in brackets
* New Brunswick declined participation to the 2010‐11 YSS
† Includes daily, occasional and experimental smoking ‡ Any form of tobacco includes cigarettes, pipe tobacco, cigarillos or little cigars, cigars, roll‐your‐own cigarettes, bidis,
smokeless tobacco, water pipe to smoke tobacco, or blunt wraps but does not include individuals who only used nicotine patches, nicotine gum, nicotine lozenges, or nicotine inhalers
§ Any form of flavoured tobacco includes menthol cigarettes, flavoured cigarillos or little cigars, flavoured cigars, flavouredbidis, flavoured smokeless tobacco, or flavoured tobacco in a water‐pipe. The original data included a small number of inconsistencies of students who reported use of a flavoured tobacco product in the last 30 days when they had not previously reported use of that product. These cases were excluded from the estimate of flavoured tobacco use. This is the most conservative estimate of flavoured tobacco use.
¶ Moderate sampling variability, interpret with caution
# High sampling variability, data are suppressed
** Secondary III‐V in Quebec †† For Quebec Grade 9 represents Secondary III, Grade 10 represents Secondary IV, Grade 11 represents Secondary V and
Grade 12 does not exist ‡‡ Grade 6‐Secondary V in Quebec
§§ For Quebec Grade 7 represents Secondary I, Grade 8 represents Secondary II
Source: 2010‐11 Youth Smoking Survey

6 Flavoured Tobacco Use among Canadian Youth
Table 4: Population Estimates of Use of Tobacco Products in the Last 30 Days, by Grade, Sex, Region, 2010/2011 YSS
Cigarette smoking last 30 days† Population Estimate
Used any form of tobacco, last 30
days‡ Population Estimate
Used any form of flavoured
tobacco, last 30 days§
Population Estimate
Last 30 day cigarette
smokers† who smoked menthol in last 30 days Population Estimate
Canada*, Grades 9‐12** 237,100 327,000 169,300 75,200
Canada, Boys, Gr. 9‐12** 134,800 199,700 103,800 42,500
Canada, Girls, Gr. 9‐12** 102,300 127,300 65,500 32,700
Canada, Gr. 9††, both sexes 40,100 52,400 26,900 12,700
Canada, Gr. 10††, both sexes 51,800 73,500 37,700 17,100
Canada, Gr. 11††, both sexes 65,300 90,800 51,000 22,100
Canada, Gr. 12††, both sexes 79,900 110,300 53,800 23,300
Atlantic*, Gr. 9‐12, both sexes 16,000 19,800 9,600 5,900
Atlantic, Gr. 9‐12, boys 9,200 12,000 6,300 3,500
Atlantic, Gr. 9‐12, girls 6,900 7,800 3,400 2,400
Quebec, Sec III‐V both sexes 40,300 56,300 33,400 10,500¶
Quebec, Sec III‐V boys 21,700 30,400 17,800¶ #
Quebec, Sec III‐V girls 18,600 25,900 15,600 #
Ontario, Gr. 9‐12, both sexes 79,300 117,000 54,200 22,400
Ontario, Gr. 9‐12, boys 49,800 79,100 39,100 14,600¶
Ontario, Gr. 9‐12, girls 29,500¶ 37,900 15,100¶ 7,700¶
Manitoba, Gr. 9‐12, both sexes 8,700 11,700 5,800¶ 2,900
Manitoba, Gr. 9‐12, boys 5,300 7,500 3,800¶ 1,700
Manitoba, Gr. 9‐12, girls 3,500 4,200 2,000 1,200
Saskatchewan, Gr. 9‐12, both sexes 15,400¶ 18,700¶ 10,100 5,500
Saskatchewan, Gr. 9‐12, boys 9,100¶ 11,800 7,100 3,300¶
Saskatchewan, Gr. 9‐12, girls # # 3,000¶ 2,300
Alberta, Gr. 9‐12, both sexes 34,900 46,000 25,700 12,800
Alberta, Gr. 9‐12, boys 17,100¶ 25,100 12,200¶ 4,300¶
Alberta, Gr. 9‐12, girls 17,800 20,900 13,500 8,500¶
British Columbia, Gr. 9‐12, both sexes 42,400 57,500 30,500 15,300
British Columbia, Gr. 9‐12, boys 22,700 33,700 17,500 8,000
British Columbia, Gr. 9‐12, girls 19,700 23,800 13,000 7,300
Canada Grades 6‐12, both sexes‡‡ 272,400 374,400 188,000 82,700
Canada , Gr. 6‐12, Boys‡‡ 152,900 226,200 114,200 45,900
Canada , Gr. 6‐12, Girls‡‡ 119,500 148,200 73,800 36,800
Canada, Gr. 6, both sexes 2,900¶ 5,300¶ 1,900¶ #
Canada, Gr. 7§§ both sexes 8,100 11,600 4,200¶ 1,600¶
7 Flavoured Tobacco Use among Canadian Youth
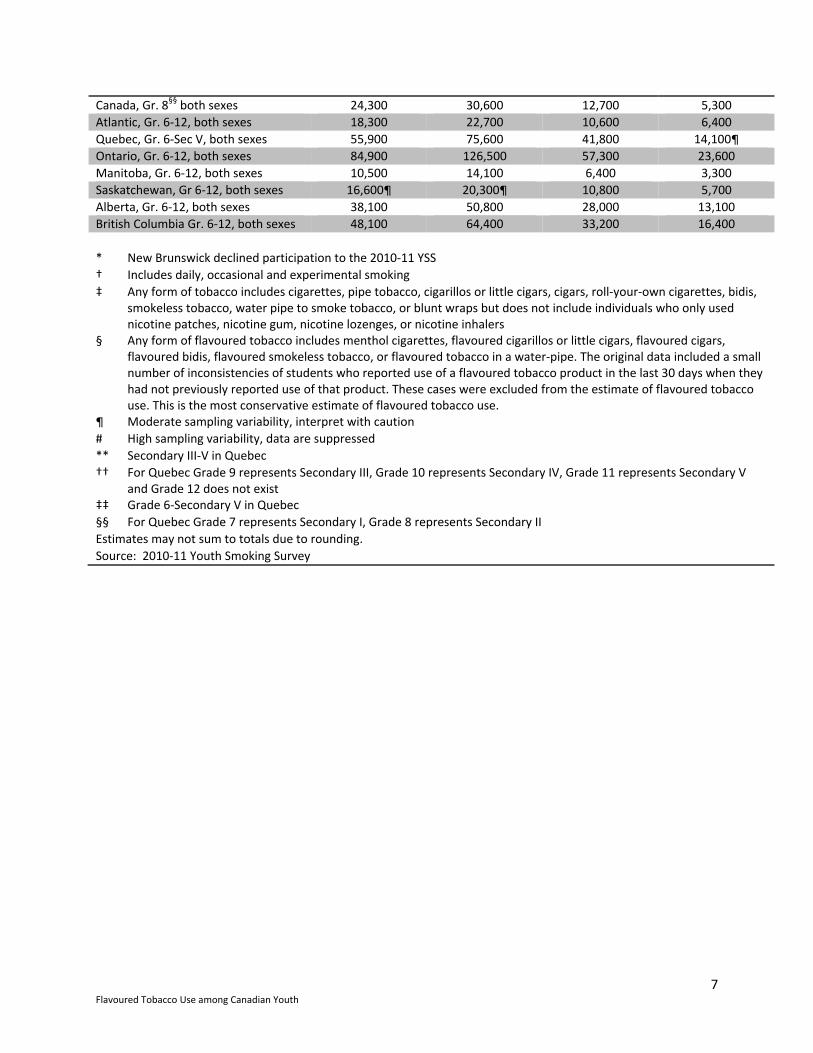
Canada, Gr. 8§§ both sexes 24,300 30,600 12,700 5,300
Atlantic, Gr. 6‐12, both sexes 18,300 22,700 10,600 6,400
Quebec, Gr. 6‐Sec V, both sexes 55,900 75,600 41,800 14,100¶
Ontario, Gr. 6‐12, both sexes 84,900 126,500 57,300 23,600
Manitoba, Gr. 6‐12, both sexes 10,500 14,100 6,400 3,300
Saskatchewan, Gr 6‐12, both sexes 16,600¶ 20,300¶ 10,800 5,700
Alberta, Gr. 6‐12, both sexes 38,100 50,800 28,000 13,100
British Columbia Gr. 6‐12, both sexes 48,100 64,400 33,200 16,400
* New Brunswick declined participation to the 2010‐11 YSS
† Includes daily, occasional and experimental smoking
‡ Any form of tobacco includes cigarettes, pipe tobacco, cigarillos or little cigars, cigars, roll‐your‐own cigarettes, bidis, smokeless tobacco, water pipe to smoke tobacco, or blunt wraps but does not include individuals who only used nicotine patches, nicotine gum, nicotine lozenges, or nicotine inhalers
§ Any form of flavoured tobacco includes menthol cigarettes, flavoured cigarillos or little cigars, flavoured cigars, flavoured bidis, flavoured smokeless tobacco, or flavoured tobacco in a water‐pipe. The original data included a small number of inconsistencies of students who reported use of a flavoured tobacco product in the last 30 days when they had not previously reported use of that product. These cases were excluded from the estimate of flavoured tobacco use. This is the most conservative estimate of flavoured tobacco use.
¶ Moderate sampling variability, interpret with caution
# High sampling variability, data are suppressed
** Secondary III‐V in Quebec
†† For Quebec Grade 9 represents Secondary III, Grade 10 represents Secondary IV, Grade 11 represents Secondary V and Grade 12 does not exist
‡‡ Grade 6‐Secondary V in Quebec
§§ For Quebec Grade 7 represents Secondary I, Grade 8 represents Secondary II
Estimates may not sum to totals due to rounding.
Source: 2010‐11 Youth Smoking Survey

8 Flavoured Tobacco Use among Canadian Youth
Table 5: Percent Usage of Flavoured Tobacco Products in the Last 30 Days, by Grade, Sex, Region, 2010/2011 YSS
% of last 30 day
cigarette smokers†
who smoked
menthol in last 30 days % [95% CI]
% of last 30 day cigarillo or little
cigar users who used flavoured cigarillos or little cigars in the last 30 days
% [95% CI]
% of last 30 day cigar users who
used flavoured cigars in the last 30 days % [95% CI]
% of last 30 day bidi users who
used flavoured bidis in the last 30 days % [95% CI]
% of last 30 day
smokeless tobacco users who
used flavoured smokeless tobacco in the last 30
days % [95% CI]
% of last 30 day water‐pipe users who used flavoured water‐pipe in the last 30 days
% [95% CI]
Canada*, Grades 9‐12** 32 [28‐35] 65 [61‐69] 50 [43‐56] 67 [57‐76] 70 [65‐75] 54 [49‐60]
Canada, Boys, Gr. 9‐12** 32 [26‐37] 64 [59‐69] 46 [38‐54] 56 [44‐68] 69 [63‐74] 46 [39‐54]
Canada, Girls, Gr. 9‐12** 32 [28‐36] 68 [63‐74] 61 [51‐70] 88 [78‐98] 75 [62‐88] 69 [57‐80]
Canada, Gr. 9††, both sexes 32 [26‐37] 64 [56‐72] 56 [47‐66] 74 [56‐91] 75 [65‐84] 76 [66‐87]
Canada, Gr. 10††, both sexes 33 [26‐40] 61 [55‐68] 55 [44‐65] 69 [53‐86] 76 [66‐87] 53 [41‐65]
Canada, Gr. 11††, both sexes 34 [29‐39] 61 [55‐67] 52 [42‐62] 82 [71‐94] 76 [65‐86] 63 [55‐71]
Canada, Gr. 12††, both sexes 29 [24‐35] 74 [66‐81] 40 [31‐49] 38¶ [24‐52] 58 [46‐71] 41 [29‐52]
Atlantic*, Gr. 9‐12, both sexes 37 [33‐40] 64 [60‐69] 47 [42‐51] 62 [55‐68] 63 [57‐68] 50 [45‐55]
Atlantic, Gr. 9‐12, boys 38 [34‐42] 64 [59‐68] 47 [42‐51] 63 [55‐71] 65 [60‐70] 49 [43‐55]
Atlantic, Gr. 9‐12, girls 34 [29‐39] 66 [59‐73] 48 [38‐57] # # 53 [42‐65]
Quebec, Sec III‐V both sexes 26¶ [15‐37] 60 [53‐67] 54¶ [34‐75] # # 78 [65‐92]
Quebec, Sec III‐V boys # 60 [50‐71] # # # #
Quebec, Sec III‐V girls # 59 [51‐67] # # # #
Ontario, Gr. 9‐12, both sexes 28 [20‐36] 67 [58‐76] 44 [35‐53] # 72 [62‐82] 40 [32‐48]
Ontario, Gr. 9‐12, boys 29¶ [18‐40] 67 [57‐77] 42 [30‐54] # 73 [62‐84] 34¶ [23‐45]
Ontario, Gr. 9‐12, girls 26¶ [16‐36] 66 [55‐78] # # # 53¶ [34‐71]
Manitoba, Gr. 9‐12, both sexes 34 [27‐40] 66 [61‐72] 47 [36‐58] # 70 [58‐83] 44 [36‐52]
Manitoba, Gr. 9‐12, boys 32 [23‐41] 68 [64‐73] 45 [31‐58] # 70 [55‐84] 43 [30‐57]
Manitoba, Gr. 9‐12, girls 36 [28‐44] 62 [50‐74] # # # #
Saskatchewan, Gr. 9‐12, both sexes 36 [27‐45] 68 [56‐79] 48 [37‐58] # 63 [46‐80] 70 [60‐80]
Saskatchewan, Gr. 9‐12, boys 36¶ [23‐48] 68 [56‐79] 49 [39‐59] # 65 [47‐83] 71 [61‐80]
Saskatchewan, Gr. 9‐12, girls 36 [29‐42] 67 [53‐82] # # # #
Alberta, Gr. 9‐12, both sexes 37 [28‐45] 68 [61‐75] 69 [54‐84] # 72 [57‐87] 74 [53‐94]
Alberta, Gr. 9‐12, boys 25¶ [13‐36] 62 [50‐74] 61 [45‐77] # 57 [47‐67] #
Alberta, Gr. 9‐12, girls 48¶ [32‐64] 75 [68‐83] 81 [61‐100] # # #
British Columbia, Gr. 9‐12, both sexes 36 [32‐40] 67 [55‐80] 37¶ [17‐57] 38¶ [21‐55] 68 [64‐71] 56 [43‐69]
British Columbia, Gr. 9‐12, boys 35 [31‐40] 60 [54‐66] 31¶ [10‐52] # 68 [63‐72] 54 [41‐68]
British Columbia, Gr. 9‐12, girls 37 [33‐40] 78 [56‐99] 53 [37‐69] # # 59 [45‐72]

9 Flavoured Tobacco Use among Canadian Youth
% of last 30 day
cigarette smokers†
who smoked
menthol in last 30 days % [95% CI]
% of last 30 day cigarillo or little
cigar users who used flavoured cigarillos or little cigars in the last 30 days
% [95% CI]
% of last 30 day cigar users who
used flavoured cigars in the last 30 days % [95% CI]
% of last 30 day bidi users who
used flavoured bidis in the last 30 days % [95% CI]
% of last 30 day
smokeless tobacco users who
used flavoured smokeless tobacco in the last 30
days % [95% CI]
% of last 30 day water‐pipe users who used flavoured water‐pipe in the last 30 days
% [95% CI]
Canada Grades 6‐12, both sexes‡‡ 30 [27‐34] 65 [61‐69] 49 [44‐55] 65 [56‐73] 69 [64‐74] 55 [50‐60]
Canada , Gr. 6‐12, Boys‡‡ 30 [25‐35] 63 [58‐68] 46 [39‐53] 55 [45‐65] 68 [63‐74] 46 [40‐53]
Canada , Gr. 6‐12, Girls‡‡ 31 [27‐34] 68 [62‐74] 58 [50‐66] 86 [76‐96] 72 [60‐84] 69 [59‐80]
Canada, Gr. 6, both sexes # # # # # #
Canada, Gr. 7§§ both sexes 19¶ [11‐28] 61¶ [38‐83] # # # #
Canada, Gr. 8§§ both sexes 22 [15‐28] 61 [50‐71] 43 [31‐55] # 63 [47‐78] 55 [37‐73]
Atlantic, Gr. 6‐12, both sexes 35 [32‐38] 64 [60‐69] 48 [44‐52] 63 [57‐69] 62 [57‐67] 51 [46‐56]
Quebec, Gr. 6‐Sec V, both sexes 25¶ [16‐35] 61 [55‐67] 50 [36‐65] # # 71 [60‐81]
Ontario, Gr. 6‐12, both sexes 28 [20‐35] 65 [56‐74] 43 [34‐51] # 72 [63‐81] 41 [33‐49]
Manitoba, Gr. 6‐12, both sexes 32 [26‐37] 63 [57‐70] 47 [36‐58] # 68 [57‐80] 44 [37‐52]
Saskatchewan, Gr 6‐12, both sexes 34 [26‐43] 68 [57‐79] 49 [39‐59] # 62 [45‐80] 69 [58‐79]
Alberta, Gr. 6‐12, both sexes 34 [27‐42] 68 [61‐75] 69 [54‐83] # 73 [59‐86] 75 [56‐95]
British Columbia Gr. 6‐12, both sexes 34 [29‐39] 67 [53‐80] 40¶ [22‐58] 46¶ [28‐64] 68 [64‐71] 58 [46‐70]
^ 95% confidence intervals in brackets
* New Brunswick declined participation to the 2010‐11 YSS
† Includes daily, occasional and experimental smoking
¶ Moderate sampling variability, interpret with caution
# High sampling variability, data are suppressed
** Secondary III‐V in Quebec †† For Quebec Grade 9 represents Secondary III, Grade 10 represents Secondary IV, Grade 11 represents Secondary V and
Grade 12 does not exist ‡‡ Grade 6‐Secondary V in Quebec
§§ For Quebec Grade 7 represents Secondary I, Grade 8 represents Secondary II
Source: 2010‐11 Youth Smoking Survey

10 Flavoured Tobacco Use among Canadian Youth
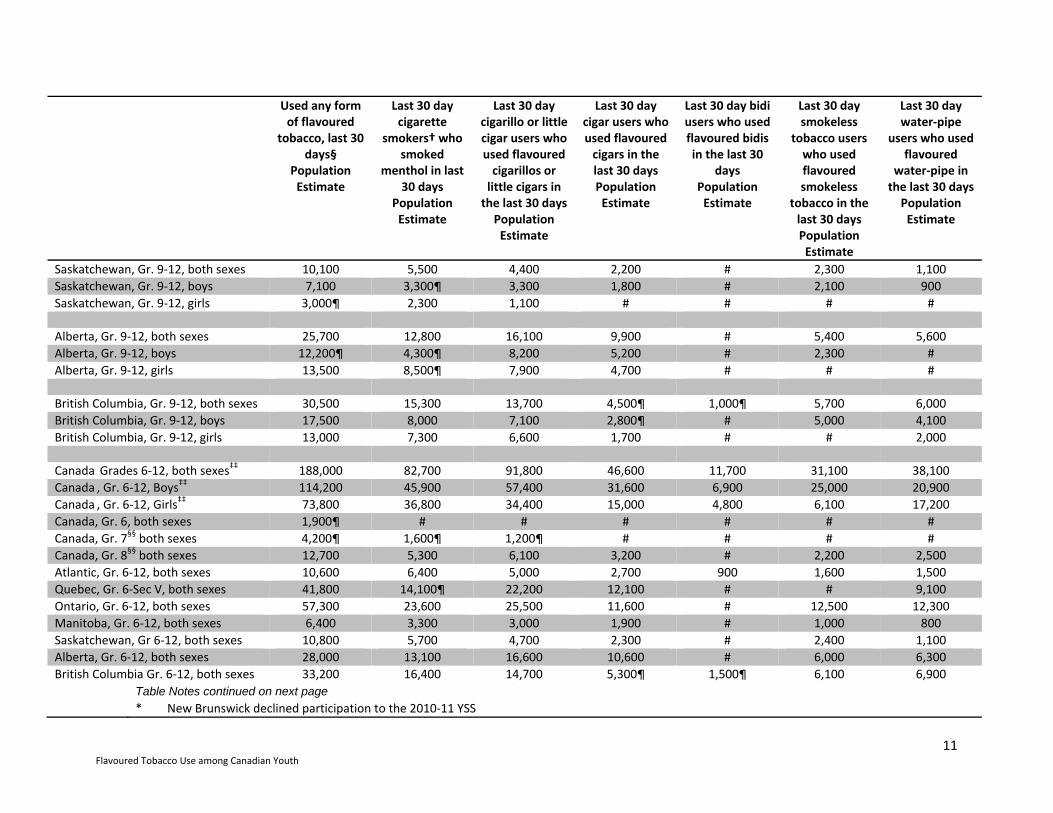
Table 6: Population Estimates of Use of Flavoured Tobacco Products in the Last 30 Days, by Grade, Sex, Region, 2010/2011 YSS
Used any form of flavoured
tobacco, last 30 days§
Population Estimate
Last 30 day cigarette
smokers† who smoked
menthol in last 30 days
Population Estimate
Last 30 day cigarillo or little cigar users who used flavoured cigarillos or little cigars in the last 30 daysPopulation Estimate
Last 30 day cigar users who used flavoured cigars in the last 30 days Population Estimate
Last 30 day bidi users who used flavoured bidis in the last 30
days Population Estimate
Last 30 day smokeless
tobacco users who used flavoured smokeless
tobacco in the last 30 days Population Estimate
Last 30 day water‐pipe
users who used flavoured
water‐pipe in the last 30 daysPopulation Estimate
Canada*, Grades 9‐12** 169,300 75,200 84,100 41,000 10,000 28,200 34,300
Canada, Boys, Gr. 9‐12** 103,800 42,500 53,500 28,300 5,700 22,700 18,700
Canada, Girls, Gr. 9‐12** 65,500 32,700 30,600 12,800 4,300 5,500 15,500
Canada, Gr. 9††, both sexes 26,900 12,700 14,000 8,700 3,000 4,900 6,600
Canada, Gr. 10††, both sexes 37,700 17,100 17,300 9,800 1,600 6,200 6,400
Canada, Gr. 11††, both sexes 51,000 22,100 24,500 13,000 4,000 9,300 11,600
Canada, Gr. 12††, both sexes 53,800 23,300 28,300 9,500 1,500¶ 7,800 9,700
Atlantic*, Gr. 9‐12, both sexes 9,600 5,900 4,600 2,400 700 1,400 1,300
Atlantic, Gr. 9‐12, boys 6,300 3,500 3,300 1,900 600 1,200 1,000
Atlantic, Gr. 9‐12, girls 3,400 2,400 1,300 500 # # 300
Quebec, Sec III‐V both sexes 33,400 10,500¶ 17,800 9,600¶ # # 8,100
Quebec, Sec III‐V boys 17,800¶ # 10,500 # # # #
Quebec, Sec III‐V girls 15,600 # 7,200 # # # #
Ontario, Gr. 9‐12, both sexes 54,200 22,400 24,700 10,700 # 11,500 11,300
Ontario, Gr. 9‐12, boys 39,100 14,600¶ 19,100 8,600 # 10,600 6,500¶
Ontario, Gr. 9‐12, girls 15,100¶ 7,700¶ 5,600 # # # 4,800¶
Manitoba, Gr. 9‐12, both sexes 5,800¶ 2,900 2,900 1,800 # 1,000 800
Manitoba, Gr. 9‐12, boys 3,800¶ 1,700 2,100 1,500 # 900 600
Manitoba, Gr. 9‐12, girls 2,000 1,200 800 # # # #
11 Flavoured Tobacco Use among Canadian Youth
Used any form of flavoured
tobacco, last 30 days§
Population Estimate
Last 30 day cigarette
smokers† who smoked
menthol in last 30 days
Population Estimate
Last 30 day cigarillo or little cigar users who used flavoured cigarillos or little cigars in the last 30 daysPopulation Estimate
Last 30 day cigar users who used flavoured cigars in the last 30 days Population Estimate
Last 30 day bidi users who used flavoured bidis in the last 30
days Population Estimate
Last 30 day smokeless
tobacco users who used flavoured smokeless
tobacco in the last 30 days Population Estimate
Last 30 day water‐pipe
users who used flavoured
water‐pipe in the last 30 daysPopulation Estimate
Saskatchewan, Gr. 9‐12, both sexes 10,100 5,500 4,400 2,200 # 2,300 1,100
Saskatchewan, Gr. 9‐12, boys 7,100 3,300¶ 3,300 1,800 # 2,100 900
Saskatchewan, Gr. 9‐12, girls 3,000¶ 2,300 1,100 # # # #
Alberta, Gr. 9‐12, both sexes 25,700 12,800 16,100 9,900 # 5,400 5,600
Alberta, Gr. 9‐12, boys 12,200¶ 4,300¶ 8,200 5,200 # 2,300 #
Alberta, Gr. 9‐12, girls 13,500 8,500¶ 7,900 4,700 # # #
British Columbia, Gr. 9‐12, both sexes 30,500 15,300 13,700 4,500¶ 1,000¶ 5,700 6,000
British Columbia, Gr. 9‐12, boys 17,500 8,000 7,100 2,800¶ # 5,000 4,100
British Columbia, Gr. 9‐12, girls 13,000 7,300 6,600 1,700 # # 2,000
Canada Grades 6‐12, both sexes‡‡ 188,000 82,700 91,800 46,600 11,700 31,100 38,100
Canada , Gr. 6‐12, Boys‡‡ 114,200 45,900 57,400 31,600 6,900 25,000 20,900
Canada , Gr. 6‐12, Girls‡‡ 73,800 36,800 34,400 15,000 4,800 6,100 17,200
Canada, Gr. 6, both sexes 1,900¶ # # # # # #
Canada, Gr. 7§§ both sexes 4,200¶ 1,600¶ 1,200¶ # # # #
Canada, Gr. 8§§ both sexes 12,700 5,300 6,100 3,200 # 2,200 2,500
Atlantic, Gr. 6‐12, both sexes 10,600 6,400 5,000 2,700 900 1,600 1,500
Quebec, Gr. 6‐Sec V, both sexes 41,800 14,100¶ 22,200 12,100 # # 9,100
Ontario, Gr. 6‐12, both sexes 57,300 23,600 25,500 11,600 # 12,500 12,300
Manitoba, Gr. 6‐12, both sexes 6,400 3,300 3,000 1,900 # 1,000 800
Saskatchewan, Gr 6‐12, both sexes 10,800 5,700 4,700 2,300 # 2,400 1,100
Alberta, Gr. 6‐12, both sexes 28,000 13,100 16,600 10,600 # 6,000 6,300
British Columbia Gr. 6‐12, both sexes 33,200 16,400 14,700 5,300¶ 1,500¶ 6,100 6,900 Table Notes continued on next page * New Brunswick declined participation to the 2010‐11 YSS
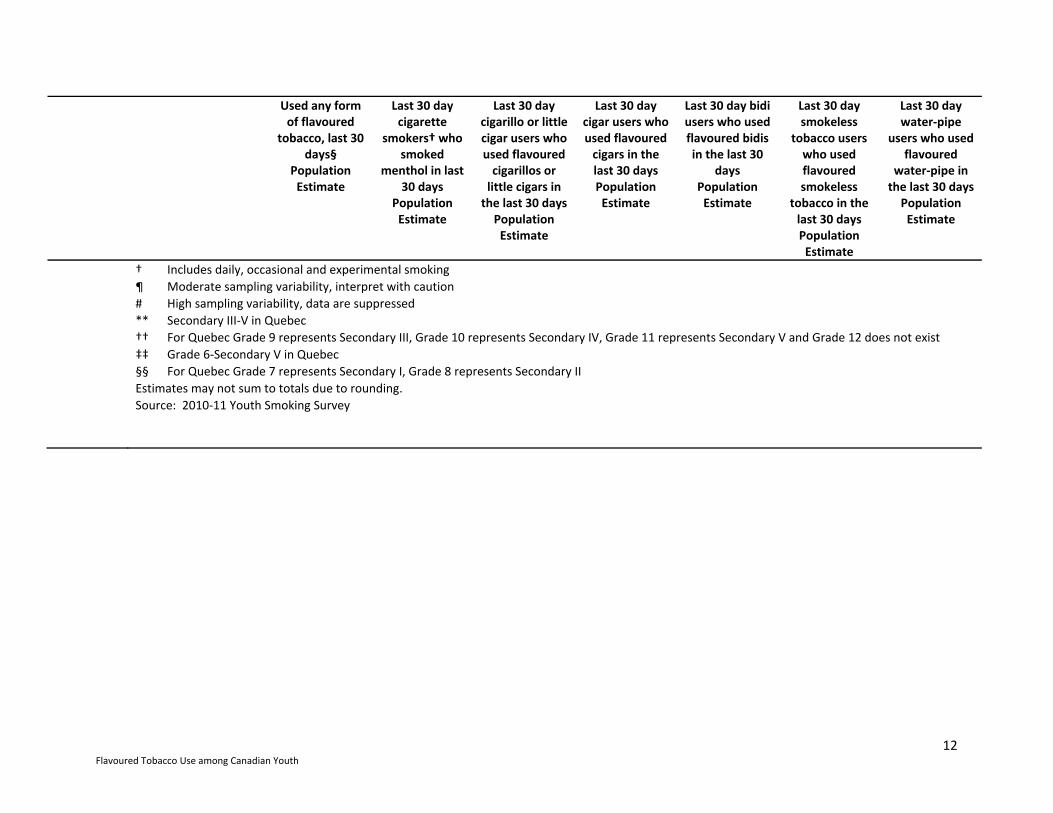
12 Flavoured Tobacco Use among Canadian Youth
Used any form of flavoured
tobacco, last 30 days§
Population Estimate
Last 30 day cigarette
smokers† who smoked
menthol in last 30 days
Population Estimate
Last 30 day cigarillo or little cigar users who used flavoured cigarillos or little cigars in the last 30 daysPopulation Estimate
Last 30 day cigar users who used flavoured cigars in the last 30 days Population Estimate
Last 30 day bidi users who used flavoured bidis in the last 30
days Population Estimate
Last 30 day smokeless
tobacco users who used flavoured smokeless
tobacco in the last 30 days Population Estimate
Last 30 day water‐pipe
users who used flavoured
water‐pipe in the last 30 daysPopulation Estimate
† Includes daily, occasional and experimental smoking ¶ Moderate sampling variability, interpret with caution # High sampling variability, data are suppressed ** Secondary III‐V in Quebec †† For Quebec Grade 9 represents Secondary III, Grade 10 represents Secondary IV, Grade 11 represents Secondary V and Grade 12 does not exist ‡‡ Grade 6‐Secondary V in Quebec §§ For Quebec Grade 7 represents Secondary I, Grade 8 represents Secondary II Estimates may not sum to totals due to rounding. Source: 2010‐11 Youth Smoking Survey