Data Integration Project. MoSTEMWINS Data Projects Strategy 1 -- Develop and Implement a statewide...
22
Data Integration Project
-
Upload
helen-hutchinson -
Category
Documents
-
view
213 -
download
0
Transcript of Data Integration Project. MoSTEMWINS Data Projects Strategy 1 -- Develop and Implement a statewide...

Data Integration Project

MoSTEMWINS Data ProjectsStrategy 1 -- Develop and Implement a statewide data system in support of tracking student performance in noncredit programs of study
Activities Milestones Where we are
Year 1 – •Project modeling & scoping•Hire project manager•Identify options & select data collection portal & repository•Develop standards for data sharing•Identify questions & concerns recommendations on data collection portal & repository•Select data collection portal & repository • Install data collection portal & repository
Year 1 – •Develop project scope•Hire project manager•Create web portal to manage data collection•Set standards for stakeholders sharing data•Assess noncredit programs and outcomes•Begin stakeholder training in new system
Year 1 – •Project scope determined•Project manager (business analyst position posted & interviews scheduled)•Business analysis underway to document business processes and systems for longitudinal database

MoSTEMWINS Data ProjectsStrategy 1 -- Develop and Implement a statewide data system in support of tracking student performance in noncredit programs of study
Activities Milestones Where we are
Year 2 –• Pilot program and modifications•Conduct training•Conduct user surveys•Start data harvesting•Research and Analysis•Begin generating reports
Year 2 – •Data system installed•Pilot conducted•Analyze pilot results•Implement modifications where necessary•Continue stakeholder training •Full system rollout
Year 2 –

MoSTEMWINS Data ProjectsStrategy 1 -- Develop and Implement a statewide data system in support of tracking student performance in noncredit programs of study
Activities Milestones Where we are
Year 3 – •Complete training•Complete user surveys•Start data harvesting•Continue research and analysis•Generate reports
Year 3 – •Professional development continues•Allow articulation between credit and noncredit programs•Begin using data for planning and evaluation strategies at the college and state level•Outcomes data analyzed•Policy discussion engaged in support of project
Year 3 --
MoSTEMWINS Data ProjectsStrategy 2 – Develop and implement an all-inclusive course matrix mapping crosswalk to national standardized prior learning assessment opportunities with relative credit hour values
Activities Milestones Where we are
Year 1 – •Procure subject matter expert to facilitate project•Conduct analysis of current prior year learning opportunities at community colleges•Conduct training with key stakeholders around project processes and data mining processes
Year 1 – •Subject matter expert will be hired•Begin to convene work group to facilitate training and development of crosswalk matrix mapping of courses•Establish data matrix tables for input from all colleges
Year 1 –
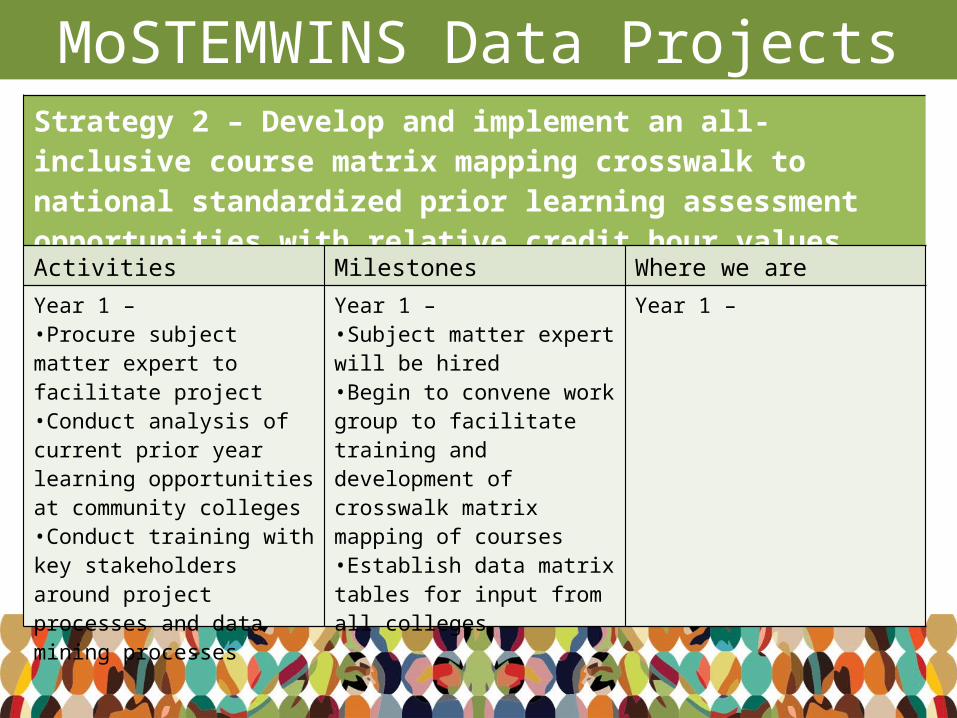
MoSTEMWINS Data ProjectsStrategy 2 – Develop and implement an all-inclusive course matrix mapping crosswalk to national standardized prior learning assessment opportunities with relative credit hour values
Activities Milestones Where we are
Year 2 & 3 – •Compile information on national standards for Prior Learning Assessment (PLA) options•Evaluate courses to national standards (major part of work)•Prepare documentation for each course as well as a complete guide
Year 2 &3 – •Consultant works with colleges to input appropriate course information into data matrix inventory
Year 2 & 3 –

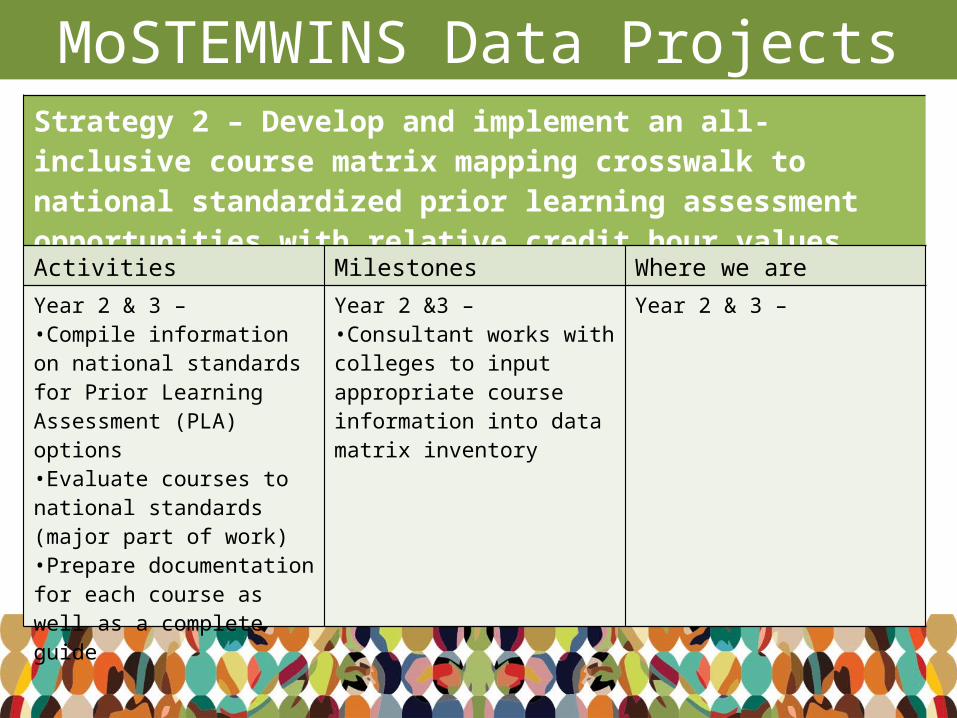
MoSTEMWINS Data ProjectsStrategy 3 – Develop and implement a grant participant real-time data system for the MoSTEMWINS TAACCCT grant.
Activities Milestones Where we are
Year 1 –•Select a participant data collection system software tool•Install and begin training with grant implementers•Conduct a pilot and make necessary adjustments
Year 1 – •Procure participant data collection software tool•Installation and implementation of pilot program
Year 1 --•RFP closed and bids under evaluation
MoSTEMWINS Data ProjectsStrategy 3 – Develop and implement a grant participant real-time data system for the MoSTEMWINS TAACCCT grant.
Activities Milestones Where we are
Year 2 –•Complete pilot then scale to remaining consortium colleges•Continue training grant implementers•Go live with system•Begin to generate participant data reports
Year 2 – •Full implementation of program to remaining colleges
Year 2 --

MoSTEMWINS Data ProjectsStrategy 3 – Develop and implement a grant participant real-time data system for the MoSTEMWINS TAACCCT grant.
Activities Milestones Where we are
Year 3 –•System established and reporting continues•Evaluation analysis
Year 3 – •Reports generated•Evaluation analysis
Year 3 --
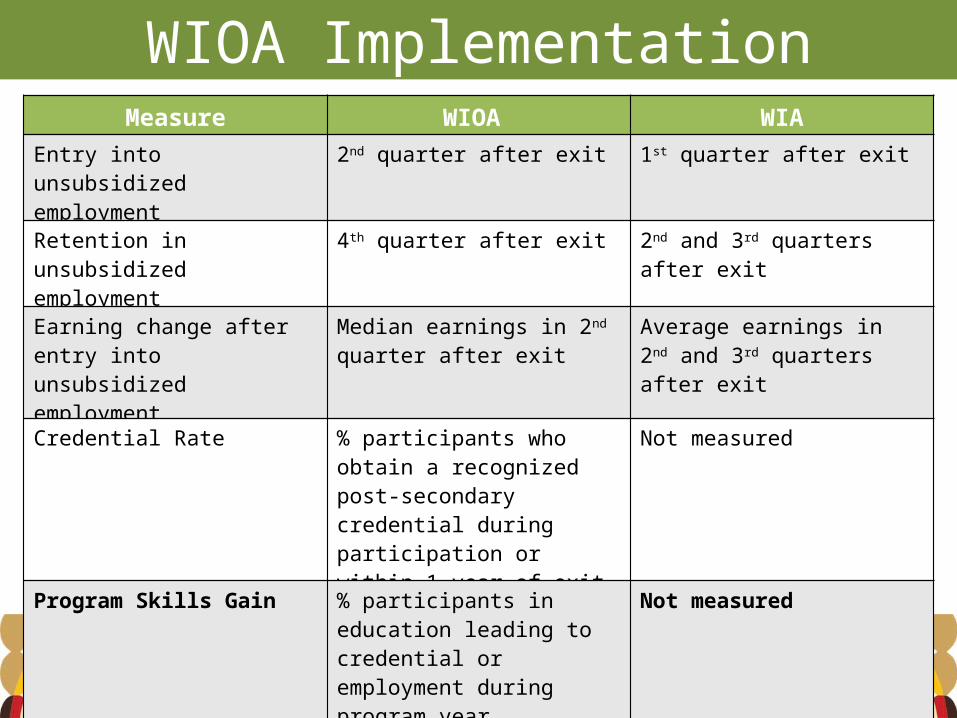
WIOA Implementation
WIOA Measure WIA Measure
Measure WIOA WIA
Entry into unsubsidized employment
2nd quarter after exit 1st quarter after exit
Retention in unsubsidized employment
4th quarter after exit 2nd and 3rd quarters after exit
Earning change after entry into unsubsidized employment
Median earnings in 2nd quarter after exit
Average earnings in 2nd and 3rd quarters after exit
Credential Rate % participants who obtain a recognized post-secondary credential during participation or within 1 year of exit
Not measured
Program Skills Gain % participants in education leading to credential or employment during program year, achieving measurable gains, and measured in real time
Not measured

WIOA RequirementsPerformance measures aligned for programs –• DWD (including ETPS)• Wagner Peyser• Vocational Rehabilitation• Adult Education
To receive workforce funding through WIOA –• All students must be reported – • Credit and noncredit reported (industry recognized noncredit credentials)
Effective July 1, 2015 but WIOA performance effective July 1, 2016

Scorecard Metrics
Scorecard Metric Proposed Measurement
Annual Graduation Rate Graduate Rate Survey (GRS)
Employment Rate of Completers
6 months after completion
Employment Retention of Completers
1 year after employment
Average Earnings of Completers
3 years following completion
Transfer Rates All transfers, including community college students transferring to a 4 year institution

Scorecard
Missouri was only 1 of 2 states to receive additional grant funds to create the scorecard.
Why? –• Previous success with building the longitudinal database (WDQI).• Track record of multiple state agencies working together.• Wage Explorer• Research and tools are sustainable after grant funding ends.
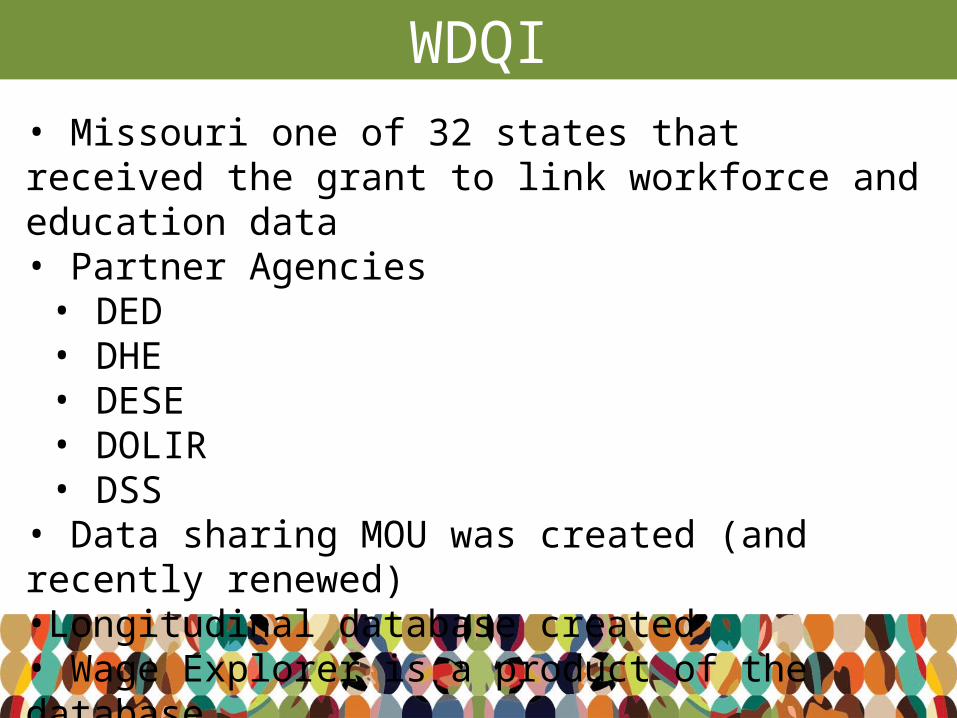
WDQI• Missouri one of 32 states that received the grant to link workforce and education data• Partner Agencies• DED• DHE• DESE• DOLIR• DSS• Data sharing MOU was created (and recently renewed) •Longitudinal database created• Wage Explorer is a product of the database

Wage Explorer
https://www.missourieconomy.org/wdqi/reportcard/SelectionPage.aspx

http://www.careerbridge.wa.gov/default.aspx
Sample Scorecard
http://www.careerbridge.wa.gov/default.aspx

Sample Scorecard
https://www.whitehouse.gov/issues/education/higher-education/college-score-card

Labor Market Summary

Gov Deliveryhttps://public.govdelivery.com/accounts/MODED/subscriber/new

Gov Delivery

Contact Information
Ronda AndersonWorkforce Research ManagerMissouri Economic Research and Information Center (MERIC)[email protected]