Georgia Statewide Transportation Plan/ Statewide Strategic ......Nov 06, 2013 · Collected GA...
51
Georgia Statewide Transportation Plan/ Statewide Strategic Transportation Plan Update Presented to: Stakeholder Advisory Committee November 6, 2013, Meeting #2
Transcript of Georgia Statewide Transportation Plan/ Statewide Strategic ......Nov 06, 2013 · Collected GA...

Georgia Statewide Transportation Plan/
Statewide Strategic Transportation Plan Update
Presented to:
Stakeholder Advisory Committee
November 6, 2013, Meeting #2

• Welcome – Kelly Gwin (GDOT)
• Project Overview – Kelly Gwin (GDOT)
• Existing Conditions Summary – Marc Cutler (CS)
• Economic & Financial Forecasts – Tracy Selin (CS)
• Outreach – Jamie Cochran (GSP)
• Next Steps – Kelly Gwin (GDOT)
Agenda
2
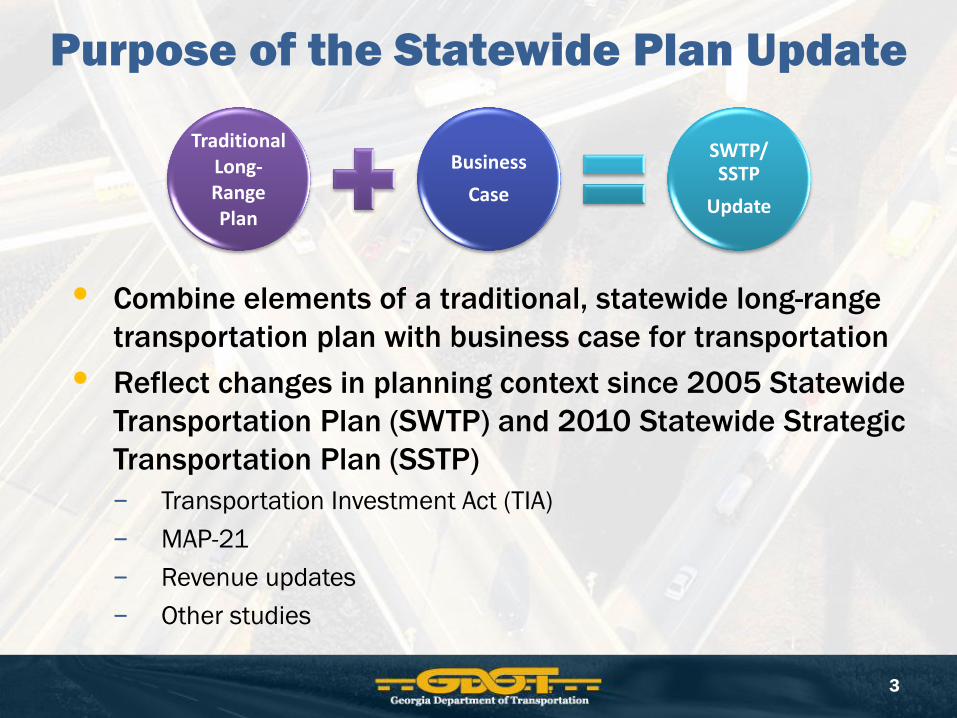
• Combine elements of a traditional, statewide long-range
transportation plan with business case for transportation
• Reflect changes in planning context since 2005 Statewide
Transportation Plan (SWTP) and 2010 Statewide Strategic
Transportation Plan (SSTP)
− Transportation Investment Act (TIA)
− MAP-21
− Revenue updates
− Other studies
Purpose of the Statewide Plan Update
Traditional Long-Range Plan
Business
Case
SWTP/ SSTP
Update
3

I. Document existing conditions across all
modes – November 2013
II. Forecast future conditions for year 2040 –
December 2013
III. Assess future deficiencies across all
modes – April 2014
IV. Develop program-level tradeoff analysis to
inform funding decisions – June 2014
V. Prepare investment recommendations and
final report – 2015
Plan Development Schedule
Existing Conditions
Future Conditions
Future Deficiencies
Trade-Offs
Recommended Investments
4

Modes
Highway
Transit
Air
Rail
Water/Freight
Bicycle and Pedestrian
Existing Conditions
Attributes
Inventory of Facilities
Capacity
Use
Performance
Major Issues/Deficiencies
5

6,968, 2.7% 669 , 0.3% 15,399 , 6.0%
21,705 , 8.4%
31,660 , 12.3%
14,886,5.8%
166,155, 64.5%
INTERSTATE
OTHER FREEWAYS AND
EXPRESSWAYS
OTHER PRINCIPAL
ARTERIAL
MINOR ARTERIAL
MAJOR COLLECTOR
MINOR COLLECTOR
LOCAL
Highway Lane-Miles
6
Source: GDOT Office of Transportation Data.
Total Lane Miles: 256,842

Daily Vehicle-Miles Traveled
7
Source : GDOT Statewide Model.
0.02
0.10
6.90
29.60
51.32
10.93
88.60
0.08
0.12
3.35
5.08
11.84
1.37
0 5 10 15 20 25 30 35 40 45 50 55 60 65 70 75 80 85 90 95
Local
Minor Collector
Major Collector
Minor Arterial
Principal Arterial – Other
Principal Arterial – Other Freeways and Expressways
Interstate
Daily VMT (in Millions)
Non-State Owned Facility
State Owned Facility
96

Congestion: Percentage of Miles State-Owned Urban and Rural Roads
0% 20% 40% 60% 80% 100%
Local
Minor Collector
Major Collector
Minor Arterial
Principal Arterial – Other
Principal Arterial – Other Freeways and Expressways
Interstate
A B C D E F
Percentage of Miles at Daily Levels of Service Source: GDOT Statewide Model.
4,329 miles
6,666 miles
5,536 miles
2 miles
8 miles
8
1,248 miles
139 miles
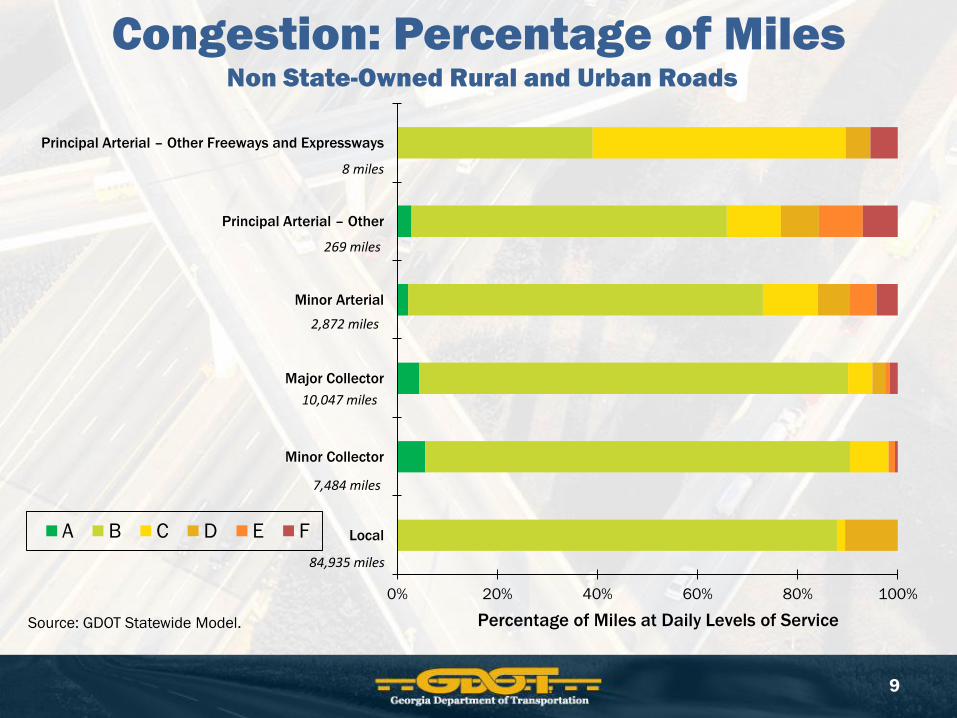
Congestion: Percentage of Miles Non State-Owned Rural and Urban Roads
0% 20% 40% 60% 80% 100%
Local
Minor Collector
Major Collector
Minor Arterial
Principal Arterial – Other
Principal Arterial – Other Freeways and Expressways
A B C D E F
Percentage of Miles at Daily Levels of Service
9
10,047 miles
269 miles
2,872 miles
8 miles
7,484 miles
84,935 miles
Source: GDOT Statewide Model.

87.98
#N/A
83.80
70.71
79.66 76.79 78.33
72.82
80.23
70.43
0
10
20
30
40
50
60
70
80
90
100
GDOT Other GDOT Other GDOT Other GDOT Other GDOT Other
Interstate Principal Arterial – Other
Freeways and
Expressways
Principal Arterial – Other Minor Arterial Major Collector
Weighted Average
COPACES
Pavement Condition
10
Source: GDOT State Maintenance Office.
State Non-State State Non-State State Non-State State Non-State State Non-State

0%
10%
20%
30%
40%
50%
60%
70%
80%
90%
100%
State County Municipal
Percent of
All Bridges
Good or Excellent
Functionally Obsolete
Structurally Deficient
6,632 7,317
564
Bridge Condition by Number
11
Source: National Bridge Inventory from GDOT Submissions.
14,281 Bridges
FO = cannot handle volume
SD = needs rehabilitation or
replacement

Bridge Condition by Deck Area
12
Source: National Bridge Inventory from GDOT Submissions.
0%
10%
20%
30%
40%
50%
60%
70%
80%
90%
100%
State County Municipal
Percent of
All Deck Area
Good or Excellent
Functionally Obsolete
Structurally Deficient
0.3 M SF
1.7 M SF
7.0 M SF

Source: Georgia Department of Transportation as of November 1, 2013.
Highway Fatalities
13
1,706 1,647
1,508
1,299 1,250 1,236 1,199
0
200
400
600
800
1,000
1,200
1,400
1,600
1,800
2006 2007 2008 2009 2010 2011 2012
Fatalities

Source: Georgia Department of Transportation as of November 1, 2013.
Highway Serious Injuries
14
6,230 5,890
5,054 4,832
3,223 3,121 2,872
0
1,000
2,000
3,000
4,000
5,000
6,000
7,000
2006 2007 2008 2009 2010 2011 2012
Serious Injuries

• Pavement and bridge condition on the
state-owned network is very good
• Pavement and bridge conditions on non-state
owned facilities have lower average condition
ratings
• Peak-period congestion in the Atlanta
metropolitan region is significant
• Some critical bottlenecks in other urban areas
Highway Findings
15

Transit Service by Type by County
Source: GDOT Office of Intermodal Programs.
16

Ridership
17
Unlinked Trips, in millions

• Dedicated funding source
• Service in rural areas
• Coordination of services
• Aging fleet
• Changing lifestyles and aging populations
increase demand in the future, in particular for
non-commute oriented travel
Transit Findings
18

State Bicycle Route Network
Example of Signed
State Bicycle Route Network
Source: GDOT.
19

Source: GDOT Office of Traffic Operations. (Total Crashes 2010-2012).
Crashes Involving a Bicycle by County
20

• Increasing traffic on designated bike routes
• Sidewalk coverage
• Coordination/filling system gaps
• Crash hot spots
Bicycle and Pedestrian Findings
21

Georgia’s Airports
Source: GDOT, FAA (September 2013).
22
• 104 airports operating in
2013, 9 commercial
• World’s busiest airport in
Atlanta
• Most airports have
excess capacity

Commercial Service Operation
0
200,000
400,000
600,000
800,000
1,000,000
1,200,000
1,400,000
1,600,000
2008 Operations (Takeoffs/Landings) 2012 Operations (Takeoffs/Landings)
Other Commercial Service Providers
Hartsfield-Jackson Atlanta International Airport (HJAIA)
23
Operations pre and post recession. Source: GDOT and FAA.

Commercial Service Enplanements
0
5,000,000
10,000,000
15,000,000
20,000,000
25,000,000
30,000,000
35,000,000
40,000,000
45,000,000
50,000,000
2003 2008 2012
Other Commercial Service Providers
Hartsfield-Jackson Atlanta International Airport (HJAIA)
Enplanements
Source: GDOT Intermodal and FAA Annual Enplanement Report.
24

• Airline consolidation
• Ridership stagnation outside of Hartsfield-Jackson
Atlanta International Airport (HJAIA)
• Limited cargo service outside of HJAIA and intense
national competition for HJAIA
• Some general aviation airports do not meet
runway length, taxiway turn-arounds, and Runway
Safety Area standards
• Funding
Aviation Findings
25

Truck
75%
Rail
25%
Water
0.20%
Air
0.06%
Truck
Rail
Water
Air
Total Tonnage (2007)
853 million tons
Source: Georgia Statewide Freight and Logistics Plan, GDOT, 2012.
Freight Tonnage by Mode
26
213.25 million tons
639.75 million tons
170.6 million tons
51.18 million tons

Source: State Transportation Board Designated Freight Corridors per GA code, 2013.
Designated Freight Corridors
27

Top State Trading Partners
for Georgia Truck Traffic
Source: 2007 TRANSEARCH Data.
29

Source: GDOT Truck-Only Lane Needs Identification Study, 2006.
Savannah Port Truck Trip Patterns
Distribution of Port Truck Trip Origins within Georgia
Distribution of Port of Savannah Truck Trip Origins within U.S.
30

Atlanta Regional Truck Trip Origins and Destinations NS Austell Intermodal Railyard
Source: GDOT SWTP/SSTP Intermodal Yard Truck Intercept Survey, August 2013.
31

Georgia Rail
Source: Georgia Statewide Freight and Logistics Plan, 2012.
32
Rail Density Rail Deficiencies Meeting Standard 286K Car Weight Minimum

Maximum Ship Sizes at Panama
Canal Today and After Expansion
33
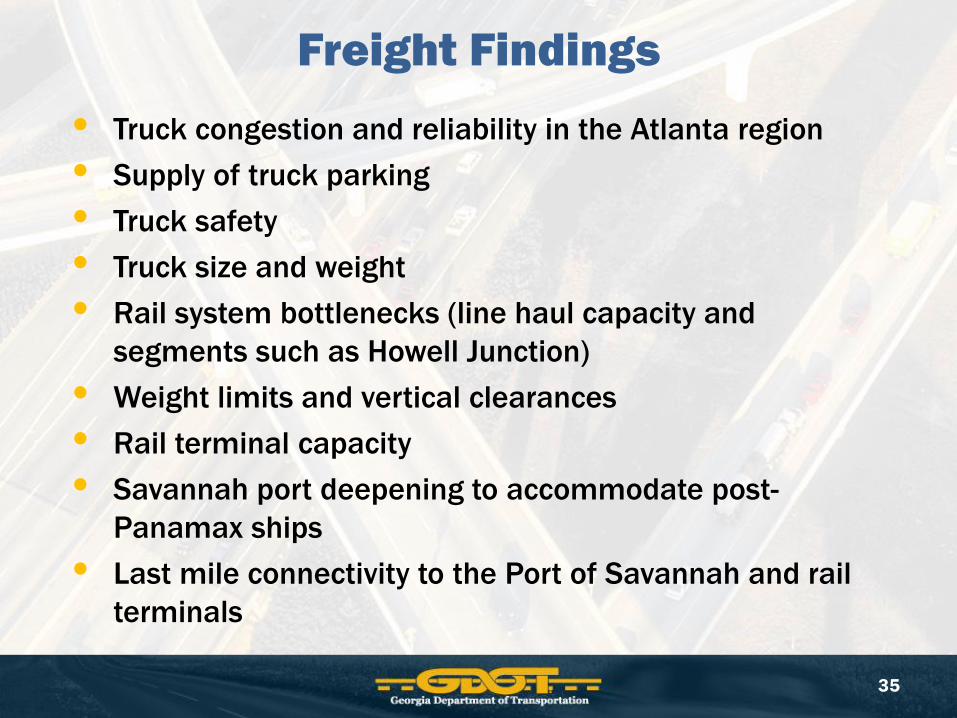
• Truck congestion and reliability in the Atlanta region
• Supply of truck parking
• Truck safety
• Truck size and weight
• Rail system bottlenecks (line haul capacity and
segments such as Howell Junction)
• Weight limits and vertical clearances
• Rail terminal capacity
• Savannah port deepening to accommodate post-
Panamax ships
• Last mile connectivity to the Port of Savannah and rail
terminals
Freight Findings
35

• Collected historical data from the U.S. Bureau of Economic
Analysis for comparison
− 11 year period (2001-2011) and 32 year period (1980-2011) used
for comparison
• Collected GA statewide forecast data :
− Georgia Governor’s Office of Planning and Budget (2012-2030)
− Georgia’s Workforce Statistics and Economic Research (2010-2020)
− Georgia Statewide Transportation Model (SWM) (2012-2040)
− All Georgia MPOs (2010-2040)
− Economy.com (2012-2043)
− REMI (2011 and 2012-2043)
• Economic indicators include population, employment,
and Gross State Product (GSP)
Economic Forecast Methodology
36

• Three funding tiers
− 2015-2020, 2021-2030, 2031-2040
• All funding sources
− Federal (FHWA and FTA)
− State (state general fund, state motor fuel tax, GTIB)
− Local/Regional (MARTA sales tax and fares, TIA,
managed lanes, local funds used for highways)
• Fiscally Constrained Scenario
− Stable fund sources projected into the future
• Fiscally Unconstrained Scenario
− Less conservative assumptions
Financial Forecast Methodology
37

• Continuous throughout study process
• Tailored outreach, targeting engagement methods to
different audiences
• Project website – 490 hits in the first month
(www.dot.ga.gov/SSTP-SWTP)
• Ongoing input via: ― Plan update web site
― Statewide outreach
― On-line survey, smartphone link
― Consultation with local elected
officials, agency representatives
― Stakeholder Advisory Committee
Stakeholder Outreach
38

Fall Festival Public Outreach GDOT
District Festival County Date
Surveys
Received
1 Big Red Apple Festival Habersham 10/12/13 164
2 Kaolin Festival Washington 10/12/13 49
3 Shady Days in Gay Meriwether 10/05/13 41
4 Georgia Peanut Festival Worth 10/19/13 67
5 Rock Shrimp Festival Camden 10/05/13 158
6 Georgia Apple Festival Gilmer 10/19/13 64
7 Atlanta Streets Alive Fulton 10/06/13 62
TOTAL 605
39

Fall Festival Public Outreach Locations
40
6
1
7
3
2
4 5

Festival Survey Form
41

Festival Survey Form (cont’d)
42

What is the Best Thing About Georgia’s
Transportation System?
59%
5%
19%
11% 6%
Maintenance of the
roads and highways
Transit
Local walking and
biking opportunities
Airports, railroads &
ports
Other
43

Where Are Opportunities for
GDOT to Improve?
22%
18%
16%
26%
4%
11% 3%
Maintenance of the roads and
highways
Safety of roads
Transit options
Local walking and biking
opportunities
Airports, railroads & ports
Strategic investment to support
economic development
Other
44
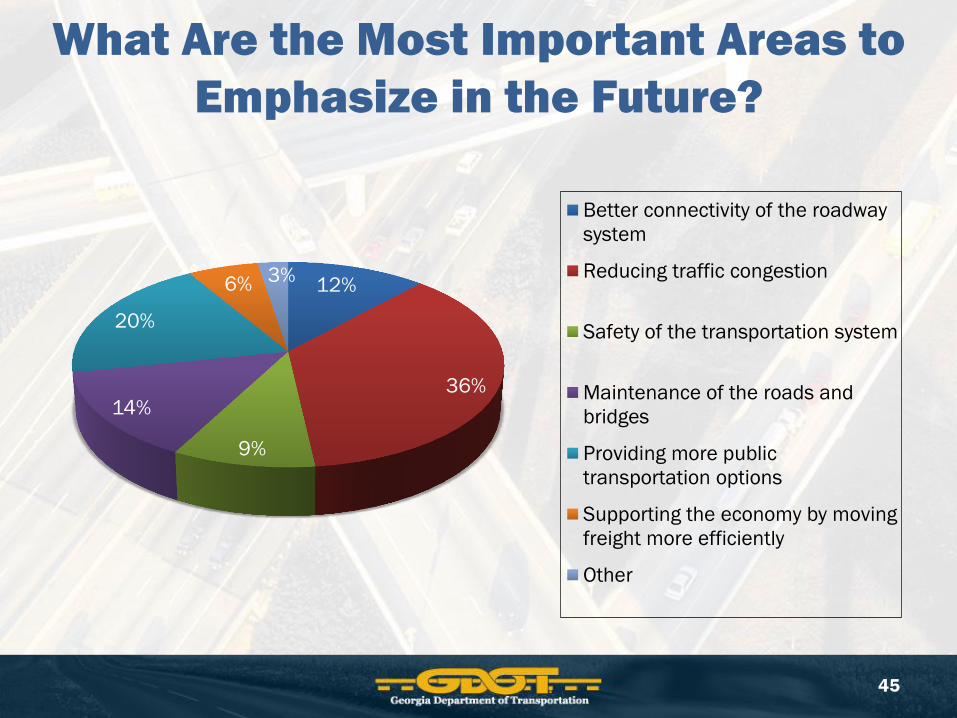
What Are the Most Important Areas to
Emphasize in the Future?
12%
36%
9%
14%
20%
6% 3%
Better connectivity of the roadway
system
Reducing traffic congestion
Safety of the transportation system
Maintenance of the roads and
bridges
Providing more public
transportation options
Supporting the economy by moving
freight more efficiently
Other
45

Looking to the Future, What is Georgia’s
Most Valuable Transportation Asset?
32%
39%
9%
9%
10% 1%
State roads
Interstate system
Local walking and biking
opportunities
Transit systems
Airports, railroads & ports
Other
46

What Are the Most Significant Transportation
Challenges Georgia Faces in the Next 25 Years?
4,595 2,200
2,075
1,835
1,525
1,345
770
660
550
105
Aging and deteriorating infrastructure
Rising transportation costs
Increasing traffic/congestion delays
Safety
Increasing truck traffic on our highways
The travel needs of the elderly
Reliability of our public transit services
Increasing distances we have to travel
Land development patterns
Other
Scoring Scale
#1 Priority – 15 points
#2 Priority – 10 points
#3 Priority – 5 points
47

Scored Statements
2.28 2.47 2.58
3.72
1.77 1.95
It is easy to get
where I need to
go; there is good
connectivity.
The roads are
safe.
The roads and
bridges are well
maintained.
I have public
transit options
to choose from.
Airports,
railroads and
ports are
important to the
economy.
My commute
time to work or
school takes
about the same
amount of time
each day (i.e., it
is "reliable").
1.00
2.00
3.00
4.00
5.00
Using a scale of 1 through 5 with “1” meaning “I strongly agree”
and “5” meaning “I strongly disagree”, please score the following
statements based on your experience.
Strongly
Disagree
Strongly
Agree
48

What Are Your Top Traveling Priorities?
6,870
3,560
2,250
1,815
1,790
470
460
50
Safety
Travel time
Reliability
Cost
Convenience
Health benefits
Comfort
Other
Weighted Score
49
Scoring Scale
#1 Priority – 15 points
#2 Priority – 10 points
#3 Priority – 5 points
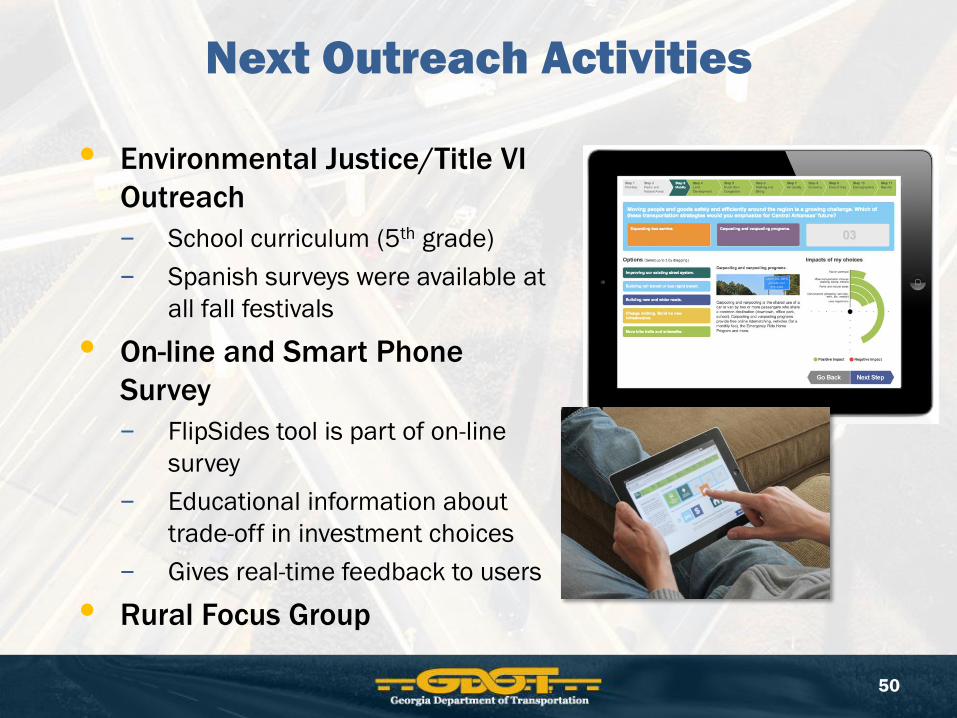
Next Outreach Activities
• Environmental Justice/Title VI
Outreach
− School curriculum (5th grade)
− Spanish surveys were available at
all fall festivals
• On-line and Smart Phone
Survey
− FlipSides tool is part of on-line
survey
− Educational information about
trade-off in investment choices
− Gives real-time feedback to users
• Rural Focus Group
50

Next Steps
Future Deficiencies Analysis
Spring 2014 (Third SAC Meeting)
Tradeoff Analysis
Fourth Stakeholder Advisory Committee Meeting, Summer 2014 – Tradeoff Analysis
51

Questions?
52

Georgia Department of Transportation
Attn: Ms. Kelly Gwin,
Phone: (404) 631-1987
Project web site – www.dot.ga.gov/SSTP-SWTP
Project Contact Information
53