Data and disease. B Healthy person A Person with chronic bronchitis 543210 543210 Total volume of...
18
Data and disease
-
Upload
darrell-dixon -
Category
Documents
-
view
213 -
download
0
Transcript of Data and disease. B Healthy person A Person with chronic bronchitis 543210 543210 Total volume of...

Data and disease

Data and disease
B Healthy person
A Person with chronic bronchitis
5
4
3
2
1
0
Total volume of air breathed out/dm3
0 1 2 3 4 5 6
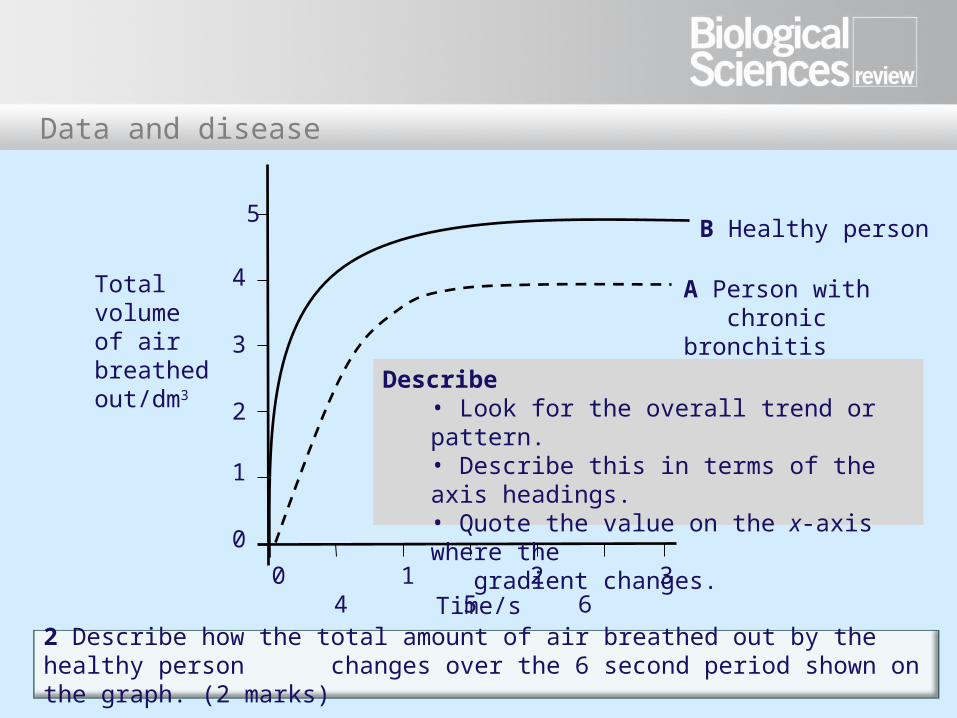
A person with chronic bronchitis breathed out as hard as he could. Curve A on the graph shows the volume of air he breathed out in 6 seconds. Curve B shows the results for a healthy person.
Read the stemRead the stem
Check the axesCheck the axes
Time/s
Understand Understand what the graph what the graph as a whole is as a whole is
telling youtelling you

Data and disease
B Healthy person
A Person with chronic bronchitis
5
4
3
2
1
0
Total volume of air breathed out/dm3
0 1 2 3 4 5 6Time/s
1 Describe how the diaphragm helps to bring about the changes shown in curve B. (3 marks)
This is straightforward if you have understood what the graph is showing you.

Data and disease
B Healthy person 5
4
3
2
1
0
Total volume of air breathed out/dm3
0 1 2 3 4 5 6Time/s
1 Diaphragm relaxes; Moves up/Becomes dome-shaped; Pressure in thoracic cavity increases; Volume (of air in lungs) decreases;
3 marks (max)
1 Describe how the diaphragm helps to bring about the changes shown in curve B. (3 marks)
Data and disease
B Healthy person
A Person with chronic bronchitis
5
4
3
2
1
0
Total volume of air breathed out/dm3
0 1 2 3 4 5 6Time/s
2 Describe how the total amount of air breathed out by the healthy person changes over the 6 second period shown on the graph. (2 marks)
Describe• Look for the overall trend or pattern. • Describe this in terms of the axis headings. • Quote the value on the x-axis where the gradient changes.

Data and disease
B Healthy person 5
4
3
2
1
0
Total volume of air breathed out/dm3
0 1 2 3 4 5 6Time/s
2 Describe how the total amount of air breathed out by the healthy person changes over the 6 second period shown on the graph. (2 marks)
2 The volume (of air breathed out) increases then levels out;

Data and disease
B Healthy person 5
4
3
2
1
0
Total volume of air breathed out/dm3
0 1 2 3 4 5 6Time/s
2 The volume (of air breathed out) increases then levels out;
At approximately 3 seconds;
2 marks
2 Describe how the total amount of air breathed out by the healthy person changes over the 6 second period shown on the graph. (2 marks)
Data and disease
B Healthy person
A Person with chronic bronchitis
5
4
3
2
1
0
Total volume of air breathed out/dm3
0 1 2 3 4 5 6Time/s
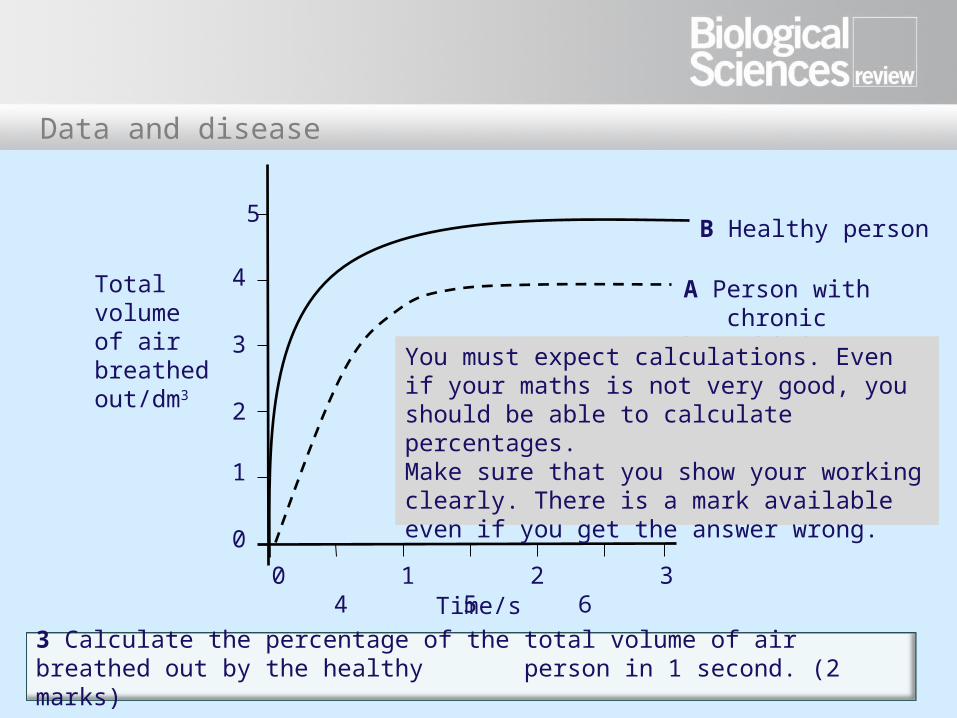
3 Calculate the percentage of the total volume of air breathed out by the healthy person in 1 second. (2 marks)
You must expect calculations. Even if your maths is not very good, you should be able to calculate percentages.Make sure that you show your working clearly. There is a mark available even if you get the answer wrong.

Data and disease
B Healthy person 5
4
3
2
1
0
Total volume of air breathed out/dm3
0 1 2 3 4 5 6Time/s
3 Give yourself 2 marks if you have got a value of 82%;
Give yourself 1 mark if your answer is wrong but you have shown clearly that you have used figures for the volume breathed out after 1 second and the total volume breathed out;
2 marks
3 Calculate the percentage of the total volume of air breathed out by the healthy person in 1 second. (2 marks)

Data and disease
B Healthy person
A Person with chronic bronchitis
5
4
3
2
1
0
Total volume of air breathed out/dm3
0 1 2 3 4 5 6Time/s
The total volume of air breathed out = 5 dm3
The volume of air breathed out after 1 sec = 4.1 dm3
4.1 as a percentage of 5.0 = 4.1 100 5.0= 82%
3 Calculate the percentage of the total volume of air breathed out by the healthy person in 1 second. (2 marks)

Data and disease
B Healthy person
A Person with chronic bronchitis
5
4
3
2
1
0
Total volume of air breathed out/dm3
0 1 2 3 4 5 6Time/s
4 Doctors use the percentage of the total air breathed out in 1 second to help confirm that a person has chronic bronchitis.

Data and disease
B Healthy person
A Person with chronic bronchitis
5
4
3
2
1
0
Total volume of air breathed out/dm3
0 1 2 3 4 5 6Time/s
4 (a) Explain why it is better to use the percentage of air breathed out in 1 secondrather than the total amount of air breathed out in 1 second. (2 marks)
Explain means give a reason why. Start your answers to these two parts with the word, Because…

Data and disease
B Healthy person
A Person with chronic bronchitis
5
4
3
2
1
0
Total volume of air breathed out/dm3
0 1 2 3 4 5 6Time/s
4 (a) Explain why it is better to use the percentage of air breathed out in 1 second rather than the total amount of air breathed out in 1 second. (2 marks)
4 (a) Because it allows comparison; The lung volume/total amount of air breathed out will vary; According to a person’s size; 2 marks max

Data and disease
B Healthy person
A Person with chronic bronchitis
5
4
3
2
1
0
Total volume of air breathed out/dm3
0 1 2 3 4 5 6Time/s
4 (b) Measuring the percentage of air breathed out in 1 second helps to confirm that a person has chronic bronchitis. Use the information in this question to explain why. (2 marks)
Explain means give a reason why. Start your answers to these two parts with the word, because. All the information you need to answer this is in the stem of this part of the question.
Chronic bronchitis is a disease in which the bronchi in the lungs are inflamed and produce a lot of mucus. People with chronic bronchitis have difficulty breathing.

Data and disease
B Healthy person
A Person with chronic bronchitis
5
4
3
2
1
0
Total volume of air breathed out/dm3
0 1 2 3 4 5 6Time / s
4 (b) Because the bronchi are blocked by mucus/ inflamed tissue; Less air can pass out; 2 marks
4 (b) Measuring the percentage of air breathed out in 1 second helps to confirm that a person has chronic bronchitis. Use the information in this question to explain why. (2 marks)

Data and disease
+40
+30
+20
+10
0
10
20
30
1976 1980 1984 1988 1992 1996
Number of cases of asthma
Concentration of substances from vehicle
exhausts in the air
Scientists recorded the number of cases of asthma and the concentration of some substances found in vehicle exhausts.
Read the stemRead the stem
Check the axesCheck the axes
Understand what the graph as Understand what the graph as a whole is telling youa whole is telling you

Data and disease
+40
+30
+20
+10
0
10
20
30
1976 1980 1984 1988 1992 1996
Number of cases of asthma
Concentration of substances from vehicle
exhausts in the air
5 Some people have suggested that substances present in vehicle exhausts cause asthma. Use Figure 2 to evaluate this suggestion. (3 marks)
• Start by looking at the data and saying how they support this idea.
There is positive correlation (between number of cases of asthma and concentration of substances in vehicle exhaust) between 1976 and 1980.

Data and disease
+40
+30
+20
+10
0
10
20
30
1976 1980 1984 1988 1992 1996
Number of cases of asthma
Concentration of substances from vehicle
exhausts in the air
5 Some people have suggested that substances present in vehicle exhausts cause asthma. Use Figure 2 to evaluate this suggestion. (3 marks)
• Now write the word ‘but’ and describe how the data fail to support this idea.
ButAlthough two things are correlated, this does not mean that one causes the other;Some other factor may be involved;There is a negative correlation after 1980;