Currents in Fishery Management
50
Portland State University Portland State University PDXScholar PDXScholar University Honors Theses University Honors College 11-2016 Currents in Fishery Management Currents in Fishery Management Genevieve DePuy Portland State University Follow this and additional works at: https://pdxscholar.library.pdx.edu/honorstheses Let us know how access to this document benefits you. Recommended Citation Recommended Citation DePuy, Genevieve, "Currents in Fishery Management" (2016). University Honors Theses. Paper 346. https://doi.org/10.15760/honors.338 This Thesis is brought to you for free and open access. It has been accepted for inclusion in University Honors Theses by an authorized administrator of PDXScholar. Please contact us if we can make this document more accessible: [email protected].
Transcript of Currents in Fishery Management

Portland State University Portland State University
PDXScholar PDXScholar
University Honors Theses University Honors College
11-2016
Currents in Fishery Management Currents in Fishery Management
Genevieve DePuy Portland State University
Follow this and additional works at: https://pdxscholar.library.pdx.edu/honorstheses
Let us know how access to this document benefits you.
Recommended Citation Recommended Citation DePuy, Genevieve, "Currents in Fishery Management" (2016). University Honors Theses. Paper 346. https://doi.org/10.15760/honors.338
This Thesis is brought to you for free and open access. It has been accepted for inclusion in University Honors Theses by an authorized administrator of PDXScholar. Please contact us if we can make this document more accessible: [email protected].

1
Currents in Fishery Management
by
Genevieve DePuy
An undergraduate honors thesis submitted in partial fulfillment of the
requirements for the degree of
Bachelor of Science
in
University Honors
and
Political Science With minors in International Studies and Sustainability
Thesis Adviser
Joshua Eastin
Portland State University
2016

2
ABSTRACT
This thesis provides an overview of fishery management policy types and attempts to
determine best practices for biological sustainability in terms of species preservation and
biomass recovery. Key concepts include biological sustainability, regulatory forces, and fishery
management and output trends. The research question investigated is: what are the best policy
practices for regulating marine fishery health and biological stability? The research process of
this paper included a review of prior literature in the field of marine policy and fishery
management, as well as the use of United States data from the Pacific and Atlantic coasts to
evaluate management strategies. Based on both the literature review and the results of the data
from Pacific and Atlantic Fisheries, the best management structure appears to be the co-
management approach while the best management methodologies involve ecosystem protections
and quotas.
INTRO
There are some estimates based on stock status plot models that world fisheries will
collapse by 2048 (Worm et al. 2006, Pauly et al. 2013). While this estimated date has been
second-guessed and criticized, the idea that marine fisheries are under severe biological strain is
widely agreed upon and there is evidence that worldwide fishery biomass is declining (Food and
Agriculture Organization 2011). If best management policies can be established, species
preservation and biomass restoration may become possible. This is important not only for
economic health but for ecosystem health, as species collapses can lead to cascade failures of
trophic webs (Frank et al. 2005). Overall, the research I have done and the research of those who
have studied the field before me indicates that co-management is the best structure, while basing
policies on ecosystem preservation is the most effective strategy for fishery sustainability. Co-

3
management involves user groups and other interested parties in the decision-making process of
the fishery and therefore increases compliance with regulations. Ecosystem-based management
acknowledges the importance of whole trophic chains and habitats in preserving commercially
important species and other of-interest fish species.
In my research, I have found that United States fishery management councils in the
Pacific emphasize co-management, while those in the Atlantic appear to be much more focused
on top-down management. On both coasts of the U.S., fishery management councils use best
available scientific data to make policy determinations, and ecosystems are an area of concern,
reflecting a consideration of both Ecosystem-Based Management and the Precautionary
Approach, which will be discussed in further detail later in this paper. Overall, the fisheries in
the Pacific appear to be better-managed, as they have fewer species listed as endangered or
threatened under the Endangered Species Act, and a slower rate of decline even in the years of
most dramatic commercial catch reduction. Of course, there are differing histories of fishery
exploitation on each coast, and modern management is not the sole cause of current state of
affairs, but in a competition between co-management and top-down management strategies, the
first seem more likely to succeed in the preservation of fishery biomass and the industry that
depends on it.
PURPOSE AND IMPORTANCE
According to the United Nations Food and Agriculture Organization’s State of World
Fisheries and Aquaculture (SOFIA) 2014 report, 3.1 billion people worldwide depend on fish for
twenty percent or more of their animal protein intake. This creates a massive demand, which is
projected to increase as world population does. Supply can only keep pace with this rising
pressure if fish are available- that is, if the biological health of fisheries and fish populations does

4
not collapse. However, marine fisheries worldwide are currently in decline, with projections of
total collapse as early as 2048 (Worm et. al. 2006).
While ocean acidification and rising sea temperatures bear some responsibility for the
overall decline of marine ecosystem health, the reason for the collapse of marine fisheries is
generally acknowledged to be direct and indirect effects of fishing and fishing methods. What
should be done to address these degrading effects has been the subject of debate; some
researchers argue that management regimes should offer greater incentives in conjunction with
enhanced enforcement ability (Beddington et al 2007), while others emphasize the participation
of user groups in management decision-making processes (Jentoft et al. 1998, Aswani 2005,
Larkin 1996, Salmi 1998). Methods of catch restriction that have received substantial attention
are Individual Transferable Quotas (ITQs) (Beddington et. al. 2007, Costello et. al. 2008, Deacon
2012), and Total Allowable Catch (TAC) restrictions, gear restrictions, and days-at-sea limits,
though there are many other efforts to curb the effects of overfishing while still meeting
consumer demand.
If general marine fishery management best practices can be established in order to
preserve marine biomass and ecosystem diversity, the health of economic, biological, and social
systems dependent on fishery health and operation stand a better chance of preservation. To this
end, the purpose of this thesis project is to compare marine fishery management types and
determine which approaches best serve the goals of biodiversity and species restoration. I have
read prior research in this field and created a literature review outlining common practices and
the efficacy of various management approaches, as well as retrieved primary data from
governmental databases in order to exemplify two different management structures; top-down
and co-management. Those who have written on the question of fishery sustainability before

5
have a professional range from biologists and marine scientists to environmental ethics scholars,
economists with environmental focuses, and political scientists and policy makers. Given this
assortment of participants, the evidentiary archive I draw from consists of government record
and policy documents, biological studies, histories of fisheries and statistical projections for
future use trends.
Discourse within this community is predicated upon several assumptions, including the
idea that biological resources (in this case, fish) are finite, so there is a need for conservation
policy; the existence of imperfect biological data and catch reporting; and competing
environmental and economic interests. These assumptions exist within the theoretical
frameworks of multiple disciplines, in particular operating within the concepts of economic
competition and common good problems, market failures to control fishing in the present while
conserving enough stock to provide for future demand, the tension between conservation and use
values, and management strategies implemented by policy makers and the resource users (fishing
communities). Key players in the field of fishery management are fisher communities,
governments or regulatory bodies, and interest groups. Key players in the discourse community
surrounding fishery management policy are regulatory committees and ruling bodies such as
states and government agencies like the National Oceanic and Atmospheric Association,
divisions of the European Union and United Nations, and interest organizations like Greenpeace,
as well as research teams and individual researchers. Those who publish discourse on this topic
use a range of methodologies, from statistical projections, tests, and observations to policy
reviews and studies based on scientific data and management information pertaining to specific
fisheries. The methodology for this project involved researching the topic through the
evidentiary archive of publications from the social and biological sciences related to fishery

6
stock and management, using articles from the journals Review of Environmental Economics and
Policy, Marine Policy, and others, as well as government documents and policy advisement
studies to categorize common fishery management in one of two ways; co-management and top
down. These organizational structures make use of various approaches to protecting or managing
fisheries, such as restrictive management, ecosystem-based management, and the precautionary
approach.
From this review and categorization, the evidence suggests that the most effective means
of fishery management is co-management. Marine fisheries on the Pacific and Atlantic coasts of
the United States are used as examples of differing policy types due to availability of data and
legal framework for implementation and enforcement of fishery policy, and in comparison the
co-managed fisheries on the Pacific Coast have shown themselves more productive, largely due
to the Alaskan harvests of Pollock and Cod.
DISCUSSION OF CONCEPTS AND DEFINITION OF TERMS
Three concepts that coincide in the discussion of fishery management are the limits to
growth theory, market-based environmentalism, and biological conservation. Because fish are
viewed as a commodity, the catch and sale of fish is dictated by market forces. Demand for fish
interacts inherently with the supply of fish, which is basically determined by biological
circumstances. In this way, fish, as well as many other commodities taken from nature, are the
subject of research and discussion in both economics and biology. The tension between what the
market demands and what the natural world is able to provide has been the topic of great concern
for many years, particularly since Thomas Malthus’ Essay on the Principle of Population
covering the topic and leading to the development of the limits to growth theory, which posits
that human population growth will outstrip the ability of the earth to provide the resources

7
necessary to support the populace and ultimately constrain human population growth (1798).
While Malthus’ original prediction concerning the inability of terrestrial agriculture to support
the human population has been largely disregarded since the Green Revolution (Economist
2008), there remains a threat that humans will demand too much of some aspect of nature, be it
the ability of the atmosphere to absorb carbon (scientists report that we have passed the “point of
no return” at 400ppm as of September 2016 (Earth System Research Laboratory 2016)) or the
ability of the oceanic ecosystem to provide fish; as already discussed, there are estimates of near-
total fishery collapse occurring within the next 40 years. Given the biological limitations,
otherwise known as carrying capacity, the market must come up with ways to make itself
sustainable so that the sale of commodities continues in the future and market collapse does not
occur alongside the collapse of biological populations.
Free market environmentalism is a school of thought that advocates addressing
environmental problems using market-based solutions. Since the free market has historically not
protected the environment, “free market” or market-based environmentalism today includes
developing policies to impose an economic value on environmental resources (Property and
Environment Research Center 2016). Market-based solutions for environmental problems
generally rest on assigning property rights, done by a government or other policy-making actor
attempting to correct for externalities in transactions or imperfect information (Maser 2016).
These solutions might come in the form of a carbon-trading scheme for producers or an
Individual Transferable Quota (ITQ) for a fishery. Essentially, market-based environmentalism
posits that environmental sustainability can be achieved through the marketization of resources
(Keohane & Olmstead 2007). However, as previously stated, economics-based management of
natural resources may not preserve those resources because of the tendency of individuals to

8
maximize current gain at the expense of the health of the resource and possible future gain
(Hardin 1991). The collapse of fisheries (and other natural resources) causes economic harm
when they no longer generate revenue. According to Roughgarden and Smith (1996), managing
a fishery for ecological stability will result in a fishery which maximizes both short-term revenue
and ecological sustainability (and therefore long term revenue).
Biological conservation is a field in its own right, aimed at protecting the Earth and its
biological diversity and finding ways for humanity to develop and coexist within nature without
destroying existing systems. In the world of fishery management, biological conservation
generally takes the form of Ecosystem-Based Management (EMB) and/or the Precautionary
Approach (PA), two ideas that rest on protecting the physical environment of the fish and
keeping stock populations high enough to replenish themselves. This does not mean not fishing
at all; it focuses on allowing fish stocks the population levels, habitat, and breeding period they
need to recover based on the best scientific data available. A common problem with making
marine policy and fishery management policy in particular is that the data available on fish
stocks is uncertain, and the Precautionary Approach dictates that all policy and fish take should
err on the side of caution. Allowing fish populations to replenish themselves is a sustainable
approach because without doing so a fishery can collapse. In the case of collapse, the fishery
would no longer be profitable or able to supply food for the 3.1 billion humans who depend on
fish for twenty percent or more of their protein (FAO 2014). According to “Best practices for
high seas fisheries management,” operating on the basic strategies of EBM and PA is crucial for
protecting ecosystems and fish stock sustainability (Mooney-Seuss & Rosenberg 2007). Taking
measures to protect habitats, conducting research including “experimental fisheries,” and using
effective enforcement, best scientific data available, and a multi-species approach to

9
management decisions is also central to sustainable management. Single-species management
techniques have been deemed inadequate due to the commercial fixation of these policies and
their disregard for conservation (Mooney-Seuss & Rosenberg 2007).
Of course, markets do not often supply where there is no demand, and sometimes demand
is not based on need alone. Social factors can also create demand and pressures on fisheries or
management strategies, like the push to protect animals that are valued for the simple fact of
their existence in some countries, such as dolphins and whales. This can lead to an additional
facet of tension in the fishing industry, an overlay of cultural judgment on those who ignore both
biological data and cultural pressure from the world at large and continue to support things like
whaling or shark finning industries. That said, there are many social factors which encourage the
consumption of fish, from cultural norms of fishing for sport to valuation of salmon or lobster
over a more common fish or vegetable dish. In some places in the world, norms and tradition can
lead to ignoring biological data and international convention, as is the case in the continuance of
the shark finning and whaling industries despite the International Whaling Commission’s
moratorium (World Wildlife Fund 2016) and international pressures to stop or reduce marine
mammal take. Much of the discussion that follows will focus on economic and biological data,
but socio-cultural aspects of the fishing industry and other exploitations of natural resources
should not be overlooked.
Another important factor in fishery management is the awareness of environmental
degradation. There are fishery practices that destroy the habitat of commercial fish populations
or other important marine ecosystems, such as coral reefs. These practices include bottom
dredging for shellfish, trawling (dragging equipment along the seafloor, often disturbing
organisms and tearing out coral), and discarding nets and other waste which destroys habitats. In

10
fact, there are so many derelict nets in the ocean that a special project in Honolulu used 660 tons
of recovered and recycled nets for energy between 2006 and 2009, just in Hawai’i (Casey 2009).
The biological conservation effort occurring in the world’s oceans takes many forms, from
cleanup projects like the net recycling to independent organizations such as Sea Shepherd that
work to protect sea life and regulatory programs like Marine Protection Areas which limit human
interference in ecologically or culturally valuable areas of the ocean.
Biological protection of the ocean and fish populations is important for a variety of
reasons, from the operation of the ocean as a carbon sink (Pacific Marine Environmental
Laboratory 2016) to the importance of biodiversity and the necessity to protect ecosystems. It is
also important to preserve food webs to prevent trophic collapse and species endangerment. The
effort to protect marine species from the damages of commercial fisheries is frequently
challenged by market demands and the environmental impact of other human activities, such as
the formation of hypoxic dead zones from agricultural runoff (Lindgren 2015). Determining
what fishery management practices allow for species preservation and biomass replenishing is
important because it is a large piece of a complex biological puzzle whose completion has
economic and social consequences.
Terms that provide relevant knowledge for the discussion of fisheries can be separated
into three categories: economic, management, and biological. Economic terms used in the
discussion of fisheries include: common pool resources, free rider problem, market-based
management, and self-interest. Common pool resources are those resources which are difficult to
exclude actors from using and which are subject to overuse because one actor’s use subtracts
from the ability of others to use. In other words, the resources are finite and non-excludable.
(Ostrom 1990, Maser 2016). This is an issue in marine policy management because of the

11
vastness of the ocean/fishing areas, the difficulty in excluding any actors from using fish in
international waters, and the incentive to over-fish (overuse) in those areas due to economic
motivations. This scenario leads to the free-rider problem, frequently associated with common
pool resources. It occurs when a good is provided by a community for use by all of those within
that community but some members do not pay their “fair share” of the provision cost, enjoying
the benefits for free (Baumol 1952). This scenario becomes problematic when the threat of non-
contributing free riders dis-incentivizes others from providing the good or participating in the
system. In the case of fisheries management, this can mean that states and other actors are not
incentivized to participate in policies of restraint because they fear that by doing so they will be
handing larger shares of the market to competing actors. Self-interest is one of the key
assumptions of the rational actor model as applied to communities and states, which argues that
entities are rational self-interested actors who pursue their own wellbeing. As Garrett Hardin
summarized in his 1991 essay the Tragedy of the Commons, public goods are non-excludable
and tend to be overexploited because personal reward is valued above public cost. This concept
underlies the economic activities of the users of fisheries, particularly marine fisheries located in
international waters where catch is a matter of competition and actors maximize their own gain
at the expense of others and the resource itself. Market-based management strategies involve the
privatization of environmental resources and putting economic value on the environment to
allow trading (Pearce 1991). Catch shares and dedicated access privileges are examples of
market-based fishery management, which some argue reduces the incentive of users to consume
the resource with destructive consequence, because the resource is no longer viewed as a
commons but rather as a private, personal good (Costello 2008, Beddington et al. 2007).

12
Common terms used in the discussion of management in prior literature include: top-
down management strategies, bottom-up management strategies, co-management strategies,
ecosystem-based management, and the precautionary approach. Top-down management
techniques are those which are imposed by a regulatory body such as a government or other
administrative body. These may include Total Allowable Catch shares and other harvest
strategies as well as reference points and management objectives (Beddington et al. 2007,
Costello 2008, Mooney-Seus & Rosenberg 2007). Bottom-up management strategies are rights-
based and depend on user groups who own the fisheries making their own management
decisions. Since the establishment of Exclusive Economic Zones (EEZs) controlled by states,
these are found in their purest form in places where user communities do not depend on licenses
from the state to operate, like in the open ocean. However, since fisheries have largely been
privatized or nationalized, bottom-up management is not a wide-spread occurrence. Co-
management strategies combine top-down and bottom-up techniques, generally in the form of
regulatory bodies discussing management objectives with user groups: for example, the fisheries
councils on the Pacific Coast of the United States, which are administrative agencies, cooperate
with fishing communities, tribal interests, and the public in order to create restrictions for the
fisheries they manage (NOAA Fisheries 2016; NPFMC 2016). It is argued by many to be the
most successful of the management techniques, because the participation of user groups in rule-
making incentivizes cooperation with those rules (Sevaly & Nielsen 1996, Jentoft et al. 1998,
Beddington et al. 2007, Costello et al. 2008, Costello et al. 2016). Ecosystem-based management
and the precautionary approach are both practices designed to improve the biological success and
preservation of fisheries. Ecosystem-based management uses research and available data to
estimate a sustainable catch level rather than relying on markets to dictate how much fish will be

13
caught, while the precautionary approach stipulates that fisheries and fish take must err on the
side of caution, recognizing that biological data is imperfect and aiming to preserve fish stocks at
a self-replenishing sustainable level without forgoing catch altogether (Mooney-Seus &
Rosenberg 2007). Both the precautionary approach and ecosystem based management are tools
that are used by various types of management regimes, detailed in the next section.
MANAGEMENT TYPES
Using the literature in the field, I have divided management types into three broad
headings: restrictive, top-down, and co-management. While restrictive management is a tool, co-
management and top-down management are regime structures. Restrictive management is
prevalent enough to be given its own descriptive section, though other tools of regimes such as
EBM (ecosystem-based management) and PA (precautionary approach) are described in context
rather than in explicit sections below.
Restrictive management: This is the term I have chosen to describe the management strategy in
play when gear types are regulated, when days-at-sea are regulated, or number/type of ships in a
fleet are regulated. These kinds of restrictions have been legislated, particularly by the
Magnuson-Stevens Act in the United States, but can also come from international law or
regulations regarding bycatch and environmental externalities judged using the Precautionary
Approach (PA) and Ecosystem-Based Management (EBM) (Stevenson 2006, Magnuson-Stevens
Fishery Conservation and Management Act 2007, Mooney-Seuss & Rosenberg 2007). PA is the
perspective that even though data available on fish stocks and fishery status can be ambiguous,
best available data should be considered and protection policies should be implemented with the
aim of preserving fishery health. The FAO’s 1996 “Technical Guidelines for Responsible
Fisheries” establishes that the burden of proof belongs on the shoulders of resource users and

14
recommends the Precautionary Approach as a management strategy for fisheries worldwide.
EBM comes from an interdisciplinary understanding of fisheries and fishing, taking into account
multiple factors for regulation but particularly the impact of a practice on the marine ecosystem
(Larkin 1996, Salmi 1998, Aswani 2005). Restrictive management strategies tend to draw from
the biological sciences, resulting from examinations of impact on the physical environment or
biomass of fisheries, and are often codified in government policy. For example, fishing gear
types are listed in the National Oceanic and Atmospheric Administration (NOAA) Technical
Memorandum NMFS-NE-181, “Characterization of the Fishing Practices and Marine Benthic
Ecosystems of the Northeast U.S. Shelf, and an Evaluation of the Potential Effects of Fishing on
Essential Fish Habitat,” which is a document that informs restrictive policy within the United
States, aiming to “provide assistance in meeting the Essential Fish Habitat (EFH) mandates of
the Magnuson-Stevens Fishery Conservation and Management Act (MSA)” (Stevenson et al.
2006). The use or restriction of various types of gear or ships can be influenced by a variety of
factors, from competition between users to environmental impact (Kaiser et al. 2000). One
critique of restrictive management is that when management programs are based on controls to
access and use like spatial and gear restrictions, disparate incentives may arise (Metzner 2005).
A popular means of restrictive fishery management is the Individual Transferable Quota
system, a kind of catch share similar to carbon trading. These kinds of limits begin with a policy
decision and are then relegated to the market for execution. The ruling policy body for the
fishery in question, usually an agency of the government responsible for the fishery, sets a total
allowable catch and allocates shares to individual actors who may then trade their surpluses to
other actors. ITQs become a market-based mechanism, and are a type of restrictive management
because they are a constraint on catch that is not imposed directly by the ability of the fishery to

15
provide, but rather a preset limit on the amount of fish that can be taken. These limits work from
an economic perspective, allowing the industry to optimize fleet capacity and economic yield
(Beddington et al. 2007).
Setting ITQs and other market mechanisms for fishery management is not the only type
of interference in the economics of fisheries carried out by governments. According to Sharp and
Sumalia (2009), fisheries in the United States receive subsidies of an average of 713 million
dollars a year, not including funding for fisheries management, port construction, or subsidy
program administration. Fuel subsidies and research subsidies account for the majority of the
money given to the fishing industry, as well as fishing access payments and state sales tax
subsidies (Sharp & Sumalia 2009). Distribution of these subsidies were mainly to Alaskan and
Pacific fisheries, particularly those that fish for Pacific salmon and tuna.
Thus far in my research I have found no policy recommendations focusing exclusively on
restrictive management approaches, but it is also never excluded from management practices
entirely. Restrictive management policies like bans on destructive bottom trawling often consider
some form of habitat or environmental protection, which is an important component to species
survival and recovery (Taylor et al. 2005, Rosenberg et al. 2000). While restrictive management
methods are important for protecting environmental integrity, as these are the laws that regulate
equipment types and prevent unnecessary physical damage to ecosystems and restrict allowable
bycatch, they are not sufficient to protect fish stocks and food chains on their own. Restrictions
typically have exceptions that may curtail their effectiveness, and require oversight to enforce
fully, which can be a costly process. Besides that, restrictions may not always operate based on
the principles of ecosystem protection, or they may be aimed at only one or two damaging
practices, or made to protect just one part of the ecosystem.

16
Human-created representations and understandings of natural interactions are generally
unable to reflect the true complexity of the relationships between organisms, so they must be
thought of as simplified representations (Western Pacific Regional Fishery Management Council
2009), particularly with regards to trophic webs and ecosystem functions. This, again, is where
the Precautionary Approach is necessary to ensure the survival of fish stocks and their
ecosystems, since it operates on the assumption that human information on and understanding of
the life processes of marine life are limited. Given that humans have the power to destroy or
protect the fragile ecosystems many fish depend on, restrictive management strategies that use
EBM and PA seem the most likely to succeed in terms of preserving fish stocks and protecting
overall marine health. However, they are not universal practices. The pressures of the industry
and the demand for seafood continue to drive fishing around the world, even as stock projections
become more ominous (Worm et al. 2006) and the academic community advocates global
restraint in fish take and environmental degradation.
Restrictive management is implemented by regime structures which may be in the form
of top-down or co-management systems, described below.
Top-down management: This is the term used for centralized management of fisheries by a
government, regulatory body, or other policy-maker. The top-down approach is generally
criticized for its lack of community involvement and often called unresponsive (Chapin et al
2009, Jentoft & McCay 1996). When fisheries are managed in this way, the group responsible
for their management makes rules and may or may not attempt to enforce them. The incentive of
user groups to adhere to use regulations is generally lower when they have no say in setting the
rules (Nielsen & Vedsmand 1999, Jentoft & McCay 1996). This is not to say that it does not
have a place in fisheries management; without a regulatory body setting policy and enforcing it,

17
Hardin’s tragedy of the commons becomes all too likely. In the U.S., all fisheries have a
regulatory body which is responsible for taking input from community and scientific sources and
making appropriate determinations for the use of the fish stock (NOAA Fisheries 2016), a
process incorporating both user groups and regulatory bodies called Co-management.
Co-management: Co-management is the most comprehensive management strategy,
emphasizing participation of users in creating regulation strategies in order to increase
compliance (Sevaly 1996, Jentoft et al. 1998, Beddington et al. 2007, Deacon 2012, Brewer &
Moon 2015). This argument was propounded in the late 1990s, and this method of fishery
management is on the rise (Metzner 2005, Aswani 2005), incorporating user communities into
the top-down management mechanisms of policy-making bodies and attempting to resolve
economic inefficiency, unsustainable harvesting, and unequal benefits from fisheries (Brewer &
Moon 2015). The socio-theoretical framework behind co-management argues that user groups
bring first-hand knowledge and experience of fisheries, which combined with fisheries science
produces systems that work economically and sociologically because strategies created with user
group input are seen as more legitimate than imposed restrictive or purely top-down controls
(Jentoft et al. 1998). Recognition of differing cultures is important for sustainable management
strategies because it does not attempt to impose foreign culture, values, or technologies on
traditional management. Additionally, the inclusion of user groups lowers the incentive to flout
regulation (Deacon 2012, Beddington et al. 2007). User groups do not dictate the management
strategy in co-managed fisheries, however; good scientific data and the presence of a regulatory
body to impose and implement ecosystem-based restrictions is a crucial part of successful co-
management (Aswani 2005, Beddington et al. 2007).

18
Because co-management is more of a process type than a set of rules, it can be compared
to the adaptive management techniques used by some onshore environmental groups, which
evaluates the success of a management strategy and changes it as time progresses and new
challenges arise. Co-management takes into account the viewpoints of multiple stakeholders and
designs approaches to individual problems with an eye to the community impact as well as the
environmental goal, increasing the participation of stakeholders and the likelihood that fishing
agreements will be adhered to (Jentoft et al. 1998). Beddington et al. argue that the best
management strategies involve a competent authority with the capability of enforcing set
regulations and monitoring stock status as well as rights-based allocations to user groups (2007),
a fair description of the ideal co-management regime.
IN PRACTICE
The following example of fishery management techniques in the United States is given
because of the availability of comprehensive data dating back to the 1950s on fish landings as
well as the relative level of enforcement ability for regulations imposed. It should be understood
that not every country has this level of exploitative ability or the capacity to monitor use and
status of fisheries.
In the United States, most fishery management strategies and policy-making bodies come
from the Magnuson-Stevens Act (MSA) passed in 1976 and its amendments and
reauthorizations, as well as the Marine Mammal Protection Act (MMPA) and Endangered
Species Act (ESA). Another key legal event was the declaration of a contiguous Exclusive
Economic Zone (EEZ) three to twelve miles off U.S. shores in 1972 and the subsequent
international reaffirmation of the idea of EEZs in 1982 when the 200 nautical-mile EEZ of the
present day was created by the UN Convention on the Law of the Sea (UNCLOS) (NOAA

19
Office of General Counsel 2016). The agency tasked with “managing, conserving, and protecting
living marine resources in inland, coastal, and offshore waters of the United States” (NOAA
Fisheries 2016) is the National Atmospheric and Administration (NOAA). Their role is dictated
mainly by the Magnuson-Stevens Fishery Conservation and Management Act (MSA), the
Endangered Species Act (ESA), and the Marine Mammal Protection Act (MMPA). They are a
federal agency that partners with agencies at each level of government as well as with tribes and
other stakeholders, using the EBM approach to address environmental issues and protect
threatened/endangered fish as well as conserving marine mammals. To protect any species
biologically assessed as threatened or endangered under the terms of the ESA, NOAA may
create protective regulations such as the designation of critical habitat as well as work with other
federal agencies and community stakeholders to create long-term recovery plans for the species
(NOAA Fisheries 2016).
Agencies that NOAA works in conjunction with include the 12 regional fishery councils
created by the MSA, each of which has their own approach to management. Normally,
management councils will work with others in the region, particularly in the case of managing
highly migratory species (SAFMC 2016). Generally, the United States fisheries management
approaches fall into two camps; those in the Pacific are managed by quota controls with fishing
rights allocated to companies or sectors, while northeast fisheries are managed by a days-at-sea
scheme and other effort controls (Beddington et al. 2007). Gear and method restrictions are also
used in the U.S., such as the restriction of towed bottom-fishing gear, which is highly destructive
to seabed habitats worldwide (Kaiser et al. 2000). The information available on the official
websites of the management councils indicates that the Pacific management councils tend to take
a co-management approach, while the Atlantic management councils use species-specific

20
committees and a more top-down approach. Both are concerned with ecosystems and habitat of
the fish stocks they manage.
Assessments of the biological status of fisheries are required by the Magnuson-Stevens
act and are made by the National Oceanic and Atmospheric Administration (NOAA) based on
several data sources including fish landings, scientific surveys, and biological or ecological
studies. Results of the assessment may place fish stocks in categories including “overfished,”
meaning that the population size is lower than can sustain itself under current pressures, “subject
to overfishing,” meaning that the annual catch rate of this stock is higher than is biologically
sustainable, or “rebuilt,” which is a stock that was overfished but is currently at a population size
able to support its set maximum sustainable yield (NOAA Fisheries 2016). These status
assessments are then used by regional councils to set catch limits and make other policy
determinations. As of the September 30 2016 report on the status of fisheries there are 29
monitored stocks on the overfishing list, 38 on the overfished list, and 39 on the rebuilt list
(NOAA Fisheries 2016).
West Coast:
The fisheries on the Pacific coast of the United States are currently more productive and
better-managed than the fisheries on the Atlantic coast (Beddington et al. 2007, Hanna 1995). As
of September 30th 2016, on the Pacific coast (including Alaska, the three west coast states, and
Hawaii), there were six fish stocks categorized as overfished, two of which were fished by
international as well as domestic fleets. At the same time, the Atlantic Coast had twenty-six
overfished species, three of which were fished by both domestic and international fleets (NOAA
Fisheries 2016). There are in total thirty-eight fish species managed by the U.S. that were

21
categorized as overfished at the end of 2014, with an additional six species located in the
Caribbean and the Gulf of Mexico.
The most productive fisheries on the West Coast are the Alaskan Pacific Cod and
Walleye Pollock fisheries, which together accounted for over 1,700,000 metric tons of the
2,572,501 metric ton annual catch for the entire state of Alaska in 2014 (NOAA Fisheries;
Fisheries Statistics Division 2016). Alaskan catch is also the force behind the productivity of the
Pacific coast in general; the other three states involved in commercial fishing since 1950, as far
back as data has been recorded, account for only about 200,000 metric tons in 2014 (NOAA
Fisheries; Fisheries Statistics Division 2016).
Management and enforcement strategies
The typical management strategies of West Coast fisheries are co-management structures
with an emphasis on EBM. NOAA cooperatively manages fisheries with the Pacific Fishery
Management Council, the North and the Western Pacific Fishery Management Councils (three of
the eight regional councils established by the MSA), individual states, tribal representatives, and
Canadian representatives. According to the website of the Pacific Fishery Management Council
(PFMC), the council process is bottom-up, accentuating public input to the process of fisheries
management, and there are different management responsibilities and mechanisms depending on
which fish stocks are being fished and by whom (PFMC 2013). Management measures
developed by the council are then recommended to the Secretary of Commerce through the
National Marine Fisheries Service (NMFS). Management measures are implemented by NMFS
West Coast Regional offices and enforced by the NOAA Office of Law Enforcement, the 11th
and 13th Coast Guard Districts, and local enforcement agencies. These methods are used to
manage about 119 species of pacific fish, including highly migratory species that are managed in

22
conjunction with international management bodies like the International Pacific Halibut
Commission. The Office of Law Enforcement also takes a hand in the economics of fishery
management, guarding against seafood fraud, illegal fishing, and keeping “an even playing field
in the market” (NOAA OLE 2016).
There are also gear and access based restrictions used on the Pacific Coast, particularly
for groundfish management. Catch shares and annual catch limits are used to rebuild fish stocks,
and marine protected areas (MPA) with a variety of restrictions on fish take are in place. One
such MPA off the Pacific Coast is the Big Sur/Port San Luis Essential Fish Habitat Conservation
Area, a permanent year-round MPA established in 2006 and located off the coast of mid-
southern California, where commercial fishing is restricted for the purposes of sustainable
production (NOAA & DOI 2016). There are also the Western and Eastern Cowcod Conservation
Areas off the coast of California in the Los Angeles-San Diego area, other permanent year-round
MPAs established in 2001 for sustainable production, where commercial and recreational fishing
are restricted under a zoned multiple use MPA. The exact nature of the restrictions in each MPA
is unclear from the public-access website, as restrictions vary between states, type of protection
area, and what species or environment is being protected (California Department of Fish and
Wildlife 2016).
NOAA on the West Coast
On the West Coast, ESA-listed species include smelt, green sturgeon, and Puget Sound
rockfish. NOAA provides funding through the Pacific Coastal Salmon Recovery Fund and the
ESA Section 6 grant program as well as working with states, watershed councils, tribes, and
other entities to allow for the needs of the salmon life cycle. NOAA also partners with biologists
and engineers who design safe fish passage solutions and ensure sustainable fisheries and protect

23
endangered species, including the Southern Resident Killer Whales protected by the MMPA
(NOAA Fisheries 2016). Sustainable fisheries are a goal of the Magnuson-Stevens Act, which
mandates NOAA’s role as caretaker of marine fisheries in federal waters. Specific examples of
NOAA’s role in protecting fish include the salmon fisheries on the Washington Coast and the
Mitchell Act hatchery facilities in the Columbia river basin, which are funded by NOAA. NOAA
Fisheries also monitors development on the West Coast and provides NEPA recommendations
and consultations with federal and state agencies to mitigate impacts on essential fish habitat, as
well as providing funding and technical assistance to restore habitats providing food, protection,
and safe areas for spawning for salmon, steelhead, marine mammals, and other species. (NOAA
Fisheries 2016).
Stock rebuilding strategies
Despite the multilayered protection and management strategies in place, fish stocks can
and do become overfished. When NOAA determines that overfishing has occurred, the fishery
management council in the relevant area must make a recovery plan to rebuild the stock to levels
determined to be the Maximum Sustainable Yield (MSY) (NOAA Fisheries Rebuilding Plans
2016). These recovery plans essentially involve ensuring that more fish live to reproduce, and
often depend on setting the catch level low enough to allow the stock to replenish itself, though
natural factors such as disease and habitat loss must also be accounted for but are difficult to
allow for. In 2015, two Pacific stocks were rebuilt using recovery plans, while there were 51
stocks in the United States in need of rebuilding, 35 of which had accepted rebuilding plans and
timelines in place (NOAA Fisheries Rebuilding Plans 2016). Of these 35 stocks used in NMFS
analysis, 21 were Atlantic species (65.7%) and 12 were Pacific species (34.3%). Each of the 13
Pacific species were categorized as “Not subject to overfishing,” with 10 species classified as

24
having biomass increasing and two classified not increasing (National Marine Fisheries Service
2015).
Monitored fish stocks in the Pacific are generally classified as not endangered and not
subject to overfishing, a good sign for continued high fishery productivity as long as fish are
allowed to reproduce and replenish their stock. To prevent misreported catches and ensure that
the fishing industry is adhering to the catch limits set, Pacific fisheries utilize observers required
by the management system but paid for by the industry (Beddington 2007). Of course, even if the
fishing plans are adhered to, stocks may be under other threats such as warming water and
increased levels of plastic and other pollutants in the ocean interrupting life cycles and food
chains. Pacific management strategies have generally been successful, following the community-
involvement structure of co-management generally recommended (Beddington et al. 2007,
Sevaly &Nielsen 1996, Jentoft et al. 1998, Larkin 1996), yet Zwolinski & Demer have predicted
a Pacific sardine species collapse based on colder temperatures, higher exploitation, and fishery
takings of older fish with higher proliferation ability (2012).
In the following graphs (figs. 1-7), which provide a visual of the status of fisheries on the
Pacific and Atlantic coasts, I have used reported commercial catch as a measurement because it
is a combination of the ecosystems’ ability to supply and the effort expended to catch- some
down trends are the result of inability to take more fish (due to lower biomass/availability) and
some are because of unwillingness to do so (or injunctions against it). Thus reported landings
give an idea of both ecosystem health and fishing efforts/regulations.

25
As shown in Figure 1, decline became consistent in the Pacific from 2005- 2009. Catch
rate increased between reports in 2009 and 2010, continued increasing through 2011 before a
slight decline in 2012, an increase in 2013, and a decline in 2014. 2005 was the peak year for
commercial fish landings on the Pacific coast of the US, while the lowest point since the peak
was 2012. There was a 7.67522% decrease in fish landings between 2005 and 2012 with a
dramatic dip in 2008 and a slight increase since 2012, summarized by the graph below (Fig. 2).
0
500000
1000000
1500000
2000000
2500000
3000000
35000001
95
0
19
52
19
54
19
56
19
58
19
60
19
62
19
64
19
66
19
68
19
70
19
72
19
74
19
76
19
78
19
80
19
82
19
84
19
86
19
88
19
90
19
92
19
94
19
96
19
98
20
00
20
02
20
04
20
06
20
08
20
10
20
12
20
14
Metric Tons Commercially Landed 1950-2014Pacific
3166603.93001537.8 2925902.7
256521.6
2263441.12468028.8
2975234.6 2923560.13,211,374.803,135,919.50
0
500000
1000000
1500000
2000000
2500000
3000000
3500000
2005 2006 2007 2008 2009 2010 2011 2012 2013 2014
Commerical Landings 2005-2014 (Metric Tons)Pacific
Figure 1
Figure 2

26
In the Pacific, there is a sudden spike in the late 1970s. This could have been caused by
several factors, fully explored in Appendix A but summarized by the state-by-state catch graph
below, in which the steep incline dictating the shape of the overall trendline is the Alaskan
commercial catch. The question then becomes; what changed in Alaska to result in such a steep
incline in the biomass of landed fish?
The answer lies with the Magnuson-Stevens Act and the increased catches of Pacific Cod
and Walleye Pollock it brought about. These species are both categorized as groundfish (Alaska
Department of Fish and Game 2016), and according to the FAO’s Fishery Profile of the United
States (2005), groundfish stocks in the Alaskan region were dominated by foreign fleets until
1977- the year after the Magnuson-Stevens Act established an exclusive economic zone giving
the U.S. sole rights to fish in that zone. After gaining exclusive rights to the waters in which
groundfish live, the U.S. fishing industry began to exploit the stocks, which are managed by the
North Pacific Fishery Management Council in conjunction with the state of Alaska (NPFMC
2016). Seasonal and gear restrictions are in place for these species in both federal and state
waters, as well as restrictions on the operation of offshore processors (NPFMC 2016). Much of
0.00
500,000.00
1,000,000.00
1,500,000.00
2,000,000.00
2,500,000.00
3,000,000.00
19
50
19
52
19
54
19
56
19
58
19
60
19
62
19
64
19
66
19
68
19
70
19
72
19
74
19
76
19
78
19
80
19
82
19
84
19
86
19
88
19
90
19
92
19
94
19
96
19
98
20
00
20
02
20
04
20
06
20
08
20
10
20
12
20
14
Metric Tons Commercially Landed Original Pacific States Individually 1950-2014
California Oregon Washington Alaska
Figure 3

27
the EEZ off the Aleutian Islands is also Marine Protected Area with a variety of restrictions in
place (NOAA Marine Protected Areas 2016). The Fisheries Management Plan for Groundfish in
the Gulf of Alaska emphasizes the use of the precautionary approach and ecosystem-based
management, as well as keeping the process open to public comment, rights-based management,
strategies for habitat protection, and limiting bycatch (NPFMC 2015). The production of this
area is higher than many other marine fisheries. Cod catches have risen, though Pollock catches
have declined somewhat since the early 2000s (NOAA Fisheries Statistics 2016).
East Coast:
The highest record catch on the Atlantic Coast of the United States happened in 1956,
followed by the record low in 1969. The Magnuson-Stevens Act was passed in 1976, but due to a
lack of sufficiently organized management and enforcement over the course of the 1980s, most
fleets were overcapitalized (too many users and too few fish) (Buck 1995) and exploitation rates
were high for groundfish stocks (Halliday & Pinhorn 1996). Even though most regimes
established new regulatory approaches in the 1990s (Halliday & Pinhorn 1996, New England
Fishery Management Council 2016) and there was a smaller peak catch in 1991, the general
trend on the Atlantic Coast has been downward (NOAA Fisheries Statistics Division 2016).

28
Management strategies, regional fishery councils
Management on the East coast generally appears to be a by-species affair, with specific
regulations in place to protect each fish stock under pressure. The New England Fishery
Management Council, established by the Magnuson-Stevens Act, details the nine management
strategies currently in place to cover 29 species, from the Northeast multispecies management
plan implemented in 1986 to recover overfished groundfish stocks to single-species plans for
Atlantic salmon, Red Crab, Skates, and other species. The management plans for these species
involve setting an Accepted Biological Catch (ABC) limit for each fishing year in order to
rebuild stocks to sustainable levels, with the exception of the Atlantic salmon, which it is
generally prohibited to possess (NEFMC 2016).
The New England Fishery Management Council is comprised of the Regional
Administrator of the Greater Atlantic Region/NOAA Fisheries, a state official responsible for
marine fishery management from each of the five states on the council, and twelve members
nominated by the governor and selected by the secretary of commerce, as well as four non-voting
members who represent the United States Coast Guard, U.S. Fish and Wildlife Service, U.S.
0.00
200,000.00
400,000.00
600,000.00
800,000.00
1,000,000.00
1,200,000.00
1,400,000.00
19
50
19
52
19
54
19
56
19
58
19
60
19
62
19
64
19
66
19
68
19
70
19
72
19
74
19
76
19
78
19
80
19
82
19
84
19
86
19
88
19
90
19
92
19
94
19
96
19
98
20
00
20
02
20
04
20
06
20
08
20
10
20
12
Metric Tons Commercially Landed 1950-2012Atlantic
Figure 4

29
Department of State, and the Atlantic States Marine Fisheries Commission (NEFMC 2016). This
council relies on a process of committees and advisory groups, each with a particular focus.
There are nine species-specific committees, as well as a committee for Enforcement, one for
Habitat, and one for Ecosystem concerns. Eleven advisory groups and a working group join the
ranks of the NEFMC, as well as four “related” committees; the Executive Committee, the
Research Steering Committee, the Observer Policy Committee (Industry-Funded Monitoring),
and the Scientific and Statistical Committee (NEFMC 2016). The NEFMC works in conjunction
with the Mid-Atlantic Fisheries Management Council on two of the latter’s management
projects, which use management measures like quotas and closed areas for thirteen species of
fish and shellfish, several of which are managed under multi-species fishery management plans
because they are found in the same geographic region or have similar life histories (MAFMC
2016). This approach would seem to be for the best, as single-species management techniques
have been deemed inadequate due to their general tendency for commercial fixation and
disregard for conservation (Mooney-Seus & Rosenberg 2007).
The Mid-Atlantic Fisheries Council and the Southern Atlantic Fisheries Management
council are structured similarly to the NEFMC; the former is made up of 21 voting members, one
from each member state’s Department of Fish and Wildlife, as well as 14 private citizens with
knowledge of and interest in fisheries and four non-voting members from the Atlantic States
Marine Fisheries Commission, the U.S. Fish and Wildlife Service, the U.S. Department of State,
and the U.S. Coast Guard (MAFMC 2016). Several of their managed species use output controls
in the form of catch and landing limits, in addition to minimum fish sizes and gear and seasonal
restrictions. The Southern Atlantic Fisheries Management Council is made up of 13 private
citizens selected by the Secretary of Commerce from lists presented by state governors, as well

30
as the four non-voting members from each of the departments listed above. The SAFMC
receives input from Advisory Panels, the Scientific & Statistical Committee and Stock
Assessment Panels (SAFMC 2016).
The management practices in the Atlantic are much more top-down than those in the
Pacific, with a diagram provided by SAFMC showing the process of creating interim rules,
emergency rules, and new management strategies through the NEPA Environmental Impact
Statement/Environmental Assessment approach (which allows for public input) but none of the
emphasis on community, user group, or tribal participation that characterizes the approaches
detailed by Pacific coast management committees (SAFMC 2016, PFMC 2013). Additionally,
the NOAA website does not show as much participation and management on the East Coast.
Stock rebuilding strategies
There are currently 21 Atlantic stocks targeted for rebuilding with accepted rebuilding
plans and timelines in place, eight species of which are classified as subject to overfishing with
biomass levels not increasing (NOAA Fisheries 2015). The Atlantic Fishery Management
Councils each have their own strategy for managing habitat and stocks, but Marine Protected
Areas (MPAs) are a common approach. An MPA is defined by the South Atlantic Fishery
Management Council as a system of marine habitats reserved for the purpose of recovering or
sustaining fish stocks (SAFMC 2016). For example, the Gulf of Maine has a year-round
groundfish closure in place which is also partially a habitat closure (NOAA Greater Atlantic
2016). This closure has several exemptions for vessels with particular fishing gear as well as
recreational vessels and charter or party vessels with letters of authorization from regional
administrators (NOAA Greater Atlantic 2016). The SAFMC created several MPAs in 2009
where no possession of snapper grouper species is allowed, though trolling for other species is

31
permitted (SAFMC 2016). Essential fish habitats for the Atlantic were initially established in
1999 by NOAA’s Habitat Omnibus Amendment, which identified threats and proposed
conservation for habitat for Atlantic salmon and Atlantic cod (NEFMC 2016).
Other methods of fish protection and stock rebuilding include ensuring that fishery
management plans comply with the Endangered Species Act so that it is illegal to catch or
possess ESA listed species (SAFMC 2016, MAFMC 2016, NOAA Greater Atlantic 2016),
removing dams to ensure that Atlantic salmon have access to spawning grounds (NOAA Greater
Atlantic General Conservation Plan 2016), and working with NOAA Proactive Species
Conservation Grants to implement various protection projects like the restoration of the
Apalachicola- Chattahoochee- Flint River Basin, which Georgia’s Department of Natural
Resources has a recurring grant for (NOAA Proactive Species Conservation Grants 2011). Other
funded projects include Conservation of the Sand Tiger Shark in the waters of Delaware Bay and
other near-shore habitats, acoustic tracking of Atlantic sturgeon conducted by the University of
Maine, and tagging and tracking Atlantic sturgeon along the Delaware coast (NOAA Proactive
Species Conservation Grants 2011). Grants of this type also exist on the Pacific coast, but they
were further emphasized as a part of the management process on the Atlantic management pages.
Stock status/anticipated declines
32
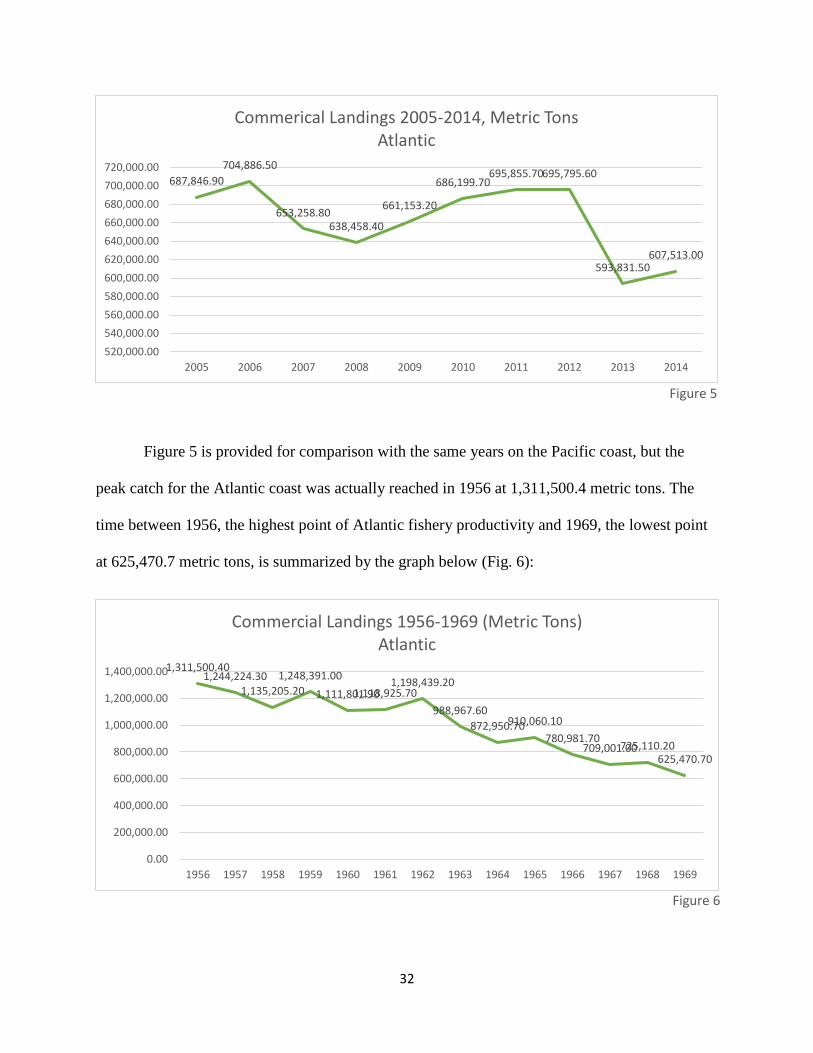
Figure 5 is provided for comparison with the same years on the Pacific coast, but the
peak catch for the Atlantic coast was actually reached in 1956 at 1,311,500.4 metric tons. The
time between 1956, the highest point of Atlantic fishery productivity and 1969, the lowest point
at 625,470.7 metric tons, is summarized by the graph below (Fig. 6):
687,846.90
704,886.50
653,258.80638,458.40
661,153.20
686,199.70695,855.70695,795.60
593,831.50607,513.00
520,000.00
540,000.00
560,000.00
580,000.00
600,000.00
620,000.00
640,000.00
660,000.00
680,000.00
700,000.00
720,000.00
2005 2006 2007 2008 2009 2010 2011 2012 2013 2014
Commerical Landings 2005-2014, Metric TonsAtlantic
1,311,500.401,244,224.30
1,135,205.20
1,248,391.00
1,111,801.901,118,925.701,198,439.20
988,967.60
872,950.70910,060.10
780,981.70709,001.00725,110.20
625,470.70
0.00
200,000.00
400,000.00
600,000.00
800,000.00
1,000,000.00
1,200,000.00
1,400,000.00
1956 1957 1958 1959 1960 1961 1962 1963 1964 1965 1966 1967 1968 1969
Commercial Landings 1956-1969 (Metric Tons)Atlantic
Figure 5
Figure 6

33
The rate of decline from maximum to minimum productivity in the Atlantic is much steeper than
that in the Pacific, a 52.309% decrease over a period of 14 years in the former as opposed to the
7.67% decline over a period of 10 years in the latter. The decline between the year of recorded
maximum productivity and minimum productivity is also much more consistently down-trending
in the Atlantic, whereas the Pacific saw a point of major decrease between slow oscillations up
and down. Nevertheless, neither fishery has fully recovered from their respective years of record
catch.
One species subject to the trends of Atlantic fishery take is the Striped bass in
Chesapeake Bay. This is now one of the stocks classified as rebuilt and no longer subject to
overfishing (NOAA 2015), but the species has increasingly been subject to bacterial infections
associated with rising water temperatures and lower concentrations of oxygen (Blankenship
2004, Blinkoff 2012). Striped bass, according to NOAA (2015) were used in the early years of
American colonization to fertilize fields because of their abundance, but by the 1980s the stock
was categorized as collapsed due to poor environment and overfishing. Though the species has
been placed on the “recovered” list, there has been a decline in spawning biomass since 2004
(NOAA Fish Facts 2015).
For a comparison of Atlantic and Pacific commercial landings since 1950, see figure 7:

34
The decline in fishery stock biomass is not a trend exclusive to the Atlantic or even to the United
States. Species stocks have been collapsing for quite some time (NOAA Fish Facts 2015, Pauly
et al. 1998) under the pressures of overfishing, fishing down the food web (or landing species at
lower trophic levels, which tend to be shorter-lived and a food source for larger fish whose
stocks have already declined under fishing pressure).
Looking at these graphs, it is important to remember that each coast is a different
ecosystem and supports different types and amounts of marine life. Additionally, the Atlantic
coast of the United States began to be fished using non-native methods much earlier than the
Pacific (and certainly much earlier than 1950, when NOAA’s data begins) which is not
immediately evident from the graph but may have impacted the trends seen here. Another thing
to keep in mind is the old maxim “just because we can doesn’t mean we should.” The current
catch levels and exploitation methods have been proven unsustainable, and the gradual decline in
U.S. fish take may indicate a trend toward sustainability and biomass preservation; that is, a
decline may be a positive thing. Studies finding current fishing patterns to be unsustainable are
0.00
500,000.00
1,000,000.00
1,500,000.00
2,000,000.00
2,500,000.00
3,000,000.00
3,500,000.001
95
0
19
52
19
54
19
56
19
58
19
60
19
62
19
64
19
66
19
68
19
70
19
72
19
74
19
76
19
78
19
80
19
82
19
84
19
86
19
88
19
90
19
92
19
94
19
96
19
98
20
00
20
02
20
04
20
06
20
08
20
10
20
12
20
14
Metric Tons Commercially Landed 1950-2014Pacific in OrangeAtlantic in Yellow
Figure 7

35
not new, and the downward trends displayed in this thesis and the graphs above can be expected
to continue unless fishing patterns are changed. Catch levels may stabilize at a lower yield level
than they currently reach, but it will be a more dependable, consistent, and sustainable level if
stocks are allowed to recover.
GAPS AND GOING FORWARD
The United States, while excellent as an example of management strategies in action, is
not a representative sample of one of the fundamental difficulties of fishery management, which
is enforcement. While the United States has observers in place on the West Coast, oversight
committees, partnerships with the coast guard and other maritime enforcement capabilities in
order to ensure accurate reporting and adherence to regulations, this level of oversight is beyond
the capabilities or practices of many states. And internal difficulties such as misreporting by an
industry or individuals are not the only challenges; international competition in supposedly
nationalized fisheries is an ongoing concern in places like Guinea, where Chinese trawlers are
outcompeting local fishing efforts and severely depleting fisheries (Ford 2016). The lack of
monitoring and enforcement capabilities are often due to a lack of funding, as in the case of
Guinea. Gaps in this field of study and literature are largely the result of a lack of data.
Measuring fish stocks is a notoriously difficult process and deciding policy based on uncertain
data may lead to poor management plans, and gaps in enforcement or monitoring may lead to
poor implementation.
Gaps in this project in particular include a lack of certain data (there are some links on
the NOAA/NMFS website that require government affiliation to access), such as bycatch, and
time constraints; this is a long and storied field with developments occurring constantly not just
in the United States but across the world and as such would require much more time and effort

36
than allowed for at the undergraduate level. Furthermore, I am certain that there are things I
simply do not know about fishery management and biological sustainability. However, this
project was intended as a general overview of the current situation and an introduction to the
management methods of the United States as a case study. While there is more research to be
done internationally and more management implementation to conserve a dwindling resource, I
hope that this project can serve as a jumping-off point which supplies the basics of management
knowledge and insight to the efficacy of various management policies.
Though I found no critiques of co-management, I could imagine that hesitation to
implement such a strategy might stem from concerns about balancing the input of many groups
when trying to make timely decisions about management practices. Further research on the
implementation of co-management strategies worldwide may ask the question, ‘how would a
regulatory body bring the interests of multiple parties into the management process in a
productive and biologically sound manner.’
Also not specifically addressed in this thesis are non-regulatory methods of controlling
industry, production, and treatment of the environment. These are typically community norms,
market forces, and industry initiatives. An interesting intersection of regulatory and non-
regulatory controls is the case of the dolphin-safe tuna. While the Marine Mammals Protection
Act was in place in 1972, it was not being strictly enforced, and video evidence released by
Greenpeace advocates showed high bycatch of dolphins during commercial tuna fishing-
contrary to the goals of the MMPA. There was a threat of boycott against Bumblebee Tuna and
other suppliers, and Bumblebee Tuna had soon altered its practices to more dolphin-friendly
methods (Maser 2016). Because dolphin-safe tuna is a legal and social expectation that comes at
a very low cost- about one cent per can more than tuna caught using methods more hazardous to

37
dolphins (Maser 2016)- this is an example of non-regulatory social pressure changing fishery
methods and reducing bycatch where implemented legal framework had failed to do so. Future
research or a continuation of this project would examine the sociocultural pressures driving the
economic demand for fish and what can be done to reduce these demands before fisheries
become completely depleted.
SUMMARY
Fishing has been a method of livelihood for thousands of years, but the manner in which
it is conducted in the present day has shortened the lifespan of the practice considerably. If
changes are not made, there may be a shortage of fish in the future. This is a problem with
biological, economic, and anthropocentric consequences including trophic collapse, decline of
industry, and protein deficiencies in humans if not adjusted for in advance. Fish provide about
3.1 billion people with 20 percent or more of their animal protein (UN FAO 2014), a demand
that is projected to increase as world population rises. The ability of supply to keep pace with
this rising demand depends on the biological health of fisheries and fish populations, which are
currently in decline. In this paper, various fishery management techniques were evaluated based
on previous research and primary data from the United States’ National Oceanic and
Atmospheric Administration (NOAA). According to NOAA data and previous studies and policy
documents, the most efficacious means of fishery management appears to be co-management, a
strategy which incorporates top-down controls as well as user group involvement and ecosystem-
based management techniques.
Difficulties with research in this field mostly revolve around the difficulty of obtaining
accurate data on fish populations and accounting for enforcement problems even where
management policy exists. Additionally, fisheries management tends to be approached from two

38
sides; economic and biological, with some elements of sociology. This often results in
management strategies with differing goals- essentially, conservation for future use or
preservation for ecosystemic stability. Market and sociocultural pressures incentivize catch,
despite environmental science advising restraint.
This thesis reviewed existing literature in the field of fishery management before
applying the concepts found therein to the differing management types on the Pacific and
Atlantic Coasts of the United States. On the Pacific Coast, which has previously been observed
to be more effectively managed in terms of biomass and ecosystem protection (Beddington et al.
2007; Hanna 1995), user participation was much more emphasized than on the Atlantic Coast.
The Pacific Coast of the U.S. has higher biomass and fishery productivity due to the Pacific Cod
and Walleye Pollock fisheries in Alaska, where catch rapidly increased after the implementation
of the Magnuson-Stevens Act and subsequent expansion of the Exclusive Economic Zone and
exclusion of foreign fishing fleets in 1976. Fish stocks in the Pacific are managed by the fishery
councils created by the MSA, in conjunction with local participants such as tribes and watershed
councils (NPFMC 2016, NOAA Fisheries 2016). This is a clear example of a co-management
regime, which depends upon various types of restrictive management and monitoring agents for
successful implementation of stock management and recovery plans. By contrast, the Atlantic
coast fisheries are managed by regional councils which break down into subcommittees and
seem to interact with each other more than they do the public or user groups, as indicated by the
information available on their web pages. Their management plans tend to be focused on one
species at a time, though they do use many of the same restrictive management approaches.
Atlantic fishery management committees tend more to the side of top-down management, while
Pacific committees tout their processes as thoroughly in the co-management style.

39
CONCLUSION
The bulk of the available literature suggests that the most efficacious means of fishery
management is employing a co-management strategy utilizing elements of restrictive
management. Co-management, as Jentoft et al (1998), Beddington et al (2007), and others point
out, is useful because it encourages greater user compliance by involving the user groups in
addition to the management authorities, as opposed to a strict top-down management structure
imposing rules on communities without their input.
Restrictive management is also an important component of policy for preservation, as
limitations on the usage of ecologically damaging practices and tools lead to a decline in
physical damage and enable ecosystems to survive. The Pacific coast fisheries in the United
States, utilizing co-management and the ecosystem-based approach along with observers and
quota systems, seem to be more successful in terms of species protection than those on the
Atlantic Coast, which utilize more top-down management strategies and single-species
approaches to fishery management.
APPENDIX ONE
In the Pacific, there is a sudden spike in the late 1970s. This can be ascribed to several
factors: It is partially due to the opening of a new fishery in the Pacific Ocean and the attribution
of many of those catches to the state of Hawaii, which is not included in NOAA data prior to
1981 (NOAA Fisheries Statistics 2016). There was also a global increase in the size of fishing
boats and the number of them in a fleet, as well as several innovations in fishing technology,
which could account for some of the increase (NOAA Pacific Islands 2014, Blackford 2008,
PFMC 2016). Below is the catch graph for the Pacific with the exception of Hawaii, Utah, and

40
at-sea processing (added in 1981, 1985, and 1990 respectively).
As figure 8 demonstrates, the general trend is the same, but the catch numbers are lower.
The massive spike is due entirely to the changes in access brought about by the Magnuson-
Stevens Act for one state, and it isn’t Hawaii. In the graph below, “series one” represents
California, “series two” represents Oregon, “series three” represents Washington, and the “series
four” spike dictating the shape of the trend line is Alaska. The question then becomes; what
changed in Alaska to result in such a steep incline in the biomass of landed fish?
0.00
500,000.00
1,000,000.00
1,500,000.00
2,000,000.00
2,500,000.00
3,000,000.00
3,500,000.00
19
50
19
52
19
54
19
56
19
58
19
60
19
62
19
64
19
66
19
68
19
70
19
72
19
74
19
76
19
78
19
80
19
82
19
84
19
86
19
88
19
90
19
92
19
94
19
96
19
98
20
00
20
02
20
04
20
06
20
08
20
10
20
12
20
14
Metric Tons Commercially Landed Pacific 1950-2014 without Hawaii, Utah, or at-sea processing
Figure 8

41
The driving factor in biomass increase is the enlarged catches of Pacific Cod and Walleye
Pollock following the exclusion of other nations from United States Exclusive Economic Zone
waters. These species are both categorized as groundfish (Alaska Department of Fish and Game
2016), and according to the FAO’s Fishery Profile of the United States (2005), groundfish stocks
in the Alaskan region were dominated by foreign fleets until 1977- the year after the Magnuson-
Stevens Act established an exclusive economic zone giving the U.S. exclusive rights to fish in
that zone. After gaining exclusive rights to the waters in which groundfish live, the fisheries
industry began to exploit the stocks, which are managed by the North Pacific Fishery
Management Council in conjunction with the state of Alaska (NPFMC 2016). Seasonal and gear
restrictions are in place for these species in both federal and state waters, as well as restrictions
on the operation of offshore processors (NPFMC 2016). Much of the EEZ off the Aleutian
Islands is also Marine Protected Area with a variety of restrictions in place (NOAA Marine
Protected Areas 2016). The Fisheries Management Plan for groundfish in the Gulf of Alaska
emphasizes the use of the precautionary approach and ecosystem-based management, as well as
keeping the process open to public comment and use an “adaptive management approach
0.00
500,000.00
1,000,000.00
1,500,000.00
2,000,000.00
2,500,000.00
3,000,000.00
Metric Tons Commercially Landed Original Pacific States Individually 1950-2014
Series1 Series2 Series3 Series4
Figure 7
Figure 9
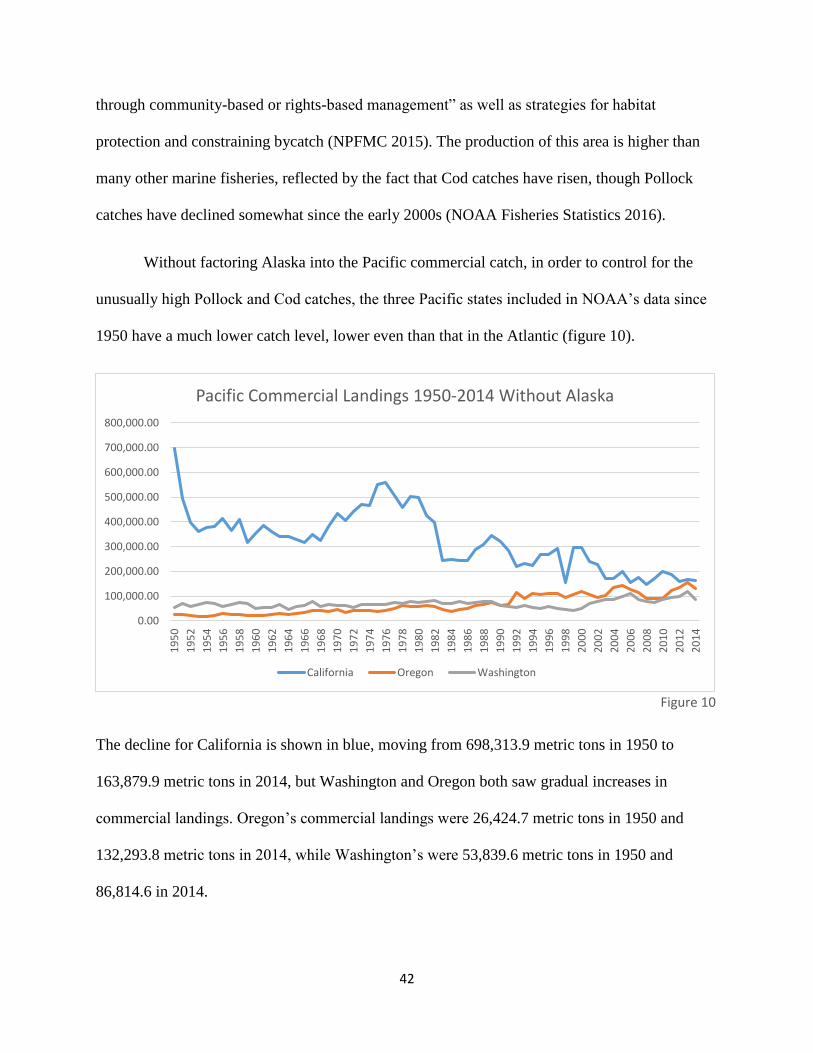
42
through community-based or rights-based management” as well as strategies for habitat
protection and constraining bycatch (NPFMC 2015). The production of this area is higher than
many other marine fisheries, reflected by the fact that Cod catches have risen, though Pollock
catches have declined somewhat since the early 2000s (NOAA Fisheries Statistics 2016).
Without factoring Alaska into the Pacific commercial catch, in order to control for the
unusually high Pollock and Cod catches, the three Pacific states included in NOAA’s data since
1950 have a much lower catch level, lower even than that in the Atlantic (figure 10).
The decline for California is shown in blue, moving from 698,313.9 metric tons in 1950 to
163,879.9 metric tons in 2014, but Washington and Oregon both saw gradual increases in
commercial landings. Oregon’s commercial landings were 26,424.7 metric tons in 1950 and
132,293.8 metric tons in 2014, while Washington’s were 53,839.6 metric tons in 1950 and
86,814.6 in 2014.
0.00
100,000.00
200,000.00
300,000.00
400,000.00
500,000.00
600,000.00
700,000.00
800,000.00
19
50
19
52
19
54
19
56
19
58
19
60
19
62
19
64
19
66
19
68
19
70
19
72
19
74
19
76
19
78
19
80
19
82
19
84
19
86
19
88
19
90
19
92
19
94
19
96
19
98
20
00
20
02
20
04
20
06
20
08
20
10
20
12
20
14
Pacific Commercial Landings 1950-2014 Without Alaska
California Oregon Washington
Figure 10
43
Bibliography
Alaska Department of Fish and Game. 2016. Information by Fishery; Commercial Groundfish
Fisheries.
http://www.adfg.alaska.gov/index.cfm?adfg=commercialbyfisherygroundfish.main.
Accessed October 19 2016.
Allison, Edward H & Frank Ellis. 2001. “The livelihoods approach and management of small-
scale fisheries.” Marine Policy 25 (September): 377–388.
Aswani, Shankar. 2005. “Customary Sea Tenure in Oceania as a Case of Rights-based Fishery
Management: Does it Work?” Reviews in Fish Biology and Fisheries (15):285–307
Baumol, William 1952. Welfare Economics and the Theory of the State. Cambridge, MA:
Harvard University Press.
Beddington, J.R., D.J Agnew, and C.W. Clark. 2007. “Current Problems in the Management of
Marine Fisheries.” Science (June): 1713-1716.
http://science.sciencemag.org/content/316/5832/1713. Accessed April 16, 2016.
Blankenship, Karl. 2004. “Mycobacteriosis infection rate in Bay’s striped bass increasing.” Bay
Journal. June 1 2004.
Blackford, Mansel. 2008. “A Tale of Two Fisheries: Fishing and Over-Fishing in American
Waters.” Origins: Current Events in Historical Perspectives vol. 1 issue 12 (September).
Blinkoff, Kevin. 2012. “Sores on Striped Bass – Not Mycobacteriosis.” On the Water. September
28 2012.
Brewer, T.D. & K. Moon. 2015. “Towards a functional typology of small-scale fisheries co-
management informed by stakeholder perceptions: A coral reef case study.” Marine
Policy 51 (January); 48-56.
Bromley, Daniel. 2009. “Abdicating Responsibility: the Deceits of Fisheries Policy.” Fisheries
(Volume 34, Issue 6): 280-290. http://www.tandfonline.com/doi/abs/10.1577/1548-8446-
34.6.280#.Vw_6C3ErLnA. Accessed April 25, 2016.
Buck, Eugene. 1995. “Overcapitalization in the U.S. Commercial Fishing Industry.” Digital
Library of the Commons, Indiana State University.
http://dlc.dlib.indiana.edu/dlc/handle/10535/4043. CRS Report: 35-296 ENR. Accessed
October 20 2016.
California Department of Fish and Wildlife. 2016. Southern California Marine Protected Areas.
https://www.wildlife.ca.gov/Conservation/Marine/MPAs/Network/Southern-California.
Updated March 1, 2016. Accessed October 11 2016.
Casey, Tina. 2009. “Hawaiian Garbage-to-Energy Plant Recycles Derelict Fishing Nets for
Electricity.” Clean Techncia.

44
Chapin, F. Stuart, Gary P. Kofinas; Carl Folke; Melissa C. Chapin. 2009. Principles of ecosystem
stewardship; resilience-based natural resource management in a changing world. New
York, Springer.
Costello, Christopher. Steven D. Gaines, John Lynham. 2008. “Can Catch Shares Prevent
Fisheries Collapse?” Science (19 Sep 2008) Vol. 321, Issue 5896, pp. 1678-1681.
Costello, Christopher. Daniel Ovando, Tyler Clavelle, C. Kent Strauss, Ray Hilborn, Michael C.
Melnychuk, Trevor A. Branch, Steven D. Gaines, Cody S. Szuwalski, Reniel B. Cabral,
Douglas N. Rader, and Amanda Leland. 2016. “Global Fishery Prospects Under
Contrasting Management Regimes.” Proceedings of the National Academy of Sciences of
the United States of America. 113 (February): 5125–5129.
Deacon, Robert T. 2012. “Fishery Management by Harvester Cooperatives.” Review of
Environmental Economics and Policy (Summer 2012) 6 (2): 258-277.
Earth Systems Research Laboratory. 2016. “Trends in Atmospheric Carbon Dioxide.” National
Oceanic and Atmospheric Administration. Available at
http://www.esrl.noaa.gov/gmd/ccgg/trends/. Accessed 10-5-2016.
Economist, the. 2008. “Malthus, the false prophet.” The Economist: Finance and Economics.
May 15th 2008 print edition.
Food and Agriculture Organization of the United Nations. 2011. “Fish Consumption Reaches an
All-Time High.” http://www.fao.org/news/story/en/item/50260/icode/ Accessed June 8
2016.
Food and Agriculture Organization of the United Nations. 2005. “Fishery Country Profile.”
ftp://ftp.fao.org/FI/DOCUMENT/fcp/en/FI_CP_US.pdf. Accessed October 19 2016.
Food and Agriculture Organization of the United Nations. 2014. “The State of World Fisheries
and Aquaculture (SOFIA).” Fisheries and Aquaculture Department.
Ford, Tamasin. 2016. “How China's trawlers are emptying Guinea's oceans.” BBC News. Africa.
July 8. http://www.bbc.com/news/world-africa-36734578. Accessed August 10 2016.
Frank, Kenneth T. Brian Petrie, Jae S. Choi, William C. Leggett. 2005. “Trophic Cascades in a
Formerly Cod-Dominated Ecosystem.” Science 308 (June): 1621-1623.
Halliday, R.G & A. T. Pinhorn. 1996. “North Atlantic Fishery Management Systems: A
Comparison of Management Methods and Resource Trends.” Journal of Northwest
Atlantic Fisheries Science. Vol. 20.
Hardin, Garrett. 1991. “The Tragedy of the Commons.” The Green Reader. Andrew Dobson
(Ed) Mercury House, San Francisco, pp55-58.
Hanna, Susan S. 1995. “User participation and fishery management performance within the
pacific fishery management council.” Ocean & Coastal Management. Vol. 28, Issues 1–
3; pp. 23-44.
Hannesson, R. 1991. “From common fish to rights based fishing.” European Economic Review
(35);397–407.

45
Grafton, Quentin. 1996. “Individual Transferable Quotas; Theory and Practice.” Reviews in Fish
Biology and Fisheries 6 (March): 5-20.
Jentoft, Svein, Bonnie J. McCay, Douglas C. Wilson. 1998. “Social Theory and Fishery Co-
Management” Marine Policy 22 (July-September): 423-436.
Jentoft, Svein & Bonnie J. McCay. 1996. "From the bottom up: Participatory issues in fisheries
management.” Society & Natural Resources Vol. 9 , Iss. 3: 237-250.
Kaiser, Michael J., Fiona E. Spence, Paul J. B. Hart. 2000. “Fishing Gear Restrictions and
Conservation of Benthic Habitat Complexity.” Conservation Biology 14 (October) 1512-
1525.
Keohane, Nathaniel & Sheila Olmstead. 2007. Markets and the Environment. Island Press-
Center for Resource Economics.
Kinsella, David T. 2016. “Liberal Institutionalism: Collective Goods Are Characterized by
Market Failure.” May 2. Lecture Presented at Portland State University, Portland OR.
Koster, Pepijen. 2007. Overfishing.org. Overfishing- definitions.
Larkin, P.A. 1996. “Concepts and Issues in Marine Ecosystem Management.” Reviews in Fish
Biology and Fisheries. 6 (June): 139-164.
Lindgren, Annie. 2015. “Marine Biology.” Presented at Portland State University.
“Magnuson-Stevens Fishery Conservation and Management Act As amended by the Magnuson-
Stevens Fishery Conservation and Management Reauthorization Act (P.L. 109-479)”
(Public Law 94-265, May 2007). U.S. DEPARTMENT OF COMMERCE National
Oceanic and Atmospheric Administration National Marine Fisheries Service.
Malthus, Thomas R. 1798. Essay on the Principle of Population. Printed for J. Johnson in St.
Paul’s Churchyard, London.
Maser, Joseph. 2016. “Need for Regulations.” Presented at Portland State University.
Metzner, Rebecca. 2005. “World Inventory of Fisheries. Property Rights and Fisheries
Management. Issues Fact Sheet.” FAO Fisheries and Aquaculture Department.
Mid-Atlantic Fisheries Management Council (MAFMC). 2016. http://www.mafmc.org/about/.
Accessed October 12 2016.
Mooney-Seus, M. and A. Rosenberg. 2007. “Best practices for high seas fisheries management:
Lessons learned.” Chatham House Briefing Paper. Energy, Environment and
Development Programme EEDP BP 07/03.
National Marine Fisheries Service. 2015. “Fish Stocks in Rebuilding Plans: A Trend Analysis.”
NMFS, NOAA. Status of Fisheries Archive: 2015.
National Oceanic and Atmospheric Administration (NOAA) & United States Department of the
Interior (DOI). 2016. Marine Protected Areas.
http://marineprotectedareas.noaa.gov/dataanalysis/mpainventory/mpaviewer/. Updated
July 15, 2016. Accessed October 11, 2016.

46
Nielsen, Jesper Raakjær & Tomas Vedsmand. 1999. “User participation and institutional change
in fisheries management: a viable alternative to the failures of ‘top-down’ driven
control?” Ocean & Coastal Management. Volume 42, Issue 1(January): pp. 19-37.
New England Fishery Management Council (NEFMC). 2016. http://www.nefmc.org. Accessed
October 12 2016.
NOAA Fish Facts. 2015. “Striped Bass.” http://chesapeakebay.noaa.gov/fish-facts/striped-bass
Chesapeake Bay Office. Accessed October 17 2016.
NOAA Fisheries. 2016. “West Coast Region: What We Do.”
http://www.westcoast.fisheries.noaa.gov/whatwedo/overview/what_we_do_overview.ht
ml. Accessed October 11 2016.
NOAA Fisheries Rebuilding Plans. 2016. “Rebuilding Plans.”
http://www.nmfs.noaa.gov/sfa/fisheries_eco/status_of_fisheries/rebuilding_plans.html.
Accessed October 10 2016.
NOAA Fisheries; Fisheries Statistics Division. 2016. “Commercial Fisheries Statistics.”
http://www.st.nmfs.noaa.gov/commercial-fisheries/commercial-landings/annual-
landings/index. Accessed April 28 2016.
NOAA Greater Atlantic. 2016. “Northeast (NE) Multispecies Information Sheet Closed Area
Regulations.”
https://www.greateratlantic.fisheries.noaa.gov/regs/infodocs/multsclosedareas.pdf.
Accessed October 18 2016.
NOAA Greater Atlantic, Atlantic Salmon General Conservation Plan.
https://www.greateratlantic.fisheries.noaa.gov/protected/altsalmon/conservation/.
Accessed October 18 2016.
NOAA Greater Atlantic, Atlantic Sturgeon Recovery Program.
https://www.greateratlantic.fisheries.noaa.gov/protected/atlsturgeon/index.html.
Accessed October 18 2016.
NOAA Marine Protected Areas. 2016. “MPA Mapping Products.”
http://marineprotectedareas.noaa.gov/dataanalysis/maps/. Accessed October 19 2016.
NOAA Office of General Counsel. 2016. “Maritime Zones and Boundaries.”
http://www.gc.noaa.gov/gcil_maritime.html. Accessed June 20 2016.
NOAA Office of Law Enforcement (OLE). 2016. “How We Help.”
http://www.fisheries.noaa.gov/ole/index.html. Accessed October 10 2016.
NOAA Pacific Islands Fisheries Science Center. 2014. “Western Pacific Fisheries Information
Network.” https://www.pifsc.noaa.gov/wpacfin/. Accessed October 18 2016.
NOAA Proactive Species Conservation Grants. 2011. “Proactive Species Conservation Grants
Funded.” http://www.nmfs.noaa.gov/pr/species/concern/Funded.html. Accessed October
18 2016.

47
North Pacific Fishery Management Council. 2015. “Fishery Management Plan for Groundfish in
the Gulf of Alaska.” http://www.npfmc.org/wp-
content/PDFdocuments/fmp/GOA/GOAfmp.pdf. Accessed October 19 2016.
North Pacific Fishery Management Council. 2016. “Bering Sea/Aleutian Islands and Gulf of
Alaska Groundfish.” http://www.npfmc.org/bering-seaaleutian-islands-groundfish/.
Accessed October 19 2016.
Office of Sustainable Fisheries. 2014. “Overfished Stocks-37 As of December 31st, 2014.” U.S.
Department of Commerce, National Oceanic and Atmospheric Administration, National
Marine Fisheries Service.
http://www.nmfs.noaa.gov/sfa/fisheries_eco/status_of_fisheries/archive/2014/fourth/map
overfishedstockscy_q4_2014.pdf. Accessed October 19 2016.
Organisation for Economic Cooperation and Development (OECD). 2006. “Using Market
Mechanisms to Manage Fisheries.” OECD Committee for Fisheries.
Ostrom, Elinor 1990. Governing the Commons: The Evolution of Institutions for Collective
Action. Cambridge, UK: Cambridge University Press.
Pacific Fishery Management Council. 2013. Pacific Fishery Management Council.
http://www.pcouncil.org/. Accessed August 10, 2016.
Pacific Fishery Management Council. 2016. Current HMS SAFE Report: Commercial Fisheries
Description. http://www.pcouncil.org/highly-migratory-species/stock-assessment-and-
fishery-evaluation-safe-documents/current-hms-safe-document/commercial-fisheries-
descriptions/. Accessed October 18 2016.
Pacific Marine Environment Laboratory. 2016. “How the Oceans Absorb Carbon is Critical for
Predicting Climate Change.” National Oceanic and Atmospheric Administration.
Available at: http://www.pmel.noaa.gov/co2/story/Ocean+Carbon+Uptake. Accessed 10-
5-16.
Pauly, Daniel; Villy Christensen, Johanne Dalsgaard, Rainer Froese, Francisco Torres Jr. 1998.
“Fishing Down Marine Food Webs.” Science. Vol. 279, Issue 5352 (Feb): 860-863.
Pauly, Daniel. Villy Christensen, Sylvie Guénette, Tony J. Pitcher, U. Rashid Sumaila, Carl J.
Walters, R. Watson & Dirk Zeller. 2002. “Towards Sustainability in World Fisheries.”
Nature 418(August): 689-695.
Pauly, Daniel. Ray Hilborn, & Trevor A. Branch. 2013. “Fisheries: Does catch reflect
abundance?” Nature 494 (February): 303-306.
Pearce, David. 1991. “Valuing the Environment.” The Green Reader. Andrew Dobson (Ed)
Mercury House, San Francisco, pp175-179.
Péreau J.-C., L. Doyen, L.R. Little, O. Thébaud. 2012. “The triple bottom line: Meeting
ecological, economic and social goals with individual transferable quotas.” Journal of
Environmental Economics and Management 63 (May): 419-434.
Pomeroy, Robert S. & Fikret Berkes. 1997. “Two to tango: the role of government in fisheries
co-management.” Marine Policy. Vol. 21, No. 5: 465-480

48
“Precautionary Approach to Capture Fisheries and Species Introductions.” 1996. FAO Technical
Guidelines for Responsible Fisheries. Food and Agriculture Organization of the United
Nations.
Property and Environment Research Center. 2016. Free Market Environmentalism.
http://www.perc.org/about-perc/free-market-environmentalism. Accessed October 10
2016.
Rolston, Holmes. 1991. “Values in and Duties to the Natural World.” Environmental Ethics:
what really matters, what really works. Ed. David Schmidtz & Elizabeth Willott. 66-70.
Rosenberg, A.A; M. J. Fogarty; M.P. Sissenwine; J.R. Beddington; J.G. Shepherd. “Achieving
Sustainable Use of Renewable Resources.” Science, New Series, Volume 262, Issue 5135
(Nov. 5, 1993), 828-829.
Rosenberg, Andrew; Bigford, Thomas E.; Leathery, Stephen; Hill, Ronald L.; Bickers, Keith.
2000. “Ecosystem approaches to fishery management through essential fish habitat.”
Bulletin of Marine Science Vol. 66 No. 3 (May): 535-542.
“Review of the State of World Marine Fisheries Resources.” 2011. Marine and Inland Fisheries
Service Fisheries and Aquaculture Resources Use and Conservation Division, FAO
Fisheries and Aquaculture Department. FAO fisheries and aquaculture technical paper
569. http://www.fao.org/docrep/015/i2389e/i2389e.pdf. Accessed October 10 2016.
Roughgarden, J. & F. Smith. 1996. “Why Fisheries Collapse and What to Do About it.”
Proceedings of the National Academy of Sciences in the United States. Vol 93 (May):
5078-5083.
Salmi, P. 1998. Towards sustainable vendace fisheries? Fishermen’s conceptions about fisheries
management. Boreal Environmental Resolutions (3): 151–159.
Sea Shepherd. 2016. http://www.seashepherd.org/. Accessed September 18 2016.
Sharp, R. and U.R. Sumaila. 2009. Quantification of U.S. Marine Fisheries Subsidies. North
American Journal of Fisheries Management 29(1): 18-32.
Shotton, R. 2000. “Current property rights systems in fisheries management.” In: Shotton, R.
(ed.), Use of Property Rights in Fisheries Management. Proceedings of the FishRights99
Conference, Fremantle, Western Australia.
Sevaly, Sen and Jesper Raakjaer Nielsen. 1996. “Fisheries Co-Management: a Comparative
Analysis.” Marine Policy 20 (September): 405-418.
Sissenwine, M. and David Symes. 2007. “Reflections on the Common Fisheries Policy.” Report
to the general directorate for fisheries and maritime affairs of the European Commission.
Greenpeace (July). http://www.greenpeace.org/greece/PageFiles/97797/reflections-on-
the-common-fish.pdf. Accessed April 19, 2016.
South Atlantic Fisheries Management Council. 2016. http://www.safmc.net/about-us/about-
safmc. Accessed October 12 2016.

49
Stevenson D, Chiarella L, Stephan D, Reid R, Wilhelm K, McCarthy J, Pentony M.
Characterization of the fishing practices and marine benthic ecosystems of the northeast
US shelf, and an evaluation of the potential effects of fishing on essential habitat. NOAA
Tech Memo NMFS NE 181; 179.
Taylor, Martin F. J. Kieran Suckling, Jeffrey Rachlinski. 2005. “The Effectiveness of the
Endangered Species Act: A Quantitative Analysis.” BioScience 55(4): 360-367.
United Nations General Assembly, Convention on the Law of the Sea, 10 December 1982.
United Nations Division for Ocean Affairs and the Law of the Sea. Available at
http://www.un.org/depts/los/convention_agreements/texts/unclos/unclos_e.pdf. Accessed
June 8 2016.
Western Pacific Regional Fishery Management Council. 2009. Fishery Ecosystem Plan for the
Mariana Archipelago. Available at
http://www.fpir.noaa.gov/Library/PUBDOCs/environmental_impact_statements/FPEIS_
FEP/Appendix%20G/FEP%20Marianas%20(WPRFMC%202009-09-24).pdf Accessed
October 4 2016.
World Wildlife Fund. 2016. “IWC Current Situation.”
http://wwf.panda.org/what_we_do/endangered_species/cetaceans/cetaceans/iwc/iwc_curr
ent_situation/. Accessed October 27 2016.
Worm, B., Edward B. Barbier, Nicola Beaumont, J. Emmett Duffy, Carl Folke, Benjamin S.
Halpern, Jeremy B. C. Jackson, Heike K. Lotze, Fiorenza Micheli, Stephen R. Palumbi,
Enric Sala, Kimberley A. Selkoe, John J. Stachowicz, Reg Watson. 2006. “Impacts of
Biodiversity Loss on Ocean Ecosystem Services.” Science 314 (November): 787-790.
Zwolinski, Juan P. & David A. Demer. 2012. “A cold oceanographic regime with high
exploitation rates in the Northeast Pacific forecasts a collapse of the sardine stock.”
Proceedings of the National Academy of Sciences in the United States. March 13, 2012.
vol. 109 no. 11: 4175-4180.