CsHm Verif Coriolis Meter #2015-0164 - Emerson Electric...• Conclusion 4. Coriolis Meters Directly...
45
1
Transcript of CsHm Verif Coriolis Meter #2015-0164 - Emerson Electric...• Conclusion 4. Coriolis Meters Directly...

1
Paper # #2015-0164 pVerification of Coriolis Flow
Meter CalibrationMeter Calibration
Ti th J C i hTimothy J. CunninghamPrincipal EngineerMicro Motion IncMicro Motion, Inc.
Boulder, Colorado 80301
2
Agenda
• Coriolis Mass Flowmeter Theory of Operation• Proving, Verification, and Coriolis Robustness• Coriolis Meter Verification Review• Statistical Hypothesis Testing• Direct Stiffness Verification Results• Conclusion
3
Agenda
• Coriolis Mass Flowmeter Theory of Operation• Proving, Verification, and Coriolis Robustness• Coriolis Meter Verification Review• Statistical Hypothesis Testing• Direct Stiffness Verification Results• Conclusion
4
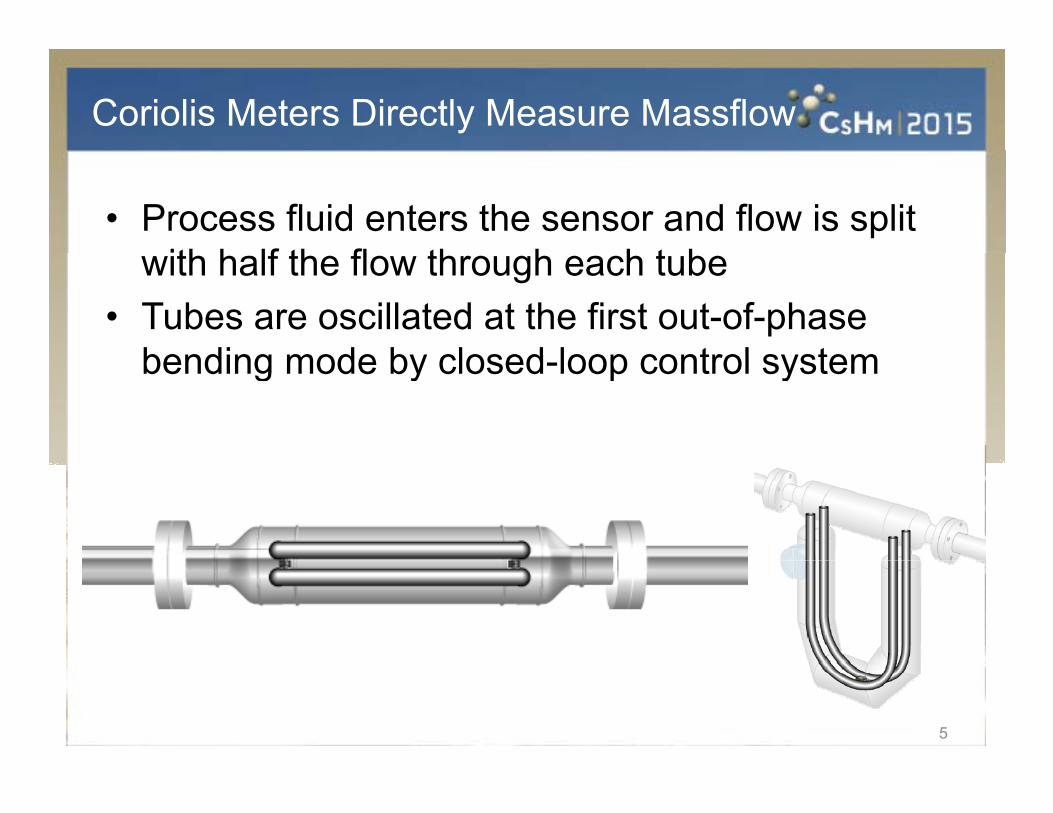
Coriolis Meters Directly Measure Massflow
• Process fluid enters the sensor and flow is split ith h lf th fl th h h t bwith half the flow through each tube
• Tubes are oscillated at the first out-of-phase bending mode by closed loop control systembending mode by closed-loop control system
5
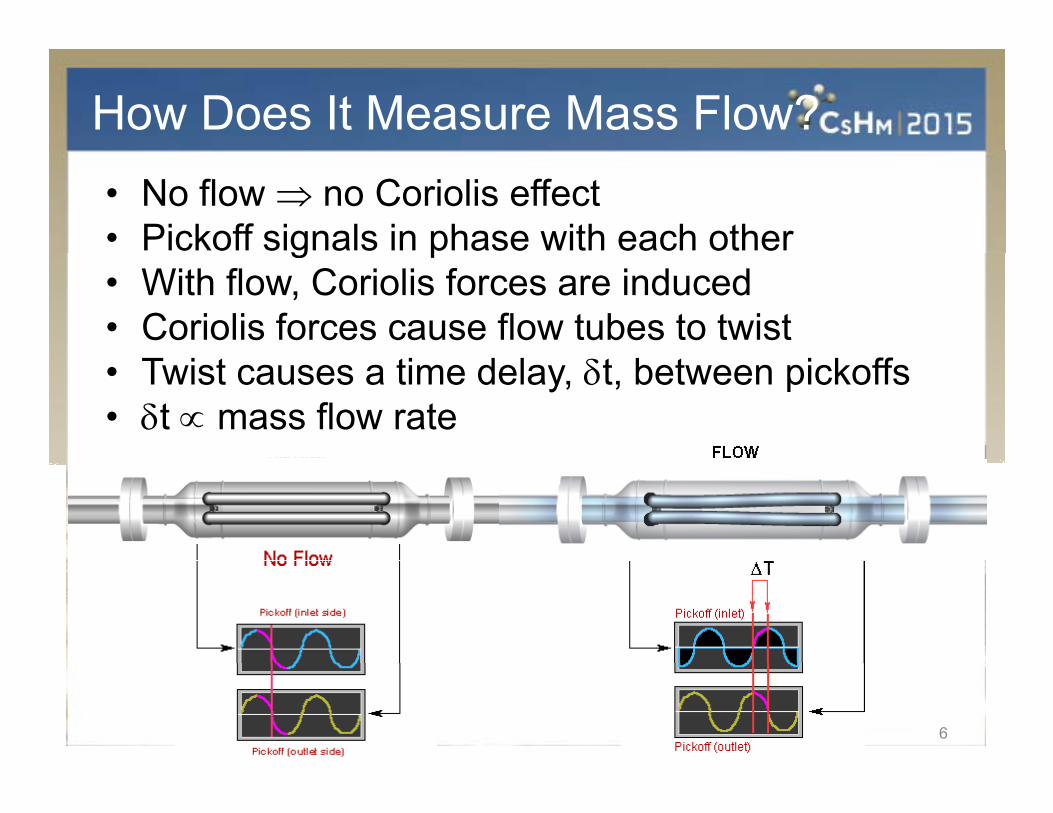
How Does It Measure Mass Flow?• No flow no Coriolis effect• Pickoff signals in phase with each otherg p• With flow, Coriolis forces are induced• Coriolis forces cause flow tubes to twist • Twist causes a time delay, t, between pickoffs• t mass flow rate
6
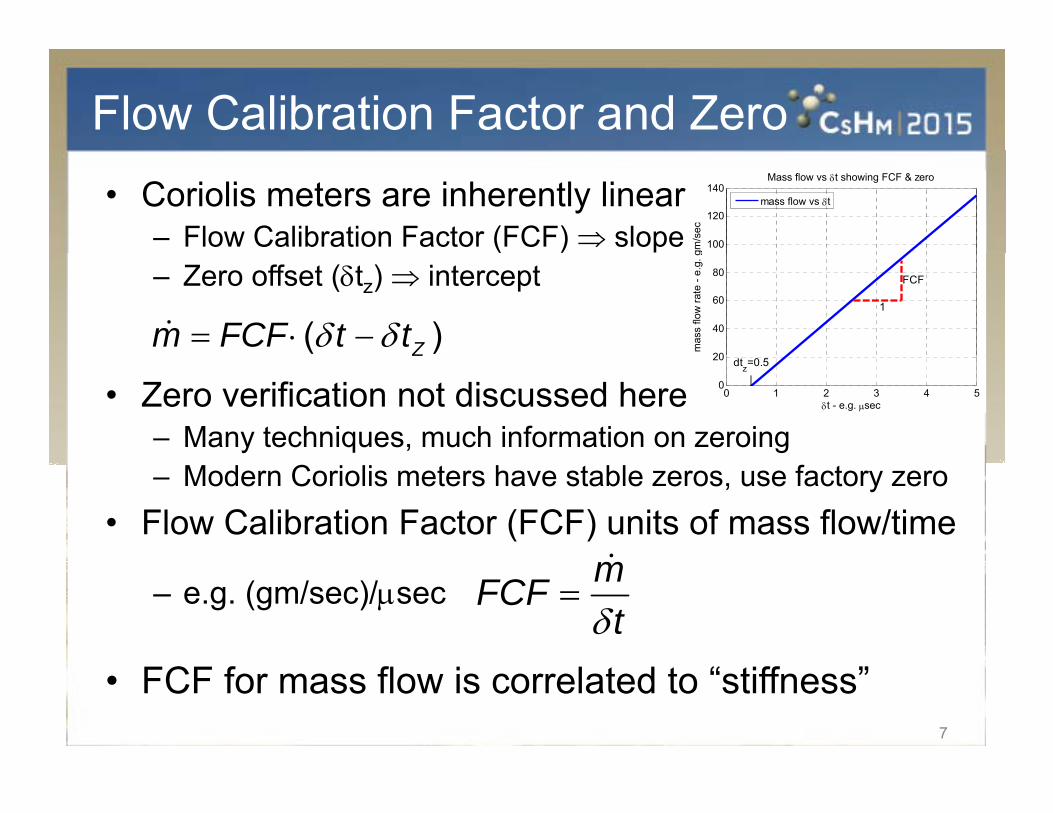
Flow Calibration Factor and Zero• Coriolis meters are inherently linear
– Flow Calibration Factor (FCF) slope 100
120
140
gm/s
ec
Mass flow vs t showing FCF & zero
mass flow vs t
– Zero offset (tz) intercept
( )Zm FCF t t20
40
60
80
mas
s flo
w ra
te -
e.g.
g
FCF
1
• Zero verification not discussed here– Many techniques, much information on zeroing
Z
0 1 2 3 4 50
20
t - e.g. sec
dtz=0.5|
– Modern Coriolis meters have stable zeros, use factory zero• Flow Calibration Factor (FCF) units of mass flow/time
– e.g. (gm/sec)/sec
mFCFt
• FCF for mass flow is correlated to “stiffness”7
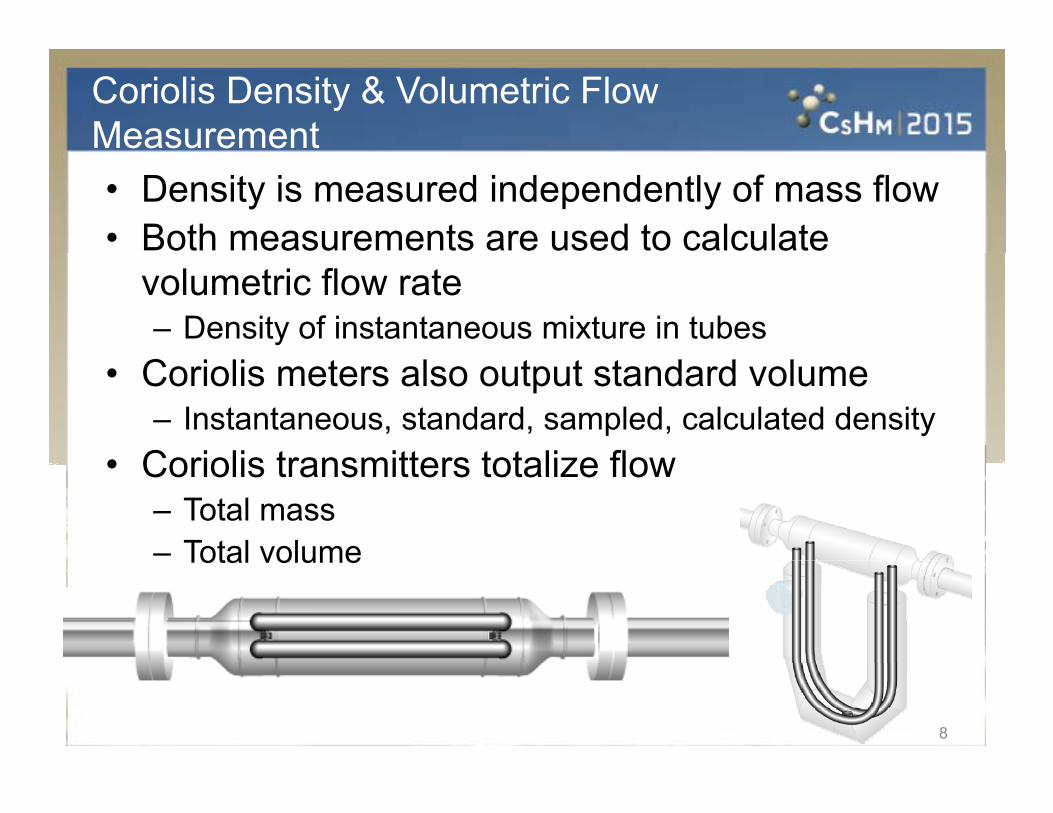
Coriolis Density & Volumetric Flow Measurement• Density is measured independently of mass flow• Both measurements are used to calculate
volumetric flow rate– Density of instantaneous mixture in tubes
• Coriolis meters also output standard volume– Instantaneous, standard, sampled, calculated density
Coriolis transmitters totalize flow• Coriolis transmitters totalize flow– Total mass– Total volumeTotal volume
8

Agenda
• Coriolis Mass Flowmeter Theory of Operation• Proving, Verification, and Coriolis Robustness• Coriolis Meter Verification Review• Statistical Hypothesis Testing• Direct Stiffness Verification Results• Conclusion
9
Terminology
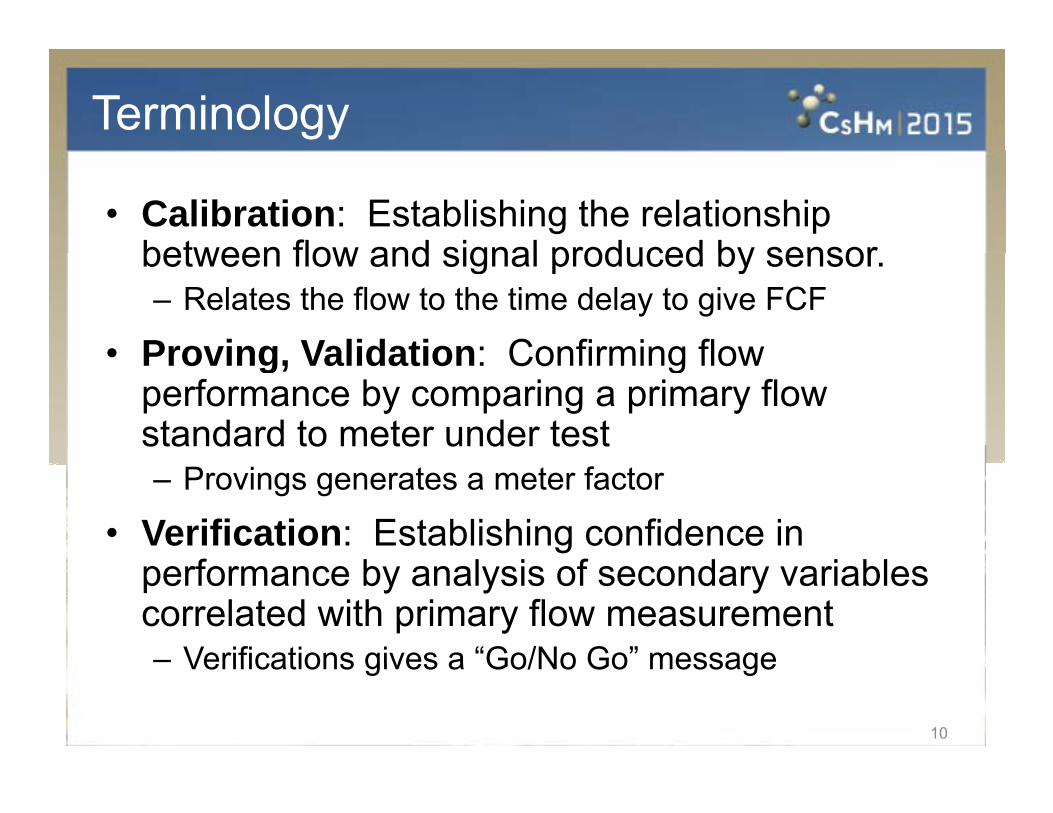
• Calibration: Establishing the relationship between flow and signal produced by sensorbetween flow and signal produced by sensor.– Relates the flow to the time delay to give FCF
• Proving Validation: Confirming flow• Proving, Validation: Confirming flow performance by comparing a primary flow standard to meter under test– Provings generates a meter factor
• Verification: Establishing confidence in f b l i f d i blperformance by analysis of secondary variables
correlated with primary flow measurement– Verifications gives a “Go/No Go” messageVerifications gives a Go/No Go message
10
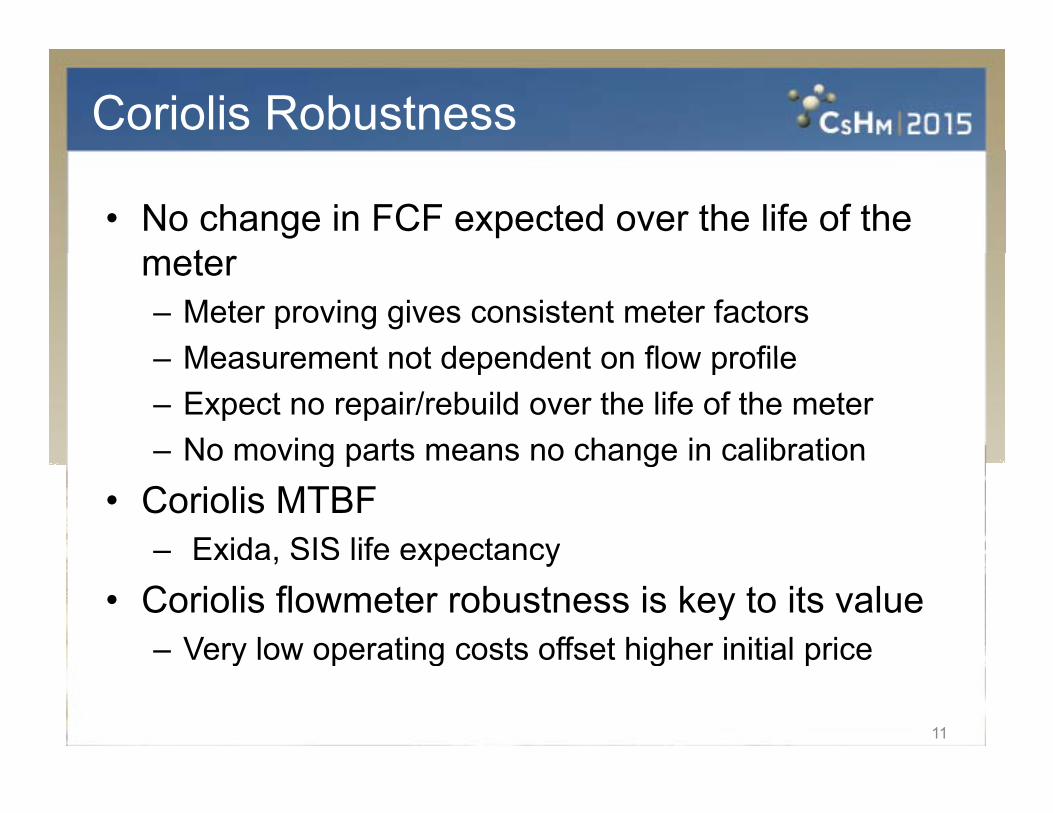
Coriolis Robustness
• No change in FCF expected over the life of the tmeter
– Meter proving gives consistent meter factorsMeasurement not dependent on flow profile– Measurement not dependent on flow profile
– Expect no repair/rebuild over the life of the meter– No moving parts means no change in calibrationNo moving parts means no change in calibration
• Coriolis MTBF– Exida, SIS life expectancy, p y
• Coriolis flowmeter robustness is key to its value– Very low operating costs offset higher initial pricey p g g p
11
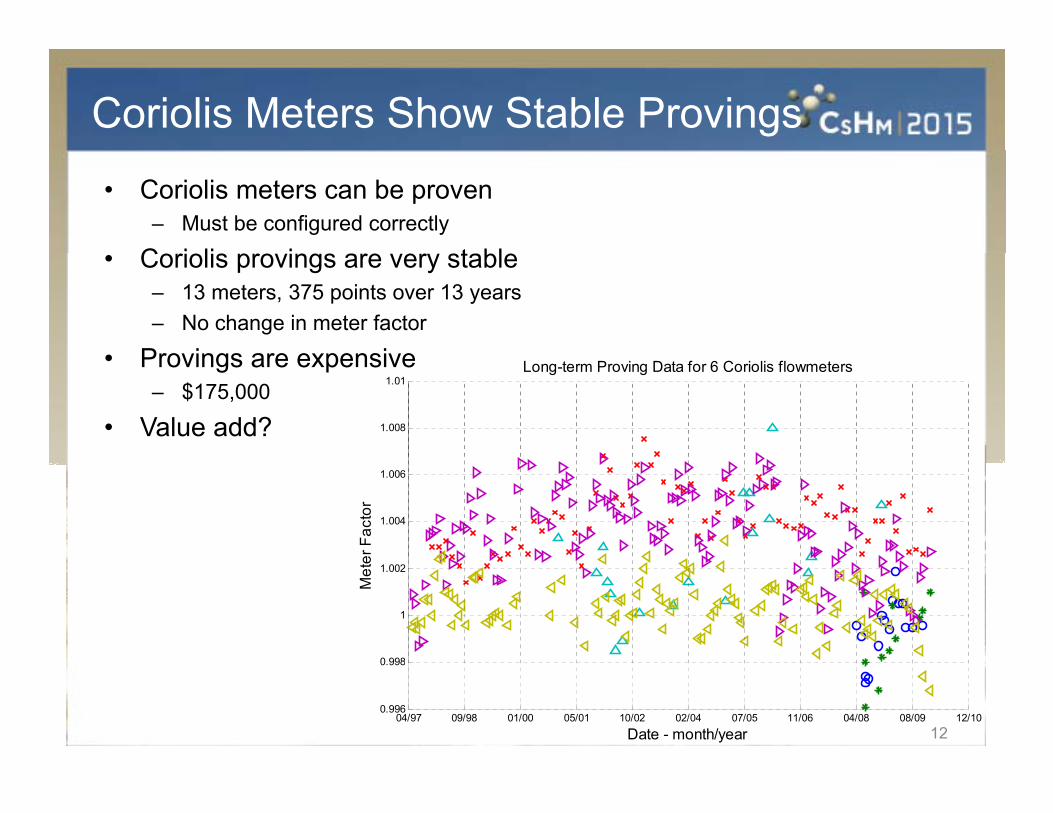
Coriolis Meters Show Stable Provings• Coriolis meters can be proven
– Must be configured correctly
C i li i t bl• Coriolis provings are very stable– 13 meters, 375 points over 13 years– No change in meter factor
• Provings are expensive
1.008
1.01Long-term Proving Data for 6 Coriolis flowmeters• Provings are expensive
– $175,000
• Value add?
1.004
1.006
er F
acto
r
0 998
1
1.002
Met
e
04/97 09/98 01/00 05/01 10/02 02/04 07/05 11/06 04/08 08/09 12/100.996
0.998
Date - month/year 12

Directive 17 Coriolis Exceptions
• Directive 17 recognizes Coriolis meter stability– Provides for proving exceptions–
13
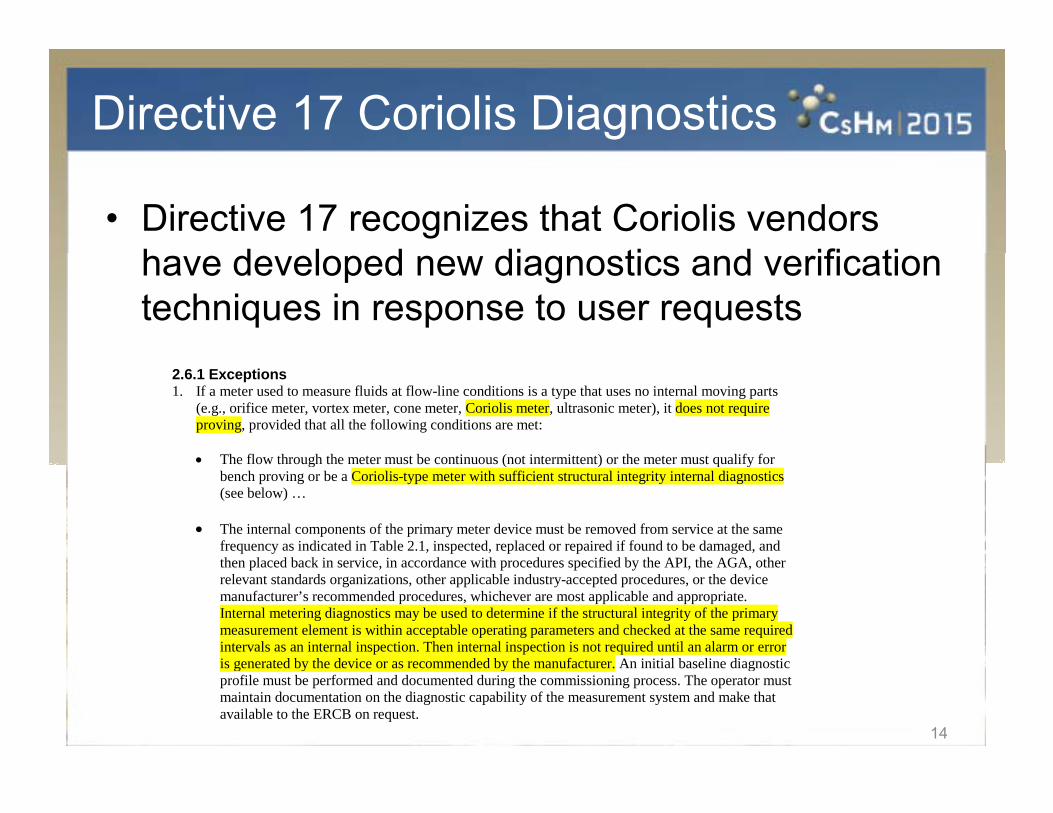
Directive 17 Coriolis Diagnostics
• Directive 17 recognizes that Coriolis vendors h d l d di ti d ifi tihave developed new diagnostics and verification techniques in response to user requests
2.6.1 Exceptions 1. If a meter used to measure fluids at flow-line conditions is a type that uses no internal moving parts
(e.g., orifice meter, vortex meter, cone meter, Coriolis meter, ultrasonic meter), it does not require proving, provided that all the following conditions are met: The flow through the meter must be continuous (not intermittent) or the meter must qualify for The flow through the meter must be continuous (not intermittent) or the meter must qualify for
bench proving or be a Coriolis-type meter with sufficient structural integrity internal diagnostics (see below) …
The internal components of the primary meter device must be removed from service at the same frequency as indicated in Table 2.1, inspected, replaced or repaired if found to be damaged, and th l d b k i i i d ith d ifi d b th API th AGA ththen placed back in service, in accordance with procedures specified by the API, the AGA, other relevant standards organizations, other applicable industry-accepted procedures, or the device manufacturer’s recommended procedures, whichever are most applicable and appropriate. Internal metering diagnostics may be used to determine if the structural integrity of the primary measurement element is within acceptable operating parameters and checked at the same required intervals as an internal inspection. Then internal inspection is not required until an alarm or error is generated by the device or as recommended by the manufacturer An initial baseline diagnostic
14
is generated by the device or as recommended by the manufacturer. An initial baseline diagnostic profile must be performed and documented during the commissioning process. The operator must maintain documentation on the diagnostic capability of the measurement system and make that available to the ERCB on request.
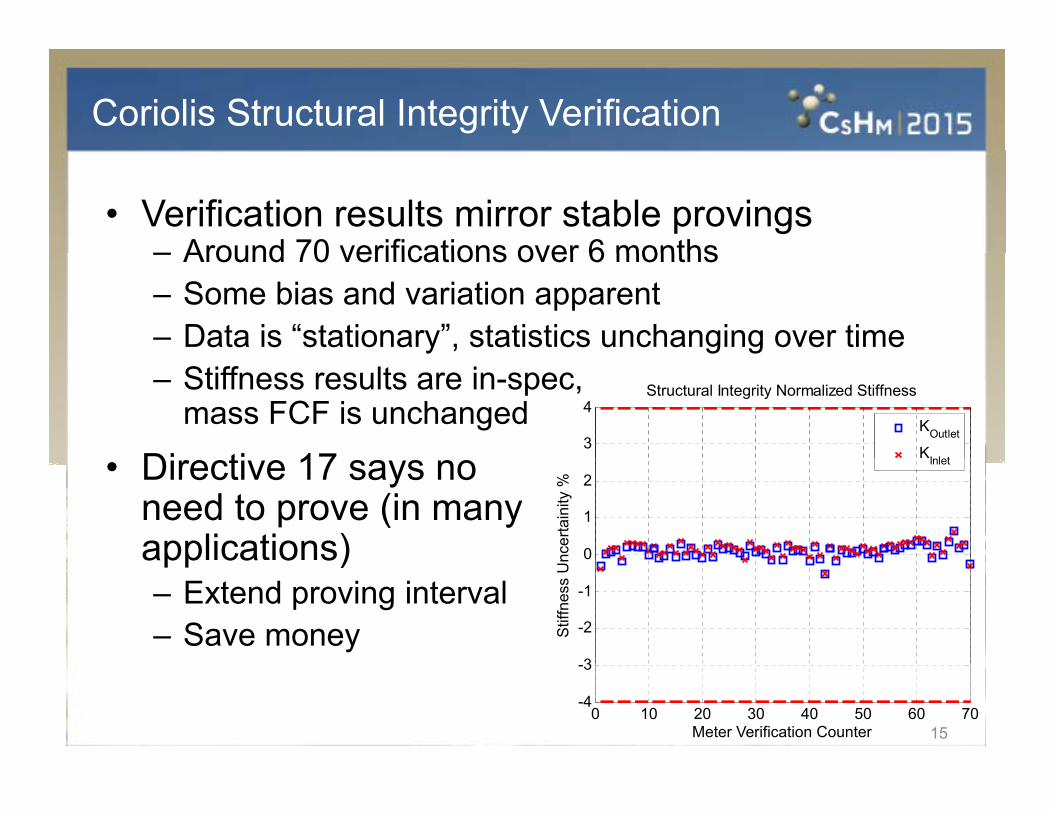
Coriolis Structural Integrity Verification
• Verification results mirror stable provings– Around 70 verifications over 6 months– Around 70 verifications over 6 months– Some bias and variation apparent– Data is “stationary”, statistics unchanging over time
3
4Structural Integrity Normalized Stiffness
KOutlet
KI l t
– Stiffness results are in-spec,mass FCF is unchanged
Di ti 17
0
1
2
ncer
tain
ity %
Inlet• Directive 17 says no need to prove (in manyapplications)
3
-2
-1
Stiff
ness
Unapp ca o s)
– Extend proving interval– Save money
0 10 20 30 40 50 60 70-4
-3
Meter Verification Counter
15
Agenda
• Coriolis Mass Flowmeter Theory of Operation• Proving, Verification, and Coriolis Robustness • Coriolis Meter Verification Review• Statistical Hypothesis Testing• Direct Stiffness Verification Results• Conclusion
16
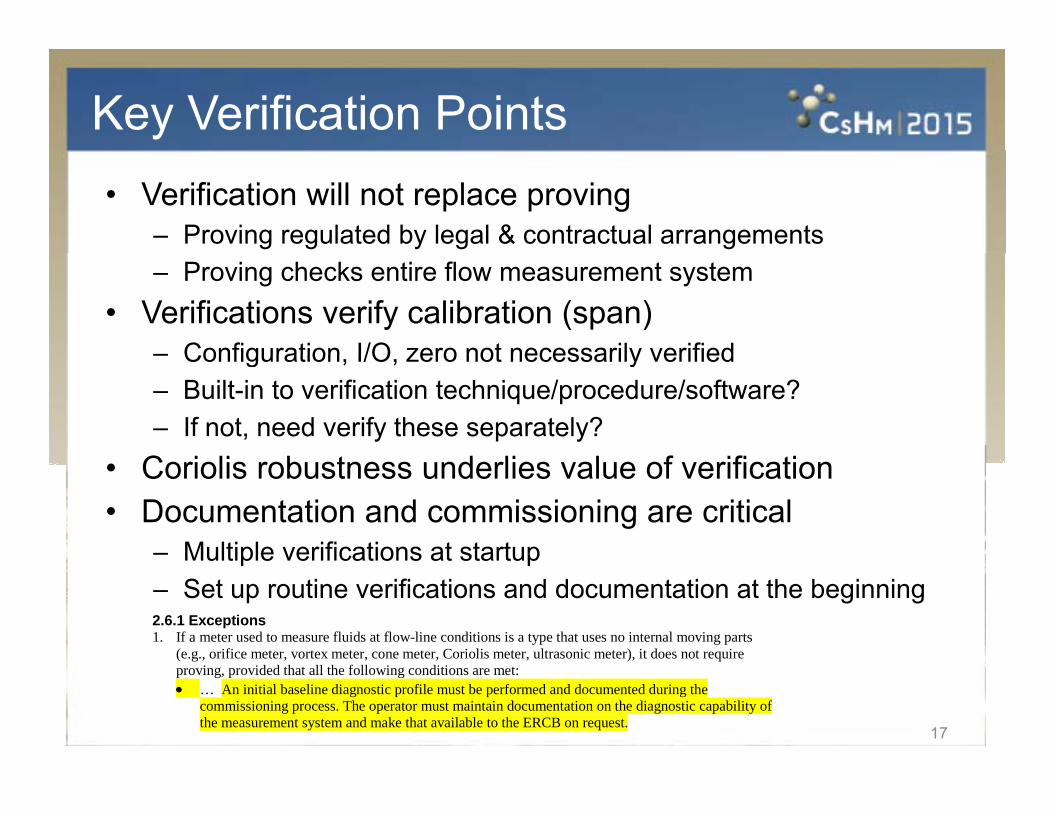
Key Verification Points• Verification will not replace proving
– Proving regulated by legal & contractual arrangements– Proving checks entire flow measurement system
• Verifications verify calibration (span)– Configuration I/O zero not necessarily verified– Configuration, I/O, zero not necessarily verified– Built-in to verification technique/procedure/software?– If not, need verify these separately?
C i li b t d li l f ifi ti• Coriolis robustness underlies value of verification• Documentation and commissioning are critical
– Multiple verifications at startupMultiple verifications at startup– Set up routine verifications and documentation at the beginning2.6.1 Exceptions 1. If a meter used to measure fluids at flow-line conditions is a type that uses no internal moving parts
(e.g., orifice meter, vortex meter, cone meter, Coriolis meter, ultrasonic meter), it does not require
17
proving, provided that all the following conditions are met: … An initial baseline diagnostic profile must be performed and documented during the
commissioning process. The operator must maintain documentation on the diagnostic capability of the measurement system and make that available to the ERCB on request.
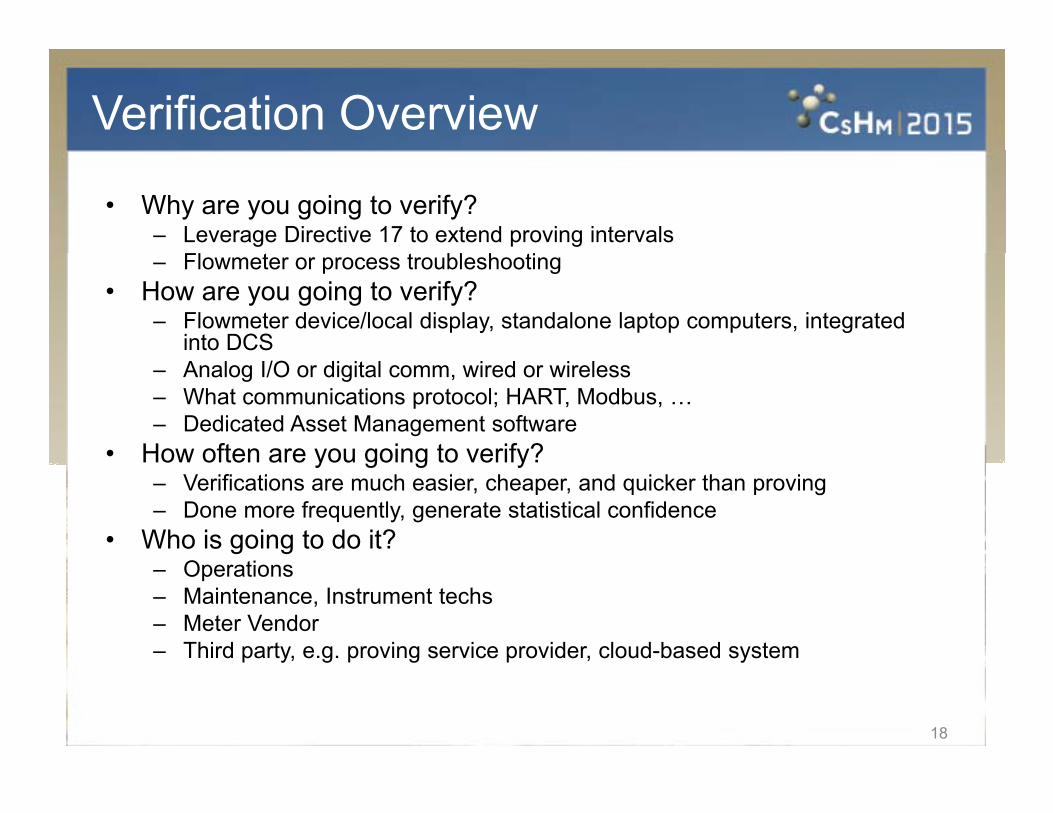
Verification Overview
• Why are you going to verify?– Leverage Directive 17 to extend proving intervals– Flowmeter or process troubleshooting
• How are you going to verify?– Flowmeter device/local display, standalone laptop computers, integrated
into DCS– Analog I/O or digital comm, wired or wireless– What communications protocol; HART, Modbus, …– Dedicated Asset Management software
• How often are you going to verify?How often are you going to verify?– Verifications are much easier, cheaper, and quicker than proving – Done more frequently, generate statistical confidence
• Who is going to do it?O i– Operations
– Maintenance, Instrument techs– Meter Vendor– Third party, e.g. proving service provider, cloud-based system
18
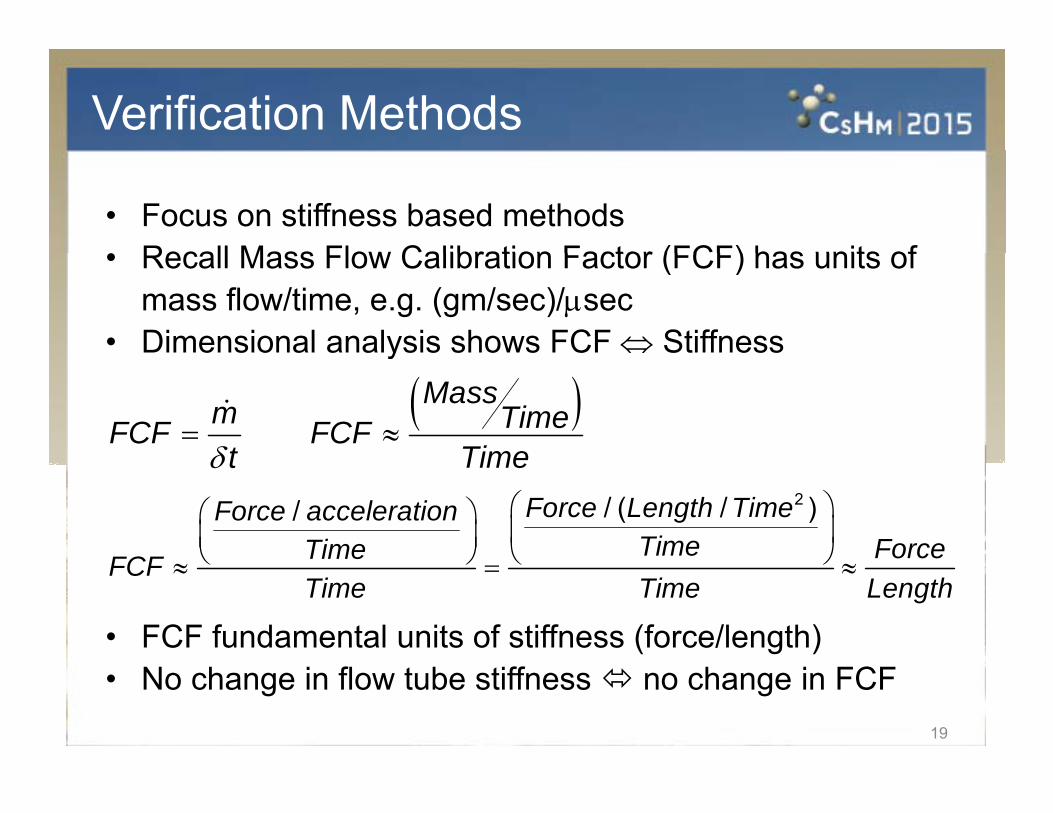
Verification Methods
• Focus on stiffness based methodsRecall Mass Flow Calibration Factor (FCF) has units of• Recall Mass Flow Calibration Factor (FCF) has units of mass flow/time, e.g. (gm/sec)/sec
• Dimensional analysis shows FCF Stiffnessy
Massm TimeFCF FCFt Time
t Time
2/ ( / )/ Force Length TimeForce accelerationTime ForceTimeFCF
• FCF fundamental units of stiffness (force/length)
FCFTime Time Length
• No change in flow tube stiffness no change in FCF19

Coriolis Stiffness Verification
• Relationship between FCF & stiffness led to development of stiffness-based verification techniquesdevelopment of stiffness based verification techniques– No “absolute stiffness number” generated– Measure change in stiffness from a baseline
• Several different stiffness verification methods– Known density– Drive/Coriolis mode frequency ratio– Drive/Coriolis mode frequency ratio– Wall thickness verification– Direct stiffness measurement
• All approach verification from structural dynamics theory– Different requirements and assumptions in each method– Different requirements and assumptions in each method
20
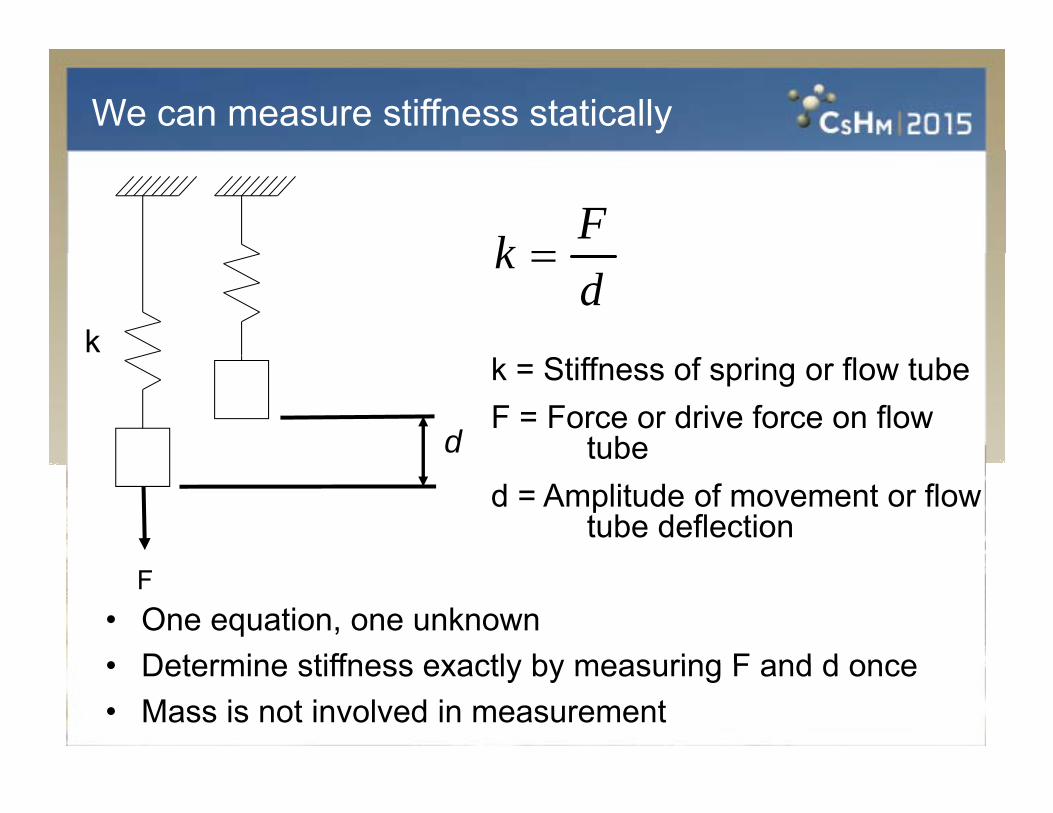
We can measure stiffness statically
Fk
kd
k
d
k = Stiffness of spring or flow tubeF = Force or drive force on flow
tubetubed = Amplitude of movement or flow
tube deflection
• One equation, one unknown• Determine stiffness exactly by measuring F and d once
F
• Determine stiffness exactly by measuring F and d once• Mass is not involved in measurement
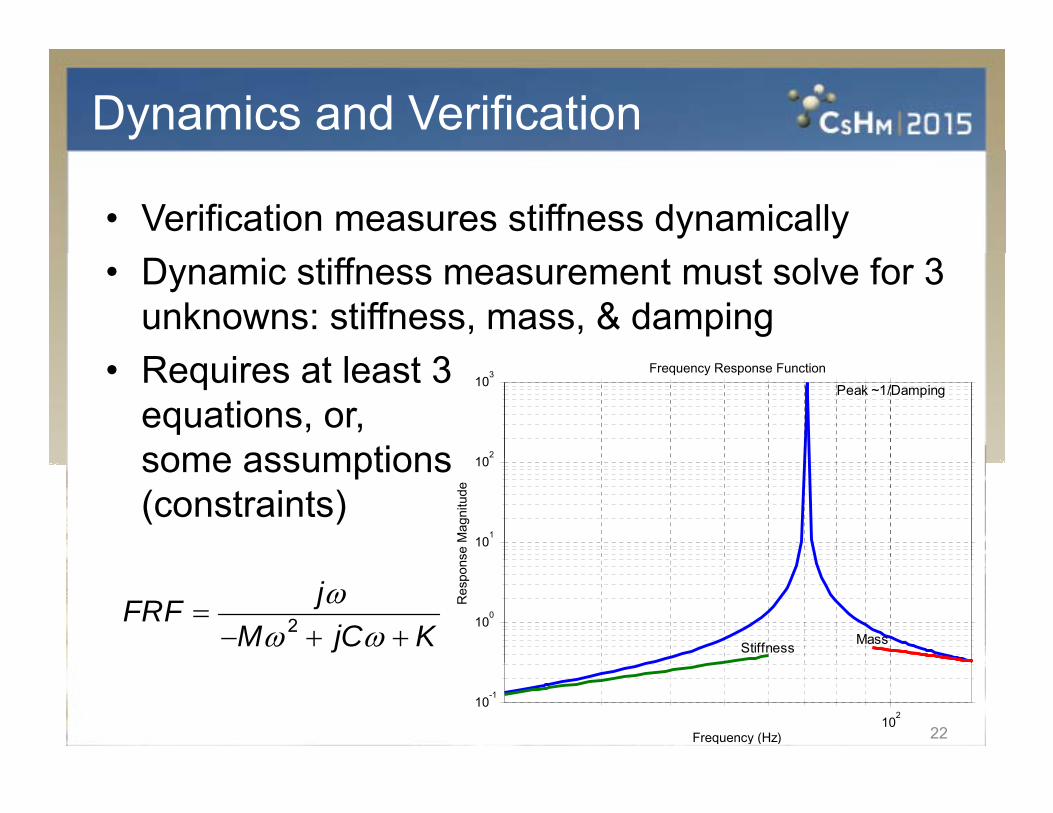
Dynamics and Verification
• Verification measures stiffness dynamically• Dynamic stiffness measurement must solve for 3
unknowns: stiffness, mass, & damping
102
103 Frequency Response Function
Peak ~1/Damping• Requires at least 3
equations, or,some assumptions
101
10se
Mag
nitu
desome assumptions(constraints)
100
Res
pon
Stiffness Mass
2
jFRFM jC K
10210-1
Frequency (Hz) 22

Stiffness Verification Techniques
• Common assumptions and constraints– Damping is smallp g– Use resonant frequency, ratio of stiffness/mass
• Techniques vary in ease of useSt fl ?– Stop flow?
– Stop measurement?– Need additional hardware?
Need remote host (PC DCS asset management system)?– Need remote host (PC, DCS, asset management system)?
• Review stiffness verification methods– Known densityy– Drive/Coriolis mode frequency ratio– Wall thickness verification– Direct stiffness measurement
23

Known Density Verification
• 1 equation– Uses 1 resonant frequency– Uses 1 resonant frequency– Assumes fluid density is accurately known– Typically air or water
V d i d d t tibl ith ll C i li
103 Known Density Verification
• Vendor independent, compatible with all Coriolis meters that measure density
• Can be challenging or not10
2
10
nitu
de
Peak ~1/Damping• Can be challenging or not depending on installation
• Confirms drive frequency
100
101
Res
pons
e M
agn
Mass
q yis unchanged frombaseline
102
10-1
Frequency (Hz)
Stiffness Mass
24
Coriolis Stiffness Verification
• Known density• Drive/Coriolis mode frequency ratio• Wall thickness verification• Direct stiffness measurement
25
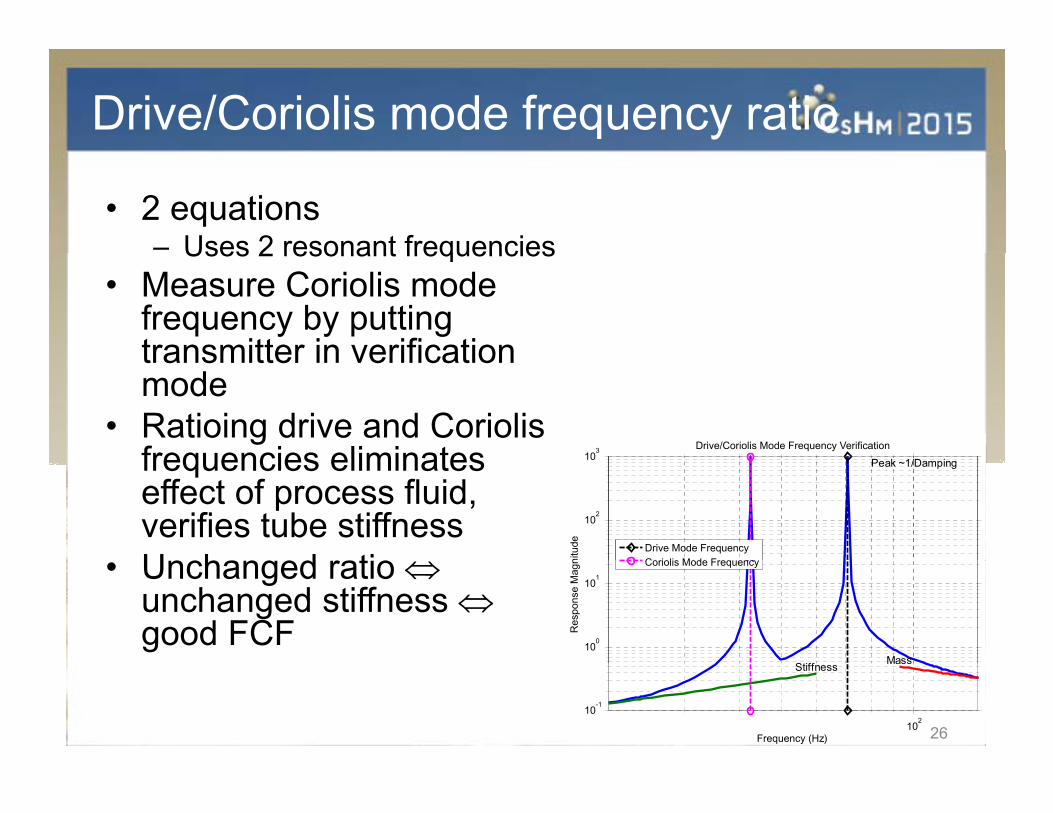
Drive/Coriolis mode frequency ratio
• 2 equations– Uses 2 resonant frequenciesUses 2 resonant frequencies
• Measure Coriolis mode frequency by putting transmitter in verification
103 Drive/Coriolis Mode Frequency Verification
transmitter in verification mode
• Ratioing drive and Coriolis frequencies eliminates
102
10
nitu
de
Peak ~1/Damping
Drive Mode FrequencyCoriolis Mode Frequency
frequencies eliminates effect of process fluid, verifies tube stiffnessUnchanged ratio
100
101
Res
pons
e M
agn
S iff Mass
Coriolis Mode Frequency• Unchanged ratio unchanged stiffness good FCF
102
10-1
Frequency (Hz)
Stiffness Mass
26
Coriolis Stiffness Verification
• Known density• Drive/Coriolis mode frequency ratio• Wall thickness verification• Direct stiffness measurement
27
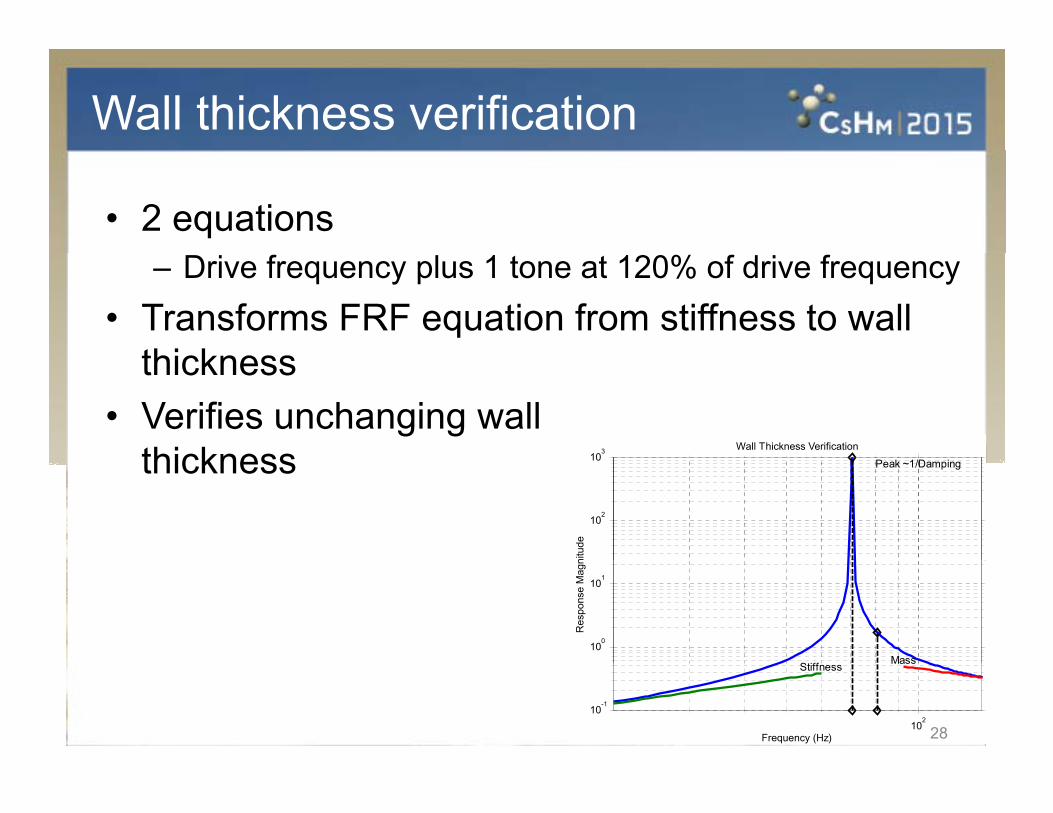
Wall thickness verification
• 2 equations– Drive frequency plus 1 tone at 120% of drive frequency
• Transforms FRF equation from stiffness to wall thickness
103 Wall Thickness Verification
thickness• Verifies unchanging wall
thickness10
2
10
nitu
de
Peak ~1/Dampingthickness
100
101
Res
pons
e M
agn
Stiff Mass
102
10-1
Frequency (Hz)
Stiffness Mass
28
Coriolis Stiffness Verification
• Known density• Drive/Coriolis mode frequency ratio• Wall thickness verification• Direct stiffness measurement
29
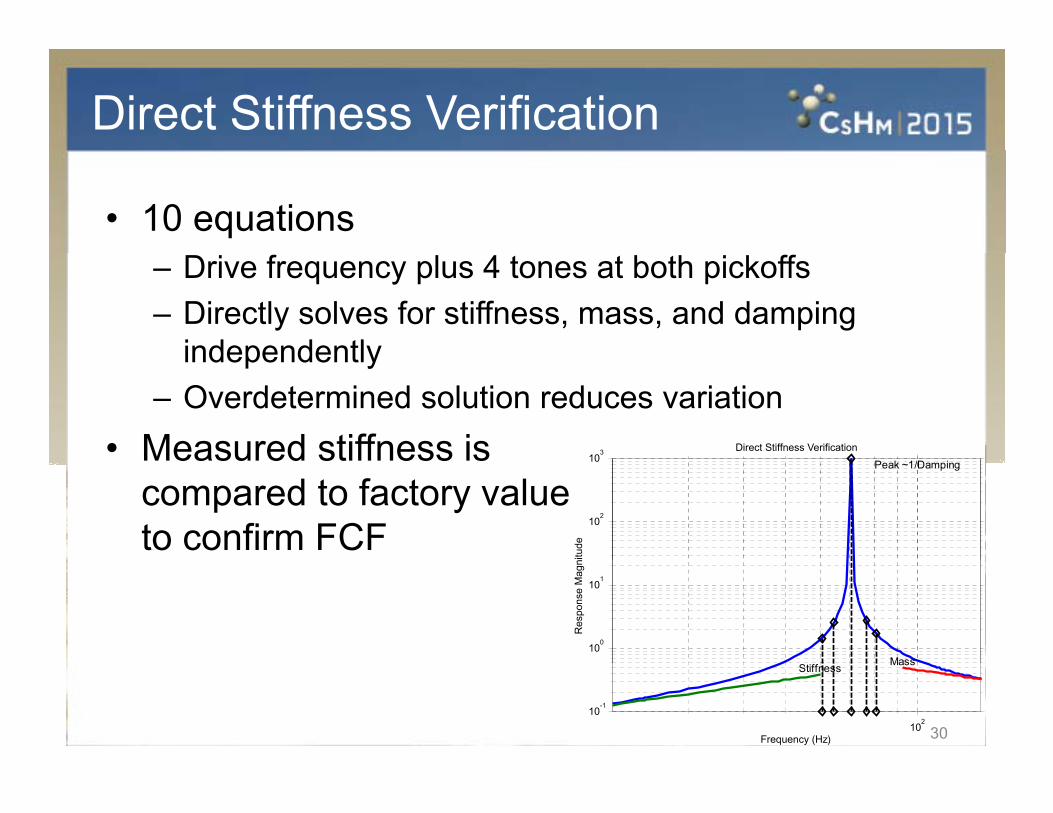
Direct Stiffness Verification
• 10 equations– Drive frequency plus 4 tones at both pickoffs– Directly solves for stiffness, mass, and damping
independently
103 Direct Stiffness Verification
independently– Overdetermined solution reduces variation
• Measured stiffness is
102
10
nitu
de
Peak ~1/DampingMeasured stiffness iscompared to factory valueto confirm FCF
100
101
Res
pons
e M
agn
Mass
102
10-1
Frequency (Hz)
Stiffness Mass
30
Agenda
• Coriolis Mass Flowmeter Theory of Operation• Proving, Verification, and Coriolis Robustness • Coriolis Meter Verification Review• Statistical Hypothesis Testing• Direct Stiffness Verification Results• Conclusion
31

Hypothesis Testing Overview
• Used in many fields: medicine, pharmaceutical, radar target recognition lawradar, target recognition, law
Sample Hypothesis Testing MatrixVerdict of Jury
Guilty Innocent
YesDeservedJail Time
Back onthe Street
F l l P
Did the Defendant C it
• Great tool to understand and compare Coriolis
NoFalsely
Imprisoned ProvenInnocent
Commit the Crime
Great tool to understand and compare Coriolis verification techniques
• 2x2 matrix can be organized in many different ways, nomenclature can vary
32
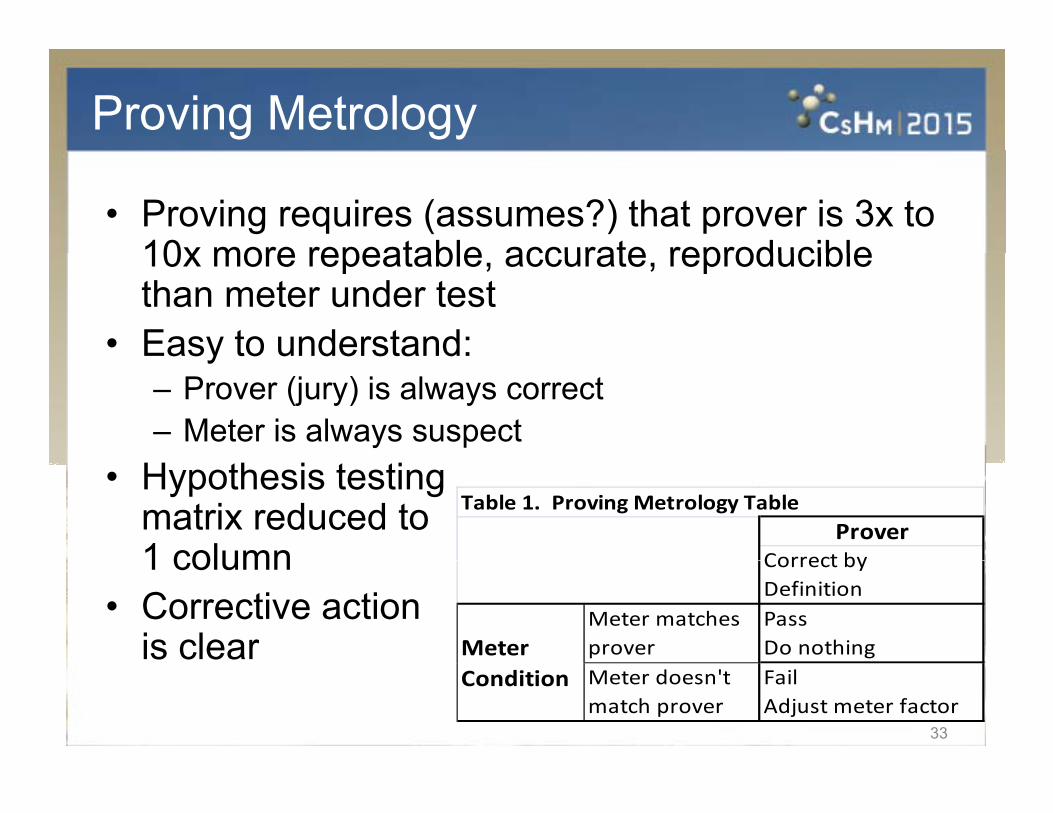
Proving Metrology
• Proving requires (assumes?) that prover is 3x to 10x more repeatable accurate reproducible10x more repeatable, accurate, reproducible than meter under test
• Easy to understand:Easy to understand: – Prover (jury) is always correct– Meter is always suspect
Table 1. Proving Metrology TableProver
Correct by
• Hypothesis testingmatrix reduced to1 column Correct by
DefinitionMeter matches prover
PassDo nothingMeter
1 column• Corrective action
is clearMeter doesn't match prover
FailAdjust meter factor
Condition
33

Verification Metrology
• Takes into account that “jury” might be wrong• Accounts for verification possibilities and statistics• Accounts for verification possibilities and statistics• Accounts for robustness and low failure rates of
Coriolis meters• Note organization of
hypothesis testing matrix, nomen-clature forpositive/negative
Table 2. Verification Hypothesis Testing Matrix
Pass FailVerification Result
positive/negative– Diagonal terms vs
off-diagonal terms
Pass FailMeter is accurate
True Positive False Alarm
M t i C tMeter
C diti
34
Meter is inaccurate
Covert Failure True Negative
Condition
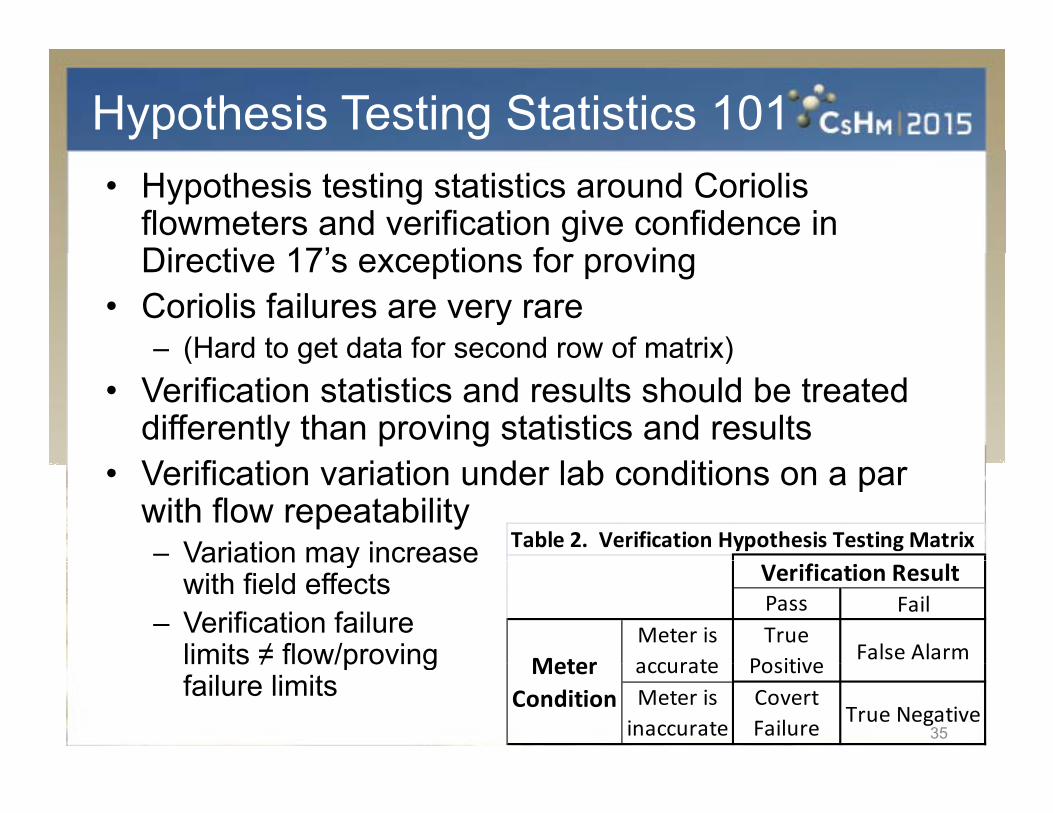
Hypothesis Testing Statistics 101• Hypothesis testing statistics around Coriolis
flowmeters and verification give confidence in Di ti 17’ ti f iDirective 17’s exceptions for proving
• Coriolis failures are very rare– (Hard to get data for second row of matrix)(Hard to get data for second row of matrix)
• Verification statistics and results should be treated differently than proving statistics and results
Table 2. Verification Hypothesis Testing Matrix
• Verification variation under lab conditions on a par with flow repeatability– Variation may increase
Pass FailMeter is accurate
True Positive False AlarmMeter
Verification ResultVariation may increase with field effects
– Verification failure limits ≠ flow/proving accurate Positive
Meter is inaccurate
Covert Failure True Negative
MeterCondition
limits ≠ flow/proving failure limits
35
Agenda
• Coriolis Mass Flowmeter Theory of Operation• Proving, Verification, and Coriolis Robustness • Coriolis Meter Verification Review• Statistical Hypothesis Testing• Direct Stiffness Verification Results• Conclusion
36
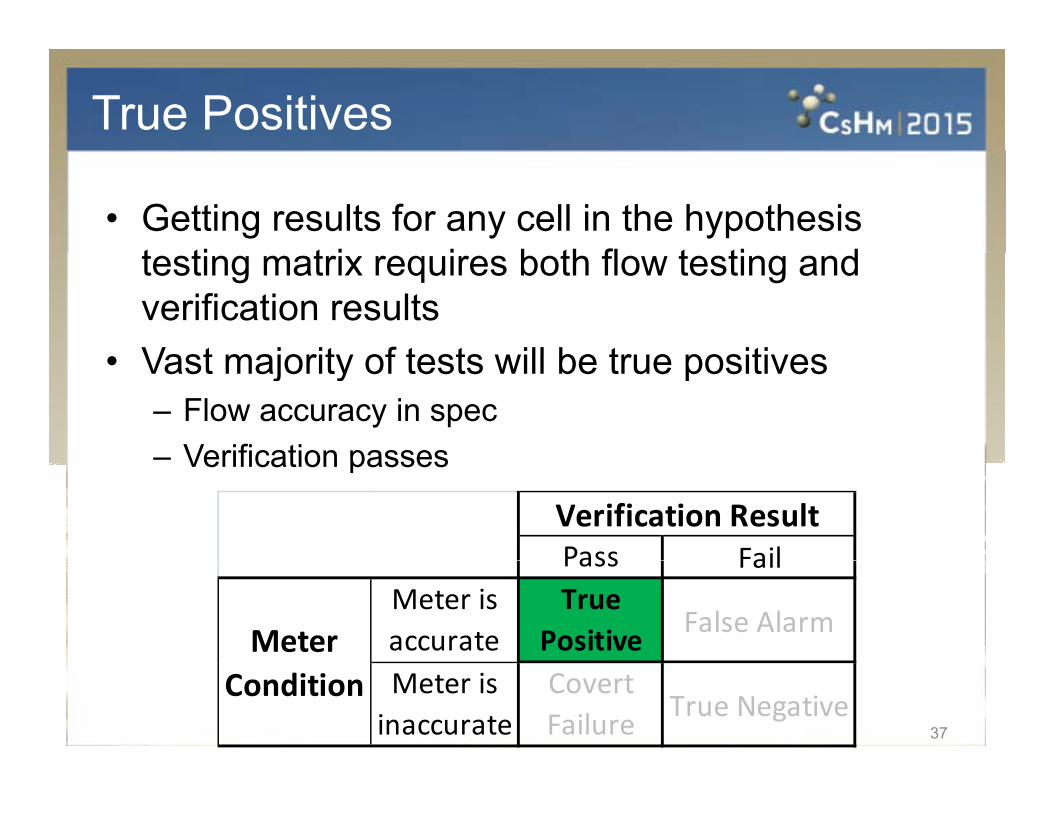
True Positives
• Getting results for any cell in the hypothesis t ti t i i b th fl t ti dtesting matrix requires both flow testing and verification resultsVast majority of tests will be true positives• Vast majority of tests will be true positives– Flow accuracy in spec– Verification passes– Verification passes
Pass FailVerification ResultPass Fail
Meter is accurate
True Positive False AlarmMeter
37
Meter is inaccurate
Covert Failure True Negative
Condition
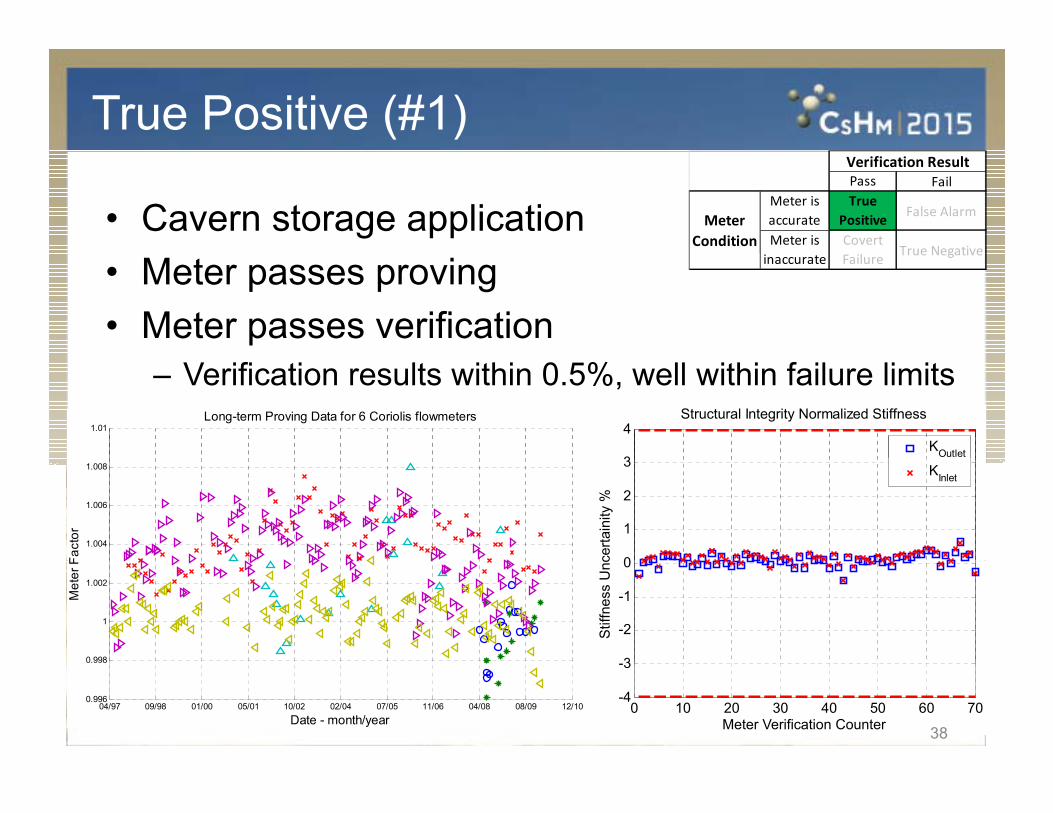
True Positive (#1)
• Cavern storage applicationPass Fail
Meter is accurate
True Positive False Alarm
Meter is Covert True Negative
Verification Result
MeterCondition
• Meter passes proving• Meter passes verification
inaccurate Failure True Negative
3
4Structural Integrity Normalized Stiffness
KOutlet
– Verification results within 0.5%, well within failure limits1.01
Long-term Proving Data for 6 Coriolis flowmeters
0
1
2
3
certa
inity
%
KInlet
1.004
1.006
1.008
Fact
or
3
-2
-1
0
Stiff
ness
Unc
0.998
1
1.002
Met
er F
0 10 20 30 40 50 60 70-4
-3
Meter Verification Counter
38
04/97 09/98 01/00 05/01 10/02 02/04 07/05 11/06 04/08 08/09 12/100.996
Date - month/year
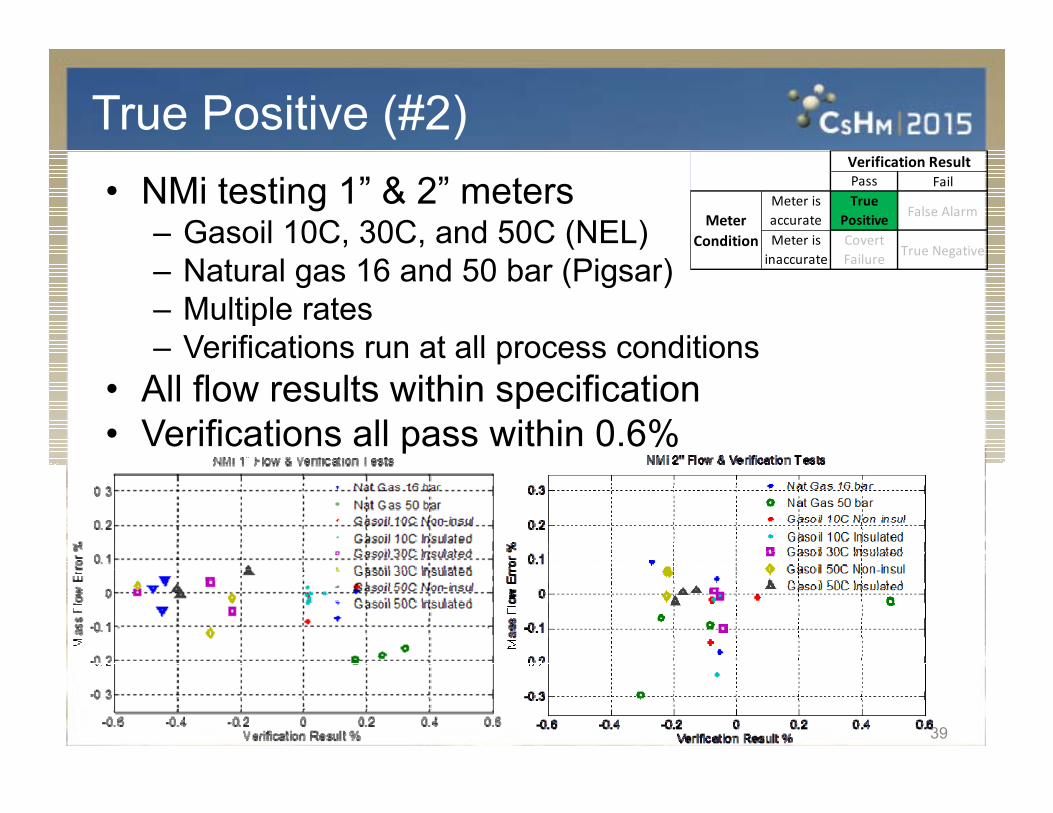
True Positive (#2)• NMi testing 1” & 2” meters
– Gasoil 10C, 30C, and 50C (NEL)
Pass FailMeter is accurate
True Positive False Alarm
Meter is Covert True Negative
Verification Result
MeterCondition
– Natural gas 16 and 50 bar (Pigsar)– Multiple rates– Verifications run at all process conditions
inaccurate Failure True Negative
Verifications run at all process conditions• All flow results within specification• Verifications all pass within 0.6%
39
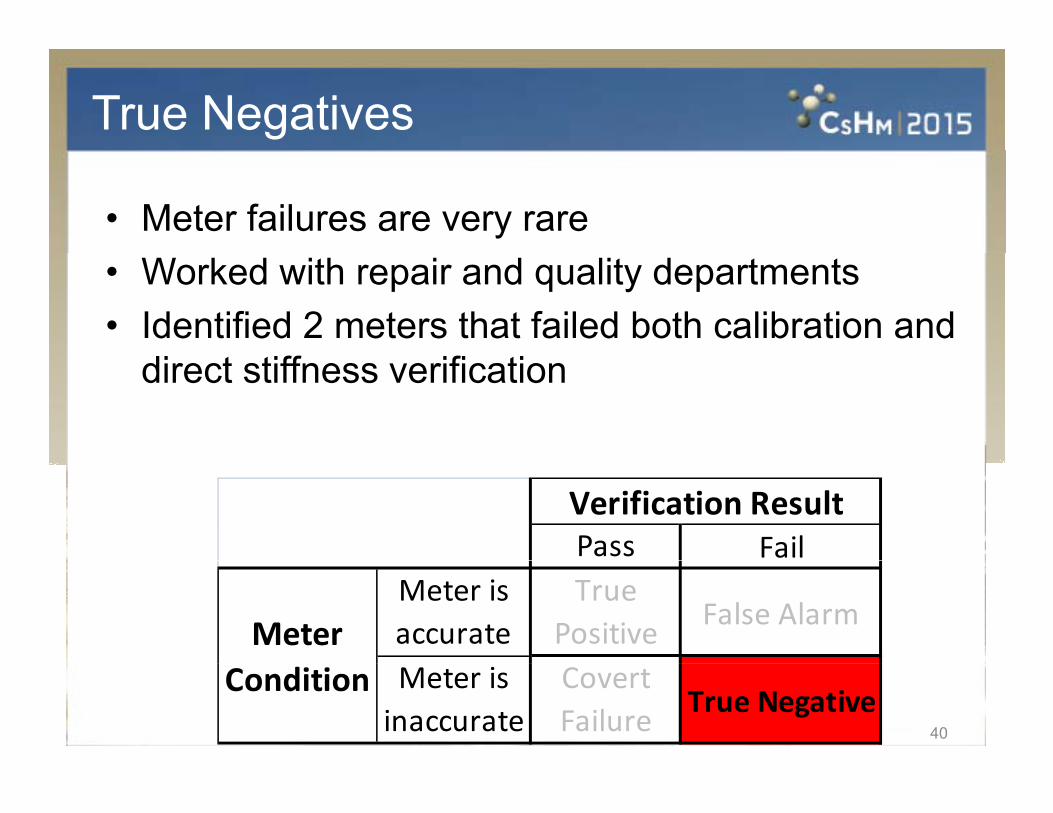
True Negatives
• Meter failures are very rare• Worked with repair and quality departments• Identified 2 meters that failed both calibration and
direct stiffness verification
Pass FailVerification Result
Meter is accurate
True Positive False AlarmMeter
40
Meter is inaccurate
Covert Failure True Negative
Condition
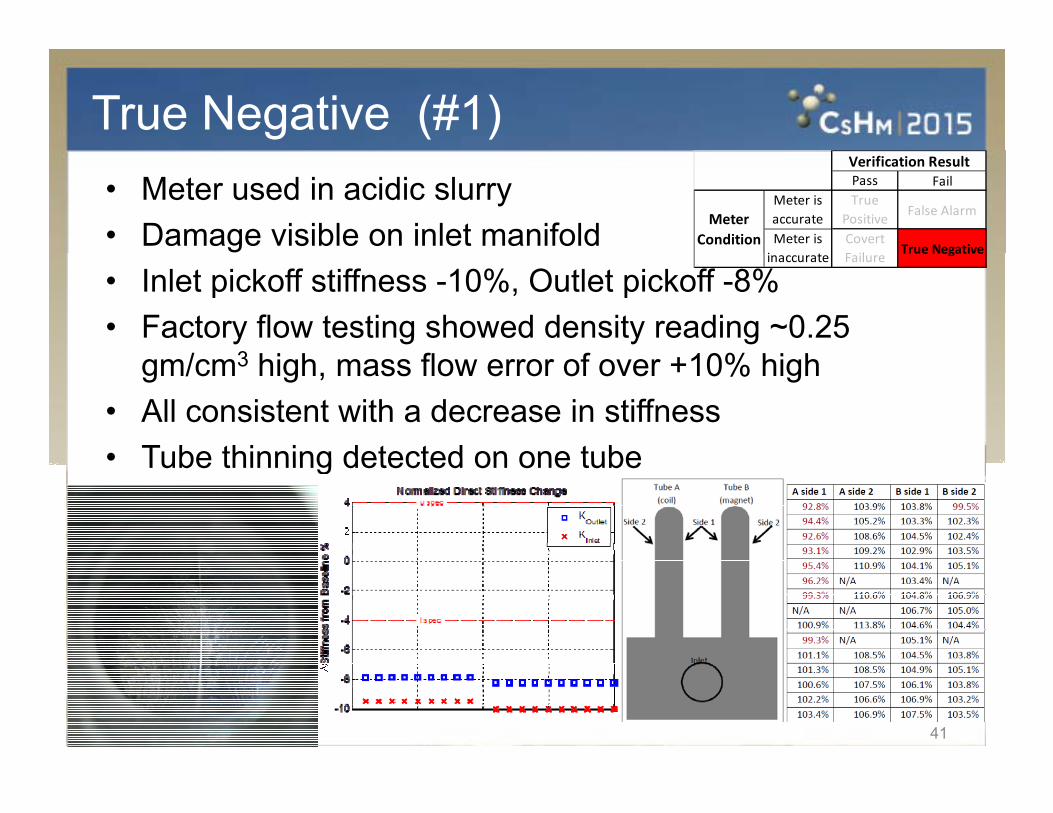
True Negative (#1)• Meter used in acidic slurry• Damage visible on inlet manifold
Pass FailMeter is accurate
True Positive False Alarm
Meter is i
Covert il True Negative
Verification Result
MeterCondition
• Inlet pickoff stiffness -10%, Outlet pickoff -8%• Factory flow testing showed density reading ~0.25
/ 3 hi h fl f 10% hi h
inaccurate Failure True Negative
gm/cm3 high, mass flow error of over +10% high• All consistent with a decrease in stiffness• Tube thinning detected on one tube• Tube thinning detected on one tube
41
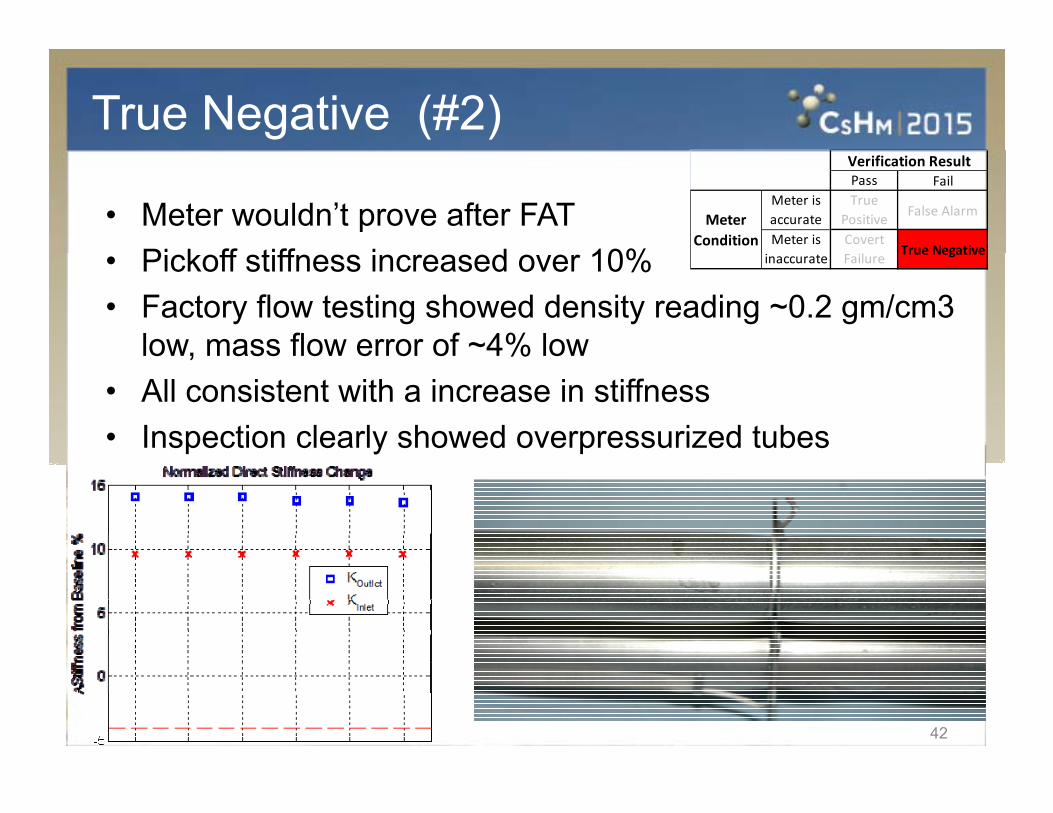
True Negative (#2)
• Meter wouldn’t prove after FATPi k ff tiff i d 10%
Pass FailMeter is accurate
True Positive False Alarm
Meter is Covert True Negative
Verification Result
MeterCondition
• Pickoff stiffness increased over 10%• Factory flow testing showed density reading ~0.2 gm/cm3
low, mass flow error of ~4% low
inaccurate Failure True Negative
low, mass flow error of 4% low• All consistent with a increase in stiffness• Inspection clearly showed overpressurized tubes
42
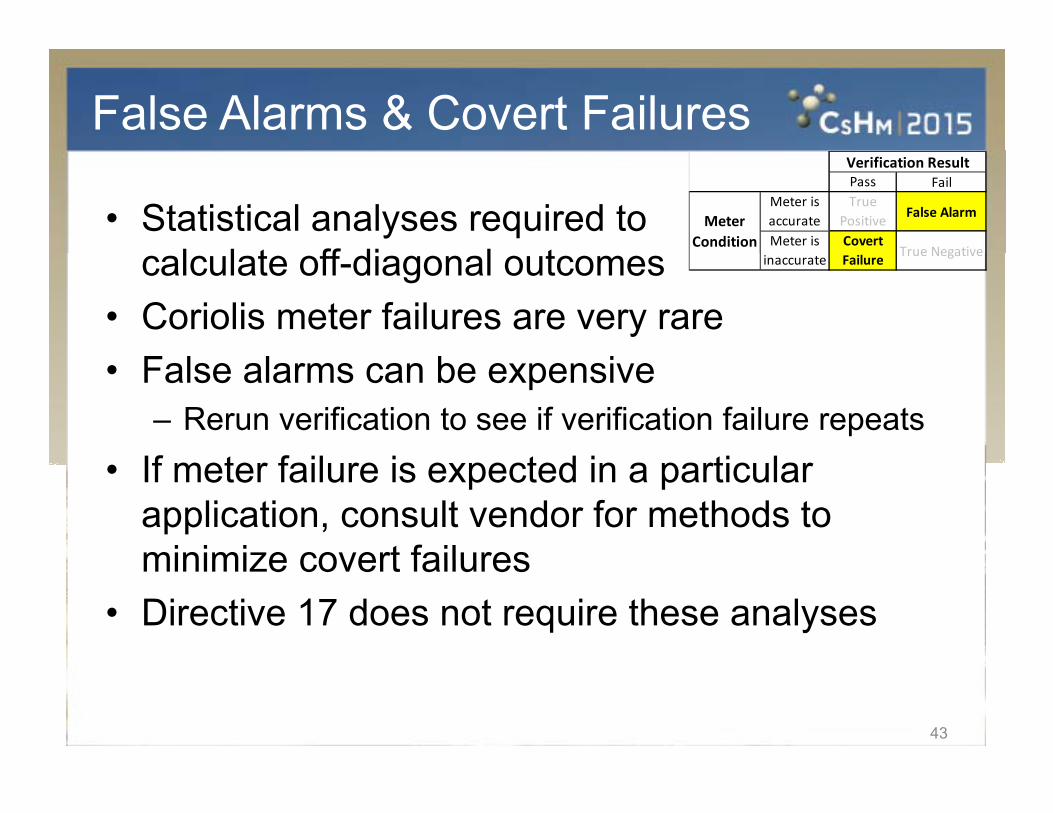
False Alarms & Covert Failures
• Statistical analyses required tol l t ff di l t
Pass FailMeter is accurate
True Positive False Alarm
Meter is Covert True Negative
Verification Result
MeterCondition
calculate off-diagonal outcomes• Coriolis meter failures are very rare
inaccurate Failure True Negative
• False alarms can be expensive– Rerun verification to see if verification failure repeats
If t f il i t d i ti l• If meter failure is expected in a particular application, consult vendor for methods to minimize covert failuresminimize covert failures
• Directive 17 does not require these analyses
43

Agenda
• Coriolis Mass Flowmeter Theory of Operation• Proving, Verification, and Coriolis Robustness • Coriolis Meter Verification Review• Statistical Hypothesis Testing• Direct Stiffness Verification Results• Conclusion
44
Conclusion
• Coriolis flowmeters should not change calibrationCoriolis flowmeters should not change calibration over the life of the meter
• Several verification techniques available for qCoriolis meters to assure valid calibration
• Run verification frequentlyq y• Leverage Directive 17, extend proving intervals• Work with your vendor!o t you e do
45